design and analysis of non-randomized studies - ispor
TRANSCRIPT

GRPs FOR DESIGNING NON-RANDOMIZED STUDIES OF TREATMENT EFFECTS USINGSECONDARY DATABASES
1
II. GOOD RESEARCH PRACTICES FOR DESIGNING NON-RANDOMIZED STUDIES
OF TREATMENT EFFECTS USING SECONDARY DATABASES: Report of the ISPOR Retrospective Database Analysis Task Force – Part II
Cox E, Martin B, van Staa T, Garbe E, Siebert U, Johnson ML
Emily Cox, PhD, Sr. Director of Research, Express Scripts, St. Louis, MO, USA Bradley Martin PhD, RPh, PharmD Professor and Head, Division of Pharmaceutical Evaluation and Policy, College of Pharmacy, University of Arkansas for Medical Sciences, Little Rock, AR, USA Tjeerd Van Staa PhD, MD, MSc, MA, Head of Research, GPRD, London, UK Edeltraut Garbe, MD, PhD, Head of the Department of Clinical Epidemiology, Bremen Institute for Prevention Research and Social Medicine, Bremen, Germany Uwe Siebert MD, MPH, MSc, ScD, Professor and Chair of Public Health, Medical Decision Making and Health Technology Assessment, University of Health Sciences, Medical Informatics and Technology, Hall, Austria; Adjunct Professor of Public Health Policy and Management, Harvard University Michael L. Johnson PhD, Associate Professor, University of Houston, College of Pharmacy, Department of Clinical Sciences and Administration, Houston, TX, USA

GRPs FOR DESIGNING NON-RANDOMIZED STUDIES OF TREATMENT EFFECTS USINGSECONDARY DATABASES
2
1 2 3 4 5 6 7 8 9
10 11 12 13 14 15 16 17 18 19 20 21 22 23 24 25 26 27 28 29 30 31
ABSTRACT Objectives The goal of comparative effectiveness analysis is to examine the relationship between two variables,
treatment or exposure and effectiveness or outcome. Compared to data obtained through randomized
controlled trials (RCTs), secondary data sources have issues of validity. Recognizing the challenges to
conducting valid epidemiologic studies to compare effectiveness, a Task Force was formed to develop a
guidance document on state of the art approaches to design for these studies. Methods The Task Force was commissioned and a Chair was selected by the ISPOR Board of Directors in March
2007. The Chair invited members, both within and outside ISPOR, from academia, industry and
government in US, Canada and Europe to participate. Task Force members began meeting and recruiting
members at the ISPOR International meeting Arlington, VA May 2007, and at the European Congress,
Dublin Ireland October 2007. Members met monthly by teleconference, at a face-to-face meeting in
Philadelphia in October 2008, and have presented a draft reports at the International Meetings into
Toronto, CA May 2008 and European Congress in Athens, Greece, November 2008. The Report gives
recommendations on design of study from secondary data sources. Results The Task Force Report addresses issues of design and provides researchers with tools to help mitigate
threats to validity. Recommendations on design of study included: the need for data analysis plan with
causal diagrams; detailed attention to classification bias in definition of exposure and clinical outcome;
careful and appropriate use of restriction; extreme care to identify and control for confounding factors,
including time-dependent confounding.
Conclusions Design of non-randomized studies of comparative effectiveness face several daunting issues, including
measurement of exposure and outcome challenged by biases in misclassification and confounding. Use of
causal diagrams and restriction are two techniques that can improve the theoretical basis for analyzing
treatment effects in study populations of more homogeneity, with reduced loss of generalizability.

GRPs FOR DESIGNING NON-RANDOMIZED STUDIES OF TREATMENT EFFECTS USINGSECONDARY DATABASES
3
32 33 34 35 36 37 38 39 40 41 42 43 44 45 46 47 48 49 50 51 52 53 54 55 56 57 58 59 60 61 62 63 64 65 66
Introduction
The goal of comparative effectiveness analysis is to examine the relationship between two variables,
treatment or exposure and effectiveness or outcome. The advantages of using secondary databases to
examine this relationship are easily recognized by researchers in the field. Compared to data obtained
through randomized controlled trials (RCTs), secondary data sources provide a low cost means of
answering the research question, answers can be obtained in a relatively short time frame, the data are
more representative of routine clinical care and large cohorts of patients can be followed over long time
periods (Schneeweiss 2007). However, researchers should be mindful of data limitations which, in some
instances, preclude their use. In this section, we will address issues of validity with respect to secondary
data sources and, where appropriate, provide researchers with tools to help mitigate threats to validity.
Researchers have been writing about the challenges that secondary data sources pose for more than two
decades now (Roos 1989, Motheral 1997, Tamblyn 1995) and while challenges still exist, the
methodological approaches to address these challenges have greatly improved. (Berger TF Report 2009;
Johnson TF Report 2009) Key in contributing toward inaccuracies in administrative data is the fact that
they were built for billing and record keeping purposes not for research. Therefore, the potential for errors
occurs at many points along the record keeping process (Schneeweiss 2005). The implication for
researchers is that both systematic and random error can occur in the identification of treatment exposure
and outcome.
In RCTs, identifying and measuring exposure is done with a great deal of accuracy and precision. For
example, in clinical trial evaluation of drug treatment, not only is it known who has received the active
drug, but also the degree of exposure – dose, duration and compliance with therapy. Similarly, outcomes,
or measures of effectiveness, are measured with a great deal of accuracy and precision. Various devices
and laboratory tests are used to measure and record both surrogate (blood pressure, cholesterol levels,
tumor staging) and final end points (e.g., myocardial infarction, stroke and even death). This same level of
precision is often not universally available in secondary data sources. Additionally, secondary data limit
the measure of exposure and outcomes to those who seek care and is limited further in administrative
claims data to those who obtain this care through the insurance payment system.
One way to measure the validity of exposure and outcomes using administrative data is to compare it to
the gold standard. For outcome measures that gold standard is often patient self-report or the medical
record. When using the gold standard of medical records, the sensitivity and specificity of medical claims
data were found to have a high level of specificity but a great deal of variability in sensitivity across
diagnoses (Wilchesky, 2004). For drug exposure, there have been indirect assessments of accuracy of

GRPs FOR DESIGNING NON-RANDOMIZED STUDIES OF TREATMENT EFFECTS USINGSECONDARY DATABASES
4
67 68 69 70 71 72 73 74 75 76 77 78 79 80 81 82 83 84 85 86 87 88 89 90 91 92 93 94 95 96 97 98 99
100 101 102
prescription claims by comparing drug compliance meaures using pharmacy claims data with other
compliance measures including patient self report (Erickson 2001, Grymonpre 1998) and studies testing
the accuracy of prescription claims information to define or supplement case definitions for hypertension
(Quam 1993). Direct assessments of the validity of prescription claims comparing prescription claims with
other medical data, such as a patients chart, have generally been performed in narrow populations or for
selected drug classes and the results have been highly variable (Kwon 2003, McKenzie 2000, Kirking
1996, Tamblyn 1995, King 2001). While prescription claims are generally considered a valid meausre of
drug exposure, in accuracies in measurement still exist.
Measurement of Exposure and Outcome
We now address reasons for inaccuracy in claims data by first examining measurement of exposure and
outcomes focusing on prescription drugs as the element of exposure.
Measurement –Exposure
Secondary data sources measure drug exposure with varying degrees of accuracy. Table x below
highlights these data sources, the level of measurement and inherent limitations in using these data
sources for drug exposure.
Considered the most accurate and most commonly used measure of drug exposure is outpatient
prescription claims. Prescription claims data provide a wealth of information on drug exposure including
date of service, dispensing pharmacy, drug name, quantity, dose and duration (days supply) and are
considered by many to be the gold standard for measuring drug exposure (Strom 1991). It should be
noted that days’ supply can be unreliable for some drug classes (i.e., injectables or medications dosed on
an as needed basis) and outside the US, measures of duration may not be available.
Several options are available to identify drugs from outpatient prescription claims files. First is the
National Drug Code (NDC), a 10-digit coding system established by the FDA to uniquely identify drug,
dosage and package size. The FDA provides a complete listing of NDCs on its website however the drug
lists can become cumbersome to manage, are time sensitive and change with new drug entries or exits
from the market. They can also be quite cumbersome to code particularly when a large number of NDCs
codes is used. For example, using only the first 9 digits of the NDC, which ignores package size, there
are over 280 NDCs for the beta blocker Atenolol. To simplify drug identification, researchers can purchase
a therapeutic classification system such as the American Hospital Formulary Service (AHFS)
Pharmacologic-Therapeutic Classification, Red Book, Anatomical Therapeutic Chemical (ATC)
classification system or Medi-Span’s Generic Product Identifier (GPI). These systems link NDC to drug
classes which allow for more manageable coding of unique drugs or therapy class.

GRPs FOR DESIGNING NON-RANDOMIZED STUDIES OF TREATMENT EFFECTS USINGSECONDARY DATABASES
5
103 104 105 106 107 108 109 110 111
112 113 114 115 116 117 118 119
Medical records can be another data source to identify drug exposure recoding whether the physician
prescribed medication for the patient, the dose and intended regimen. However medical records do not
record whether the patient obtained the medication from the pharmacy, or typically the degree of exposure
(i.e., compliance). Additionally, the medical record (either inpatient or outpatient) does not record all
prescribed medications taken by patients and is generally not considered a valid source for identifying
drug exposure. However, medical records may be considered as a source for capturing OTC agents,
typically not covered or captured in the prescription claim record. In the US, it should be noted that the
FDA will not accept e-medical records as a source for measuring drug exposure.
Drug exposure can also be measured using outpatient medical claims for a limited number of medications
dispensed and administered in the physicians’ office. In the US, these are captured using Health Care
Procedure Codes (HCPCS). However, drug use identified from HCPCS codes do not indicate dosage and
are not immediately assigned to newer agents. Additionally, medical billers often use miscellaneous J-
codes when billing for medications administered in physician offices which does not allow for accurate
identification of the drug administered.
Table x: Secondary Data Sources and Measurement of Drug Exposure
Data source Measurement Type of Exposure Measured
Limitations
Outpatient
prescription
claims
NDC or therapeutic
classification system
(i.e., GCN, ATC,
AHFS, etc.)
Incidence and
prevalence use and
intensity of exposure
See expanded
discussion on
misclassification
Medical
Records/Charts
Drug name, dosage
and regimen for
prescribed and OTC
agents
Binary drug exposure
(incidence/prevalence)
Measurement of degree
of exposure (i.e.,
duration) is limited
Incomplete capture of
patient medication
history
Outpatient
medical claims
Health Care
Procedure Codes
(HCPCS) only for
select medications
Binary drug exposure
(incidence/prevalence)
and persistency
Limited to only those
medications
administered in the
physician’s office
120
GRPs FOR DESIGNING NON-RANDOMIZED STUDIES OF TREATMENT EFFECTS USINGSECONDARY DATABASES
6
121 122 123 124 125 126 127 128 129 130 131 132 133 134 135 136 137 138 139 140 141 142 143 144 145 146 147
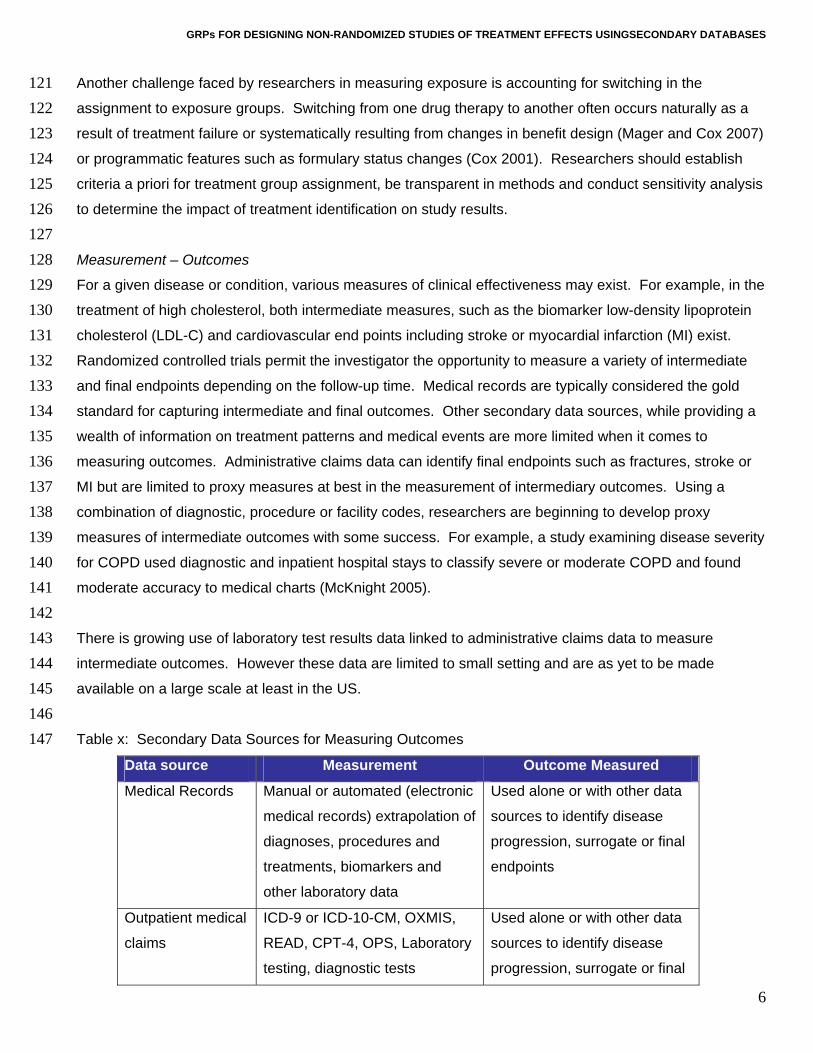
Another challenge faced by researchers in measuring exposure is accounting for switching in the
assignment to exposure groups. Switching from one drug therapy to another often occurs naturally as a
result of treatment failure or systematically resulting from changes in benefit design (Mager and Cox 2007)
or programmatic features such as formulary status changes (Cox 2001). Researchers should establish
criteria a priori for treatment group assignment, be transparent in methods and conduct sensitivity analysis
to determine the impact of treatment identification on study results.
Measurement – Outcomes
For a given disease or condition, various measures of clinical effectiveness may exist. For example, in the
treatment of high cholesterol, both intermediate measures, such as the biomarker low-density lipoprotein
cholesterol (LDL-C) and cardiovascular end points including stroke or myocardial infarction (MI) exist.
Randomized controlled trials permit the investigator the opportunity to measure a variety of intermediate
and final endpoints depending on the follow-up time. Medical records are typically considered the gold
standard for capturing intermediate and final outcomes. Other secondary data sources, while providing a
wealth of information on treatment patterns and medical events are more limited when it comes to
measuring outcomes. Administrative claims data can identify final endpoints such as fractures, stroke or
MI but are limited to proxy measures at best in the measurement of intermediary outcomes. Using a
combination of diagnostic, procedure or facility codes, researchers are beginning to develop proxy
measures of intermediate outcomes with some success. For example, a study examining disease severity
for COPD used diagnostic and inpatient hospital stays to classify severe or moderate COPD and found
moderate accuracy to medical charts (McKnight 2005).
There is growing use of laboratory test results data linked to administrative claims data to measure
intermediate outcomes. However these data are limited to small setting and are as yet to be made
available on a large scale at least in the US.
Table x: Secondary Data Sources for Measuring Outcomes
Data source Measurement Outcome Measured
Medical Records Manual or automated (electronic
medical records) extrapolation of
diagnoses, procedures and
treatments, biomarkers and
other laboratory data
Used alone or with other data
sources to identify disease
progression, surrogate or final
endpoints
Outpatient medical
claims
ICD-9 or ICD-10-CM, OXMIS,
READ, CPT-4, OPS, Laboratory
testing, diagnostic tests
Used alone or with other data
sources to identify disease
progression, surrogate or final

GRPs FOR DESIGNING NON-RANDOMIZED STUDIES OF TREATMENT EFFECTS USINGSECONDARY DATABASES
7
endpoints
Eligibility files Death*
Inpatient medical
claims
ICD-9 or ICD-10-CM, OXMIS,
READ, CPT-4, OPS, laboratory
testing, diagnostic tests,
discharge status
Used alone or with other data
sources to identify disease
progression, events or final
endpoints.
*may not be available for all payers 148 149 150 151 152 153 154 155 156 157 158 159 160 161 162 163 164 165 166 167 168 169 170 171 172 173 174 175 176
Classification Bias
Systematic and random errors can occur in measuring both exposure and outcome resulting in the
violation of internal validity. This error is termed classification bias - identifying someone as drug exposed
when they are not or not exposed when they are. Classification bias is further categorized as differential or
non-differential and unidirectional or bidirectional. Non-differential misclassification occurs when the
likelihood of misclassification is the same across the exposed or outcome groups. For example,
classification bias of exposure for a low cost medication using prescription claims data would be equally
likely regardless of outcome. However, differential misclassification is present when the likelihood of
misclassification is different between exposed or outcome groups. An example of differential
misclassification for drug exposure is when those who are exposed have a lower likelihood of outcome
misclassification because to receive medication they have to enter the health care system which increases
their likelihood of recording a diagnosis. Those not exposed are much more likely to be misclassified as
not having the disease, which is an artifact of not entering the health care system. Unidirectional
misclassification occurs when the direction of the misclassification is in the same direction. Bidirectional
misclassification occurs when the likelihood of misclassification is in both directions – there is a probability
that cases appear as controls and controls appear as cases. For a more complete discussion see
Hartzema and Perfetto (Hartzema 2nd edition). As a researcher, ONE SHOULD CONSIDER AND STATE THE
DIRECTION OF POTENTIAL SOURCES OF MISCLASSIFICATION AND HOW THAT COULD INFLUENCE THE ACCEPTANCE
OR REJECTION OF THE NULL HYPOTHESIS (Schneeweiss 2005).
An important data element influencing classification bias of both drug exposure and outcomes is member
eligibility. In the US, many administrative datasets are linked to employment and natural transitions in the
labor market can influence classification bias. If eligibility is not accounted for in the measure of
medication compliance, for example, those not continuously eligible may be incorrectly classified as
noncompliant when in fact lack of drug exposure was due to loss of eligibility. Statistically controlling for
length of eligibility or limiting to continuously eligible in these instances may be most appropriate. Lack of
appropriate time for follow-up due to drops in eligibility is also a concern for outcomes misclassification if

GRPs FOR DESIGNING NON-RANDOMIZED STUDIES OF TREATMENT EFFECTS USINGSECONDARY DATABASES
8
177 178 179 180 181 182 183 184 185 186 187 188 189 190 191 192 193 194 195 196 197 198 199 200 201 202 203 204 205 206 207 208 209 210 211
member follow-up does not allow for capture of the clinical event. ELIGIBILITY MUST BE CONTROLLED FOR
AND LACK OF THIS INFORMATION PRECLUDES COMPARATIVE EFFECTIVENESS RESEARCH.
Drug Exposure Misclassification
Many factors can lead to misclassification with respect to drug exposure. With outpatient prescription
claims, a greater number of opportunities for misclassification in the direction of not exposed exist given
the multiple channels by which members can receive their medications outside of the reimbursement
arrangements of third party payers. Other means for obtaining prescription drugs that would preclude
claims capture include physician samples, patient assistance programs (PAP), paying out of pocket, in-
patient hospital stays, taking a medication belonging to someone else, secondary insurance coverage or
fraudulent behavior. The likelihood of this misclassification can be influenced by patient demographics.
For example, the elderly and lower income patients are more likely to participate in PAP programs or
obtain samples from their physician, leading to systematic misclassification. This would be particularly
prevalent for high cost medications.
Various plan design features can impact misclassification and it is important to document plan design and
programmatic features that may impact claims capture. Programmatic features including prior
authorization policies, caps or maximum limits on coverage, and step therapy programs can influence not
only the measure of exposure but the choice of exposure. More recently, the proliferation in the US of no
cost or low cost generic programs offered by retail chain pharmacies are increasing the likelihood of
misclassification since these claims are not captured by the health plan. This could lead to bias
depending upon the drug comparators, study sample or geographic region given that market penetration
of these programs differ by region.
Differences in formularies, or the list of covered drugs, can lead to misclassification. Systematic errors in
exposure classification can occur when the treatments being compared have different formulary status or
are on different tiers. If drug A is a second tier product being compared to drug B which is a third tier
product where members pay a higher copayment, differential classification bias could result, assuming
higher copayments lead to lower compliance which could impact outcomes. Methods to address these
issues are covered in later sections.
Additionally, for administrative claims data classification bias is present when measuring exposure for
over-the-counter medications or medications with limits or coverage exclusions (medications used to treat
cosmetic indications). FOR AMBULATORY COMPARATIVE EFFECTIVENESS ANALYSIS, HOSPITAL STAYS (OR
OTHER INPATIENT STAYS) HAVE TO BE ACCOUNTED FOR IN THE STATISTICAL ANALYSIS (Suissa 2008).
GRPs FOR DESIGNING NON-RANDOMIZED STUDIES OF TREATMENT EFFECTS USINGSECONDARY DATABASES
9
212 213 214 215 216 217 218 219 220 221 222 223 224 225 226 227 228 229 230 231 232 233 234 235 236 237 238 239 240 241 242 243 244 245 246 247
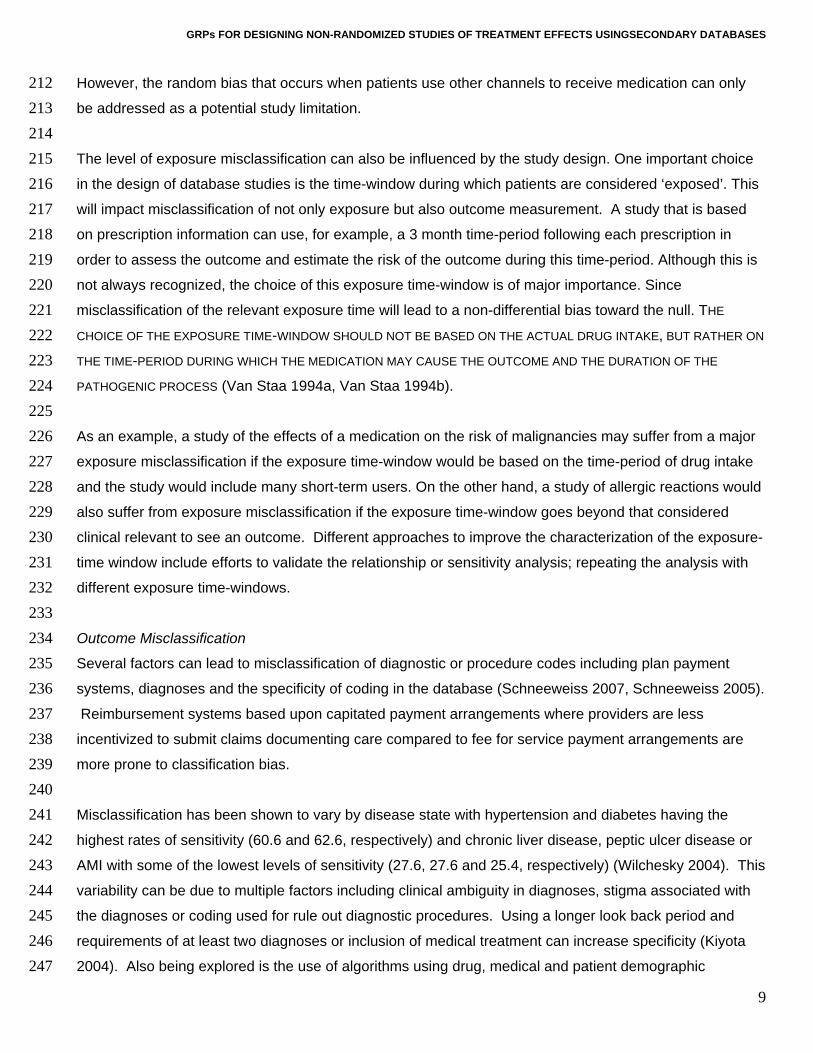
However, the random bias that occurs when patients use other channels to receive medication can only
be addressed as a potential study limitation.
The level of exposure misclassification can also be influenced by the study design. One important choice
in the design of database studies is the time-window during which patients are considered ‘exposed’. This
will impact misclassification of not only exposure but also outcome measurement. A study that is based
on prescription information can use, for example, a 3 month time-period following each prescription in
order to assess the outcome and estimate the risk of the outcome during this time-period. Although this is
not always recognized, the choice of this exposure time-window is of major importance. Since
misclassification of the relevant exposure time will lead to a non-differential bias toward the null. THE
CHOICE OF THE EXPOSURE TIME-WINDOW SHOULD NOT BE BASED ON THE ACTUAL DRUG INTAKE, BUT RATHER ON
THE TIME-PERIOD DURING WHICH THE MEDICATION MAY CAUSE THE OUTCOME AND THE DURATION OF THE
PATHOGENIC PROCESS (Van Staa 1994a, Van Staa 1994b).
As an example, a study of the effects of a medication on the risk of malignancies may suffer from a major
exposure misclassification if the exposure time-window would be based on the time-period of drug intake
and the study would include many short-term users. On the other hand, a study of allergic reactions would
also suffer from exposure misclassification if the exposure time-window goes beyond that considered
clinical relevant to see an outcome. Different approaches to improve the characterization of the exposure-
time window include efforts to validate the relationship or sensitivity analysis; repeating the analysis with
different exposure time-windows.
Outcome Misclassification
Several factors can lead to misclassification of diagnostic or procedure codes including plan payment
systems, diagnoses and the specificity of coding in the database (Schneeweiss 2007, Schneeweiss 2005).
Reimbursement systems based upon capitated payment arrangements where providers are less
incentivized to submit claims documenting care compared to fee for service payment arrangements are
more prone to classification bias.
Misclassification has been shown to vary by disease state with hypertension and diabetes having the
highest rates of sensitivity (60.6 and 62.6, respectively) and chronic liver disease, peptic ulcer disease or
AMI with some of the lowest levels of sensitivity (27.6, 27.6 and 25.4, respectively) (Wilchesky 2004). This
variability can be due to multiple factors including clinical ambiguity in diagnoses, stigma associated with
the diagnoses or coding used for rule out diagnostic procedures. Using a longer look back period and
requirements of at least two diagnoses or inclusion of medical treatment can increase specificity (Kiyota
2004). Also being explored is the use of algorithms using drug, medical and patient demographic
GRPs FOR DESIGNING NON-RANDOMIZED STUDIES OF TREATMENT EFFECTS USINGSECONDARY DATABASES
10
248 249 250 251 252 253 254 255 256 257 258 259 260 261 262 263 264 265 266 267 268 269 270 271 272 273 274 275 276 277 278 279 280 281 282 283
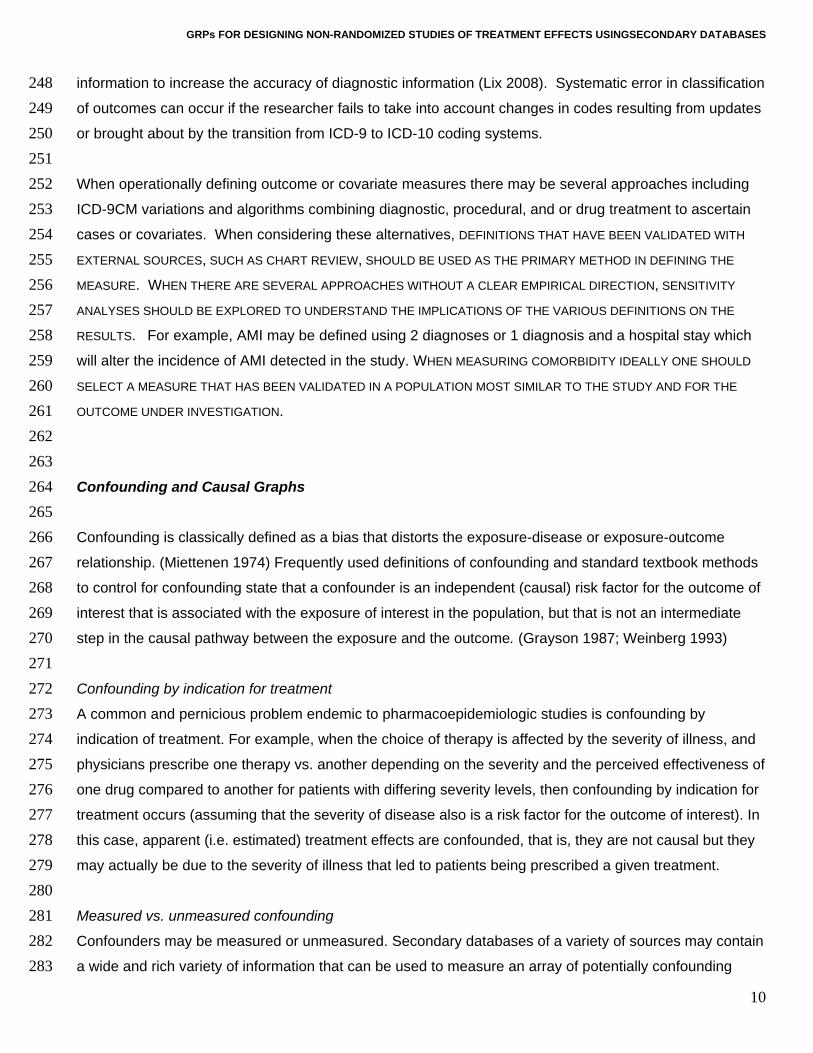
information to increase the accuracy of diagnostic information (Lix 2008). Systematic error in classification
of outcomes can occur if the researcher fails to take into account changes in codes resulting from updates
or brought about by the transition from ICD-9 to ICD-10 coding systems.
When operationally defining outcome or covariate measures there may be several approaches including
ICD-9CM variations and algorithms combining diagnostic, procedural, and or drug treatment to ascertain
cases or covariates. When considering these alternatives, DEFINITIONS THAT HAVE BEEN VALIDATED WITH
EXTERNAL SOURCES, SUCH AS CHART REVIEW, SHOULD BE USED AS THE PRIMARY METHOD IN DEFINING THE
MEASURE. WHEN THERE ARE SEVERAL APPROACHES WITHOUT A CLEAR EMPIRICAL DIRECTION, SENSITIVITY
ANALYSES SHOULD BE EXPLORED TO UNDERSTAND THE IMPLICATIONS OF THE VARIOUS DEFINITIONS ON THE
RESULTS. For example, AMI may be defined using 2 diagnoses or 1 diagnosis and a hospital stay which
will alter the incidence of AMI detected in the study. WHEN MEASURING COMORBIDITY IDEALLY ONE SHOULD
SELECT A MEASURE THAT HAS BEEN VALIDATED IN A POPULATION MOST SIMILAR TO THE STUDY AND FOR THE
OUTCOME UNDER INVESTIGATION.
Confounding and Causal Graphs
Confounding is classically defined as a bias that distorts the exposure-disease or exposure-outcome
relationship. (Miettenen 1974) Frequently used definitions of confounding and standard textbook methods
to control for confounding state that a confounder is an independent (causal) risk factor for the outcome of
interest that is associated with the exposure of interest in the population, but that is not an intermediate
step in the causal pathway between the exposure and the outcome. (Grayson 1987; Weinberg 1993)
Confounding by indication for treatment
A common and pernicious problem endemic to pharmacoepidemiologic studies is confounding by
indication of treatment. For example, when the choice of therapy is affected by the severity of illness, and
physicians prescribe one therapy vs. another depending on the severity and the perceived effectiveness of
one drug compared to another for patients with differing severity levels, then confounding by indication for
treatment occurs (assuming that the severity of disease also is a risk factor for the outcome of interest). In
this case, apparent (i.e. estimated) treatment effects are confounded, that is, they are not causal but they
may actually be due to the severity of illness that led to patients being prescribed a given treatment.
Measured vs. unmeasured confounding
Confounders may be measured or unmeasured. Secondary databases of a variety of sources may contain
a wide and rich variety of information that can be used to measure an array of potentially confounding
GRPs FOR DESIGNING NON-RANDOMIZED STUDIES OF TREATMENT EFFECTS USINGSECONDARY DATABASES
11
284 285 286 287 288 289 290 291 292 293 294 295 296 297 298 299 300 301 302 303 304 305 306 307 308 309 310 311 312 313 314 315 316 317 318
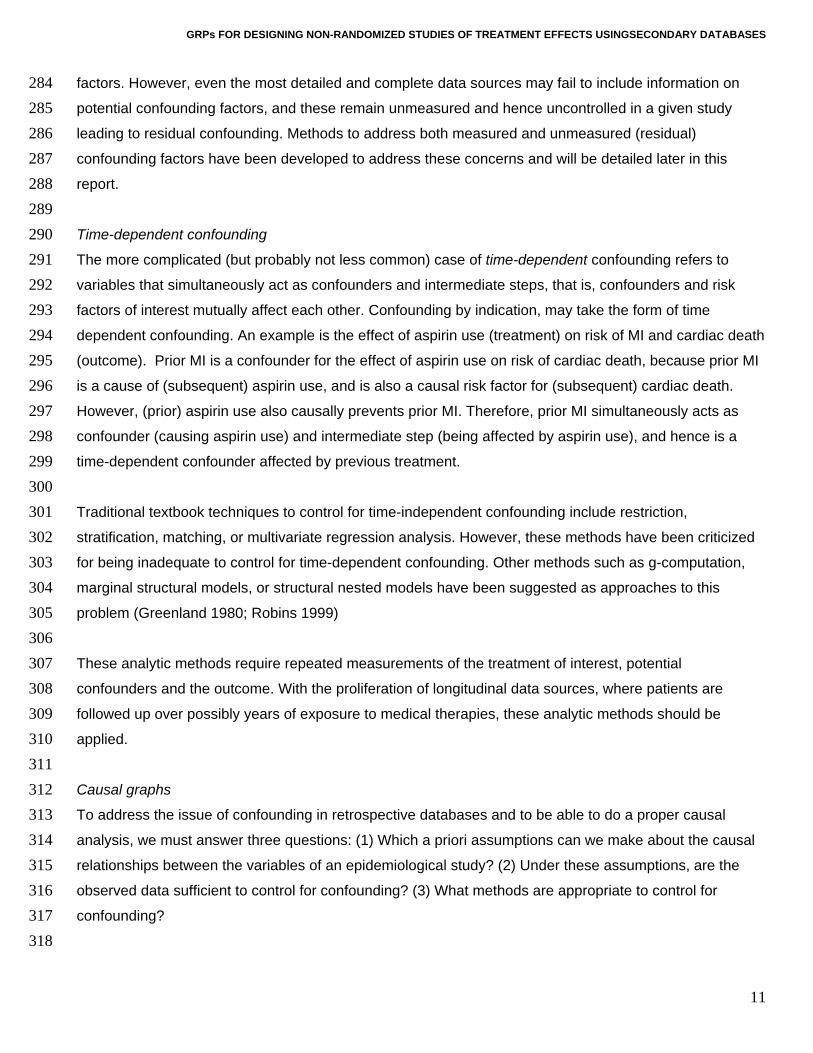
factors. However, even the most detailed and complete data sources may fail to include information on
potential confounding factors, and these remain unmeasured and hence uncontrolled in a given study
leading to residual confounding. Methods to address both measured and unmeasured (residual)
confounding factors have been developed to address these concerns and will be detailed later in this
report.
Time-dependent confounding
The more complicated (but probably not less common) case of time-dependent confounding refers to
variables that simultaneously act as confounders and intermediate steps, that is, confounders and risk
factors of interest mutually affect each other. Confounding by indication, may take the form of time
dependent confounding. An example is the effect of aspirin use (treatment) on risk of MI and cardiac death
(outcome). Prior MI is a confounder for the effect of aspirin use on risk of cardiac death, because prior MI
is a cause of (subsequent) aspirin use, and is also a causal risk factor for (subsequent) cardiac death.
However, (prior) aspirin use also causally prevents prior MI. Therefore, prior MI simultaneously acts as
confounder (causing aspirin use) and intermediate step (being affected by aspirin use), and hence is a
time-dependent confounder affected by previous treatment.
Traditional textbook techniques to control for time-independent confounding include restriction,
stratification, matching, or multivariate regression analysis. However, these methods have been criticized
for being inadequate to control for time-dependent confounding. Other methods such as g-computation,
marginal structural models, or structural nested models have been suggested as approaches to this
problem (Greenland 1980; Robins 1999)
These analytic methods require repeated measurements of the treatment of interest, potential
confounders and the outcome. With the proliferation of longitudinal data sources, where patients are
followed up over possibly years of exposure to medical therapies, these analytic methods should be
applied.
Causal graphs
To address the issue of confounding in retrospective databases and to be able to do a proper causal
analysis, we must answer three questions: (1) Which a priori assumptions can we make about the causal
relationships between the variables of an epidemiological study? (2) Under these assumptions, are the
observed data sufficient to control for confounding? (3) What methods are appropriate to control for
confounding?
GRPs FOR DESIGNING NON-RANDOMIZED STUDIES OF TREATMENT EFFECTS USINGSECONDARY DATABASES
12
319 320 321 322 323 324 325 326 327 328 329 330 331 332 333 334 335 336
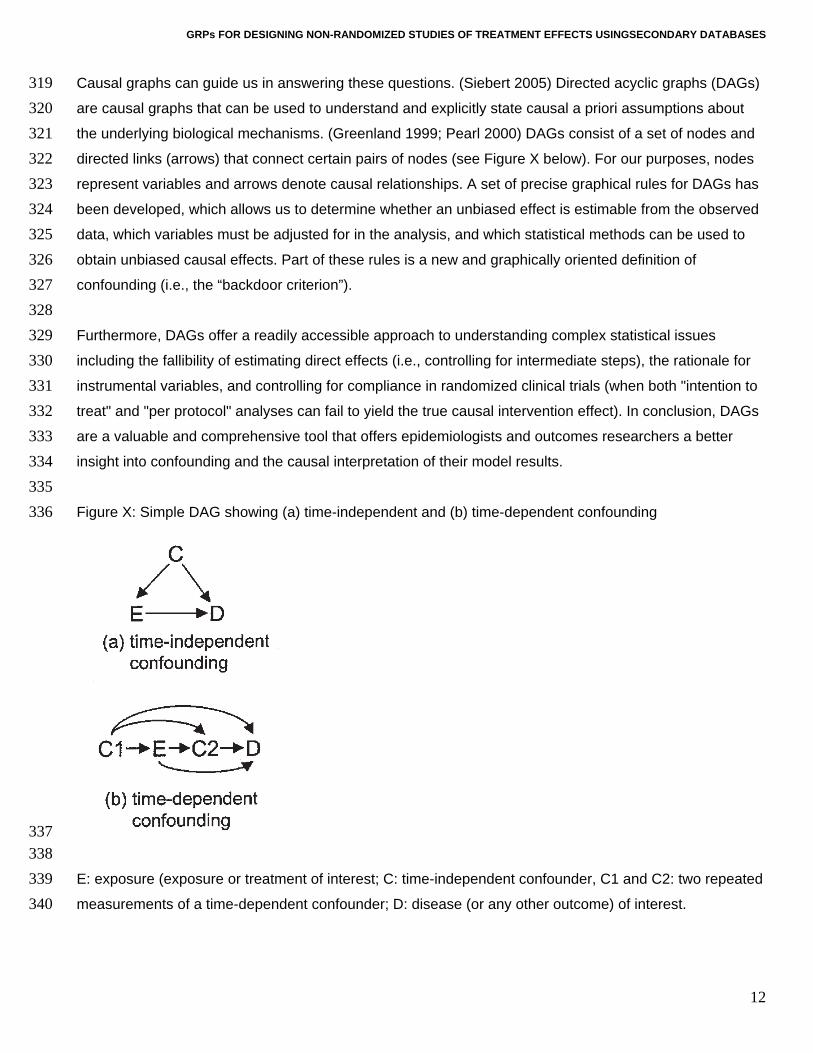
Causal graphs can guide us in answering these questions. (Siebert 2005) Directed acyclic graphs (DAGs)
are causal graphs that can be used to understand and explicitly state causal a priori assumptions about
the underlying biological mechanisms. (Greenland 1999; Pearl 2000) DAGs consist of a set of nodes and
directed links (arrows) that connect certain pairs of nodes (see Figure X below). For our purposes, nodes
represent variables and arrows denote causal relationships. A set of precise graphical rules for DAGs has
been developed, which allows us to determine whether an unbiased effect is estimable from the observed
data, which variables must be adjusted for in the analysis, and which statistical methods can be used to
obtain unbiased causal effects. Part of these rules is a new and graphically oriented definition of
confounding (i.e., the “backdoor criterion”).
Furthermore, DAGs offer a readily accessible approach to understanding complex statistical issues
including the fallibility of estimating direct effects (i.e., controlling for intermediate steps), the rationale for
instrumental variables, and controlling for compliance in randomized clinical trials (when both "intention to
treat" and "per protocol" analyses can fail to yield the true causal intervention effect). In conclusion, DAGs
are a valuable and comprehensive tool that offers epidemiologists and outcomes researchers a better
insight into confounding and the causal interpretation of their model results.
Figure X: Simple DAG showing (a) time-independent and (b) time-dependent confounding
337 338 339 340
E: exposure (exposure or treatment of interest; C: time-independent confounder, C1 and C2: two repeated
measurements of a time-dependent confounder; D: disease (or any other outcome) of interest.

GRPs FOR DESIGNING NON-RANDOMIZED STUDIES OF TREATMENT EFFECTS USINGSECONDARY DATABASES
13
341 342 343 344 345 346 347 348 349 350 351 352 353 354 355 356 357 358 359 360 361 362 363 364 365 366 367 368 369 370 371 372 373 374 375 376
Another example of time-dependent confounding by treatment is antiviral treatment of HIV infection, where
treatment or dose may depend on CD4-count and this dependency may continue over the course of the
disease. (Hernan 2000)
IN THE CONDUCT OF NONRANDOMIZED COMPARATIVE EFFECTIVENESS STUDIES, IT IS STRONGLY RECOMMENDED
TO (I) DEFINE THE DAG FOR THE BASE CASE ANALYSIS BEFORE ACTUALLY STARTING THE ANALYSIS, (II) REPORT
THE DAG FOR THE BASE CASE ANALYSIS, AND (3) IF SENSITIVITY ANALYSES ARE PERFORMED FOR DIFFERENT
ASSUMPTIONS REGARDING THE CONFOUNDING STRUCTURE, TO REPORT THE ADDITIONAL DAGS REPRESENTING
THE ASSUMPTIONS OF THE RESPECTIVE SENSITIVITY ANALYSES.
Restriction – Inclusion and Exclusion Criteria
Although a variety of systematic errors may bias non-experimental research (Maclure & Schneeweiss,
2001) confounding bias is of particular concern in epidemiologic studies of drug effects (MacMahon &
Collins, 2001).
Restricting study cohorts to patients who are homogeneous regarding their indication for the study drug
will lead to more balance of patient predictors of the study outcome among exposure groups and thus will
reduce confounding. Restricting study cohorts can also increase the likelihood that all included subjects
will have a similar response to therapy and therefore reduce the likelihood of effect modification.
Randomized controlled trials (RCTs) commonly restrict their study population to patients with a presumed
indication for the study drug and then randomly allocate the actual treatment.
There are many different approaches to restriction in specific studies (Perrio, Waller & Shakir, 2006) and it
is therefore difficult to provide generic advice that fits specific study designs. However, several guiding
principles can be identified that should be considered in a non-randomized databases study on
effectiveness and safety of medical interventions (Schneeweiss et al., 2007).
Exclude patients with a history of the study outcome?
The decision whether to exclude patients with a history of the study outcome is largely based on the study
questions and the chronicity of the outcome under study. Some guiding principle may include:
Patients with a history of occasionally or frequently occurring events that are restored to a normal health
level with or without treatment may not be candidates for exclusion if their health status has reached a
normal level before cohort entry. Examples for such conditions are uncomplicated viral or bacterial
infections.

GRPs FOR DESIGNING NON-RANDOMIZED STUDIES OF TREATMENT EFFECTS USINGSECONDARY DATABASES
14
377 378 379 380 381 382 383 384 385 386 387 388 389 390 391 392 393 394 395 396 397 398 399 400 401 402 403 404 405 406 407 408 409 410 411 412
Patients with a history of conditions that are markers for an underlying chronic condition will have an
increased risk for the study outcome and at the same time may be more likely to take a study medication
causing confounding. Examples for such conditions include hip fractures in elderly patients, which are
markers fro frail health and / or osteoporosis, which put the patient at increased risk for a future event.
Similarly, a previous myocardial infarction is a strong risk factor for future cardiac events. If these
conditions are strong risk factors for future events and therefore potentially strong confounders it may be
better to exclude these patients from the analysis rather than adjusting for them.
Study incident medication users only?
Usually, an epidemiologic database study is implemented by defining a study period for which subjects are
considered. Let us consider a cohort study of statin use and some health outcome. The most basic cohort
definition would be to identify subjects who used a statin at any point during the study period, assigning
the date of first observed statin use during that period as an index date. On each statin user’s index date,
we sampled a subject who had not used a statin as of that date, i.e. a non-user, and assigned him or her
the same index date.
The population of statin users described above consists of a mix of incident drug users, i.e. those starting
on a statin, and prevalent users, i.e. those taking a statin for some time.
Mixed Prevalent and Incident User Cohorts
Studying mixed prevalent and incident user cohorts will lead to under-ascertainment of early events.
Depending on the average duration (chronicity) of use, such cohorts may be composed predominantly of
prevalent users and few new users (e.g. statins). The estimated average treatment effect will therefore
underemphasize effects related to drug initiation and will overemphasize effects of long-term use (Ray,
2003).
Prevalent users of a drug have by definition persisted in their drug use, similar to the concept of survivor
cohorts in chronic disease epidemiology (Rothman, 2002). Being persistent or adherent is a characteristic
found more frequently in patients who tolerate the drug well and who perceive some therapeutic benefit.
Adherence also characterizes patients with higher educational status and health seeking behavior
particularly if the study drug is treating an asymptomatic condition like statins treating hyperlipidemia,
characteristics that are difficult to assess in claims data, and may lead to healthy user bias (Glynn, Knight,
Levin & Avorn , 2001; Redelmeier, Tan & Booth, 1998; Glynn, Monane, Gurwitz, Choodnovskiy &
Avorn, 1999).

GRPs FOR DESIGNING NON-RANDOMIZED STUDIES OF TREATMENT EFFECTS USINGSECONDARY DATABASES
15
413 414 415 416 417 418 419 420
The duration of use among prevalent users can differ by drug exposure; duration thus may cause bias if it
remains unadjusted. Such a scenario is likely when newly marketed drugs are compared with competitors
that have been available longer. In database studies duration of prior use can only be assessed by tracing
back a continuous string of prescriptions to the initial prescription.
In studying prevalent users, investigators can assess patient characteristics only after the initial exposure;
thus the drug under study may affect those characteristics. Adjusting for such factors that are on the
causal pathway of the drug’s action will lead to an underestimation of the drug effects.
“New User Design” 421 422 423 424 425 426 427 428 429 430 431 432 433 434 435 436 437 438 439 440
One begins an incident user design by identifying all patients in a defined population who start a course of
treatment with the study medication. Exposed person-time begins at the start of treatment, which is
identified as a dispensing of the index drug without a dispensing of the index drug during the prior year or
some other fixed time interval comparable with a wash-out period commonly used in RCTs. The
advantage of the so-called “New User Design” has recently been summarized (Ray, 2003). Although
limiting the study population to drug initiators resembles one of several key characteristics of clinical trials,
the limited number of incident users requires large source populations like health care utilization
databases from which new starters can be identified efficiently. For some patients it may not be the first
time they take the study drug, i.e. they are not really naïve to the drug. Patients who know from earlier
treatment courses that they tolerate the drug and that it is effective for them are more likely to use the
same drug again. The chance of an initiator to be a true new user can be increased by requiring longer
periods without use of the study drug before the index prescription.
What is the most adequate comparison group?
Choosing a comparison group is a complex and sometimes subjective issue. The ideal comparison should
comprise patients with identical distributions of measured and unmeasured risk factors of the study
outcome.
Patients with the Same Treatment Indication: “Alternative Drug Users” 441 442 443 444 445 446 447 448
Selecting comparison drugs that have the same perceived medical indication for head-to-head
comparisons of active drugs will reduce confounding by selecting patients with the same indication (e.g.
indication for using celecoxib vs. rofecoxib). Although one can rarely measure the indication directly –in
the statin example we would need laboratory values of serum lipid levels that are not available in claims
data – we infer the indication by the initiation of a treatment specific to the indication. However, new
competitors within a class are often marketed for better efficacy, slightly expanded indications, or better
safety (cyclo-oxygenase-2 inhibitors (coxibs) vs. non-selective non steroidal anti-inflammatory drugs
GRPs FOR DESIGNING NON-RANDOMIZED STUDIES OF TREATMENT EFFECTS USINGSECONDARY DATABASES
16
449 450 451
(NSAIDs)) influencing physicians’ prescribing decisions (Petri & Urquhart, 1991). In this way, new
opportunities of confounding by indication can arise.
“Non-Users” 452 453 454 455 456 457 458 459 460 461 462 463 464 465 466 467 468 469 470 471 472 473 474 475 476 477 478 479 480 481 482 483
In some cases there either is no comparator drug with a reasonably close indication to the study drug or a
class effect is suspected and the effect such that the entire class is to be tested, requiring comparison
subjects who did not use any drug of this class. The most obvious choice may be to identify study subjects
who do not use the study drug and then to pick a random date as the index date, possibly matched by
time to the index date of the first prescription among active drug users.
Obviously, patients on therapy most likely have a medical indication; by contrast a large proportion of non-
users have no medical indication, i.e., patients initiating statin therapy are more likely to have elevated
lipid levels and therefore increased cardiac risks. However, non-users as defined above may differ
substantially from users of the index drug for both measured and unmeasured characteristics, even
beyond the indication for the index drug.
As a case in point: Although initiators of a new drug have (presumably) been evaluated by a physician
just before that prescription, non-users may not have seen a physician for a while and, in fact, may have
less contact with the health care system in general. Differential under-recording of health conditions in the
non-user comparison group makes members of the comparison group appear healthier than they really
are and may lead to an overestimation of treatment effects.
Groups will be more comparable regarding access to health care, including health seeking behavior and
disease surveillance, when choosing comparison patients who also had contact with the health care
system in the form of a drug dispensing. Like patients starting the study drug, such patients have just been
evaluated by a physician before the initial prescription. Adequate comparison groups for new statin
initiators could, for example, be initiators of topical glaucoma drugs or thyroid hormone substitution. Both
these classes of pharmaceuticals are unrelated to lowering serum lipid levels and are used for preventing
the progression of an initially asymptomatic condition.
Excluding patients with contraindications?
In studies of the effectiveness of drugs it is questionable whether we want to include patients who have a
clear contraindication to the study drug. Such patients will be few and their experience will be unusual.
Prudence dictates, therefore, excluding patients with contraindications or absolute indications, resulting in
a situation similar to the therapeutic equipoise required for RCTs (Sturmer, Rothman & Glynn, 2006).

GRPs FOR DESIGNING NON-RANDOMIZED STUDIES OF TREATMENT EFFECTS USINGSECONDARY DATABASES
17
484 485 486 487 488 489 490 491 492 493 494 495 496 497 498 499 500 501 502 503 504 505 506 507 508 509 510 511 512 513 514 515 516 517 518
Because reliably identifying contraindications in claims data is unlikely, identifying them empirically is more
promising. Propensity scores, a common mechanism for doing this, estimate each patient’s probability of
treatment given all measured covariates. These propensity scores follow a distribution between 0 and 1
that differ between actual users and non-users. On the low end of the PS distributions indicating a low
propensity for receiving treatment, there will be a range that is only populated by actual non-users
because all users have a higher propensity scores. Such non-users are likely to have a contraindication
for the study medication because no subject with such a low propensity score has actually received
treatment. These patients should be deleted from the study population. Analogously, such trimming can be
considered at the upper end of the propensity score, excluding patients who will always be treated.
Excluding patients with very low adherence?
Patients dropping out of RCTs for reasons related to the study drug may cause bias. Non-informative
drop-out causes bias towards the null in intention-to-treat (ITT) analyses. The medical profession and
regulatory agencies accept such a bias because its direction is known and trial results are considered
conservative regarding the drug’s effectiveness. Discontinuation of treatment may also be associated with
study outcomes. Obvious reasons are lack of perceived treatment effect or intolerance. Both factors may
lead to early stopping but can cause discontinuation at any time later during the course of treatment.
Another factor that may lead to discontinuation of medications, particularly those used to treat
asymptomatic conditions, is overall frail health status that requires multiple medications to treat the more
symptomatic conditions. For example, cancer patients may discontinue statins in order to reduce
polypharmacy in favor of more urgently needed drugs (Redelmeier et al., 1998).
RCTs try to minimize bias from non-adherence by frequently reminding patients and by run-in phases
before randomization aimed to identify and exclude non-adherent patients. In routine care, adherence to
drugs is unfortunately substantially lower than in RCTs. Studies have shown, that for statin medications,
only 50% to 60% of elderly patients refill their prescriptions after 6 months(Benner, Glynn, Mogun,
Neumann, Weinstein & Avorn, 2002).
Starting follow-up after the third fill of a chronic medication will exclude patients who are least adherent.
Unlike RCTs in which run-in phases are often done with placebo (Pablos-Mendez, Barr & Shea, 1998)
patients in routine care experience their first exposure to a new drug and may discontinue use because of
a lack of effectiveness or intolerance during what may be the most vulnerable period for some medication-
outcome relations. As long as that proportion is small and most patients discontinue for reasons not
directly related to the study drug(s), this issue should be minor.

GRPs FOR DESIGNING NON-RANDOMIZED STUDIES OF TREATMENT EFFECTS USINGSECONDARY DATABASES
18
519 520 521 522 523 524 525 526 527 528 529 530 531 532 533 534 535 536 537 538 539 540 541 542 543 544 545 546 547 548 549 550 551 552 553
Generalizability
To guide our thinking about generalizability, it is useful to specify the patient to whom we wish to
generalize our results. From a patient and physician perspective, the most relevant and frequently asked
question is, “What is the effectiveness and safety of a particular drug that I am about to start and continue
to use, compared with not starting therapy, or compared with starting an alternative drug?” From this
viewpoint, restricting studies to initiators of drug therapy does not limit generalizability. Instead, it avoids
under-representation of treatment effects that occur shortly after initiation. Patients with known
contraindications (or their clinicians) would usually not have to confront this hypothetical question because
prescribing the drug in the first place would contravene current medical knowledge. Therefore, excluding
patients with known contraindications places little limits on generalizability.
In making a prescribing decision, physicians must assume that patients will take a drug as directed. If
clinicians knew beforehand that a patient would not take a prescribed medication, they would not ponder
the appropriateness of the drug in the first place. Consequently, excluding patients who are non-adherent
to their treatment -independent of intolerance or treatment failure - will not limit generalizability to the
question raised above. However, the situation is quite different if we restrict the study population by
disease severity, comorbidities, polypharmacy, and other risk factors for the study outcome. Data based
on such restrictions will limit physicians when making prescribing decisions concerning the excluded
patient subgroups. The obvious solution to this problem is to stratify analyses according to relevant clinical
subgroups, rather than restricting them out of the analysis altogether, and then testing whether treatment
effects differ between groups (Rothwell, 2005). The large size of health care utilization databases can
allow performing such subgroup analyses with substantial numbers of subjects, and represents an
attractive alternative to wholesale restriction.
Conclusion
Design of non-randomized studies of comparative effectiveness face several daunting issues, including
measurement of exposure and outcome challenged by biases in misclassification and confounding. We
identified a set of restrictions that analysts should consider in epidemiologic studies of the safety and
effectiveness of therapeutics when using large observational databases. Such restrictions will place few
limits on generalizability of research finding for most clinically relevant treatment choices. Use of causal
diagrams and restriction are two techniques that can improve the theoretical basis for analyzing treatment
effects in study populations of more homogeneity, with reduced loss of generalizability.

GRPs FOR DESIGNING NON-RANDOMIZED STUDIES OF TREATMENT EFFECTS USINGSECONDARY DATABASES
19
554
References 555
556 557
558 559 560
561 562
563 564
565 566
567 568
569
570 571
572 573
574 575
576 577 578
579 580
581 582
583 584 585
Benner JS, Glynn RJ, Mogun H, Neumann PJ, Weinstein MC, Avorn J: Long-term persistence in use of
statin therapy in elderly patients. JAMA 2002;288:455-461.
Berger M, Mamdani M, Atkins D, Schneeweiss S, Johnson ML. Framing the question: defining, reporting
and interpreting non-randomized studies of treatment effects using secondary databases. ISPOR TF
Report 2009.
Cox ER, Jernigan C, Coons SJ, Draugalis JL. Medicare beneficiaries’ management of capped prescription
benefits. Med Care 2001 Mar: 39(3):296-301.
Erickson SR, Coombs JH, Kirking DM et al. Compliance from self-reported versus pharmacy claims data
with metered-dose inhalers. Ann Pharmacother. 2001; 35(9):997-1003.
Glynn RJ. Monane M. Gurwitz JH. Choodnovskiy I. Avorn J. Aging, comorbidity, and reduced rates of drug
treatment for diabetes mellitus. J Clin Epidemiol 1999;52:781-790
Glynn RJ, Knight EL, Levin R, Avorn J: Paradoxical relations of drug treatment with mortality in older
persons. Epidemiology 2001;12:682-689.
Grayson DA. Confounding confounding. Am J Epidemiol 1987;126:546–53.
Greenland S, Neutra R. Control of confounding in the assessment of medical technology. Int J Epidemiol
1980;9:361–7
Greenland S, Pearl J, Robins JM. Causal diagrams for epidemiologic research. Epidemiology 1999;
10(1):37-48.
Grymonpre RE, Didur CD, Montgomery PR et al. Pill count, self-report, and pharmacy claims to measure
medication adherence in the elderly. Ann Pharmacother. 1998;32(7-8): 749-754.
Hartzema AG and Perfetto EM. Sources and Effects of Drug Exposure and Unintended Effect
Misclassification in Pharmacoepidemiologic Studies. In: Pharmacoepidemiology. Ed. Hartzema AG,
Porta MS, Tilson HH. 2nd edition. Harvey Whitney Books Co.
Hernan MA, Brumback B, Robins JM. Marginal structural models to estimate the causal effect of
zidovudine on the survival of HIV-positive men. Epidemiology 2000; 11:561-570.
Johnson ML, Crown W, Martin B, Dormuth C, Siebert U. Analytic issues in non-randomized studies of
treatment effects using secondary databases. ISPOR TF Report 2009.
King MA, Purdie DM, Roberts MS, Matching prescription claims with medication data for nursing home
residents: implications for prescriber feedback, drug utilization studies and selection of prescription
claims database. J Clin Epidemiol. 2001;54(2):202-209.
GRPs FOR DESIGNING NON-RANDOMIZED STUDIES OF TREATMENT EFFECTS USINGSECONDARY DATABASES
20
586 587
588 589 590
591 592
593 594
595
596 597
598 599
600 601 602
603 604 605
606
607 608
609 610
611
612 613
614
Kirking DM, Ammann MA, Harrington CA. Comparison of medical records and prescription claims files in
documenting prescription medication therapy. J Pharmacoepidemiol. 1996;5:3-15.
Kiyota Y, Schneeweiss S, Glynn RJ, et al., The accuracy of Medicare claims-based diagnosis of acute
myocardial infarction: estimating positive predictive value based on review of hospital records. Am
Heart J. 2004;148:99-104.
Kwon A, Bungay KM, Pei Y et al. Antidepressant Use: concordance between self-report and claims
records. Med Care. 2003;41(3):368-374.
Lix LM, Yogendran MS, Leslie WD, et al. Using multiple data features improved the validity of
osteoporosis case ascertainment from administrative databases. J Clin Epidemiol. 2008 (in press)
Maclure M, Schneeweiss S. Causation of Bias: The Episcope. Epidemiology 2001;12:114-22.
MacMahon S, Collins R: Reliable assessment of the effects of treatment on mortality and major morbidity,
II: observational studies. Lancet 2001;357:455-462.
Mager DE, Cox ER. Relationship between generic and preferred-brand prescription copayment
differentials and generic fill rate. Am J Manag Care. 2007 Jun;13(6 Pt 2):347-52.
McKenzie DA, Semradek J, McFarland BH et al. The validity of Medicaid pharmacy claims for estimating
drug use among elderly nursing home residents: The Oregon experience. J Clin Epidemiol.
2000;53(12):1248-1257.
McKnight J, Scott A, Menzies D, Bourbeau J, Blais L, Lemiere C. A cohort study showed that health
insurance databases were accurate to distinguish chronic obstructive pulmonary disease from asthma
and classify disease severity. J Clin Epidemiol. 2005;58:206-208.
Miettinen OS. Confounding and effect modification. Am J Epidemiol. 1974. 100(5): 350-353.
Motheral BR and Fairman KA. The use of claims databases for outcomes research: Rationale,
challenges, and strategies. Clinical Therapeutics. 1997;19:346-366.
Pablos-Mendez A, Barr RG, Shea S, Run-in periods in randomized trials: implications for the application of
results in clinical practice. JAMA 1998;279:222-25.
Pearl J. Causality. Cambridge, UK: Cambridge University Press, 2000).
Perrio M, Waller PC, Shakir SAW. An analysis of the exclusion criteria used in observational
pharmacoepidemiological studies. Pharmacoepidemiol Drug Safety 2006; in press.
Petri H, Urquhart J. Channeling bias in the interpretation of drug effects. Stat Med 1991;10:577-81.

GRPs FOR DESIGNING NON-RANDOMIZED STUDIES OF TREATMENT EFFECTS USINGSECONDARY DATABASES
21
615 616 617
618 619
620 621
622 623 624
625 626
627
628 629
630 631
632 633 634
635 636
637 638 639
640 641
642 643 644
645 646
Quam L, Ellis LB, Venus P et al. Using claims data for epidemiologic research. The concordance of
claims-based criteria with the medical record and patient survey for identifying a hypertensive
population. Med Care. 1993;31(6):498-507.
Ray WA: Evaluating medication effects outside of clinical trials: new-user designs. Am J Epidemiol
2003;158:915-920.
Redelmeier DA, Tan SH, Booth GL: The Treatment of Unrelated Disorders in Patients with Chronic
Medical Diseases. N Engl J Med 1998;338:1516-20.
Robins JM. Marginal structural models versus structural nested models as tools for causal inference. In:
Halloran E, Berry D, eds. Statistical Models in Epidemiology: The Environment and Clinical Trials. New
York: Springer-Verlag, 1999;95-134.
Roos LL, Sharp SM, Wajda A. Assessing data quality: A computerized approach. Soc Sci Med.
1989;28:175-182.
Rothman KJ. Epidemiology. An Introduction. Oxford University Press, New York, NY, 2002.
Rothwell PM. Subgroup analysis in randomized controlled trials: importance, indications, and
interpretation. Lancet 2005;365:176-86.
Schneeweiss S, Avorn J. A review of uses of health care utilization databases for epidemiologic research
on therapeutics. J of Clinical Epidemiology. 2005;58:323-337.
Schneeweiss S, Patrick AR, Sturmer T, Brookhart MA, Avorn J, Maclure M, Rothman K, Glynn RJ.
Increasing levels of restriction in pharmacoepidemiologic database studies of elderly and comparison
with randomized trial results. Medical Care 2007;45:S131-42.
Schneeweiss S. Developments in post-marketing comparative effectiveness research. Clinical
Pharmacology and Therapeutics. 2007;82:143-156.
Siebert U. Comments from the Recipient of the Award for Outstanding Short Course: Causal Inference in
Decision Analysis - DAGs as Causal Roadmaps. Society for Medical Decision Making Newsletter
2005;17(1):9-10).
Strom BL, Carson JL, Halpern AC, Schinnar R, Snyder ES, Stolley PD et al. Using a claims database to
investigate drug-induced Stevens-Johnson syndrome. Stat Med 1991;10:565-76.
Sturmer T , Rothman KJ, Glynn RJ. Insights into different results from different causal contrasts in the
presence of effect-measure modification. Pharmacoepidemiol Drug Saf. 2006 Mar 10; [Epub ahead of
print]
Suissa S. Immeasurable time bias in observational studies of drug effects on mortality. Am J Epidemiol.
2008 Aug 1: 168(3): 329-35.
GRPs FOR DESIGNING NON-RANDOMIZED STUDIES OF TREATMENT EFFECTS USINGSECONDARY DATABASES
22
647 648 649
650 651
652 653
654
655 656
657 658
Tamblyn R, LaVoie G, Petrella L, Monette J. The use of prescription claims databases in
pharmacoepidemiological research: The accuracy and comprehensiveness of the prescription claims
database in Quebec. J Clin Epidemiol. 1995;48:999-1009.
Van Staa TP, Abenhaim L, Leufkens HGM. A study of the effects of exposure misclassification due to the
time-window design in pharmacoepidemiologic studies. J Clin Epidemiol 1994;47:183-189.
Van Staa TP, Abenhaim L. Utilization dynamic and risk comparisons in studies that use prescription
information. Pharmacoepidemiol Drug Saf 1994;3:191-197.
Weinberg CR: Towards a clearer definition of confounding. Am J Epidemiology 1993; 137:1-8.)
Wilchesky M, Tamblyn RM, Huang A. Validation of diagnostic codes within medical services claims. J
Clin Epidemiol. 2004;57:131-141.