design and evaluation of hybrid energy storage systems for
TRANSCRIPT

Design and Evaluation of Hybrid Energy
Storage Systems for Electric Powertrains
by
Karl BA. Mikkelsen
A thesis
presented to the University of Waterloo
in fulfillment of the
thesis requirement for the degree of
Master of Applied Science
in
Mechanical Engineering
Waterloo, Ontario, Canada, 2010
© Karl BA. Mikkelsen 2010

ii
Author's Declaration I hereby declare that I am the sole author of this thesis. This is a true copy of the thesis, including any
required final revisions, as accepted by my examiners.
I understand that my thesis may be made electronically available to the public.

iii
Abstract At the time of this writing, increasing pressure for fuel efficient passenger vehicles has prompted automotive
manufactures to invest in the research and development of electrically propelled vehicles. This includes
vehicles of strictly electric drive and hybrid electric vehicles with internal combustion engines.
To investigate some of the many technological innovations possible with electric power trains, the
AUTO21 network of centres of excellence funded project E301-EHV; a project to convert a Chrysler
Pacifica into a hybrid electric vehicle. The converted vehicle is intended for use as a test-bed in the research
and development of a variety of advances pertaining to electric propulsion. Among these advances is hybrid
energy storage, the focus of this investigation.
A key difficulty of electric propulsion is the portable storage or provision of electricity, challenges are
twofold; (1) achieving sufficient energy capacity for long distance driving and (2) ample power delivery to
sustain peak driving demands. Where gasoline is highly energy dense and may be burned at nearly any rate,
storing large quantities of electrical energy and supplying it at high rate prove difficult. Furthermore, the
demands of regenerative braking require the storage system to undergo frequent current reversals, reducing
the service life of some electric storage systems.
A given device may be optimized for one of either energy storage or power delivery, at the sacrifice
of the other. A hybrid energy storage system (HESS) attempts to address the storage needs of electric vehicles
by combining two of the most popular storage technologies; lithium ion batteries, ideal for high energy
capacity, and ultracapacitors, ideal for high power discharge and frequent cycles.
Two types of HESS are investigated in this study; one using energy-dense lithium ion batteries paired
with ultracapacitors and the other using energy-dense lithium ion batteries paired with ultra high powered
batteries. These two systems are compared against a control system using only batteries. Three sizes of each
system are specified with equal volume in each size. They are compared for energy storage, energy efficiency,
vehicle range, mass and relative demand fluctuation when simulated for powering a model Pacifica through
each of five different drive cycles.

iv
It is shown that both types of HESS reduce vehicle mass and demand fluctuation compared to the
control. Both systems have reduced energy efficiency. In spite of this, a battery-battery system increases range
with greater storage capacity, but battery-capacitor systems have reduced range.
It is suggested that further work be conducted to both optimize the design of the hybrid storage
systems, and improve the control scheme allocating power demand across the two energy sources.

v
Acknowledgements For his support, astute guidance and unfaltering patience, I would like to thank my supervisor; Professor
Stephan Blair Lambert of the faculty of Mechanical and Mechatronics Engineering at the University of
Waterloo. I would like to extend a debt of gratitude to a host of researchers for sharing their collective wealth
of knowledge with me. These include Dr. Salama and Dr. Kazerani of the faculty of Electrical and Computer
Engineering at the University of Waterloo, Dr. Rideout of Memorial University of Newfoundland, Dr.
Minaker of the University of Windsor, and Dr. Rohraur of the University of Ontario Institute of Technology.
I would especially like to thank Dr. Rohraur's student, Pierre Hinse, for inspiring my interest in electric drive
trains.
This study would not have been possible without the continued financial support of AUTO21, a
network of centres of excellence promoting academic research in the automotive industry within Canada. By
extension, I thank AUTO21's benefactors, the Natural Sciences and Engineering Research Council of
Canada.
I also wish to thank my family. The perpetual encouragement, wisdom, and understanding they have
shown me has been of immense value.

vi
Dedication I dedicate this thesis to my friend Arija. Thank you for always helping me find joy in whichever moment I'm
living in.

vii
Table of Contents Author's Declaration ii
Abstract iii
Acknowledgements v
Dedication vi
Table of Contents vii
List of Tables x
List of Figures xi
1.0 Introduction 1
1.1 Motivation for Electrified Vehicles 2
1.2 Background to Electrified Vehicles 3
1.3 Pacifica Background 4
1.4 Thesis Objectives 5
2.0 Literature Review 6
2.1 Vehicle Power Requirements 6
2.2 EV Powertrain Technologies 9
2.2.1 Transmission and Running Gear 9
2.2.2 Electric Motors 10
2.2.3 Inverters 12
2.2.4 DC/DC Converters 13
2.3 EV Storage Technologies 14
2.3.1 Batteries 14
2.3.2 Ultra capacitors 19
2.3.3 Comparison of Storage Technologies 21
2.3.4 Hybrid Energy Storage 23
2.3.5 Hybrid Control and Power Management 25
2.4 Powertrain Evaluation 26
3.0 Vehicle Configuration and Simulation 29
3.1 Vehicle Configuration 29
3.1.1 Powertrain 30

viii
3.1.2 Hybrid Energy Storage Design Strategy 32
3.2 Simulation Structure 35
3.2.1 Overview 35
3.2.2 Inputs 37
3.2.3 Vehicle Drag Force 38
3.2.4 Running power 39
3.2.5 Motor 40
3.2.6 Inverter 42
3.2.7 DC Converter 43
3.2.8 HESS 47
3.3 Validation 49
4.0 Results 50
4.1 Scenarios 50
4.1.1 Energy Storage Systems 50
4.1.2 Drive Schedules 51
4.1.3 Simulation Matrix 52
4.2 Results 52
4.2.1 Range and Energy Efficiency Estimation 52
4.2.2 Service Life Effects 59
4.2.3 Implications 61
4.3 Limitations 63
4.3.1 Simplification and Approximation 63
4.3.2 Drive Schedule 64
4.3.3 Hybrid Control Scheme 64
4.3.4 Battery Service Life 65
4.3.5 Chapter Summary 65
5.0 Conclusions and Recommendations 66
5.1 Conclusions 66
5.2 Recommendations 67
References 69

ix
Appendices
Appendix A - Chrysler Pacifica Specifications 74
Appendix B - Gapped Inductor Design for DC-DC Converter 78
Appendix C - Battery Discharge Model 84
Appendix D - Battery and Capacitor Cell Parameters 85
Appendix E - Energy Usage Graphs 87
Appendix F - Demand Variation Graphs 90

x
List of Tables
Table 1.1 - Pacifica specifications 4
Table 2.1 - Drive cycle statistics 7
Table 2.2 - Battery cell comparison (Masrur and Mi 2006) 18
Table 2.3 - Comparison of storage and conversion technologies 21
Table 3.1 - Power system properties 34
Table 4.1 - Energy storage systems under consideration for Pacifica conversion 51
Table 4.2 - Simulation matrix 52

xi
List of Figures Figure 1.A - Parallel vs. series hybrid configurations 4
Figure 1.B - Proposed drive train topology for the Pacifica 5
Figure 2.A - Motor torque and power vs. shaft speed 11
Figure 2.B - Li-ion battery schematic 15
Figure 2.C - Cell chemistry specific energy vs. specific power, gravimetric 19
Figure 2.D - Capacitor and ultracapacitor schematic 20
Figure 2.E - Energy density vs. power density, volumetric 23
Figure 2.F - Battery-capacitor coupling options 25
Figure 3.A - Powertrain overview 31
Figure 3.B - Powertrain calculation procedure 36
Figure 3.C - System overview 37
Figure 3.D - Drive cycle input 38
Figure 3.E - Drag force schematic 39
Figure 3.F - Running power schematic 40
Figure 3.G - Motor schematic 42
Figure 3.H - Inverter schematic 43
Figure 3.I - DC-DC converter schematic 44
Figure 3.J - Energy management system schematic 45
Figure 3.K - DC-DC converter loss schematic 46
Figure 3.L - HESS calculations 48
Figure 4.A - Range vs. storage system mass 53
Figure 4.B - Range vs. mass per drive schedule 55
Figure 4.C - Energy usage breakdown for UDDS 57
Figure 4.D - Energy usage breakdown for US06 58
Figure 4.E - Normalized current demand for US06 59
Figure 4.F - Normalized current demand for UDDS 60

xii
Figure 4.G - System volume specific power vs. volume specific capacity 62

1
1.0 Introduction
As of 2010, the most prominent aspect for improvement required of the automotive industry is clear:
governments and consumers are increasingly demanding vehicles with better fuel efficiency and lower
emissions. This demand began in the early 1970's with the Arab Oil Embargo (U.S. Dept. of State Office of
the Historian) followed by the advent of the United States Corporate Average Fuel Economy (CAFE)
regulations in 1975 (National Highway and Traffic Safety Administration, 2010). The trend persisted through
the 1990's with the California Air Resources Board (CARB) requiring a fraction of vehicles sold in California
to be zero emission vehicles (Westbrook, 2001).
Each manufacturer has responded uniquely to the demand for fuel efficiency; however, a common
theme is a move toward electrification of the powertrain. General Motors began with the EV1 in 1996. The
EV1 was, for most intents and purposes, the first production electric car since the Baker Electric in 1921
(Westbrook, 2001). GM's most recent research efforts in improving fuel efficiency include two-mode hybrid
systems (Sherman, 2009), a gas-electric series hybrid called the 'Volt' (General Motors Canada, 2010), and
homogenous charge compression ignition engines (Abuelsamid, 2007). Toyota produced the first mass
market parallel hybrid vehicle, the Prius, released in North America in 1997 (Westbrook, 2001). Ford has
announced a battery powered version of the Focus to be available in 2011 (Patrascu, 2010).
Interest in fuel efficiency spearheads an accelerating shift toward electrified vehicles that appears to
be beginning with partially electric drive trains, like those of gas-electric hybrids, and progressing to
completely electric propulsion. This shift presents a host of technical challenges, the most significant of
which is the reliable, robust and practical storage of electrical energy for propulsion over long distances. A
handful of portable electricity sources exist, such as fuel cells or batteries, with varying benefits and
detriments. A major challenge is the balance between sufficient energy storage for adequate electric-only
range, coupled with sufficient power capability for acceleration (and deceleration) performance.
One of many answers to the problems of energy storage is to combine two different storage devices
in order to leverage the benefits of each; a hybrid energy storage device. Hybrid electric energy storage poses

2
a host of technical, design and evaluation requirements, the implications of which are addressed in this work.
This section provides background to electrified vehicles, introduces a specific design case, and gives an
outline for the content to follow.
1.1 Motivation for Electrified Vehicles
The attractions of electric transportation are many, but the primary incentives stem from the problems of the
prevalent alternative: the combustion of fossil fuels. Hydrocarbon combustion is substantially responsible for
degraded air quality, especially in densely populated areas, and for human-associated greenhouse gas
emissions (Hodkinson, et al., 2001). Internal combustion presently relies directly on the availability of crude
oil, the procurement of which is a politically and environmentally sensitive process. Disruptions to the supply
of oil result in price swings and economic uncertainty. Additionally, crude oil is in finite supply, and a
substantial amount of the original worldwide reserves have already been consumed (Styles, 2010). Automobile
ownership is increasing worldwide (Hodkinson, et al., 2001) and the consumption of crude oil is likely to
increase at a matching pace. General awareness is growing for the unsustainable nature of fossil fuels, and the
need for a viable alternative energy source for transportation.
Generating sources for electricity are numerous, and environmentally benign sources such as wind,
solar and hydrostatic generation are finding increasing public favour. The multitude of options for producing
electricity reduces the risk of supply disruption. Furthermore, the efficiency of converting stored energy to
mechanical energy is on the order of 80% for electric propulsion, compared to internal combustion which is
at best 30% (Masrur, et al., 2006). The price of electricity is much less than that of gasoline and also more
stable (Paine, 2006).
The benefits of electric transportation are countered by difficulties in storing electrical energy for use
in vehicles. Market research indicates that consumers are willing to purchase electric vehicles if performance,
range and service life all match or exceed that of traditional gasoline powered vehicles (LeBlanc, 2010) at or
below the cost of gasoline cars. Present options for storing electric energy include fuel cells, ultra-capacitors
and a variety of battery types, none of which are yet able to compete with gasoline on the aforementioned
metrics by themselves.

3
1.2 Background to Electrified Vehicles
Many types of electrified vehicles exist. They are categorized by energy storage type and by degree of
electrification. At one end of the spectrum of electrification is a conventional gasoline powered vehicle and at
the other, a fully electrified vehicle. In between the two are hybrid electric vehicles (HEVs). By definition, a
hybrid vehicle uses two propulsion methods - for instance gasoline and electric. Depending on the relative
power of the electric motor and combustion engine, the vehicle may be termed a 'micro hybrid', 'mild hybrid',
or 'full hybrid' (Johnson Controls, 2010). Some hybrids are capable of increased electric operation if their
batteries are first charged by an external electricity supply, these are known as plug-in hybrid electric vehicles
(PHEV). Fully electric vehicles are categorized according to their power source, for instance battery electric
vehicles (BEV), or fuel cell electric vehicles (FCEV). The term electrified vehicle (EV) broadly refers to all of
these varieties.
HEVs may use a parallel or series configuration of engine and motor. In a parallel configuration, the
engine is mechanically connected to the drive wheels and can operate the car independently. This approach is
used by Honda's integrated motor assist topology (Honda Motor Co., Ltd., 2010). In a series hybrid such as
the Chevrolet Volt, the engine is used exclusively for generating electricity with which to run the motor
(General Motors Canada, 2010). Figure 1.A shows typical configurations for series and parallel hybrid drive
trains.

4
1.3 Pacifica Background
Many advantages related to propulsion and otherwise, can be gained or made easier to implement with a
vehicle using an electric drive train. These advantages include torque vectoring, active handling and stability
control, intelligent grid interfacing, hybrid energy storage, and more. To evaluate these advantages, a project
to convert a Chrysler Pacifica to hybrid electric propulsion was initiated by research members of AUTO21, a
network of centres of excellence within Canada. The converted Pacifica is intended for use as a test-bed
vehicle for use in the research of EV related technologies.
The Pacifica is a crossover minivan and SUV with a six cylinder engine, front wheel drive and
automatic transmission. The model used in this project has the all wheel drive option, with a shaft from the
rear wheels connecting to the front differential through a power takeoff unit. Key specifications of the 2004
Pacifica are shown in Table 1.1. Detailed specifications are given in Appendix A (Allpar, 2010).
Table 1.1 - Pacifica specifications
Drive type All wheel drive (AWD)
Engine 3.5L V6
Torque 250 ft.lb @ 3950 rpm
Power 250 hp @ 6400 rpm
Transmission 4 speed automatic
Fuel economy (city/highway) 17/22 mpg
Curb weight 2121 kg
Combustion engine
Transmission
Motor/ generator
Motor/ generator
Generator
Battery pack
Electrical connection
Front axle
Figure 1.A - Parallel vs. series hybrid configurations

5
The proposed configuration of the electrified Pacifica includes adding an electrical energy source,
DC/DC converter, traction inverter and electric motor with a single speed transmission. The precise
mechanical configuration of the drive train is not yet determined, but it is assumed that electric propulsion
will be applied to all four wheels. A topology proposed by Steven Samborsky in 2006 includes electric motors
at each axle and a battery-capacitor energy storage system as illustrated in Figure 1.B (Samborsky, 2006).
1.4 Thesis Objectives
The goals of this work are to design a hybrid energy storage system for the Pacifica, and assess its merits over
traditional storage solutions. This document begins with a technical review of relevant technologies for
energy storage, electric vehicle propulsion and power train evaluation in section 2.0 - Literature Review. The
topology (or configuration) of the electric drive train is given for the Pacifica with discussion of the method
for evaluation and validation in section 3.0 - Vehicle Configuration and Simulation. The hybrid storage
systems to be tested and corresponding test scenarios are presented in section 4.0 - Results. Section 4.0 also
includes simulation results and discussion, together with limitations of the evaluation. Conclusions and
recommendations are summarized in section 5.0.
Internal combustion
engine
M/G
Trans M/G
Ultracapacitors
Batteries
DC/DC
Inverter Inverter
Figure 1.B - Proposed drive train topology for the Pacifica

6
2.0 Literature Review
This section summarizes the technical background of electric powertrains and energy usage. It includes an
explanation of vehicle running requirements, a brief technical overview of the most common components
used in electric drive trains and energy storage systems, and gives consideration to the design of hybrid
storage systems and power control schemes. The section concludes with a discussion of overall vehicle
powertrain simulation and evaluation.
2.1 Vehicle Power Requirements
Owing to varied speed limits and traffic conditions, a journey by car through a typical city will encounter a
wide range of speeds. The journey will also be punctuated by stops due to intersections and other
interruptions to traffic such as construction or congestion.
To characterize and measure typical vehicle driving patterns, the United States Environmental
Protection Agency (EPA) (United States Environmental Protection Agency 2008) developed a number of
drive schedules, or drive cycles, that represent driving conditions expected of a consumer vehicle. The drive
schedules consist of a second-by-second record of vehicle velocity. Acceleration and distance may be
calculated from the velocity profile, and with details of the vehicle such as mass, coefficient of drag,
transmission ratios and efficiency maps, total vehicle power usage can be determined. An important limitation
of the drive cycles is that they do not include information about surface incline, and so gravitational running
requirements must be neglected.
The drive cycles published by the EPA are used widely in industry as benchmarks for vehicle
efficiency and fuel consumption. Among them are the urban dynamic drive schedule (UDDS), the unified
drive schedule (LA92), the supplemental federal test procedure (US06), the highway fuel economy driving
schedule (HWYCOL) and the New York city schedule (NYCCCOL). More drive cycles exist, though these
five cover the widest array of driving situations (United States Environmental Protection Agency 2008).

7
UDDS is the most used standard drive schedule, represents driving in suburban/city conditions and
is regarded as one of the mildest drive cycles published. LA92 was developed by the California Air Resources
Board. LA92 also represents city driving but is more aggressive with a higher top speed than UDDS and has
considerably higher acceleration. US06 is also city style driving, but is more aggressive than LA92 or UDDS,
and includes a greater share of highway travel. HWYCOL includes only a single start/stop with
approximately 10 minutes of highway speed travel in between. NYCCCOL reflects travel in dense traffic
through a major city centre. Key statistics of all five drive cycles are given in Table 2.1. Note that 30 [m/s] =
108 [km/h].
Table 2.1 - Drive cycle statistics
UDDS LA92 US06 NYCCCOL HWYCOL
Distance [m] 11990 15797 12885 1898 16503
Duration [s] 1369 1435 598 596 765
Average veloctiy [m/s] 8.8 12.1 21.5 3.2 22.5
Maximum velocity [m/s] 25.3 30.0 35.9 12.4 26.8
Maximum acceleration [m/s2] 1.48 2.82 3.24 2.68 0.94
Minimum acceleration [m/s2] -1.48 -2.84 -2.82 -2.28 -1.45
Intermediate stops 15 14 4 16 0
Propulsion force requirements, Fp, of a vehicle powertrain are fourfold: (1) rolling resistance, (2)
aerodynamic drag, (3) inertial, and (4) gravitational. Propulsion power, Pp is the product of propulsion force
and vehicle speed, u.
(2-i)
Gravitational resistance is present only when the vehicle is travelling in the direction of a surface
gradient. The sum of forces due to rolling resistance, Frr and aerodynamic drag, Fad make up the total drag.
For cruising at constant velocity with no surface gradient, drag is the only propulsion requirement. When
accelerating, the force of acceleration, Fac must be added to the drag to give total propulsion requirement.
(2-ii)
Fg is proportional to the mass of the vehicle, m, velocity, and the angle of incline, θ.

8
(2-iii)
Rolling resistance is a consequence of deformation in the wheels and/or road surface, it is given by
(2-iv)
where Cr is the coefficient of rolling resistance of the vehicle tires. Cr varies with the type of road surface.
Aerodynamic drag is calculated according to the expression
(2-v)
where Cd is the drag coefficient corresponding to the vehicle's geometry, A is the frontal surface area, and ρ is
the density of air. Finally, the force of acceleration comes from Newton's second law,
(2-vi)
where a is the instantaneous acceleration of the vehicle. Because Fac is proportional to the vehicle mass and
acceleration, it becomes important any time a change in velocity happens, such as accelerating after a stop. It
can be shown that for a vehicle travelling through a typical city, Fac is intermittently much higher than drag,
and causes Fp to vary widely. Fac becomes negative during deceleration. As a vehicle decelerates, it's kinetic
energy is reduced, and the difference in kinetic energy at the initial and final velocities is potentially available
for recovery.
Various mechanisms are available for the recovery of kinetic energy, including mechanical flywheels
and electrical storage. Energy recovered from deceleration may subsequently be used in acceleration,
offsetting power demand due to Fac. The amount of kinetic energy available for recovery is significant: for a
1500 [kg] vehicle coming to rest from a highway speed of 100 [km/h], more than 160 [W∙hr] may be
recovered. For reference, the Chevrolet Volt is expected to have a usable battery capacity of 8 [kW∙hr] that is
to power the car for 64 [km]. Thus, the recovered energy from each stop from highway speed can extend the
range by up to 2%.

9
Vehicles require power to operate exterior and interior lighting, air conditioning or heating systems,
driver instrumentation, etc. This manifests as an accessory load, which varies depending on the equipment
used in the vehicle (Miller 2006).
2.2 EV Powertrain Technologies
This section introduces and describes key technologies for devices used in electric powertrains. Focus is given
to devices considered for use in the conversion of the Chrysler Pacifica.
2.2.1 Transmission and Running Gear
Many configurations for vehicle running gear exist, with the most common being front wheel drive. Rear
wheel, four wheel and all wheel drive are other typical configurations seen on production vehicles; these
configurations will typically require a propulsion shaft to transfer torque from the engine, which is usually at
the front of the vehicle. Motor/generators can be made much more compact than internal combustion
engines, and so electric vehicles have new driveline options available. For instance, multiple motors may be
used individually at the front and rear axles, or at each wheel (Editors, Green Car Journal 2010). This brings
the benefit of allocating torque selectively to the front or rear, or left to right, known as torque vectoring.
Selection of the drive wheels has importance for regenerative braking. During braking, vehicle weight
shifts to the front. To avoid locking the rear wheels, most braking torque must come from the front wheels.
It is best to have electric drive at all wheels, but if this is not feasible, it is preferable to have electric drive at
the front wheels in order to capture more regenerative braking energy while preserving the normal brake bias.
The torque and efficiency of a combustion engine varies significantly with engine speed, and so most
gas engine powered vehicles have a gear box to make the engine's 'torque band' accessible at every driving
speed. Some late model vehicles use a continuously variable transmission (CVT) that consist of conical
pulleys that can adjust the radius of a connecting belt. As discussed in section 2.2.2 - Electric Motors, electric
motors have no need for an adjustable ratio transmission; a single speed reduction is sufficient in most cases.

10
The modified Pacifica will add an electric motor to both the front and the rear, allowing for
regenerative braking from all wheels. A single speed reduction is used for each motor for simplicity.
2.2.2 Electric Motors
Many types of electric motor exist, the simplest being a commutated DC motor, or a brushless AC motor. A
host of three-phase motors exist, including synchronous, asynchronous and switched reluctance varieties. The
most common choice for electric vehicles is the three phase induction motor. The induction motor finds
favour in vehicles because of its high torque and power in a small, light weight package (Westbrook 2001),
(Hodkinson and Fenton 2001).
An induction motor has either two or four pairs of windings, or poles, arranged around its stator, for
each of the three phases (Westbrook 2001). Supplied with 3 phase alternating current, the windings become
magnetically polarized, with the direction of polarization rotating around the shaft of the motor. The rotating
magnetic field induces magnetization in the rotor, typically resembling a squirrel cage. The relative speed of
the rotor and the rotating magnetic field of the stator induces motion in the rotor. The difference in angular
speed between the rotor and the field of the stator is called the slip, which increases with higher torque.
Output speed is a function of slip and supply frequency.
When the three phase input supplied to an induction motor lags the rotational position of the rotor, a
torque is applied that opposes the direction of motion of rotation. This effect may be used to cause the motor
to act as a generator, slowing the vehicle by converting mechanical motion to electrical current.
11
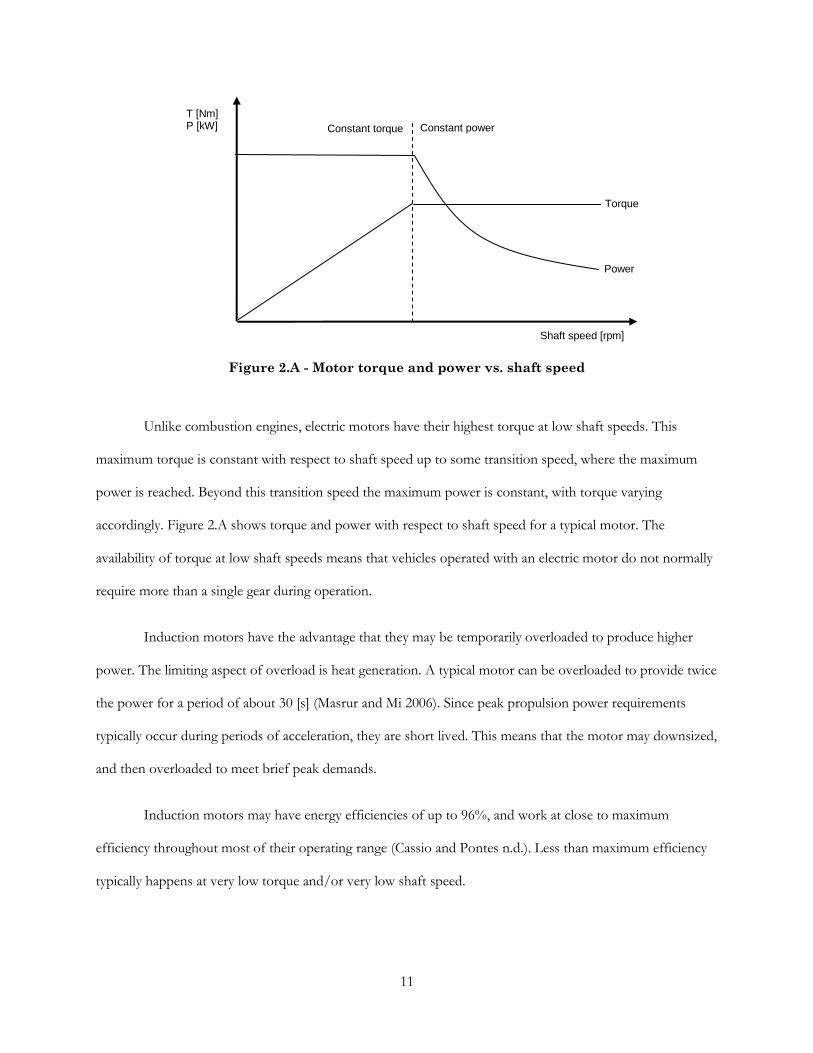
Unlike combustion engines, electric motors have their highest torque at low shaft speeds. This
maximum torque is constant with respect to shaft speed up to some transition speed, where the maximum
power is reached. Beyond this transition speed the maximum power is constant, with torque varying
accordingly. Figure 2.A shows torque and power with respect to shaft speed for a typical motor. The
availability of torque at low shaft speeds means that vehicles operated with an electric motor do not normally
require more than a single gear during operation.
Induction motors have the advantage that they may be temporarily overloaded to produce higher
power. The limiting aspect of overload is heat generation. A typical motor can be overloaded to provide twice
the power for a period of about 30 [s] (Masrur and Mi 2006). Since peak propulsion power requirements
typically occur during periods of acceleration, they are short lived. This means that the motor may downsized,
and then overloaded to meet brief peak demands.
Induction motors may have energy efficiencies of up to 96%, and work at close to maximum
efficiency throughout most of their operating range (Cassio and Pontes n.d.). Less than maximum efficiency
typically happens at very low torque and/or very low shaft speed.
T [Nm] P [kW]
Shaft speed [rpm]
Constant power Constant torque
Power
Torque
Figure 2.A - Motor torque and power vs. shaft speed

12
Detailed mathematical relations exist to fully describe the state of an induction motor. These
relationships are necessary in the detailed design and assessment of an induction motor, but would be
cumbersome and impractical for simulating prolonged use, as in evaluating powertrain performance through
a drive cycle. A number of alternate approaches can be taken. Motor simulation can be done using a
simulation package such as the Powertrain Systems Analysis Toolkit (PSAT) by Argonne National Laboratory
(Argonne National Laboratory 2010), or Simulink for MatLab (MathWorks 2010). PSAT and Simulink
simulate motors with a condensed set of equations and relationships. For Simulink, this condensed model
consists of a fourth order state-space model to represent the electrical aspect of the motor, and a second
order system for the mechanical aspect (The MathWorks, Inc. 2009).
The primary goal of simulating a motor within a powertrain is to understand where energy is lost.
Motors and generators have energy efficiencies that vary most strongly with shaft speed and with torque
demand (Odvarka, et al. 2009), (Lukic and Emado n.d.). This fact makes it possible to estimate the efficiency
of the motor using a simple lookup table, based only on shaft speed and torque. The lookup table approach is
adopted by ADVISOR, a vehicle simulation toolkit developed within MatLab Simulink (AVL 2010). Lookup
tables are the simplest and most computationally expedient method of simulating the operation of an
induction motor.
2.2.3 Inverters
The induction motor described in section 2.2.2 - Electric Motors operates with a supply of three phase
alternating current (AC), yet all portable sources of electrical energy supply direct current (DC). The prevalent
method of converting DC to three phase AC is with a switched three phase inverter (Emadi 2005). A linear
inverter varies output voltage between 0 and input voltage by adding an adjustable resistor in series with the
output. This method entails a large energy waste as current must pass through the added resistor. A switched
inverter uses a set of switches to rapidly flicker the input voltage on and off, similar to dimming a light by
rapidly switching it on and off. Switched inversion does not involve an extra resistance in series with the load,
and so energy losses are much lower than linear inversion.

13
A switched three phase inverter uses a set of six switches to produce three sinusoidal outputs. Supply
frequency can be changed by increasing or decreasing the frequency of switching. Small parasitic losses are
inherent as switches shed some heat in the on-state, and each change from on to off or vice versa loses some
energy within the switches' snubber circuits.
Inverters can be simulated in any of the same ways as motors; PSAT, ADVISOR and Simulink all
have inverter models built in. Switched electronic circuits are very tedious to simulate because of the frequent
discontinuities at every state change of every switch (Bryant, Walker and Mawby n.d.). Time average models
can sometimes accelerate simulation by replacing each switch with a voltage source of value equal to the time-
average voltage across it and each diode with a current source equal to the time average current through it
(Perreault n.d.), but this method can still involve lengthy simulation times.
If the desired outcome is simply to understand energy losses in inverters with use, their relatively
simple nature lends them well to basic empirical relations in terms of switching frequency, parasitic
resistances and switch losses.
2.2.4 DC/DC Converters
It is often necessary to supply electricity at a particular voltage while storing it at another. Additionally, since
batteries and capacitors both have varying voltage levels throughout their range of charge, DC-DC
conversion is often appropriate (Emadi 2005).
In municipal electric transmission, voltage transformation is done electromagnetically with a
transformer. This approach cannot be used directly in electric transmissions since voltage is supplied with
DC, instead of AC as used in transformers. Transformation may not be done after the inverter either, since
the inverter supplies three phase current of varying frequency. DC-DC conversion is instead achieved using a
switched approach, whereby an inductor core is magnetized with DC current from the source in one state,
and this current is applied to the load in the second state. This type of conversion has many forms, but the
simplest and most commonly used in electric vehicles is the switched buck-boost converter. A buck-boost

14
converter can transform the voltage of a DC supply either upwards or downwards depending on the duty
ratio of the switch, and also serves as an electrical isolation between the source and the load.
PSAT, ADVISOR and Simulink may be used to simulate the operation of a DC-DC converter. No
specific models exist within Simulink, but a model of the desired topology may be implemented and
simulated. DC-DC converters are difficult to simulate for extended use for the same reason as inverters;
frequent state switching is computationally expensive (Lachichi and Schofield 2006), (Yalamanchili and
Ferdowsi 2006). Time average models may be used in the same way as inverters, but only provide a marginal
improvement in calculation time. Like inverters, simple equations can be used to determine energy losses
based on current through switches, switching frequency, and parasitic resistive losses.
2.3 EV Storage Technologies
This section covers the most relevant means available for storing and supplying electric energy for use in a
vehicle. Batteries and capacitors are given special focus. The section concludes with a comparison of storage
techniques, and a case for hybrid energy storage.
2.3.1 Batteries
Perhaps the oldest and most recognized method of storing electrical energy is the battery. Though other
technologies have emerged, batteries, especially secondary or rechargeable cells, are still one of the best
options available because of their energy density.
Many battery types are available with varying chemistries for each major category; the most common
varieties are lead acid (Pb), nickel cadmium (NiCad), nickel metal hydride (Nimh) and lithium ion (Li+)
(Buchmann 2003). The basic mode of operation is the same in each case, an anode and a cathode are
separated by an electrolyte, which may be a liquid as in Pb or NiCad, or a gel as in Nimh or Li+. When
discharging, positive ions migrate from the anode through the electrolyte to the cathode, and the reverse for
charging. Figure 2.B shows a basic schematic for a Li+ battery.

15
Battery capacity (C) is measured in amp-hours (Ah), and the total amount of energy stored in the
battery is roughly equal to the capacity multiplied by the average voltage during discharge:
(2-vii)
A battery's state of charge (SoC) is a measure of the energy available from the battery. Batteries are
typically designed to operate within a specific window of SoC, known as the SoC swing. The SoC with the
lowest remaining energy in the battery is known as the depth of discharge, or DoD.
Maximum current output from a battery scales linearly with capacity, and is therefore measured in
terms of capacity, using a parameter called [C]. A discharge rate of 1 [C] indicates the battery will be depleted
in one hour, while a rate of 2 [C] will drain the battery in half of an hour. Current is limited by the rates for
chemical reactions within the cell and by the generation of heat. It is common for batteries to have a
maximum continuous rate of discharge, with a larger peak output that may be sustained for a brief period.
Kokam Co. Ltd. supplies several types of Li+ batteries with a peak output of twice their continuous rate, and
can sustain this output for approximately 10 [s] (Kokam Co. Ltd. 2010).
Negative terminal
Cathode
Lithium ions in electrolyte
Solid electrolyte interface
Anode
Positive terminal
Figure 2.B - Li-ion battery schematic

16
Batteries have an internal resistance which accounts for some energy loss from the cell while
charging or discharging. Partly due to internal resistance, batteries have smaller apparent capacities when
discharging at high rates. This is known as the Peukert effect (Buchmann 2003).
Battery packs consist of multiple cells arranged in series and/or parallel. A set of batteries connected
in series is called a string, the length of which is the stack height. The product of the stack height and number
of strings gives the total number of cells in a battery pack. For instance, a battery pack with two sets of three
batteries connected in series has 2 strings, a stack height of 3 and six batteries in total.
Batteries have limited service life, the length of which depends on cell chemistry, DoD, SoC swing
and temperature, among other factors. With time and use, battery capacity attenuates and internal resistance
grows. For most batteries, this process is accelerated with higher temperatures during storage and use, deeper
discharge cycles, and high drain rates. Ideal usage conditions for a battery are moderate temperature, SoC
swing and DoD, low and stable current demand with few current reversals, or microcycles. These conditions
will extend the service life of the battery and yield better energy capacity per charge.
Each cell chemistry has unique characteristics that make it suitable or not for a given application. Pb
batteries are simple, cheap and robust. The electrolyte, water, is readily available and so the battery can be
conveniently 'topped up' if necessary. This makes them a favourite choice for use in the electrical systems of
combustion engines. Additionally, Pb batteries can be serviced by careful charging and addition of electrolyte
to restore some of their original capacity. Pb batteries are not ideal for electric vehicle applications because
they are large, heavy, and do not tolerate deep discharge well. While recyclable, they are not considered
environmentally ideal because of their lead content.
Like Pb, NiCad batteries are partially serviceable because their electrolyte, potassium hydroxide, is
liquid. NiCad batteries are more tolerant to deep discharging than Pb and offer greater energy density and
power density. When a current reversal occurs frequently at a similar level of discharge, a 'memory' effect
occurs that reduces the cell voltage at this level of discharge, and deep discharging is necessary to reverse the

17
effect. Cadmium is an environmentally adverse material to extract, process and dispose of, and thus NiCad
batteries are not regarded as environmentally benign.
Nimh batteries have increased energy and power density compared to NiCad's. The electrolyte is a
gel, which removes the possibility of servicing the battery to restore capacity. There is no memory effect, the
cells respond well to deep discharging and have good cycle life. The contents of Nimh cells are less adverse
than NiCad, and may be recycled into new batteries.
Li+ batteries come in many varieties and chemistries. Li+ cells may have a rigid cylindrical case, or
may be contained in a rectangular pouch, known as a lithium ion polymer battery. Li+ cells are very tolerant
of reverse currents, deep discharge and high drain rate. Compared to other cells, Li+ batteries maintain their
voltage throughout the discharge cycle very well. Owing to a relatively high cell voltage of 3.7 [V], Li+
batteries have the highest energy and power density of any safe chemistry operating at room-temperature, and
are therefore a foremost consideration for modern EV's. Li+ batteries do have the disadvantage of poor
performance at low temperatures (< about -20 [°C]) because their internal resistance increases. Table 2.2
compares several battery types (Masrur and Mi 2006), (Vetter, et al. 2005).

18
Table 2.2 - Battery cell comparison (Masrur and Mi 2006)
Battery Type Specific Energy [Wh/kg]
Peak Power [W/kg]
Energy Efficiency [%]
Cycle Life Self discharge [% per 48hr]
Cost [US$/kWhr]
Acidic aqueous solution
Lead/acid 35-50 150-400 >80 500-1000 0.6 120-150
Alkaline aqueous solution
Nickel/cadmium 50-60 80-150 75 800 1 250-350
Nickel/iron 50-60 80-150 75 1500-2000 3 200-400
Nickel/zinc 55-75 170-260 65 300 1.6 100-300
Nickel/metal Hydride 70-95 200-300 70 750-1200+ 6 200-350
Aluminum/air 200-300 160 <50 ? ? ?
Iron/air 80-120 90 60 500+ ? 50
Zinc/air 100-220 30-80 60 600+ ? 90-120
Flow
Zinc/bromine 70-85 90-110 65-70 500-2000 ? 200-250
Vanadium redox 20-30 110 75-85 - - 400-450
Molten salt
Sodium/sulfur 150-240 230 80 800+ 0* 250-450
Sodium/nickel chloride 90-120 130-160 80 1200+ 0* 230-345
Lithium/iron sulfide (FeS) 100-130 150-250 80 1000+ ? 110
Organic/Lithium
Lithium-ion 118-196 400-2600 >95 1000+ 0.7 700
Modelling batteries accurately is challenging, and a number of approaches exist (Chan and Sutanto
n.d.), (Baisden and Emadi 2004). Most methods are mathematical models that account for the SoC, terminal
voltages and demand current to predict battery response. ADVISOR, PSAT, and Simulink all employ some
mathematical model to represent battery behaviour. Gravimetric specific capacity and peak power of the cell
chemistries shown in Table 2.3 are arranged as a Ragone plot in Figure 2.C.

19
Figure 2.C - Cell chemistry specific energy vs. specific power, gravimetric
2.3.2 Ultra capacitors
Any two conducting materials separated by a dielectric gap have a capacitance, given by
(2-viii)
where C is the capacitance in Farads, εr is the relative static permittivity, A is the overlapping area of the
conductors and d is the gap between them (Conway 1999). The amount of energy stored in the capacitors is
proportional to the square of the voltage:
(2-ix)
Capacitors employ a dielectric layer between their plates to increase capacitance; this dielectric layer
has an electric field strength limit beyond which it will fail. The dielectric limit results in a maximum voltage
to which the capacitor may be charged.
10
100
1000
10000
1 10 100 1000
Sp
ecif
ic E
ne
rgy [
Wh
/kg
]
Specific Peak Power [W/kg]
Acidic Aqueous solution
Alkaline aqueous solution
Flow
Molten salt
Organic/Lithium

20
Not limited by chemical reactions or movement of ions, capacitors have extremely high power
delivery. However, they are very large and do not store much energy. An ultracapacitor stores more energy
than a conventional capacitor by using a substrate with two porous layers separated by an extremely thin layer
of insulation. By equation 2-viii, this very close separation substantially increases capacitance, and in turn
stored energy. The thin separation layer means that breakdown voltage is much reduced, and so the
maximum voltage across the plates is much less than conventional capacitors. Figure 2.D illustrates a
conventional capacitor and an ultracapacitor. Only ultracapacitors are considered for use in this work, and so
for brevity, the term 'capacitor' refers to ultracapacitors.
Power output from capacitors is bounded by thermal considerations. A small equivalent series
resistance (ESR) of the device results in heat generation that rises sharply with output current.
Ultracapacitors have several advantages for use in electric vehicles; they are very robust and tolerant
of both mechanical vibration and cold temperatures. Ultracapacitors may be charged and discharged more
than 500,000 times, and last longer than 10 years (NESSCAP Co., Ltd. 2008). While capable of very high
- +
Electrolyte
Porous electrode
Current collector + -
d
Capacitor Electric Double Layer Capacitor
Separator
Figure 2.D - Capacitor and ultracapacitor schematic

21
power delivery, ultracapacitors have very low energy density. This makes them suitable only for vehicles with
very short range.
Capacitors are very simple to model mathematically, with models available in ADVISOR, PSAT and
Simulink (Baisden and Emadi 2004), (Conway 1999), (Hoelscher, et al. 2006), (Jinrui and Qinglian n.d.).
Simple equations in terms of current, voltage and capacitance are sufficient to understand capacitive energy
storage.
2.3.3 Comparison of Storage Technologies
In this section, a wide range of energy storage methods are discussed and compared. Special attention is given
to batteries and capacitors in the context of an electrically powered vehicle. Table 2.3 gives a broad overview
of many different methods of energy storage (Masrur and Mi 2006), (Hilton 2010).
Table 2.3 - Comparison of storage and conversion technologies
Battery Type Gravimetric Specific Energy [Wh/kg]
Volumetric Specific Energy [Wh/m
3]
Energy Efficiency [%]
Cycle Life Self Discharge [%]
Hydrocarbon
Gasoline 12,890 9.5 × 10⁶ <30 - 0*
Hydrogen 39,720 Liquid: 2.8 × 10⁶
700 bar: 1.6 × 10⁶
Combustion: <25 Fuel cell: 50
- 0**
Natural Gas (250 bar)
14,890 10.1 × 10⁴
? - 0*
Kinetic
Flywheel 12-30 ? 80 - 100***
Electrostatic
Ultracapacitors 3-5.5 6.8 × 10³
>95 500,000 1
Electrochemical
Lead/acid 35-50 1 × 10⁵ >80 500-1000 0.6
Nickel/cadmium 50-60 3 × 10⁵
75 800 1
Nickel/metal Hydride
70-95 1.4 × 10⁵
70 750-1200+ 6
Lithium-ion 118-196 2-4 × 10⁵
>95 1000+ 0.7
*Leakage and/or vaporization is possible **Diffusion through pressure vessel walls is common ***Flywheel spin-down time is approximately 30 minutes
Portable energy storage and conversion for use in electric vehicle propulsion is ideally energy and
power dense, usable indefinitely, cheap and convenient to build and refuel or recharge, is energy efficient,

22
robust, and poses no safety or environmental hazard. No method presently known achieves all of these
objectives perfectly.
Gasoline and other hydrocarbons are among the most energy dense storage solutions, even though
the poor efficiency of combustion greatly reduces the amount of useful energy available from these sources.
Hydrocarbons are still the best option available for extended driving range. A gas tank is made inexpensively,
may be filled in minutes, used for a lifetime, and tolerant of adverse temperatures and mechanical vibration.
Power is limited only by the maximum rate of pumping gasoline to the engine. Hydrocarbons, especially
gasoline, are mostly manufactured fuels with extensive environmental and safety hazards associated with their
production and use. Gasoline, manufactured from crude oil, is expected to become scarce in the far term
(Styles 2010).
Hydrogen is an alternative hydrocarbon that may be used to generate electricity as in a fuel cell, but
may also be used in combustion. The efficiency of combustion is much less than that of electrical generation,
and has otherwise very similar characteristics to gasoline combustion. While the gravimetric energy density of
hydrogen is much higher than gasoline, it is somewhat impractical to store. Compressed hydrogen tanks are
much larger and heavier than gas tanks, and if liquefied hydrogen is used, diffusion through the vessel wall is
significant (Masrur and Mi 2006). In either case, the storage vessel may be refuelled quickly and conveniently
if appropriate facilities are available, but needs consideration of the risks of explosion. The power delivery of
hydrogen is limited in fuel cells by the size of the fuel cell stack; a stack large enough to meet peak vehicle
demands is large, heavy and costly. Fuel cells are very sensitive to temperature and mechanical vibration.
A flywheel is perhaps the most direct storage of energy, since no energy conversion takes place
between flywheel and transmission, storage and conversion are accordingly efficient. Very low energy density,
lack of any convenient way to recharge, and rapid rate of loss makes mechanical storage suitable only for
capturing regenerative braking energy.
Batteries and ultracapacitors are highly energy efficient, may be recharged with electricity generated
from any source, and are highly energy efficient. Safety considerations are present but less serious than those

23
of hydrocarbons. Batteries and ultracapacitors both suffer from limited power output and energy density.
While ultracapacitors can easily achieve the desired power output, they do not store enough energy for
propulsion of more than a few kilometres. Batteries suffer from a less severe deficit of both power density
and energy density. Both technologies make a compromise between power and energy. Figure 2.E shows a
Ragone plot of volumetric energy and power density for batteries and capacitors. On this power-energy
spectrum, capacitors lie at the far end of the power side and batteries cover a range of the energy side.
Presently no single electrical storage device exists between batteries and capacitors on the power-
energy spectrum. Among the range of batteries available, most electrified vehicles use those that are power
optimized in order to meet peak vehicle demands, sacrificing extra capacity that would have been available
from energy optimized batteries.
Figure 2.E - Energy density vs. power density, volumetric
100
1000
10000
100000
1 10 100 1000
Vo
lum
e S
pe
cif
ic P
ow
er
[W/L
]
Volume Specific Capacity [Wh/L]
Capacitors
Batteries

24
2.3.4 Hybrid Energy Storage
In section 2.3.3 it was shown that every storage technology, especially electric storage devices, have a unique
set of advantages and disadvantages. It can be advantageous to combine more than one electric storage
device, in order to realize the benefits of each. Specifically, a power optimized device can be paired with an
energy optimized device, such that energy capacity is increased while power delivery is sufficient to meet peak
demands. The concept is similar to using an accumulator in a hydraulic circuit to shave peak demands from
the pump. To reduce the size of its fuel cell, the Honda FCX Clarity employs a bank of ultracapacitors to
handle peak demand, while continuous running demands are supplied by the fuel cell stack (Honda Motor
Co., Ltd. 2010).
Hybrid storage systems using batteries and capacitors are among the most commonly studied, and it
has been shown that these can be more versatile, increase component service lives and efficiency while
reducing cost and mass relative to storage systems using only batteries or only ultracapacitors (Hoelscher, et
al. 2006).
By adding a bank of ultracapacitors to a pack of batteries, the battery pack may be selected for energy
density, rather than power delivery, and so energy capacity increases. Since capacitors are well suited to
frequent current reversals, they may be used to absorb regenerative braking energy. This effect combined
with peak shaving mean that the battery load becomes more stable and reverse currents can be eliminated,
which is expected to result in longer battery service life and increased effective capacity.
Since the energy and power devices will have different voltage levels, DC-DC conversion
requirements change (Lachichi and Schofield 2006), (Lukic, et al. 2006), (Yalamanchili and Ferdowsi 2006),
(Hoelscher, et al. 2006). Specifically, each device must each have a unique link to the vehicle power bus.
Simply connecting batteries and capacitors together in parallel would result in the battery supplying most of
the load, since capacitor voltage is linear with SoC. Each device may have its own DC-DC converter, with the
converters connected either in parallel or in series. Alternatively, a single, dual-input DC-DC converter may

25
be used to draw from sources simultaneously. Figure 2.F shows four methods of coupling batteries and
ultracapacitors.
It is shown by Lukic, et al (Lukic, et al. 2006) that the ideal way to couple two sources of different
voltage is a dual-input DC-DC converter, of which various topologies exist.
2.3.5 Hybrid Control and Power Management
A unique requirement of an energy storage system using multiple sources is the need for a control scheme to
allocate demand across the sources. Power requirements vary widely throughout a drive schedule, with peak
demands during acceleration of more than three times the average power output of the whole drive cycle
(Rossario, et al. 2006). A hybrid energy storage system meets average propulsion demands with a high
Direct parallel connection
Double converters in parallel
Double converters in series
Dual input converter
Figure 2.F - Battery-capacitor coupling options
Load
Lo
ad
DC/DC
DC/DC
DC/DC DC/DC
Lo
ad
DC/DC
Lo
ad

26
capacity energy system, and peak vehicle demands with a high power system. A control scheme, or energy
management system (EMS) should then allocate average running demand to the energy system and peak
demands to the power system.
There are many strategies for the design of an EMS. Most approaches consider inputs such as the
demand current, SoC of the battery, maximum output of the battery, vehicle speed and acceleration, etc. A
simple rule based system will use these inputs to allocate power with logic statements such as (Jalil, Kheir and
Salman 1997)
"If demand current > maximum battery current, then battery power = battery maximum and capacitor power = demand -
battery maximum"
A rule based system is simple and easy to implement, but can result in discontinuities when inputs
cross boundary values. Fuzzy logic control offers a similar, but more stable approach (Kisacikoglu, Uzunoglu
and Alam 2006). A fuzzy based system sorts input values into overlapping categories with membership
functions. By example, vehicle speed may lie on a range of slow to fast, but a value in between slow and fast
may have a membership value of 30% fast, 70% slow. A fuzzy rule base evaluates logical statements based on
the inputs in a similar fashion to a simple rule base. Output of the rule base lies on a similar sliding scale to
the inputs, returning one or more results. When multiple results are returned, an amalgamation is made to
deliver the final result. The method can be thought of as a way to generate a smoothly transitioned piece-wise
output function of the input parameters. The output function is tolerant of error or rapid change of inputs.
Fuzzy logic controllers are very well suited to EMS, but require much trial and error to implement well.
2.4 Powertrain Evaluation
Designing and developing a vehicle powertrain or part thereof, whether propulsion is electric or combustive,
presents a sizeable gamut of problems and considerations. As with any design discipline, the process is
iterative and very reliant on the ability to test and evaluate designs to address problems and make incremental
improvements.

27
Prototyping and physical testing is the most positive way to assess a design, but is also the most
costly and time consuming. Given the many revisions often necessary to develop a powertrain or a
component of it, prototyping and physical testing is typically restricted to design milestones very late in the
design process.
Computer modelling and simulation is a much faster, more flexible and less expensive approach to
understanding a propulsion system. Experienced designers can create models in a matter of days, changes can
be made easily, and simulation can be performed rapidly and autonomously. Models can be made with a
degree of complexity to suit the purpose. For instance a highly detailed model of an engine can be simulated
to comprehensively understand its operation, or it can be represented with a very simple model if its
behaviour within a wider system is desired. The speed, cost, ease and accuracy of simulation account for its
major adoption in the practice of powertrain and propulsion development.
The intersection of prototyping/testing and modelling/simulation is known as hardware in the loop
(HIL) (Winkler and Guhmann n.d.). HIL uses a combination of computer models and physical hardware to
perform tests. For instance, a HIL test in the development of a hybrid power train may include a physical
engine and computer models of the electric motor, energy storage and power electronics. The engine would
have computerized inputs and be attached to a dynamometer to feed back information to the simulation. This
arrangement could be used to assess the interaction of the engine and motor to propel a vehicle in order to
optimize the controller allocating torque between the two. Like prototyping, HIL testing is highly expensive
and time consuming to perform.
Fortunately, many options are available for modelling and simulation. PSAT, ADVISOR and
Simulink are all popular choices. ADVISOR, a program based on the Simulink platform, offers a number of
common devices and powertrain configurations modelled using operating efficiency tables. The lack of any
physics based simulation means ADVISOR is very rapid, and the accuracy of the results is sufficient in most
cases (Hoffman, Steinbuch and Druten 2006).

28
The platform for ADVISOR, Simulink, contains a library of electromechanical devices and power
electronics that can be used to model a powertrain (Lin, et al. 2001). The devices are modelled from physical
processes, which means simulation can take a long time, particularly for switched power electronics which
have frequent state changes requiring iteration. Power electronics specific applications are available to
simulate switched systems much faster, some of which can interface with Simulink (POWERSIM n.d.).
When simulating a powertrain in ADVISOR, a backwards-facing approach is taken. This means the
vehicle speed follows the input drive cycle exactly, and it is assumed a-priori that the vehicle is able to follow
the drive cycle. Check values must be examined post-simulation to confirm that traction, torque, and other
vehicle limits were not violated in the simulation. Energy usage and other measurements are made of the
powertrain in the course of keeping pace with the drive cycle.
Absent from the backwards-facing approach is any consideration of the throttle or brake pedals.
PSAT, developed by Argonne National Laboratory, takes a forward-facing approach, whereby a driver
module attempts to follow the drive cycle as closely as possible using a simulated throttle and brake. In a
forward-facing simulation, the test vehicle will not follow the input drive cycle unless the powertrain is
capable of doing so. Forward facing simulation is regarded as more accurate than backward facing, though
simulation times are longer (Xiaomin, et al. 2009). Backward or forward facing simulation is possible in
Simulink, depending on how the model is designed.
In this chapter, several technologies for storing energy in vehicles were described. Similar discussion
was given to converting energy in electric vehicles. The chapter concluded with a comparison of different
means of evaluating a given powertrain for performance and energy efficiency. The intention of this study is
to determine whether hybrid energy storage is an viable approach to balancing the energy capacity of the
storage system with its power delivery, and if such a storage system might extend have an extended service
life compared to a battery only system.

29
3.0 Vehicle Configuration and Simulation
In this section, the design strategy for the hybrid energy storage systems is presented. The complete approach
to modelling and simulating the modified Pacifica is explained, as well the topology and components of the
drive train are specified. To begin with, the propulsion requirements of the Pacifica are estimated.
3.1 Vehicle Configuration
To fully examine all of the potential advances that are possible with electrification, it is pertinent that the
Pacifica be capable of all-electric operation, up to and including highway travel. Ideally, the vehicle will have
as much all-electric range as possible. For simplification, this study will not consider use of the combustion
engine. The vehicle is treated as having strictly electric propulsion, and so the electric propulsion system must
be capable of meeting the full running requirements as estimated by equation 2-i. Power requirements are
twofold; the powertrain and energy storage system must be able to; (1) continuously supply enough power to
operate the vehicle at highway speeds, taken here as 120 [km/h], and (2) sustain power peaks encountered
under acceleration to highway speed.
Requirement (1) is determined by the sum of rolling resistance and aerodynamic drag at highway
speed. Requirement (2) is estimated simply as the constant power required to accelerate from 0 to 97 [km/h]
(60 [mph]) in a period of 10 [s]. For reference, the stock vehicle's 0-60 [mph] time is approximately 9.3 [s].
The coefficient of rolling resistance is estimated at Cr = 0.01 (Masrur and Mi 2006) and the vehicle
curb weight of 2121 [kg] (Allpar 2010), is expected to increase to approximately 2500 [kg] after modification.
Exact vehicle weight depends on the storage system used. The Pacifica has an aerodynamic drag coefficient
of Cd = 0.35 and frontal area A = 2.82 [m2] (New-cars.com 2004). In accordance with equations 2-i through
2-vi, the continuous power requirement for travel at highway speed is 30 [kW], and the peak power is 90
[kW], or 41 [hp] and 121 [hp] respectively.
Neglecting losses, the powertrain and energy storage system of the Pacifica must be able to supply at
least 30 [kW] continuously and up to 90 [kW] for periods of up to 10 [s]. Of equal design importance to

30
power is the amount of current required to supply the power. Determining operating current requires
selection of a bus voltage with which to supply the inverter and motor, as well as a nominal supply voltage
with which to store energy.
For reference, the General Motors EV1 had a supply voltage and bus voltage of 312 [V] (General
Motors 2001). Using equal supply and bus voltages reduces DC-DC conversion requirements, and higher
voltages generally translate to lower operating current and resistive losses. For the purposes of this study, the
modified Pacifica will use a supply and bus voltage of 320 [V]. Given that current is proportional to power
and the inverse of voltage, the current required to supply 198 [kW] at 320 [V] is 619 [A].
3.1.1 Powertrain
For this study, the drive train topology proposed by Samborsky will be adopted (Samborsky 2006). In this
configuration, motor/generators (MGs) are connected to the differentials of both front and rear axles with
single speed gear reductions and the internal combustion engine (ICE) drives the front axle using the existing
four-speed automatic transmission. A hybrid electric energy storage system is used to power the electric
propulsion system, which may use batteries and capacitors or two types of batteries. Figure 3.A shows an
overview of the powertrain using batteries and ultracapacitors.

31
The same three-phase AC induction motor and corresponding switched inverter is to be used at each
axle. Allocating electric drive at each axle allows for dynamic handling effects to be studied and for maximum
energy recovery from regenerative braking. With a view to maximize efficiency, only one of the two motors
will operate at a time, unless torque demand requires both to be used (Mendes 2006). Furthermore, the single
speed gear reduction for each MG was selected such that the MGs would operate at the highest rotor speeds
without exceeding maximum rotor speed at highway velocity. Assuming a maximum rotor speed of 5500
DC/DC
Lithium ion battery pack
Power controller (EMS)
Ultracapacitors
Rear transaxle
ICE
Front transaxle
Inverter
Motor
Single speed gear reduction
4 speed
automatic transmission
Motor
Inverter
Figure 3.A - Powertrain overview

32
[rpm], the single speed gear boxes are set to give a final drive ratio of 6:1. This results in rotor speeds of 5335
[rpm] when travelling at 120 [km/h].
The DC-DC converter is a bidirectional, integrated buck-boost, buck-boost converter of similar
topology to that discussed by Lachichi and Schofield (Lachichi and Schofield 2006). A design for the inductor
used in the converter was prepared by the Author, and is detailed in Appendix B. The inductor uses four
separate gapped cores in parallel, with a total inductance of 25 [µH]. Design of the inductor follows the core
geometry approach developed by McLyman (McLyman 2004). Power allocation is applied through the DC-
DC converter by a controller programmed with the appropriate EMS. Design of the EMS is discussed in
section 3.1.2, Hybrid Energy Storage Design Strategy.
3.1.2 Hybrid Energy Storage Design Strategy
A successful hybrid energy storage system (HESS) must achieve some combination of (1) increased vehicle
performance by supplying more power, (2) extended storage system service life, (3) improved cold weather
performance, or (4) reduced storage system volume or weight. Furthermore, a successful HESS will not
unduly compromise any other aspect of the storage system.
Two options for a power device are considered here: ultra high power Li+ batteries and
ultracapacitors. High capacity Li+ batteries are used as the energy system in either case. Ultra high power
batteries give high power capability in a much smaller package, leaving room for extra energy batteries, but a
reduced total power output. Detailed parameters of the ultracapacitors and all battery models used in this
study are given in Appendix C.
Limited space is available in the vehicle for energy storage. This space must be appropriately shared
among the energy and power systems. A larger energy system increases the total energy capacity and range of
the system, and nominal load is spread among more energy cells, reducing energy system stress. A larger
power system increases the maximum power available and the duration of peak output of the system, while
reducing stress by spreading load across more power components. In section 3.1, Vehicle Configuration, it

33
was shown that peak output should be able to sustain acceleration of the vehicle to highway speed, requiring
90 [kW]. Exceeding this power requirement is of limited benefit; thus the power system should be only large
enough to meet it, leaving the maximum amount of room available for the energy system, and by extension,
vehicle range.
Design of the hybrid storage system for the Pacifica follows a strategy based on vehicle kinetic
energy. The largest total amount of kinetic energy to be supplied during a given high power peak is
comparable to the kinetic energy of the vehicle at its maximum expected speed, a highway velocity of 120
[km/h]. This suggests that the power system should have a useable capacity that is at least large enough to
accommodate this amount of energy, plus a safety factor to accommodate for conversion efficiency. For the
assumed vehicle mass of 2500 [kg] travelling at 120 [km/h], the vehicle's kinetic energy is 1.4 [MJ], or 389
[Wh].
Two power systems were designed: one using ultracapacitors and one using ultra high power
batteries. Details of each are given in Table 3.1 (Kokam Co. Ltd. 2010), (NESSCAP Co., Ltd. 2008).

34
Table 3.1 - Power system properties
Ultracapacitor Ultra high power batteries
Cell properties
Maximum voltage [V] 2.7 4.2
Minimum voltage [V] 0.5 3.5
Capacitance [F] 5000 -
Total energy capacity [Wh] 5.1 27
SoC swing (Max/Min) 100/3.33 70/40
Useable energy capacity [Wh]
4.9 8
Nominal discharge current [A]
Not specified 36
Maximum discharge current [A]
2547 144
Duration of maximum discharge [s]
1 10
Maximum power output [kW] 6.9 0.6
Internal resistance [mΩ] < 0.33 0.3 (estimate)
Pack properties
Stack height 120 84
Strings 1 1
Total cells 120 84
Maximum voltage [V] 324 353
Minimum voltage [V] 60 294
Capacitance [F] 42 -
Total energy capacity [Wh] 608 2240
Useable energy capacity [Wh]
587 672
Nominal discharge current [A]
Not specified 36
Maximum discharge current [A]
2547 144
Duration of maximum discharge [s]
1 10
Maximum power output [kW] 825 51
Internal resistance [mΩ] 40 25.2
Both systems are designed to have operating voltages of approximately 320 [V], and a capacity of at
least 150 [%] of the vehicle’s maximum kinetic energy. A safety factor of 1.5 accommodates for energy losses
in the drive train. The capacitor system is designed not to discharge below 60 [V], and not to exceed its
maximum potential of 324 [V]. To reduce the fatigue of severe demand fluctuation and current reversals, the
battery system is designed to operate within a relatively narrow SoC swing of 40-70 [%]. This SoC restricted
swing is common for batteries in gas-electric hybrid vehicles to prolong battery service life (Santini 2009).
The EMS controlling the hybrid energy storage system must also reflect the kinetic energy strategy.
Observe that if the vehicle is at rest, it is next likely to accelerate and will require energy from the high power
system to do so. Similarly, if the vehicle is travelling close to its maximum velocity, the most likely event is a

35
deceleration, requiring the power system to absorb energy from regenerative braking. This suggests that the
energy stored within the power system should be related to the speed of the vehicle, being fully charged when
the vehicle is at rest, and relatively drained when the vehicle is at high speed.
A kinetic energy based EMS can be implemented by creating a reference function of power system
SoC to vehicle speed, and adjusting power system output to match the reference function. This causes power
system output to scale positively with acceleration, becoming negative under regenerative braking. Cruising
requirements during constant velocity are supplied by the energy system.
Note that only a cursive attempt is made at optimizing the parameters of the storage system. Full
optimization would include a comprehensive study of the effects of different energy and power system stack
heights and string numbers and bus voltage. Due to the large design space, genetic algorithms present an ideal
way of determining the best makeup of the hybrid energy storage systems (Huang, Wang and Xu 2006),
(Montazeri-Gh, Poursamad and Ghalichi 2006), (Wang 2005).
3.2 Simulation Structure
To assess hybrid energy storage systems, a powertrain model was developed to simulate and evaluate system
performance under a variety of conditions. This section explains how the powertrain was modeled.
3.2.1 Overview
Because of its simplicity and availability, computer modelling and simulation was the chosen method of
evaluating the performance of a powertrain using hybrid energy storage systems. Among the prevalent
options to do so, PSAT, ADVISOR and Simulink for MatLab, Simulink is the most versatile and this made it
the simulation tool of choice for this investigation.
The model of the electric powertrain for the modified Chrysler Pacifica uses a combination of
efficiency tables and empirical relationships to represent its individual components. The components are
organized into subsystems that connect together and operate dependently. The subsystems are, in order of

36
calculation: (1) drive cycle motion, (2) drag force, (3) power and acceleration requirements, (4) motor and
transmission simulation, (5) inverter simulation, (6) DC-DC converter simulation, (7) energy management
system calculation, and (8) hybrid energy storage system simulation. These subsystems are illustrated in Figure
3.B. The complete system, except for drive cycle input and EMS calculation, can be seen in Figure 3.C, which
shows an overview of the powertrain model developed in Simulink.
DC/DC
Energy system (Li+
battery pack)
EMS
Power system (Ultracapacitors
or high power Li+ battery)
Front transaxle
Inverter Motor &
transmission
Single speed gear reduction
Drive cycle
motion
1
Drag force Power and
acceleration requirement
2 3 4
5
6
7
8
Figure 3.B - Powertrain calculation procedure

37
3.2.2 Inputs
The model leverages three inputs: vehicle properties, natural properties and a drive cycle. The natural
properties module contains constants for the density of air and acceleration due to gravity. These constants
are used as appropriate throughout the model. Similarly, a vehicle properties module contains a collection of
parameters necessary to model the vehicle and its powertrain. The complete list of parameters included in the
vehicle module and their units follows:
Vehicle mass (dependent on number and mass of components of storage system) [kg]
Coefficient of drag
Frontal area [m2]
Coefficient of rolling resistance
Wheel radius [m]
Figure 3.C - System overview

38
Transmission ratio
Motor ratio
Number of energy strings
Energy string stack height
Energy cell capacity [Ah]
Energy cell mass [kg]
Number of power strings
Power string stack height
Power cell capacity [Ah] for batteries or [F] for capacitors
Power cell mass [kg]
Vehicle weight distribution (front/rear)
Accessory load [W]
Data for all five of the drive cycles used in this investigation are available from the United States
Environmental Protection Agency website (United States Environmental Protection Agency 2008), and
consist of velocity measurements at one second intervals. These velocity data, part (1) in Figure 3.B, were
used to determine distance travelled and acceleration within a spreadsheet. Velocity and acceleration were
then imported into separate lookup tables within Simulink. Given an input signal corresponding to simulation
time, these lookup tables return the instantaneous velocity and acceleration of the vehicle respectively. A time
repeater, based on the duration of the drive cycle, is used to cause the lookup tables to return a repeating
signal, useful if an extended simulation of more than one cycle is required. A sample drive cycle input
subsystem is shown in Figure 3.D.
Figure 3.D - Drive cycle input

39
3.2.3 Vehicle Drag Force
Given vehicle speed, drag force may be determined; part (2) in Figure 3.B. Rolling resistance and aerodynamic
drag are determined as per equations 2-iv and 2-v respectively. Drag force is returned as shown in Figure 3.E.
3.2.4 Running power
Given drag force and vehicle speed, cruising power may be found - part (3) in Figure 3.B. Given acceleration,
the total mechanical power required is obtained. As per equations 2-i and 2-ii, total power is calculated as
shown in Figure 3.F. As a consistency check, the available traction and associated maximum possible
acceleration are calculated. Actual acceleration is subtracted from available traction to return the margin of
traction. This value must be positive at all times to confirm that the vehicle's front wheels have not lost
traction. A running minimum block returns the lowest margin of traction throughout the drive cycle.
Figure 3.E - Drag force schematic

40
3.2.5 Motor
While the Pacifica is to use separate motors at the front and rear axles, the overflow torque split method
proposed by Mendes (Mendes 2006) mandates that only a single motor should be used to provide all torque
requirements unless demand cannot be met be a single motor. With allowances for periodic overloading, this
leads to an important simplification for this powertrain model: both motors are modelled together as a single
machine. A three phase asynchronous induction motor model was modelled in Simulink, with shaft speeds
determined from wheel size and transmission ratios. This is part (4) in Figure 3.B. Measurements of efficiency
were made at a range of shaft speeds and demand torque. These measurements were then consolidated to
produce a lookup table of motor efficiency vs. shaft speed and torque to represent the energy characteristics
of the motor. Though the expected trend of low efficiency was apparent at low shaft speed and low torque,
the maximum efficiency of the motor was unrealistically high, with an efficiency of near unity. To compensate
for this, a gain of 0.93 was applied to the output of the efficiency table. This brings the maximum efficiency
of the simulated motor into better agreement with real motors (Cassio and Pontes n.d.).
Figure 3.F - Running power schematic

41
Vehicle speed, wheel radius and transmission ratio may be used to find the instantaneous speed of
the rotor. Wheel radius, transmission ratio and the total mechanical power requirement determine the torque
demanded of the motor. Motor torque and shaft speed are then used as inputs to the motor efficiency lookup
table, which returns the fraction of energy used by the motor that is converted to mechanical power. This
fraction is used to determine the input electrical power required to produce the desired mechanical output
power.
The difference in speed of the motor and its input electrical frequency is known as the motor ratio.
The product of motor shaft speed and motor ratio give the necessary electrical input frequency, which is
output from the motor subsystem for use in the inverter subsystem.
Minimum/maximum checks are performed for motor efficiency, shaft speed and torque demand.
These are used to identify invalid simulation output. Figure 3.G shows the motor subsystem.

42
3.2.6 Inverter
The inverter module uses empirical relations to estimate energy losses in the inverter, part (5) in Figure 3.B.
The six power-electric switches that chop input DC to produce three phase AC will lose some power to
parasitic resistance and their snubber circuits with every on-off cycle. Information pertaining to these losses
was obtained from the datasheet of an appropriate model switch (Powerex 2009), including parasitic on-state
resistance and switching energy loss as a function of off-state voltage difference and on-state current.
Switching frequency is the product of the desired motor input frequency and carrier wave frequency.
The sum of the switch losses for every switch cycle multiplied by switching frequency gives the total loss
power of the inverter, as shown in Figure 3.H.
Figure 3.G - Motor schematic

43
Running maximum checks are performed for the electrical power supplied by the inverter and the
current through it. These values assist with appropriate selection of inverter components.
3.2.7 DC Converter
Figure 3.I shows an overview of the DC-DC converter subsystem, which may be explained in three parts:
boost ratio calculation, energy management system, and losses. Boost ratios and losses form part (6) in Figure
3.B while EMS is part (7). Boost ratios are simply the ratios of the desired system bus voltage to the source
voltages. The ratio of voltages indicates the ratio of demand current and current delivered from each source.
As the voltage of a source decreases, the current required to maintain equivalent power increases.
The energy management system is responsible for allocating current demand across the two input
sources; it is modelled as a subsystem of the DC-DC converter and shown in Figure 3.J.
Figure 3.H - Inverter schematic

44
Figure I - DC-DC converter schematic

45
Present vehicle speed and acceleration are used to estimate the vehicle speed one second into the
simulation time. This speed is used as input to a lookup table that returns the desired state of charge of the
power storage system, also one second from simulation time. The difference between this future desired SoC
of the power system and its actual present value are compared, and the power output from or to the power
system required to reduce this difference to zero is found. The power system outputs either this power
(scaled by 0.33 to avoid overshoot and power system instability,) or the full demand power, whichever is less,
subject to current delivery limitations. The difference between actual vehicle demand and the output of the
power system is applied to the energy storage system. The scheme can mean that the energy system must
supply more power than the vehicle demand, to charge the power system and bring it to the desired SoC for
the present vehicle speed.
Estimating the DC-DC converter energy losses requires detailed knowledge of its power inductor.
While inductors are available in a variety of off-the-shelf formats, it is uncommon to find components that
are well suited to specific high voltage, high power applications. To accurately model the operation of the
Figure 3.J - Energy management system schematic

46
DC-DC converter, an inductor was designed specifically for the purposes of the Pacifica's hybrid storage
system conversion requirements.
The inductor was designed following the procedure presented by (McLyman 2004) for a gapped
inductor using the core geometry approach. The final design uses four standard 180UI format inductor cores
in parallel with a total inductance of 25 [µH]. Four cores are necessary to handle the current requirement,
which is estimated to reach 1412 [A]. The core is designed to operate at a ripple frequency of up to 200
[kHz]. Complete design details of the inductor are presented in Appendix B.
Three types of energy loss in the DC-DC converter are dominant: (1) switching losses, similar to
those in the inverter, (2) "copper loss" resulting from resistance in the windings of the inductor, and (3) "iron
loss" in the inductor core due to magnetic hysteresis. All three are estimated empirically, within a subsystem
of the DC-DC converter. This subsystem is shown in Figure 3.K.
Switching losses are determined in the same manner, and using the same model switch as for the
inverter. Switching frequency is 60 [kHz], with one switch for each source. Current through each switch
varies with power demand and off-state voltage varies with the voltage of its respective source. Copper losses
Figure 3.K - DC-DC converter loss schematic

47
are determined from the total amount of current flowing through the inductor coils and the coil resistance.
Iron losses are proportional to the amplitude of the ripple current in the coils, which is a fraction of the total
current. Total current, IT in the coils is the sum of the currents from each source, IS1 and IS2, and the current
delivered to the load, IL.
(0-x)
Notice that the total current carried by the coils is double the current flowing through the device; this is a
result of the switched nature of the DC-DC converter. As the voltage of either source decreases, more
current must flow from that source to produce equivalent power. Thus, ripple current and iron loss vary with
the SoC's of both sources.
Total energy losses are divided among the two input sources in a ratio equal to their instantaneous
ratio of power delivery. The loss is expressed as a current at the system bus voltage, and fractions of this
current are then scaled and added to each source current.
3.2.8 HESS
Both energy sources are represented within the HESS subsystem, using models under the SimPowerSystems
blockset (The MathWorks, Inc. n.d.). These are part (8) in Figure 3.B. Models of lithium ion batteries and/or
capacitors were used to represent the energy and power systems. To simulate demand, controlled current
sources were used with inputs derived from the DC-DC converter subsystem. Rather than modelling
complete banks of batteries or ultracapacitors, single cell models were used for both the power system and
the energy system. Demand current of each cell was divided by the number of strings in its respective storage
system, and output voltage multiplied by the stack height. The HESS subsystem is shown in Figure 3.L.

48
The SimPowerSystems lithium ion battery model can be customized to match desired cell
performance using a number of parameters. These parameters were adjusted to match the discharge profiles
given in (Kokam Co. Ltd. 2010). A comparison of the modelled and actual discharge profiles is presented in
Appendix C. A simple capacitor-resistor model is used to model an ultracapacitor with equivalent series
resistance. In both cases, resistive energy losses by the storage system are calculated.
HESS calculation is dependent upon output from the DC-DC subsystem, which in turn requires
feedback (voltage measurement) from the HESS subsystem. This establishes an algebraic loop that prevents
Simulink from converging to a solution. The algebraic loop was resolved by adding a time delay of 0.5 [s] to
the voltage measurements within the HESS subsystem. The time delay means that voltage can be explicitly
Figure 3.L - HESS calculations

49
determined from its previous value instead of being implicitly dependent on its present value. The time delay
was adjusted to the smallest value possible that did not result in anomalous voltage measurements.
3.3 Validation
To validate results obtained from the model powertrain, the model's parameters were adapted to suit those of
a 1997 Chevrolet S10 Electric. The S10 Electric uses a single string of 26 lead acid batteries with a total bank
voltage of 312 [V] (EV America, United States Dept. of Energy 1997). The S10 has a rated energy efficiency
of 292 [Wh/mile] during the SAE J1634 drive, which equates to 181 [Wh/km]. The SAE J163 drive cycle
consists of UDDS followed by HWYCOL.
A simulation of the vehicle in PSAT by Qin for the UDDS drive cycle results in energy usage of 182
[Wh/km] in the same drive cycle (Qin, Ms. 2009). Results from the model presented here indicate energy
usage of 179 [Wh/km]. The results are in good agreement, with a difference of only 1.1% between the rated
efficiency and the results of this powertrain model.
50
4.0 Results In this section, observations from the study are presented and implications are discussed. Limitations of the
modelling/simulation process are also summarized.
4.1 Scenarios
With a view to understand the trends and relations among hybrid storage system size and usage style, several
scenarios have been tested. The scenarios include varying type of drive cycle, energy storage system, and
storage system size. Details of these three dimensions are discussed in this section.
In each scenario, the energy use of the vehicle was measured and the range of the vehicle was
predicted. Statistics relating to the energy system demand variation are recorded as a proxy metric for service
life. These include the mean, standard deviation, minimum and maximum of current demand per battery cell
in the energy system.
4.1.1 Energy Storage Systems
Design of the storage systems follows a kinetic energy based strategy described in section 3.1.2 - Hybrid
Energy Storage Design Strategy. This section specifies two power systems based on ultracapacitor and ultra
high power batteries. Three categories of storage system have been investigated here; (1) an energy dense
battery system coupled with a capacitor power system, (2) an energy dense battery system coupled with an
ultra high power battery system , and (3) a traditional, battery-only system as a control. Three sizes for each
system have been specified: small (approximately 0.13 [m3]), medium (approximately 0.22 [m3]) and large
(approximately 0.3 [m3]). The Pacifica's fuel tank capacity is much smaller, about 87 [L], or 0.087 [m3] (Allpar
2010). The only difference among the system sizes is the number of strings of batteries in the energy system.
Detailed parameters of all battery models used in this study are given in Appendix D.
To provide a basis for comparison, the volume of all components in the storage system was kept as
equal approximately among different storage systems in each size category. Details of the battery packs are
summarized in Table 4.1. Note that a battery-capacitor system in the small size did not satisfy the

51
requirements for continuous running power: with the constant volume constraint, there would be too few
energy batteries in the system to sustain highway cruising. This system was not tested.
Table 4.1 - Energy storage systems under consideration for Pacifica conversion
Cell type Strings Stack height
Stack voltage [V]
Bank capacity [kWh]
Bank mass [kg]
Battery only
Large High power battery
7 84 354 69.6 647
Medium High power battery
5 84 354 49.7 462
Small High power battery
3 84 354 29.8 277
Battery-Capacitor
Large High capacity battery
35 84 354 69.6 441
ultracapacitor 1 120 324 0.61 112
Medium High capacity battery
21 84 354 41.8 265
Ultracapacitor 1 120 324 0.61 112
Small High capacity battery
7 84 354 13.9 88
Ultracapacitor 1 120 324 0.61 112
Battery-Battery
Large High capacity battery
42 84 354 93.5 592
Ultra high power battery
1 84 354 0.67 19
Medium High capacity battery
33 84 354 65.6 416
Ultra high power battery
1 84 354 0.67 19
Small High capacity battery
21 84 354 41.8 265
Ultra high power battery
1 84 354 0.67 19
4.1.2 Drive Schedules
Five drive cycles were introduced in section 2.0 - Vehicle Power Requirements. These five cycles, UDDS,
LA92, US06, HWYCOL and NYCCCOL, include examples of travel in highway conditions, dense city traffic,
and mild, moderate and aggressive urban use. Together they cover a wide gamut of typical conditions and so
these five are used as separate cases in this study. Considering a range of driving conditions helps to highlight
the performance of energy storage systems in different contexts.

52
4.1.3 Simulation Matrix
The range of storage systems tested and the drive cycles with which they are tested represent the simulation
matrix. This is summarized in Table 4.2 with code names for each scenario.
Table 4.2 - Simulation matrix
UDDS LA92 US06 HWYCOL NYCCCOL
Battery only
Large B.L-1 B.L-2 B.L-3 B.L-4 B.L-5
Medium B.M-1 B.M-2 B.M-3 B.M-4 B.M-5
Small B.S-1 B.S-2 B.S-3 B.S-4 B.S-5
Battery-Capacitor
Large BC.L-1 BC.L-2 BC.L-3 BC.L-4 BC.L-5
Medium BC.M-1 BC.M-2 BC.M-3 BC.M-4 BC.M-5
Small Not tested Not tested Not tested Not tested Not tested
Battery-Battery
Large BB.L-1 BB.L-2 BB.L-3 BB.L-4 BB.L-5
Medium BB.M-1 BB.M-2 BB.M-3 BB.M-4 BB.M-5
Small BB.S-1 BB.S-2 BB.S-3 BB.S-4 BB.S-5
4.2 Results
In this section, findings are presented and discussed.
4.2.1 Range and Energy Efficiency Estimation
For each scenario, a model Chrysler Pacifica was simulated undergoing a drive cycle twice; once with the
energy storage batteries at 100% charge, and once with the energy storage batteries at 30% charge. Each
measurement for each scenario is the average of values taken from the 100% and 30% charge simulations.
Averaging measurements between 100% and 30% accounts for differences in storage level voltage which
increases conversion requirements and ohmic losses.
Each storage system within the three size levels have roughly equal volume, but different mass. It is
appropriate to consider the driving range of a storage system against its mass. Figure 4.A shows the storage
system mass and vehicle range achieved by each storage system. Points on this graph indicate the expected
driving range assuming an equal proportion of driving in each of the five drive cycles. The vertical bars
indicate the minimum and maximum expected range for each storage system.

53
Figure 4.A - Range vs. storage system mass
Compared to the control scenario of simple power batteries, hybrid storage introduces four
competing effects with respect to vehicle range: (1) increased energy density in the type of storage batteries
used, leading to increased range, (2) more uniform current demand from the batteries, leading to increased
range, (3) reduced volume available for energy batteries, leading to reduced range, and (4) differences in
energy usage throughout the powertrain, with unpredictable results. Differences in energy usage arise in the
form of losses within the storage system itself, voltage conversion losses, and changes to vehicle running
requirements due to storage system mass. The data indicate that hybrid storage systems are lighter than
battery-only systems at all size levels, and this is favourable in and of itself.
While battery-battery systems have greater vehicle range than the control, battery-capacitor systems
have less. Given that both the large battery-capacitor and battery-only systems store equal amounts of energy
(69.6 [kWh] each), the difference in range at this size must be due to increased losses within the storage
system and the DC-DC converter. At the medium size, the battery-capacitor system has less energy capacity
0
50
100
150
200
250
300
350
400
450
200 250 300 350 400 450 500 550 600 650 700
Veh
icle
ran
ge
[km
]
Total storage system mass [kg]
Batt. Only
Batt. Cap.
Batt. Batt.

54
than the control system (41.8 vs. 49.7 [kWh] respectively), meaning the dominant effect is that of reduced
volume available for energy storage batteries. Indeed, the range penalty for the medium size battery-capacitor
system is much larger than at the large size; a difference of 42 vs. 5 [km] respectively.
The power system within battery-battery systems occupies a much smaller volume of the total
storage system than that of battery-capacitor systems. The result is increased energy capacity compared to the
control at all sizes, with the gap increasing for larger system sizes. This, and the lighter weight of battery-
battery compared to the control systems, explains the advantage in range they have over battery only systems.
Figure 4.B shows the same data as Figure 4.A, arranged here with respect to drive cycle. Recall that
UDDS, LA92 and US06 represent mild, medium and aggressive urban driving respectively, while HWYCOL
and NYCCCOL represent highway cruising and heavy congestion driving respectively.

55
Figure 4.B - Range vs. mass per drive schedule
The data is mostly consistent; the most aggressive drive cycle, US06 results in the lowest range for all
scenarios. An unexpected close second is the heavy traffic cycle, NYCCCOL. The poor energy efficiency of
this cycle results from the low speed and average demand torque of the electric motor, which operates
inefficiently in this range. LA92 results in a range close to the average of the five drive cycles tested aside
from in one scenario corresponding to a small battery-battery system, where the range of this cycle is
comparable to that of US06. The cause of this phenomenon is not understood, but the result is repeatable.
The spectrum of vehicle range is observed to increase with increasing storage system size.
As mentioned previously in this section, energy usage and losses of the powertrain vary with each
storage system. Measurement of energy usage is necessary to understand differences in vehicle range amongst
0
50
100
150
200
250
300
350
400
450
200 250 300 350 400 450 500 550 600 650 700
Ran
ge
[km
]
Mass [kg]
UDDS
LA92
US06
HWYCOL
NYCCCOL

56
the different storage systems. Energy use and loss within the hybrid energy powertrain can be accounted for
in eight categories:
1. Cruising - the energy required to overcome drag due to aerodynamic and rolling resistance
2. Motor losses - inefficiencies of the induction machine, whether as a motor or generator
3. Inverter losses - inefficiencies of the inverter
4. Converter losses - inefficiencies of the DC-DC converter
5. Energy losses - energy losses within the energy storage system
6. Power losses - energy losses within the power system
7. Accessory load - energy spent by air conditioning, exterior lighting, driver instrumentation, etc.
8. Regenerative losses - the difference between the amount of energy available to the storage system
from decelerating the vehicle and the amount actually recovered
Note that in an ideal electric powertrain, the acceleration energy would be balanced by the
regenerative energy collected by decelerating. As such, the energy required to accelerate the vehicle is not
accounted for in its own category. The difference between acceleration energy and deceleration energy is
accounted for among motor, inverter, converter and storage losses. In the case that limitations of the storage
system prevent it from capturing all of the deceleration energy, the difference between the energy available to
the storage system and the amount actually recovered is measured as a regenerative loss. Regenerative losses
were not present in any of the scenarios tested here, and so this loss category has been dropped from
consideration for this study.
Energy measurements in each of the remaining seven categories were recorded for all scenarios.
Each measurement is the average of measurements taken from a drive cycle starting with the energy system at
100% and 30% charge. Energy usage is shown in Figure 4.C and Figure 4.D for the UDDS and US06 drive
cycles respectively. Similar figures for the LA92, HWYCOL and NYCCCOL cycles are included in Appendix
E.

57
Figure 4.C- Energy usage breakdown for UDDS
0
100
200
300
400
500
600
Large Medium Small Large Medium Small Large Medium Small
Batt. Only Batt. Cap. Batt. Batt.
En
erg
y u
se [
kJ/k
m]
Power
Energy
Accessory
Converter
Inverter
Motor
Cruise

58
Figure 4.D - Energy usage breakdown for US06
The data indicate that energy usage increases with increasing storage system size, and that the
increase is due to cruising energy; a heavier vehicle experiences increased rolling resistance. While cruising
requirements increase with system size, energy losses decrease. As the storage system becomes larger, demand
current is spread among more cells, reducing ohmic losses. Also noteworthy is that all of the hybrid storage
systems have increased energy usage per [km] than the control does; this difference being mostly due to a
difference in DC-DC converter requirements, but partly due to increased energy and power system losses as
well. Among the hybrid storage systems, power losses increase with system size; the effects of increased mass
are borne by the power system when accelerating the vehicle. Note that the battery-only system has no power
losses since it has no power system.
Overall energy usage is much higher for the US06 cycle than for UDDS. This is expected, since US06
represents a much more aggressive driving pattern. The biggest increase in requirements between US06 and
UDDS is in cruising energy, a result of much higher average speed in US06. Energy and power system losses,
0
100
200
300
400
500
600
Large Medium Small Large Medium Small Large Medium Small
Batt. Only Batt. Cap. Batt. Batt.
En
erg
y u
se [
kJ/k
m]
Power
Energy
Accessory
Converter
Inverter
Motor
Cruise

59
converter, and inverter losses are all higher in US06 due to increased demand. Accessory usage per [km] is
higher for UDDS; since accessory usage is a constant power load, accessory energy increases with time. A
slower average speed means accessory usage per [km] is higher.
4.2.2 Service Life Effects
Accurately measuring the effects of different usage patterns on the service life of a battery requires destructive
physical testing. Since service life is dependent upon, among other things, the amount of variation in demand
current and the presence of current reversals, these factors are proxies that can be used to imply changes in
battery service life.
Normalized current demand represents the current demand per battery cell within the energy system.
Approximating this as a normal distribution, statistics of demand can be analyzed. Figure 4.E and Figure 4.F
show the minimum, maximum, as well as the range of the mean of normalized demand plus and minus one
standard deviation, or 68% confidence interval for the US06 and UDDS drive cycles, respectively. Similar
figures are included in Appendix F for the remaining three drive cycles.
Figure 4.E - Normalized current demand for US06
-2.00
-1.50
-1.00
-0.50
0.00
0.50
1.00
1.50
2.00
2.50
3.00
3.50
Large Medium Small Large Medium Small Large Medium Small
Batt. Only Batt Cap Batt Batt
No
rmali
zed
Dem
an
d [
A]

60
Figure 4.F - Normalized current demand for UDDS
Predictably, the maximum demand per cell is farther from the mean than the minimum is in all cases.
While accelerating, drag forces increase the power required to change the vehicle's velocity, whereas they
decrease the power required to decelerate the vehicle.
As expected, hybrid storage systems have a much narrower range and confidence interval than the
control, indicating that the inclusion of a power system positively reduces the fluctuation of normalized
demand for the energy batteries. The effect is stronger for batter-capacitor systems than for battery-battery
systems. The implications to service life for battery-capacitor systems are made stronger by the fact that no
negative demand is present at all, proving a lack of any current reversals. While current reversals are present
for battery-battery systems, they are not as severe as for battery only scenarios.
Particularly for the US06 cycle, average demand is higher for battery-capacitor systems than for
battery-battery systems. This is a result of the battery-capacitor system having fewer cells than the battery-
battery systems. Average demand and demand variation can be seen to increase with storage system size in all
scenarios.
-2.00
-1.50
-1.00
-0.50
0.00
0.50
1.00
1.50
2.00
2.50
3.00
3.50
Large Medium Small Large Medium Small Large Medium Small
Batt. Only Batt Cap Batt Batt
No
rmali
zed
Dem
an
d [
A]

61
Both average demand and variation increase for the US06 cycle compared to UDDS, this is expected
given the higher accelerations and decelerations in US06. Furthermore, it appears that variation in the positive
and negative sense increase in equal proportion.
4.2.3 Implications
It is apparent from the results that several tradeoffs lie in the choice of storage system, and the powertrain
specifications. It follows that storage system design is application dependent, and that thorough consideration
should be given to a vehicle's intended use in specifying a powertrain.
One factor that is expected to have an effect on storage system performance is the voltage bus. No
variation in voltage bus was examined in any of the scenarios here. A higher bus voltage will have
implications for the ohmic losses in the inverter, as well as switching energy losses in the converter and
inverter.
A major implication of the findings here are that there is substantial scope for optimizing the storage
system and powertrain design. The most significant parameters to be optimized are (1) bus voltage, (2) stack,
height of the energy system, (3) number of strings in the energy system, (4) stack height of the power system,
and (5) number of strings in the power system. At a component level, the increased losses in the DC-DC
converter for both hybrid storage systems suggest that converter design is crucial to hybrid storage system
success. An improved design may reduce or eliminate the difference in conversion losses.
In all cases, a larger energy storage system leads to less demand on its components and lower ohmic
losses within the storage system, but greater overall energy consumption per [km] due to increased vehicle
mass. The effect of the size of the power system has not been investigated here. With both hybrid storage
systems, the advantage over the battery-only system improves as the system size increases. This suggests
hybrid storage systems are most appropriate at large system sizes, particularly for battery-capacitor systems.
In the case of a battery-capacitor system, a larger power system is not expected to have any marginal
benefit, since the existing system already has enough capacity to contain the kinetic energy of the vehicle at

62
highway speed. A smaller power system would lead to increased space with which to add more energy
batteries. This would lead to longer vehicle range and reduced demand per cell, but may result in the power
system not having sufficient capacity to fully sustain vehicle acceleration or regenerative braking. This would
lead to larger demand variation for the energy batteries and possibly some current reversals as well.
In the case of the battery-battery system, changing the size of the power system is more complicated.
The capacity of the system can be adjusted by increasing or decreasing the SoC window, so removing
batteries from the power system wouldn't necessarily cause a lack of capacity for acceleration. A smaller
battery power system would result in less ability to absorb regenerative braking, since a lower stack has a
lower voltage and would have to accept more current from the DC-DC converter to absorb the same power.
The power system is already current-limited in regeneration with the current configuration.
For comparison, the overall system energy and power densities are plotted on the same Ragone plot
as in section 2.3.3 - Comparison of Storage Technologies, together with the batteries and capacitors. This plot
is shown in Figure 4.G.
Figure 4.G - System volume specific power vs. volume specific capacity
100
1000
10000
100000
1 10 100 1000
Vo
lum
e S
pe
cif
ic P
ow
er
[W/L
]
Volume Specific Capacity [Wh/L]
Batt. Only
Batt. Cap.
Batt. Batt.
Capacitors
Batteries

63
That there are some battery cells in Figure 4.G with higher energy and power density than the
ultracapacitor systems deserves some discussion. It should be noted that the values depicted in Figure 4.G
represent peak output. This peak output is duration limited, and is not necessarily the same as peak input. In
the case of the ultra-high power batteries, which appear to be similar to battery-capacitor systems in Figure
4.G, this peak output is limited to 10 [s] duration. Furthermore, the peak input of these batteries is much less
than peak output. This has important consequences for storing regenerative braking energy, one of the key
functions these batteries are to perform. In the case of battery-capacitor systems, the capacitor peak output is
limited by the energy content of the capacitors, and input power is equal to output power.
As stated in section 2.3.3 - Comparison of Storage Technologies, no single electrical storage device
exists that makes a mid-way compromise between the power density of capacitors and the energy density of
batteries. Hybrid storage systems can be designed to fill a space anywhere in this gap as appropriate.
4.3 Limitations
This study is intended to develop a basic understanding of hybrid energy storage systems in the context of a
passenger vehicle; specifically, the Chrysler Pacifica. The study is not a comprehensive review of hybrid
electric storage systems in general, nor is it fully sufficient to understand the implications hybrid storage
systems within the context of the Pacifica, or to implement such a storage system. This section provides a
discussion of the limitations of this study.
4.3.1 Simplification and Approximation
A key limitation of the study is that it involves no physical testing. The results of a modeling/simulation
approach are highly dependent on the quality of modeling and simulation. A perfect model is often
unattainable owing to incomplete information, overload of detail, or computational expense. Often these
problems are addressed with appropriate simplifications or approximations. For the purposes of this study, a
fully switched electrical model of the inverter, converter and induction motor were much too computationally
expensive to be able to simulate the powertrain's operation for the range of 600 - 1500 [s] as is required to
simulate the drive cycles. This problem was solved by simplifying the motor to an efficiency lookup table, and

64
modeling energy loss within the inverter and DC-DC converter with empirical relationships. While every
effort was made to make the motor efficiency lookup table accurately reflect a real motor's characteristics, this
can only be confirmed against physical testing of the motor, the data for which was unavailable for this study.
An approximation had to be made for the batteries' internal resistance, a parameter that is generally
considered proprietary, confidential information. A value was suggested by Simulink's battery model
generator based on the type of battery, capacity, nominal discharge rate, etc. This value was selected since
better information could not be found at the time. The Simulink battery model does not account for the
Peukert effect (MathWorks 2010), which is an important limitation since one of the expected advantages of
hybrid storage leverages the increased useful capacity of a battery when depleted at a slower rate.
4.3.2 Drive Schedule
The drive schedules used in this study are widely used in studies of vehicle powertrains, but do not contain
complete information. The drive cycles consist of velocity data at one second intervals, but have no
information about road corners, surface, gradient, weather conditions, use of vehicle accessories, etc. Several
such factors beyond the velocity profile can affect the energy consumption of the vehicle. In the absence of
this information, it is assumed that the vehicle travels in a straight line over level terrain with no wind and
with a constant, estimated accessory load.
It is significant that the drive cycles here are selected to cover a wide variety of common vehicle
usage; they are no more a comprehensive representation of general human driving behaviour than a single
person is representative of the entire human population. Idiosyncrasies vary widely among the driving
population, among other things changing with geographic location, age, and gender. Completely covering all
possible driving scenarios is impossible, and the best available alternative is to use the drive cycles that are the
most widely used for other powertrain studies.

65
4.3.3 Hybrid Control Scheme
The hybrid control scheme used in this study to allocate power demand across the batteries and
ultracapacitors is attractive in its simplicity and derivation from the basic concept of kinetic energy. It is,
however, substantially less complicated than other similar schemes of its kind (Jalil, Kheir and Salman 1997),
(Lukic, et al. 2006), (Rossario, et al. 2006). While the scheme generally performed fine for all the scenarios
observed here, driving situations that involved rapid oscillations of acceleration and deceleration could cause
it to behave in a somewhat unstable fashion. Furthermore, it was better suited to the operation of the
ultracapacitor based HESS than the battery-battery system. The control should be more thoroughly
optimized for the system it is paired with.
4.3.4 Battery Service Life
As discussed in section 4.2.2 - Service Life Effects, actual implications of a hybrid energy storage on battery
service life are very difficult to determine without physical, destructive battery cell testing. The closest and
most readily understood proxy to measuring service life is to measure the fluctuation of current demand on
each cell, and the degree of current reversal. While these metrics can be used to imply an improvement in
battery service life, they cannot be used to guarantee it, or to measure it.
4.3.5 Chapter Summary
In this chapter, results are presented from the testing described in section 3.0 - Vehicle Configuration and
Simulation. It is shown that the control, battery-only systems, are heavier in most cases than any of the hybrid
systems. Further, it is shown that a battery-capacitor system has advantages over both the control and the
battery-battery systems in mass and expected service, while battery-battery systems provide increased range at
decreased mass in most cases, while making a large improvement in expected service life compared to
battery-only systems.
The results found here are mostly agreeable to the findings of Hoelscher, et al, who also found that
battery-capacitor systems decreased mass and improved service life. Hoelscher however, found that hybrid
energy system had reduced internal resistance losses compared to battery-only systems, whereas this study

66
measured a slight increase. Hoelscher's 2006 paper did not provide results pertaining to battery-battery
systems.

67
5.0 Conclusions and Recommendations This section covers conclusions of section 4.0 - Results, and recommendations that follow from those
conclusions.
5.1 Conclusions The objective of this study was to evaluate the effectiveness of a hybrid electric energy storage system for use
in a modified Chrysler Pacifica. The results show that effectiveness of a hybrid storage system depends on the
size and type of the hybrid storage system, the type of driving patterns observed, and what metrics are
evaluated. The results are conclusive to the extent that the model and simulation of the modified Pacifica
powertrain are accurate.
Hybrid storage can successfully be used to reduce vehicle mass, as well as demand variation and
current reversals of the energy system battery cells. The reduction in demand variation and current reversals
implies a longer service life for these battery cells. Reduction of mass, demand variation and current reversals
was greatest in battery-capacitor systems. A battery-battery HESS improves total energy capacity for all
system sizes tested, while a battery-capacitor HESS increases energy capacity only for the largest system size
tested here, with approximately 70 [kWh] of storage.
Although energy capacity is improved in most HESS's tested here, energy consumption is increased.
The increase comes predominantly in higher DC-DC converter losses, demonstrating that hybrid energy
storage has implications for other components in the powertrain.
The power system of the battery-battery HESS was unable to fully accommodate regenerative
braking demand in all cases, resulting in some current reversals for the energy batteries. This leads to the
conclusion that a battery-capacitor system is appropriate for applications demanding frequent, large velocity
changes. The power system of the battery-capacitor HESS was very bulky, limiting space for energy batteries.
This reduced vehicle range compared to the battery-battery system, leading to the conclusion that a battery-
battery system is appropriate when range is the primary concern.
Given the intricate set of compromises between the size and makeup of the storage system, the bus
voltage, and converter design, it is apparent that optimization is required to realize the full potential of a

68
HESS. Successful optimization will determine the best makeup of any given class of storage system to best
achieve a given set of design objectives and lead to the greatest energy capacity, power capacity and energy
efficiency of the system that is possible given a set of constraints.
5.2 Recommendations The foremost recommendation in the design of a HESS is to employ genetic algorithms or other form of
optimization to find the optimum bus voltage and numbers of energy and power strings and stack heights in
the storage system. Optimization should be application specific, with design objectives defined such that the
system is tailored to the intended use of the vehicle. For instance, HESS optimization for a vehicle that is
expected to experience frequent velocity changes should favour a battery-capacitor solution, whereas a vehicle
intended for long distance driving should favour a battery-battery system.
A second recommendation is to carefully consider the design of DC-DC converter for the
application, with a view to minimizing losses. Reducing energy loss in the DC-DC converter will bring the
efficiency of a HESS closer to that of a battery-only, improving range relative to these systems.
Thirdly, the control scheme should be optimized. In this study, the control scheme considered
vehicle kinetic energy only. Fuzzy logic may be a suitable technique to apply to the control scheme as a means
of considering kinetic energy and other factors as appropriate. For best results, the control scheme and
optimization of the HESS parameters should be considered simultaneously.
To overcome the limitations of modeling and simulation in this study, it is suggested to perform
physical testing. A prototype powertrain as well as battery testing can be used to corroborate the results found
here. Battery testing using cycles corresponding to the usage patterns discovered here will lead to a better
understanding of exactly how battery service life is affected by storage hybridization.

69
References Abuelsamid, Sam. "ABG Tech Analysis and Driving Impression: GM's HCCI Engine." AutoBlogGreen, 8 26,
2007.
Allpar. Allpar. 2010. http://www.allpar.com/model/pacifica-specs.html (accessed 6 30, 2010).
Argonne National Laboratory. Transportation R&D Center. U.S. Deptarment of Energy. 2010.
http://www.transportation.anl.gov/modeling_simulation/PSAT/index.html (accessed 7 5, 2010).
Author, Unknown. "Building the S-10 Electric." Automotive Manufacturing & Production, 7 1997.
—. Ecomodder. http://ecomodder.com/forum/emgarage.php?do=details&vehicleid=2257 (accessed 6
30, 2010).
AVL. AVL - ADVISOR. AVL. 2010.
http://www.avl.com/wo/webobsession.servlet.go?app=bcms&page=view&nodeid=400030459
(accessed 7 5, 2010).
Baisden, Andrew, and Ali Emadi. ADVISOR-Based Model of a Battery and an Ultra-Capacitor Energy
Source for Hybrid Electric Vehicles. IEEE, 2004.
Bryant, A.T., A. Walker, and P.A. Mawby. Fast Inverter Loss Simulation for Hybrid Electric Vehicle Drives.
Coventry, UK: School of Engineering, University of Warwick.
Buchmann, Isidor. Part Two. 2003. http://www.batteryuniversity.com/parttwo-34.htm (accessed 05 19,
2010).
Cassio, T.C. Andrade, and S.T. Ricardo Pontes. Three-Phase Induction Motors Energy Efficiency
Standards. Case Study, Ceara Federal University.
Chan, H, and D Sutanto. A New Battery Model for use With Battery Energy Storage Systems and Electric
Vehicle Power Systems. Hung Hom, Hong Kong: The Hong Kong Polytechnic University.
Cho, Don-Hyeok, Hyun-Kyo Jung, and Cheol-Gyun Lee. "Induction Motor Design for Electric Vehicle Using
a Niching Genetic Algorithm." IEEE Transactions on Industry Applications, VOl 37, No. 4, 2001: 994.
Ciobotaru, M, T Kerekes, R Teodorescu, and A Bouscayrol. PV Inverter Simulation Using
MATLAB/Simulink Graphical Environment. Aalborg, Denmark: Scientific Commons, 2008.
Conway, B. Electrochemical Supercapacitors. New York, NY: Kluwer Academic / Plenum Publishers, 1999.
Dodge, Onathan. "IGBT Tutorial Part 2 - Static, dynamic characteristics." Industrial Control Design Online.
United Business Media, 3 13, 2007.
Editors, Green Car Journal. "Could In-Wheel Motors be the Next Big Thing?" Green Car, 2010.
Emadi, Ali. Handbook of Automotive Power Electronics and Motor Drives. Boca Raton: CRC Press, 2005.

70
EV America, United States Dept. of Energy. 1997 Chevrolet S-10 Electric Vehicle Specifications. 1997.
General Motors Canada. 2011 Chevrolet Volt. 2010.
http://www.chevrolet.com/pages/open/default/future/volt.do (accessed 6 30, 2010).
General Motors. EV1 Specifications. 2001. http://www.evchargernews.com/CD-
A/gm_ev1_web_site/specs/specs_specs_top.htm (accessed 7 9, 2010).
Hilton, Jon. "What Has Formula 1 Ever Done For Us?" SAE Congress 2010. Detroit, Mi, (4 14, 2010).
Hodkinson, Ron, and John Fenton. Lightweight Electric/Hybrid Vehicle Design. Woburn: Butterworth-
Heinemann, 2001.
Hoelscher, David, Alex Skorcz, Yimin Gao, and Mehrdad Ehsani. "Hybridized Electric Energy Storage
Systems for Hybrid Electric Vehicles." IEEE Power and Propulsion Conference, 2006.
Hoffman, T, M Steinbuch, and R Druten. "Modeling for simulation of hybrid drivetrain components."
Vehicle Power and Propulsion Conference, 2006.
Honda Motor Co., Ltd. Honda IMA System/Power Unit. 2010.
http://world.honda.com/CIVICHYBRID/Technology/NewHondaIMASystem/PowerUnit/index_1.html
(accessed 7 1, 2010).
—. Ultra-capacitor, The Honda FCX. 2010. http://world.honda.com/FuelCell/FCX/ultracapacitor/
(accessed 6 30, 2010).
Huang, Bufu, Zhancheng Wang, and Yangsheng Xu. "Multi-Objective Genetic Algorithm for Hybrid
Electric Vehicle Parameter Optimization." IEEE/RSJ International Conference on the Intelligent Robots
and Systems. Beijing: IEEE, 2006.
Jalil, Nashat, Naim Kheir, and Mutasim Salman. "A Rule-Based Energy Management Strategy for a Series
Hybrid Vehicle." Albuquerque: American Control Conference, 1997.
Jinrui, N, and R Qinglian. Simulation and Analysis of Performance of a Pure Electric Vehicle With a
Supercapacitor. Beijing, China: Beijing Institute of Technology.
Johnson Controls. "Hybrid Vehicle Technology." Johnson Controls. 2010.
http://www.johnsoncontrols.co.uk/publish/us/en/products/power_solutions/media_kit/sustainability/h
ybrid_vehicle_technology.html (accessed 6 30, 2010).
Kisacikoglu, M, M Uzunoglu, and M Alam. "Fuzzy Logic Control of a Fuel Cell/Ultra-capacitor Hybrid
Vehicular Power System." Vehicle Power and Propulsion Conference, 2006.
Kokam Co. Ltd. "Product Catalogue." Kokam America. 2010.
http://www.kokam.com/english/product/battery_main.html (accessed 05 19, 2010).

71
Lachichi, A., and N. Schofield. "Comparison of DC-DC Converter Interfaces for Fuel." IEEE Vehicle Power
and Propulsion Conference, 2006.
LeBlanc, John. "Tough Road Ahead for Electric Cars." Toronto Star, 4 3, 2010: W3.
Lin, C, et al. Integrated, Feed-Forward Hybrid Electric Vehicle Simulation in SIMULINK and its Use for
Power Management Studies. Society of Automotive Engineers, 2001.
Lukic, S, and A Emado. Modeling of Electric Machines for Automotive Applications Using Efficiency Maps.
Illinois: Illinois Institute of Technology.
Lukic, Srdjan, Sanjaka Wirasingha, Fernando Rodriguez, Jian Cao, and Ali Emadi. "Power Management of
an Ultracapacitor/Battery Hybrid Energy Storage System in an HEV." IEEE Power and Propulsion
Conference (IEEE Power and Propulsion ), 2006.
Masrur, Abul, and Chris Mi. Fundamentals of Hybrid Electric Vehicles Seminar. SAE International, 2006.
MathWorks. The MathWorks. 2010. http://www.mathworks.com/ (accessed 7 5, 2010).
McLyman, Colonel Wm. Transformer and InductorDesign Handbook, 3rd ed. Columbus, OH: Marcel
Dekker, Inc, 2004.
Mendes, Christopher. Torque Control Strategies for AWD Electric Vehicles. Thesis, Waterloo: University
of Waterloo, 2006.
Miller, John. "Accessory Overload Threatens Auto Power Budgets." Automotive Design Online. United
Business Media, 9 20, 2006.
Montazeri-Gh, Morteza, Amir Poursamad, and Babak Ghalichi. "Application of Genetic Algorithm for
Optimization of Control Strategy in Parallel Hybrid Electric Vehicles." Journal of The Franklin Institute
(Elsevier), 2006.
National Highway and Traffic Safety Administration. NHTSA. 2010. http://www.nhtsa.gov/#6 (accessed 7
1, 2010).
NESSCAP Co., Ltd. "NESSCAP Ultracapacitor Products." NESSCAP. 2008.
http://www.nesscap.com/products_edlc.htm (accessed 05 19, 2010).
New-cars.com. New-Cars.com. 2004. http://www.new-cars.com/2004/chrysler/chrysler-pacifica-
specs.html (accessed 7 27, 2010).
Odvarka, Erik, Abdeslam Mebarki, David Gerada, Neil Brown, and Cestmir Ondrusek. "Electric Motor-
Generator for a Hybrid Electric Vehicle." Engineering Mechanics, 2009: 131-139.
Who Killed the Electric Car. Directed by Chris Paine. 2006.
Patrascu, Daniel. "Ford Focus Electric to be Built in Michigan." AutoEvolution, 1 12, 2010.
72
Perreault, David. "Course# 6.334 "Power Electronics" course notes." Boston: Massachusetts Institute of
Technology.
Powerex. CM200DU-12NFH. Product Datasheet, Youngwood, PA: Powerex, Inc., 2009.
POWERSIM. PSIM 9. http://www.powersimtech.com/ (accessed 7 6, 2010).
Qin, Helen, interview by Karl Mikkelsen. Ms. (04 21, 2009).
Qin, Helen, interview by Karl Mikkelsen. Simulation of S10 in PSAT (7 5, 2009).
Rizzoni, Giorgio, Lino Guzzella, and Bernd Baumann. Unified Modeling of Hybrid Electric Vehicle
Drivetrains. IEEE, 1999.
Rossario, L, P Luk, J Economou, and B White. A Modular Power and Energy Management Structure for
DUal-Energy Source Electric Vehicles. Shrivenham, UK: Cranfield University, 2006.
Russ, Carey. "2006 Chrysler Pacifica Touring AWD Review." The Auto Channel, 2006.
Samborsky, Steven. Design and Simulation of an Ultracapacitor Based Hybrid Electric Vehicle. Waterloo:
University of Waterloo, 2006.
Sherman, Don. "Features: Technology of the Year: GM's Two-Mode Hybrid System." Automobile, 2 2009.
SmartGauge Electronics. Smart Gauge. 04 02, 2008. http://www.smartgauge.co.uk/peukert_depth.html
(accessed 05 19, 2010).
Styles, Geoffrey. "What Peak Oil?" Energy Tribune, 6 25, 2010.
The MathWorks, Inc. Asynchronous Machine, Simulink product documentation. 2009.
Toronto. 2010 Toyota Prius. 2010. http://www.toyota.ca/cgi-
bin/WebObjects/WWW.woa/7/wo/Home.Vehicles.Go.Prius-
CtZRtmM7qZpzkUYlle1lXw/3.9?fmg%2fprius%2fintro.html (accessed 6 30, 2010).
U.S. Dept. of State Office of the Historian. "OPEC Oil Embargo, 1973-1974." Milestones.
http://history.state.gov/milestones/1969-1976/OPEC (accessed 7 1, 2010).
United States Environmental Protection Agency. Testing and Measuring Emissions. March 19, 2008.
Vetter, J, et al. "Ageing mechanisms in lithium-ion batteries." Journal of Power Sources, 2005.
Wang, Lingfeng. Hybrid Electric Vehicle Design Based on a Multi-Objective Optimization Evolutionary
Algortihm. Texas A&M University, 2005.
Westbrook, Michael H. The Electric and Hybrid Electric Car. Stevensage: The Institution of Electrical
Engineers and Society of Automotive Engineers, 2001.

73
Winkler, Dietmar, and Clemens Guhmann. Hardware-in-the-Loop simulation of a hybrid electric vehicle
using Modelica/Dymola. Technical University of Berlin.
Wright, R, et al. "Power fade and capacity fade resulting from cycle-life testing of Advanced Technology
Development Program lithium-ion batteries." Journal of Power Sources, 2003.
Xiaomin, Pu, Liao Chenglin, Wang Lifang, and Zhang Junzhi. "Test and Improvement of HEV Control
Strategies Using PSAT." IEEE. Dearborn, MI, 2009.
Yalamanchili, Krishna, and Mehdi Ferdowsi. "New Double Input DC-DC Converters for Automotive." IEEE
Power and Propulsion Conference, 2006.

74
Appendix A - Chrysler Pacifica Specifications
Chrysler Pacifica Feature Highlights
Six-passenger Luxury Seating in Three Rows (2 + 2 + 2)
Full-Length Center Console - 1st and 2nd Rows
Seats - Power 10-way Driver, 4-way Passenger
Power Adjustable Pedals with Memory
Dual Zone Automatic Temperature Control
Fold-Flat Load Floor
Tire Pressure Monitoring System
Next Generation (Multi-Stage) Front Air Bags*
Three-Row Side Curtain Air Bags*
3.5-l, 24-Valve, SOHC V-6 Engine
(250 Horsepower, 250 lb.-ft. Torque)
Four-speed Automatic Transaxle with Autostick®
On-demand All-wheel Drive or Front-Wheel Drive with Traction Control
Four-wheel Antilock Disc Brakes
(318 x 28 mm Front and 312 x 14 mm Rear)
Five-link Independent Rear Suspension with Load-leveling and Height Control
17-inch P235/65 Tires and Aluminum Wheels
Standard Features
Heated First- and Second-Row Seats
Leather-Trimmed Seats
In-Cluster Navigation System - INDUSTRY FIRST
Infinity Intermezzo (TM) Digital 5.1 Surround sound
UConnect Hands-Free Communication System (TM)
DVD Rear Seat Video (TM) Entertainment System
SIRIUS Satellite Radio (TM) Prep
High-Intensity Discharge Headlamps
Door-Mounted Front Seat Power Switches
Power, Front & Rear One-touch Down Windows
Power Locks
Illuminated Keyless Entry with Central Locking
Security Alarm System
Sentry Key Theft Deterrent System
Radio/Driver Seat/Exterior Mirrors Memory
Universal Garage Door Opener System
Sunglass Holder
Illuminated Vanity Mirrors in Sun Visors
Tachometer
Power Accessory Delay
4 Power Outlets - Front & Rear
Folding Second and Third Row Seats
Rear Cargo Storage Bin
Leather-Wrapped Shift Knob & Steering Wheel
Steering Wheel-Mounted Audio Controls
Speed Control
Tilt Steering Column

75
Instrument Panel Mounted Ignition Switch
Climate Control Outlets - Front/Rear
Air Filtering
Solar Control Sunscreen Glass
Rear Window Defroster
Automatic Halogen Headlamps
Fog Lamps
Exterior Mirrors - Dual, Power, Heated Fold-Away with Auto Dim Driver
Inside Rear View, Auto Dim Mirror
Antenna - Integrated in Side Window
Sound System: AM/FM Radio with Compact Disc and Changer Control with 150 watt amplifier and seven Infinity (R) speakers
Rear Window Wiper/Washer
Fuel Tank - 23 Gallons
Chrysler Pacifica Specifications
All dimensions are in inches (millimeters) unless otherwise noted
Assembly Plant Windsor, Ontario, Canada EPA Vehicle Class Multi-purpose vehicle
Engine: 3.5-liter, 24-Valve, SOHC, SMPI V-6 o Plenum intake manifold operated with electronically controlled manifold tuning valve and
short-runner valves o Displacement 214.7 cu. in. (3518 cu. cm) o Bore x Stroke 3.78 x 3.19 (96 x 81) o Valve System SOHC, 24 valves, hydraulic, center-pivot roller rocker arms o Fuel Injection Sequential, multi-port, electronic o Construction Semi-permanent mold aluminum block with cast-in iron liners and cast
aluminum heads o Compression Ratio 10.0:1 o Power (SAE net) 250 HP bhp (186 kW) @ 6400 rpm (71.4 bhp/liter) o Torque (SAE net) 250 lb.-ft. ( 339 Nom) @ 3950 rpm o Max. Engine Speed 6800 rpm
Fuel Requirement Unleaded mid-grade, 89 octane (R+M)/2 -preferred, unleaded regular, 87 octane (R+M)/2 - acceptable
Oil Capacity 5 qt. (4.75 L) with dry filter
Coolant Capacity 10.5 qt. (9.9 L)
Emission Controls: Three-way catalytic converter, electronic EGR, and internal engine features. Meets Federal Tier 2, Bin 9A emissions requirements; marketed in California as an ULEV (Ultra-Low Emission Vehicle) under cleanest vehicle rules.
Max. Gross Trailer Weight 3500 lbs. (1600 kg) Estimated EPA Fuel Economy 17/22 (MPG City/Hwy.)
Transaxle: four-speed
Adaptive electronic control, electronically modulated converter clutch. Gear Ratios
1st 2.84
2nd 1.57
3rd 1.00

76
4th 0.69
Final Drive Ratio 4.28
Overall Top Gear 2.95 All-wheel Drive
Center Differential Viscous coupling
Torque Split, F/R Variable: 0-90 percent
Rear Differential Open Electrical System
Alternator 160 A
Battery Group 34, maintenance-free: 500 CCA Dimensions and Capacities (at curb weight)
Wheelbase 116.3 (2954)
Track, Front 66.0 (1676)
Track, Rear 66.0 (1676)
Overall Length 198.9 (5052)
Overall Width 79.3 (2013)
Overall Height 66.5 (1688)
Cargo Floor Height 28.6 (726)
Ground Clearance 5.9 (149)
Curb Weight-est. 4675 lbs. (2121 kg) - AWD, 4482 lbs. (2033 kg) - initial FWD, 4393 lbs. (1993 kg) - lower-priced FWD
Weight Distribution, % F/R 55/45 - AWD, 56/44 -FWD
Frontal Area 30.55 sq. ft. (2.84 sq. m)
Drag Coefficient 0.355
Fuel Tank Capacity 23 gal. (87 L)
Accommodations
Seating Capacity, F/I/R 2/2/2 Front
Headroom (without sunroof) 39.2 (996)
Legroom 40.9 (1040)
Shoulder Room 60.8 (1545)
Hip Room 55.1 (1401)
Seat Travel 8.2 (208)
Front Volume Index 56.2 cu. ft. (1.59 cu. m) 2nd Row
Headroom 40.4 (1025)
Legroom 38.9 (988)
Knee Clearance 2.8 (72)
Shoulder Room 60.5 (1538)
Hip Room 56.3 (1430)
2nd Row Volume Index 55.0 cu. ft. (1.56 cu. m) 3rd Row
Headroom 35.4 (900)
Legroom 29.9 (760)
Knee Clearance 0.1 (2)
Shoulder Room 58.0 (1472)

77
Hip Room 41.9 (1063)
3rd Row Volume Index 32.2 cu. ft. (0.91 cu. m)
Front Volume Index 143.3 cu. ft. (4.06 cu. m) Cargo Volume Indexes
Aft of 2nd Row 43.6 cu. ft. (1.23 cu. m)
Aft of 3rd Row 13.0 cu. ft. (369 L)
All Seats Folded 79.5 cu. ft. (2.25 cu. m)
Body
Transverse front engine, all-wheel drive or front-wheel drive
Construction Unitized steel body with rubber-isolated front and rear suspension cradles, manual liftgate with temperature compensated gas props - std., power liftgate - opt.
Suspension
Front: Iso struts with integral gas-charged shock absorbers, coil springs, asymmetrical lower control arms, link-type stabilizer bar and urethane jounce bumpers
Rear: Five-link independent with coil springs, link-type stabilizer bar and gas-charged, self-levelling shock absorbers
Steering
Type Rack and pinion, variable-assist droop-flow power
Overall Ratio 17.8:1
Turning Diameter (curb-to-curb) 39.8 ft. (12.1 m)
Steering Turns (lock-to-lock) 3.18
Tires
Michelin MXV4 Energy P235/65 R17 (others may be used) Revs per Mile (km) 717 (445)
Wheels
Cast aluminum 17 x 7.5
Brakes
Front: 12.5 x 1.1 (318 x 28) vented disc with 1.88 (48) diameter two-piston sliding caliper
Swept Area 291.1 sq. in. (1878.2 sq. cm)
Rear: 12.25 x 0.55 (312 x 14) disc with 1.65 (42) diameter single-piston caliper
Swept Area 189.3 sq. in. (1221.4 sq. cm)

78
Appendix B - Gapped Inductor Design for DC-DC Converter
Gapped Inductor Design Using Core Geometry Approach
Step 1 - Specifications
Total Inductance
Number of Parallel Inductors
Inductance, L
Total DC Current
Per Inductor DC Current, I_0
Total Ripple Current
Per Inductor AC Current, ΔI
Total Output Power
Output Power, P_0
Regulation, α
Ripple Frequency, f
Operating flux density, B_m
Core Material
Ferrite
Window Utilization, K_u
Temperature rise goal, T_r
Leq 0.000025H
n 4
L Leq n 1 104
H
Ieq 1412A
I0
Ieq
n353A
Irip 40A
IIrip
n10A
Pt 1.5105W
Po
Pt
n3.75 10
4 W
1
f 200kHz
Bm 0.5T
Ku 0.4
Tr 25

79
Step 2 - Peak Current
Step 3 - Energy Handling
Step 4 - Electrical Conditions Coefficient
Step 5 - Core Geometry Coefficient
Ipk I0I
2 358A
Eh
L Ipk2
26.408W s
Ke 0.145Po
W
Bm
T
2
104 0.136
Kg
Eh
J
2
Ke cm
5 302.088cm
5

80
Step 6 - Select or Define Core
Core number 180UI
Magnetic Path Length
Core Weight
Mean Length Turn
Iron Area
Window Area
Area Product
Core Geometry
Surface Area
Permeability
Milli Henrys per 1k turns
Winding Length
Total iron weight
Step 7 - Current Density
Step 8 - RMS Current
Step 9 - Required Bare Wire Area
MPL 50.29cm
Wtfe 7491gm
MLT 26.28cm
Ac 19.858cm2
Wa 52.258cm2
Ap 1037.74cm4
Kg 313.636cm5
At 1296cm2
P 25000
L1000 3295mH
Gw 11.43cm
n Wtfe 29.964kg
Jd
2Eh
J 10
4
Bm
T
Ap
cm4
Ku
A
cm2
617.515A
cm2
IRMS I02
I2
353.142A
AwB
IRMS
Jd
0.572cm2

81
Step 10 - Select Wire
2 strands of AWG #0 Max current
Strands
Diameter
Bare
Insulated
Resistance
Step 11 - Effective Window Area
Step 12 - Number of Turns Possible
Step 13 - Required Gap Length
Step 14 - Calculate Equivalent Gap in mils
211A
str 2
d 8.2513mm
AwB str d
2
2
cm2
Aw str 1.1 AwB 2.353cm2
r0.0983
str
1000ft 1.613 10
4
m
S3 0.75
Waeff Wa S3 39.194cm2
S2 0.6
NWaeff S2
Aw
9.995
lg
0.4 N2
Ac
cm2
108
L
H
MPL
cm
P
0
cm 0.229cm
mils lg 393.7 90.225cm

82
Step 15 - Fringing Flux Factor
Step 16 - New Number of Turns
Step 17 - Winding Resistance
Step 18 - Copper Loss
Step 19 - Regulation
Step 20 - AC Flux Density
Fr 1
lg
cm
Ac
cm2
ln
2Gw
cm
lg
cm
1.237
Nnn
lg
cm
L
H
0.4Ac
cm2
Fr 108
8.617
Nn round Nnn 9
RL MLT Nn r 3.814 104
Pcu IRMS2
RL 47.564W
Pcu
Po
100 0.127
Bac
0.4 Nn FrI
2 A
104
lg
cm
MPL
cm
P
0
T 0.028T

83
Step 21 - Watts per Kilogram
Step 22 - Core Loss
Step 23 - Total Loss
Step 24 - Watt Density
Step 25 - Temperature Rise
Step 26 - Peak Flux Density
k 0.00004855 m 1.63 n 2.62
mWg kf
Hz
m
Bac
T
n
W
kg1.822
W
kg
Pfe mWgWtfe 13.65W
P Pcu Pfe 61.214WPo
P Po0.998
P
At
0.047W
cm2
Tr 450
W
cm2
0.826
36.152
Bpk
0.4 Nn Fr
I0I
2
A
104
lg
cm
MPL0
P cm
T 2.009T

84
Appendix C - Battery Discharge Model Parameters for each of three cell types were estimated from their manufacturer's data sheets [REF] to mimic
their discharge behaviour. The discharge profile for the high capacity cell as per its manufacturer datasheet is
given together with the corresponding Matlab model discharge profile.
Figure I - High capacity battery discharge profile (datasheet)
Figure II - High capacity battery discharge profile (Matlab model)

85
Appendix D - Battery and Capacitor Cell Parameters This table shows details of the battery cells used herein [REF]. Referenced models are highlighted.
This table shows details of the ultra capacitors used in this work [REF]. The referenced cell is highlighted.

86
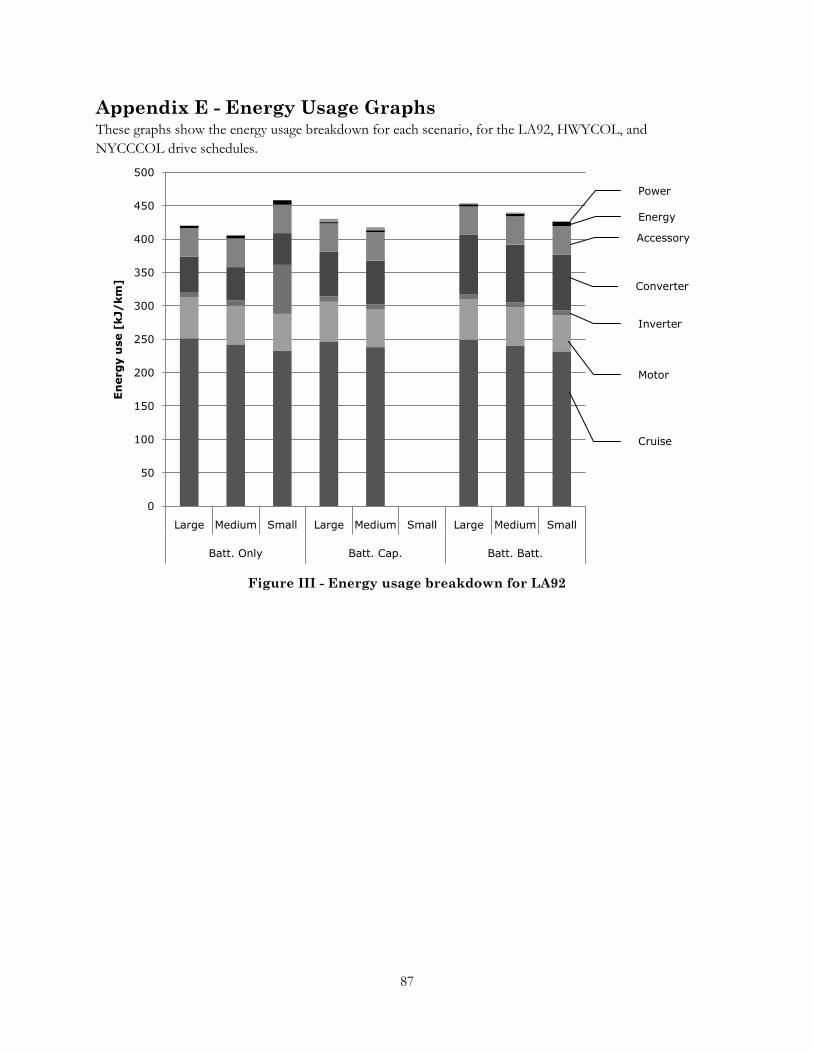
87
Appendix E - Energy Usage Graphs These graphs show the energy usage breakdown for each scenario, for the LA92, HWYCOL, and
NYCCCOL drive schedules.
Figure III - Energy usage breakdown for LA92
0
50
100
150
200
250
300
350
400
450
500
Large Medium Small Large Medium Small Large Medium Small
Batt. Only Batt. Cap. Batt. Batt.
En
erg
y u
se [
kJ/
km
]
Power
Energy
Accessory
Converter
Inverter
Motor
Cruise

88
Figure IV - Energy usage breakdown for HWYCOL
0
50
100
150
200
250
300
350
400
450
Large Medium Small Large Medium Small Large Medium Small
Batt. Only Batt. Cap. Batt. Batt.
En
erg
y u
se [
kJ/
km
]
Power
Energy
Accessory
Converter
Inverter
Motor
Cruise

89
Figure V - Energy usage breakdown for NYCCCOL
0
100
200
300
400
500
600
Large Medium Small Large Medium Small Large Medium Small
Batt. Only Batt. Cap. Batt. Batt.
En
erg
y u
se [
kJ/
km
]Power
Energy
Accessory
Converter
Inverter
Motor
Cruise

90
Appendix F - Demand Variation Graphs These graphs show the demand variation for each scenario, for the LA92, HWYCOL, and NYCCCOL drive
schedules.
Figure VI - Demand variation for LA92
Figure VII - Demand variation for HWYCOL
-2.00
-1.50
-1.00
-0.50
0.00
0.50
1.00
1.50
2.00
2.50
3.00
3.50
Large Medium Small Large Medium Small Large Medium Small
Batt. Only Batt Cap Batt Batt
No
rm
ali
zed
Dem
an
d [
A]
-2.00
-1.50
-1.00
-0.50
0.00
0.50
1.00
1.50
2.00
2.50
3.00
3.50
Large Medium Small Large Medium Small Large Medium Small
Batt. Only Batt Cap Batt Batt
No
rm
ali
zed
Dem
an
d [
A]

91
Figure VIII - Demand variation for NYCCCOL
-2.00
-1.50
-1.00
-0.50
0.00
0.50
1.00
1.50
2.00
2.50
3.00
3.50
Large Medium Small Large Medium Small Large Medium Small
Batt. Only Batt Cap Batt Batt
No
rm
ali
zed
Dem
an
d [
A]