design and implementation considerations of aca risk ... · design and implementation...
TRANSCRIPT

Design and Implementation
Considerations of ACA Risk
Mitigation Programs
JUNE 2012
The opinions expressed and conclusions reached by the authors are their own and do not represent any official position or opinion of the Society of Actuaries or its members. The Society of Actuaries makes no representation or warranty to the accuracy of the information. © 2012 Society of Actuaries, All Rights Reserved
PREPARED BY
Adrian Clark, FSA, MAAA James T. O’Connor, FSA, MAAA
SPONSORED BY

© 2012 Society of Actuaries, All Rights Reserved
Table of Contents
Executive Summary ......................................................................................................................................... 1 Scope of the Report ........................................................................................................................................ 3 General Results ............................................................................................................................................... 4 Individual Market Results for Scenario 1 for Varying Rate Level Assumptions ........................................... 4 Individual Market Results for Scenario 1 by Geographic Grouping for Varying Rate Level Scenarios ........ 13 Individual Market Results - Varying Exchange/Risk Mitigation Scenarios ................................................... 22 Scenarios Modeled ......................................................................................................................................... 24 Initial Scenarios ............................................................................................................................................ 24 Additional Scenarios ..................................................................................................................................... 27 Simplifying Assumptions ................................................................................................................................. 28 Limitations, Caveats and Reliance .................................................................................................................. 29 Acknowledgments ........................................................................................................................................... 29 ATTACHMENTS Attachment A – About the HCRFM ................................................................................................................. A-1 Introduction .............................................................................................................................................. A-1 Switching (Change Factor) Process........................................................................................................... A-2 Market Switching ............................................................................................................................... A-2 Plan Switching .................................................................................................................................... A-3 Expansion of the Small Group Market to 100 Employees ........................................................................ A-5 Health Care Cost Projections .................................................................................................................... A-5 Health Status and Market Utilization Factors .......................................................................................... A-5 ACA Risk Mitigation Programs .................................................................................................................. A-6 Transitional Reinsurance Program ..................................................................................................... A-7 Risk Adjustment Program................................................................................................................... A-9 Transitional Risk Corridor Program .................................................................................................... A-11 Premium Setting Process .......................................................................................................................... A-11 Attachment B – Key Underlying Assumptions ................................................................................................ B-1 Census ...................................................................................................................................................... B-1 Change Factor Assumptions ..................................................................................................................... B-9
Health Plan Characteristics ....................................................................................................................... B-14 Plan Assignments and Designs – Commercial Individual and Group Business ........................................ B-16 Initial Claim Costs ..................................................................................................................................... B-17 Premium Structure and Methodology ..................................................................................................... B-19 Attachment C – Rate Level Scenarios ............................................................................................................. C-1 Attachment D – Exchange/3Rs Scenarios ....................................................................................................... D-1

© 2012 Society of Actuaries, All Rights Reserved Milliman, Inc.
Page 1
EXECUTIVE SUMMARY
The Society of Actuaries (SOA) retained Milliman, Inc. to conduct research examining the potential implications of the risk mitigation programs—risk adjustment, reinsurance, and risk corridors—created under The Patient Protection and Affordable Care Act, as amended (ACA). Background: The ACA prohibits health plans from denying coverage or excluding coverage of pre-existing health conditions. It also prohibits health plans from varying premiums by gender or health status and limits premium variations by age. As a result of these provisions, health plans that enroll a relatively less healthy population could be at a greater risk of losses. This could, in turn, create incentives for health plans to avoid enrolling individuals in poor health. The ACA includes three risk mitigation programs to help ensure that health plans are more fairly compensated for the risks they bear, thereby facilitating competition based on efficient care management and quality rather than risk selection. The three ACA programs are: 1. A permanent risk adjustment program, intended to shift funds from health plans that enroll
relatively healthy populations to those that enroll relatively less healthy populations.
2. A transitional reinsurance program providing additional funds to health plans that enroll individuals with especially high medical spending.
3. A 3-year transitional risk corridor program, intended to mitigate risks associated with mispricing premiums when the estimated medical spending of potential enrollees is uncertain—the government will provide funding if a health plan’s losses exceed a certain threshold and a health plan will pay the government if the health plan’s gains exceed a certain threshold.
Projection Methodology: This analysis uses Milliman’s Health Care Reform Financing Model (HCRFM) to analyze the impact of these risk mitigation programs in 2014-2017. Using the model’s projections of enrollment and premiums, the analysis focused on loss ratios—medical claims divided by premiums—to assess the adequacy of premium income, both with and without the risk mitigation programs. Six different scenarios were modeled, varying particular aspects of the risk adjustment method and rules applying to the Individual Market. For a baseline scenario, two additional sub-scenarios were modeled which varied the assumptions regarding premium increases. Each scenario was run for three groups of states categorized by pre-ACA regulatory restrictiveness, and the results are also presented on a nationwide level. Key Findings from Research: Risk mitigation programs appear to reduce financial risks to health plans. At the same time, overly
restrictive premium rate limitations can lead to high federal risk corridor payments. Risk mitigation programs help stabilize the market by adjusting overall health plan revenues to be more in line with the risks undertaken. The results suggest that the transitional risk corridor program is of particular importance, especially if the rate review process were to become overly restrictive or plans do not adequately adjust for the post-2013 population, resulting in premiums that are inadequate relative to the risk that plans are bearing. If the rate-setting process results in premiums that are not adequate to meet claims and expenses, federal payments under the risk corridor programs will be high to compensate partially for the inadequate premiums. The impact of inadequate rates on a health plan’s financial viability should also be considered. This result stresses the need for the rate review process to not only guard against unduly high premiums, but also to ensure that premiums are not set too low. This is especially important in 2017 and beyond, after the expiration of the risk corridor program.

© 2012 Society of Actuaries, All Rights Reserved Milliman, Inc.
Page 2
Risk mitigation programs are especially important for plans in states with less restrictive issue and
rating rules prior to ACA. The results vary fairly significantly between states, depending on the restrictiveness of each state’s regulatory environment prior to 2014. As might be expected, plans in the most restrictive states (e.g., those that already impose significant rating and underwriting restrictions) already have relatively higher premiums, but are projected to require lower rate increases than plans in other states. Plans in states that are moving from relatively less restrictive rules to the guaranteed issue and community rating rules in 2014 are projected to have more need for the risk mitigation mechanisms, especially the risk corridors, if premiums do not incorporate anticipated adverse selection and the increase in costs that may result from the expected health status of newly enrolled members.
Grandfathered plans will reflect a relatively healthier population over time.
Prior to 2014, average premium rate increases and loss ratios tend to be higher for grandfathered business because underwriting often restricts less healthy people from changing to other coverage options. Over time, grandfathered plans are projected to become a smaller share of the overall market, with rapid migration to other plans beginning in 2014, as individuals originally in grandfathered plans move to other plans either inside or outside of an exchange. Individuals who would be eligible for lower premiums in non-grandfathered plans, either due to premium subsidies or to the introduction of premium rate restrictions related to age or health status, are more likely to change plans. As a result, individuals remaining in grandfathered plans are more likely to be younger and/or in better health, with commensurately lower premium increases and loss ratios. This effect should be recognized in the rate review process as potential premium rate reductions for grandfathered plans, and potentially as increases in trend rates observed by non-grandfathered plans.
The Individual Market is expected to grow rapidly starting in 2014 By year 2017, the total individual market enrollment is projected to almost triple. This is primarily the result of the ACA’s individual mandate combined with the availability of substantial subsidies. Exchange business is expected to grow much faster than non-exchange business due to the availability of subsidies only through exchanges. Much of this increase is expected to come from individuals currently uninsured, but some enrollment is expected to come from individuals currently insured through coverage provided by employers.
Limitations: As with all models projecting health insurance enrollment, medical spending, and premiums, there is uncertainty regarding the results. The model’s underlying assumptions, which are detailed in the report and attachments, were developed using various data sources and professional judgment. The specific results may vary under different sets of assumptions and scenarios. The projections, therefore, are not intended to be predictions of specific outcomes. Rather, they are meant to illustrate the potential impacts of the risk mitigation programs under certain scenarios. Particular caution must be exercised regarding the premium projections. Premiums can differ across years and across scenarios for several reasons, including rating rules, differences in the relative health status/utilization of the underlying insured population, differences in the age and gender distribution of the underlying insured population, varying healthcare delivery system structures, practice patterns, provider reimbursement arrangements, and the risk mitigation programs. Of course, there can also be random fluctuations. Unless otherwise noted, care must be taken not to attribute premium changes or differences solely to any one of these factors. This analysis focuses largely on loss ratios rather than premiums in order to isolate the relationship between the underlying risk the health plans bear with respect to medical costs and the premiums received.

© 2012 Society of Actuaries, All Rights Reserved Milliman, Inc.
Page 3
SCOPE OF THE REPORT
The Society of Actuaries (SOA) retained Milliman to conduct a research project examining the impact of The Patient Protection and Affordable Care Act, as amended (ACA), on the health insurance industry and, in particular, the impact of the three ACA risk mitigation programs. This report presents an analysis of the impact of ACA based upon specific sets of assumptions and projection methodologies applied to six scenarios chosen for modeling in consultation with the SOA Project Oversight Group (POG). Six different scenarios were modeled, varying particular aspects of the risk adjustment method and rules applying to the Individual Market. For a baseline scenario, two additional sub-scenarios were modeled which varied the assumptions regarding premium increases. Each scenario was run for three groups of states categorized by pre-ACA regulatory restrictiveness (referred throughout the report as Geographic Groups or Regulatory Environments), and the results are also presented on a nationwide level. The first scenario was analyzed under three different assumptions regarding implementation of premium rate levels and rate increases because of the sensitivity of results, particularly for the risk corridor program, depending upon the assumption for rate increases implemented during the transition years. Milliman used its Health Care Reform Financing Model (HCRFM) to generate model projections for each of these scenarios. See Attachment A for a detailed description of this model. This report presents a summary of the results, along with a description of the projection methodology and the key assumptions underlying the projections. Detailed results are contained in the attachments to the report. The main report focuses on the impact to the individual medical market.

© 2012 Society of Actuaries, All Rights Reserved Milliman, Inc.
Page 4
GENERAL RESULTS
As mentioned above, we used six different scenarios to model the impact of variations in health plan participation and product qualification in state exchanges, as well as the financial impact of risk mitigation programs. The results of those scenarios are presented later in this section of the report. A description of each scenario is presented in the next section of the report. Our modeling indicates that a health plan’s ability to maintain adequate rates is critical to an ACA objective of creating a viable and competitive health plan marketplace. Even with the risk mitigation programs in place for years 2014-2016, our model projects that some markets and health plans will experience losses beyond the capacity of the risk mitigation programs to eliminate completely. Our modeling shows that these losses may indicate the need for premium rate actions that are higher than past experience would support, at least in years 2014 and 2015. Potentially higher rate increases may be needed in 2017 after the reinsurance and risk corridor programs terminate. As such, we first present results for Scenario 1, in which we varied the rate increase assumptions for years 2014 and later to illustrate the premium and loss ratio variability that could occur. These rate increase variations are described below.
Individual Market Results for Scenario 1 for Varying Rate Level Assumptions Based on the underlying assumptions related to relative health status/utilization levels (of both the uninsured and the currently insured), and because of the ACA requirements for guaranteed issue, modified community rating, and elimination of pre-existing condition limitations, our modeling has indicated the possibility for adverse selection to occur, particularly in years 2014, 2015, and 2016. Such adverse selection could result in the need for health plans to increase their premium rates significantly1. Given the challenge to health plans and regulators to keep premiums as affordable as possible, but also adequate to maintain the financial viability of a health plan, we modeled three different rate level scenarios that examined differences in implementation of rates at differing levels relative to the adverse selection health plans may encounter:
Status Quo: Reflects expected results as if the 2014 ACA reforms are not implemented. Rate increases for this scenario are uncapped.
Scenario 1A: Reflects expected results for implementation of 2014 ACA reforms, does not reflect pricing for anticipated adverse selection for years 2014 and later, and assumes a 20% maximum rate increase (excluding increases for age and benefit changes).
Scenario 1B: Reflects expected results for implementation of 2014 ACA reforms, includes
pricing for anticipated adverse selection for years 2014 and later, but with a 20% maximum rate increase (excluding increases for age and benefit changes).
Scenario 1C: Reflects expected results for implementation of 2014 ACA reforms, includes
pricing for anticipated adverse selection for years 2014 and later, with no maximum rate increase.
Tables 1 – 7 provide a summary of the projected experience results by rate level scenario and category of business (i.e. grandfathered, exchange, and non-exchange, non-grandfathered business) for the Individual Medical markets for all three geographic groupings combined. Tables 8A through 8F provide similar summary data by geographic grouping, but only for all categories of business combined.
1 We note that many health plans will introduce rates for new plans to be sold for 2014, which may replace plan
designs currently in force. Technically these will not be considered rate increases. Since ACA requires pooling and
modified community rates, we applied the 20% cap as if the new rates were relative to the prior rates for similar
plans. As such, we did not distinguish between rates for new plans and those for continuing plans.

© 2012 Society of Actuaries, All Rights Reserved Milliman, Inc.
Page 5
Separate detailed results by category of business for each geographic grouping are presented in Attachment C. Enrollment Table 1 summarizes projected enrollment of each individual market channel by projection year for the status quo scenario and each of the three rate level scenarios.
Table 1
Results by Rate Level Scenario and Projection Year
Individual Medical Business Only
All Geographic Areas Combined
Enrollment (In Thousands)
Projection Year Scenario Total
Grandfathered Business*
Non-Grandfathered Non-Exchange
Business* Exchange Business
All Non-Exchange Business
2013 Status Quo 14,594 7,425 7,169 n/a 14,594
2014 Status Quo 14,563 5,936 8,628 n/a 14,563 2014 Scenario 1A 20,622 2,518 8,674 9,430 11,192 2014 Scenario 1B 20,628 2,485 8,513 9,630 10,998 2014 Scenario 1C 20,640 2,252 7,884 10,505 10,135
2015 Status Quo 14,535 4,789 9,746 n/a 14,535 2015 Scenario 1A 29,772 1,947 10,821 17,004 12,768 2015 Scenario 1B 29,831 1,892 10,666 17,274 12,558 2015 Scenario 1C 29,733 2,025 9,143 18,566 11,168
2016 Status Quo 14,538 3,936 10,602 n/a 14,538 2016 Scenario 1A 35,259 1,859 12,098 21,302 13,957 2016 Scenario 1B 35,314 1,789 11,942 21,583 13,731 2016 Scenario 1C 35,228 1,946 10,183 23,099 12,129
2017 Status Quo 14,534 3,286 11,247 n/a 14,534 2017 Scenario 1A 39,160 1,775 12,767 24,618 14,543 2017 Scenario 1B 39,206 1,718 12,583 24,906 14,300 2017 Scenario 1C 39,113 1,870 10,875 26,369 12,745
* For the Status Quo scenario, business issued after 2010 was placed into the non-grandfathered business column. Business issued prior to 2011 and persisting was placed in the Grandfathered Business category.
The following are notable from the projections in Table 1:
By year 2015 the total individual market enrollment in each scenario is projected to double over what it would have been as measured by the Status Quo scenario. By year 2017, it is projected to be 2.7 times as high. This is primarily the result of the ACA’s individual mandate, combined with the availability of substantial subsidies for lower income people. In addition, some people with group coverage migrate to the individual market due to their employer plans being terminated, particularly among small employers not subject to penalties. The migration of uninsured to the individual market is assumed to phase in over time, because of the time it takes to educate people about and have them respond to the changes and the phase-in of individual mandate penalties. The specific underlying phase-in assumptions are shown in Table A-3 in Attachment A.

© 2012 Society of Actuaries, All Rights Reserved Milliman, Inc.
Page 6
Due to the expansion of Medicaid eligibility, some migration from the individual market to
Medicaid is projected to occur. This results in slower projected enrollment growth in the individual market in year 2014. This is not evident in Table 1. Evaluation of changes to Medicaid was outside the scope of this analysis.
As might be expected, exchange business is projected to grow much faster than non-exchange
business. By 2017, exchange business is projected to have approximately twice as many enrollees as non-grandfathered/non-exchange plans. This is primarily due to the availability of subsidies only to those who purchase coverage through an exchange. The growth in exchange enrollment is even more pronounced for Scenario 1C--higher premiums when premium increases are uncapped make subsidized coverage in the exchange preferable.
Grandfathered business is projected to lapse very quickly from year 2013 to 2014 due to the
introduction of guaranteed issue and the availability of premium subsidies to those purchasing new exchange plans. By year 2017, less than 5% of the individual market members in force in 2010 (the base year of the model) is projected to remain enrolled in a grandfathered plan. In Table 2, we see that projected average premium rates for the grandfathered business start out higher than those for non-grandfathered business, but ultimately end up lower. Similarly, Table 3 shows that projected loss ratios are lower for grandfathered business after year 2013 since healthier people are more likely to persist in such plans.
Some may expect that there would be less growth or perhaps even a reduction in enrollment in 2017 due to the end of the transitional reinsurance and risk corridor programs. While the elimination of these risk mitigation programs could result in larger rate increases to compensate health plans for their increased risk, we do not think it will have substantial impact since, as shown later, the average net reinsurance program payments received by the individual market are not very significant as a percentage of premium (about 2%). However, this impact could vary by health plan. We have assumed that once a person becomes covered, he or she will maintain coverage in order to comply with the ACA individual mandate. Average Annual Premiums Table 2 summarizes a comparison of average projected annual premium by rate level scenario, category of business, and projection year. It should be noted that the ratio of one year’s average premium rate to the prior year’s rate is not the same as the average rate increase that was implemented. These results reflect differences and annual changes in age/gender, geographic area, and benefit plan distributions, variation in health status/utilization levels, as well as the implemented rate increases.
Table 2
Results by Rate Level Scenario and Projection Year
Individual Medical Business Only
All Geographic Areas Combined
Average Annual Premiums*
Projection Year Scenario Total
Grandfathered Business**
Non-Grandfathered Non-Exchange
Business** Exchange Business+
Exchange Business after
Premium Subsidy
2013 Status Quo $2,725 $2,890 $2,553 n/a n/a
2014 Status Quo $2,933 $3,233 $2,726 n/a n/a 2014 Scenario 1A $2,979 $3,430 $2,902 $2,929 $1,835 2014 Scenario 1B $3,242 $3,677 $3,146 $3,214 $1,945 2014 Scenario 1C $3,725 $4,180 $3,688 $3,654 $2,054

© 2012 Society of Actuaries, All Rights Reserved Milliman, Inc.
Page 7
Table 2
Results by Rate Level Scenario and Projection Year
Individual Medical Business Only
All Geographic Areas Combined
Average Annual Premiums*
Projection Year Scenario Total
Grandfathered Business**
Non-Grandfathered Non-Exchange
Business** Exchange Business+
Exchange Business after
Premium Subsidy
2015 Status Quo $3,170 $3,606 $2,955 n/a n/a 2015 Scenario 1A $3,492 $3,681 $3,427 $3,512 $1,998 2015 Scenario 1B $3,788 $4,151 $3,691 $3,809 $2,107 2015 Scenario 1C $4,808 $4,026 $4,907 $4,845 $2,361
2016 Status Quo $3,493 $4,004 $3,303 n/a n/a 2016 Scenario 1A $4,171 $3,962 $4,088 $4,237 $2,162 2016 Scenario 1B $4,490 $4,635 $4,388 $4,535 $2,279 2016 Scenario 1C $5,478 $4,208 $5,591 $5,536 $2,426
2017 Status Quo $3,897 $4,415 $3,745 n/a n/a 2017 Scenario 1A $4,942 $4,231 $4,868 $5,031 $2,368 2017 Scenario 1B $5,283 $4,737 $5,212 $5,357 $2,480 2017 Scenario 1C $6,045 $4,401 $6,158 $6,115 $2,540
* Note: Premiums reflect anticipated net risk adjustment and reinsurance payments, but not net risk corridor payments.
** For the Status Quo scenario, business issued after 2010 was placed into the non-grandfathered business column. Business issued prior to 2011 and persisting was placed in the Grandfathered Business category.
+ Before application of federal premium subsidies
Table 2 offers the following observations:
While the projected average premiums for grandfathered business are greater than those for other business categories in year 2013 (and in every year for the Status Quo scenario), over time this reverses as less healthy people move to the guaranteed issue, standard rated market and older people move to lower rates resulting from the 3-to-1 rate slope requirement2.
The non-grandfathered premium would be higher than shown in Table 2 in 2014-2016 if not for the impact of the transitional reinsurance program.
The modest differences between average premiums for exchange business and non-
grandfathered/non-exchange business are due to the differing age/gender and plan mix between the two distribution channels. They are not due to health status differences since rates for the two channels are based on pooled experience and vary only by plan, age, and geographic location.
We note that many people purchasing coverage through an exchange will qualify for federal
premium subsidies, which, as shown above, reduces the premium rates they effectively pay on average. For some consumers, the subsidy will bring the personal cost of a plan down substantially, and may even be $0 for a bronze plan.
2 Section 1201 of ACA amends the Public Health Service Act to require that premium rates cannot vary by age more
than 3 to 1 for adults and cannot vary by gender. Many states currently allow rate variation by age and gender based upon actuarial cost differences that exceed the limitations imposed by ACA.

© 2012 Society of Actuaries, All Rights Reserved Milliman, Inc.
Page 8
Loss Ratios Table 3 summarizes the resulting loss ratios3 across all individual market plans by rate level scenario, category of business, and projection year. Loss ratios are used to assess the adequacy of premium income by isolating the relationship between the underlying risk the health plans bear with respect to medical costs and the premiums received. Assumed target loss ratios range from 78% to 80%, varying by modeled health plan type. These levels reflect the loss ratios needed to meet or exceed the ACA MLR minimum requirement of 80%. Loss ratios exceeding these targets may indicate that premiums are inadequate for some plans to meet claims and administrative expenses.
Table 3
Results by Rate Level Scenario and Projection Year
Individual Medical Business Only
All Geographic Areas Combined
Incurred Loss Ratios Prior to Risk Mitigation Payments
Projection Year Scenario Total
Grandfathered Business*
Non-Grandfathered Non-Exchange
Business* Exchange Business
All Non-Exchange Business
2013 Status Quo 80% 86% 72% n/a 80%
2014 Status Quo 82% 87% 77% n/a 82% 2014 Scenario 1A 116% 82% 114% 128% 105% 2014 Scenario 1B 106% 77% 106% 116% 98% 2014 Scenario 1C 92% 69% 91% 99% 86%
2015 Status Quo 83% 87% 80% n/a 83% 2015 Scenario 1A 113% 76% 112% 117% 107% 2015 Scenario 1B 104% 69% 105% 108% 99% 2015 Scenario 1C 81% 72% 81% 82% 80%
2016 Status Quo 83% 86% 82% n/a 83% 2016 Scenario 1A 105% 77% 105% 107% 101% 2016 Scenario 1B 97% 68% 98% 100% 94% 2016 Scenario 1C 79% 75% 78% 79% 78%
2017 Status Quo 82% 86% 81% n/a 82% 2017 Scenario 1A 97% 79% 97% 98% 95% 2017 Scenario 1B 91% 72% 91% 92% 89% 2017 Scenario 1C 78% 79% 78% 79% 78%
* For the Status Quo scenario, business issued after 2010 was placed into the non-grandfathered business column. Business issued prior to 2011 and persisting was placed in the Grandfathered Business category.
3 Note that these loss ratios are not on a basis for determining rebates payable due to the minimum loss ratio
requirements of ACA. In this report, the use of the term “loss ratio” refers to the ratio of incurred claims to earned premiums. This differs from the ACA term “medical loss ratio” or “MLR”, which includes other items in its ratio such as quality improvement expenses, contract reserves changes, and taxes and regulatory assessments and fees.

© 2012 Society of Actuaries, All Rights Reserved Milliman, Inc.
Page 9
As can be observed:
Loss ratios for grandfathered business are projected to be relatively stable from one year to the next for all three of the rate level scenarios. They are lower in Scenario 1B in 2015-2017 in order to make up for some of the premium shortages for non-grandfathered business, while still exceeding the MLR minimum for all business combined.
The loss ratios are very high in years 2014 through 2017 for non-grandfathered business, except
for Scenario 1C after 2014. Scenario 1C has no limit on the rate increases implemented and can thereby keep loss ratios close to target.
Loss ratios in Scenarios 1A and 1B are projected to decrease over time, but do not revert to
target loss ratio levels. This is due to several factors, including the assumption that rate increases are capped. In addition, we have assumed that health plans will reflect in their product pricing the projected reduction in claims caused by anticipated net reinsurance payments individual carriers receive through 2016 (i.e. health plans are assumed to set lower premium rates in anticipation of receiving some reinsurance program payments for their large claims).
Loss ratios are projected to be higher for exchange business than for non-grandfathered/non-
exchange business in years 2014 and 2015 largely due to an expectation of pent-up demand in the first year of coverage from the previously uninsured, and the impact of that demand on claim costs in the first year of insurance coverage, since more of the uninsured are projected to move to the exchange channel than the non-exchange channel. The differences in loss ratios narrow over time.
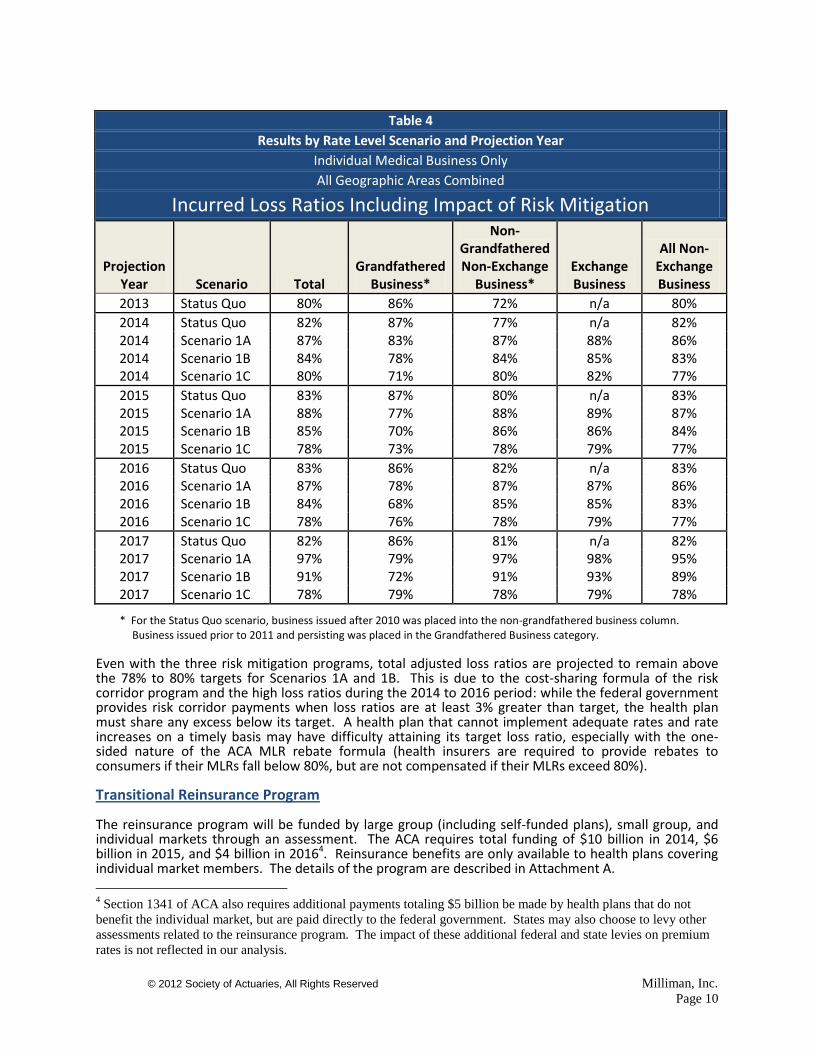
The health plans are projected to receive some relief from higher-than-target loss ratios in years 2014 through 2016 from the risk mitigation programs. This can be seen in Table 4 (below), which shows the loss ratios after inclusion of the impact of the risk mitigation programs. These programs allow health plans to sustain higher loss ratios through 2016. They also allow for lower premium rates from which consumers can benefit. However, it is not likely that lower premium rates and high loss ratios evident in Scenarios 1A and 1B, which limit premium increases, would be financially sustainable after 2016 when the risk corridor program ends. Table 4, below, summarizes the resulting loss ratios (including the impact of the risk mitigation programs) by rate level scenario, category of business, and projection year. Consistent with the previous table, these loss ratios are not on a basis that can enable the determination of rebates payable pursuant to the minimum loss ratio (MLR) requirements of ACA. MLRs include quality improvement expenses and certain reserve changes in the numerator and remove taxes and fees from the denominator.
© 2012 Society of Actuaries, All Rights Reserved Milliman, Inc.
Page 10
Table 4
Results by Rate Level Scenario and Projection Year
Individual Medical Business Only
All Geographic Areas Combined
Incurred Loss Ratios Including Impact of Risk Mitigation
Projection Year Scenario Total
Grandfathered Business*
Non-Grandfathered Non-Exchange
Business* Exchange Business
All Non-Exchange Business
2013 Status Quo 80% 86% 72% n/a 80%
2014 Status Quo 82% 87% 77% n/a 82% 2014 Scenario 1A 87% 83% 87% 88% 86% 2014 Scenario 1B 84% 78% 84% 85% 83% 2014 Scenario 1C 80% 71% 80% 82% 77%
2015 Status Quo 83% 87% 80% n/a 83% 2015 Scenario 1A 88% 77% 88% 89% 87% 2015 Scenario 1B 85% 70% 86% 86% 84% 2015 Scenario 1C 78% 73% 78% 79% 77%
2016 Status Quo 83% 86% 82% n/a 83% 2016 Scenario 1A 87% 78% 87% 87% 86% 2016 Scenario 1B 84% 68% 85% 85% 83% 2016 Scenario 1C 78% 76% 78% 79% 77%
2017 Status Quo 82% 86% 81% n/a 82% 2017 Scenario 1A 97% 79% 97% 98% 95% 2017 Scenario 1B 91% 72% 91% 93% 89% 2017 Scenario 1C 78% 79% 78% 79% 78%
* For the Status Quo scenario, business issued after 2010 was placed into the non-grandfathered business column. Business issued prior to 2011 and persisting was placed in the Grandfathered Business category.
Even with the three risk mitigation programs, total adjusted loss ratios are projected to remain above the 78% to 80% targets for Scenarios 1A and 1B. This is due to the cost-sharing formula of the risk corridor program and the high loss ratios during the 2014 to 2016 period: while the federal government provides risk corridor payments when loss ratios are at least 3% greater than target, the health plan must share any excess below its target. A health plan that cannot implement adequate rates and rate increases on a timely basis may have difficulty attaining its target loss ratio, especially with the one-sided nature of the ACA MLR rebate formula (health insurers are required to provide rebates to consumers if their MLRs fall below 80%, but are not compensated if their MLRs exceed 80%). Transitional Reinsurance Program The reinsurance program will be funded by large group (including self-funded plans), small group, and individual markets through an assessment. The ACA requires total funding of $10 billion in 2014, $6 billion in 2015, and $4 billion in 20164. Reinsurance benefits are only available to health plans covering individual market members. The details of the program are described in Attachment A.
4 Section 1341 of ACA also requires additional payments totaling $5 billion be made by health plans that do not
benefit the individual market, but are paid directly to the federal government. States may also choose to levy other
assessments related to the reinsurance program. The impact of these additional federal and state levies on premium
rates is not reflected in our analysis.

© 2012 Society of Actuaries, All Rights Reserved Milliman, Inc.
Page 11
Table 5 shows the net impact of the transitional reinsurance program on the individual market for each scenario.
Table 5
Transitional Reinsurance Program
Individual Medical Market
Benefits and Contributions (Assessments) by Projection Year within State Regulatory Grouping
($ billions)
Reinsurance Benefits Reinsurance Contributions
from Individual Market Net Reinsurance Subsidy
from Group Markets
Scenario 2014 2015 2016 2014 2015 2016 2014 2015 2016
1A $10.0 $6.0 $4.0 $1.3 $1.1 $0.8 $8.7 $4.9 $3.2
1B $10.0 $6.0 $4.0 $1.3 $1.1 $0.8 $8.7 $4.9 $3.2
1C $10.0 $6.0 $4.0 $1.3 $1.1 $0.8 $8.7 $4.9 $3.2
Total Individual Market Claims
before Mitigation Ratio of Net Reinsurance Subsidy
to Total Benefits
Scenario 2014 2015 2016 2014 2015 2016
1A $71.1 $117.3 $153.8 12% 4% 2%
1B $71.1 $117.8 $154.6 12% 4% 2%
1C $70.8 $115.9 $152.1 12% 4% 2%
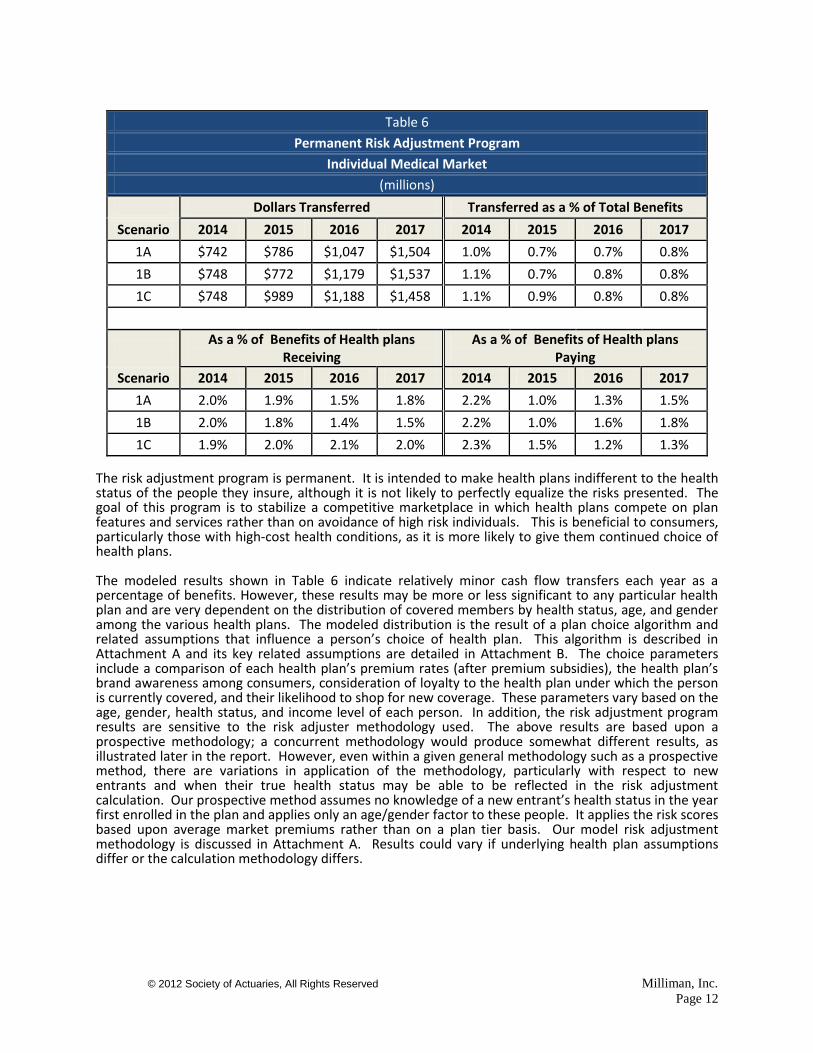
The net reinsurance subsidy ratio shown above is an indication of the claim relief the individual market is projected to receive. This subsidy can allow for premium rates to be set lower than they might otherwise be in anticipation of large claims. This can help stabilize premiums for consumers during the three years when the most market disruption is expected to occur. Each year when the reinsurance funds decline and then in 2017 when the program has ended, benefit trends will increase due to the effect of claims leveraging each year through the reduction of reinsurance subsidies. This trend leveraging needs be recognized by health plans and regulators alike in setting premium rates. See Attachment A for additional discussion on the reinsurance program. The ratio to total benefits shown above is an approximation for the impact on the numerator of the loss ratio. Risk Adjustment Program Table 6 shows the amount of money transferred each year through the risk adjustment program. This program is a “zero-sum game” in that the total amounts paid by health plans into the risk adjustment pool are received by other health plans each year. These scenarios are based upon a prospective model approach. A “concurrent” approach, which the HHS has indicated it will use for the federal model, is assumed for Scenario 5. The results for Scenario 5 are compared to those for Scenario 1 later in the report, and more information on how the two risk adjustment approaches differ is provided in Attachment A.
© 2012 Society of Actuaries, All Rights Reserved Milliman, Inc.
Page 12
Table 6
Permanent Risk Adjustment Program
Individual Medical Market
(millions)
Dollars Transferred Transferred as a % of Total Benefits
Scenario 2014 2015 2016 2017 2014 2015 2016 2017
1A $742 $786 $1,047 $1,504 1.0% 0.7% 0.7% 0.8%
1B $748 $772 $1,179 $1,537 1.1% 0.7% 0.8% 0.8%
1C $748 $989 $1,188 $1,458 1.1% 0.9% 0.8% 0.8%
As a % of Benefits of Health plans
Receiving As a % of Benefits of Health plans
Paying
Scenario 2014 2015 2016 2017 2014 2015 2016 2017
1A 2.0% 1.9% 1.5% 1.8% 2.2% 1.0% 1.3% 1.5%
1B 2.0% 1.8% 1.4% 1.5% 2.2% 1.0% 1.6% 1.8%
1C 1.9% 2.0% 2.1% 2.0% 2.3% 1.5% 1.2% 1.3%
The risk adjustment program is permanent. It is intended to make health plans indifferent to the health status of the people they insure, although it is not likely to perfectly equalize the risks presented. The goal of this program is to stabilize a competitive marketplace in which health plans compete on plan features and services rather than on avoidance of high risk individuals. This is beneficial to consumers, particularly those with high-cost health conditions, as it is more likely to give them continued choice of health plans. The modeled results shown in Table 6 indicate relatively minor cash flow transfers each year as a percentage of benefits. However, these results may be more or less significant to any particular health plan and are very dependent on the distribution of covered members by health status, age, and gender among the various health plans. The modeled distribution is the result of a plan choice algorithm and related assumptions that influence a person’s choice of health plan. This algorithm is described in Attachment A and its key related assumptions are detailed in Attachment B. The choice parameters include a comparison of each health plan’s premium rates (after premium subsidies), the health plan’s brand awareness among consumers, consideration of loyalty to the health plan under which the person is currently covered, and their likelihood to shop for new coverage. These parameters vary based on the age, gender, health status, and income level of each person. In addition, the risk adjustment program results are sensitive to the risk adjuster methodology used. The above results are based upon a prospective methodology; a concurrent methodology would produce somewhat different results, as illustrated later in the report. However, even within a given general methodology such as a prospective method, there are variations in application of the methodology, particularly with respect to new entrants and when their true health status may be able to be reflected in the risk adjustment calculation. Our prospective method assumes no knowledge of a new entrant’s health status in the year first enrolled in the plan and applies only an age/gender factor to these people. It applies the risk scores based upon average market premiums rather than on a plan tier basis. Our model risk adjustment methodology is discussed in Attachment A. Results could vary if underlying health plan assumptions differ or the calculation methodology differs.

© 2012 Society of Actuaries, All Rights Reserved Milliman, Inc.
Page 13
Risk Corridor Program The 3-year transitional risk corridor program, modeled after the Medicare Advantage program, provides health plans some protection against pricing risk due to the unknown mix of enrollees who might purchase coverage from them. If a health plan’s loss ratio for qualified plans, after adjustment for the reinsurance and risk adjustment programs, is higher than its target level, the government shares in the excess loss via a payment to the health plan, and if the adjusted loss ratio ends up lower than target, the health plan pays the government some of the windfall. The program is described more fully in Attachment A. Table 7 shows the projected net impact of the risk corridor program for Scenarios 1A, 1B, and 1C. A positive dollar amount in the table indicates the amount that the federal government will need to pay to the health plans and a negative amount is the amount that health plans will need to pay the federal government. Only Scenario 1C results in a payment to the government when all states are combined. As will be illustrated in the next section, this varies considerably by state regulatory grouping for each scenario.
Table 7
Risk Corridor Program
Individual Medical Market
Aggregate Net Payments by Projection Year within Rate Level Scenario
(millions)
Year Scenario Total All States
2014 Scenario 1A $9,115
2014 Scenario 1B $6,419
2014 Scenario 1C $ 994
2015 Scenario 1A $21,063
2015 Scenario 1B $16,517
2015 Scenario 1C ($ 980)
2016 Scenario 1A $23,321
2016 Scenario 1B $17,695
2016 Scenario 1C ($ 1,850)
The results highlight the interaction between the rate review process and the risk corridors. If the rate review process is overly restrictive and results in premiums that are not adequate to meet claims and expenses, federal payments under the risk corridor programs will be high to partially compensate for the inadequate premiums. Individual Market Results for Scenario 1 by Geographic Grouping for Varying Rate Level Scenarios The previous section of this report showed results for Scenario 1 by category of business (i.e. grandfathered, exchange and non-grandfathered/non-exchange). Tables 8A through 8F provide results for Scenario 1 under the three groupings of states with respect to rate increase assumptions, as described earlier.

© 2012 Society of Actuaries, All Rights Reserved Milliman, Inc.
Page 14
Enrollment by State Grouping
Table 8A
Results by Rate Level Scenario by Geographic Area
Individual Business
By Geographic Area
All Business Combined
Projection Year Scenario
Enrollment (000 omitted) Yearly Change in Enrollment
Most Restrictive
Average Restrictive
Least Restrictive
Most Restrictive
Average Restrictive
Least Restrictive
2013 Status Quo 1,474 5,004 8,117
2014 Status Quo 1,471 5,003 8,089 0% 0% 0%
2014 Scenario 1A 1,766 6,641 12,215 20% 33% 50%
2014 Scenario 1B 1,763 6,642 12,223 20% 33% 51%
2014 Scenario 1C 1,765 6,649 12,226 20% 33% 51%
2015 Status Quo 1,467 5,001 8,067 0% 0% 0%
2015 Scenario 1A 2,460 9,623 17,689 39% 45% 45%
2015 Scenario 1B 2,461 9,627 17,743 40% 45% 45%
2015 Scenario 1C 2,464 9,649 17,621 40% 45% 44%
2016 Status Quo 1,473 5,015 8,050 0% 0% 0%
2016 Scenario 1A 3,053 11,402 20,805 24% 18% 18%
2016 Scenario 1B 3,056 11,395 20,863 24% 18% 18%
2016 Scenario 1C 3,057 11,420 20,752 24% 18% 18%
2017 Status Quo 1,471 5,025 8,037 0% 0% 0%
2017 Scenario 1A 3,578 12,699 22,883 17% 11% 10%
2017 Scenario 1B 3,582 12,682 22,942 17% 11% 10%
2017 Scenario 1C 3,577 12,712 22,824 17% 11% 10%
The most restrictive regulatory states represent approximately 10% of the total individual insured population in year 2013 and drop slightly to 9% by 2017. It should be noted that we have assumed gradual entry of the uninsured population into the commercial insured markets over several years (see Table A-3 in Attachment A or Table B-12 in Attachment B for the assumed phase-in factors); these phase-in factors vary by geographic grouping and are lower in year 2014 for the most restrictive states. This results in the slower projected growth rate for these states. It also explains the slower projected growth rate in 2014 for the average restrictive area compared to the least restrictive.

© 2012 Society of Actuaries, All Rights Reserved Milliman, Inc.
Page 15
Average Annual Premium Changes by State Grouping
Table 8B shows results for average premium changes for each geographic grouping through year 2018. Readers should note that these are changes in average premiums in force and not necessarily the rate increases implemented. In addition to rate increases, they are impacted by changes in age, gender, and plan mix, which differ somewhat for each projection year, each geographic grouping, and each scenario. These increases also reflect base claims trend of 7.5% each year plus deductible leveraging impact.
Table 8B
Results by Rate Level Scenario by Geographic Area
Individual Business
By Geographic Area
All Business Combined
Projection Year Scenario
Annual Change in Avg. Premium Cumulative Avg. Premium Relativities
Most Restrictive
Average Restrictive
Least Restrictive
Most Restrictive
Average Restrictive
Least Restrictive
2013 Status Quo 1.00 1.00 1.00
2014 Status Quo 5.7% 8.2% 8.2% 1.06 1.08 1.08
2014 Scenario 1A 10.1% 11.9% 13.0% 1.10 1.12 1.13
2014 Scenario 1B 20.9% 21.1% 23.0% 1.21 1.21 1.23
2014 Scenario 1C 20.9% 32.7% 52.6% 1.21 1.33 1.53
2015 Status Quo 5.4% 8.4% 9.2% 1.11 1.17 1.18
2015 Scenario 1A 17.0% 18.1% 17.7% 1.29 1.32 1.33
2015 Scenario 1B 11.9% 18.2% 18.8% 1.35 1.43 1.46
2015 Scenario 1C 13.1% 31.9% 33.0% 1.37 1.75 2.03
2016 Status Quo 9.8% 9.8% 10.5% 1.22 1.29 1.31
2016 Scenario 1A 17.1% 19.2% 19.2% 1.51 1.57 1.59
2016 Scenario 1B 12.1% 18.9% 19.5% 1.52 1.70 1.75
2016 Scenario 1C 11.5% 13.1% 14.4% 1.52 1.98 2.32
2017 Status Quo 12.5% 11.3% 11.3% 1.38 1.43 1.45
2017 Scenario 1A 10.8% 19.3% 19.5% 1.67 1.88 1.89
2017 Scenario 1B 9.6% 18.1% 19.0% 1.66 2.01 2.08
2017 Scenario 1C 8.8% 10.2% 10.2% 1.66 2.18 2.56 While average premiums are currently considerably higher in the most restrictive state grouping than in the other two groupings, the changes in average premiums are projected to be lower in the most restrictive states than in the other two state groupings, in part because some ACA reforms are already in force in those markets and hence have little projected impact during the full transition to the ACA. As a result, premium differences across the geographic groupings narrow over time. The cumulative average premium relativities in Table 8B illustrate that cumulative increases through 2017 needed in Scenario 1C for average states are 31% higher (2.18/1.66 -1) than the most restrictive state grouping, and those for the least restrictive state grouping are 54% higher (2.56/1.66 -1).
© 2012 Society of Actuaries, All Rights Reserved Milliman, Inc.
Page 16
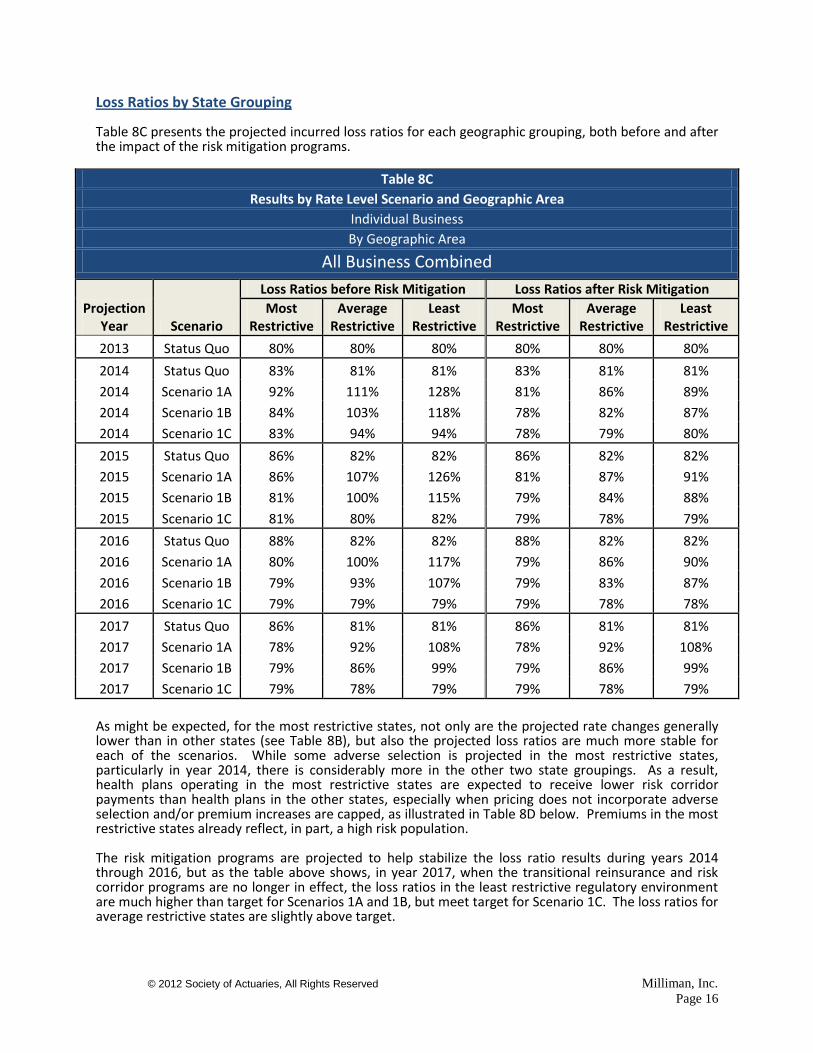
Loss Ratios by State Grouping Table 8C presents the projected incurred loss ratios for each geographic grouping, both before and after the impact of the risk mitigation programs.
Table 8C
Results by Rate Level Scenario and Geographic Area
Individual Business
By Geographic Area
All Business Combined
Projection Year Scenario
Loss Ratios before Risk Mitigation Loss Ratios after Risk Mitigation
Most Restrictive
Average Restrictive
Least Restrictive
Most Restrictive
Average Restrictive
Least Restrictive
2013 Status Quo 80% 80% 80% 80% 80% 80%
2014 Status Quo 83% 81% 81% 83% 81% 81%
2014 Scenario 1A 92% 111% 128% 81% 86% 89%
2014 Scenario 1B 84% 103% 118% 78% 82% 87%
2014 Scenario 1C 83% 94% 94% 78% 79% 80%
2015 Status Quo 86% 82% 82% 86% 82% 82%
2015 Scenario 1A 86% 107% 126% 81% 87% 91%
2015 Scenario 1B 81% 100% 115% 79% 84% 88%
2015 Scenario 1C 81% 80% 82% 79% 78% 79%
2016 Status Quo 88% 82% 82% 88% 82% 82%
2016 Scenario 1A 80% 100% 117% 79% 86% 90%
2016 Scenario 1B 79% 93% 107% 79% 83% 87%
2016 Scenario 1C 79% 79% 79% 79% 78% 78%
2017 Status Quo 86% 81% 81% 86% 81% 81%
2017 Scenario 1A 78% 92% 108% 78% 92% 108%
2017 Scenario 1B 79% 86% 99% 79% 86% 99%
2017 Scenario 1C 79% 78% 79% 79% 78% 79%
As might be expected, for the most restrictive states, not only are the projected rate changes generally lower than in other states (see Table 8B), but also the projected loss ratios are much more stable for each of the scenarios. While some adverse selection is projected in the most restrictive states, particularly in year 2014, there is considerably more in the other two state groupings. As a result, health plans operating in the most restrictive states are expected to receive lower risk corridor payments than health plans in the other states, especially when pricing does not incorporate adverse selection and/or premium increases are capped, as illustrated in Table 8D below. Premiums in the most restrictive states already reflect, in part, a high risk population. The risk mitigation programs are projected to help stabilize the loss ratio results during years 2014 through 2016, but as the table above shows, in year 2017, when the transitional reinsurance and risk corridor programs are no longer in effect, the loss ratios in the least restrictive regulatory environment are much higher than target for Scenarios 1A and 1B, but meet target for Scenario 1C. The loss ratios for average restrictive states are slightly above target.

© 2012 Society of Actuaries, All Rights Reserved Milliman, Inc.
Page 17
The premium rates underlying Table 8B are reflective of a target loss ratio of 78% to 80% for each of the geographic areas. However, actual experience in the most restrictive states, as measured by 2010 Supplementary Healthcare Exhibits, indicates considerably higher loss ratios. We have assumed that insurers will price at lower target levels than those experienced, resulting in higher premiums. If regulators restrict such increases, then premiums will be lower than modeled, and the loss ratios shown in Table 8C (above) will be higher. Chart 1 shows the relationships between average rate changes shown in Table 8B and loss ratios shown in Table 8C for Scenario 1C. Charts for the other two scenarios are included in Attachment C.

© 2012 Society of Actuaries, All Rights Reserved Milliman, Inc.
Page 18
Transitional Risk Corridor Results by State Grouping Table 8D presents the aggregate net payments from the risk corridor program by regulatory environment. The federal government is projected to pay significant amounts each year under Scenarios 1A and 1B (in which rate increases are restricted), but receives funds under Scenario 1C after 2014. The projected effect of the risk corridor program varies considerably by regulatory environment. The most restrictive states are projected to be required to pay the government, while the less restrictive states are projected to receive funds from the government in all but Scenario 1C in which health plans can price to their target loss ratios. When premium increases are limited, the least restrictive states are projected to receive considerable funds relative to the other state groupings because they are most affected by the ACA reforms.
Table 8D
Transitional Risk Corridor Program Results by Rate Level Scenario and Geographic Area
Individual Business
Aggregate Net Payments* by Projection Year within Rate Level Scenario and State Regulatory Grouping
(millions)
Year Scenario Most Restrictive State Grouping
Average Restrictive State
Grouping Least Restrictive State Grouping Total All States
2014 Scenario 1A $ 85 $1,874 $7,156 $9,115
2014 Scenario 1B ($429) $1,231 $5,618 $6,419
2014 Scenario 1C ($450) $ 285 $1,159 $ 994
2015 Scenario 1A $ 244 $5,086 $15,733 $21,063
2015 Scenario 1B ($242) $3,789 $12,970 $16,517
2015 Scenario 1C ($273) ($528) ($179) ($980)
2016 Scenario 1A ($145) $5,338 $18,128 $23,321
2016 Scenario 1B ($384) $3,746 $14,333 $17,695
2016 Scenario 1C ($340) ($ 610) ($900) ($1,850)
* A positive number indicates payments from the federal government to the health plans, while a negative number indicates amounts to be paid by health plans to the federal government under the risk corridor program.
© 2012 Society of Actuaries, All Rights Reserved Milliman, Inc.
Page 19
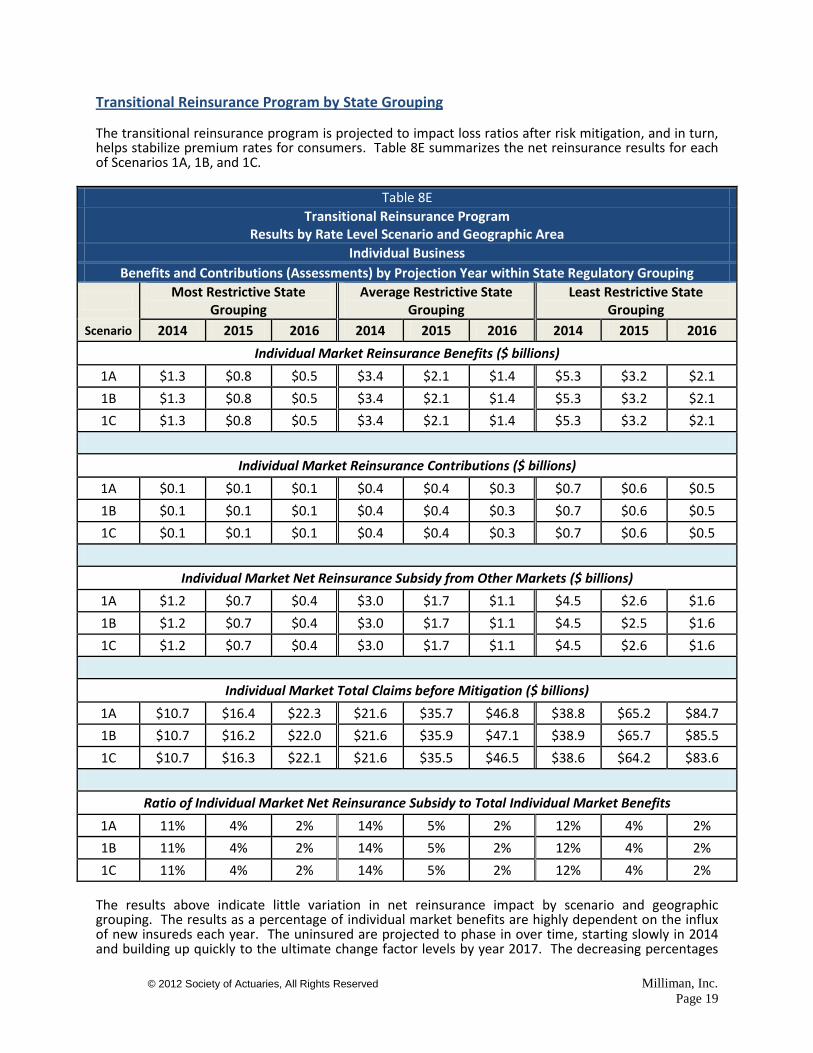
Transitional Reinsurance Program by State Grouping
The transitional reinsurance program is projected to impact loss ratios after risk mitigation, and in turn, helps stabilize premium rates for consumers. Table 8E summarizes the net reinsurance results for each of Scenarios 1A, 1B, and 1C.
Table 8E
Transitional Reinsurance Program Results by Rate Level Scenario and Geographic Area
Individual Business
Benefits and Contributions (Assessments) by Projection Year within State Regulatory Grouping
Most Restrictive State
Grouping Average Restrictive State
Grouping Least Restrictive State
Grouping
Scenario 2014 2015 2016 2014 2015 2016 2014 2015 2016
Individual Market Reinsurance Benefits ($ billions)
1A $1.3 $0.8 $0.5 $3.4 $2.1 $1.4 $5.3 $3.2 $2.1
1B $1.3 $0.8 $0.5 $3.4 $2.1 $1.4 $5.3 $3.2 $2.1
1C $1.3 $0.8 $0.5 $3.4 $2.1 $1.4 $5.3 $3.2 $2.1
Individual Market Reinsurance Contributions ($ billions)
1A $0.1 $0.1 $0.1 $0.4 $0.4 $0.3 $0.7 $0.6 $0.5
1B $0.1 $0.1 $0.1 $0.4 $0.4 $0.3 $0.7 $0.6 $0.5
1C $0.1 $0.1 $0.1 $0.4 $0.4 $0.3 $0.7 $0.6 $0.5
Individual Market Net Reinsurance Subsidy from Other Markets ($ billions)
1A $1.2 $0.7 $0.4 $3.0 $1.7 $1.1 $4.5 $2.6 $1.6
1B $1.2 $0.7 $0.4 $3.0 $1.7 $1.1 $4.5 $2.5 $1.6
1C $1.2 $0.7 $0.4 $3.0 $1.7 $1.1 $4.5 $2.6 $1.6
Individual Market Total Claims before Mitigation ($ billions)
1A $10.7 $16.4 $22.3 $21.6 $35.7 $46.8 $38.8 $65.2 $84.7
1B $10.7 $16.2 $22.0 $21.6 $35.9 $47.1 $38.9 $65.7 $85.5
1C $10.7 $16.3 $22.1 $21.6 $35.5 $46.5 $38.6 $64.2 $83.6
Ratio of Individual Market Net Reinsurance Subsidy to Total Individual Market Benefits
1A 11% 4% 2% 14% 5% 2% 12% 4% 2%
1B 11% 4% 2% 14% 5% 2% 12% 4% 2%
1C 11% 4% 2% 14% 5% 2% 12% 4% 2%
The results above indicate little variation in net reinsurance impact by scenario and geographic grouping. The results as a percentage of individual market benefits are highly dependent on the influx of new insureds each year. The uninsured are projected to phase in over time, starting slowly in 2014 and building up quickly to the ultimate change factor levels by year 2017. The decreasing percentages

© 2012 Society of Actuaries, All Rights Reserved Milliman, Inc.
Page 20
of net reinsurance payments are due to a combination of this phase-in of uninsureds and the reduction of the amounts required by ACA to be contributed to the program (i.e. $10 billion in year 2014, $6 billion in 2015, and $4 billion in 2016). The funding was allocated among the three state groupings based upon members covered in the individual and commercial group markets (including self-funded plans and grandfathered business). The funding can only be used for eligible claims of non-grandfathered individual members. Risk Adjustment Program by State Grouping Table 8F summarizes the risk adjustment results for each of Scenarios 1A, 1B, and 1C.
Table 8F
Permanent Risk Adjustment Program
Individual Medical Market
(millions)
Dollars Transferred
Most Restrictive State Grouping Average Restrictive State
Grouping Least Restrictive State Grouping
Scenario 2014 2015 2016 2017 2014 2015 2016 2017 2014 2015 2016 2017
1A $68 $ 80 $130 $314 $173 $219 $300 $360 $500 $487 $616 $830
1B $60 $130 $257 $210 $216 $158 $246 $359 $473 $483 $676 $968
1C $77 $ 68 $170 $234 $178 $292 $284 $373 $493 $629 $734 $851
Transferred as a % of Total Individual Market Benefits
Most Restrictive State Grouping Average Restrictive State
Grouping Least Restrictive State Grouping
Scenario 2014 2015 2016 2017 2014 2015 2016 2017 2014 2015 2016 2017
1A 0.6% 0.5% 0.6% 1.1% 0.8% 0.6% 0.6% 0.6% 1.3% 0.7% 0.7% 0.8%
1B 0.6% 0.8% 1.2% 0.7% 1.0% 0.4% 0.5% 0.6% 1.2% 0.7% 0.8% 0.9%
1C 0.7% 0.4% 0.8% 0.8% 0.8% 0.8% 0.6% 0.7% 1.3% 1.0% 0.9% 0.8%
As a % of Individual Market Benefits of Health Plans Receiving
Most Restrictive State Grouping Average Restrictive State
Grouping Least Restrictive State Grouping
Scenario 2014 2015 2016 2017 2014 2015 2016 2017 2014 2015 2016 2017
1A 1.1% 1.6% 1.5% 2.8% 1.0% 2.1% 2.0% 2.0% 3.4% 1.9% 1.3% 1.5%
1B 1.0% 2.6% 2.7% 2.0% 1.3% 1.1% 1.3% 1.3% 3.4% 2.1% 1.3% 1.5%
1C 1.3% 1.1% 2.0% 1.9% 1.1% 1.9% 1.4% 1.7% 3.1% 2.2% 2.6% 2.2%
As a % of Individual Market Benefits of Health Plans Paying
Most Restrictive State Grouping Average Restrictive State
Grouping Least Restrictive State Grouping
Scenario 2014 2015 2016 2017 2014 2015 2016 2017 2014 2015 2016 2017
1A 1.5% 0.7% 1.0% 1.9% 3.6% 0.9% 0.9% 0.9% 2.1% 1.2% 1.6% 1.8%
1B 1.4% 1.2% 2.0% 1.2% 4.0% 0.7% 0.9% 1.2% 1.9% 1.1% 2.1% 2.5%
1C 1.7% 0.7% 1.3% 1.5% 3.6% 1.4% 1.1% 1.1% 2.2% 1.8% 1.3% 1.4%

© 2012 Society of Actuaries, All Rights Reserved Milliman, Inc.
Page 21
The results shown in Table 8F show some variation by state grouping. As mentioned earlier during the discussion of the nationwide results (see the discussion following Table 6), the risk adjustment flow of funds is highly dependent on how health plans position themselves relative to each other in the marketplace and how people perceive each health plan. The fact that the results differ from one state grouping to another is primarily indicative of differences between the health plans participating in a particular state grouping. The change within a state grouping from one year to another is due to movement on a guaranteed issue basis by individuals of varying risk scores based upon the plans and rates being offered in that year. Again, this membership migration from one health plan to another is dependent on numerous factors specific to each individual, including age, gender, health status, income level, brand loyalty, brand awareness, eligibility for federal premium subsidies, and, of course, the relative premium rates being offered for each plan. Where the percentages relative to benefits incurred for those health plans receiving risk adjustment payments are greater than that for those paying, it is indicative that less healthy risks are concentrated in fewer health plans and possibly those with the greatest membership. Where the relationship is reversed, there are a few carriers with healthy membership providing risk adjustment payments to the other health plans with greater than average health risk scores.

© 2012 Society of Actuaries, All Rights Reserved Milliman, Inc.
Page 22
Individual Market Results – Varying Exchange/Risk Mitigation Scenarios
As mentioned earlier, in addition to a status quo scenario, we modeled five different scenarios varying by several criteria: the number of health plans that participate in and outside of the exchanges; plan requirements for the exchanges; the presence of an ACA Basic Health Program; and the risk adjuster method used. These scenarios are described in Table 11 of this report. Table 9 summarizes the results of each of these five scenarios, along with the status quo scenario, for all modeled individual health plans combined. These are all reflective of a rate level scenario in which premium rates are based only on the prior year’s experience without adjustment for anticipated adverse selection and capped at 20% per year (as was previously described for Scenario 1A).
Table 9
Results by Exchange/3Rs Scenario and Projection Year
Individual Business
All Geographic Areas Combined
All Health Plans Combined
Projection Year Scenario
Enrollment (000)
Premium ($millions)
Average Premium
Loss Ratio w/o Risk
Mitigation
Loss Ratio w/ Risk
Mitigation
Net Risk Mitigation ($millions)
2013 Status Quo 14,594 $39,764 $2,725 79.9% 79.9% n/a
2014 Status Quo 14,563 $42,708 $2,933 81.6% 81.6% n/a
2014 Scenario 1 20,622 $61,431 $2,979 115.7% 86.7% $17,831
2014 Scenario 2 20,619 $60,439 $2,931 115.5% 86.7% $17,381
2014 Scenario 3 20,614 $61,486 $2,983 115.3% 86.6% $17,629
2014 Scenario 4 18,140 $55,309 $3,049 113.5% 85.8% $15,321
2014 Scenario 5 20,641 $61,683 $2,988 115.1% 86.6% $17,585
2015 Status Quo 14,535 $46,070 $3,170 82.7% 82.7% n/a
2015 Scenario 1 29,772 $103,965 $3,492 112.8% 87.8% $25,995
2015 Scenario 2 29,795 $102,154 $3,429 112.5% 87.8% $25,173
2015 Scenario 3 29,828 $104,350 $3,498 112.1% 87.7% $25,542
2015 Scenario 4 25,790 $92,286 $3,578 110.7% 87.2% $21,672
2015 Scenario 5 29,731 $104,226 $3,506 112.2% 87.7% $25,509
2016 Status Quo 14,538 $50,779 $3,493 83.2% 83.2% n/a
2016 Scenario 1 35,259 $147,084 $4,171 104.6% 86.5% $26,502
2016 Scenario 2 35,278 $144,088 $4,084 104.6% 86.7% $25,742
2016 Scenario 3 35,321 $147,598 $4,179 104.0% 86.4% $26,049
2016 Scenario 4 30,237 $129,172 $4,272 103.0% 86.1% $21,780
2016 Scenario 5 35,202 $147,502 $4,190 104.0% 86.4% $25,950
2017 Status Quo 14,534 $56,631 $3,897 82.3% 82.3% n/a
2017 Scenario 1 39,160 $193,513 $4,942 97.0% 97.0% $0
2017 Scenario 2 39,167 $189,479 $4,838 97.1% 97.1% $0
2017 Scenario 3 39,214 $194,049 $4,948 96.6% 96.6% $0
2017 Scenario 4 33,541 $169,632 $5,057 95.7% 95.7% $0
2017 Scenario 5 39,119 $194,111 $4,962 96.7% 96.7% $0

© 2012 Society of Actuaries, All Rights Reserved Milliman, Inc.
Page 23
Net risk mitigation reflects the sum of the net reinsurance and risk corridor transfer payments received by the health plans. The risk adjustment program payments net to zero ($0) since the program is designed such that payments from the program equal contributions into the program each year. The results do not vary significantly by scenario, except for Scenario #4, which includes the presence of an ACA Basic Health program. The enrollment in the Basic Health Program is not included in the results shown above, which explains why it has lower enrollment and total premium revenue than the other scenarios. Another of the differences between these scenarios is the risk adjustment methodology that is used. All the scenarios except for Scenario 5 use a prospective methodology. Scenario 5 uses a concurrent methodology. The difference between these methods is described in Attachment A. Table 10 presents a comparison of the payment transfer results for Scenarios 1 and 5, which are identical except for their risk adjustment method.
Table 10
Permanent Risk Adjustment Program
Individual Medical Market Comparison of Prospective Method (Scenario 1) to Concurrent Method (Scenario 5)
(millions)
Dollars Transferred Transferred as a % of Total Benefits
Scenario 2014 2015 2016 2017 2014 2015 2016 2017
Scenario 1 $742 $786 $1,047 $1,504 1.0% 0.7% 0.7% 0.8%
Scenario 5 $775 $1,111 $1,317 $1,687 1.1% 1.0% 0.9% 0.9%
As a % of Benefits of Health plans
Receiving As a % of Benefits of Health plans
Paying
Scenario 2014 2015 2016 2017 2014 2015 2016 2017
Scenario 1 2.0% 1.9% 1.5% 1.8% 2.2% 1.0% 1.3% 1.5%
Scenario 5 3.1% 2.5% 1.7% 1.9% 1.7% 1.5% 1.7% 1.7%
The results show only some minor variation. While the concurrent method resulted in less dollars being transferred in year 2014 than the prospective method, the opposite is true for subsequent years. The reader should however not draw a general conclusion that this will always be the case. It is dependent on our model assumptions and the risk adjustment formulas being used, as described in Attachment A.

© 2012 Society of Actuaries, All Rights Reserved Milliman, Inc.
Page 24
SCENARIOS MODELED
Initial Scenarios In addition to a status quo scenario that assumed the ACA reforms for 2014 and beyond do not go into effect, the following five scenarios were modeled for the analyses presented in this report. Each was modeled separately by three Regulatory Environments (Most Restrictive States, Average Restrictive States, and Least Restrictive States). The states in each Regulatory Environment are summarized in Table B-2 of Attachment B. For Scenario 1, we also modeled three rate level scenarios. The other scenarios reflect only the “A” rate increase assumptions (i.e. rate increases based only on prior experience without adjustment for anticipated adverse selection and with a 20% annual maximum). Tables 11 and 13 present the various scenarios selected for modeling. Table 11 lists characteristics that are common to all the scenarios. Table 13 shows those characteristics that vary among the six scenarios. There are countless potential scenarios that could be modeled, but there are also realistic limitations on the number of scenarios that can reasonably be modeled due to time, budget, and presentation constraints. The scenarios tested were chosen to measure specific incremental changes to certain characteristics of the reformed health insurance industry. Assumptions common to all scenarios include the following:
* The Reinsurance Program and Risk Corridor program do not apply to the Status Quo scenario.
Several of the above characteristics are further described as follows: 1. Individual/SG Markets: States are allowed to keep their individual and small group markets as
separate markets or as merged markets. A key aspect of a merged market is that premium rates
Table 11 COMMON SCENARIOS CHARACTERISTICS
Scenario Characteristic All Scenarios* 1. Individual/SG Markets Separate markets and exchanges
2. Premium Rate Development
a. Rate Levels Based on Past Experience Only
b. Rate Increase Caps 20%
c. Rate Reduction Limits 0%
3. Reinsurance Program
a. Payment Method Based on Actual Incurred Claims
b. Contribution Method Allocated per member c. Attachment Point $50,000
d. Coinsurance 20%
e. Benefit Cap None
4. Risk Corridor Calculation
a. Calculation Method Target MLR = 1- Admin Load
b. Application Each QHP in or out of Exchange
5. Modeled Health Plan Types See Attachment B for a listing of health plan types 6. Plans Offered by each Health
Plan See Attachment B for a listing of plan types being modeled
7. Geographic Area Splits 3 Separate areas: 1) Most Restricted States; 2) Average Restricted States; and, 3) Least Restrictive States. Table B-2 in Attachment B shows which states have been assigned to each area grouping.

© 2012 Society of Actuaries, All Rights Reserved Milliman, Inc.
Page 25
would be based on the pooled experience of both a health plan’s individual business and small group business. This could result in different premium rates than if the markets were not merged, which in turn can affect the dollars of subsidy a person might receive since the premium rates for the second lowest Silver plan might be higher or lower than that of a non-merged market. A merged market can also have implications about a health plan’s ability to manage its rates for MLR purposes since rate determination is pooled, but MLR rebate determination is based on the separate experience of each of the two markets. However, given our limitations in the number of scenarios that were feasible to run, we have only run scenarios reflecting separate markets since it is our understanding that most states will keep the markets separate.
2. Premium Rate Development: The premium rate development algorithm of the model determines each subsequent year’s premium rates based upon the prior year’s claims experience. In years 2014 and later, the experience of all the individual products is pooled to determine the premiums for each plan. No provision for future adverse selection is reflected in any of these five initial scenarios. The resulting rate changes are also limited to no more than 20% per year. These are assumptions that significantly affect the sensitivity of the results, as will be shown by varying these restrictions for Scenario #1, as described earlier in the report.
3. The Reinsurance Program: ACA introduces a transitional reinsurance program for years 2014
through 2016. HHS has issued a final rule that indicates that the funding will be based on member counts and benefits will be based on claim dollars, irrespective of whether the claimant had a specific condition. Attachment A provides additional description of the reinsurance program.
States will have considerable flexibility in determining the cost-sharing provisions of the program in terms of the attachment point, coinsurance, out-of-pocket limit, and benefit cap. For this report, a $50,000 attachment point with 20% coinsurance without cap is assumed for all scenarios. However, it should be noted that the reinsurance program is not intended to replace the excess-of-loss reinsurance health plans purchased in today’s marketplace. In particular, the total program is funded only up to $10 billion in 2014, $6 billion in 2015, and $4 billion in 2016. Traditional reinsurance currently used by many health plans will continue to be needed due to the transitional nature of this program and the limited amount of coverage available through the ACA program.
4. The Risk Corridor Program: The transitional risk corridor program, which also is in effect from year 2014 to 2016, has a formula that is replicated in the model. We assume the target claims are consistent with minimum MLR levels. The formula is applied on a QHP level consistent with the final regulation. We have assumed that only plans sold outside of the exchange that have a corresponding plan sold within the exchange are QHPs, along with all plans sold through the exchange.
5. Modeled Health Plan Types: The Milliman health care reform model has the feature of being able to simulate the competitive marketplace among health plans. We have modeled nine different types of health plans that typically operate in the individual marketplace. The characteristics of these health plan types vary in terms of their current approaches to medical underwriting, the level of provider discounts they receive, the expense and risk loads they reflect in their premium rates, and their rating methodologies. See Attachment B for various assumptions used for the health plan types.
6. Description of Plans Offered by Each Health Plan: We have also modeled health plan types
differently in terms of their strategies for exchange participation and plans to be offered within and outside of the exchange starting in year 2014. The plans modeled each represent one of the metal tiers. Some health plan types offer all of them; others are selective as to which of the four metal plans they offer and may vary offering between what is sold in the exchange and outside of the exchange. See Table B-18 in Attachment B for the details assumed.

© 2012 Society of Actuaries, All Rights Reserved Milliman, Inc.
Page 26
7. Geographic Area Splits: We characterized each state as being more restrictive, less restrictive, or at an average regulatory level for the individual market. These characterizations were based on research we prepared and on our judgment. They are reflective of our assessment of the states based upon each state’s regulatory environment as of 2010. Others might categorize the states differently than we have for this study. The three geographic groupings of states are listed in the following table.
Table 12
STATE REGULATORY GROUPINGS
Regulatory Environment* States
MR - Most Restrictive MA, ME, NJ, NY, VT
AR - Average Restrictive
AL, CT, DE, FL, IA, ID, KS, KY, LA, MI, MN, MS, MT, NE, NH, NM, NV, OR, PA, RI, SC, SD, UT, WA
LR - Least Restrictive
AK, AR, AZ, CA, CO, DC, GA, HI, IL, IN, MD, MO, NC, ND, OH, OK, TN, TX, VA, WI, WV, WY
* based on the regulatory environment of the individual market
Table 13 shows key characteristics that differentiate the scenarios.
Each row in the table is further described as follows: 1. Basic Health Plan: the Basic Health Plan is an option offered by ACA to each state. The program is
for people between 138% of the Federal Poverty Level (FPL) and 200% FPL. It is intended to be a bridge between Medicaid and the individual exchange for those people who tend to move in and out of Medicaid eligibility. The state receives 95% of the premium and benefit subsidies that the BHP members would have qualified for if they were in the federally subsidized exchange. Scenario #4 reflects adoption of the BHP. In all other respects, it is identical to Scenario #1.
2. Exchange Rules: This is intended to characterize the type of exchange that a state might develop. An “open exchange” is one in which any willing health plan can market its plans through the exchange with relatively few restrictions. A “restricted exchange” is one that requires an increased
Table 13 SCENARIOS MODELED
Scenario Characteristic Status Quo Scenario 1 Scenario 2 Scenario 3 Scenario 4 Scenario 5
1. Basic Health Plan None None None None Yes None
2. Exchange Rules
a. Health Plan qualification N/A Open Restricted Open Open Open
b. Product limits N/A Any QHP Each metal Each metal Any QHP Any QHP
3. Modeled Health Plan Count 9 9 9 9 9 9
a. In Exchange Only N/A 3 1 2 3 3
b. Outside Exchange Only 9 1 6 2 1 1
c. Both in and out N/A 5 2 5 5 5
4. Risk Adjuster Method None Prospective Prospective Prospective Prospective Concurrent

© 2012 Society of Actuaries, All Rights Reserved Milliman, Inc.
Page 27
level of qualification criteria to be met before allowing a health plan to participate in the exchange. Fewer health plans are expected to participate in a restricted exchange.
Exchanges may also have certain requirements regarding what plans a health plan must offer. We have reflected those that allow any qualified health plan (QHP) the health plan chooses to be marketed through the exchange. Other exchanges could conceivably require a health plan to offer each type of metal tier5 plan if it wishes to participate on the exchange. This restriction could affect the number of health plans willing to participate on the exchange. Scenarios #2 and #3 differ from Scenario #1 in these respects.
3. Modeled Health Plan Count: Based on the health plan qualifications described in row 2a, we have varied the number of health plans in the model as to whether they sell their products only through the exchange, only outside of the exchange, or through both in and outside of the exchange.
4. Risk Adjuster Method: As of the date of when our scenarios were determined, there had been no decision by HHS as to what methodology should be used for the Risk Adjustment program required by ACA to be implemented. Our scenarios use a prospective method, except for Scenario #5 which uses a concurrent method, but is identical to Scenario #1 in all other respects. A description of the “prospective” and “concurrent” methods is presented in Attachment C.
Additional Scenarios In addition to the five reform scenarios indicated above, we also ran what we refer to as a “status quo” scenario. This scenario reflects the situation under the assumption that none of the future ACA reforms are implemented. This scenario allows us to measure the impact of the ACA reforms in any given projection year. This scenario provides a baseline projection against which changes due solely to the implementation of ACA can be measured. In reviewing the preliminary results of the projections, we found that the key assumptions resulting in the most variability of the risk adjustment programs, particularly the risk corridor program, were the health plans’ assumptions as to the level of rate increase needed, their requests for rate increases, and the approvals of the filed rate changes. Depending on the level of market disruption that a health plan takes into account in its rate development process and the subsequent approval of such requested rates, the risk mitigation programs may not be adequate to ensure that plans are being compensated for the risk that they actually end up bearing. The market disruption may result from adverse selection, the level of expected claims for the currently uninsured population, the volatility of a health plan’s membership (switching to other plans), competitors' strategic reactions (e.g. rates and marketing approaches), and other key assumptions in pricing. This led us to add several additional scenarios related to differing rate level assumptions, as discussed earlier, for Scenario 1. The rate level scenarios illustrated are the following:
Status Quo: Reflects expected results as if the 2014 ACA reforms are not implemented. Rate increases for this scenario are uncapped.
Scenario 1A: Reflects expected results for implementation of 2014 ACA reforms, no anticipated adverse selection for years 2014 and later, and a 20% maximum rate increase (excluding increases for age and benefit changes).
Scenario 1B: Reflects expected results for implementation of 2014 ACA reforms, includes pricing for anticipated adverse selection for years 2014 -2016, but with a 20% maximum rate increase (excluding increases for age and benefit changes).
Scenario 1C: Reflects expected results for implementation of 2014 ACA reforms, includes pricing for anticipated adverse selection for years 2014 - 2016, with no maximum rate increase.
5 “Metal tier” plan refers to a health plan with one of the levels of coverage defined by §1302(d)(1) of ACA. Four
levels of coverage are described in this section of the law and described as Bronze, Silver, Gold, and Platinum.

© 2012 Society of Actuaries, All Rights Reserved Milliman, Inc.
Page 28
SIMPLIFYING ASSUMPTIONS
The following are certain simplifying assumptions used in the projection system model:
1. Assumes that employer groups in excess of 100 employees are all insured through a single health plan. This assumption was made in recognition that the focus of the analysis was on the small group and individual markets which are the ones most affected by the ACA reforms.
2. Requires that all movements and change decisions occur either at the end of a projection year or at the beginning of a projection year. No changes within the year are assumed to occur.
3. Does not explicitly reflect the impact of the minimum loss ratio requirement of ACA. This is implicitly reflected by the choice of pricing targets for the affected lines of business.
4. Changes in job status are not projected.
5. Changes in employer size are not included, other than for deaths.
6. Assumes only one plan is offered by a given employer.
7. Does not permit an employee to switch to spouse’s coverage from own employee’s coverage, or vice versa, due to data and assumption limitations.
8. Assumes there is no movement from between the self-funded group market to a fully insured arrangement and vice versa. The system can model such movements, but such change factors were not available to model such movements.
9. Uses a fixed set of up to five plan benefit designs for all the health plans within a market. These have been chosen to represent the actuarial values required for each of the ACA metal plans, even for projection years prior to 2014. As such, the projection results do not capture any rate increases due to having to move from a non-qualified plan to one that meets the minimum 60% actuarial value requirement.
10. Excludes the cost and impact of supplemental and ancillary coverages such as mini-meds, LTC, disability income, accident, cancer and critical illness plans.
11. Makes no provision for reflecting the presence and impact of HSA and HRA accounts and contributions made to such accounts by employers and individuals.
12. Does not allow individual family members to switch to a non-family plan, except for those newly eligible for Medicare or reaching the child dependent limiting age. However, it does allow for individual family members to separate from the family in market switching scenarios.
13. Is not an econometric model. The number of employers is assumed to be constant (i.e. new employers offset business failures). Also, while the number of employees for a given employer may change due to deaths and other assumptions, the system does not model fluctuations in employee sizes due to business reasons.
14. Does not reflect the impact of ACA on Medicare Advantage and Medicare Part D plans, nor does it model the impact on Medicaid, other than movement to Medicaid due to new expanded eligibility rules effective in year 2014. Does not reflect the potential for individuals to switch between individual and Medicaid as economic status changes. This is also true of the Basic Benefit Plan modeled in Scenario #4.
15. Does not reflect SHOP Exchange employee choice.
16. Does not reflect the impact of MLR waivers granted to certain states.

© 2012 Society of Actuaries, All Rights Reserved Milliman, Inc.
Page 29
17. Does not reflect the potential range of take-up factors that may be experienced in some states, caused by the range of individual economic conditions, the range of products offered in the market, and other factors.
18. Does not reflect delivery system issues, such as provider access. LIMITATIONS, CAVEATS AND RELIANCE It should be noted that the choice of scenarios was constrained by available time and budget. Our results do illustrate the potential impact on premiums, enrollment, and other key metrics of variations in some key assumptions, but they do not represent the full range of possible outcomes. This is also partially attributable to our current incomplete knowledge of the ultimate choices that will be made by regulators, as well as choices made by health plans, employers, providers, and citizens. The results of our analysis are projections, not predictions, and they are dependent upon the set of assumptions that is used. The results are likely to vary if a different set of assumptions is used. It is very likely that future experience will not exactly conform to these projected results. We have conducted limited sensitivity testing of our results to changes in assumptions. As expected for as complex a system as we are attempting to model, changes in some assumptions can produce significant changes in results, due to the interrelationships of factors influencing the results. It is possible that actual results will be outside the range we have shown. We have relied on various sources for data and information upon which the underlying assumptions have been developed. In many cases there has not been adequate experience data upon which to develop assumptions, and we have had to rely on judgment. The analyses are based upon our understanding and interpretation of ACA and its related regulations. At the time we did the analyses for this report, the government had not issued final regulations related to many of the reforms to be effective starting in the year 2014. Furthermore, interim regulations issued are likely to be amended in some fashion in the future. We also note that states will be allowed some flexibility in varying certain aspects of the 3Rs, Exchange operations and requirements, and other provisions of ACA, which may impact results differently than what has been presented. Note that the authors are not attorneys, and that Milliman does not provide legal advice to clients. Milliman advises reader not to take any action solely in reliance on this report. Any of the results presented could prove to be different for any one state or health plan.
ACKNOWLEDGMENTS The authors would like to acknowledge and thank the Society of Actuaries for the opportunity to conduct this study on its behalf. We also wish to recognize and thank the SOA Project Oversight Group (POG) and the SOA staff members for their active participation in the design of the study and for the considerable time and effort they dedicated in reviewing the report and its results and in providing helpful feedback and suggestions that made the report all the more valuable to its readers.

© 2012 Society of Actuaries, All Rights Reserved Milliman, Inc.
Page A-1
Attachment A
ABOUT THE HCRFM
Introduction The Milliman Health Care Reform Financing Model (HCRFM) was developed by Milliman, Inc. (Milliman) to assist clients with an assessment of the potential impact of a particular health care reform requirement to be evaluated. The creation of HCRFM is the result of a collaborative effort among numerous Milliman consultants in various Milliman offices. The HCRFM models the potential costs and movements of individuals and the interaction between competing medical cost payers and providers within and between the various insurance markets that comprise the U.S. health care system for a given proposed health care financing scheme.
Modeling includes provision for:
Seriatim projection of each census record, including differentiation by age, gender, income
status, and health status. For these projections, we have used a random sample of 10% of a census file which represents all 300 million people in the United States.
Twelve (12) different market segments, each with its own set of demographic, change factor,
health care cost, and premium rate determination assumptions. The market segments being used are the following:
Table A-1 MARKET SEGMENT MODELED
1. Individual
2. State/Federal High Risk Programs
3. Uninsured
4. Small Group : 1 - 10 employees
5. Small Group : 11 - 25 employees
6. Small Group : 26 - 50 employees
7. Group : 51 - 100 employees
8. Group : 101 - 999 employees
9. Group: 1000+
10. Medicaid
11. Medicare
12. Basic Health Program
While we are modeling 12 different markets, our focus is almost entirely on the individual market, which is subject to the risk mitigation programs. Some people in other markets move out of those markets into one of the other markets, including the individual market place. Others in the individual market may move into one of the other markets. In particular, there is considerable movement from the uninsured market into the individual market and the Medicaid market. People in the commercial markets who become Medicare eligible are assumed to move to the Medicare market. See Attachment A for a listing of the assumed movement factors from one market to another.

© 2012 Society of Actuaries, All Rights Reserved Milliman, Inc.
Page A-2
Nine (9) different health plan types within each commercial market segment were modeled. These are characterized as shown in Table A-2.
Table A-2
HEALTH PLAN TYPES MODELED
1. Single State Health plan
2. National Health plan group #1
3. National Health plan group #2
4. HMO/Local Health plan #1
5. HMO/Local Health plan #2
6. Local/Regional Health plan #1
7. Local/Regional Health plan #2
8. Non-Profit COOP*
9. Multi-State OPM Plan* * New health plans entering in year 2014
Up to 5 different benefit plan designs per health plan within each market segment for
grandfathered plans; up to another 5 for exchange plans, and up to 5 more for non-grandfathered/non-exchange plans. The plans chosen reflect the metallic plans offered by each health plan type for each of these categories.
This model includes results from 2010 through 2017. We show results from 2013 through 2017. Change algorithms applied to each individual and employer group in the census. Change
algorithms used are in two basic types: 1) likelihood to change from one market to another; and, 2) likelihood to change from one health plan/plan combination to another within a market.
Morbidity projection based on a correlated stochastic process, including provision for
alternative probability distributions. This feature allows a particular person to have either improving or deteriorating health status from one year to the next. The randomness of such change is controlled though a correlation factor to the original health status and the prior year health status of each person. We are using a 0.90 correlation factor for this model (i.e. allows up to only 10% random variation from one year to the next).
Measurement of the impact of the ACA risk mitigation programs, including options on the
methodology to be used for each program.
Switching (Change Factor) Process
The switching process develops the probability of an individual switching from his current market segment or current insurance plan into each available competing market segment or to a different insurance plan within his current market, including the likelihood of remaining in his current market segment and plan. Plan movement is based on the premium variance between current and possible alternative market segment plans, adjusted by elasticity factors related to the individual’s health status, current insured status, income level, and other characteristics at that time. Similarly, movement to a new market is based upon selected characteristics of the individual or employer. Market Switching Movement from the uninsured market is based upon change factors that Milliman developed through research on certain programs such as health reform in Massachusetts and Maine’s Dirigo project, along with our judgment. Assumed movement varied by age, gender, income level, health status, and the market to which each uninsured person would change. It was assumed that a currently uninsured individual would stay uninsured, move to the Medicaid market, or obtain

© 2012 Society of Actuaries, All Rights Reserved Milliman, Inc.
Page A-3
coverage in the individual market (or Basic Health Plan for Scenario #4). However, in recognition of the relatively low initial penalties or incentive to change their uninsured status in year 2014 to purchase a health plan, we have assumed that our change factors to the Individual Medical Market from the Uninsured market are graded in over time as penalties grow. We have assumed the following phase-in multipliers of our uninsured person change factors to the individual market:
TABLE A-3 PHASE-IN OF MARKET CHANGE FACTORS
UNINSURED TO INDIVIDUAL
Projection Year Most Restrictive Avg. Restrictive Least Restrictive
2014 0.25 0.40 0.45
2015 0.50 0.70 0.75
2016 0.75 0.85 0.90
2017 1.00 1.00 1.00
These phase-in assumptions have a significant impact on the results of our analysis. We note that we have developed these phase-in factors based solely on judgment. These factors were not applied to movement to the Medicaid market since this decision would either not cost or be relatively low cost to newly eligible uninsured people to get their new coverage. We have assumed that 100% of those newly eligible for either program move to that program in 2014.
Plan Switching
In addition to the individual characteristics mentioned above, the plan switching process makes provision to reflect:
Brand awareness of a given insurance health plan and other intangibles (e.g. quality of provider
network, health plan’s distribution systems, etc.)
Brand loyalty is a measure of the increased likelihood of a person to stay with their current health plan due to their satisfaction (or dissatisfaction) with the health plan.
Health plan claims expectations (premium underwriting) versus employer and individual’s claims expectations (benefit worthiness
Benefit relativities of the various available plans The differences in rates between the plans and the current plan rate
The probability of choosing a plan design of a particular health plan (including the current plan) is set in direct proportion to the propensity of choosing a given insurer/plan combination, which is determined by the following formula:
Pr (P, C) = Propensity of choosing Plan P of Insurer C = IF x BF x BW x [1/(1+RI –INFL)] x BR
where:
IF – Incumbent (Inertia) Factor – A measure of the inertia of the family to change insurer or plan of coverage. The incumbent factor must be between zero and 1. The IF applies to the Current Health plan and Plan. All other potential quotes are assigned an IF equal to (1-IF) / (# of quotes). Incumbent factors are looked up from elasticity tables specified in the assumptions. Within this assumption, tables for looking up the inertia to stay with the current health plan are specified. The table values to look up this inertia factor may vary by the following characteristics:

© 2012 Society of Actuaries, All Rights Reserved Milliman, Inc.
Page A-4
o Rate increase (measured after application of employer contributions and federal subsidies)
o Primary insured’s multiple of the federal poverty level (FPL) o Average health status of family using current and previous year’s health status. o Age of the Primary o Gender of the Primary o Year o Market code
Different incumbent factor tables can be used for different projection years. We have used incumbent factor tables that vary by projection year, rate increase level, health status, age/gender, and income level. BF – Brand Factor – A ratio of the potential health plan’s brand awareness compared to the brand awareness of the current health plan’s brand name. A ratio less than 1.0 indicates a movement to a new brand is less likely; a ratio greater than 1.0 that migration is more likely. This is a combination of the Brand Loyalty factor and the Brand Awareness factor assigned to each health plan type. BW – Benefit Worthiness – A ratio of the insured’s claims expectations compared to the Health plan’s claims expectations. RI – Rate Increase – The ratio of this year’s premium quoted for the potential plan less subsidy to last year’s premium charged less last year’s subsidy of the current plan. BR – Benefit Relativity – The ratio of the benefit value of the plan being switched to relative to the current plan. However, the system limits the extent of these differences through the use of switch tolerance limits. We have assumed limits of 10% on the high side and 15% on the low side. INFL – Inflation Indicator - The annual inflation rate or other appropriate indicator. This dampens the impact of the rate increase to the amount of the rate increase in excess of the indicator.
The following table provides an illustration of the change process. This example is not specific to any particular health plan or plans used in the SOA model.
Table A-4 MILLIMAN HEALTH CARE REFORM PROJECTION MODEL
Individual Switching Process Example
Health Plan 1
Health Plan 2
Health Plan 3
Health Plan 4
Health Plan 5 Total
STEP 1: Calculate probabilities of switching to each health plan/plan for a given individual/family
Incumbent Factor IF 0.700 0.075 0.075 0.075 0.075
Brand Factor BF 1.000 1.250 1.050 0.800 0.950
Benefit Worthiness BW 0.900 1.050 1.075 1.050 1.000
Rate Increase RI 0.150 0.120 0.100 0.100 0.180
Inflation Indicator INFL 0.050 0.050 0.050 0.050 0.050
Benefit Relativity BR 1.000 1.050 0.900 1.100 1.000
Minimum Rate Increase 0.100 n/a n/a n/a n/a
Benefit Relativity BRT High 0.100 0.100 0.100 0.100 0.100
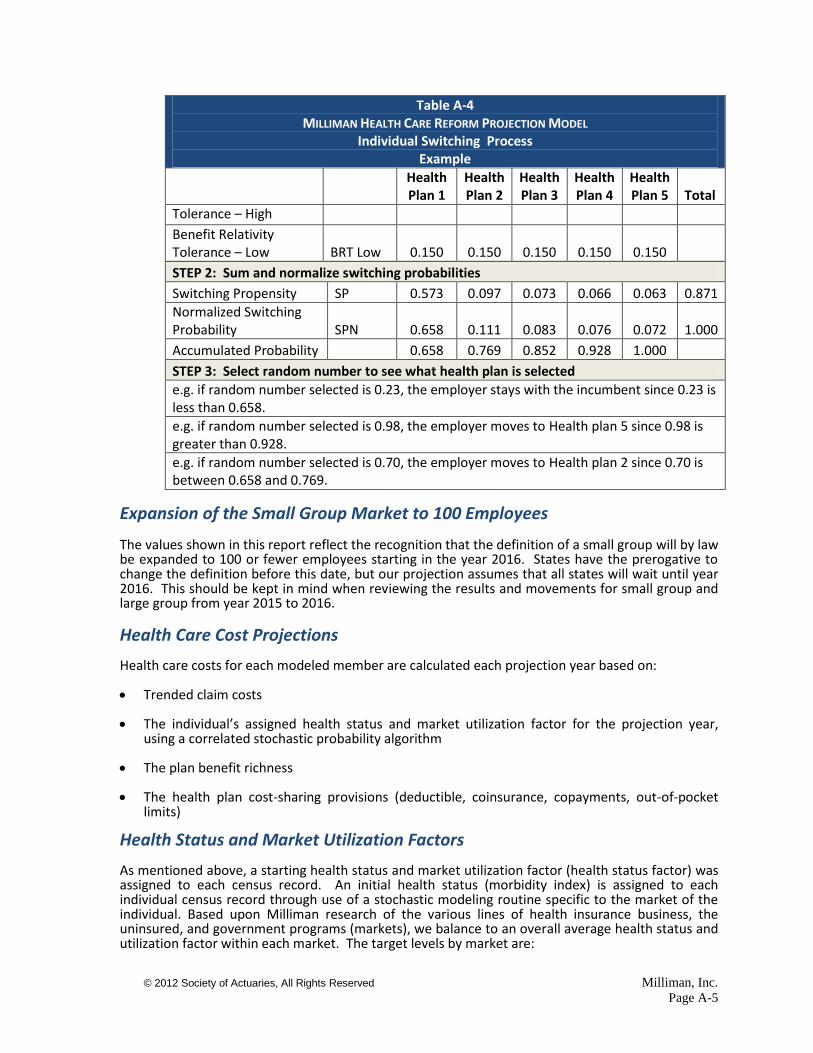
© 2012 Society of Actuaries, All Rights Reserved Milliman, Inc.
Page A-5
Table A-4 MILLIMAN HEALTH CARE REFORM PROJECTION MODEL
Individual Switching Process Example
Health Plan 1
Health Plan 2
Health Plan 3
Health Plan 4
Health Plan 5 Total
Tolerance – High
Benefit Relativity Tolerance – Low BRT Low 0.150 0.150 0.150 0.150 0.150
STEP 2: Sum and normalize switching probabilities
Switching Propensity SP 0.573 0.097 0.073 0.066 0.063 0.871
Normalized Switching Probability SPN 0.658 0.111 0.083 0.076 0.072 1.000
Accumulated Probability 0.658 0.769 0.852 0.928 1.000
STEP 3: Select random number to see what health plan is selected
e.g. if random number selected is 0.23, the employer stays with the incumbent since 0.23 is less than 0.658.
e.g. if random number selected is 0.98, the employer moves to Health plan 5 since 0.98 is greater than 0.928.
e.g. if random number selected is 0.70, the employer moves to Health plan 2 since 0.70 is between 0.658 and 0.769.
Expansion of the Small Group Market to 100 Employees The values shown in this report reflect the recognition that the definition of a small group will by law be expanded to 100 or fewer employees starting in the year 2016. States have the prerogative to change the definition before this date, but our projection assumes that all states will wait until year 2016. This should be kept in mind when reviewing the results and movements for small group and large group from year 2015 to 2016.
Health Care Cost Projections Health care costs for each modeled member are calculated each projection year based on:
Trended claim costs The individual’s assigned health status and market utilization factor for the projection year,
using a correlated stochastic probability algorithm The plan benefit richness The health plan cost-sharing provisions (deductible, coinsurance, copayments, out-of-pocket
limits) Health Status and Market Utilization Factors As mentioned above, a starting health status and market utilization factor (health status factor) was assigned to each census record. An initial health status (morbidity index) is assigned to each individual census record through use of a stochastic modeling routine specific to the market of the individual. Based upon Milliman research of the various lines of health insurance business, the uninsured, and government programs (markets), we balance to an overall average health status and utilization factor within each market. The target levels by market are:

© 2012 Society of Actuaries, All Rights Reserved Milliman, Inc.
Page A-6
Table A-5
Average Health Status/Market Utilization Factors by Geographic Grouping and Market
Market Most
Restrictive Average
Restrictive Least
Restrictive
Individual 1.231 0.920 0.806
High Risk 2.500 2.500 2.500
Uninsured 1.091 1.133 1.149
SG : 1 - 10 EEs 1.293 1.058 1.131
SG : 11 - 25 EEs 1.067 0.996 1.099
SG : 26 - 50 EEs 1.059 1.013 1.105
Group : 51 – 100 1.024 0.944 0.974
Group : 101 - 999 1.024 0.961 0.965
Group: 1000+ 0.991 0.962 1.055
Note that because the geographic groupings for all markets are defined by the rating restrictions in each state's individual market, the relative health status/utilization factors in the small and large group markets will not exhibit the same relative health status as calculated in the individual market. In other words, the least restrictive geographic grouping will not have the lowest group health status/utilization of the three geographic areas. A different combination of states represent the most, average, and least restrictive state groupings for the group business since current group regulations differ from individual regulation in many states in terms of their restrictions. The HCRFM system allows changes to each person’s health status/utilization factor each year through application of a correlated stochastic process which is related to each person’s starting and prior year health status. The correlation coefficient controls how much random change is allowed each year. A correlation coefficient of zero (0) means that there is no relationship to the previous year’s morbidity level (other than both continue to be related to the initial level), whereas a correlation coefficient of one (1) would result in each year’s morbidity level being equal to the starting level (i.e. no change in factor). For these scenarios, we have used a correlation coefficient of 0.90. The choice of correlation coefficient directly affects the ACA Part 5 risk mitigation programs since it is a determinant of the probability that a person will have a large claim and is the key element involved in determining the risk adjustment calculations. ACA Risk Mitigation Programs ACA contains three programs intended to stabilize the individual and small group markets following the implementation in year 2014 of guaranteed issue with no pre-existing condition limitations and strict limitations on a health plan’s ability to rate according to the inherent actuarial value of the risks that it insures. These programs are: the transitional reinsurance program for individual markets in each state (Section 1341); transitional risk corridors for plans in individual and small group markets (Section 1342); and risk adjustment (Section 1343). These programs are described in Part 5 of Subtitle D of Title I of ACA and are therefore collectively known as the Part 5 programs. All three programs are effective in 2014. The first two programs are temporary and terminate after 2016.

© 2012 Society of Actuaries, All Rights Reserved Milliman, Inc.
Page A-7
Transitional Reinsurance Program The transitional reinsurance program is temporary, running for three years beginning January 1, 2014, and applies reimbursement to individual market health plans only, although it is funded by health plans selling insured coverage in the group and/or individual markets as well as by third party administrators (TPAs) servicing self-funded employer group plans. The ACA originally charged the Secretary of Health and Human Services (the Secretary) with identifying criteria for determining high-risk individuals, based on a list of 50 to 100 conditions that are “indicative of individuals with pre-existing high-risk conditions," or a comparable method recommended by the American Academy of Actuaries. A final rule issued by HHS on March 16th indicates that eligibility will be based upon actual claim levels rather than a condition list. States will be responsible for determining the benefit provisions of the program (attachment point, health plan coinsurance, out-of-pocket limit, and/or benefit cap). Grandfathered plans are excluded from receiving reimbursement from the program. The transitional reinsurance program is funded via a levy on the commercial insurance blocks of all health plans, with nationwide levy amounts totaling $10 billion for 2014; $6 billion for 2015; and $4 billion for 2016. In addition to these amounts, which are intended to fund the reinsurance payments, the act specifies additional amounts ($2 billion in 2014 and 2015, and $1 billion in 2016) which are to be included in a levy. The levy is apportioned among all health plans and third-party administrators of self-funded business, with each company’s assessment reflecting its “…fully insured commercial book of business for all major medical products and the total value of all fees charged by the issuer and the cost of coverage administrated by the issuer as a third-party administrator.” The ACA allows for states to add additional assessments. For the claims funding, this method is intended to be a zero-sum program. We have estimated the share of these direct program levies (contributions) for each state grouping based upon member distribution. This is consistent with the final regulation issued by HHS on March 16th. Table A-6 shows the amounts assumed for nationwide and for each state grouping.
Table A-6a
MILLIMAN HEALTH CARE REFORM PROJECTION MODEL Allocation of Transitional Reinsurance Assessments
($ millions) Projection
Year Nationwide Most
Restricted Average
Restricted Least
Restricted 2014 $10,000 $1,268 $3,449 $5,283 2015 $ 6,000 $ 761 $2,069 $3,170 2016 $ 4,000 $ 507 $1,379 $2,113
Table A-6b MILLIMAN HEALTH CARE REFORM PROJECTION MODEL
Transitional Reinsurance Assessments per Assessed Member
Projection Year Nationwide
Most Restricted
Average Restricted
Least Restricted
2014 $62.46 $65.10 $63.83 $61.01 2015 $36.00 $38.12 $36.85 $35.01 2016 $23.30 $24.72 $23.85 $22.64

© 2012 Society of Actuaries, All Rights Reserved Milliman, Inc.
Page A-8
Table A-6c
MILLIMAN HEALTH CARE REFORM PROJECTION MODEL Transitional Reinsurance Assessments
as a Percentage of Assessed Premium Equivalents Projection
Year Nationwide Most
Restricted Average
Restricted Least
Restricted 2014 1.36% 1.54% 1.37% 1.36% 2015 0.72% 0.79% 0.73% 0.72% 2016 0.42% 0.45% 0.43% 0.42%
We have assumed that all funds will be distributed on claims incurred during the same year in which the levied amounts are collected. We have reflected only the claims funding of the program and have not included the impact of the additional Federal assessments that do not support the program directly or any additional state assessments that could be levied. Table A-7, below, shows both the benefits and assessments (“Contributions”) for the individual market by scenario, year and regulatory environment. It also presents the ratio of the reinsurance subsidy (i.e. benefits of the program less contributions to the program) to total benefits incurred each year. The model has assumed that 100% of the nationwide assessments ($10 billion, $6 billion, and $4 billion) are distributed to the individual market in the same year as it is assessed. Given that the modeled scenarios in this analysis all assumed the same attachment point ($50,000), coinsurance (20%), and benefit cap (none), the benefits are the same for all five scenarios.
Table A-7 TRANSITIONAL REINSURANCE PROGRAM
INDIVIDUAL MEDICAL MARKET CONTRIBUTIONS (ASSESSMENTS) BY MARKET AND PROJECTION YEAR WITHIN STATE GROUPING
(billions) Most Restrictive State Grouping Average Restrictive State Grouping Least Restrictive State Grouping
Scenario 2014 2015 2016 2014 2015 2016 2014 2015 2016
Individual Market Reinsurance Benefits (billions) 1 $1.3 $0.8 $0.5 $3.4 $2.1 $1.4 $5.3 $3.2 $2.1
2 $1.3 $0.8 $0.5 $3.4 $2.1 $1.4 $5.3 $3.2 $2.1
3 $1.3 $0.8 $0.5 $3.4 $2.1 $1.4 $5.3 $3.2 $2.1
4 $1.3 $0.8 $0.5 $3.4 $2.1 $1.4 $5.3 $3.2 $2.1
5 $1.3 $0.8 $0.5 $3.4 $2.1 $1.4 $5.3 $3.2 $2.1
Individual Market Reinsurance Contributions (billions) 1 $0.1 $0.1 $0.1 $0.4 $0.4 $0.3 $0.7 $0.6 $0.5
2 $0.1 $0.1 $0.1 $0.4 $0.4 $0.3 $0.7 $0.6 $0.5
3 $0.1 $0.1 $0.1 $0.4 $0.4 $0.3 $0.7 $0.6 $0.5
4 $0.1 $0.1 $0.1 $0.4 $0.3 $0.2 $0.7 $0.5 $0.4
5 $0.1 $0.1 $0.1 $0.4 $0.4 $0.3 $0.7 $0.6 $0.5

© 2012 Society of Actuaries, All Rights Reserved Milliman, Inc.
Page A-9
Table A-7 TRANSITIONAL REINSURANCE PROGRAM
INDIVIDUAL MEDICAL MARKET CONTRIBUTIONS (ASSESSMENTS) BY MARKET AND PROJECTION YEAR WITHIN STATE GROUPING
(billions) Most Restrictive State Grouping Average Restrictive State Grouping Least Restrictive State Grouping
Scenario 2014 2015 2016 2014 2015 2016 2014 2015 2016
Individual Market Total Claims before Mitigation (billions) 1 $10.7 $16.4 $22.3 $21.6 $35.7 $46.8 $38.8 $65.2 $84.7
2 $10.5 $16.0 $21.8 $21.2 $35.0 $45.8 $38.1 $63.9 $83.1
3 $10.7 $16.4 $22.2 $21.4 $35.5 $46.6 $38.8 $65.2 $84.7
4 $9.8 $14.9 $20.0 $18.8 $31.1 $40.4 $34.1 $56.2 $72.6
5 $10.7 $16.4 $22.2 $21.5 $35.6 $46.7 $38.8 $64.9 $84.5
Ratio of Individual Market Reinsurance Subsidy to Total Benefits 1 11% 4% 2% 14% 5% 2% 12% 4% 2%
2 11% 4% 2% 14% 5% 2% 12% 4% 2%
3 11% 4% 2% 14% 5% 2% 12% 4% 2%
4 12% 5% 2% 16% 6% 3% 14% 5% 2%
5 11% 4% 2% 14% 5% 2% 12% 4% 2%
The net subsidy to the Individual market from the Group market as a percentage of Individual market incurred benefits is also shown above in Table A-7. It shows an 11% to 14% ratio in 2014, but then the ratio falls the following years to 4% to 6% in 2015 and 2% to 3% in 2016. This percentage reduction is not only a result of decreasing total contributions to the program from the group market, but also due to the phase-in assumptions for bringing the uninsured into the individual marketplace (see Table A-3). Risk Adjustment Program The risk adjustment program is a permanent program that will be carried out under the criteria and methods established by the Secretary, in consultation with states. The criteria and methods may be similar to those utilized under Medicare Part C or D. Using risk adjustment, revenue will be shifted from health plans with lower than average actuarial risk members (i.e., healthier enrollees) to those with higher than average actuarial risk members (i.e., sicker enrollees). Such adjustments apply to plans in the individual and small group markets, but do not apply to grandfathered plans. The two risk adjustment methods currently used in the Medicare, Medicaid, and commercial medical insurance markets can be classified as either concurrent method or prospective. Each method offers certain advantages over the other. HHS will use a concurrent method as the federal approach to implementing the risk adjustment program, but will allow states to use an alternate method of their choosing, subject to HHS approval. This analysis modeled both methods to assess their difference in impact.
A concurrent risk adjustment method develops relative health status factors for every member in the population. These health status factors represent the relative expected resource use for members for the same period for which the input data was gathered. For example, a common concurrent risk adjustment methodology would be to use ICD9 diagnosis data from CY2011 to estimate members’ relative health status in CY2011. A prospective risk adjustment method, on the other hand, develops relative health status factors applicable to a future period based on historical data. A common prospective risk adjustment methodology would be to use ICD9 diagnosis data from CY2011 to estimate members’ relative health status in CY2012.

© 2012 Society of Actuaries, All Rights Reserved Milliman, Inc.
Page A-10
The HCRFM is an annual calendar year based projection system. As such, it does not model activity that occurs on a monthly or quarterly basis. So, while the risk adjustment factors may get revised during the year (e.g. on a quarterly basis), our projection reflects only a single factor per person each year. An individual's health status is assumed to remain unchanged during the year. The HCRFM also ignores timing differences, such as the elapsed time between data collection and the determination of final risk scores. In addition to calculating the projected actual payments that a health plan may need to pay or will receive, the system also estimates what these payments or receipts will be at the end of the prior projection year for the purpose of setting premium rates for the current year. Because the current year results are not necessarily known at the time, such estimation is based on the members in force and the plan experience in the prior year. This creates a potential mismatch between the impact of the risk mitigation programs as reflected in the premium rates to be charged during the year and the actual net payments the health plan will need to pay or will receive. For the calculation of prospective risk scores, we used individuals with 12 months of eligibility in our research database. As a result, the factors do not need to be weighted by member months (i.e. partial year exposures). The formulas we have used are one approach to calculating the risk adjustment payments. There are other potential approaches that could be used. While HHS will use a concurrent method, it has not yet released the calculation model it will employ. Each state may adapt its own approach within guidelines. Our method was useful given the annual projection period methodology being employed by the HCRFM. The following are the basic formulas used by HCRFM in calculating these values for the prospective method. PROSPECTIVE METHOD
where, is the population-weighted sum of the risk scores (or health status factors) for the current year, over the members in force in the plan. It is divided by the current year exposure of members (Plan Exposure (CY)) to derive the plan’s average risk adjustment factor. The same is done for the determinant pool (i.e. the entire non-grandfathered business in the individual market and separately for the entire small group market). CY represents the current year; PY the prior year; and NY is the next year. Average Benefit (CY) represents the average incurred claims of the pool in the current year.
CONCURRENT METHOD

© 2012 Society of Actuaries, All Rights Reserved Milliman, Inc.
Page A-11
where, is the population-weighted sum of the risk scores (or health status factors) over the members in force in the plan. It is divided by the current year exposure of members (Plan Exposure (CY)) to derive the plan’s average risk adjustment factor. The same is done for the determinant pool (i.e. the entire non-grandfathered business in the individual market and separately for the entire small group market). CY represents the current year; PY the prior year; and NY is the next year. Average Benefit (CY) represents the average incurred claims of the pool in the current year. For the purpose of setting premium rates for the next year, the predicted amount per exposure is subtracted from the trended experience claims being used to determine the premium rates and divided by the target loss ratio. The model allows for ad hoc adjustments to these calculated premium rates to reflect the anticipation of any changes the pricing actuary may want to include, although for these projections no ad hoc adjustments were assumed. These formulas assume knowledge of the health status of all enrollees in a health plan’s portfolio of plans, including new members to the plan. This may not be the case for the prospective method when the actual methodology prescribed by HHS is implemented. New members may be assigned only an average risk score rather than their actual score for this method. We have not tested how results might change if the prospective method were to be implemented on this basis. Transitional Risk Corridor Program The transitional risk corridor program for the individual and small group markets mirrors that established by the Medicare Modernization Act for Medicare Part D. Health plans retain 100% of gains or losses for qualified health plans with allowable costs (described below) within 3% of target (i.e., 97% of target to 103% of target). Health plans retain 50% of gains or losses for the next 5% band (92% of target through 97% of target, and 103% of target to 108% of target). Outside that range, health plans retain 20% of gains or losses. The target amount defined as the total amount of premiums, including any premium subsidies under any government program, less the administrative costs of the plan (limited to 20% of premium). The allowable costs compared to target are total non-administrative costs, reduced for any payments received under the other two ACA risk mitigation programs. This program is effective for qualified health plans for calendar years 2014, 2015, and 2016 and applied on a plan-by-plan basis. ACA specifies only one method for this program, although the interpretation of what plans are eligible and how the target and allowable claims are determined could differ. The HCRFM system determines the ins and outs by plan for this program after application of the other two risk mitigation programs. We have interpreted ACA to indicate that this program, unlike the other two, is not a zero-sum result, and the Federal government will either pay out or collect any differences from target levels. This program does not have a direct impact on the premium rate setting process. We have illustrated the projected results of the risk corridor program in the Results section of this report (see Tables 7 and 8D).
Premium Setting Process Premium rates for each plan are a function of the plan’s past trended experience, the target loss ratio for the plan, the impact of pooling the plan’s experience with that of other plans in the pool, and any ad hoc rate increases assumed to be implemented for the plan. The model allows the user to choose the experience period over which the premiums will be determined, either the most recent year or the last two years before the pricing period. The two years can be weighted differently by health plan and plan

© 2012 Society of Actuaries, All Rights Reserved Milliman, Inc.
Page A-12
as to the impact. Each plan of a health plan can be assigned a pool of other plans. For pooled plans, the rates will be determined based upon the combined experience of all the plans included in the pool. There can be multiple pools used by any given health plan. Experience can be pooled across health plans and across markets if desired. A base rate or community rate is determined and then the plan’s age/gender factors (age factors only after 2014 for non-grandfathered plans) are applied to the base rate to determine the rate to charge to the individual. If still allowed, an individual may have also been assigned an underwriting rate-up factor due to his/her health status. Ad hoc rate increases can also be reflected by year for each plan. The model used for this report assumed rate setting is based upon pooled experience between exchange and non-grandfathered non-exchange plans of a health plan. Effectively, since exchanges are introduced in year 2014, the pooling between exchange and non-exchange plans only begins in 2014 and later. We have assumed pooled plans consider only the current year’s experience in determining premium rates for the next year. The basic premium formula is: Premium Rate(t) = {∑ [(Wtt-2 x Claims Experiencet-2 + Wtt-1 x Claims Experiencet-1)/( Wtt-2 + Wtt-1)] x (1+ Trendt) / (1 – Loadt)} x AdHoct x Age/Sex Factor where Wtt is the weight to assign to the claims experience of year t. We employed different rate level scenarios, as follows:
Status Quo: Reflects expected results as if the 2014 ACA reforms are not implemented. Rate increases for this scenario are uncapped.
Scenarios 1A, 2 - 5: Reflects expected results for implementation of 2014 ACA reforms, no
anticipated adverse selection for years 2014 and later, and a 20% maximum rate increase (excluding increases for age and benefit changes).
Scenario 1B: Reflects expected results for implementation of 2014 ACA reforms, pricing for
anticipated adverse selection for years 2014 and 2015, but with a 20% maximum rate increase (excluding increases for age and benefit changes).
Scenario 1C: Reflects expected results for implementation of 2014 ACA reforms, pricing for
anticipated adverse selection for years 2014 and 2015, with no maximum rate increase.
We also limited base rate reductions to no more than 0%.

© 2012 Society of Actuaries, All Rights Reserved Milliman, Inc.
Attachment B
Key Underlying Assumptions

Attachment B
Key Underlying Assumptions
© 2012 Society of Actuaries, All Rights Reserved Milliman, Inc. Page B-1
CENSUS A. Used U.S. MEPS and U.S. Census data (March 2010) coupled with market research data for
demographic and insurance splits of the baseline U.S. census data 1. Member counts by age, gender, and family composition
2. Family size
3. Line of business
4. Employer size
B. Distribution of population by geographic grouping and market
Table B-1A
DISTRIBUTION OF POPULATION BY GEOGRAPHIC GROUPING AND MARKET
(IN THOUSANDS)
Market Most
Restrictive Average
Restrictive Least
Restrictive Grand Total
Individual 1,489 5,018 8,134 14,641
High Risk 3 101 153 257
Uninsured 4,620 15,673 29,206 49,499
SG : 1 - 10 EEs 1,264 2,753 4,254 8,271
SG : 11 - 25 EEs 1,088 3,159 4,875 9,122
SG : 26 - 50 EEs 1,021 3,181 5,405 9,607
Group : 51 – 100 1,132 2,912 4,612 8,656
Group : 101 - 999 3,964 9,035 16,102 29,101
Group: 1000+ 10,117 29,038 44,792 83,947
Medicaid 7,869 17,328 29,934 55,132
Total Non-Medicare 32,569 88,197 147,467 268,233
Medicare 5,338 15,792 21,868 42,998
Total 37,907 103,989 169,336 311,232
Table B-1B shows the percentage distribution of the population shown above within each geographic area.

Attachment B
Key Underlying Assumptions
© 2012 Society of Actuaries, All Rights Reserved Milliman, Inc. Page B-2
Table B-1B
DISTRIBUTION OF POPULATION BY GEOGRAPHIC GROUPING AND MARKET
Market Most
Restrictive Average
Restrictive Least
Restrictive Grand Total
Individual 4.6% 5.7% 5.5% 5.5%
High Risk 0.0% 0.1% 0.1% 0.1%
Uninsured 14.2% 17.8% 19.8% 18.5%
SG : 1 - 10 EEs 3.9% 3.1% 2.9% 3.1%
SG : 11 - 25 EEs 3.3% 3.6% 3.3% 3.4%
SG : 26 - 50 EEs 3.1% 3.6% 3.7% 3.6%
Group : 51 – 100 3.5% 3.3% 3.1% 3.2%
Group : 101 - 999 12.2% 10.2% 10.9% 10.8%
Group: 1000+ 31.1% 32.9% 30.4% 31.3%
Medicaid 24.2% 19.6% 20.3% 20.6%
Total Non-Medicare 100.0% 100.0% 100.0% 100.0%
The states included in each of the regulatory groupings are shown in the Table B-2. They were categorized based upon our view of the business environment for the individual comprehensive medical market. We recognize that some states might be categorized differently by others and the groupings would differ for the group markets.
Table B-2
STATE REGULATORY GROUPINGS
Regulatory Environment* States
MR - Most Restrictive MA, ME, NJ, NY, VT
AR - Average Restrictive
AL, CT, DE, FL, IA, ID, KS, KY, LA, MI, MN, MS, MT, NE, NH, NM, NV, OR, PA, RI, SC, SD, UT, WA
LR - Least Restrictive
AK, AR, AZ, CA, CO, DC, GA, HI, IL, IN, MD, MO, NC, ND, OH, OK, TN, TX, VA, WI, WV, WY
* based on the regulatory environment of the individual market

Attachment B
Key Underlying Assumptions
© 2012 Society of Actuaries, All Rights Reserved Milliman, Inc. Page B-3
C. Distribution of population by federal poverty level
The following tables show the distribution of the population by federal poverty level (FPL). The distributions vary by geographic grouping. Note that we have assumed the same distribution by FPL for both Small Group and Large Group due to data limitations.
Table B-3A
DISTRIBUTION OF POPULATION BY FEDERAL POVERTY LEVEL*
NATIONWIDE (ALL GEOGRAPHIC GROUPINGS COMBINED)
FPL Individual High Risk Small Group Large Group Uninsured Total
<139% 23.9% 17.9% 4.9% 4.9% 40.1% 14.6%
139% - 149% 2.2% 1.6% 0.9% 0.9% 3.7% 1.7%
150% - 199% 10.2% 9.7% 5.8% 5.8% 13.7% 8.0%
200% - 299% 18.2% 15.5% 17.2% 17.2% 18.1% 17.5%
300% - 399% 12.9% 13.1% 16.5% 16.6% 9.9% 14.7%
400%+ 32.5% 42.2% 54.7% 54.6% 14.5% 43.6%
All 100.0% 100.0% 100.0% 100.0% 100.0% 100.0% * Based upon U.S. Census data. Percentage may not add to 100.0% due to rounding.
Table B-3B
DISTRIBUTION OF POPULATION BY FEDERAL POVERTY LEVEL*
MOST RESTRICTIVE GEOGRAPHIC GROUPING
FPL Individual High Risk Small Group Large Group Uninsured Total
<139% 27.0% 20.9% 4.2% 4.2% 32.0% 10.8%
139% - 149% 2.1% 1.9% 0.6% 0.6% 3.1% 1.1%
150% - 199% 8.1% 4.8% 4.3% 4.3% 12.6% 6.0%
200% - 299% 18.0% 16.4% 13.7% 13.7% 18.0% 14.8%
300% - 399% 11.0% 10.6% 13.7% 13.7% 12.2% 13.2%
400%+ 33.8% 45.3% 63.5% 63.5% 22.1% 54.0%
All 100.0% 100.0% 100.0% 100.0% 100.0% 100.0% * Based upon U.S. Census data. Percentage may not add to 100.0% due to rounding.

Attachment B
Key Underlying Assumptions
© 2012 Society of Actuaries, All Rights Reserved Milliman, Inc. Page B-4
Table B-3C
DISTRIBUTION OF POPULATION BY FEDERAL POVERTY LEVEL*
AVERAGE RESTRICTIVE GEOGRAPHIC GROUPING
FPL Individual High Risk Small Group Large Group Uninsured Total
<139% 24.0% 19.9% 5.0% 5.0% 40.0% 14.2%
139% - 149% 2.8% 2.2% 1.0% 1.0% 3.7% 1.7%
150% - 199% 11.2% 9.6% 6.2% 6.2% 13.5% 8.2%
200% - 299% 18.2% 14.6% 18.1% 18.1% 18.5% 18.2%
300% - 399% 13.0% 13.3% 17.3% 17.3% 9.6% 15.3%
400%+ 30.8% 40.3% 52.3% 52.3% 14.7% 42.4%
All 100.0% 100.0% 100.0% 100.0% 100.0% 100.0% * Based upon U.S. Census data. Percentage may not add to 100.0% due to rounding.
Table B-3D
DISTRIBUTION OF POPULATION BY FEDERAL POVERTY LEVEL*
LEAST RESTRICTIVE GEOGRAPHIC GROUPING
FPL Individual High Risk Small Group Large Group Uninsured Total
<139% 23.3% 16.5% 5.0% 5.0% 41.5% 15.6%
139% - 149% 1.8% 1.3% 0.9% 0.9% 3.8% 1.7%
150% - 199% 10.1% 9.9% 5.8% 5.8% 14.0% 8.2%
200% - 299% 18.3% 16.0% 17.5% 17.5% 17.8% 17.6%
300% - 399% 13.2% 12.9% 16.8% 16.8% 9.8% 14.7%
400%+ 33.3% 43.3% 54.0% 54.0% 13.1% 42.1%
All 100.0% 100.0% 100.0% 100.0% 100.0% 100.0% * Based upon U.S. Census data. Percentage may not add to 100.0% due to rounding.
D. Distribution by Health Plan type based upon statutory annual statement information 1. From 2010 Annual Statement data, we identified various types of health plans and health
insurance carriers selling comprehensive medical business. We categorized them into seven different health plan types for purposes of modeling movement of insureds among health plans.
2. Distribution of population by type of health plan being assumed is shown in the following
tables.

Attachment B
Key Underlying Assumptions
© 2012 Society of Actuaries, All Rights Reserved Milliman, Inc. Page B-5
Table B-4A
INSURED POPULATION DISTRIBUTION BY HEALTH PLAN TYPE
NATIONWIDE
(THOUSANDS)
Health Plan Type Individual Small Group
Large Group
Total Under 65
1. Health Plan Type 1 8,346 12,662 61,120 82,129
2. Health Plan Type 2 1,431 4,555 13,098 19,085
3. Health Plan Type 3 1,552 4,335 17,158 23,046
4. Health Plan Type 4 374 830 7,277 8,480
5. Health Plan Type 5 690 1,502 10,759 12,950
6. Health Plan Type 6 1,722 1,769 4,561 8,052
7. Health Plan Type 7 526 1,347 7,730 9,603
8. High Risk Pools 257
9. Uninsured 49,499
10. Medicaid 55,132
11. Medicare 42,998
Total – All Health Plan Types 14,641 27,000 121,703 311,232
Table B-4B
INSURED POPULATION DISTRIBUTION BY HEALTH PLAN TYPE
MOST RESTRICTIVE GEOGRAPHIC GROUPING
(THOUSANDS)
Health Plan Type Individual Small Group
Large Group
Total Under 65
1. Health Plan Type 1 832 1,265 5,045 7,142
2. Health Plan Type 2 197 914 3,200 4,311
3. Health Plan Type 3 31 275 1,573 1,880
4. Health Plan Type 4 97 262 802 1,161
5. Health Plan Type 5 161 194 753 1,108
6. Health Plan Type 6 104 222 1,192 1,517
7. Health Plan Type 7 67 242 2,649 2,958
8. High Risk Pools 3
9. Uninsured 4,620
10. Medicaid 7,869
11. Medicare 5,338
Total – All Health Plan Types 1,489 3,374 15,213 37,907

Attachment B
Key Underlying Assumptions
© 2012 Society of Actuaries, All Rights Reserved Milliman, Inc. Page B-6
Table B-4C
INSURED POPULATION DISTRIBUTION BY HEALTH PLAN TYPE
AVERAGE RESTRICTIVE GEOGRAPHIC GROUPING
(THOUSANDS)
Health Plan Type Individual Small Group
Large Group
Total Under 65
1. Health Plan Type 1 2,934 4,676 23,218 30,829
2. Health Plan Type 2 463 1,248 2,691 4,402
3. Health Plan Type 3 581 1,423 4,884 6,888
4. Health Plan Type 4 106 220 1,927 2,253
5. Health Plan Type 5 241 700 5,759 6,700
6. Health Plan Type 6 585 515 1,248 2,348
7. Health Plan Type 7 107 311 1,257 1,675
8. High Risk Pools 101
9. Uninsured 15,673
10. Medicaid 17,328
11. Medicare 15,792
Total – All Health Plan Types 5,018 9,092 40,984 103,989
Table B-4D
INSURED POPULATION DISTRIBUTION BY HEALTH PLAN TYPE
LEAST RESTRICTIVE GEOGRAPHIC GROUPING
(THOUSANDS)
Health Plan Type Individual Small Group
Large Group
Total Under 65
1. Health Plan Type 1 4,580 6,721 32,857 44,158
2. Health Plan Type 2 771 2,393 7,208 10,372
3. Health Plan Type 3 940 2,637 10,701 14,278
4. Health Plan Type 4 171 348 4,548 5,067
5. Health Plan Type 5 287 609 4,247 5,143
6. Health Plan Type 6 1,033 1,033 2,121 4,186
7. Health Plan Type 7 352 794 3,824 4,970
8. High Risk Pools 153
9. Uninsured 29,206
10. Medicaid 29,934
11. Medicare 21,868
Total – All Health Plan Types 8,134 14,534 65,506 169,336
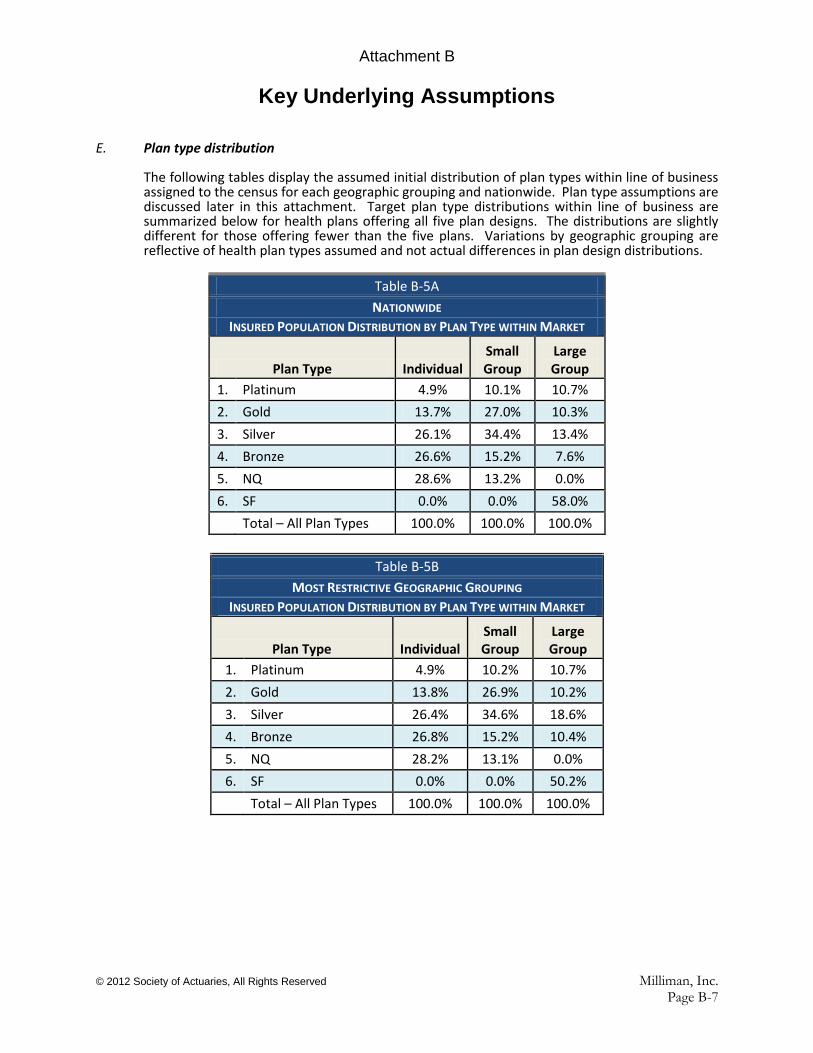
Attachment B
Key Underlying Assumptions
© 2012 Society of Actuaries, All Rights Reserved Milliman, Inc. Page B-7
E. Plan type distribution
The following tables display the assumed initial distribution of plan types within line of business assigned to the census for each geographic grouping and nationwide. Plan type assumptions are discussed later in this attachment. Target plan type distributions within line of business are summarized below for health plans offering all five plan designs. The distributions are slightly different for those offering fewer than the five plans. Variations by geographic grouping are reflective of health plan types assumed and not actual differences in plan design distributions.
Table B-5A
NATIONWIDE
INSURED POPULATION DISTRIBUTION BY PLAN TYPE WITHIN MARKET
Plan Type Individual Small Group
Large Group
1. Platinum 4.9% 10.1% 10.7%
2. Gold 13.7% 27.0% 10.3%
3. Silver 26.1% 34.4% 13.4%
4. Bronze 26.6% 15.2% 7.6%
5. NQ 28.6% 13.2% 0.0%
6. SF 0.0% 0.0% 58.0%
Total – All Plan Types 100.0% 100.0% 100.0%
Table B-5B
MOST RESTRICTIVE GEOGRAPHIC GROUPING
INSURED POPULATION DISTRIBUTION BY PLAN TYPE WITHIN MARKET
Plan Type Individual Small Group
Large Group
1. Platinum 4.9% 10.2% 10.7%
2. Gold 13.8% 26.9% 10.2%
3. Silver 26.4% 34.6% 18.6%
4. Bronze 26.8% 15.2% 10.4%
5. NQ 28.2% 13.1% 0.0%
6. SF 0.0% 0.0% 50.2%
Total – All Plan Types 100.0% 100.0% 100.0%
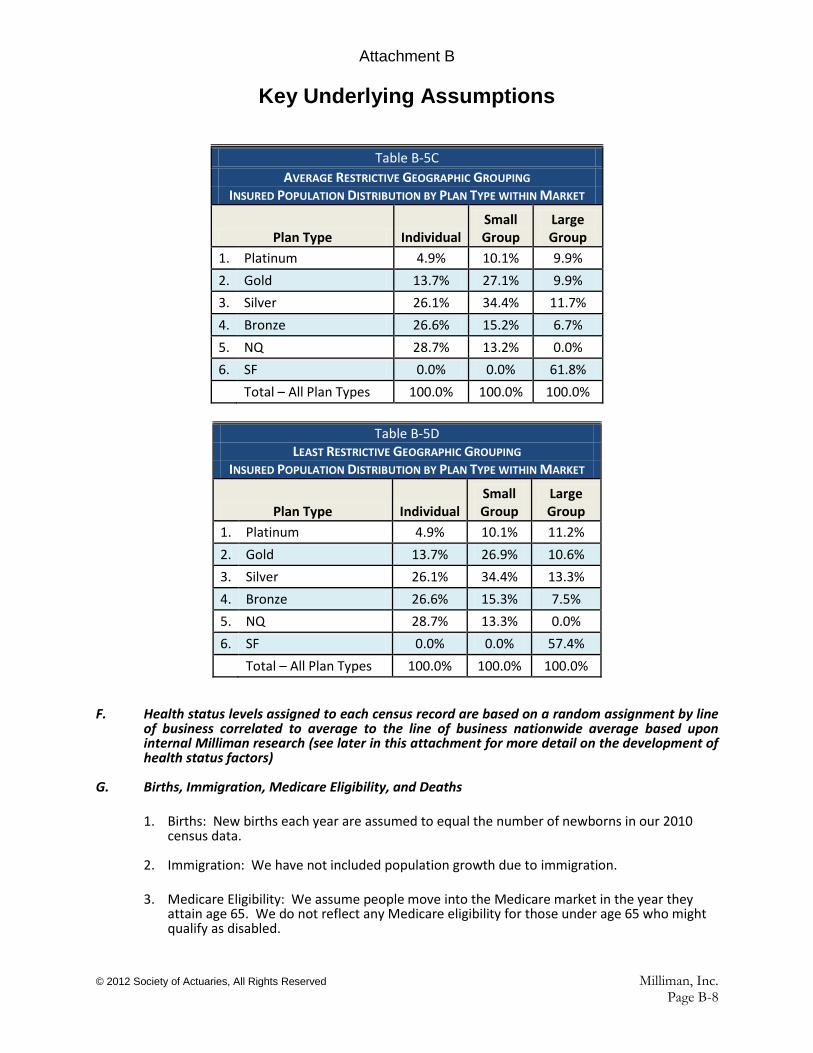
Attachment B
Key Underlying Assumptions
© 2012 Society of Actuaries, All Rights Reserved Milliman, Inc. Page B-8
Table B-5C
AVERAGE RESTRICTIVE GEOGRAPHIC GROUPING INSURED POPULATION DISTRIBUTION BY PLAN TYPE WITHIN MARKET
Plan Type Individual Small Group
Large Group
1. Platinum 4.9% 10.1% 9.9%
2. Gold 13.7% 27.1% 9.9%
3. Silver 26.1% 34.4% 11.7%
4. Bronze 26.6% 15.2% 6.7%
5. NQ 28.7% 13.2% 0.0%
6. SF 0.0% 0.0% 61.8%
Total – All Plan Types 100.0% 100.0% 100.0%
Table B-5D LEAST RESTRICTIVE GEOGRAPHIC GROUPING
INSURED POPULATION DISTRIBUTION BY PLAN TYPE WITHIN MARKET
Plan Type Individual Small Group
Large Group
1. Platinum 4.9% 10.1% 11.2%
2. Gold 13.7% 26.9% 10.6%
3. Silver 26.1% 34.4% 13.3%
4. Bronze 26.6% 15.3% 7.5%
5. NQ 28.7% 13.3% 0.0%
6. SF 0.0% 0.0% 57.4%
Total – All Plan Types 100.0% 100.0% 100.0%
F. Health status levels assigned to each census record are based on a random assignment by line of business correlated to average to the line of business nationwide average based upon internal Milliman research (see later in this attachment for more detail on the development of health status factors)
G. Births, Immigration, Medicare Eligibility, and Deaths
1. Births: New births each year are assumed to equal the number of newborns in our 2010 census data.
2. Immigration: We have not included population growth due to immigration.
3. Medicare Eligibility: We assume people move into the Medicare market in the year they
attain age 65. We do not reflect any Medicare eligibility for those under age 65 who might qualify as disabled.

Attachment B
Key Underlying Assumptions
© 2012 Society of Actuaries, All Rights Reserved Milliman, Inc. Page B-9
4. Deaths: Deaths are projected to occur at the end of each projection year based upon a U.S. standard mortality table.
Change Factor Assumptions Change factors are key assumptions regarding the projected impact of the ACA reforms. There is little empirical data supporting these assumptions. Milliman has conducted research on various programs that converted to a guaranteed acceptance basis and developed various change factors through observations of these other programs. Following are the various change factor assumptions used in this projection. They do not vary by scenario. A. Group Employers Plan Termination Factors
Some employers may be motivated to terminate their health plans and send their employees to the individual market. This is particularly true for groups of 50 or fewer employees since they are not subject to any penalties for not sponsoring a plan. Table B-6 presents the assumed termination rates. It is assumed that these terminations occur only in years 2014 and 2015. This results in sending their employees to the individual market to choose a plan, either through the Exchange or outside of the Exchange. No correlation is assumed between the health plan carrier they had under their group plan and the one that they choose in the individual market. All employees will choose a plan in the year the employer terminates the group plan.
TABLE B-6
GROUP PLAN TERMINATION ASSUMPTIONS BY REGULATORY GROUPING IN 2014 AND 2015
Group Size Most
Restrictive Average
Restrictive Least
Restrictive
SG : 1 - 10 EEs 10% / 10% 15% / 15% 20% / 15%
SG : 11 - 25 EEs 10% / 5% 10% / 10% 15% / 10%
SG : 26 - 50 EEs 5% / 2% 5% / 5% 10% / 5%
Group : 51 – 100 2% / 1% 3% / 3% 5% / 3%
Group : 101 - 999 1% / 0% 1% / 0% 1% / 1%
Group: 1000+ 0% / 0% 0% / 0% 0% / 0%
B. Medicaid Crowd-Out from the Individual or Group Markets
Medicaid crowd-out is the opportunity of employees and individuals who are in income levels (i.e. FPL ≤ 138%) that make them eligible for Medicaid expansion to move from their current coverage or uninsured status to the Medicaid program. The following crowd-out factors have been assumed. The higher the factor, the more likely the person will leave their current plan and enroll in Medicaid.
TABLE B-7 MEDICAID CROWD-OUT FACTORS
Age/Gender
Health Status Factor
< 0.75 0.75 - 1.10 1.10 - 1.70 > 1.70
All < 18 86% 88% 89% 91%
Females 18 – 44 81% 83% 84% 86%
Females ≥ 45 77% 80% 81% 83%
Males ≥ 17 77% 80% 81% 83%
These factors do not vary by market or regulatory groupings.

Attachment B
Key Underlying Assumptions
© 2012 Society of Actuaries, All Rights Reserved Milliman, Inc. Page B-10
C. Individual Plan Switching Factors (Incumbency/Inertia Factors) The following are the incumbency or inertia factors used for plan switching. The application of these factors is discussed in the section in Attachment A on plan switching. The factors vary by projection year, the rate increase being presented by the incumbent plan, the individual’s health status factor, and the individual’s income level (see Table B-3 for the income levels). The lower the factor, the more likely the employer will shop to switch its plan. This first table of factors was used for projection year 2014 and 2015. These are lower factors than for other years due to the likelihood of more interest in comparing one’s current plan with the introduction of exchanges, guaranteed issue, and other new reforms.
Table B-8 INDIVIDUAL PLAN SWITCHING INCUMBENCY/INERTIA FACTORS
Projection Years 2014 and 2015
Rate Increase
Income Level 1 Income Level 2
< 0.75 0.75 - 1.10
1.10 - 1.70 > 1.70 < 0.75
0.75 - 1.10
1.10 - 1.70 > 1.70
< 10% 70.0% 73.7% 73.7% 73.7% 70.0% 73.7% 73.7% 73.7%
10%-20% 68.5% 72.1% 73.7% 73.1% 68.6% 72.3% 73.7% 73.1%
20%-30% 65.4% 69.0% 72.1% 71.8% 65.9% 69.5% 72.5% 72.0%
30%-40% 60.2% 63.9% 67.8% 69.8% 61.3% 64.9% 68.7% 70.2%
40%-50% 49.9% 53.6% 59.3% 65.7% 52.1% 55.7% 61.1% 66.5%
Rate Increase
Income Level 3 Income Level 4
< 0.75 0.75 - 1.10
1.10 - 1.70 > 1.70 < 0.75
0.75 - 1.10
1.10 - 1.70 > 1.70
< 10% 70.0% 73.7% 73.7% 73.7% 70.0% 73.7% 73.7% 73.7%
10%-20% 68.7% 72.4% 73.7% 73.2% 68.9% 72.6% 73.7% 73.2%
20%-30% 66.2% 69.9% 72.7% 72.2% 66.7% 70.4% 73.2% 72.4%
30%-40% 62.0% 65.6% 69.3% 70.5% 63.0% 66.7% 70.1% 70.9%
40%-50% 53.5% 57.2% 62.3% 67.1% 55.7% 59.3% 64.1% 67.9%
Rate Increase
Income Level 5 Income Level 6
< 0.75 0.75 - 1.10
1.10 - 1.70 > 1.70 < 0.75
0.75 - 1.10
1.10 - 1.70 > 1.70
< 10% 70.0% 73.7% 73.7% 73.7% 70.0% 73.9% 73.7% 73.7%
10%-20% 69.2% 72.9% 73.7% 73.3% 69.6% 73.2% 73.7% 73.5%
20%-30% 67.5% 71.2% 73.7% 72.7% 68.7% 72.4% 73.7% 73.2%
30%-40% 64.8% 68.4% 71.6% 71.6% 67.2% 70.9% 73.6% 72.6%
40%-50% 59.3% 62.9% 67.0% 69.4% 64.3% 67.9% 71.2% 71.4% The next table of factors was assumed for years prior to 2014 since they are likely to have less disruption, but will still see some movement in anticipation of 2014.

Attachment B
Key Underlying Assumptions
© 2012 Society of Actuaries, All Rights Reserved Milliman, Inc. Page B-11
Table B-9 INDIVIDUAL PLAN SWITCHING INCUMBENCY/INERTIA FACTORS
Projection Years prior to 2014
Rate Increase
Income Level 1 Income Level 2
< 0.75 0.75 - 1.10
1.10 - 1.70 > 1.70 < 0.75
0.75 - 1.10
1.10 - 1.70 > 1.70
< 10% 71.3% 75.0% 75.0% 84.6% 71.3% 75.0% 75.0% 84.6%
10%-20% 69.7% 73.4% 75.0% 84.6% 69.8% 73.6% 75.0% 84.6%
20%-30% 66.5% 70.3% 73.4% 84.6% 67.0% 70.8% 73.8% 84.6%
30%-40% 61.3% 65.0% 69.0% 84.6% 62.4% 66.1% 69.9% 84.6%
40%-50% 50.8% 54.5% 60.4% 84.6% 53.0% 56.7% 62.2% 84.6%
Rate Increase
Income Level 3 Income Level 4
< 0.75 0.75 - 1.10
1.10 - 1.70 > 1.70 < 0.75
0.75 - 1.10
1.10 - 1.70 > 1.70
< 10% 71.3% 75.0% 75.0% 84.6% 71.3% 75.0% 75.0% 84.6%
10%-20% 70.0% 73.7% 75.0% 84.6% 70.1% 73.9% 75.0% 84.6%
20%-30% 67.4% 71.1% 74.1% 84.6% 67.9% 71.6% 74.5% 84.6%
30%-40% 63.1% 66.8% 70.5% 84.6% 64.1% 67.9% 71.4% 84.6%
40%-50% 54.5% 58.2% 63.4% 84.6% 56.7% 60.4% 65.2% 84.6%
Rate Increase
Income Level 5 Income Level 6
< 0.75 0.75 - 1.10
1.10 - 1.70 > 1.70 < 0.75
0.75 - 1.10
1.10 - 1.70 > 1.70
< 10% 71.3% 75.0% 75.0% 84.6% 71.3% 75.0% 75.0% 84.6%
10%-20% 70.4% 74.2% 75.0% 84.6% 70.8% 74.6% 75.0% 84.6%
20%-30% 68.7% 72.5% 75.0% 84.6% 69.9% 73.7% 75.0% 84.6%
30%-40% 65.9% 69.7% 72.8% 84.6% 68.4% 72.2% 74.9% 84.6%
40%-50% 60.3% 64.0% 68.2% 84.6% 65.4% 69.2% 72.4% 84.6%
The next table of factors was assumed for years later than 2015 since they are likely to have the least amount of disruption. Given the uncertainty regarding how people will shop for new coverage after 2015, we have set these factors to be much higher than the previous sets of factors, reflecting less movement from one plan to another.

Attachment B
Key Underlying Assumptions
© 2012 Society of Actuaries, All Rights Reserved Milliman, Inc. Page B-12
Table B-10 INDIVIDUAL PLAN SWITCHING INCUMBENCY/INERTIA FACTORS
Projection Years Later Than 2015
Rate Increase
Income Level 1 Income Level 2
< 0.75 0.75 - 1.10
1.10 - 1.70 > 1.70 < 0.75
0.75 - 1.10
1.10 - 1.70 > 1.70
< 10% 94.0% 94.0% 94.0% 94.0% 94.0% 94.0% 94.0% 94.0%
10%-20% 91.9% 92.0% 92.4% 93.2% 92.1% 92.2% 92.6% 93.3%
20%-30% 87.8% 88.1% 89.3% 91.6% 88.4% 88.7% 89.8% 91.9%
30%-40% 80.9% 81.5% 84.0% 89.0% 82.3% 82.8% 85.1% 89.5%
40%-50% 67.1% 68.3% 73.5% 83.7% 69.9% 71.1% 75.7% 84.8%
Rate Increase
Income Level 3 Income Level 4
< 0.75 0.75 - 1.10
1.10 - 1.70 > 1.70 < 0.75
0.75 - 1.10
1.10 - 1.70 > 1.70
< 10% 94.0% 94.0% 94.0% 94.0% 94.0% 94.0% 94.0% 94.0%
10%-20% 92.3% 92.4% 92.7% 93.4% 92.5% 92.6% 92.9% 93.4%
20%-30% 88.9% 89.1% 90.1% 92.1% 89.6% 89.8% 90.6% 92.3%
30%-40% 83.2% 83.7% 85.8% 89.9% 84.6% 85.1% 86.9% 90.4%
40%-50% 71.9% 72.9% 77.1% 85.6% 74.8% 75.7% 79.3% 86.7%
Rate Increase
Income Level 5 Income Level 6
< 0.75 0.75 - 1.10
1.10 - 1.70 > 1.70 < 0.75
0.75 - 1.10
1.10 - 1.70 > 1.70
< 10% 94.0% 94.0% 94.0% 94.0% 94.0% 94.0% 94.0% 94.0%
10%-20% 92.9% 92.9% 93.2% 93.6% 93.4% 93.4% 93.5% 93.8%
20%-30% 90.7% 90.8% 91.5% 92.7% 92.2% 92.3% 92.6% 93.3%
30%-40% 87.0% 87.3% 88.6% 91.3% 90.2% 90.4% 91.1% 92.6%
40%-50% 79.6% 80.3% 83.0% 88.5% 86.3% 86.7% 88.1% 91.1%
D. Uninsured Switching to Individual Market The following are the switching probabilities that an uninsured person will move into the individual market. These probabilities vary by age, gender, income level, and health status. The higher the factor, the more likely the uninsured individual will move to the individual market and purchase an individual plan. We have not assumed that any uninsured will move into the Small Group or Large Group markets.

Attachment B
Key Underlying Assumptions
© 2012 Society of Actuaries, All Rights Reserved Milliman, Inc. Page B-13
Table B-11
UNINSURED SWITCHING PROBABILITIES TO INDIVIDUAL MARKET
All Projection Years
Age/Sex
Income Level 1 Income Level 2
< 0.75 0.75 - 1.10
1.10 - 1.70 > 1.70 < 0.75
0.75 - 1.10
1.10 - 1.70 > 1.70
All < 20 0.0% 0.0% 0.0% 0.0% 28.4% 31.7% 33.7% 34.9%
Males 20-35 0.0% 0.0% 0.0% 0.0% 12.4% 13.9% 14.8% 15.3%
Males > 35 0.0% 0.0% 0.0% 0.0% 28.4% 31.7% 33.7% 34.9%
Females 20+ 0.0% 0.0% 0.0% 0.0% 28.4% 31.7% 33.7% 34.9%
Rate Increase
Income Level 3 Income Level 4
< 0.75
0.75 - 1.10
1.10 - 1.70
> 1.70
< 0.75
0.75 - 1.10
1.10 - 1.70
> 1.70
All < 20 65.6% 68.7% 69.4% 71.1% 55.3% 57.2% 57.4% 59.4%
Males 20-35 28.7% 30.1% 30.4% 31.1% 24.2% 25.1% 25.1% 26.0%
Males > 35 65.6% 68.7% 69.4% 71.1% 55.3% 57.2% 57.4% 59.4%
Females 20+ 65.6% 68.7% 69.4% 71.1% 55.3% 57.2% 57.4% 59.4%
Rate Increase
Income Level 5 Income Level 6
< 0.75 0.75 - 1.10
1.10 - 1.70 > 1.70 < 0.75
0.75 - 1.10
1.10 - 1.70 > 1.70
All < 20 37.6% 38.0% 38.3% 39.8% 20.6% 20.6% 21.2% 21.2%
Males 20-35 16.5% 16.6% 16.8% 17.4% 9.0% 9.0% 9.3% 9.3%
Males > 35 37.6% 38.0% 38.3% 39.8% 20.6% 20.6% 21.2% 21.2%
Females 20+ 37.6% 38.0% 38.3% 39.8% 20.6% 20.6% 21.2% 21.2%
In recognition of relatively low penalties or incentive to change their uninsured status in year 2014 to purchase a health plan, we have assumed that the above change factors to the Individual Medical Market are graded in over time as penalties grow and people become more aware of their responsibilities under ACA. We have assumed the following phase-in multipliers of our change factors:
TABLE B-12 PHASE-IN OF MARKET CHANGE FACTORS
UNINSURED TO INDIVIDUAL
Projection Year Most Restrictive Avg. Restrictive Least Restrictive
2014 0.25 0.40 0.45
2015 0.50 0.70 0.75
2016 0.75 0.85 0.90
2017 1.00 1.00 1.00
Therefore, for example, instead of a very healthy male age 40 in FPL5 in an average restrictive state having a probability of 37.6% of moving to the individual market, his probability of moving in year 2014 is 0.40 x 37.6% = 15.0%. The probability of the remaining very health age 40 uninsured males moving to the individual market in 2015 is 0.70 x 37.6% = 26.3% instead of 37.6%.
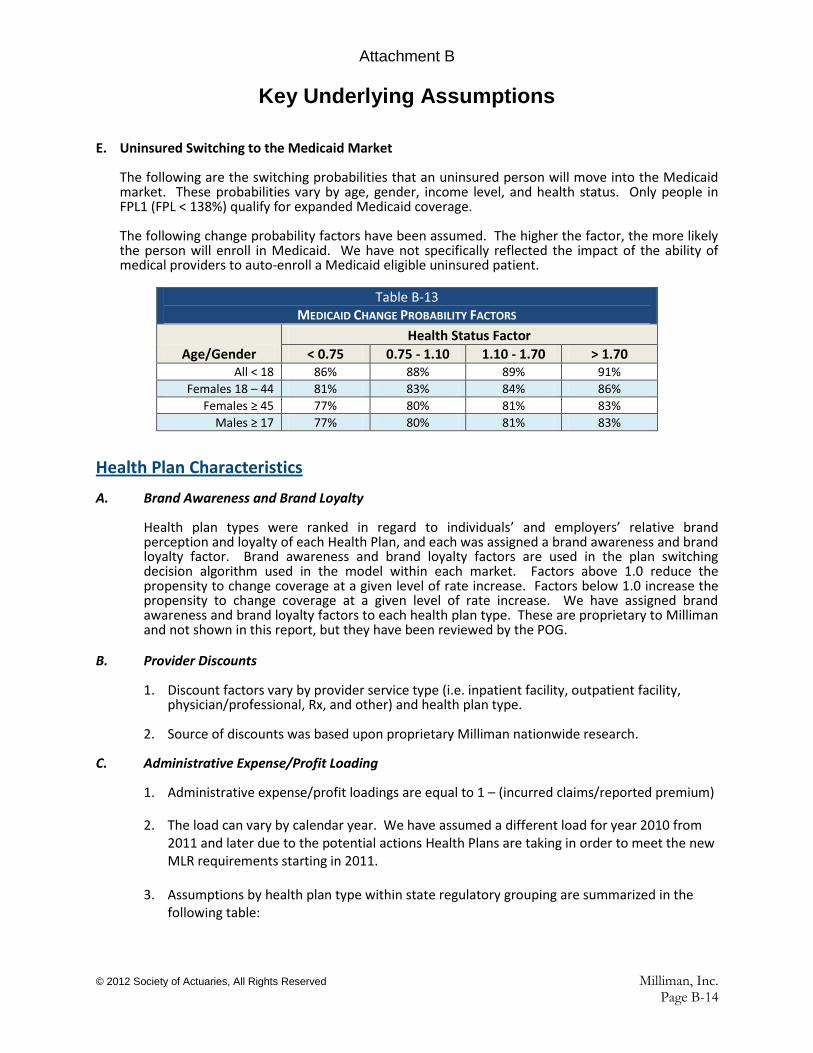
Attachment B
Key Underlying Assumptions
© 2012 Society of Actuaries, All Rights Reserved Milliman, Inc. Page B-14
E. Uninsured Switching to the Medicaid Market
The following are the switching probabilities that an uninsured person will move into the Medicaid market. These probabilities vary by age, gender, income level, and health status. Only people in FPL1 (FPL < 138%) qualify for expanded Medicaid coverage.
The following change probability factors have been assumed. The higher the factor, the more likely the person will enroll in Medicaid. We have not specifically reflected the impact of the ability of medical providers to auto-enroll a Medicaid eligible uninsured patient.
Table B-13
MEDICAID CHANGE PROBABILITY FACTORS
Age/Gender
Health Status Factor
< 0.75 0.75 - 1.10 1.10 - 1.70 > 1.70
All < 18 86% 88% 89% 91%
Females 18 – 44 81% 83% 84% 86%
Females ≥ 45 77% 80% 81% 83%
Males ≥ 17 77% 80% 81% 83% Health Plan Characteristics A. Brand Awareness and Brand Loyalty
Health plan types were ranked in regard to individuals’ and employers’ relative brand perception and loyalty of each Health Plan, and each was assigned a brand awareness and brand loyalty factor. Brand awareness and brand loyalty factors are used in the plan switching decision algorithm used in the model within each market. Factors above 1.0 reduce the propensity to change coverage at a given level of rate increase. Factors below 1.0 increase the propensity to change coverage at a given level of rate increase. We have assigned brand awareness and brand loyalty factors to each health plan type. These are proprietary to Milliman and not shown in this report, but they have been reviewed by the POG.
B. Provider Discounts
1. Discount factors vary by provider service type (i.e. inpatient facility, outpatient facility,
physician/professional, Rx, and other) and health plan type.
2. Source of discounts was based upon proprietary Milliman nationwide research. C. Administrative Expense/Profit Loading
1. Administrative expense/profit loadings are equal to 1 – (incurred claims/reported premium)
2. The load can vary by calendar year. We have assumed a different load for year 2010 from 2011 and later due to the potential actions Health Plans are taking in order to meet the new MLR requirements starting in 2011.
3. Assumptions by health plan type within state regulatory grouping are summarized in the following table:

Attachment B
Key Underlying Assumptions
© 2012 Society of Actuaries, All Rights Reserved Milliman, Inc. Page B-15
Table B-14 ADMINISTRATIVE EXPENSE / PROFIT LOADING
INDIVIDUAL MEDICAL MARKET 2010 LEVEL / 2011+ LEVEL
Health Plan Most Restrictive Average
Restrictive Least
Restrictive
1. Health Plan Type 1 5%/20% 21%/20% 26%/20%
2. Health Plan Type 2 5%/21% 21%/21% 26%/21%
3. Health Plan Type 3 5%/21% 21%/21% 26%/21%
4. Health Plan Type 4 5%/21% 21%/21% 26%/21%
5. Health Plan Type 5 5%/21% 21%/21% 26%/21%
6. Health Plan Type 6 5%/21% 21%/21% 26%/21%
7. Health Plan Type 7 5%/21% 21%/21% 26%/21%
8. Non-Profit Coop 5%/21% 21%/21% 26%/21%
9. OPM Multi-State Plan 5%/20% 21%/20% 26%/20%
D. Health Plan Underwriting Criteria prior to Year 2014
These assumptions are applicable only for the average and least restrictive state groupings. The most restrictive state grouping was assumed to require guaranteed issue and no health status rating in all years.
1. Accept/Reject Criteria – Individual Medical Business
Table B-15 ACCEPT / REJECT UNDERWRITING CRITERIA
INDIVIDUAL MARKET AVERAGE AND LEAST RESTRICTIVE STATE GROUPINGS*
Health Plan Maximum morbidity level
accepted for coverage Experience period analysis
and weighting**
1. Health Plan Type 1 3.00 Last 2 years 60/40
2. Health Plan Type 2 2.50 Last 2 years 50/50
3. Health Plan Type 3 2.00 Last 2 years 60/40
4. Health Plan Type 4 3.00 Last 2 years 50/50
5. Health Plan Type 5 2.00 Last 2 years 60/40
6. Health Plan Type 6 2.00 Last 2 years 70/30
7. Health Plan Type 7 1.50 Last 2 years 80/20
8. Non-Profit Coop N/A N/A
9. OPM Multi-State Plan N/A N/A * No limit on morbidity level in the Most Restrictive State Grouping ** Note that this analysis is the basis for the Health Plan portion of the Benefit Worthiness component
of the plan switching formula.

Attachment B
Key Underlying Assumptions
© 2012 Society of Actuaries, All Rights Reserved Milliman, Inc. Page B-16
2. Substandard Rating Methodology
Table B-16
SUBSTANDARD UNDERWRITING RATING CRITERIA INDIVIDUAL MARKET
AVERAGE AND LEAST RESTRICTIVE STATE GROUPINGS*
Health Plan Percentage of Excess
Morbidity for Rate Up Maximum Rate-Up
1. Health Plan Type 1 80% 100%
2. Health Plan Type 2 90% 100%
3. Health Plan Type 3 100% 150%
4. Health Plan Type 4 60% 50%
5. Health Plan Type 5 70% 100%
6. Health Plan Type 6 80% 150%
7. Health Plan Type 7 90% 200%
8. Non-Profit Coop N/A N/A
9. OPM Multi-State Plan N/A N/A * No limit on morbidity level in the Most Restrictive State Grouping
Plan Assignments and Designs – Commercial Individual and Group Business A. Modeled plans designs will be limited to 5 types
All health plans offer identical plan designs, although not all plans will be offered by each health plan (this is done for ease of comparing movements)
B. Commercial plan designs and their actuarial values
Table B-17 COMMERCIAL PLAN DESIGNS AND ACTUARIAL VALUES
Plan Plan Abbrev. Actuarial Value
Platinum P 91%
Gold G 81%
Silver S 71%
Bronze B 61%
Non-Qualified NQ 51%
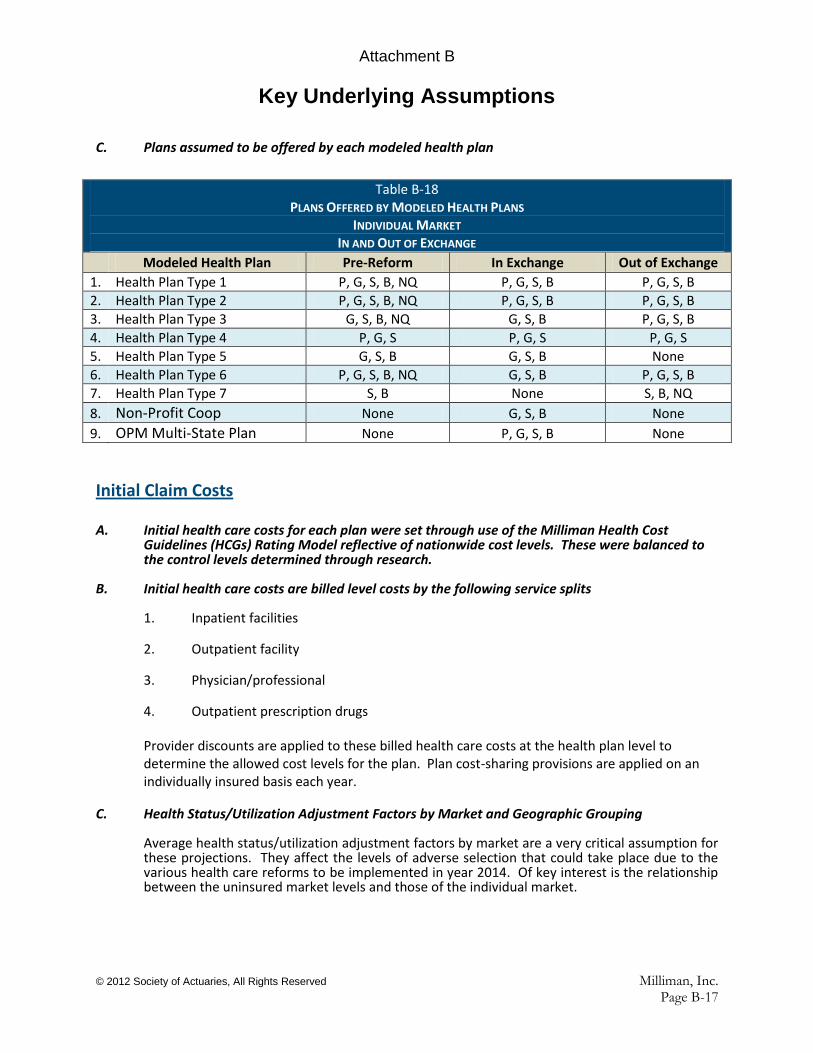
Attachment B
Key Underlying Assumptions
© 2012 Society of Actuaries, All Rights Reserved Milliman, Inc. Page B-17
C. Plans assumed to be offered by each modeled health plan
Table B-18
PLANS OFFERED BY MODELED HEALTH PLANS INDIVIDUAL MARKET
IN AND OUT OF EXCHANGE
Modeled Health Plan Pre-Reform In Exchange Out of Exchange
1. Health Plan Type 1 P, G, S, B, NQ P, G, S, B P, G, S, B
2. Health Plan Type 2 P, G, S, B, NQ P, G, S, B P, G, S, B
3. Health Plan Type 3 G, S, B, NQ G, S, B P, G, S, B
4. Health Plan Type 4 P, G, S P, G, S P, G, S
5. Health Plan Type 5 G, S, B G, S, B None
6. Health Plan Type 6 P, G, S, B, NQ G, S, B P, G, S, B
7. Health Plan Type 7 S, B None S, B, NQ
8. Non-Profit Coop None G, S, B None
9. OPM Multi-State Plan None P, G, S, B None
Initial Claim Costs A. Initial health care costs for each plan were set through use of the Milliman Health Cost
Guidelines (HCGs) Rating Model reflective of nationwide cost levels. These were balanced to the control levels determined through research.
B. Initial health care costs are billed level costs by the following service splits 1. Inpatient facilities
2. Outpatient facility
3. Physician/professional
4. Outpatient prescription drugs
Provider discounts are applied to these billed health care costs at the health plan level to determine the allowed cost levels for the plan. Plan cost-sharing provisions are applied on an individually insured basis each year.
C. Health Status/Utilization Adjustment Factors by Market and Geographic Grouping
Average health status/utilization adjustment factors by market are a very critical assumption for these projections. They affect the levels of adverse selection that could take place due to the various health care reforms to be implemented in year 2014. Of key interest is the relationship between the uninsured market levels and those of the individual market.

Attachment B
Key Underlying Assumptions
© 2012 Society of Actuaries, All Rights Reserved Milliman, Inc. Page B-18
Table B-19
Average Health Status/Utilization Adjustment Factors by Geographic Grouping and Market
Market Most
Restrictive Average
Restrictive Least
Restrictive
Individual 1.231 0.920 0.806
High Risk 2.500 2.500 2.500
Uninsured 1.091 1.133 1.149
SG : 1 - 10 EEs 1.293 1.058 1.131
SG : 11 - 25 EEs 1.067 0.996 1.099
SG : 26 - 50 EEs 1.059 1.013 1.105
Group : 51 – 100 1.024 0.944 0.974
Group : 101 - 999 1.024 0.961 0.965
Group: 1000+ 0.991 0.962 1.055
These assumptions are based on research conducted by Milliman, including self-reported health status results of the U.S. Census Bureau 2010 Current Population Survey (CPS), relative claim costs by state and market reported by health plans in 2010 annual statement filings, as well as other proprietary data of Milliman. These have been set relative to our nationwide estimates for the large group market. Note that the Most Restrictive state grouping has healthier uninsured than the other two groupings and that their individual insured health status is much higher than their uninsured population and that of the individual markets for the other two groupings.
D. Health Status Factor Relativities by Health Plan Type for the Individual Market
Table 20 HEALTH STATUS RELATIVITY FACTORS BY HEALTH PLAN TYPE
INDIVIDUAL MARKET
Health Plan Type Most
Restrictive Average
Restrictive Least
Restrictive
Health Plan Type 1 1.030 1.100 1.100
Health Plan Types 4 and 5 1.010 1.050 1.050
Other Plans 1.000 1.000 1.000
High Risk Programs 2.500 2.500 2.500 * Will be set to reproduce Table 1 relativities
These factors recognize that some health plan types have higher average risk scores than other types due to a combination of regulatory and underwriting influences.
E. Claims Trend Assumptions The following annual base trend rates are assumed. These are applied to healthcare costs prior to application of plan cost-sharing provisions.

Attachment B
Key Underlying Assumptions
© 2012 Society of Actuaries, All Rights Reserved Milliman, Inc. Page B-19
Table B-21 CLAIMS TREND ASSUMPTIONS
INDIVIDUAL MEDICAL AND GROUP COMMERCIAL BUSINESS
Calendar Year Total Trend
2011 6.0%
2012 and Later 7.5%
Premium Structure and Methodology A. Premium age/gender rating factor curves
Premium rates in the individual and small group lines of business were in part determined based upon sets of designated age/gender curves. These curves are restricted to a 3-to-1 ratio for adult rates beginning on 1/1/2014, but prior to 2014 steeper slopes were used. We did not assume smoker-nonsmoker differentials nor lower rates for approved wellness programs.
B. Federal Subsidies
Federal subsidies are calculated in accordance with our understanding of the ACA formulas for each census record based upon the family income level and the cost for the second lowest silver plan being modeled. These subsidies are subtracted from the premium being offered by each health plan during the plan switching process.

© 2012 Society of Actuaries, All Rights Reserved Milliman, Inc.
Attachment C
Projection Results – Rate Level Scenarios
C-1: Individual Business Only: All Geographic Areas Combined - Scenarios 1A, 1B, and 1C
C-2: Individual Business Only: Most Restrictive State Grouping - Scenarios 1A, 1B, and 1C
C-3: Individual Business Only: Average Restrictive State Grouping - Scenarios 1A, 1B, and 1C C-4: Individual Business Only: Least Restrictive State Grouping - Scenarios 1A, 1B, and 1C

Society of Actuaries
Design and Implementation Considerations of ACA Risk Mitigation Programs
Attachment C1
Individual Business Only
All Geographic Areas Combined
2013 Status Quo 14,594 7,425 7,169 n/a 14,594
2014 Status Quo 14,563 5,936 8,628 n/a 14,563
2014 Scenario 1A 20,622 2,518 8,674 9,430 11,192
2014 Scenario 1B 20,628 2,485 8,513 9,630 10,998
2014 Scenario 1C 20,640 2,252 7,884 10,505 10,135
2015 Status Quo 14,535 4,789 9,746 n/a 14,535
2015 Scenario 1A 29,772 1,947 10,821 17,004 12,768
2015 Scenario 1B 29,831 1,892 10,666 17,274 12,558
2015 Scenario 1C 29,733 2,025 9,143 18,566 11,168
2016 Status Quo 14,538 3,936 10,602 n/a 14,538
2016 Scenario 1A 35,259 1,859 12,098 21,302 13,957
2016 Scenario 1B 35,314 1,789 11,942 21,583 13,731
2016 Scenario 1C 35,228 1,946 10,183 23,099 12,129
2017 Status Quo 14,534 3,286 11,247 n/a 14,534
2017 Scenario 1A 39,160 1,775 12,767 24,618 14,543
2017 Scenario 1B 39,206 1,718 12,583 24,906 14,300
2017 Scenario 1C 39,113 1,870 10,875 26,369 12,745
Exchange Business
All Non-Exchange
Business
All Geographic Areas Combined
Enrollment
Projection
Year Scenario Total
Grandfathered
Business
Non-Grandfathered
Non-Exchange
Business
(thousands)
Table C1-1
Results by Exchange/Non Exchange and Projection Year
Individual Business
© 2012 Society of Actuaries, All Rights Reserved Milliman, Inc.
Page C-1

Society of Actuaries
Design and Implementation Considerations of ACA Risk Mitigation Programs
Attachment C1
Individual Business Only
All Geographic Areas Combined
2013 Status Quo 39,764 21,461 18,303 n/a 39,764
2014 Status Quo 42,708 19,192 23,517 n/a 42,708
2014 Scenario 1A 61,431 8,636 25,172 27,623 33,808
2014 Scenario 1B 66,870 9,139 26,777 30,955 35,916
2014 Scenario 1C 76,875 9,412 29,076 38,387 38,488
2015 Status Quo 46,070 17,267 28,803 n/a 46,070
2015 Scenario 1A 103,965 7,169 37,082 59,714 44,251
2015 Scenario 1B 113,007 7,853 39,364 65,791 47,217
2015 Scenario 1C 142,966 8,152 44,862 89,952 53,014
2016 Status Quo 50,779 15,759 35,020 n/a 50,779
2016 Scenario 1A 147,084 7,364 49,455 90,266 56,818
2016 Scenario 1B 158,567 8,292 52,405 97,870 60,697
2016 Scenario 1C 192,986 8,189 56,929 127,867 65,119
2017 Status Quo 56,631 14,508 42,123 n/a 56,631
2017 Scenario 1A 193,513 7,511 62,146 123,857 69,657
2017 Scenario 1B 207,129 8,137 65,583 133,409 73,720
2017 Scenario 1C 236,457 8,229 66,972 161,257 75,200
Projection
Year Scenario Total
Grandfathered
Business
All Geographic Areas Combined
Premium Revenue
Non-Grandfathered
Non-Exchange
Business Exchange Business
All Non-Exchange
Business
($ millions)
Table C1-2
Results by Exchange/Non Exchange and Projection Year
Individual Business
© 2012 Society of Actuaries, All Rights Reserved Milliman, Inc.
Page C-2
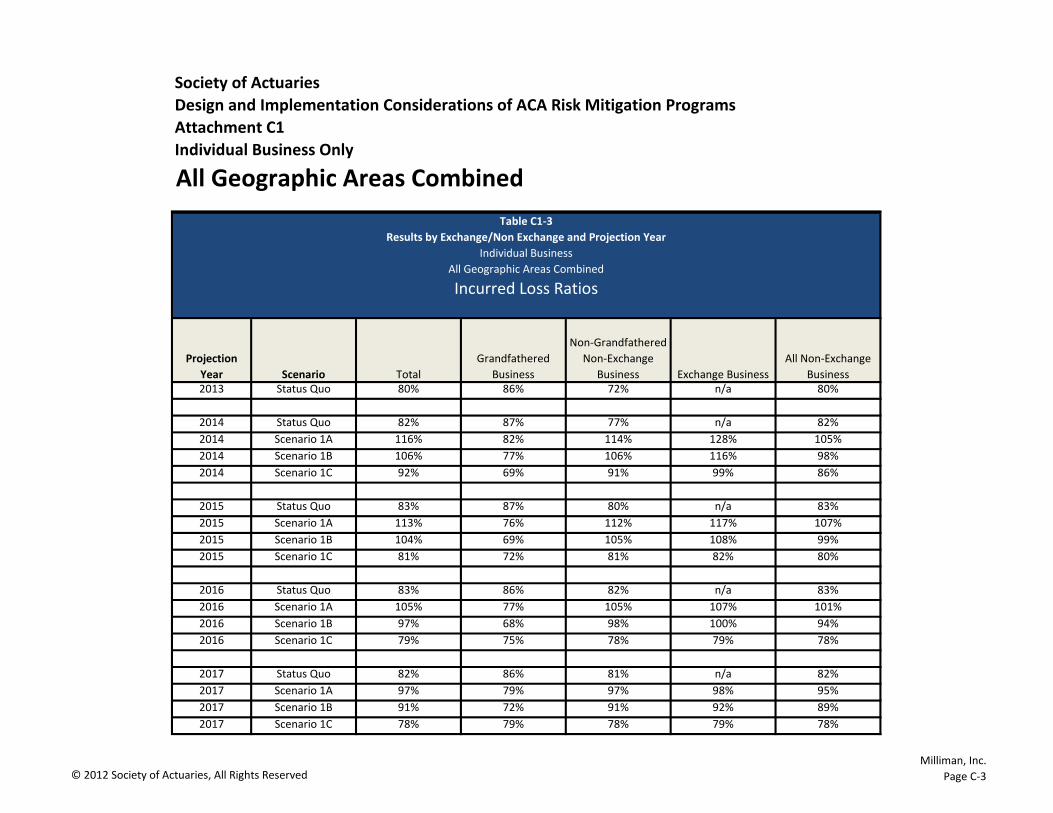
Society of Actuaries
Design and Implementation Considerations of ACA Risk Mitigation Programs
Attachment C1
Individual Business Only
All Geographic Areas Combined
Table C1-1
2013 Status Quo 80% 86% 72% n/a 80%
2014 Status Quo 82% 87% 77% n/a 82%
2014 Scenario 1A 116% 82% 114% 128% 105%
2014 Scenario 1B 106% 77% 106% 116% 98%
2014 Scenario 1C 92% 69% 91% 99% 86%
2015 Status Quo 83% 87% 80% n/a 83%
2015 Scenario 1A 113% 76% 112% 117% 107%
2015 Scenario 1B 104% 69% 105% 108% 99%
2015 Scenario 1C 81% 72% 81% 82% 80%
2016 Status Quo 83% 86% 82% n/a 83%
2016 Scenario 1A 105% 77% 105% 107% 101%
2016 Scenario 1B 97% 68% 98% 100% 94%
2016 Scenario 1C 79% 75% 78% 79% 78%
2017 Status Quo 82% 86% 81% n/a 82%
2017 Scenario 1A 97% 79% 97% 98% 95%
2017 Scenario 1B 91% 72% 91% 92% 89%
2017 Scenario 1C 78% 79% 78% 79% 78%
Exchange Business
All Non-Exchange
Business
Projection
Year Scenario Total
Grandfathered
Business
Non-Grandfathered
Non-Exchange
Business
All Geographic Areas Combined
Incurred Loss Ratios
Results by Exchange/Non Exchange and Projection Year
Individual Business
Table C1-3
© 2012 Society of Actuaries, All Rights Reserved Milliman, Inc.
Page C-3

Society of Actuaries
Design and Implementation Considerations of ACA Risk Mitigation Programs
Attachment C1
Individual Business Only
All Geographic Areas Combined
Table C1-2
2013 Status Quo 80% 86% 72% n/a 80%
2014 Status Quo 82% 87% 77% n/a 82%
2014 Scenario 1A 87% 83% 87% 88% 86%
2014 Scenario 1B 84% 78% 84% 85% 83%
2014 Scenario 1C 80% 71% 80% 82% 77%
2015 Status Quo 83% 87% 80% n/a 83%
2015 Scenario 1A 88% 77% 88% 89% 87%
2015 Scenario 1B 85% 70% 86% 86% 84%
2015 Scenario 1C 78% 73% 78% 79% 77%
2016 Status Quo 83% 86% 82% n/a 83%
2016 Scenario 1A 87% 78% 87% 87% 86%
2016 Scenario 1B 84% 68% 85% 85% 83%
2016 Scenario 1C 78% 76% 78% 79% 77%
2017 Status Quo 82% 86% 81% n/a 82%
2017 Scenario 1A 97% 79% 97% 98% 95%
2017 Scenario 1B 91% 72% 91% 93% 89%
2017 Scenario 1C 78% 79% 78% 79% 78%
Non-Grandfathered
Non-Exchange
Business Exchange Business
All Non-Exchange
Business
Projection
Year Scenario Total
Grandfathered
Business
All Geographic Areas Combined
Incurred Loss Ratios Including Impact of Risk Mitigation
Results by Exchange/Non Exchange and Projection Year
Individual Business
Table C1-4
© 2012 Society of Actuaries, All Rights Reserved Milliman, Inc.
Page C-4

Society of Actuaries
Design and Implementation Considerations of ACA Risk Mitigation Programs
Attachment C1
Individual Business Only
All Geographic Areas Combined
Table C1-1
2013 Status Quo $2,725 $2,890 $2,553 n/a n/a
2014 Status Quo $2,933 $3,233 $2,726 n/a n/a
2014 Scenario 1A $2,979 $3,430 $2,902 $2,929 $1,835
2014 Scenario 1B $3,242 $3,677 $3,146 $3,214 $1,945
2014 Scenario 1C $3,725 $4,180 $3,688 $3,654 $2,054
2015 Status Quo $3,170 $3,606 $2,955 n/a n/a
2015 Scenario 1A $3,492 $3,681 $3,427 $3,512 $1,998
2015 Scenario 1B $3,788 $4,151 $3,691 $3,809 $2,107
2015 Scenario 1C $4,808 $4,026 $4,907 $4,845 $2,361
2016 Status Quo $3,493 $4,004 $3,303 n/a n/a
2016 Scenario 1A $4,171 $3,962 $4,088 $4,237 $2,162
2016 Scenario 1B $4,490 $4,635 $4,388 $4,535 $2,279
2016 Scenario 1C $5,478 $4,208 $5,591 $5,536 $2,426
2017 Status Quo $3,897 $4,415 $3,745 n/a n/a
2017 Scenario 1A $4,942 $4,231 $4,868 $5,031 $2,368
2017 Scenario 1B $5,283 $4,737 $5,212 $5,357 $2,480
2017 Scenario 1C $6,045 $4,401 $6,158 $6,115 $2,540
Exchange Business
Exchange Business
after Subsidy
Projection
Year Scenario Total
Grandfathered
Business
Non-Grandfathered
Non-Exchange
Business
All Geographic Areas Combined
Average Annual Premiums
Results by Exchange/Non Exchange and Projection Year
Individual Business
Table C1-5
© 2012 Society of Actuaries, All Rights Reserved Milliman, Inc.
Page C-5

Society of Actuaries
Design and Implementation Considerations of ACA Risk Mitigation Programs
Attachment C1
Individual Business Only
All Geographic Areas Combined
Table C1-2
2013 Status Quo 0% 0% 0% n/a n/a
2014 Status Quo 8% 12% 7% n/a n/a
2014 Scenario 1A 9% 19% 14% 15% -28%
2014 Scenario 1B 19% 27% 23% 26% -24%
2014 Scenario 1C 37% 45% 44% 43% -20%
2015 Status Quo 8% 12% 8% n/a n/a
2015 Scenario 1A 17% 7% 18% 20% 9%
2015 Scenario 1B 17% 13% 17% 18% 8%
2015 Scenario 1C 29% -4% 33% 33% 15%
2016 Status Quo 10% 11% 12% n/a n/a
2016 Scenario 1A 19% 8% 19% 21% 8%
2016 Scenario 1B 19% 12% 19% 19% 8%
2016 Scenario 1C 14% 5% 14% 14% 3%
2017 Status Quo 12% 10% 13% n/a n/a
2017 Scenario 1A 18% 7% 19% 19% 10%
2017 Scenario 1B 18% 2% 19% 18% 9%
2017 Scenario 1C 10% 5% 10% 10% 5%
Table C1-6
Results by Exchange/Non Exchange and Projection Year
Individual Business
All Geographic Areas Combined
Change in Average Premium Each Year
Exchange Business
Exchange Business
after Subsidy
Projection
Year Scenario Total
Grandfathered
Business
Non-Grandfathered
Non-Exchange
Business
© 2012 Society of Actuaries, All Rights Reserved Milliman, Inc.
Page C-6

Society of Actuaries
Design and Implementation Considerations of ACA Risk Mitigation Programs
Attachment C1
Individual Business Only
All Geographic Areas Combined
2013 Status Quo 1.00 1.00 1.00 n/a n/a
2014 Status Quo 1.08 1.12 1.07 n/a n/a
2014 Scenario 1A 1.09 1.19 1.14 1.15 0.72
2014 Scenario 1B 1.19 1.27 1.23 1.26 0.76
2014 Scenario 1C 1.37 1.45 1.44 1.43 0.80
2015 Status Quo 1.16 1.25 1.16 n/a n/a
2015 Scenario 1A 1.28 1.27 1.34 1.38 0.78
2015 Scenario 1B 1.39 1.44 1.45 1.49 0.83
2015 Scenario 1C 1.76 1.39 1.92 1.90 0.92
2016 Status Quo 1.28 1.39 1.29 n/a n/a
2016 Scenario 1A 1.53 1.37 1.60 1.66 0.85
2016 Scenario 1B 1.65 1.60 1.72 1.78 0.89
2016 Scenario 1C 2.01 1.46 2.19 2.17 0.95
2017 Status Quo 1.43 1.53 1.47 n/a n/a
2017 Scenario 1A 1.81 1.46 1.91 1.97 0.93
2017 Scenario 1B 1.94 1.64 2.04 2.10 0.97
2017 Scenario 1C 2.22 1.52 2.41 2.40 0.99
Exchange Business
Exchange Business
after Subsidy
Projection
Year Scenario Total
Grandfathered
Business
Non-Grandfathered
Non-Exchange
Business
Table C1-7
Results by Exchange/Non Exchange and Projection Year
Individual Business
All Geographic Areas Combined
Accumulated Change in Average Premium from 2013
© 2012 Society of Actuaries, All Rights Reserved Milliman, Inc.
Page C-7

© 2012 Society of Actuaries, All Rights ReservedMilliman, Inc.
Page C-8
80%
92%
86%
80% 78%
80%
111%
107%
100%
92%
80%
128% 126%
117%
108%
50%
60%
70%
80%
90%
100%
110%
120%
130%
140%
1.00
1.10
1.20
1.30
1.40
1.50
1.60
1.70
1.80
1.90
2.00
2013 2014 2015 2016 2017
Loss
Rat
io
Acc
um
ula
ted
Ave
rage
Pre
miu
m C
han
ge
Accumulated Changes in Average Premium from Year 2013 and Annual Loss Ratios by Regulatory Grouping
Scenario 1A Most Restrictive Average Restrictive Least Restrictive

© 2012 Society of Actuaries, All Rights ReservedMilliman, Inc.
Page C-9
80%
84% 81%
79% 79% 80%
103%
100%
93%
86%
80%
118% 115%
107%
99%
50%
60%
70%
80%
90%
100%
110%
120%
130%
1.00
1.20
1.40
1.60
1.80
2.00
2.20
2013 2014 2015 2016 2017
Loss
Rat
io
Acc
um
ula
ted
Ave
rage
Pre
miu
m C
han
ge
Accumulated Changes in Average Premium from Year 2013 and Annual Loss Ratios by Regulatory Grouping
Scenario 1B Most Restrictive Average Restrictive Least Restrictive

© 2012 Society of Actuaries, All Rights ReservedMilliman, Inc.
Page C-10
80%
83%
81%
79% 79% 80%
94%
80% 79% 78%
80%
94%
82%
79% 79%
50%
55%
60%
65%
70%
75%
80%
85%
90%
95%
100%
1.00
1.20
1.40
1.60
1.80
2.00
2.20
2.40
2.60
2.80
2013 2014 2015 2016 2017
Loss
Rat
io
Acc
um
ula
ted
Ave
rage
Pre
miu
m C
han
ge
Accumulated Changes in Average Premium from Year 2013 and Annual Loss Ratios by Regulatory Grouping
Scenario 1C Most Restrictive Average Restrictive Least Restrictive

Society of Actuaries
Design and Implementation Considerations of ACA Risk Mitigation Programs
Attachment C2
Individual Business Only
Most Restrictive States Only
2013 Status Quo 1,474 751 723 n/a 1,474
2014 Status Quo 1,471 589 882 n/a 1,471
2014 Scenario 1A 1,766 212 657 897 869
2014 Scenario 1B 1,763 214 608 941 821
2014 Scenario 1C 1,765 209 603 953 812
2015 Status Quo 1,467 461 1,006 n/a 1,467
2015 Scenario 1A 2,460 146 704 1,610 850
2015 Scenario 1B 2,461 147 671 1,642 818
2015 Scenario 1C 2,464 147 677 1,640 824
2016 Status Quo 1,473 364 1,110 n/a 1,473
2016 Scenario 1A 3,053 134 779 2,140 913
2016 Scenario 1B 3,056 137 770 2,149 907
2016 Scenario 1C 3,057 137 766 2,154 903
2017 Status Quo 1,471 292 1,180 n/a 1,471
2017 Scenario 1A 3,578 124 866 2,588 989
2017 Scenario 1B 3,582 126 857 2,599 983
2017 Scenario 1C 3,577 126 851 2,600 978
(thousands)
All Non-Exchange
Business
Table C2-1
Results by Exchange/Non Exchange and Projection Year
Individual Business
Most Restrictive States Only
Enrollment
Projection
Year Scenario Total
Grandfathered
Business
Non-Grandfathered
Non-Exchange
Business Exchange Business
© 2012 Society of Actuaries, All Rights Reserved Milliman, Inc.
Page C-11

Society of Actuaries
Design and Implementation Considerations of ACA Risk Mitigation Programs
Attachment C2
Individual Business Only
Most Restrictive States Only
Table C2-1
2013 Status Quo 80% 92% 64% n/a 80%
2014 Status Quo 83% 94% 73% n/a 83%
2014 Scenario 1A 92% 88% 85% 98% 86%
2014 Scenario 1B 84% 88% 76% 87% 80%
2014 Scenario 1C 83% 88% 77% 86% 80%
2015 Status Quo 86% 93% 81% n/a 86%
2015 Scenario 1A 86% 82% 83% 88% 82%
2015 Scenario 1B 81% 86% 78% 82% 80%
2015 Scenario 1C 81% 82% 79% 81% 80%
2016 Status Quo 88% 94% 84% n/a 88%
2016 Scenario 1A 80% 80% 78% 81% 79%
2016 Scenario 1B 79% 84% 77% 80% 78%
2016 Scenario 1C 79% 80% 78% 79% 78%
2017 Status Quo 86% 93% 83% n/a 86%
2017 Scenario 1A 78% 82% 77% 78% 78%
2017 Scenario 1B 79% 82% 77% 79% 78%
2017 Scenario 1C 79% 81% 78% 79% 79%
All Non-Exchange
Business
Projection
Year Scenario Total
Grandfathered
Business
Non-Grandfathered
Non-Exchange
Business Exchange Business
Individual Business
Most Restrictive States Only
Incurred Loss Ratios
Table C2-2
Results by Exchange/Non Exchange and Projection Year
© 2012 Society of Actuaries, All Rights Reserved Milliman, Inc.
Page C-12

Society of Actuaries
Design and Implementation Considerations of ACA Risk Mitigation Programs
Attachment C2
Individual Business Only
Most Restrictive States Only
2013 Status Quo 80% 92% 64% n/a 80%
2014 Status Quo 83% 94% 73% n/a 83%
2014 Scenario 1A 81% 89% 78% 81% 81%
2014 Scenario 1B 78% 89% 75% 77% 79%
2014 Scenario 1C 78% 88% 75% 77% 79%
2015 Status Quo 86% 93% 81% n/a 86%
2015 Scenario 1A 81% 82% 80% 82% 81%
2015 Scenario 1B 79% 87% 78% 79% 80%
2015 Scenario 1C 79% 83% 78% 79% 79%
2016 Status Quo 88% 94% 84% n/a 88%
2016 Scenario 1A 79% 80% 78% 80% 79%
2016 Scenario 1B 79% 84% 78% 79% 79%
2016 Scenario 1C 79% 80% 78% 79% 78%
2017 Status Quo 86% 93% 83% n/a 86%
2017 Scenario 1A 78% 82% 78% 78% 78%
2017 Scenario 1B 79% 82% 77% 79% 78%
2017 Scenario 1C 79% 81% 78% 79% 79%
All Non-Exchange
Business
Grandfathered
Business
Non-Grandfathered
Non-Exchange
Business
Projection
Year Scenario Total Exchange Business
Individual Business
Most Restrictive States Only
Incurred Loss Ratios Including Impact of Risk Mitigation
Table C2-3
Results by Exchange/Non Exchange and Projection Year
© 2012 Society of Actuaries, All Rights Reserved Milliman, Inc.
Page C-13
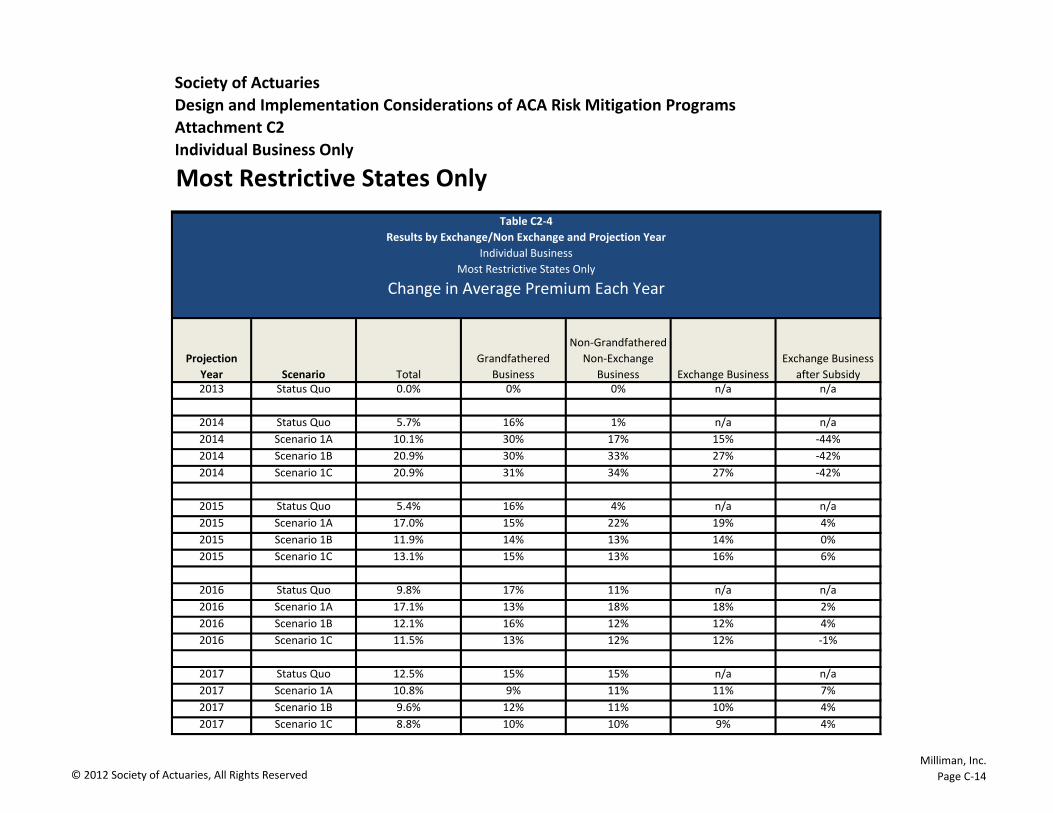
Society of Actuaries
Design and Implementation Considerations of ACA Risk Mitigation Programs
Attachment C2
Individual Business Only
Most Restrictive States Only
2013 Status Quo 0.0% 0% 0% n/a n/a
2014 Status Quo 5.7% 16% 1% n/a n/a
2014 Scenario 1A 10.1% 30% 17% 15% -44%
2014 Scenario 1B 20.9% 30% 33% 27% -42%
2014 Scenario 1C 20.9% 31% 34% 27% -42%
2015 Status Quo 5.4% 16% 4% n/a n/a
2015 Scenario 1A 17.0% 15% 22% 19% 4%
2015 Scenario 1B 11.9% 14% 13% 14% 0%
2015 Scenario 1C 13.1% 15% 13% 16% 6%
2016 Status Quo 9.8% 17% 11% n/a n/a
2016 Scenario 1A 17.1% 13% 18% 18% 2%
2016 Scenario 1B 12.1% 16% 12% 12% 4%
2016 Scenario 1C 11.5% 13% 12% 12% -1%
2017 Status Quo 12.5% 15% 15% n/a n/a
2017 Scenario 1A 10.8% 9% 11% 11% 7%
2017 Scenario 1B 9.6% 12% 11% 10% 4%
2017 Scenario 1C 8.8% 10% 10% 9% 4%
Table C2-4
Results by Exchange/Non Exchange and Projection Year
Individual Business
Most Restrictive States Only
Change in Average Premium Each Year
Projection
Year Scenario Total
Grandfathered
Business
Non-Grandfathered
Non-Exchange
Business Exchange Business
Exchange Business
after Subsidy
© 2012 Society of Actuaries, All Rights Reserved Milliman, Inc.
Page C-14

Society of Actuaries
Design and Implementation Considerations of ACA Risk Mitigation Programs
Attachment C2
Individual Business Only
Most Restrictive States Only
2013 Status Quo 1.00 1.00 1.00 n/a n/a
2014 Status Quo 1.06 1.16 1.01 n/a n/a
2014 Scenario 1A 1.10 1.30 1.17 1.15 0.56
2014 Scenario 1B 1.21 1.30 1.33 1.27 0.58
2014 Scenario 1C 1.21 1.31 1.34 1.27 0.58
2015 Status Quo 1.11 1.34 1.05 n/a n/a
2015 Scenario 1A 1.29 1.49 1.43 1.37 0.58
2015 Scenario 1B 1.35 1.48 1.51 1.45 0.58
2015 Scenario 1C 1.37 1.51 1.51 1.47 0.62
2016 Status Quo 1.22 1.56 1.17 n/a n/a
2016 Scenario 1A 1.51 1.68 1.69 1.62 0.59
2016 Scenario 1B 1.52 1.71 1.69 1.63 0.60
2016 Scenario 1C 1.52 1.71 1.70 1.64 0.61
2017 Status Quo 1.38 1.81 1.35 n/a n/a
2017 Scenario 1A 1.67 1.83 1.87 1.81 0.63
2017 Scenario 1B 1.66 1.91 1.87 1.78 0.63
2017 Scenario 1C 1.66 1.87 1.86 1.78 0.63
Exchange Business
Exchange Business
after Subsidy
Projection
Year Scenario Total
Grandfathered
Business
Non-Grandfathered
Non-Exchange
Business
Table C2-5
Results by Exchange/Non Exchange and Projection Year
Individual Business
Most Restrictive States Only
Accumulated Change in Average Premium from 2013
© 2012 Society of Actuaries, All Rights Reserved Milliman, Inc.
Page C-15

Society of Actuaries
Design and Implementation Considerations of ACA Risk Mitigation Programs
Attachment C3
Individual Business Only
Average Restrictive States Only
2013 Status Quo 5,004 2,544 2,460 n/a 5,004
2014 Status Quo 5,003 2,051 2,952 n/a 5,003
2014 Scenario 1A 6,641 864 2,777 3,000 3,641
2014 Scenario 1B 6,642 855 2,752 3,035 3,607
2014 Scenario 1C 6,649 812 2,584 3,253 3,396
2015 Status Quo 5,001 1,664 3,337 n/a 5,001
2015 Scenario 1A 9,623 667 3,465 5,490 4,132
2015 Scenario 1B 9,627 661 3,450 5,517 4,111
2015 Scenario 1C 9,649 756 2,995 5,897 3,752
2016 Status Quo 5,015 1,376 3,639 n/a 5,015
2016 Scenario 1A 11,402 639 3,863 6,900 4,502
2016 Scenario 1B 11,395 636 3,856 6,903 4,492
2016 Scenario 1C 11,420 724 3,366 7,329 4,090
2017 Status Quo 5,025 1,156 3,869 n/a 5,025
2017 Scenario 1A 12,699 613 4,070 8,016 4,683
2017 Scenario 1B 12,682 614 4,059 8,009 4,673
2017 Scenario 1C 12,712 694 3,615 8,404 4,308
(thousands)
All Non-Exchange
Business
Table C3-1
Results by Exchange/Non Exchange and Projection Year
Individual Business
Average Restrictive States Only
Enrollment
Projection
Year Scenario Total
Grandfathered
Business
Non-Grandfathered
Non-Exchange
Business Exchange Business
© 2012 Society of Actuaries, All Rights Reserved Milliman, Inc.
Page C-16
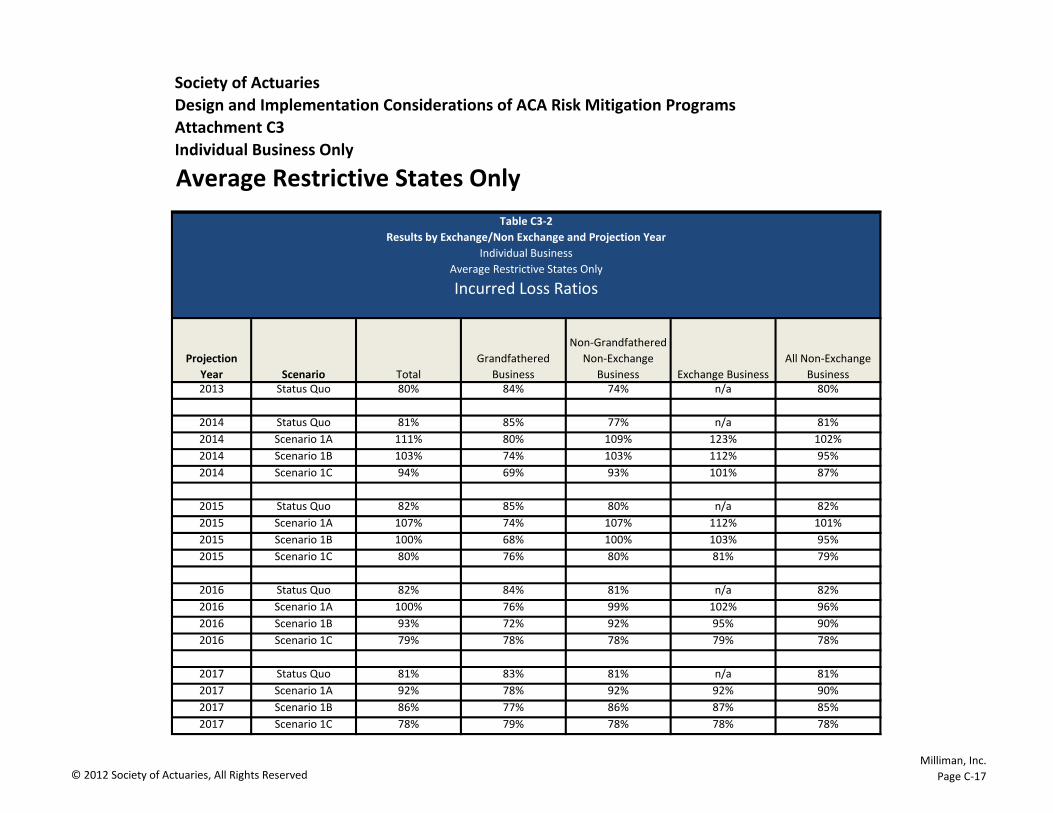
Society of Actuaries
Design and Implementation Considerations of ACA Risk Mitigation Programs
Attachment C3
Individual Business Only
Average Restrictive States Only
Table C3-1
2013 Status Quo 80% 84% 74% n/a 80%
2014 Status Quo 81% 85% 77% n/a 81%
2014 Scenario 1A 111% 80% 109% 123% 102%
2014 Scenario 1B 103% 74% 103% 112% 95%
2014 Scenario 1C 94% 69% 93% 101% 87%
2015 Status Quo 82% 85% 80% n/a 82%
2015 Scenario 1A 107% 74% 107% 112% 101%
2015 Scenario 1B 100% 68% 100% 103% 95%
2015 Scenario 1C 80% 76% 80% 81% 79%
2016 Status Quo 82% 84% 81% n/a 82%
2016 Scenario 1A 100% 76% 99% 102% 96%
2016 Scenario 1B 93% 72% 92% 95% 90%
2016 Scenario 1C 79% 78% 78% 79% 78%
2017 Status Quo 81% 83% 81% n/a 81%
2017 Scenario 1A 92% 78% 92% 92% 90%
2017 Scenario 1B 86% 77% 86% 87% 85%
2017 Scenario 1C 78% 79% 78% 78% 78%
All Non-Exchange
Business
Projection
Year Scenario Total
Grandfathered
Business
Non-Grandfathered
Non-Exchange
Business Exchange Business
Individual Business
Average Restrictive States Only
Incurred Loss Ratios
Table C3-2
Results by Exchange/Non Exchange and Projection Year
© 2012 Society of Actuaries, All Rights Reserved Milliman, Inc.
Page C-17

Society of Actuaries
Design and Implementation Considerations of ACA Risk Mitigation Programs
Attachment C3
Individual Business Only
Average Restrictive States Only
2013 Status Quo 80% 84% 74% n/a 80%
2014 Status Quo 81% 85% 77% n/a 81%
2014 Scenario 1A 86% 82% 86% 87% 85%
2014 Scenario 1B 82% 76% 82% 85% 80%
2014 Scenario 1C 79% 71% 79% 82% 77%
2015 Status Quo 82% 85% 80% n/a 82%
2015 Scenario 1A 87% 75% 87% 88% 85%
2015 Scenario 1B 84% 69% 85% 86% 82%
2015 Scenario 1C 78% 77% 76% 79% 76%
2016 Status Quo 82% 84% 81% n/a 82%
2016 Scenario 1A 86% 77% 86% 87% 85%
2016 Scenario 1B 83% 73% 83% 84% 82%
2016 Scenario 1C 78% 78% 77% 78% 77%
2017 Status Quo 81% 83% 81% n/a 81%
2017 Scenario 1A 92% 78% 90% 93% 89%
2017 Scenario 1B 86% 77% 85% 88% 84%
2017 Scenario 1C 78% 79% 77% 79% 77%
All Non-Exchange
Business
Grandfathered
Business
Non-Grandfathered
Non-Exchange
Business
Projection
Year Scenario Total Exchange Business
Individual Business
Average Restrictive States Only
Incurred Loss Ratios Including Impact of Risk Mitigation
Table C3-3
Results by Exchange/Non Exchange and Projection Year
© 2012 Society of Actuaries, All Rights Reserved Milliman, Inc.
Page C-18

Society of Actuaries
Design and Implementation Considerations of ACA Risk Mitigation Programs
Attachment C3
Individual Business Only
Average Restrictive States Only
2013 Status Quo 0.0% 0% 0% n/a n/a
2014 Status Quo 8.2% 11% 8% n/a n/a
2014 Scenario 1A 11.9% 19% 17% 16% -28%
2014 Scenario 1B 21.1% 29% 27% 25% -23%
2014 Scenario 1C 32.7% 39% 40% 37% -23%
2015 Status Quo 8.4% 10% 9% n/a n/a
2015 Scenario 1A 18.1% 8% 20% 20% 10%
2015 Scenario 1B 18.2% 9% 20% 20% 10%
2015 Scenario 1C 31.9% -5% 37% 36% 18%
2016 Status Quo 9.8% 10% 11% n/a n/a
2016 Scenario 1A 19.2% 6% 20% 20% 8%
2016 Scenario 1B 18.9% 3% 20% 20% 9%
2016 Scenario 1C 13.1% 7% 13% 13% 4%
2017 Status Quo 11.3% 9% 13% n/a n/a
2017 Scenario 1A 19.3% 7% 20% 20% 9%
2017 Scenario 1B 18.1% 1% 19% 19% 8%
2017 Scenario 1C 10.2% 8% 10% 10% 4%
Table C3-4
Results by Exchange/Non Exchange and Projection Year
Individual Business
Average Restrictive States Only
Change in Average Premium Each Year
Projection
Year Scenario Total
Grandfathered
Business
Non-Grandfathered
Non-Exchange
Business Exchange Business
Exchange Business
after Subsidy
© 2012 Society of Actuaries, All Rights Reserved Milliman, Inc.
Page C-19

Society of Actuaries
Design and Implementation Considerations of ACA Risk Mitigation Programs
Attachment C3
Individual Business Only
Average Restrictive States Only
2013 Status Quo 1.00 1.00 1.00 n/a n/a
2014 Status Quo 1.08 1.11 1.08 n/a n/a
2014 Scenario 1A 1.12 1.19 1.17 1.16 0.72
2014 Scenario 1B 1.21 1.29 1.27 1.25 0.77
2014 Scenario 1C 1.33 1.39 1.40 1.37 0.77
2015 Status Quo 1.17 1.22 1.18 n/a n/a
2015 Scenario 1A 1.32 1.28 1.40 1.39 0.79
2015 Scenario 1B 1.43 1.41 1.52 1.50 0.85
2015 Scenario 1C 1.75 1.31 1.92 1.86 0.91
2016 Status Quo 1.29 1.35 1.31 n/a n/a
2016 Scenario 1A 1.57 1.36 1.68 1.67 0.85
2016 Scenario 1B 1.70 1.44 1.82 1.80 0.92
2016 Scenario 1C 1.98 1.40 2.17 2.11 0.95
2017 Status Quo 1.43 1.47 1.48 n/a n/a
2017 Scenario 1A 1.88 1.46 2.02 2.00 0.93
2017 Scenario 1B 2.01 1.47 2.16 2.14 1.00
2017 Scenario 1C 2.18 1.51 2.38 2.33 0.99
Exchange Business
Exchange Business
after Subsidy
Projection
Year Scenario Total
Grandfathered
Business
Non-Grandfathered
Non-Exchange
Business
Table C3-5
Results by Exchange/Non Exchange and Projection Year
Individual Business
Average Restrictive States Only
Accumulated Change in Average Premium from 2013
© 2012 Society of Actuaries, All Rights Reserved Milliman, Inc.
Page C-20

Society of Actuaries
Design and Implementation Considerations of ACA Risk Mitigation Programs
Attachment C4
Individual Business Only
Least Restrictive States Only
2013 Status Quo 8,117 4,130 3,987 n/a 8,117
2014 Status Quo 8,089 3,295 4,794 n/a 8,089
2014 Scenario 1A 12,215 1,442 5,240 5,534 6,682
2014 Scenario 1B 12,223 1,416 5,153 5,653 6,570
2014 Scenario 1C 12,226 1,231 4,696 6,299 5,927
2015 Status Quo 8,067 2,664 5,403 n/a 8,067
2015 Scenario 1A 17,689 1,134 6,651 9,904 7,786
2015 Scenario 1B 17,743 1,083 6,545 10,114 7,629
2015 Scenario 1C 17,621 1,121 5,470 11,029 6,592
2016 Status Quo 8,050 2,197 5,853 n/a 8,050
2016 Scenario 1A 20,805 1,085 7,457 12,263 8,542
2016 Scenario 1B 20,863 1,017 7,316 12,531 8,332
2016 Scenario 1C 20,752 1,085 6,051 13,616 7,136
2017 Status Quo 8,037 1,838 6,199 n/a 8,037
2017 Scenario 1A 22,883 1,038 7,832 14,013 8,870
2017 Scenario 1B 22,942 977 7,667 14,297 8,645
2017 Scenario 1C 22,824 1,050 6,409 15,365 7,459
(thousands)
All Non-Exchange
Business
Table C4-1
Results by Exchange/Non Exchange and Projection Year
Individual Business
Least Restrictive States Only
Enrollment
Projection
Year Scenario Total
Grandfathered
Business
Non-Grandfathered
Non-Exchange
Business Exchange Business
© 2012 Society of Actuaries, All Rights Reserved Milliman, Inc.
Page C-21

Society of Actuaries
Design and Implementation Considerations of ACA Risk Mitigation Programs
Attachment C4
Individual Business Only
Least Restrictive States Only
Table C4-1
2013 Status Quo 80% 85% 74% n/a 80%
2014 Status Quo 81% 85% 78% n/a 81%
2014 Scenario 1A 128% 79% 126% 145% 115%
2014 Scenario 1B 118% 73% 117% 131% 107%
2014 Scenario 1C 94% 62% 94% 101% 87%
2015 Status Quo 82% 85% 80% n/a 82%
2015 Scenario 1A 126% 75% 124% 133% 117%
2015 Scenario 1B 115% 64% 115% 122% 107%
2015 Scenario 1C 82% 66% 82% 83% 80%
2016 Status Quo 82% 84% 81% n/a 82%
2016 Scenario 1A 117% 76% 115% 121% 111%
2016 Scenario 1B 107% 60% 107% 111% 100%
2016 Scenario 1C 79% 72% 79% 79% 78%
2017 Status Quo 81% 84% 80% n/a 81%
2017 Scenario 1A 108% 79% 106% 110% 104%
2017 Scenario 1B 99% 65% 98% 101% 95%
2017 Scenario 1C 79% 77% 78% 79% 78%
All Non-Exchange
Business
Projection
Year Scenario Total
Grandfathered
Business
Non-Grandfathered
Non-Exchange
Business Exchange Business
Individual Business
Least Restrictive States Only
Incurred Loss Ratios
Table C4-2
Results by Exchange/Non Exchange and Projection Year
© 2012 Society of Actuaries, All Rights Reserved Milliman, Inc.
Page C-22

Society of Actuaries
Design and Implementation Considerations of ACA Risk Mitigation Programs
Attachment C4
Individual Business Only
Least Restrictive States Only
2013 Status Quo 80% 85% 74% n/a 80%
2014 Status Quo 81% 85% 78% n/a 81%
2014 Scenario 1A 89% 81% 90% 91% 88%
2014 Scenario 1B 87% 75% 89% 89% 85%
2014 Scenario 1C 80% 63% 81% 83% 77%
2015 Status Quo 82% 85% 80% n/a 82%
2015 Scenario 1A 91% 77% 91% 92% 89%
2015 Scenario 1B 88% 65% 90% 90% 86%
2015 Scenario 1C 79% 67% 78% 80% 77%
2016 Status Quo 82% 84% 81% n/a 82%
2016 Scenario 1A 90% 77% 90% 90% 89%
2016 Scenario 1B 87% 60% 88% 88% 85%
2016 Scenario 1C 78% 72% 78% 79% 77%
2017 Status Quo 81% 84% 80% n/a 81%
2017 Scenario 1A 108% 79% 106% 110% 104%
2017 Scenario 1B 99% 65% 98% 101% 95%
2017 Scenario 1C 79% 77% 78% 79% 78%
All Non-Exchange
Business
Grandfathered
Business
Non-Grandfathered
Non-Exchange
Business
Projection
Year Scenario Total Exchange Business
Individual Business
Least Restrictive States Only
Incurred Loss Ratios Including Impact of Risk Mitigation
Table C4-3
Results by Exchange/Non Exchange and Projection Year
© 2012 Society of Actuaries, All Rights Reserved Milliman, Inc.
Page C-23

Society of Actuaries
Design and Implementation Considerations of ACA Risk Mitigation Programs
Attachment C4
Individual Business Only
Least Restrictive States Only
2013 Status Quo 0% 0% 0% n/a n/a
2014 Status Quo 8% 11% 8% n/a n/a
2014 Scenario 1A 13% 21% 19% 17% -19%
2014 Scenario 1B 23% 31% 28% 28% -15%
2014 Scenario 1C 53% 59% 61% 59% -6%
2015 Status Quo 9% 11% 10% n/a n/a
2015 Scenario 1A 18% 7% 19% 20% 10%
2015 Scenario 1B 19% 18% 20% 20% 10%
2015 Scenario 1C 33% -4% 37% 36% 16%
2016 Status Quo 11% 10% 12% n/a n/a
2016 Scenario 1A 19% 8% 20% 20% 9%
2016 Scenario 1B 19% 17% 20% 20% 9%
2016 Scenario 1C 14% 1% 15% 15% 3%
2017 Status Quo 11% 10% 13% n/a n/a
2017 Scenario 1A 19% 7% 20% 20% 10%
2017 Scenario 1B 19% 0% 20% 20% 10%
2017 Scenario 1C 10% 1% 10% 10% 5%
Table C4-4
Results by Exchange/Non Exchange and Projection Year
Individual Business
Least Restrictive States Only
Change in Average Premium Each Year
Projection
Year Scenario Total
Grandfathered
Business
Non-Grandfathered
Non-Exchange
Business Exchange Business
Exchange Business
after Subsidy
© 2012 Society of Actuaries, All Rights Reserved Milliman, Inc.
Page C-24
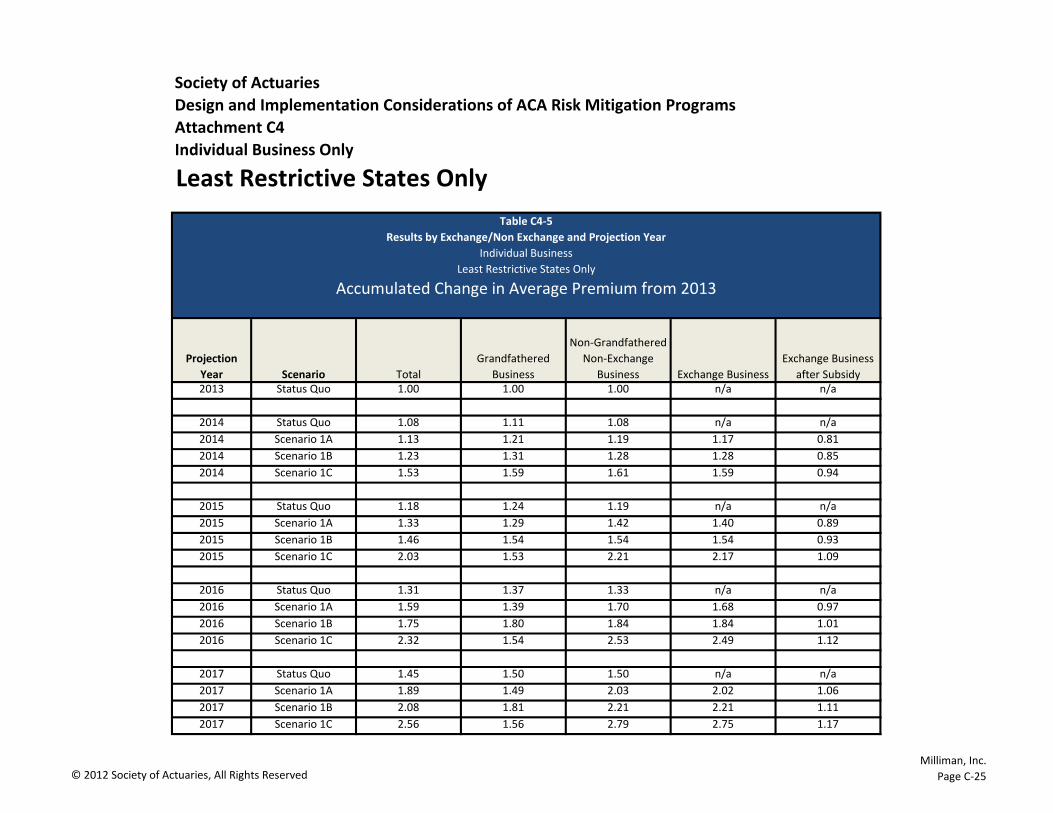
Society of Actuaries
Design and Implementation Considerations of ACA Risk Mitigation Programs
Attachment C4
Individual Business Only
Least Restrictive States Only
2013 Status Quo 1.00 1.00 1.00 n/a n/a
2014 Status Quo 1.08 1.11 1.08 n/a n/a
2014 Scenario 1A 1.13 1.21 1.19 1.17 0.81
2014 Scenario 1B 1.23 1.31 1.28 1.28 0.85
2014 Scenario 1C 1.53 1.59 1.61 1.59 0.94
2015 Status Quo 1.18 1.24 1.19 n/a n/a
2015 Scenario 1A 1.33 1.29 1.42 1.40 0.89
2015 Scenario 1B 1.46 1.54 1.54 1.54 0.93
2015 Scenario 1C 2.03 1.53 2.21 2.17 1.09
2016 Status Quo 1.31 1.37 1.33 n/a n/a
2016 Scenario 1A 1.59 1.39 1.70 1.68 0.97
2016 Scenario 1B 1.75 1.80 1.84 1.84 1.01
2016 Scenario 1C 2.32 1.54 2.53 2.49 1.12
2017 Status Quo 1.45 1.50 1.50 n/a n/a
2017 Scenario 1A 1.89 1.49 2.03 2.02 1.06
2017 Scenario 1B 2.08 1.81 2.21 2.21 1.11
2017 Scenario 1C 2.56 1.56 2.79 2.75 1.17
Exchange Business
Exchange Business
after Subsidy
Projection
Year Scenario Total
Grandfathered
Business
Non-Grandfathered
Non-Exchange
Business
Table C4-5
Results by Exchange/Non Exchange and Projection Year
Individual Business
Least Restrictive States Only
Accumulated Change in Average Premium from 2013
© 2012 Society of Actuaries, All Rights Reserved Milliman, Inc.
Page C-25

© 2012 Society of Actuaries, All Rights Reserved Milliman, Inc.
Attachment D
Projection Results – Exchange/3Rs Scenarios
D-1: Individual Business Only: All Geographic Areas Combined - Scenarios 1 – 5 and Status Quo
D-2: Individual Business Only: Most Restrictive State Grouping - Scenarios 1 – 5 and Status Quo
D-3: Individual Business Only: Average Restrictive State Grouping - Scenarios 1 – 5 and Status Quo
D-4: Individual Business Only: Least Restrictive State Grouping - Scenarios 1 – 5 and Status Quo

Society of Actuaries
Design and Implementation Considerations of ACA Risk Mitigation Programs
Attachment D1
Individual Business Only
All Geographic Areas Combined
2013 Status Quo 14,594 7,425 7,169 n/a 14,594
2014 Status Quo 14,563 5,936 8,628 n/a 14,563
2014 Scenario 1 20,622 2,518 8,674 9,430 11,192
2014 Scenario 2 20,619 2,506 11,421 6,692 13,927
2014 Scenario 3 20,614 2,509 9,021 9,084 11,530
2014 Scenario 4 18,140 2,303 7,981 7,856 10,284
2014 Scenario 5 20,641 2,511 8,665 9,465 11,176
2015 Status Quo 14,535 4,789 9,746 n/a 14,535
2015 Scenario 1 29,772 1,947 10,821 17,004 12,768
2015 Scenario 2 29,795 1,924 15,270 12,601 17,194
2015 Scenario 3 29,828 1,937 11,467 16,424 13,403
2015 Scenario 4 25,790 1,814 10,073 13,903 11,888
2015 Scenario 5 29,731 1,950 10,763 17,018 12,713
2016 Status Quo 14,538 3,936 10,602 n/a 14,538
2016 Scenario 1 35,259 1,859 12,098 21,302 13,957
2016 Scenario 2 35,278 1,833 17,315 16,130 19,148
2016 Scenario 3 35,321 1,844 12,847 20,631 14,690
2016 Scenario 4 30,237 1,737 11,330 17,169 13,067
2016 Scenario 5 35,202 1,862 12,024 21,317 13,885
2017 Status Quo 14,534 3,286 11,247 n/a 14,534
2017 Scenario 1 39,160 1,775 12,767 24,618 14,543
2017 Scenario 2 39,167 1,744 18,386 19,037 20,130
2017 Scenario 3 39,214 1,761 13,547 23,906 15,307
2017 Scenario 4 33,541 1,665 12,072 19,803 13,738
2017 Scenario 5 39,119 1,778 12,700 24,641 14,478
(thousands)
All Geographic Areas Combined
Enrollment
Projection
Year Scenario Total
Grandfathered
Business
Non-Grandfathered
Non-Exchange
Business Exchange Business
All Non-Exchange
Business
Table D1-1
Results by Exchange/Non Exchange and Projection Year
Individual Business
© 2012 Society of Actuaries, All Rights Reserved Milliman, Inc.
Page D-1

Society of Actuaries
Design and Implementation Considerations of ACA Risk Mitigation Programs
Attachment D1
Individual Business Only
All Geographic Areas Combined
2013 Status Quo 39,764 21,461 18,303 n/a 39,764
2014 Status Quo 42,708 19,192 23,517 n/a 42,708
2014 Scenario 1 61,431 8,636 25,172 27,623 33,808
2014 Scenario 2 60,439 8,580 32,942 18,917 41,522
2014 Scenario 3 61,486 8,610 26,202 26,674 34,812
2014 Scenario 4 55,309 8,048 23,629 23,632 31,677
2014 Scenario 5 61,683 8,608 25,250 27,825 33,858
2015 Status Quo 46,070 17,267 28,803 n/a 46,070
2015 Scenario 1 103,965 7,169 37,082 59,714 44,251
2015 Scenario 2 102,154 7,071 52,151 42,932 59,222
2015 Scenario 3 104,350 7,149 39,337 57,864 46,486
2015 Scenario 4 92,286 6,807 35,137 50,342 41,944
2015 Scenario 5 104,226 7,162 37,021 60,043 44,183
2016 Status Quo 50,779 15,759 35,020 n/a 50,779
2016 Scenario 1 147,084 7,364 49,455 90,266 56,818
2016 Scenario 2 144,088 7,290 70,302 66,496 77,592
2016 Scenario 3 147,598 7,338 52,537 87,723 59,875
2016 Scenario 4 129,172 7,096 47,060 75,015 54,157
2016 Scenario 5 147,502 7,368 49,350 90,784 56,718
2017 Status Quo 56,631 14,508 42,123 n/a 56,631
2017 Scenario 1 193,513 7,511 62,146 123,857 69,657
2017 Scenario 2 189,479 7,430 88,776 93,273 96,206
2017 Scenario 3 194,049 7,508 65,933 120,608 73,440
2017 Scenario 4 169,632 7,305 59,581 102,747 66,885
2017 Scenario 5 194,111 7,557 62,090 124,465 69,646
($ millions)
Total
Grandfathered
Business
Non-Grandfathered
Non-Exchange
Business
All Geographic Areas Combined
Premium Revenue
Exchange Business
All Non-Exchange
Business
Projection
Year Scenario
Table D1-2
Results by Exchange/Non Exchange and Projection Year
Individual Business
© 2012 Society of Actuaries, All Rights Reserved Milliman, Inc.
Page D-2

Society of Actuaries
Design and Implementation Considerations of ACA Risk Mitigation Programs
Attachment D1
Individual Business Only
All Geographic Areas Combined
Table D1-1
2013 Status Quo 80% 86% 72% n/a 80%
2014 Status Quo 82% 87% 77% n/a 82%
2014 Scenario 1 116% 82% 114% 128% 105%
2014 Scenario 2 115% 82% 117% 128% 110%
2014 Scenario 3 115% 82% 114% 127% 106%
2014 Scenario 4 113% 82% 113% 125% 105%
2014 Scenario 5 115% 81% 113% 128% 105%
2015 Status Quo 83% 87% 80% n/a 83%
2015 Scenario 1 113% 76% 112% 117% 107%
2015 Scenario 2 112% 77% 114% 116% 110%
2015 Scenario 3 112% 77% 113% 116% 107%
2015 Scenario 4 111% 78% 112% 114% 107%
2015 Scenario 5 112% 77% 112% 116% 106%
2016 Status Quo 83% 86% 82% n/a 83%
2016 Scenario 1 105% 77% 105% 107% 101%
2016 Scenario 2 105% 78% 106% 106% 104%
2016 Scenario 3 104% 78% 105% 106% 101%
2016 Scenario 4 103% 78% 105% 104% 101%
2016 Scenario 5 104% 78% 104% 106% 100%
2017 Status Quo 82% 86% 81% n/a 82%
2017 Scenario 1 97% 79% 97% 98% 95%
2017 Scenario 2 97% 79% 99% 97% 97%
2017 Scenario 3 97% 79% 97% 97% 96%
2017 Scenario 4 96% 80% 97% 96% 95%
2017 Scenario 5 97% 79% 97% 98% 95%
Exchange Business
All Geographic Areas Combined
Incurred Loss Ratios
All Non-Exchange
Business
Table D1-3
Results by Exchange/Non Exchange and Projection Year
Projection
Year Scenario Total
Grandfathered
Business
Non-Grandfathered
Non-Exchange
Business
Individual Business
© 2012 Society of Actuaries, All Rights Reserved Milliman, Inc.
Page D-3

Society of Actuaries
Design and Implementation Considerations of ACA Risk Mitigation Programs
Attachment D1
Individual Business Only
All Geographic Areas Combined
Table D1-2
2013 Status Quo 80% 86% 72% n/a 80%
2014 Status Quo 82% 87% 77% n/a 82%
2014 Scenario 1 87% 83% 87% 88% 86%
2014 Scenario 2 87% 83% 87% 88% 86%
2014 Scenario 3 87% 83% 87% 87% 86%
2014 Scenario 4 86% 84% 86% 86% 85%
2014 Scenario 5 87% 83% 87% 87% 86%
2015 Status Quo 83% 87% 80% n/a 83%
2015 Scenario 1 88% 77% 88% 89% 87%
2015 Scenario 2 88% 78% 88% 89% 87%
2015 Scenario 3 88% 78% 88% 88% 87%
2015 Scenario 4 87% 79% 88% 88% 86%
2015 Scenario 5 88% 78% 88% 88% 87%
2016 Status Quo 83% 86% 82% n/a 83%
2016 Scenario 1 87% 78% 87% 87% 86%
2016 Scenario 2 87% 79% 87% 87% 86%
2016 Scenario 3 86% 78% 87% 87% 86%
2016 Scenario 4 86% 79% 87% 86% 86%
2016 Scenario 5 86% 79% 87% 87% 86%
2017 Status Quo 82% 86% 81% n/a 82%
2017 Scenario 1 97% 79% 97% 98% 95%
2017 Scenario 2 97% 79% 98% 98% 97%
2017 Scenario 3 97% 79% 97% 97% 96%
2017 Scenario 4 96% 80% 96% 97% 94%
2017 Scenario 5 97% 79% 97% 98% 95%
Scenario Total
Grandfathered
Business
Non-Grandfathered
Non-Exchange
Business
Individual Business
All Geographic Areas Combined
Incurred Loss Ratios Including Impact of Risk Mitigation
Exchange Business
All Non-Exchange
Business
Projection
Year
Table D1-4
Results by Exchange/Non Exchange and Projection Year
© 2012 Society of Actuaries, All Rights Reserved Milliman, Inc.
Page D-4

Society of Actuaries
Design and Implementation Considerations of ACA Risk Mitigation Programs
Attachment D2
Individual Business Only
Most Restrictive States Only
2013 Status Quo 1,474 751 723 n/a 1,474
2014 Status Quo 1,471 589 882 n/a 1,471
2014 Scenario 1 1,766 212 657 897 869
2014 Scenario 2 1,763 212 831 720 1,043
2014 Scenario 3 1,764 213 685 866 898
2014 Scenario 4 1,602 202 633 767 835
2014 Scenario 5 1,766 212 657 897 869
2015 Status Quo 1,467 461 1,006 n/a 1,467
2015 Scenario 1 2,460 146 704 1,610 850
2015 Scenario 2 2,469 144 971 1,354 1,115
2015 Scenario 3 2,465 148 749 1,568 897
2015 Scenario 4 2,204 144 697 1,362 842
2015 Scenario 5 2,458 147 699 1,613 845
2016 Status Quo 1,473 364 1,110 n/a 1,473
2016 Scenario 1 3,053 134 779 2,140 913
2016 Scenario 2 3,061 132 1,084 1,845 1,215
2016 Scenario 3 3,064 136 838 2,090 974
2016 Scenario 4 2,693 135 783 1,775 918
2016 Scenario 5 3,052 136 778 2,138 914
2017 Status Quo 1,471 292 1,180 n/a 1,471
2017 Scenario 1 3,578 124 866 2,588 989
2017 Scenario 2 3,586 119 1,178 2,290 1,296
2017 Scenario 3 3,586 126 923 2,537 1,049
2017 Scenario 4 3,142 125 865 2,152 990
2017 Scenario 5 3,577 126 871 2,579 998
(thousands)
Most Restrictive States Only
Enrollment
Projection
Year Scenario Total
Grandfathered
Business
Non-Grandfathered
Non-Exchange
Business Exchange Business
All Non-Exchange
Business
Table D2-1
Results by Exchange/Non Exchange and Projection Year
Individual Business
© 2012 Society of Actuaries, All Rights Reserved Milliman, Inc.
Page D-5

Society of Actuaries
Design and Implementation Considerations of ACA Risk Mitigation Programs
Attachment D2
Individual Business Only
Most Restrictive States Only
Table D2-1
2013 Status Quo 80% 92% 64% n/a 80%
2014 Status Quo 83% 94% 73% n/a 83%
2014 Scenario 1 92% 88% 85% 98% 86%
2014 Scenario 2 92% 88% 86% 101% 87%
2014 Scenario 3 91% 88% 85% 97% 86%
2014 Scenario 4 91% 88% 84% 98% 85%
2014 Scenario 5 92% 88% 85% 98% 86%
2015 Status Quo 86% 93% 81% n/a 86%
2015 Scenario 1 86% 82% 83% 88% 82%
2015 Scenario 2 86% 83% 81% 89% 82%
2015 Scenario 3 86% 83% 83% 87% 83%
2015 Scenario 4 85% 83% 80% 88% 81%
2015 Scenario 5 86% 84% 84% 88% 84%
2016 Status Quo 88% 94% 84% n/a 88%
2016 Scenario 1 80% 80% 78% 81% 79%
2016 Scenario 2 81% 81% 78% 83% 78%
2016 Scenario 3 80% 81% 78% 81% 79%
2016 Scenario 4 80% 82% 78% 81% 78%
2016 Scenario 5 80% 81% 78% 81% 79%
2017 Status Quo 86% 93% 83% n/a 86%
2017 Scenario 1 78% 82% 77% 78% 78%
2017 Scenario 2 79% 84% 78% 79% 79%
2017 Scenario 3 79% 83% 78% 79% 79%
2017 Scenario 4 79% 83% 77% 79% 78%
2017 Scenario 5 78% 81% 78% 78% 79%
Exchange Business
Most Restrictive States Only
Incurred Loss Ratios
All Non-Exchange
Business
Table D2-2
Results by Exchange/Non Exchange and Projection Year
Projection
Year Scenario Total
Grandfathered
Business
Non-Grandfathered
Non-Exchange
Business
Individual Business
© 2012 Society of Actuaries, All Rights Reserved Milliman, Inc.
Page D-6
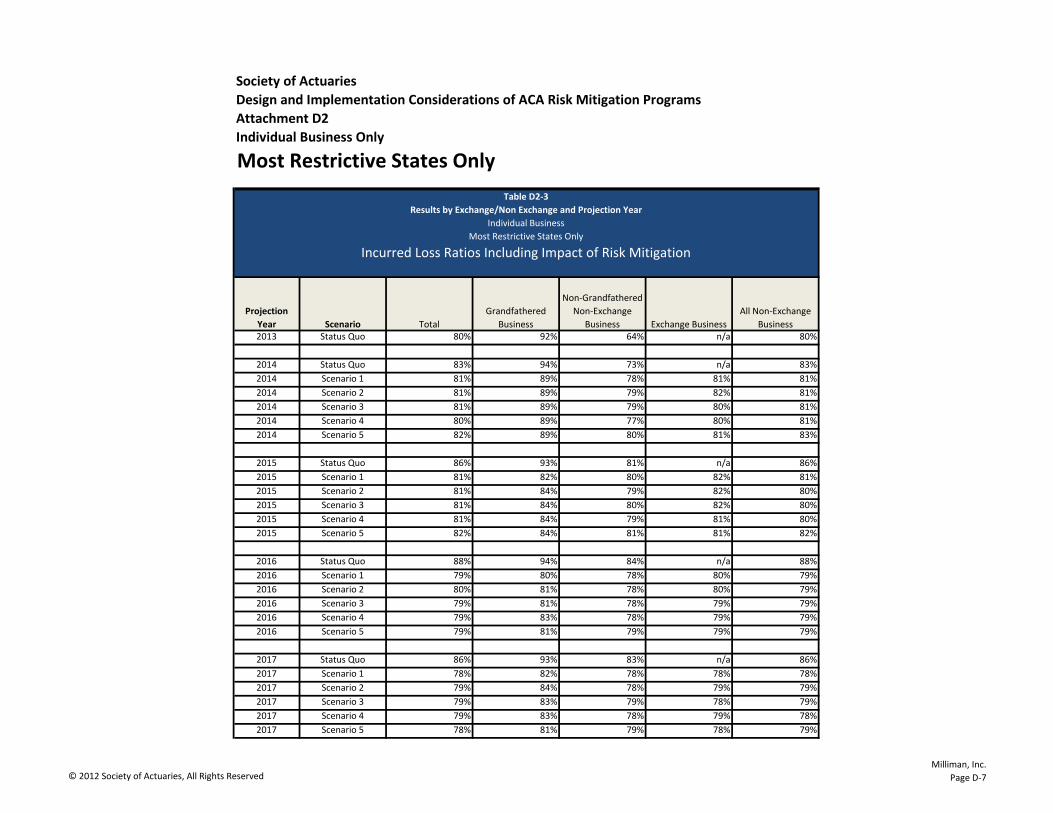
Society of Actuaries
Design and Implementation Considerations of ACA Risk Mitigation Programs
Attachment D2
Individual Business Only
Most Restrictive States Only
2013 Status Quo 80% 92% 64% n/a 80%
2014 Status Quo 83% 94% 73% n/a 83%
2014 Scenario 1 81% 89% 78% 81% 81%
2014 Scenario 2 81% 89% 79% 82% 81%
2014 Scenario 3 81% 89% 79% 80% 81%
2014 Scenario 4 80% 89% 77% 80% 81%
2014 Scenario 5 82% 89% 80% 81% 83%
2015 Status Quo 86% 93% 81% n/a 86%
2015 Scenario 1 81% 82% 80% 82% 81%
2015 Scenario 2 81% 84% 79% 82% 80%
2015 Scenario 3 81% 84% 80% 82% 80%
2015 Scenario 4 81% 84% 79% 81% 80%
2015 Scenario 5 82% 84% 81% 81% 82%
2016 Status Quo 88% 94% 84% n/a 88%
2016 Scenario 1 79% 80% 78% 80% 79%
2016 Scenario 2 80% 81% 78% 80% 79%
2016 Scenario 3 79% 81% 78% 79% 79%
2016 Scenario 4 79% 83% 78% 79% 79%
2016 Scenario 5 79% 81% 79% 79% 79%
2017 Status Quo 86% 93% 83% n/a 86%
2017 Scenario 1 78% 82% 78% 78% 78%
2017 Scenario 2 79% 84% 78% 79% 79%
2017 Scenario 3 79% 83% 79% 78% 79%
2017 Scenario 4 79% 83% 78% 79% 78%
2017 Scenario 5 78% 81% 79% 78% 79%
Scenario Total
Grandfathered
Business
Non-Grandfathered
Non-Exchange
Business
Individual Business
Most Restrictive States Only
Incurred Loss Ratios Including Impact of Risk Mitigation
Exchange Business
All Non-Exchange
Business
Projection
Year
Table D2-3
Results by Exchange/Non Exchange and Projection Year
© 2012 Society of Actuaries, All Rights Reserved Milliman, Inc.
Page D-7

Society of Actuaries
Design and Implementation Considerations of ACA Risk Mitigation Programs
Attachment D3
Individual Business Only
Average Restrictive States Only
2013 Status Quo 5,004 2,544 2,460 n/a 5,004
2014 Status Quo 5,003 2,051 2,952 n/a 5,003
2014 Scenario 1 6,641 864 2,777 3,000 3,641
2014 Scenario 2 6,641 862 3,636 2,143 4,498
2014 Scenario 3 6,638 861 2,881 2,896 3,742
2014 Scenario 4 5,805 783 2,538 2,484 3,321
2014 Scenario 5 6,650 863 2,776 3,011 3,639
2015 Status Quo 5,001 1,664 3,337 n/a 5,001
2015 Scenario 1 9,623 667 3,465 5,490 4,132
2015 Scenario 2 9,631 661 4,869 4,102 5,530
2015 Scenario 3 9,625 664 3,647 5,314 4,311
2015 Scenario 4 8,315 616 3,220 4,479 3,836
2015 Scenario 5 9,622 668 3,441 5,513 4,109
2016 Status Quo 5,015 1,376 3,639 n/a 5,015
2016 Scenario 1 11,402 639 3,863 6,900 4,502
2016 Scenario 2 11,403 631 5,523 5,249 6,153
2016 Scenario 3 11,404 634 4,076 6,694 4,710
2016 Scenario 4 9,764 593 3,619 5,553 4,211
2016 Scenario 5 11,390 639 3,835 6,916 4,474
2017 Status Quo 5,025 1,156 3,869 n/a 5,025
2017 Scenario 1 12,699 613 4,070 8,016 4,683
2017 Scenario 2 12,699 603 5,879 6,217 6,482
2017 Scenario 3 12,707 606 4,295 7,805 4,901
2017 Scenario 4 10,869 570 3,852 6,447 4,422
2017 Scenario 5 12,698 611 4,038 8,049 4,649
(thousands)
Average Restrictive States Only
Enrollment
Projection
Year Scenario Total
Grandfathered
Business
Non-Grandfathered
Non-Exchange
Business Exchange Business
All Non-Exchange
Business
Table D3-1
Results by Exchange/Non Exchange and Projection Year
Individual Business
© 2012 Society of Actuaries, All Rights Reserved Milliman, Inc.
Page D-8

Society of Actuaries
Design and Implementation Considerations of ACA Risk Mitigation Programs
Attachment D3
Individual Business Only
Average Restrictive States Only
Table D3-1
2013 Status Quo 80% 84% 74% n/a 80%
2014 Status Quo 81% 85% 77% n/a 81%
2014 Scenario 1 111% 80% 109% 123% 102%
2014 Scenario 2 111% 80% 113% 122% 106%
2014 Scenario 3 110% 81% 110% 120% 103%
2014 Scenario 4 109% 80% 109% 118% 102%
2014 Scenario 5 110% 80% 109% 122% 101%
2015 Status Quo 82% 85% 80% n/a 82%
2015 Scenario 1 107% 74% 107% 112% 101%
2015 Scenario 2 107% 76% 109% 111% 105%
2015 Scenario 3 107% 75% 107% 110% 102%
2015 Scenario 4 106% 75% 107% 109% 102%
2015 Scenario 5 107% 76% 106% 111% 101%
2016 Status Quo 82% 84% 81% n/a 82%
2016 Scenario 1 100% 76% 99% 102% 96%
2016 Scenario 2 100% 77% 100% 102% 98%
2016 Scenario 3 99% 77% 99% 101% 96%
2016 Scenario 4 99% 78% 99% 100% 97%
2016 Scenario 5 99% 78% 98% 101% 96%
2017 Status Quo 81% 83% 81% n/a 81%
2017 Scenario 1 92% 78% 92% 92% 90%
2017 Scenario 2 92% 78% 92% 92% 91%
2017 Scenario 3 91% 78% 92% 92% 90%
2017 Scenario 4 91% 79% 92% 91% 90%
2017 Scenario 5 91% 79% 91% 92% 90%
Exchange Business
Average Restrictive States Only
Incurred Loss Ratios
All Non-Exchange
Business
Table D3-2
Results by Exchange/Non Exchange and Projection Year
Projection
Year Scenario Total
Grandfathered
Business
Non-Grandfathered
Non-Exchange
Business
Individual Business
© 2012 Society of Actuaries, All Rights Reserved Milliman, Inc.
Page D-9

Society of Actuaries
Design and Implementation Considerations of ACA Risk Mitigation Programs
Attachment D3
Individual Business Only
Average Restrictive States Only
2013 Status Quo 80% 84% 74% n/a 80%
2014 Status Quo 81% 85% 77% n/a 81%
2014 Scenario 1 86% 82% 86% 87% 85%
2014 Scenario 2 86% 82% 86% 87% 85%
2014 Scenario 3 86% 83% 86% 87% 85%
2014 Scenario 4 85% 82% 85% 85% 84%
2014 Scenario 5 86% 82% 86% 87% 85%
2015 Status Quo 82% 85% 80% n/a 82%
2015 Scenario 1 87% 75% 87% 88% 85%
2015 Scenario 2 87% 77% 87% 88% 86%
2015 Scenario 3 87% 77% 87% 88% 85%
2015 Scenario 4 86% 76% 87% 87% 85%
2015 Scenario 5 87% 77% 87% 88% 85%
2016 Status Quo 82% 84% 81% n/a 82%
2016 Scenario 1 86% 77% 86% 87% 85%
2016 Scenario 2 86% 78% 86% 87% 85%
2016 Scenario 3 86% 77% 86% 86% 85%
2016 Scenario 4 86% 78% 86% 86% 85%
2016 Scenario 5 86% 78% 86% 86% 85%
2017 Status Quo 81% 83% 81% n/a 81%
2017 Scenario 1 92% 78% 90% 93% 89%
2017 Scenario 2 92% 78% 91% 93% 90%
2017 Scenario 3 91% 78% 90% 92% 89%
2017 Scenario 4 91% 79% 89% 92% 88%
2017 Scenario 5 91% 79% 90% 93% 89%
Scenario Total
Grandfathered
Business
Non-Grandfathered
Non-Exchange
Business
Individual Business
Average Restrictive States Only
Incurred Loss Ratios Including Impact of Risk Mitigation
Exchange Business
All Non-Exchange
Business
Projection
Year
Table D3-3
Results by Exchange/Non Exchange and Projection Year
© 2012 Society of Actuaries, All Rights Reserved Milliman, Inc.
Page D-10

Society of Actuaries
Design and Implementation Considerations of ACA Risk Mitigation Programs
Attachment D4
Individual Business Only
Least Restrictive States Only
2013 Status Quo 8,117 4,130 3,987 n/a 8,117
2014 Status Quo 8,089 3,295 4,794 n/a 8,089
2014 Scenario 1 12,215 1,442 5,240 5,534 6,682
2014 Scenario 2 12,216 1,432 6,955 3,829 8,387
2014 Scenario 3 12,212 1,435 5,455 5,322 6,890
2014 Scenario 4 10,734 1,319 4,809 4,606 6,128
2014 Scenario 5 12,226 1,436 5,232 5,558 6,668
2015 Status Quo 8,067 2,664 5,403 n/a 8,067
2015 Scenario 1 17,689 1,134 6,651 9,904 7,786
2015 Scenario 2 17,695 1,119 9,430 7,146 10,549
2015 Scenario 3 17,739 1,125 7,070 9,543 8,195
2015 Scenario 4 15,271 1,053 6,156 8,061 7,209
2015 Scenario 5 17,651 1,135 6,623 9,893 7,758
2016 Status Quo 8,050 2,197 5,853 n/a 8,050
2016 Scenario 1 20,805 1,085 7,457 12,263 8,542
2016 Scenario 2 20,814 1,071 10,708 9,035 11,779
2016 Scenario 3 20,853 1,074 7,933 11,846 9,006
2016 Scenario 4 17,779 1,010 6,928 9,842 7,938
2016 Scenario 5 20,760 1,087 7,410 12,263 8,497
2017 Status Quo 8,037 1,838 6,199 n/a 8,037
2017 Scenario 1 22,883 1,038 7,832 14,013 8,870
2017 Scenario 2 22,882 1,021 11,330 10,530 12,351
2017 Scenario 3 22,922 1,029 8,329 13,564 9,358
2017 Scenario 4 19,530 970 7,356 11,204 8,326
2017 Scenario 5 22,845 1,040 7,791 14,013 8,832
(thousands)
Least Restrictive States Only
Enrollment
Projection
Year Scenario Total
Grandfathered
Business
Non-Grandfathered
Non-Exchange
Business Exchange Business
All Non-Exchange
Business
Table D4-1
Results by Exchange/Non Exchange and Projection Year
Individual Business
© 2012 Society of Actuaries, All Rights Reserved Milliman, Inc.
Page D-11

Society of Actuaries
Design and Implementation Considerations of ACA Risk Mitigation Programs
Attachment D4
Individual Business Only
Least Restrictive States Only
Table D4-1
2013 Status Quo 80% 85% 74% n/a 80%
2014 Status Quo 81% 85% 78% n/a 81%
2014 Scenario 1 128% 79% 126% 145% 115%
2014 Scenario 2 128% 80% 130% 144% 121%
2014 Scenario 3 128% 80% 127% 144% 116%
2014 Scenario 4 126% 80% 125% 141% 115%
2014 Scenario 5 127% 79% 124% 144% 114%
2015 Status Quo 82% 85% 80% n/a 82%
2015 Scenario 1 126% 75% 124% 133% 117%
2015 Scenario 2 126% 76% 127% 133% 121%
2015 Scenario 3 125% 76% 125% 132% 118%
2015 Scenario 4 123% 77% 125% 129% 117%
2015 Scenario 5 125% 75% 124% 132% 116%
2016 Status Quo 82% 84% 81% n/a 82%
2016 Scenario 1 117% 76% 115% 121% 111%
2016 Scenario 2 117% 77% 117% 121% 114%
2016 Scenario 3 116% 77% 116% 120% 111%
2016 Scenario 4 115% 77% 116% 118% 111%
2016 Scenario 5 116% 77% 114% 121% 110%
2017 Status Quo 81% 84% 80% n/a 81%
2017 Scenario 1 108% 79% 106% 110% 104%
2017 Scenario 2 108% 78% 108% 110% 106%
2017 Scenario 3 107% 79% 106% 109% 104%
2017 Scenario 4 106% 78% 106% 107% 104%
2017 Scenario 5 107% 79% 106% 110% 103%
Exchange Business
Least Restrictive States Only
Incurred Loss Ratios
All Non-Exchange
Business
Table D4-2
Results by Exchange/Non Exchange and Projection Year
Projection
Year Scenario Total
Grandfathered
Business
Non-Grandfathered
Non-Exchange
Business
Individual Business
© 2012 Society of Actuaries, All Rights Reserved Milliman, Inc.
Page D-12

Society of Actuaries
Design and Implementation Considerations of ACA Risk Mitigation Programs
Attachment D4
Individual Business Only
Least Restrictive States Only
2013 Status Quo 80% 85% 74% n/a 80%
2014 Status Quo 81% 85% 78% n/a 81%
2014 Scenario 1 89% 81% 90% 91% 88%
2014 Scenario 2 89% 82% 90% 91% 89%
2014 Scenario 3 89% 82% 90% 91% 88%
2014 Scenario 4 89% 83% 89% 90% 88%
2014 Scenario 5 89% 82% 90% 91% 88%
2015 Status Quo 82% 85% 80% n/a 82%
2015 Scenario 1 91% 77% 91% 92% 89%
2015 Scenario 2 91% 77% 92% 92% 90%
2015 Scenario 3 91% 77% 91% 92% 89%
2015 Scenario 4 90% 78% 91% 91% 89%
2015 Scenario 5 91% 76% 91% 92% 89%
2016 Status Quo 82% 84% 81% n/a 82%
2016 Scenario 1 90% 77% 90% 90% 89%
2016 Scenario 2 90% 78% 90% 91% 89%
2016 Scenario 3 89% 77% 90% 90% 89%
2016 Scenario 4 89% 78% 90% 90% 88%
2016 Scenario 5 89% 77% 90% 90% 89%
2017 Status Quo 81% 84% 80% n/a 81%
2017 Scenario 1 108% 79% 106% 110% 104%
2017 Scenario 2 108% 78% 107% 111% 105%
2017 Scenario 3 107% 79% 107% 109% 104%
2017 Scenario 4 106% 78% 105% 108% 102%
2017 Scenario 5 107% 79% 106% 109% 104%
Scenario Total
Grandfathered
Business
Non-Grandfathered
Non-Exchange
Business
Individual Business
Least Restrictive States Only
Incurred Loss Ratios Including Impact of Risk Mitigation
Exchange Business
All Non-Exchange
Business
Projection
Year
Table D4-3
Results by Exchange/Non Exchange and Projection Year
© 2012 Society of Actuaries, All Rights Reserved Milliman, Inc.
Page D-13