design and implementation of an agent-based simulation...
TRANSCRIPT

Design And Implementation Of An Agent-Based Simulation For
Emergency Response And Crisis Management∗
Timothy Schoenharl, Zhi Zhai, Ryan McCune, Alec Pawling and Greg MadeyDept of Computer Science and Engineering
University of Notre DameNotre Dame, IN 46556
January 20, 2009
Keywords: GIS, Crisis Modeling, Agent-BasedSimulation
Abstract
This paper introduces the simulation component ofthe WIPER system [22]. The Wireless IntegratedPhone-based Emergency Response (WIPER) sys-tem is a Dynamic Data-Driven Application System(DDDAS) that uses a stream of cellular network ac-tivity to detect, classify and predict crisis events.The WIPER simulation is essential to classificationand prediction tasks, as the simulations model hu-man activity, both in movement and cell phone activ-ity, in an attempt to better understand crisis events.These Agent-Based simulations are parameterizedwith agent location data from the cellular serviceprovider and agents inhabit a GIS space represen-tative of the urban area. Simulations include mod-els for normal and crisis behaviors in an urban set-ting. Simulations generate call activity and agent lo-cations, similar to that generated by the observationof cell phone users in an urban setting. We presentan overview of the design and implementation of theWIPER simulation along with validation and veri-fication of the system and an evaluation of runtimecharacteristics.
∗The research on WIPER is supported by an NSF Grant,CISE/CNS-DDDAS, Award #0540348.
1 INTRODUCTION
Fires, riots, traffic jams and terrorist attacks are cri-sis events that can impact our lives. When possi-ble, prevention is best. However, these events can-not be entirely eliminated, and so it is advantageousto spend time and effort developing techniques tomitigate their impact. Simulations of these eventscan help us to understand the development of theseevents, as well as evaluating strategies for dealingwith these crises.
Crisis events occur without warning on short timescales relative to normal human activities. Simula-tions designed to model human behavior under crisisscenarios faces several challenges when attempting tomodel behavior in real time. The DDDAS approachseeks to address that challenge by incorporatingreal time sensor data into running simulations[25][7].Dynamic, Data-Driven Application Systems is anapproach to developing systems incorporating sen-sors and simulations where the simulations receivestreaming data from the sensors and the sensors re-ceive control information from the simulations.
WIPER works to detect and predict the courseof crisis events and advise emergency response plan-ners with up to date information on crisis scenarios.WIPER works by monitoring a stream of cell phoneactivity data to detect anomalies, then uses Agent-Based Modeling simulations, created from and up-dated against the streaming data, to provide more
Copyright held by SCS.
thorough understanding of crisis events. Finally, theinformation regarding potential anomalies, call infor-mation and simulation output is presented to usersin a web-based console. A thorough introduction tothe WIPER system can be found in [22].
Agent-Based Simulation is an accepted paradigmfor simulating human behavior in realistic environ-ments. The canonical examples of this are in traf-fic simulation, a relatively mature field, and in sim-ulating the spread of infectious disease through ur-ban areas. Important to both of these approaches iscapturing the movements of individuals in the area.Simulating events like traffic jams or outbreaks ofAvian Flu is advantageous for several reasons. First,a well developed simulation can provide insight intothe spread of the disease or the conditions and behav-iors that can lead to traffic jams. Second, computersimulations give planners the ability to evaluate sce-narios to deal with the crisis event. Planners usingthe EpiSims simulation [3] can evaluate strategies forpreventing the spread of Smallpox in a large urbanarea.
2 BACKGROUND
Agent-Based Models are well suited to simulating thebehavior of complex systems, such as ecological sys-tems, biological simulations and simulations of hu-man behavior and movement [20, 24, 6, 21, 2, 15].These simulations cover a vast range of applicationdomains, but there are similarities in the systemsthat make them amenable to the ABM approach.First, the system is composed of heterogeneous ac-tors, which are called agents when simulated. Next,the desired output of the system is an aggregate overall the agents in the system. This can be some mea-sure of the state of the agents, such as location, emo-tional state, etc. Finally, the simulation output isgenerated as a result of the interactions of the agentswith themselves and the environment.
2.1 Traffic Simulations
Several Agent-Based Models of traffic flow currentlyexist [2] [14]. These models are useful in that they
can produce useful information over a variety of traf-fic conditions, from traffic jams to steady state traf-fic flow, which is a limitation of earlier approaches[12, 13]. The output of these simulations can be usedfor short term prediction of events such as traffic jamsand routing around construction areas, or long termanalysis for planning and development of infrastruc-ture.
2.2 Epidemiological Simulations
Agent-Based Modeling has been used in spatially ex-plicit epidemiological simulations [3, 8]. In simula-tions such as EpiSims, modelers can simulate the out-break of a biological agent such as smallpox in anurban area and examine the effectiveness of variousstrategies to control the spread of the disease.
2.3 Integrating GIS with Agent-Based Models
Several research groups have explored the integrationof GIS data sources with Agent-Based Models [4, 17,5]. The advantages of this approach are that agentscan interact with realistic environments, improvingthe validity of the simulation’s predictions, as wellas allowing planners and architects to evaluate theeffectiveness of designs before they are built.
Using GIS data sources to represent the environ-ment in Agent-Based Models requires rethinking theapproach to simulation. Often the environment in anABM is a grid structure, with agent movement de-lineated in discrete units. However, movement on aGIS is continuous and simulations must take this intoaccount. Often land-use simulations will use discreteparcels of land in order to avoid issues with modelingarbitrary areas [27]. In the WIPER simulation weaddress the issue by simulating agent movements interms of meters per time step and avoiding discreterepresentations of space.
3 PROBLEM DESCRIPTION
When a crisis occurs emergency responders will of-ten quickly receive notice through standard emer-
gency reporting channels, such as the 911 system.However, reports from bystanders often contain in-accuracies and individuals often lack the ability tojudge the scope of crisis events. In situations likethis Emergency Responders need tools that let themquickly assess the type and extent of the crisis. Un-der ideal circumstances, it would be even better tooffer responders the ability to get predictions on thedevelopment of crisis scenarios. This allows respon-ders to plan for the evolution and mitigation of suchcrises.
It is in this context that we present the WIPERsimulation. The simulation is designed to model hu-man movement and calling activity under normal cir-cumstances and during crisis events. The simulationsare designed for several purposes. First, simulationsare created with streaming data from the crisis areaand, in conjunction with an online validation ap-proach, attempt to identify the detected crisis event.Second, the simulations can be used for short-termprediction of the evolution of crisis events.
4 DESIGN
The WIPER Agent-Based Simulation has been de-signed using Design Patterns [10]. The use of DesignPatterns is a common approach to the developmentof object-oriented software and in this regard theycan be applied quite well to Agent-Based Models.
All simulation scenarios share important compo-nents. The GIS files representing geography, politi-cal boundaries, tower information, etc are the samefor all scenarios. A centralized simulation model classhandles the initialization and setup of the simulation,placing agents onto the map, setting agent movementand activity models and handling the schedule.
4.1 Application of Design Patterns toSimulation
In order to reduce the amount of time and effortspent in writing the code for these simulations, webreak out the agents’ movement and activity mod-els as Strategy and Singleton Patterns [10]. This ispossible because much of an agent’s state remains
unchanged, regardless of the underlying phenomenonthat we intend to simulate. For example, in thereal world, a person’s age and physical fitness donot change whether the person is sitting at a deskor walking down the street. However, these charac-teristics may influence the speed that he/she walks,etc. We extract and encapsulate agent behaviors re-lated to movement and activity into objects, outsideof the agent itself. Agents then retain a reference tothis movement or activity model object. Althoughthis does seem to introduce a semantic disconnectwith how we expect an agent to be designed, thisapproach offers huge benefits in model developmentand allows researchers to run simulations where itis easy to initialize a population of agents with a fewmodels and tractable to initialize the population witha large number (100 or more) of distinct movementor activity models. More importantly this flexibil-ity is apparent during the running of a simulation,when agents can change their movement or activitymodel at runtime, easily and without adverse affectson simulation performance, as switching models canbe done as easily as changing a pointer.
5 IMPLEMENTATION
The WIPER simulations are written in Java usingthe RePast Agent Modeling Framework [19]. TheWIPER simulation also uses a number of Java APIsthat come bundled with the RePast distribution, in-cluding the Colt High Performance Scientific Library[16] and GeoTools [11] and OpenMap [26] for GIS.
The simulation is comprised of two types of mod-els, one that simulates the calling behavior of peoplecarrying cell phones and another that simulates themovement of people (pedestrians or vehicles). Wesimulate cell phone calling data, as this is our datasource for detecting crisis events in the WIPER sys-tem. Generating faithful simulations of calling be-havior should allow the WIPER system to more re-liably identify crisis scenarios. Movement models aredirectly useful to emergency responders, who mayneed immediate information and short term predic-tion about the behavior of people during crisis events.
5.1 Activity Models
The activity models define the calling behavior ofthe agents. There are 3 activity models usedin the simulation: the NullActivity model, theAlwaysCall model and the DistributionBasedmodel. All of the ActivityModel types are sub-classes of ActivityModel. ActivityModel is de-signed as a Singleton class (as described in [10]), rec-ognizing that all of the relevant state used to deter-mine an agent’s calling activity (Time, Date, Agentlocation) is maintained in the WIPER agent and inWiperSimModel.
WIPER Agents use the ActivityModel objects ina Strategy Pattern [10]. This makes it possible to setthe agent’s behavior type as a parameter and pro-vides fine-grained control over the behavior of indi-vidual agents in the simulation. The control overagent behavior allows large scale heterogeneity inagent movement models, an important considerationwhen attempting to model a large population of hu-man agents.
The NullActivity model is a place-holder class. Itoverrides the abstract methods from ActivityModelbut does not produce any behavior. This class isintended to be used for testing the Movement models,as it will not alter agent behavior.
The AlwaysCall model is another class used fortesting. In this class, the checkCall method alwayscauses the agent to make a call. This class can beused to test how agents call each other and to testother attributes of calling behavior.
The DistributionBased model is the primary callactivity model in the simulation. This model requiresinitialization, it must be given an empirical call dis-tribution as input. When the checkCall method iscalled, the method gets the (simulation) time anddate from the WiperSimModel and then uses the em-pirical call distribution to determine the expected callactivity at the current interval.
5.2 Basic Movement Models
The movement models define the manner in whichWIPER agents move on the map. There are5 different movement models: NullMovement,
RandomMovement, MoveAndReturnMovement,FleeMovement and BoundedFleeMovement. Aswith ActivityModel, MovementModel is an abstractbase class and is designed to be a Singleton.
As with ActivityModel, WIPER agents useMovementModels in the Strategy pattern. In thiscase, the agent encapsulates the location and anypertinent characteristics (movement speed, locationof work or home, etc) and the MovementModel ac-cesses these through the agent when calculating thedestination.
The NullMovement class is a placeholder, imple-menting the move method but without causing thecalling agent to actually move. This class is usefulwhen testing ActivityModels.
The RandomMovement class is used to move agentsin a random fashion on the map. When the move()method is called, a random direction is chosen andthe agent is advanced along that direction. Thedistance traveled depends on the agent’s movementspeed and the length of a simulation time step. Theagents do not continue traveling along this path, ateach time step a new direction is chosen.
The MoveAndReturnMovement class defines a“daily routine”, where agents travel from a homelocation to a work location and back. This modelworks in conjunction with events scheduled in theWiperSimModeland with state maintained in theWIPER agents, the home and work locations, in-formation on whether they are traveling to homeor work, etc. The WIPER agent maintains thelocation of its own work and home, and theMoveAndReturnMovement uses these to calculate thenext position of the agent.
The FleeMovement class is an implementation ofa crisis movement class. The move() method moveseach WIPER agent in a straight line away from adisaster location. The location of the crisis is initial-ized in the WiperSimModel at the start of the sim-ulation. In this class, WIPER agents always moveaway from the crisis and continue moving until thesimulation ends. This type of behavior is similar towhat is expected in a major disaster scenario, such asthe way that people fled from Manhattan on Septem-ber 11. Due to the relatively short duration of theWIPER simulations, minutes and hours, rather than
Figure 1: Initial state in RoadFlee Movement.
days, this type of behavior is a good first-order ap-proximation.
The BoundedFleeMovement class is a refined ver-sion of FleeMovement. In this move method, eachWIPER agent moves directly away from the crisis lo-cation until it reaches a threshold, then stops. Thecrisis location and the flee radius are initialize inWiperSimModel at the start of the simulation. Thistype of crisis behavior is more consistent with whatwould be seen in a building fire or small-scale crisis,where people flee the crisis until they reach a safedistance.
5.3 Extended Movement Models
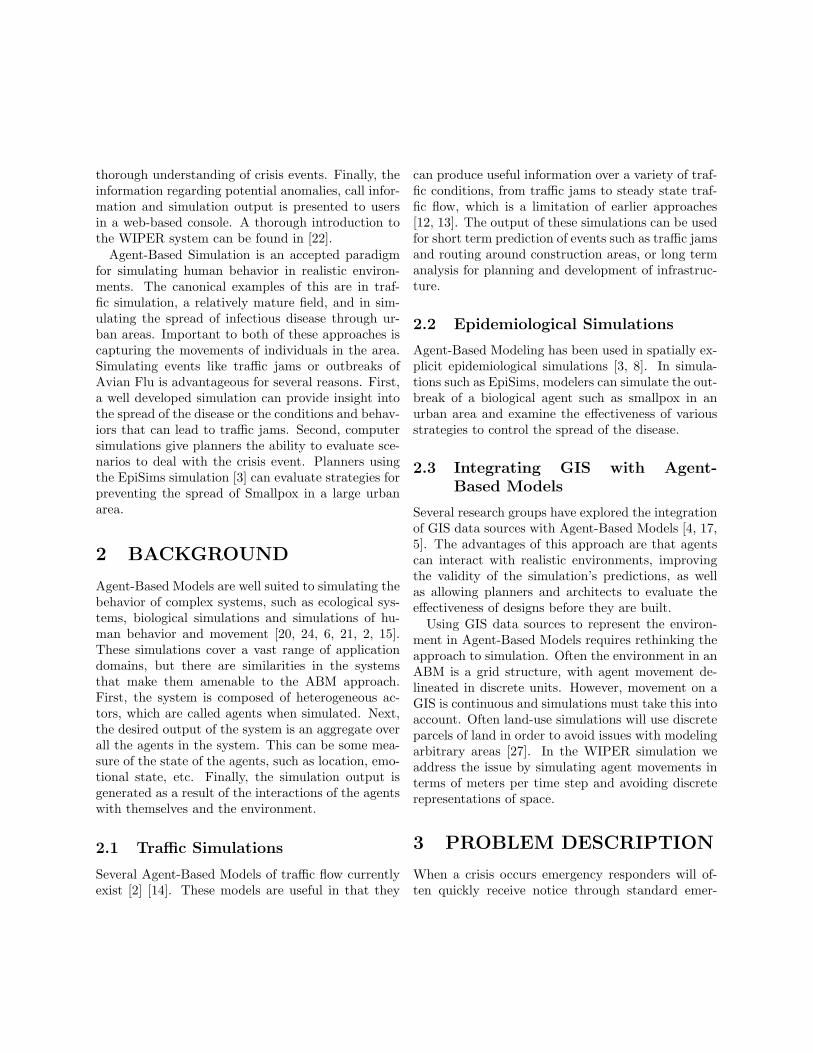
The initial basic models were extended to demon-strate more rich and realistic behavior.RoadFleeMovement: When a crisis event happens,
some agents will choose vehicles as their transporta-tion method, so their moving routes are constrainedby the road configuration. In the WIPER simulation,GIS information about the road network is saved in aGIS shape file. After successfully locating the roadssurrounding the crisis location, vehicle agents followthe road topology. Figure 1 shows the initial stateof a simulation using the RoadFleeMovement. Wecan see the agents’ locations, voronoi cells (markingthe boundaries of the coverage are of the cell tow-ers) and road network at the initial state. For moreinformation on voronoi cells, see Section 5.5. In Fig-
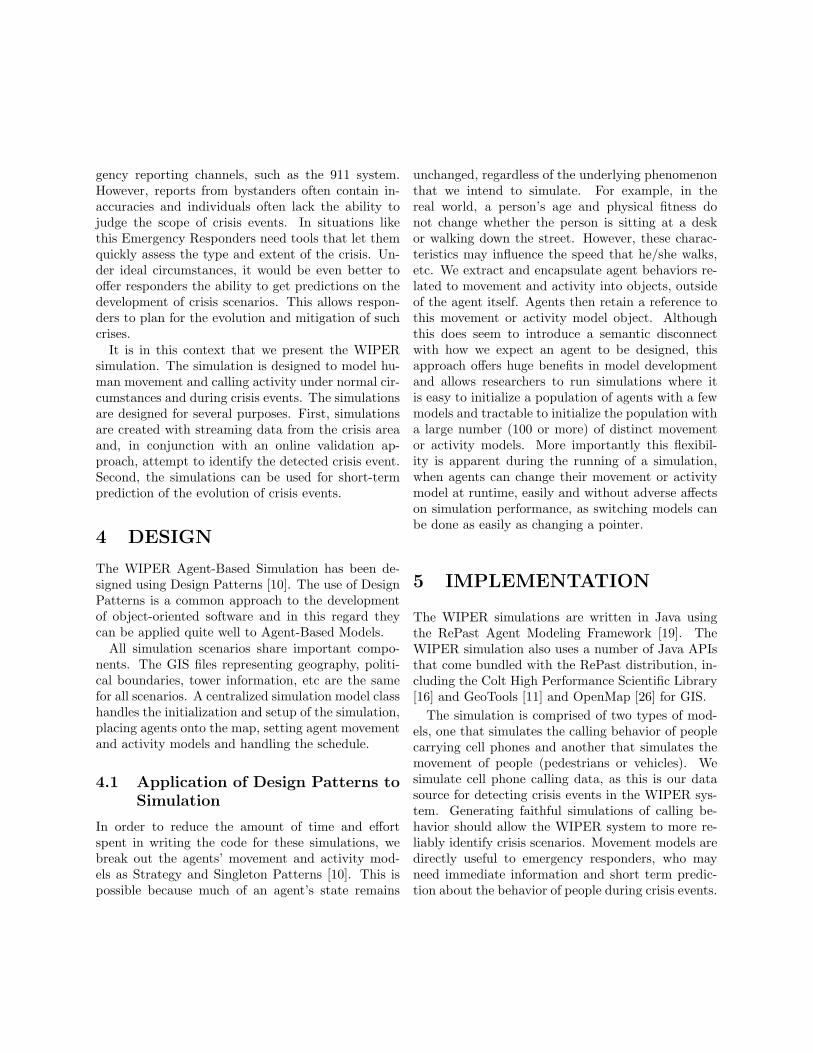
Figure 2: Interim state 50 time steps into the simu-lation in RoadFlee Movement.
ure 2, vehicles are following the highways to flee fromthe crisis. We notice that there are some overlapsbetween moving agents, this is addressed in the Con-gestionFleeMovement below.CongestionFleeMovement: In reality, when a
great number of vehicles simultaneously attempt toaccess limited road resources, a traffic jam will occur.Since traffic congestion usually occurs during evac-uations, we developed a CongestionFleeMovementmodel to reproduce this behavior. We create thismodel by giving the roads limited capacity and givingthe agents physical size. If a car tries to move to itsdestination and no other cars are closer to that spot,the car would move at full speed. Otherwise, it has toslow down and wait for other cars. As soon as there isroom to move, this car can move at full speed. FromFigure 3 to Figure 4, the course of traffic jams createdand dissolved has been illuminated. In these figures,every grey square represents a cell phone user movingwith his/her car. The initial states in RoadFleeMove-ment and CongestionFleeMovement are very similar.MixedFleeMovement During crisis events, when
people are trying to flee, they may have several op-tions: they can choose to drive a car, a truck, orsimply run. So, a mixed flee movement model ismeant to simulate this kind of mixed situation. Inour model, we combine the basic flee (walk) and con-gestion flee (vehicle) model, creating a new modelthat incorporates both the pedestrian movement and

Figure 3: Interim state 50 time steps into the simula-tion in CongestionFlee Movement, showing formationof traffic jams.
vehicle movement. In Figure 5, the grey squares rep-resents vehicles, and red circles are pedestrians. After50 time steps, due to traffic congestion, some vehiclesare even slower than pedestrians, as shown in Figure6.
5.4 The WIPER Agent Class
The primary purpose of the WIPER simulation isto model the behavior of cell phone carrying inhabi-tants of an urban area. The WiperAgent class is theimplementation of the cell phone agent, encapsulat-ing state information such as current location, homeand work locations, current cell tower / voronoi cell.As described above, WiperAgents use the Strategypattern [10] for holding their movement and activitymodels, which allows unprecedented flexibility acrossthe population of agents. This means that move-ment or activity models can be assigned individuallyto agents and that the behavior of an agent can bechanged easily by replacing its movement or activitymodels.
5.5 GIS
Various GIS data sources are used in the WIPERsimulation: roads, political boundaries, cellular towerlocations, voronoi cells. A voronoi diagram is a tiling
Figure 4: Interim state 120 time steps into the simu-lation in CongestionFlee Movement.
Figure 5: Initial state in MixedFlee Movement.
on a surface around a set of points p ∈ P where eachpoint pi occupies a unique cell and all points withinthat cell are closer to pi than to any other p ∈ P . Thevoronoi cells in the WIPER simulation are a tilingof the map made from the cellular tower locations.These cells provide a good first order approximationof the coverage area around each tower, allowing thesimulation to read in agent activity at a tower andtranslate this to approximate agent locations on amap. Political boundaries, such as postal codes, citylimits, etc are useful when attempting to paramterizeagents based on census data or other demographicslinked to location.

Figure 6: Interim state 50 time steps into the simu-lation in MixedFlee Movement.
Certain GIS data representing the location and ex-tent of information like chemical dispersion, weatherpatterns, etc can be added to the simulation. Thesedata can added to the realism of the simulation andpotentially will increase the usefulness of simulationoutput.
6 VALIDATION AND VERI-FICATION
Model validation is a necessary step in the develop-ment of a simulation. In order to demonstrate thevalidity of the simulation as a whole, several stepsare taken to validate the underlying theoretical modeland to verify the implementation. In this section wedescribe the verification and validation approachesused on the WIPER simulation.
6.1 Design Decisions
Here we briefly present the design decisions that con-tributed to the development of the simulation. Forthe simulation, we choose to model human behaviorin 1 minute increments. The choice of time step wasdictated by our need to generate calling activity atno more than 1 minute intervals. Agent movementsimulations may benefit from smaller time steps, butthere is a tradeoff between time resolution and simu-
lation runtime. For the purposes of agent movementsimulation, 1 minute intervals provides adequate ac-curacy to model agent behavior. Agents must moveon a simulated represention of the world. We choseto implement this using a GIS, which provides an ac-curate model of the world. We chose to model celltower coverage areas using voronoi cells. This is anaccepted technique for representing coverage areas,as stated in [18].
6.2 Input-Output Correlation on Em-pirical Data
The WIPER simulation is designed to be a compo-nent in the WIPER emergency response system. Theintended purpose of the simulation is to be used in aDDDAS system where the simulations are updatedwith and validated against streaming data from acell phone network. With this in mind, the WIPERsimulation was designed to generate simulation out-put similar to empirical data captured from a cellularservice provider and furnished to the WIPER group.Here we present a detailed examination of the simula-tion output in terms of cell phone activity, comparingit to the empirical data taken from the CDR data.Call Data Record (CDR) data is the data used bycellular service providers for billing purposes. CDRrecords contain transaction records for the initiationand termination of calls, SMS messages and otherservices.
In order to perform these tests, we started by run-ning 10 simulations, all with identical input parame-ters but varying the random seed for each simulation.We later increased this to 100 simulations. We pa-rameterized the simulations with the number of ac-tive users for the simulated area, as taken from theempirical CDR data. We set the movement modelto null, which causes the cell phone user agents toremain at fixed locations throughout the simulation.We set the activity model to be a Distribution-basedmodel, as described in Section 5.1. The Distribution-based model is designed to generate call activity ina way that is similar to that found in the empiricalCDR data.
We present the call activity output of the firstround of simulations in Figure 7. This figure shows
●
●
●
●
●●
●
●●●●●●●
●
●
●
●●●●
●
●●
●●●●●●●●●●●●●
●
●●
●
●
●
●
●
●
●
●
●
●
●
●
●
●
●
●
●
●
●
●
●
●
●
●
●
●●●
●
●
●
●
●
●
●
●
●
●
●
●
●
●
●
●●
●
●
●
●
●
●●
●●
●
●
●
●●●
●●
●
●
●
●
●
●
●
●
●
●
●
●
●
●
●
●
●
●
●
●
●
●●
●
●
●
●
●
●
●●
●
●
●
●
●
●●
●
●
●
●
0 20 40 60 80 100 120 140
020
4060
8010
012
0
Comparison of Empirical Activity to the Range of Simulated Activity
Time in 10 Minute Intervals, 24 Hours TotalMidnight to Midnight
Cal
l Act
ivity
at I
nter
val
●
●
●
●
●●
●
●●●●●●●
●
●
●
●●●●
●
●●
●●●●●●●●●●●●●
●
●●
●
●
●
●
●
●
●
●
●
●
●
●
●
●
●
●
●
●
●
●
●
●
●
●
●
●●●
●
●
●
●
●
●
●
●
●
●
●
●
●
●
●
●●
●
●
●
●
●
●●
●●
●
●
●
●●●
●●
●
●
●
●
●
●
●
●
●
●
●
●
●
●
●
●
●
●
●
●
●
●●
●
●
●
●
●
●
●●
●
●
●
●
●
●●
●
●
●
●
●
●
Empirical Data, 2006−01−18Range of Simulated Data
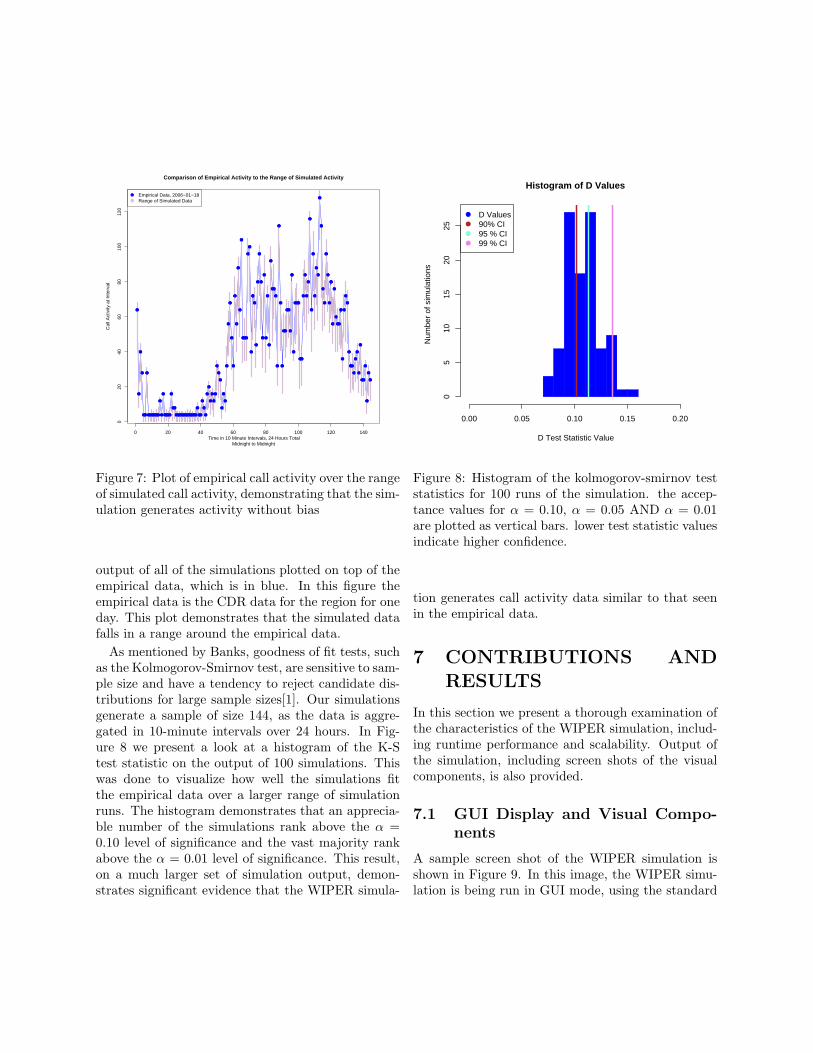
Figure 7: Plot of empirical call activity over the rangeof simulated call activity, demonstrating that the sim-ulation generates activity without bias
output of all of the simulations plotted on top of theempirical data, which is in blue. In this figure theempirical data is the CDR data for the region for oneday. This plot demonstrates that the simulated datafalls in a range around the empirical data.
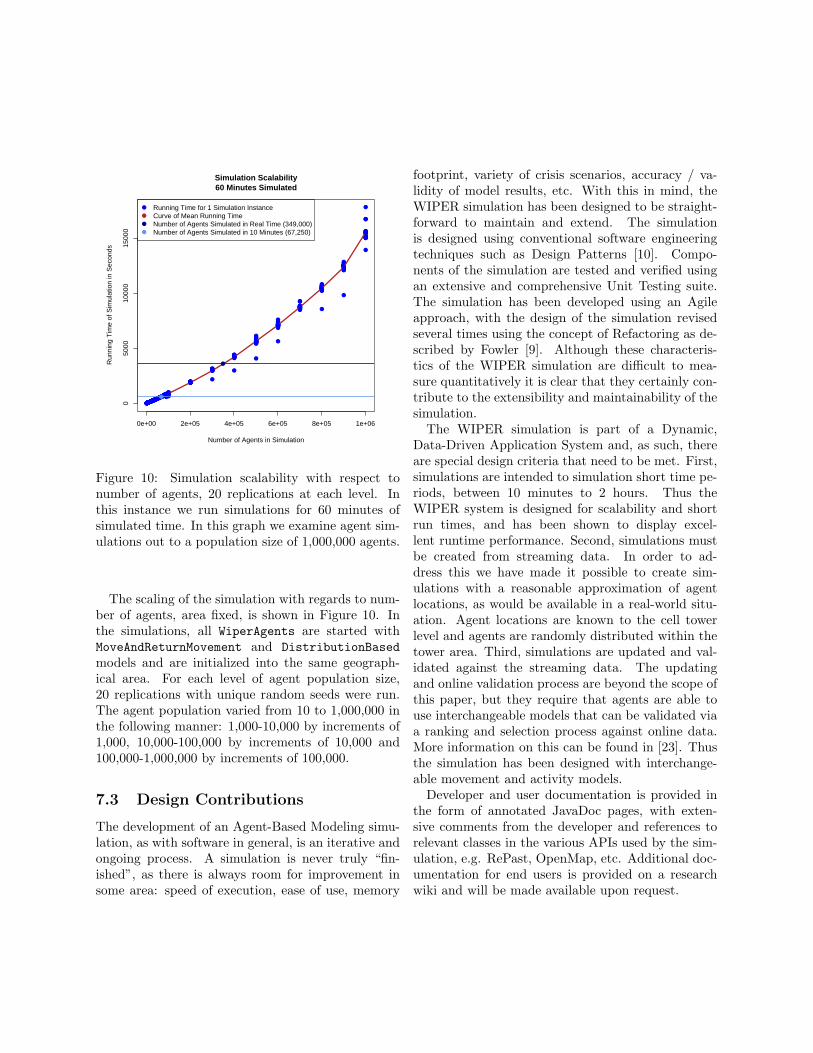
As mentioned by Banks, goodness of fit tests, suchas the Kolmogorov-Smirnov test, are sensitive to sam-ple size and have a tendency to reject candidate dis-tributions for large sample sizes[1]. Our simulationsgenerate a sample of size 144, as the data is aggre-gated in 10-minute intervals over 24 hours. In Fig-ure 8 we present a look at a histogram of the K-Stest statistic on the output of 100 simulations. Thiswas done to visualize how well the simulations fitthe empirical data over a larger range of simulationruns. The histogram demonstrates that an apprecia-ble number of the simulations rank above the α =0.10 level of significance and the vast majority rankabove the α = 0.01 level of significance. This result,on a much larger set of simulation output, demon-strates significant evidence that the WIPER simula-
Histogram of D Values
D Test Statistic ValueN
umbe
r of
sim
ulat
ions
0.00 0.05 0.10 0.15 0.20
05
1015
2025
●
●
●
●
D Values90% CI95 % CI99 % CI
Figure 8: Histogram of the kolmogorov-smirnov teststatistics for 100 runs of the simulation. the accep-tance values for α = 0.10, α = 0.05 AND α = 0.01are plotted as vertical bars. lower test statistic valuesindicate higher confidence.
tion generates call activity data similar to that seenin the empirical data.
7 CONTRIBUTIONS ANDRESULTS
In this section we present a thorough examination ofthe characteristics of the WIPER simulation, includ-ing runtime performance and scalability. Output ofthe simulation, including screen shots of the visualcomponents, is also provided.
7.1 GUI Display and Visual Compo-nents
A sample screen shot of the WIPER simulation isshown in Figure 9. In this image, the WIPER simu-lation is being run in GUI mode, using the standard

Figure 9: Screen shot of the wiper simulation.This simulation is a flee movement model withdistribution-based activity model. Agents are rep-resented as red dots with the voronoi cells colored bythe number of agents.
RePast toolbar to control the simulation and adjustinput parameters. The map is an OpenMap displayshowing agent locations and the voronoi cell bound-aries, with the voronoi cells colored by the number ofagents within each cell’s boundaries. The call activitywindow shows a running display of the call activityof all agents in the simulation, plotted against theempirical call activity for this time and day.
When the WIPER simulation is run interactively,a researcher can observe via the GUI display the stateof the system and the recent agent behaviors. In or-der to improve runtime performance, the plotting ofagent locations can be disabled. The overall agentlocations can still be determined through the color-ing of the voronoi cells but with a lower degree ofaccuracy.
7.2 Runtime Performance
Empirical study of the marginal cost of running vari-ous simulation components, such as the visualizationlayer, displaying agent locations, generating snap-shots, etc, was conducted. The runtime performanceof the WIPER simulation in response to changing
Table 1: Cumulative runtime for 20 runs of the simu-lation with varying levels of graphical output. GIS -GIS display, showing tower locations and voronoi cellscolored by number of contained agents. AGENTS -the location of all agents are added to the GIS dis-play. SNAPSHOTS - every 10 time steps the simula-tion makes a snapshot of the GIS display and savesit to disk.
GIS AGENTS SNAPSHOTS TIMENO NO NO 240.34sYES NO NO 354.70sYES YES NO 363.44sYES YES YES 35200.29s
levels of graphical output is presented in Table 1.All simulations for this analysis are started with 500agents, using the MoveAndReturn movement modeland DistributionBased calling model. The simula-tion runs for one simulated day, 1440 time steps, witheach time step representing one minute. The simu-lation can be run without any graphical display (thedefault when running simulations on a computationalgrid), with a GIS display or generating snapshots ofthe GIS display. The GIS display can be configured toshow cell tower locations and the surrounding voronoicells colored by agents or additionally with agent lo-cations individually plotted. Snapshots of the GISdisplay are a convenient way of reviewing the simula-tion’s behavior, as they can be compiled together toform a movie.
The results shown in Table 1 are the total cumula-tive running time for 20 runs of the simulation. Theresults clearly demonstrate that there is a cost associ-ated with running the graphical display and generat-ing snapshots of the GIS. It is interesting to note thatthe marginal cost for visualizing the entire populationof agents on the GIS display is negligible comparedwith the fixed cost of the GIS display. Generatingthe snapshots only once every 10 time steps requiresan approximately 2 orders of magnitude cost, 363 sec-onds for simulations with visualizations versus 35,200seconds for simulations with snapshots.
●●●●●●●●●●●●●●●●●●●●●●●●●●●●●●●●●●●●●●●●●●●●●●●●●●●●●●●●●●●●●●●●●●●●●●●●●●●●●●●●●●●●●●●●●●●●●●●●●●●●●●●●●●●●●●●●●●●●●●●●●●●●●●●●●●●●●●●●●●●●●●●●●●●●●●●●●●●●●●●●●●●●●●●●●●●●●●●●●●●●●●●●●●●●●●●●●●●●●●●●●●●●●●●●●●●●●●●●●●●●●●●●●●●●●●●●●●●●●●●●●●●●●●●●●●●●●●●●●●●●●●●●●●●●●●●●●●●●●●●●●●●●●●●●●●●●●●●●●●●●●●●●●●●●●●●●●●●●●●●●●●●●●●●●●●●●●●●●●●●●●●●●●●●●●●●●●●●●●●●●●●●●●●●●●●●●●●●●●●●●●
●●●●●●●●●●●●●●●●●●●●●
●●●●●●●●●●●●●●●●●●● ●
●●●●●●●●●●●●●●●●●●●
●
●●●●●●●●●●●●●●●●●●●
●
●●●●●●●●●●●●●●●●●●●
●●●●●●●●●●●●●●●●●●●●
●●●●●●●●●●●●●●●●●●●
●
●●●●●●●●●●●●●●●●●●●
●
●
●●●●●●●●●●●●●●●●
●●
●
0e+00 2e+05 4e+05 6e+05 8e+05 1e+06
050
0010
000
1500
0
Simulation Scalability60 Minutes Simulated
Number of Agents in Simulation
Run
ning
Tim
e of
Sim
ulat
ion
in S
econ
ds
●●●●●●●●●●●●●●●●●●●
●
●
●
●
●
●
●
●
●
●
●
●
●
●
●
Running Time for 1 Simulation InstanceCurve of Mean Running TimeNumber of Agents Simulated in Real Time (349,000)Number of Agents Simulated in 10 Minutes (67,250)
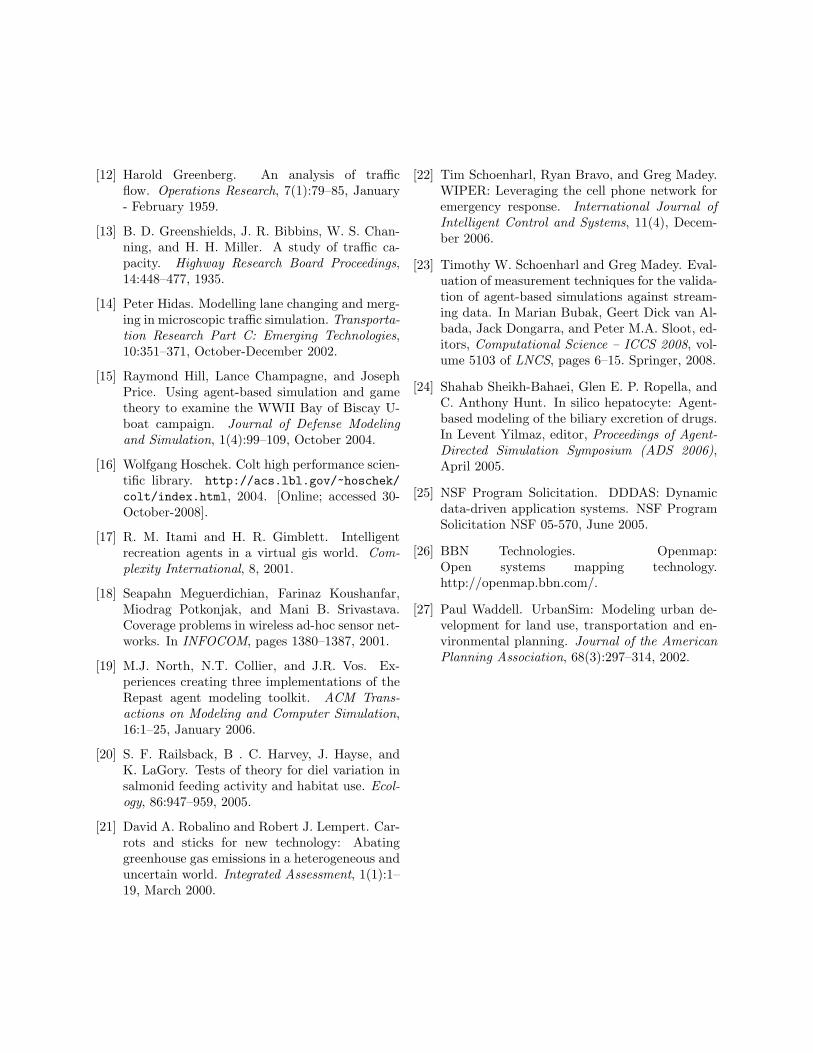
Figure 10: Simulation scalability with respect tonumber of agents, 20 replications at each level. Inthis instance we run simulations for 60 minutes ofsimulated time. In this graph we examine agent sim-ulations out to a population size of 1,000,000 agents.
The scaling of the simulation with regards to num-ber of agents, area fixed, is shown in Figure 10. Inthe simulations, all WiperAgents are started withMoveAndReturnMovement and DistributionBasedmodels and are initialized into the same geograph-ical area. For each level of agent population size,20 replications with unique random seeds were run.The agent population varied from 10 to 1,000,000 inthe following manner: 1,000-10,000 by increments of1,000, 10,000-100,000 by increments of 10,000 and100,000-1,000,000 by increments of 100,000.
7.3 Design Contributions
The development of an Agent-Based Modeling simu-lation, as with software in general, is an iterative andongoing process. A simulation is never truly “fin-ished”, as there is always room for improvement insome area: speed of execution, ease of use, memory
footprint, variety of crisis scenarios, accuracy / va-lidity of model results, etc. With this in mind, theWIPER simulation has been designed to be straight-forward to maintain and extend. The simulationis designed using conventional software engineeringtechniques such as Design Patterns [10]. Compo-nents of the simulation are tested and verified usingan extensive and comprehensive Unit Testing suite.The simulation has been developed using an Agileapproach, with the design of the simulation revisedseveral times using the concept of Refactoring as de-scribed by Fowler [9]. Although these characteris-tics of the WIPER simulation are difficult to mea-sure quantitatively it is clear that they certainly con-tribute to the extensibility and maintainability of thesimulation.
The WIPER simulation is part of a Dynamic,Data-Driven Application System and, as such, thereare special design criteria that need to be met. First,simulations are intended to simulation short time pe-riods, between 10 minutes to 2 hours. Thus theWIPER system is designed for scalability and shortrun times, and has been shown to display excel-lent runtime performance. Second, simulations mustbe created from streaming data. In order to ad-dress this we have made it possible to create sim-ulations with a reasonable approximation of agentlocations, as would be available in a real-world situ-ation. Agent locations are known to the cell towerlevel and agents are randomly distributed within thetower area. Third, simulations are updated and val-idated against the streaming data. The updatingand online validation process are beyond the scope ofthis paper, but they require that agents are able touse interchangeable models that can be validated viaa ranking and selection process against online data.More information on this can be found in [23]. Thusthe simulation has been designed with interchange-able movement and activity models.
Developer and user documentation is provided inthe form of annotated JavaDoc pages, with exten-sive comments from the developer and references torelevant classes in the various APIs used by the sim-ulation, e.g. RePast, OpenMap, etc. Additional doc-umentation for end users is provided on a researchwiki and will be made available upon request.

8 SUMMARY
In this paper we have presented the WIPER simula-tion, an Agent-Based Model for simulating the move-ment and calling behavior of cell phone users. Thesimulation has a calling activity model based on theactivity observed in empirical data taken from cellu-lar service provider records. The activity generatedby the simulation is indistinguishable from the em-pirical data according to statistical tests. The move-ment models demonstrate various behaviors that areimportant when attempting to simulate crisis behav-ior. Also, as the simulation is designed to be a partof the WIPER system for emergency response, wheresimulations are updated with streaming data, run-time performance is an important development goal.We have demonstrated through a scalability explo-ration the runtime characteristics of the simulation,showing that it displays adequate performance for usein the time-critical WIPER system.
9 FUTURE WORK
The current cell phone activity models represent us-age under normal scenarios. We would like to studythe existing CDR data and examine behavior of peo-ple during crisis events. We will use this informationto guide the creation of crisis activity models and willuse our existing validation framework to evaluate thisapproach.
In order to better model human behavior and thespread of information as it relates to crisis events,it may be useful to examine creating a social net-work structure on the agents. The could allow usto study information diffusion across a population,as well as examining the interplay between physicallocation and distance in a social network.
References
[1] Jerry Banks, John Carson, Barry Nelson, andDavid Nicol. Discrete-Event System Simulation.Prentice Hall, Upper Saddle River, NJ, Thirdedition, 2005.
[2] C. L. Barrett and et al. Transportation analysissimulation system. Technical report, Los AlamosNational Laboratory, 2004.
[3] Chris L. Barrett, Stephen G. Eubank, andJames P. Smith. If smallpox strikes portland... Scientific American, March 2005.
[4] Michael Batty and Bin Jiang. Multi-agent sim-ulation: New approaches to exploring space-time dynamics within gis. Graphical InformationSystems Research - UK (GISRUK) 1999, April1999.
[5] Ling Bian. A conceptual framework for anindividual-based spatially explicit epidemiolog-ical model. Environment and Planning B,31:381–395, 2004.
[6] Scott Christley, Mark S. Alber, and Stuart A.Newman. Patterns of mesenchymal condensa-tion in a multiscale, discrete stochastic model.PLoS Computational Biology, 3(e76), 2007.
[7] Frederica Darema. Dynamic Data Driven Appli-cation Systems: A new paradigm for applicationsimulations and measurements. In M. Bubaket al, editor, The Proceedings of ICCS 2004,Lecture Notes in Computer Science 3038, pages662–669, 2004.
[8] Stephen Eubank. Scalable, efficient epidemiolog-ical simulation. Proceedings of the 2002 ACMSymposium on Applied Computing, pages 139–145, 2002.
[9] Martin Fowler. Refactoring: improving the de-sign of existing code. Addison-Wesley LongmanPublishing Co., Inc., Boston, MA, USA, 1999.
[10] Erich Gamma, Richard Helm, Ralph Johnson,and John Vlissides. Design patterns: elementsof reusable object-oriented software. Addison-Wesley Longman Publishing Co., Inc., Boston,MA, USA, 1995.
[11] The Geotools project. http://geotools.codehaus.org, 2006.
[12] Harold Greenberg. An analysis of trafficflow. Operations Research, 7(1):79–85, January- February 1959.
[13] B. D. Greenshields, J. R. Bibbins, W. S. Chan-ning, and H. H. Miller. A study of traffic ca-pacity. Highway Research Board Proceedings,14:448–477, 1935.
[14] Peter Hidas. Modelling lane changing and merg-ing in microscopic traffic simulation. Transporta-tion Research Part C: Emerging Technologies,10:351–371, October-December 2002.
[15] Raymond Hill, Lance Champagne, and JosephPrice. Using agent-based simulation and gametheory to examine the WWII Bay of Biscay U-boat campaign. Journal of Defense Modelingand Simulation, 1(4):99–109, October 2004.
[16] Wolfgang Hoschek. Colt high performance scien-tific library. http://acs.lbl.gov/~hoschek/colt/index.html, 2004. [Online; accessed 30-October-2008].
[17] R. M. Itami and H. R. Gimblett. Intelligentrecreation agents in a virtual gis world. Com-plexity International, 8, 2001.
[18] Seapahn Meguerdichian, Farinaz Koushanfar,Miodrag Potkonjak, and Mani B. Srivastava.Coverage problems in wireless ad-hoc sensor net-works. In INFOCOM, pages 1380–1387, 2001.
[19] M.J. North, N.T. Collier, and J.R. Vos. Ex-periences creating three implementations of theRepast agent modeling toolkit. ACM Trans-actions on Modeling and Computer Simulation,16:1–25, January 2006.
[20] S. F. Railsback, B . C. Harvey, J. Hayse, andK. LaGory. Tests of theory for diel variation insalmonid feeding activity and habitat use. Ecol-ogy, 86:947–959, 2005.
[21] David A. Robalino and Robert J. Lempert. Car-rots and sticks for new technology: Abatinggreenhouse gas emissions in a heterogeneous anduncertain world. Integrated Assessment, 1(1):1–19, March 2000.
[22] Tim Schoenharl, Ryan Bravo, and Greg Madey.WIPER: Leveraging the cell phone network foremergency response. International Journal ofIntelligent Control and Systems, 11(4), Decem-ber 2006.
[23] Timothy W. Schoenharl and Greg Madey. Eval-uation of measurement techniques for the valida-tion of agent-based simulations against stream-ing data. In Marian Bubak, Geert Dick van Al-bada, Jack Dongarra, and Peter M.A. Sloot, ed-itors, Computational Science – ICCS 2008, vol-ume 5103 of LNCS, pages 6–15. Springer, 2008.
[24] Shahab Sheikh-Bahaei, Glen E. P. Ropella, andC. Anthony Hunt. In silico hepatocyte: Agent-based modeling of the biliary excretion of drugs.In Levent Yilmaz, editor, Proceedings of Agent-Directed Simulation Symposium (ADS 2006),April 2005.
[25] NSF Program Solicitation. DDDAS: Dynamicdata-driven application systems. NSF ProgramSolicitation NSF 05-570, June 2005.
[26] BBN Technologies. Openmap:Open systems mapping technology.http://openmap.bbn.com/.
[27] Paul Waddell. UrbanSim: Modeling urban de-velopment for land use, transportation and en-vironmental planning. Journal of the AmericanPlanning Association, 68(3):297–314, 2002.