design of a h - era home
TRANSCRIPT

This thesis has been submitted in fulfilment of the requirements for a postgraduate degree
(e.g. PhD, MPhil, DClinPsychol) at the University of Edinburgh. Please note the following
terms and conditions of use:
This work is protected by copyright and other intellectual property rights, which are
retained by the thesis author, unless otherwise stated.
A copy can be downloaded for personal non-commercial research or study, without
prior permission or charge.
This thesis cannot be reproduced or quoted extensively from without first obtaining
permission in writing from the author.
The content must not be changed in any way or sold commercially in any format or
medium without the formal permission of the author.
When referring to this work, full bibliographic details including the author, title,
awarding institution and date of the thesis must be given.

I
Design of a H2 Pressure Swing
Adsorption process at an advanced
IGCC plant for cogenerating hydrogen
and power with CO2 capture
Mauro Luberti
For the degree of Doctor of Philosophy
School of Engineering
The University of Edinburgh
2015


III
Lay Summary
Strong dependency on coal, crude oil and natural gas and the associated price
and supply chain risk increase the need for efficient utilisation of existing non-
renewable energy sources. Carbon capture and hydrogen purification technologies
are expected to play a key role in the future low-carbonised energy matrix. Integrated
Gasification Combined Cycles (IGCCs) are one of the emerging clean coal
technologies which pave the way for producing power from coal with a higher net
power efficiency than conventional PC-fired boiler power plants. The first part of
this thesis has been devoted to a detailed process simulation of an IGCC with a Shell
technology gasifier based on the DOE/NETL report in order to estimate the net plant
efficiency when the carbon capture unit is equipped.
At the same time, the production of ultrapure hydrogen is both a sought target
and an appropriate environmental solution because it is commonly utilised as
feedstock in refineries’ hydrotreaters and hydrocrackers as well as energy carrier in
fuel cells.
An efficient way to produce hydrogen can be through coal gasification.
Therefore, a novel hydrogen pressure swing adsorption (PSA) system has been
designed and optimised that is applied to an advanced IGCC plant for cogenerating
power and ultrapure hydrogen (99.99+ mol%) with pre-combustion CO2 capture. An
in-depth economic analysis was carried out and discussed in detail. The industrial
advanced IGCC performances have also been improved by process integration
between the H2 PSA unit and other units in the plant.

IV
Abstract
Strong dependency on fossil fuels and the associated price and supply chain
risk increase the need for more efficient utilisation of existing non-renewable energy
sources. Carbon capture and hydrogen purification technologies are expected to play
a key role in the future low-carbonised energy matrix. Integrated Gasification
Combined Cycles (IGCCs) are one of the emerging clean coal technologies which
pave the way for producing power from coal with a higher net power efficiency than
conventional PC-fired boiler power plants. It is also advantageous that in an IGCC
power plant a carbon capture unit can be applied to a stream having a very high CO2
partial pressure ahead of gas combustion that would not be available in case of a PC-
fired boiler power plant, leading to less energy penalty involved in carbon capture.
At the same time, the production of ultrapure hydrogen is both a sought target
and an appropriate environmental solution because it is commonly utilised as
feedstock in refineries’ hydrotreaters and hydrocrackers as well as energy carrier in
fuel cells. A high purity of hydrogen has been commercially produced out of raw
synthesis gas using a Hydrogen Pressure Swing Adsorption (H2 PSA) process. In this
thesis, it was aimed to design and optimise a bespoke H2 PSA system tailored for a
decarbonised syngas feed originating from a carbon capture unit. Therefore, a novel
H2 PSA has been studied that is applied to an advanced IGCC plant for cogenerating
power and ultrapure hydrogen (99.99+ mol%) with pre-combustion CO2 capture.
In designing the H2 PSA, it is essential to increase the recovery of ultrapure
hydrogen product to its maximum since the power consumption for compressing the
H2 PSA tail gas up to the gas turbine operating pressure should be minimised to save
the total auxiliary power consumption. Hydrogen recovery was raised by increasing
the complexity of the PSA step configuration that allows a PSA cycle to have a lower
feed flow to one column being used for adsorption and more pressure equalisation
steps. An in-depth economic analysis was carried out and discussed in detail. The
industrial advanced IGCC performances have also been improved by process
integration between the H2 PSA unit and other units in the plant.

V
“The number measures reality and allows to penetrate its
meaning”
PYTHAGORAS
“Felix, qui potuit rerum cognoscere causas”
[Fortunate who was able to know the causes of things]
VIRGIL (Georgica, II, 490)

VI
Acknowledgements
It is arduous to express in just a few sentences my sincere gratitude for all the
people who made possible this three-year PhD in Edinburgh.
First of all, I would like to profoundly thank my first supervisor Dr.
Hyungwoong Ahn for his constant help, support and motivation in exploring new
ideas and paths during my tenure. His continuous guidance has been fundamental for
achieving all my research goals, for improving my critical thinking, for introducing
me to the academic world in terms of how to write, improve and revise a paper, and
how to successfully prepare a presentation. I am convinced that my engineering skills
in general were greatly enhanced by this constant and daily exchange of opinions. A
special thanks goes to my second supervisor, Prof. Stefano Brandani, for his precious
advice and comments on my research during the weekly group meetings: his
extensive knowledge in all the fields of Chemical Engineering opened my mind more
than once, bringing me to solve problems from other perspectives.
I would like to express my gratitude to Dr. Daniel Friedrich for his support,
especially in developing the numerical code for simulating PSA systems, and to Dr.
Giulio Santori for the useful conversations on Adsorption Thermodynamics and for
making me sympathetic of his research interests. I owe a lot of my knowledge on
carbon capture and beyond to the CCS group at the University of Edinburgh: having
shared the office with brilliant colleagues was a great pleasure. In particular I wish to
thank the “old group” in the persons of Enzo, Zoe, Davide, Dursun, Francisco and
Zhilin, and the “new group” comprising Eleni, Arran, Elsa, Nick, Pramatesh,
Shreenath and Charithea. A special thanks is directed to Gabriel with whom I shared
almost three years of the burdens and joys of academic life, always supporting each
other like brothers.
My life in Edinburgh was much enlivened by the honest friendship of my
successive flatmates Ruth and Roberto who helped me explore the city and build new
life experiences. I wish also to thank George, Mike and Thomas for the scientific
conversations, the sport activities and many nights out where a disconnection from
the university was more than appreciated. I would like to heartily thank Nash who

VII
has been my first and best friend here in Edinburgh and on whom I could always rely
in any situation, especially at the beginning of this adventure.
I have always expressed in the past the willingness to do research but if I were
asked who convinced me to undertake the PhD I would answer it was my family. My
parents Rolando and Lucia and my brothers Tiziano and Dario, now both engineers,
have always been my best supporters, encouraging me to face new life challenges,
even abroad.
Eventually, I wish to dedicate this thesis work to my girlfriend Sarah, whose
sincere love has accompanied me during these years in Edinburgh, helping to relieve
me of the stress of research and highlighting all the good that life can bring.

VIII
List of papers / patents related to the Thesis
Luberti M, Friedrich D, Brandani S, Ahn H. Design of H2 PSA for cogeneration of
ultrapure hydrogen and power at an advanced integrated gasification combined cycle
with pre-combustion capture. Adsorption 2014; 20: 511-524.
Luberti M, Friedrich D, Ozcan DC, Brandani S, Ahn H. A novel strategy to produce
ultrapure hydrogen from coal with pre-combustion carbon capture. Energy Procedia
2014; 63: 2023-2030.
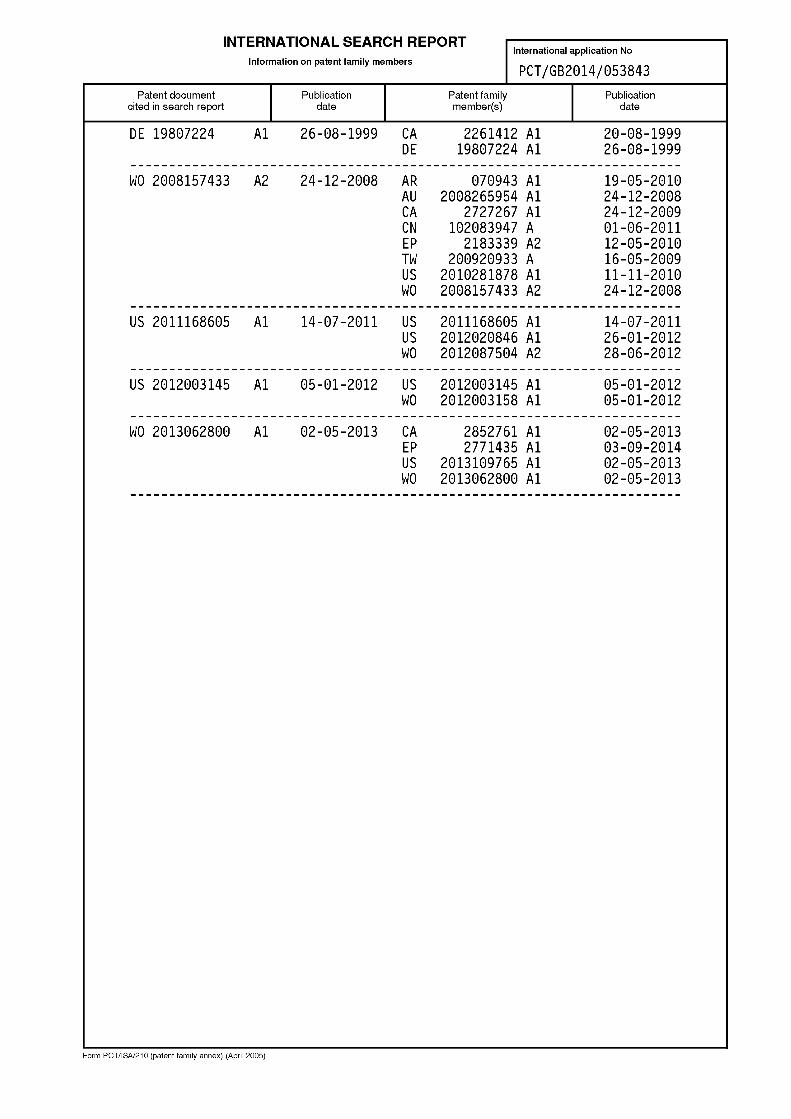
Ahn H, Brandani S, Luberti M, Lee CH. Hydrogen production processing. WO
2015/104532 A1, 2015.
Full list of papers / patents
Ahn H, Luberti M, Liu Z, Brandani S. Process configuration studies of the amine
capture process for coal-fired power plants. International Journal of Greenhouse Gas
Control 2013; 16: 29-40.
Ahn H, Luberti M, Liu Z, Brandani S. Process simulation of aqueous MEA plants for
post-combustion capture from coal-fired power plants. Energy Procedia 2013; 37:
1523-1531.
Luberti M, Friedrich D, Brandani S, Ahn H. Design of H2 PSA for cogeneration of
ultrapure hydrogen and power at an advanced integrated gasification combined cycle
with pre-combustion capture. Adsorption 2014; 20: 511-524.
Santori G, Luberti M, Ahn H. Ideal adsorbed solution theory solved with direct
search minimisation. Computers and Chemical Engineering 2014; 71: 235-240.
Luberti M, Friedrich D, Ozcan DC, Brandani S, Ahn H. A novel strategy to produce
ultrapure hydrogen from coal with pre-combustion carbon capture. Energy Procedia
2014; 63: 2023-2030.
Santori G, Luberti M, Brandani S. Common tangent plane in mixed-gas adsorption.
Fluid Phase Equilibria 2015; 392: 49-55.
Oreggioni GD, Brandani S, Luberti M, Baykan Y, Friedrich D, Ahn H. CO2 capture
from syngas by an adsorption process from a biomass gasification CHP plant: Its
comparison with amine-based CO2 capture. International Journal of Greenhouse Gas
Control 2015; 35: 71-81.

IX
Barba D, Brandani F, Capocelli M, Luberti M, Zizza A. Process analysis of an
industrial waste-to-energy plant: Theory and experiments. Process Safety and
Environmental Protection 2015; 96: 61-73.
Luberti M, Kim YH, Lee CH, Ferrari MC, Ahn H. New momentum and energy
balance equations considering kinetic energy effect for mathematical modelling of a
fixed bed adsorption column. Adsorption 2015; 21: 353-363.
Ahn H, Brandani S, Luberti M, Lee CH. Hydrogen production processing. WO
2015/104532 A1, 2015.

X
List of symbols
a Sorbate activity, (-)
AC Cost of CO2 avoided, ($/tonCO2)
Ac Internal column surface area, (m2)
Ac,a Internal column axial surface area, (m2)
Ac,l Internal column lateral surface area, (m2)
Ap Pellet surface area, (m2)
B Mobility of sorbate, (mol·m2/J·s)
bn,i Adsorption equilibrium constant of site n for component i, (bar-1
)
bn,i,0 Pre-exponential adsorption equilibrium const. coeff. of site n for comp. i, (bar-1
)
bi Adsorption equilibrium constant of component i, (bar-1
)
bi,0 Pre-exponential adsorption equilibrium constant of component i, (bar-1
)
C Gas phase concentration, (mol/m3)
cT Total gas phase concentration, (mol/m3)
ci Gas phase concentration of component i, (mol/m3)
cim Gas phase concentration of component i in the macropore, (mol/m
3)
cp,i Heat capacity at constant pressure of component i, (J/mol·K)
cv,i Heat capacity at constant volume of component i, (J/mol·K)
cp,s Adsorbent specific heat capacity (J/kg·K)
cv Valve coefficient, (m2)
D Diffusivity, (m2/s)
D0 Corrected diffusivity, (m2/s)
D∞ Diffusivity at infinite temperature, (m2/s)
Dc Internal column diameter, (m)
Dc,ext External column diameter, (m)
Di,j Molecular diffusivity of the component pair i and j, (m2/s)
Dk,i Knudsen diffusivity of component i, (m2/s)

XI
Dlm Diameter logarithmic mean, (m)
Dm,i Molecular diffusivity of component i, (m2/s)
Dp,i Macropore diffusivity of component i, (m2 /s)
dp Pellet averaged diameter, (m)
Ds,i Surface diffusivity of component i, (m2 /s)
Ds0,i Surface diffusivity at infinite temperature of component i, (m2 /s)
Dv,i Viscous diffusivity of component i, (m2 /s)
Dz Mass axial dispersion, (m2/s)
Dμ,i Effective micropore diffusivity, (m2/s)
E Diffusional activation energy, (J/mol)
F Flowrate (mol/s)
fi Fugacity of component i, (Pa)
Hf Enthalpy of the gas phase, (J/m3)
Partial molar enthalpy in the gas phase of component i, (J/mol)
∆H Heat of adsorption, absorption or reaction, (J/mol)
(-∆Hi) Heat of adsorption of component i, (J/mol)
hint Internal surface heat transfer coefficient, (W/m2·K)
hext External surface heat transfer coefficient, (W/m2·K)
hw Heat transfer coefficient between the gas phase and the column wall, (W/m2·K)
J Diffusive flux, (mol/m2·s)
Ji Diffusive flux of component i, (mol/m2·s)
JT Thermal diffusive flux, (W/m2)
K Dimensionless Henry’s law constant, (-)
K0 Pre-exponential dimensionless Henry’s law constant, (-)
K’ Henry’s law adsorption constant defined in terms of sorbate pressure, (mol/m3·Pa)
kg Gas phase thermal conductivity, (W/m·K)
kg,i Gas phase thermal conductivity of component i, (W/m·K)
iH~

XII
Ki,s Henry’s law constant of component i in solvent s, (Pa)
kip·Ap/Vp LDF mass transfer coefficient of component i in the pellet, (s
-1)
kicr·3/rc LDF mass transfer coefficient of component i in the crystal, (s
-1)
kw Wall thermal conductivity, (W/m·K)
kz Thermal axial dispersion, (W/m·K)
L, Lc Column length, (m)
LCOE Levelized cost of electricity, ($/MWh)
mads Adsorbent mass, (kg)
M Averaged molecular weight, (kg/mol)
Mi Molecular weight of component i, (g/mol)
Nc Number of components, (-)
P Total pressure in the gas phase, (bar)
Pi Partial pressure of component i, (bar)
Pads Adsorption pressure, (bar)
Pdes Desorption pressure, (bar)
Pr Prandtl number, (-)
q Adsorbed phase concentration, (mol/m3)
iq Averaged adsorbed phase concentration of component i in the crystal, (mol/m
3)
iQ Averaged adsorbed concentration of component i in the pellet, (mol/m
3)
qi* Adsorbed phase concentration in the equilibrium state of component i, (mol/m
3)
qs,i Saturation adsorption capacity of component i, (mol/m3)
qs,n,i Saturation adsorption capacity of site n for component i, (mol/m3)
Qfeed Feed flowrate, (mol/s)
r Radial coordinate, (-)
R Ideal gas constant, (J/mol·K)
Rc Column radius, (m)
Re Reynolds number, (-)

XIII
rc Crystal radius, (m)
rp Pellet radius, (m)
Sc Schimdt number, (-)
t Time, (s)
tads Adsorption time, (s)
tcycle Cycle time, (s)
T Temperature, (K)
Tref Reference temperature, (K)
Tf Gas phase temperature, (K)
Ts Adsorbed phase temperature, (K)
Tfeed Feed temperature, (K)
Tw Column wall temperature, (K)
u Interstitial velocity, (m/s)
Uf Internal energy in the gas phase, (J/m3)
UP Internal energy in the pellet, (J/m3)
UP,f Internal energy in the macropores, (J/m3)
UP,s Internal energy in the adsorbed phase, (J/m3)
ΔU Internal energy change of adsorption, (J/mol)
Vc Column volume, (m3)
v Superficial velocity, (m/s)
Vp Pellet volume, (m3)
x Wall thickness, (m)
xi Molar fraction of component i in the liquid or adsorbed phase, (-)
yi Molar fraction of component i in the gas phase, (-)
z Axial coordinate, (m)

XIV
Greek letters
αi,j Selectivity of component i over component j, (-)
ε Bed void fraction excluding macropores, (-)
εi Characteristic Lennard-Jones energy parameter of component i, ((kg/mol·K)0.5
)
εcry Crystal void fraction, (-)
εp Pellet void fraction, (-)
μ Molar chemical potential, (J/mol)
μ0 Molar chemical potential in the reference state, (J/mol)
μ Gas phase viscosity, (Pa·s)
μi Gas phase viscosity of component i, (Pa·s)
φ Pellet non-spherically coefficient, (-)
φi Fugacity coefficient of component i, (-)
Φi,j Characteristic Lennard-Jones viscosity parameter for the component pair i and j, (-)
ρbulk Gas bulk phase density, (kg/m3)
ρcry Crystal density, (kg/m3)
ρf, ρg Gas phase density, (kg/m3)
ρp Pellet density, (kg/m3)
ρskel Skeletal density, (kg/m3)
σi,j Characteristic Lennard-Jones length for the component pair i and j, (Å)
τ Gas residence time, (s)
τp Pellet tortuosity, (-)
Ωi,j Characteristic Lennard-Jones energy parameter for the component pair i and j, (-)
Ωμ Characteristic Lennard-Jones viscosity parameter, (-)

XV
List of contents
Chapter 1: General introduction ................................................................ 1
1.1 Fossil fuels and global warming ......................................................................... 1
1.2 Carbon dioxide global emissions and the need for CCS .................................... 3
1.3 Carbon capture systems ...................................................................................... 6
1.3.1 Post-combustion carbon capture ............................................................................. 7
1.3.2 Pre-combustion carbon capture ............................................................................... 8
1.3.3 Oxy-fuel combustion carbon capture ...................................................................... 8
1.3.4 Capture from industrial process streams ................................................................. 9
1.4 Carbon capture technologies .............................................................................. 9
1.4.1 Chemical absorption ............................................................................................. 10
1.4.2 Physical absorption ............................................................................................... 13
1.4.3 Adsorption............................................................................................................. 14
1.4.4 Membranes ............................................................................................................ 15
1.4.5 Chemical looping .................................................................................................. 16
1.4.6 Cryogenic distillation ............................................................................................ 16
1.5 Carbon dioxide capture costs ........................................................................... 17
1.6 Global hydrogen demand ................................................................................. 18
1.7 Methods for producing hydrogen ..................................................................... 20
1.8 Carbon capture from hydrogen plants: Research perspective .......................... 22
1.9 Carbon capture from hydrogen plants: Industrial perspective ......................... 25
1.10 The role of hydrogen in the future energy matrix .......................................... 26
1.11 Objectives of the thesis ................................................................................... 27
1.12 Outline of the thesis ........................................................................................ 30
References .............................................................................................................. 31
Chapter 2: IGCC power plant design and simulation ............................. 39
2.1 IGCC power plants in the literature ................................................................. 40
2.2 Gasification process ......................................................................................... 43
2.3 Gasification technologies ................................................................................. 45
2.4 Shell gasifier description and modelling .......................................................... 46
2.5 Gasifier and surroundings modification for carbon capture ............................. 50
2.6 Water gas shift reactors .................................................................................... 52

XVI
2.7 Air separation unit ............................................................................................ 53
2.8 Dual-stage SelexolTM
........................................................................................ 60
2.8.1 Thermodynamics of the process ........................................................................... 62
2.8.2 Gas–liquid equilibrium in UniSim Design ............................................................ 65
2.8.3 Proposed configuration ......................................................................................... 67
2.9 CO2 compression and dehydration ................................................................... 70
2.10 Claus plant ...................................................................................................... 72
2.11 Gas turbine ..................................................................................................... 77
2.12 Heat recovery steam generation ..................................................................... 80
2.12.1 Main and reheat steam systems ........................................................................... 81
2.12.2 Circulating water system ..................................................................................... 81
2.12.3 Raw water and cycle makeup water systems ...................................................... 82
2.13 Overall plant performances ............................................................................ 85
2.14 Conclusions .................................................................................................... 88
References .............................................................................................................. 89
Chapter 3: Fundamentals of adsorption and pressure swing adsorption
processes.................................................................................................. 96
3.1 Adsorbents ........................................................................................................ 96
3.1.1 Silica gel................................................................................................................ 99
3.1.2 Activated alumina ............................................................................................... 100
3.1.3 Activated carbon ................................................................................................. 100
3.1.4 Carbon molecular sieves ..................................................................................... 101
3.1.5 Polymeric resins .................................................................................................. 101
3.1.6 Mesoporous silica ............................................................................................... 102
3.1.7 Zeolites ................................................................................................................ 102
3.1.8 Metal organic frameworks (MOFs) .................................................................... 104
3.2 Adsorption equilibrium .................................................................................. 105
3.3 Adsorption kinetics ......................................................................................... 109
3.3.1 Diffusion in mesopores and macropores ............................................................. 110
3.3.2 Diffusion in micropores ...................................................................................... 112
3.4 Adsorption column model .............................................................................. 113
3.4.1 Column dimensions ............................................................................................ 114
3.4.2 Mass balance ....................................................................................................... 116
3.4.3 Energy balance .................................................................................................... 118

XVII
3.4.4 Momentum balance ............................................................................................. 120
3.4.5 Transport parameters and physical properties of gases ....................................... 120
3.5 Industrial use of adsorption for gas separation ............................................... 122
3.6 PSA process for hydrogen purification .......................................................... 128
3.7 Conclusions .................................................................................................... 136
References ............................................................................................................ 137
Chapter 4: Design of a H2 PSA applied to an IGCC with pre-combustion
capture ................................................................................................... 142
4.1 Background of the study ................................................................................. 142
4.2 Design basis of a H2 PSA integrated with an IGCC power plant ................... 144
4.3 Adsorption equilibria ...................................................................................... 145
4.4 Simulation of the H2 PSA unit ....................................................................... 150
4.5 Adsorption breakthrough results .................................................................... 154
4.6 PSA cycle simulation results .......................................................................... 155
4.6.1 Four-column H2 PSA .......................................................................................... 156
4.6.2 Six-column H2 PSA ............................................................................................ 161
4.6.3 Polybed H2 PSA (nine and twelve columns) ....................................................... 166
4.6.4 Sixteen-column H2 PSA ...................................................................................... 171
4.6.5 Comparison among various PSA cycles ............................................................. 172
4.7 H2 PSA simulation results with fixed total cycle time ................................... 175
4.8 Conclusions .................................................................................................... 177
References ............................................................................................................ 178
Chapter 5: Process integration of the industrial H2 PSA unit with the
IGCC for cogenerating ultrapure hydrogen and electricity, cost analysis
and process improvements .................................................................... 181
5.1 Retrofit of the H2 PSA unit to the IGCC with pre-combustion capture ......... 182
5.2 Design of an industrial H2 PSA at the advanced IGCC ................................. 184
5.3 Industrial H2 PSA economic analysis ............................................................. 195
5.4 Integrated IGCC cost analysis ........................................................................ 198
5.5 Recycle of the H2 PSA tail gas to shift reactors ............................................. 204
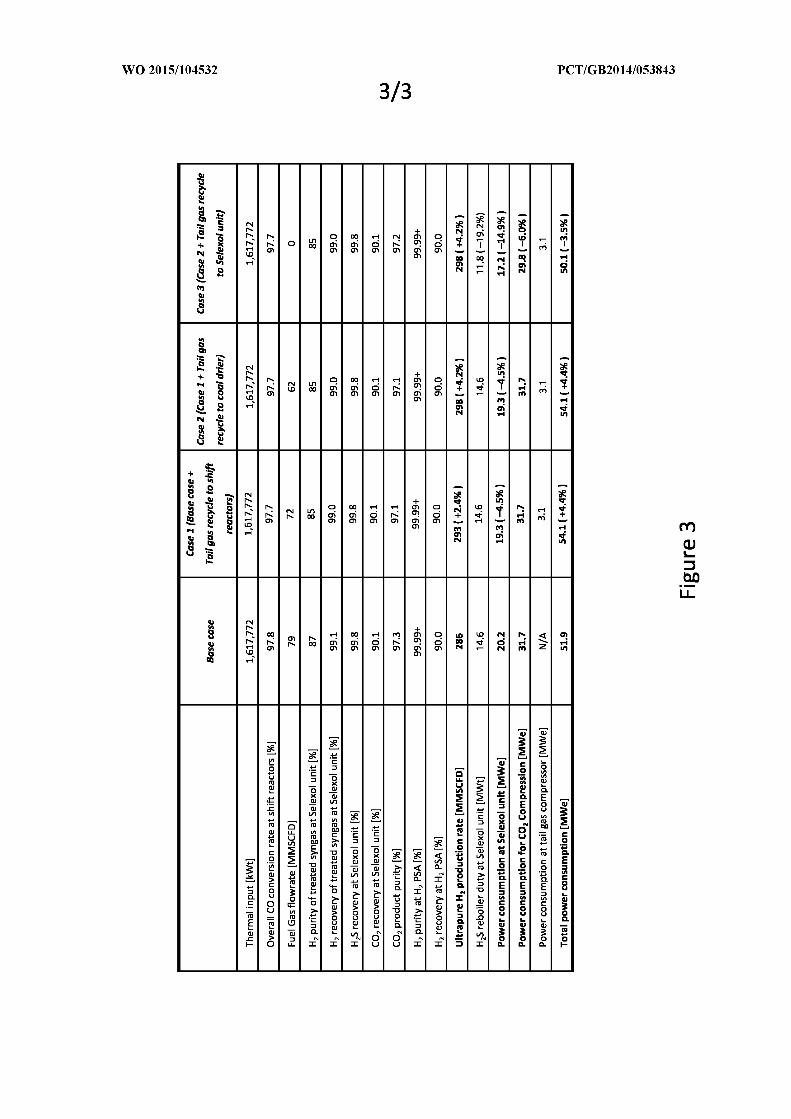
5.6 Cogenerating IGCC process improvements ................................................... 207
5.6.1 Case 1: H2 PSA tail gas recycle to water gas shift reactors ................................ 208

XVIII
5.6.2 Case 2: H2 PSA tail gas recycle to dual-stage Selexol unit ................................. 209
5.6.3 Case 3: H2 PSA tail gas recycle to coal dryer ..................................................... 209
5.6.4 Case 4: Multiple alterations with H2 PSA tail gas recycle to WGSRs and coal
dryer ............................................................................................................................. 210
5.6.5 Comparison for the proposed process modifications .......................................... 211
5.7 Hydrogen plant process improvements .......................................................... 214
5.8 Conclusions .................................................................................................... 216
References ............................................................................................................ 217
Chapter 6: Conclusions and directions for future work ........................ 220
6.1 IGCC power plant modelling ......................................................................... 220
6.2 Design of a novel H2 PSA unit applied to an IGCC H2-rich feed .................. 222
6.3 Retrofit of an industrial H2 PSA unit to an IGCC .......................................... 224
References ............................................................................................................ 225
Appendix 1: DOE case 6 block flow diagram and data ........................ 226
Appendix 2: Design of H2 PSA for cogeneration of ultrapure hydrogen
and power at an advanced integrated gasification combined cycle with
pre-combustion capture by Luberti et al., 2014 .................................... 232
Appendix 3: A novel strategy to produce ultrapure hydrogen from coal
with pre-combustion carbon capture by Luberti et al., 2014 ................ 247
Appendix 4: Hydrogen production processing by Ahn et al., 2015 ...... 256

XIX
List of Tables
Table 1.1: Carbon capture cross-referenced toolbox between systems and technologies
(IPCC, 2005) .......................................................................................................................... 10
Table 1.2: Common solvents used in pre-combustion capture processes (IPCC, 2005)........ 13
Table 1.3: World hydrogen demand over years expressed in billion cubic meters (Freedonia
Group, Inc., 2014) .................................................................................................................. 19
Table 1.4: Summary of research works on carbon capture processes from hydrogen plants 22
Table 2.1: Categories of gasification processes (Simbeck et al., 1993) ................................. 46
Table 2.2: Illinois No. 6 proximate and ultimate analysis (DOE, 2007) ................................ 48
Table 2.3: Validation of the simulation approach with DOE (2007) data for Shell gasifier.. 50
Table 2.4: Simulation parameters and product specifications for ASU simulation ............... 58
Table 2.5: Properties of physical solvents (Ranke and Mohr, 1985) ..................................... 61
Table 2.6: Henry’s law constants for H2S and CO2 in Selexol (Xu et al., 1992) ................... 63
Table 2.7: Standard heats of absorption for H2S and CO2 in Selexol (Xu et al., 1992) ......... 63
Table 2.8: Gas solubilities of some physical solvents relative to CO2 (Burr and Lyddon,
2008) ...................................................................................................................................... 65
Table 2.9: Original and regressed parameters of Henry’s law equation for acid gases in
Selexol ................................................................................................................................... 67
Table 2.10: Energy requirements for two-stage Selexol process ........................................... 70
Table 2.11: Combustion turbine exhaust gas for carbon capture Shell IGCC compared with
DOE report (2007) data ......................................................................................................... 79
Table 2.12: Condenser outlet streams validation carbon capture Shell IGCC compared with
DOE report (2007) data ......................................................................................................... 82
Table 2.13: Comparison of DOE report (2007) data and simulation ..................................... 87
Table 2.14: Simulated energy penalty in Shell IGCC with capture ....................................... 87
Table 2.15: Auxiliary consumptions comparison between non-capture and carbon capture
IGCCs (DOE, 2007) ............................................................................................................... 88
Table 3.1: Classification of commercial adsorbents .............................................................. 97
Table 3.2: Physical properties of some common adsorbents and their industrial application
(Yang, 1987; Ruthven et al., 1994) ........................................................................................ 99
Table 3.3: Summary of column and pellet dimensions, densities and void fractions .......... 115
Table 3.4: Some dimensionless numbers used in the correlations ....................................... 121
Table 3.5: Summary of research works on hydrogen purification by PSA processes ......... 131
Table 4.1: Isotherm parameters of dual-site Langmuir model for zeolite 5A ...................... 146

XX
Table 4.2: List of column parameters, particle parameters and operating conditions of H2
PSA simulations (Luberti et al., 2014a) ............................................................................... 153
Table 4.3: Performances of the four-column H2 PSA system at different purge flow rates 158
Table 4.4: Performance of six-column H2 PSA simulations ................................................ 165
Table 4.5: Performance of nine- and twelve-column PSA simulations ............................... 170
Table 4.6: Performance of sixteen-column PSA simulations .............................................. 172
Table 4.7: Effect of the one-column residence time during adsorption step on hydrogen
purity, recovery and productivity at different H2 PSA configurations ................................. 177
Table 5.1: List of column parameters and pressure drop evaluation for the industrial H2 PSA
simulations ........................................................................................................................... 185
Table 5.2: List of additional column parameters, particle parameters and operating conditions
of the industrial H2 PSA simulations for a one-column residence time of 120 s. Numbers in
brackets represent transport parameters of lab-scale system ............................................... 187
Table 5.3: Effect of the one-column residence time during adsorption step on hydrogen
purity, recovery and bed productivity at different industrial H2 PSA configurations with total
cycle time of 420 s ............................................................................................................... 190
Table 5.4: List of variables used to calculate the bed productivity for all the system
configurations at 99.99+% H2 purity ................................................................................... 191
Table 5.5: Ultrapure hydrogen production rate and tail gas compression work at various
industrial H2 PSA configurations at the condition of 99.99+ mol% H2 purity and total cycle
time of 420 s, including IGCC overall plant performances ................................................. 194
Table 5.6: Design and economic parameters utilised in the economic analysis .................. 196
Table 5.7: Economic analysis comparison among the different PSA configurations including
the comparison with the entire IGCC plant ......................................................................... 197
Table 5.8: Nomenclature used to define levelised cost of electricity................................... 200
Table 5.9: Economic and plant parameters used for the cost analysis among the three IGCC
cases ..................................................................................................................................... 201
Table 5.10: List of references for unit costs ......................................................................... 201
Table 5.11: LCOE and AC results of various studies on hard coal IGCC with pre-combustion
capture (ZEP, 2011) ............................................................................................................. 204
Table 5.12: Simulation results for the cogenerating IGCC plant performances among the
various cases ........................................................................................................................ 213
Table 5.13: Simulation results for the hydrogen plant (HP) performances for the various
cases (Ahn et al., 2015) ........................................................................................................ 215

XXI
List of Figures
Figure 1.1: World energy consumption by fuel type during the years 1990–2040 (quadrillion
[1015
] Btu) (WEO/EIA, 2013) .................................................................................................. 2
Figure 1.2: World primary energy use by sector, 1971–2001 (IEA, 2003) ............................. 4
Figure 1.3: World CO2 emissions from fossil fuel use by sector, 1971–2001 (IEA, 2003) ..... 4
Figure 1.4: Relative importance of refinery greenhouse gas emission sources evaluated on
CO2e basis (EPA, 2008) ........................................................................................................... 6
Figure 1.5: Overview of carbon capture systems (IPCC, 2005) .............................................. 7
Figure 1.6: General schemes of the main processes relevant for CO2 capture (IPCC, 2005) 10
Figure 1.7: Process flow diagram for CO2 recovery from flue gas by chemical absorption
(IPCC, 2005) .......................................................................................................................... 11
Figure 1.8: Levelised cost of electricity (LCOE) of PC and IGCC power plants (Hoffmann
and Szlo, 2011) ...................................................................................................................... 17
Figure 1.9: Cost of CO2 avoided of PC and IGCC power plants (Hoffmann and Szlo, 2011)
............................................................................................................................................... 18
Figure 1.10: World hydrogen production and use (Evers, 2008) ........................................... 19
Figure 1.11: Hydrogen sources and production processes (IGEM, 2012) ............................. 21
Figure 1.12: Block flow diagram of Port Arthur SMRs and integrated CO2 capture facility
(Baade et al., 2012) ................................................................................................................ 26
Figure 2.1: Block flow diagram of the Shell IGCC with carbon capture............................... 43
Figure 2.2: Simplified schematic of a gasification process showing options with CO2 capture
and electricity, hydrogen or chemical production (IPCC, 2005) ........................................... 44
Figure 2.3: Shell gasifier schematic (DOE, 2007) ................................................................. 47
Figure 2.4: Variation of syngas composition with temperature at 40 bar (Higman and van der
Burgt, 2003) ........................................................................................................................... 49
Figure 2.5: Shell Gasifier, syngas scrubber and COS hydrolysis reactor for non-capture mode
(Kapetaki et al., 2013) ............................................................................................................ 51
Figure 2.6: Shell Gasifier, syngas scrubber and water gas shift reactors for carbon capture
mode (Kapetaki et al., 2013) .................................................................................................. 52
Figure 2.7: Technology comparison for nitrogen production systems................................... 54
Figure 2.8: Cryogenic process for oxygen production by distillation of liquid air (Castle,
1991) ...................................................................................................................................... 55
Figure 2.9: Simulation flowsheet of cryogenic air separation unit ........................................ 56
Figure 2.10: Coal gasification and air separation unit schematic (Kapetaki, 2015) .............. 59
Figure 2.11: Selexol process flow diagram for acid gas removal (Padurean et al., 2012) ..... 62

XXII
Figure 2.12: Gas solubilities of H2S and CO2 in physical solvents ( ..................................... 64
Figure 2.13: Solubilities of CO2 and H2S in Selexol solvent at 25 C. The Y-axis reports the
gas partial pressure while the X-axis reports the component mole fraction in the liquid phase.
Dotted lines represent UniSim original curves, continuous lines represent UniSim regressed
curves, dots represent experimental obtained values by Xu et al. (1992) .............................. 67
Figure 2.14: Simplified schematic of the integrated Selexol process (Kapetaki, 2015) ........ 69
Figure 2.15: Syngas clean-up schematic (Kapetaki, 2015) .................................................... 71
Figure 2.16: Schematic of the Claus process with two converters (El-Bishtawi and Haimour,
2004) ...................................................................................................................................... 73
Figure 2.17: Sulfur conversion to species with temperature (♦ S2, ■ S6, ▲ S8) .................... 75
Figure 2.18: Sulfur recovery and tail gas recycle schematic (Kapetaki, 2015) ..................... 76
Figure 2.19: Carbon capture Shell IGCC power block schematic ......................................... 79
Figure 2.20: Combined cycle power generation schematic (Kapetaki, 2015) ....................... 83
Figure 2.21: Steam and feedwater schematic (Kapetaki, 2015) ............................................. 84
Figure 2.22: Fully integrated IGCC simulation flow sheet in UniSim Design R400
environment ........................................................................................................................... 86
Figure 3.1: Pore size distribution for pelleted 5A zeolite (Ruthven et al., 1994) .................. 98
Figure 3.2a: Representation of a sodalite cage or truncated octahedron (Manske, 2009) ... 103
Figure 3.2b: Representation of type A zeolite unit cell (left) and unit cell of types X and Y,
or faujasite (right) (Averill and Eldredge, 2007) ................................................................. 104
Figure 3.3: X-ray crystal structure of indium soc-MOF, in which (a) is a cluster of metal
ions, (b) is an organic linker, (c) and (d) are representations of a cuboidal cage of indium
soc-MOF and (e) is a space filling representation of the framework viewed along the y-
direction (Wang et al., 2011) ............................................................................................... 105
Figure 3.4: The IUPAC classification for adsorption isotherms (IUPAC, 1985) ................ 106
Figure 3.5: Dimensionless equilibrium isotherms ............................................................... 107
Figure 3.6: The resistances to mass transfer in a composite adsorbent pellet ...................... 110
Figure 3.7: Model hierarchy for the adsorption column: in each stage the different options
are only shown for one option of the previous stage but apply to all options of the previous
stage ..................................................................................................................................... 114
Figure 3.8: Schematic of an adsorption column showing the two inlets and the adsorbent
pellets: the inset shows a schematic of an idealised adsorbent pellet including the spherical
crystallites ............................................................................................................................ 115
Figure 3.9: Schematic isotherms showing pressure swing, thermal swing and combined
pressure–temperature swing operation for an adsorption process (Ruthven et al., 1984).... 123

XXIII
Figure 3.10: The basic two-bed pressure swing adsorption system (Skarstrom, 1960) ....... 125
Figure 3.11: The sequence of steps in the basic Skarstrom cycle ........................................ 126
Figure 3.12: UOP four-bed PSA system (Batta, 1971) ........................................................ 129
Figure 3.13: UOP Polybed process for hydrogen purification (Fuderer and Rudelstorfer,
1976) .................................................................................................................................... 130
Figure 4.1: A conceptual diagram to compare general approach to capture CO2 from a SMR
H2 plant and a coal-fired power plant separately to an advanced IGCC process for
cogenerating power and ultrapure hydrogen with carbon capture (Luberti et al., 2014a) ... 143
Figure 4.2: Block flow diagram of an advanced IGCC process for cogenerating power and
ultrapure hydrogen ............................................................................................................... 144
Figure 4.3: Adsorption equilibrium of hydrogen on 5A zeolite. Solid lines: dual-site
Langmuir model. Experimental data by Lopes et al. (2009) ................................................ 147
Figure 4.4: Adsorption equilibrium of carbon dioxide on 5A zeolite. Solid lines: dual-site
Langmuir model. Experimental data by Lopes et al. (2009) ................................................ 147
Figure 4.5: Adsorption equilibrium of carbon monoxide on 5A zeolite. Solid lines: dual-site
Langmuir model. Experimental data by Lopes et al. (2009) ................................................ 148
Figure 4.6: Adsorption equilibrium of nitrogen on 5A zeolite. Solid lines: dual-site Langmuir
model Experimental data by Lopes et al. (2009) ................................................................. 148
Figure 4.7: Adsorption equilibrium of argon on 5A zeolite. Solid lines: dual-site Langmuir
model. Experimental data by Miller et al. (1987) ................................................................ 149
Figure 4.8: Adsorption equilibrium comparison of hydrogen, carbon dioxide, carbon
monoxide, nitrogen and argon on 5A zeolite at 303 K ........................................................ 150
Figure 4.9: Unibed CySim PSA flowsheet .......................................................................... 152
Figure 4.10: Breakthrough simulation results of the shifted syngas stream on zeolite 5A bed
at 303 K and 34 bar. Column size and feed condition are reported in Table 4.2 ................. 154
Figure 4.11: Step configuration of a four-column PSA cycle (AD: adsorption, DPE:
depressurising pressure equalisation, PP: providing purge, BD: blowdown, PU: purge, PPE:
pressurising pressure equalisation, PR: product pressurisation, tAD = tcycle/4; tPR = 3tcycle/16; tPP
= tPU = tcycle/8; tBD = tDPE = tPPE = tcycle/16) ............................................................................ 156
Figure 4.12: Pressure profiles at the product end of a column over a cycle at the cyclic steady
state of the four-column H2 PSA unit: effect of the different amounts of purge flow ......... 157
Figure 4.13: Component mole fraction profiles at the feed end of a column over a cycle at
the cyclic steady state of the four-column H2 PSA unit (Run 2).......................................... 159
Figure 4.14: Hydrogen mole fraction profile along the column at the end of adsorption step
at the cyclic steady state of the four-column H2 PSA unit (Run 2) ...................................... 160

XXIV
Figure 4.15: Impurities mole fraction profiles along the column at the end of adsorption step
at the cyclic steady state of the four-column H2 PSA unit (Run 2) ...................................... 160
Figure 4.16: Evolution of hydrogen purity and recovery through the cycles (Run 2) ......... 161
Figure 4.17: Step configurations of a six-column H2 PSA cycle with two-stage pressure
equalisation (AD: adsorption, DPE: depressurising pressure equalisation, ID: idle, PP:
providing purge, BD: blowdown, PU: purge, PPE: pressurising pressure equalisation, PR:
pressurisation, tAD = tcycle/3; tPP = tPU = tPR = tcycle/9; tBD = tDPE = tPPE= tcycle/18) ................... 162
Figure 4.18: Step configurations of a six-column H2 PSA cycle with three-stage pressure
equalisations (AD: adsorption, DPE: depressurising pressure equalisation, PP: providing
purge, BD: blowdown, PU: purge, ID: idle, PPE: pressurising pressure equalisation, PR:
pressurisation, tAD = tcycle/6; tPP = tPU = tPR = tcycle/9; tBD = tDPE = tPPE = tID= tcycle/18) ........... 163
Figure 4.19: Pressure profile at the product end of a column over a cycle at the cyclic steady
state of six-column H2 PSA simulation at PP/F = 0.3 with two-stage pressure equalisation
(Run 6) ................................................................................................................................. 164
Figure 4.20: Pressure profile at the product end of a column over a cycle at the cyclic steady
state of six-column H2 PSA simulation at PP/F = 0.3 with three-stage pressure equalisation
............................................................................................................................................. 164
Figure 4.21: Step configurations of a nine-column H2 PSA cycle (AD: adsorption, DPE:
depressurising pressure equalisation, PP: providing purge, BD: blowdown, PU: purge, PPE:
pressurising pressure equalisation, PR: pressurisation, tAD = tcycle/3; tPP = tPU = tcycle/9; tBD =
tDPE = tPPE = tPR= tcycle/18) ..................................................................................................... 167
Figure 4.22: Pressure profiles at the product end of a column over a cycle at the cyclic steady
state of a nine-column H2 PSA at PP/F = 0.3 (Run 14) ....................................................... 168
Figure 4.23: Step configurations of a twelve-column H2 PSA cycle (AD: adsorption, DPE:
depressurising pressure equalisation, PP: providing purge, BD: blowdown, PU: purge, PPE:
pressurising pressure equalisation, PR: pressurisation, tAD = tcycle/4; tPP = tPU = tcycle/6; tBD =
tDPE = tPPE = tPR= tcycle/24) ..................................................................................................... 169
Figure 4.24: Pressure profiles at the product end of a column over a cycle at the cyclic steady
state of a twelve-column H2 PSA at PP/F = 0.3 (Run 18) .................................................... 169
Figure 4.25: Step configurations of a sixteen-column H2 PSA cycle (AD: adsorption, DPE:
depressurising pressure equalisation, PP: providing purge, BD: blowdown, PU: purge, PPE:
pressurising pressure equalisation, PR: pressurisation, tAD = tcycle/4; tPP = tPU = 3tcycle/16; tBD
= tDPE = tPPE = tPR= tcycle/32) .................................................................................................. 171
Figure 4.26: Comparison of hydrogen purity and recovery at various H2 PSA systems with
the different number of columns and different step configurations ..................................... 173
XXV
Figure 4.27: Hydrogen molar fraction profiles along the column at the end of the adsorption
step in various H2 PSA cycles at around 99.99% H2 purity ................................................. 174
Figure 4.28: Hydrogen molar fraction profiles along the column at the end of the blowdown
step in various H2 PSA cycles at around 99.99% H2 purity ................................................. 175
Figure 5.1: Block flow diagram of an advanced IGCC plant for cogenerating power and
ultrapure hydrogen with pre-combustion capture ................................................................ 182
Figure 5.2: Overall mass balance around the industrial H2 PSA unit of the cogenerating
IGCC .................................................................................................................................... 183
Figure 5.3: Evolution of the pressure drops against one-column residence time for the
industrial H2 PSA simulations.............................................................................................. 186
Figure 5.4: Step configuration of the industrial four-column H2 PSA cycle at PP/F = 0.2 (See
Chapter 4 for configuration details) ..................................................................................... 187
Figure 5.5: Step configurations of the industrial six-column H2 PSA cycle with two-stage
pressure equalisation at PP/F = 0.3 (See Chapter 4 for configuration details) .................... 188
Figure 5.6: Step configurations of the industrial nine-column H2 PSA cycle at PP/F = 0.3
(See Chapter 4 for configuration details) ............................................................................. 188
Figure 5.7: Step configurations of the industrial twelve-column H2 PSA cycle at PP/F = 0.3
(See Chapter 4 for configuration details) ............................................................................. 189
Figure 5.8: Comparison of hydrogen purity against recovery for various industrial H2 PSA
systems with different numbers of columns and different step configurations .................... 192
Figure 5.9: Comparison of hydrogen purity against productivity for various industrial H2
PSA systems with different numbers of columns and different step configurations ........... 192
Figure 5.10: Weakly adsorbed impurities (nitrogen + argon) molar fraction profiles along a
common dimensionless axial coordinate at the end of adsorption step at CSS and at 99.99+%
H2 purity among various industrial H2 PSA configurations ................................................. 193
Figure 5.11: Economic analysis summary for the different PSA configurations expressed in
total installed cost ($ Millions) ............................................................................................ 198
Figure 5.12: LCOE calculation results for the three examined IGCC cases ........................ 203
Figure 5.13: Block flow diagram of an advanced IGCC plant with a recycle of H2 PSA tail
gas to water gas shift reactors .............................................................................................. 205
Figure 5.14: Variation of the hydrogen mole fraction percentage in the raw H2 feed with the
split ratio of the ‘tail gas recycle to shift reactors’ flow to total tail gas flow ...................... 205
Figure 5.15: Hydrogen molar fraction profile along the column at the end of adsorption step
and at CSS for the nine-column PSA system ....................................................................... 206
Figure 5.16: Block diagram of the Base case ....................................................................... 207

XXVI
Figure 5.17: Block diagram of the Case 1 with the H2 PSA tail gas recycle to the water gas
shift reactors ......................................................................................................................... 208
Figure 5.18: Block diagram of the Case 2 with the H2 PSA tail gas recycle to the Selexol unit
............................................................................................................................................. 209
Figure 5.19: Block diagram of the Case 3 with the H2 PSA tail gas recycle to the coal dryer
............................................................................................................................................. 210
Figure 5.20: Block diagram of the Case 4 with the H2 PSA tail gas recycle to the water gas
shift reactors and the coal dryer ........................................................................................... 211
Figure 5.21: Block diagram of the hydrogen plant (HP). Red arrows define the improved
cases of Table 5.13 with different ways to recycle the H2 PSA tail gas to the water gas shift
reactor, the coal dryer and the CO2 regenerator ................................................................... 215

1
Chapter 1: General introduction
Strong dependency on coal, crude oil and natural gas, as well as the associated
costs and supply chain risks, increase the need for efficient utilisation of existing
non-renewable energy sources. The rise in concentration of different pollutants in the
atmosphere, especially greenhouse gases, has alerted the international community to
evidence of possible climate change and has spurred on research to reduce
anthropogenic carbon dioxide (CO2) emissions.
Utilising more renewable sources and reducing the dependency on fossil fuels
for energy production will ultimately lead to decarbonised and sustainable societies.
However, renewable energy must be complemented by fossil fuel energy in the near
future because its availability varies around the world and their production rates,
varying depending on the natural environment, often give rise to supply and demand
mismatches and their production costs are still more expensive than those of fossil
fuel energies. Therefore, short-term measures, e.g. carbon capture and storage (CCS),
must be taken to prevent the CO2 concentration in the air from increasing while fossil
fuels still take the position of major energy source.
This chapter introduces a brief discussion about fossil fuels, global warming
and CO2 emissions as well as the role of carbon capture and storage in the future
low-carbonised energy matrix. The following sub-sections are devoted to the
description of carbon capture systems and technologies, and the importance of
hydrogen as both a sought target and an appropriate environmental solution.
Subsequently, the motives, aims and outline of this thesis are presented and
discussed.
1.1 Fossil fuels and global warming
Among fossil fuels, coal has long been considered the most conventional
energy source for power generation due to its abundance – there is supply for more
than 2,000 years at current consumption rates – and its relatively wide geographic
distribution (Emun et al., 2010). By contrast, the CIA World Factbook (2010)
estimated that oil and natural gas will run out in 2050 and 2060, respectively. The
use of coal increased rapidly, mainly due to the industrial revolution, and has

2
continued to grow ever since, with only a few occasional temporary decreases. Coal
was the dominant fuel during the 19th
century and the first half of the 20th
century
(Encyclopaedia of Energy, 2004). The development that has occurred during the
years in all societies is directly linked to the growth of the coal industry.
Technological advancements closely associated with the use of coal have clearly
influenced the modern definition of a developed society. Globally, coal is currently
the dominant fuel in the power sector, accounting for 38% of electricity generated in
2000, with hydropower accounting for 17.5%, natural gas for 17.3%, nuclear for
16.8%, oil for 9% and non-hydro renewables for 1.6% (IPCC, 2005). The usage of
coal as a primary fuel is expected to grow between 2010 and 2030 and the worldwide
capacity of coal-fuelled power plants is expected to increase as well (Deb-Mondol et
al., 2009). Moreover, according to the IPCC report (2005), coal is projected to
remain the dominant fuel for power generation in 2020 (about 36%). Figure 1.1
exhibits the overall world energy consumption by fuel type during the years 1990–
2040 expressed in quadrillions of Btu.
Figure 1.1: World energy consumption by fuel type during the years 1990–2040
(quadrillion [1015
] Btu) (WEO/EIA, 2013)
Nevertheless, burning coal and other fossil fuels leads to greenhouse gas
emissions. Greenhouse gases (often abbreviated to GHG) are gaseous constituents of
the atmosphere, both natural and anthropogenic, that absorb and emit radiation

3
within the thermal infrared range produced by solar warming of the Earth’s surface.
This property causes the greenhouse effect (IPCC, 2008). Water vapour (H2O),
carbon dioxide (CO2), nitrous oxide (N2O), methane (CH4) and ozone (O3) are the
primary greenhouse gases in the Earth’s atmosphere. Moreover, there are a number
of entirely man-made greenhouse gases in the atmosphere, such as the halocarbons
and other chlorine- and bromine-containing substances. Greenhouse gases greatly
affect the temperature of the Earth; without them, the Earth’s surface temperature
would be approximately -18 ºC and under this condition most life as we know it
would not be possible (Jacob, 1999). Since the Industrial Revolution began around
1750, the burning of fossil fuels and extensive clearing of native forests has
contributed to a 43% increase in the atmospheric concentration of carbon dioxide,
from 280 to 400 parts per million (ppm) in 2014 in the northern hemisphere
(www.natureworldnews.com). Under ongoing greenhouse gas emissions, Earth
System Models projected that the Earth’s surface temperature would exceed
historical analogues as early as 2047, affecting most ecosystems on Earth and the
livelihoods of over 3 billion people worldwide (Mora et al., 2013). In addition, the
International Panel on Climate Change (IPCC, 2007) as well as Mastandrea and
Sneider (2005) have estimated that an increase of 2 °C in the global temperature
would be extremely dangerous for the planet. Within this situation, there exists a
concrete and substantial need to interrupt the trend of atmospheric change.
1.2 Carbon dioxide global emissions and the need for CCS
Carbon dioxide continued an upward trend in the early years of the 21st
century. Fossil fuels are the dominant form of energy utilised in the world (86%),
and account for about 75% of current anthropogenic CO2 emissions (IPCC, 2005).
The main sectors that contribute to energy consumption and CO2 emissions are
illustrated in Figures 1.2 and 1.3. Within the industrial sector, it is noteworthy that
electricity production is responsible for approximately 30% of global CO2 emissions
(Chiesa et al., 2005). Regarding world energy source consumption and future
predictions, several scenarios have been developed by different institutions based on
different perspectives and techniques (Coates, 2002; Schiffer, 2008). Globally, the
electricity and heat generation sectors rely heavily on coal. By 2035, the World

4
Energy Outlook (2013) projects that the demand for electricity will be more than
70% higher than the current demand (WEO, 2013). Therefore, the future
development of CO2 emissions intensity of this sector would depend strongly on the
fuels used to generate electricity and on the share of fossil fuel plants equipped with
CCS. This would be possible only if policy makers agreed with this direction.
Figure 1.2: World primary energy use by sector, 1971–2001 (IEA, 2003)
Figure 1.3: World CO2 emissions from fossil fuel use by sector, 1971–2001 (IEA, 2003)
From a more local point of view, the UK (and similarly the EU) has set in its
2008 Climate Change Act a target to reduce its GHG emissions to 80% of the 1990
levels by 2050, achieving the allowed emissions of 150 Mt CO2e (CO2 equivalent)

5
per year. However, the figure also includes GHG emissions that are hard to reduce
further, such as international aviation and shipping, and non-CO2 emissions, both of
which amount to 90 Mt CO2e. Therefore, the net CO2 emissions to be allowed in
2050 will be only 60 Mt CO2e (Committee on Climate Change, 2011). To meet the
target, it is essential to decarbonise all the industries, including refineries as well as
power stations. Usually, the emission sources to be considered include all large
stationary sources (>0.1 Mt CO2e yr-1
). This threshold is selected because the sources
emitting less than 0.1 Mt CO2e yr-1
account for less than 1% of the emissions from all
the stationary sources under consideration (IPCC, 2005). Eight refineries in the UK
are currently emitting 14.9 Mt CO2e, which accounts for around 3% of the total CO2
emissions in the UK in 2009 (DECC, 2009). The INEOS refining plant in
Grangemouth, for example, emits around 2.2 Mt CO2e per annum, which is
equivalent to 4% of total CO2 emissions in Scotland (SEPA, 2008). The Committee
on Climate Change (CCC) estimated that there will be a chance to curtail around 3.5
Mt CO2e out of 14.9 Mt CO2e from refineries in 2030 by improving their energy
efficiency. The CCC also foresaw that, beyond this target of abatement, a further
reduction would be possible by deploying carbon capture units on H2 plants and
replacing combustion fuels with carbon-neutral biomass (Committee on Climate
Change, 2011). The petroleum refining industry is the nation’s second-highest
industrial consumer of energy.
Globally, the petroleum refining industry is a significant source of GHG
emissions because nearly all of the energy consumed is fossil fuel for combustion. In
addition to the combustion-related sources (e.g., process heaters and boilers), there
are certain processes, such as fluid catalytic cracking units (FCCU), hydrogen
production units and sulfur recovery plants, that have significant process emissions
of carbon dioxide. Methane emissions from a typical petroleum refinery arise from
process equipment leaks, crude oil storage tanks, asphalt blowing and delayed coking
units. System blowdown and flaring of waste gas also contribute to the overall CO2
and CH4 emissions at the refinery. Figure 1.4 presents the breakdown of onsite GHG
emissions by source. As seen in Figure 1.4, combustion sources, direct process
emissions and flaring account for 99% of the onsite GHG emissions on a CO2e basis
(EPA, 2008).

6
Figure 1.4: Relative importance of refinery greenhouse gas emission sources evaluated
on CO2e basis (EPA, 2008)
1.3 Carbon capture systems
Capturing CO2 typically involves separating it from a gas stream. Suitable
techniques were developed more than 80 years ago in connection with the production
of town gas; these involve scrubbing the gas stream with a chemical solvent
(Bottoms, 1931). This kind of technique is widely used today for separating CO2 and
other acid gases from natural gas streams. Horn and Steinberg (1982) and Hendriks
et al. (1989) were among the firsts to discuss the application of this type of
technology to carbon capture from power plants for the purpose of mitigation of
climate change. The main application of CO2 capture is likely to be at large point
sources, as discussed in the previous sub-section. Capturing CO2 directly from small
and mobile sources in the transportation and residential and commercial building
sectors is expected to be more difficult and expensive than from large point sources.
The possibility of CO2 capture from ambient air (Lackner, 2003) is still at an early
stage of research because the CO2 concentration in ambient air is around 400 ppm, a
factor of hundreds lower than those in flue gases. There are four basic systems for
capturing CO2 from the use of fossil fuels and/or biomass:
Post-combustion capture

7
Pre-combustion capture
Oxy-fuel combustion capture
Capture from industrial process streams
These systems are shown in schematic form in Figure 1.5.
Figure 1.5: Overview of carbon capture systems (IPCC, 2005)
1.3.1 Post-combustion carbon capture
The capture of CO2 from flue gases produced by combustion of carbonaceous
fuels, such as fossil fuels and biomass with air, is referred to as post-combustion
capture. Instead of being discharged directly to the atmosphere, a flue gas is passed
through a post-combustion capture unit, which separates most of the CO2 out of the
flue gas usually by means of its contact with chemical solvents represented primarily
by monoethanolamine (MEA). Other techniques are also being considered but these
are not at such an advanced stage of development. The CO2 captured is compressed
for its subsequent use in Enhanced Oil Recovery (EOR) or CO2 storage, and the
remaining flue gas is discharged to the atmosphere. Several modifications to the
amine capture process have been proposed over the years. Ahn and co-workers
recently evaluated various amine process configurations reported in papers and

8
patents and quantified how much energy it could save in comparison to the
conventional scheme (Ahn et al., 2013).
1.3.2 Pre-combustion carbon capture
Pre-combustion capture involves reacting fuel with oxygen or air and steam to
produce ‘synthesis gas (syngas)’ or ‘fuel gas’ composed mainly of carbon monoxide
and hydrogen. The carbon monoxide reacts with steam in a catalytic reactor, a so-
called shift reactor, to give CO2 and more hydrogen. CO2 is then separated by a
physical or chemical absorption process, resulting in a hydrogen-rich fuel that can be
used in many applications, such as boilers, furnaces, gas turbines, engines and fuel
cells. These systems are considered to be strategically important despite the fact that
integrated gasification combined cycle (IGCC) power plants represent only 0.1% of
the total installed capacity worldwide (WEO, 2004). These systems in fact have
higher net plant efficiency (38–41% HHV) than PC-boiler power plant (37–39%
HHV) and this difference increases by up to 5–7 % when integrated with carbon
capture units (DOE, 2007). Moreover, compared to PC power plants, IGCCs also
produce smaller volumes of solid wastes (Shilling and Lee, 2003), use 30–60% less
water and provide greater fuel flexibility (Ratafia-Brown et al., 2002).
1.3.3 Oxy-fuel combustion carbon capture
In oxy-fuel combustion, nearly pure oxygen is used for combustion instead of
air, resulting in a flue gas that is composed of mainly CO2 and H2O. If the fuel is
burnt in pure oxygen, the flame temperature is excessively high, but CO2 and/or
H2O-rich flue gas can be recycled through the combustor to moderate this effect
(Takami et al., 2009). Oxygen is usually produced conventionally by low
temperature (cryogenic) air separation unit and several novel techniques to supply
oxygen to the fuel are being developed, such as ion transport membranes (ITM),
chemical looping combustion (CLC) and chemical looping oxygen uncoupling
(CLOU). For a new-build pulverised coal fired power boiler using a supercritical
steam cycle, Dillon et al. (2005) estimated that the overall thermal efficiency on a
lower heating value basis is reduced from 44.2% to 35.4% and the net power output

9
is reduced from 677 MWe to 532 MWe. Prior to the CO2 compression train, the flue
gas leaving the boiler is passed through a gas cooler and separator for water removal.
1.3.4 Capture from industrial process streams
Carbon dioxide has been captured from industrial process streams for 80 years
(Kohl and Nielsen, 1997), although most of the CO2 that is captured is vented to the
atmosphere because there is no incentive or requirement to store it. Current examples
of CO2 capture from process streams are purification of natural gas and production of
hydrogen-containing synthesis gas for the manufacture of ammonia, alcohols and
synthetic liquid fuels. Most of the techniques being employed for CO2 capture in the
above-mentioned examples are similar to those used in pre-combustion capture. On
the other hand, significant amounts of CO2 are being produced by operating refining
and petrochemical plants, cement plants, iron and steel plants, and fermentation
processes for food and drink production. The CO2 generated from these sources
could be captured using techniques that are common to post-combustion capture or
oxy-fuel combustion capture.
1.4 Carbon capture technologies
Carbon capture systems use many of the known technologies for gas
separation, which are integrated into the basic systems for CO2 capture. A summary
of these separation methods is given in Figure 1.6. The CO2 capture systems shown
in Figure 1.5 can be cross-referenced with the different separation technologies of
Figure 1.6, resulting in a capture toolbox. Table 1.1 gives an overview of both
current and emerging technologies in this toolbox. In the following sections, a more
detailed description of all these technological options will be given, with more
emphasis on the most developed technologies for which the CO2 capture cost can be
estimated more reliably. These leading commercial options are shown in bold in
Table 1.1. All the diverse range of emerging options are aimed at more efficient and
lower-cost CO2 capture systems compared with the leading options.

10
Figure 1.6: General schemes of the main processes relevant for CO2 capture (IPCC,
2005)
Table 1.1: Carbon capture cross-referenced toolbox between systems and technologies
(IPCC, 2005)
1.4.1 Chemical absorption
Absorption processes based on chemical solvents are currently the preferred
option for post-combustion CO2 capture (Hendriks, 1994; Riemer and Ormerod,
1995) because of their high capture efficiency and selectivity as well as their mature
commercial stage of operation. Absorption processes in post-combustion capture
make use of the reversible nature of the chemical reaction of an aqueous alkaline

11
solvent, usually an amine, with an acid or sour gas. The process flow diagram of a
commercial absorption system is presented in Figure 1.7.
Figure 1.7: Process flow diagram for CO2 recovery from flue gas by chemical
absorption (IPCC, 2005)
After cooling the flue gas, it is brought into contact with the solvent in the
absorber. A blower is required to overcome the pressure drop through the absorber.
At absorber temperatures typically between 40 and 60 ºC, CO2 is bound by the
chemical solvent in the absorber. The flue gas then undergoes a water wash to
balance water in the system and to remove any solvent droplets or solvent vapour
carried over, and then it leaves the absorber. It is possible to reduce the CO2
concentration in the exit gas down to very low values as a result of the chemical
reaction in the solvent, but lowering exit concentrations tends to increase the height
of the absorption vessel. The ‘rich’ solvent, which contains the chemically bound
CO2, is then pumped to the top of a stripper (or regeneration vessel) via a heat
exchanger. The regeneration of the chemical solvent is carried out in the stripper at
elevated temperatures (100–130 ºC) and pressures ranging between 1.1–1.5 bar
(IPCC, 2005). Heat is supplied to the reboiler to maintain the regeneration
conditions. This leads to a thermal energy penalty as a result of heating up the

12
solvent, providing the required desorption heat for removing the chemically bound
CO2 and for steam production, which acts as a stripping gas. Steam is recovered in
the condenser and fed back to the stripper, whereas the CO2 product gas leaves the
stripper. The ‘lean’ solvent, containing far less CO2, is then pumped back to the
absorber via the lean-rich heat exchanger and a cooler to bring it down to the
absorber temperature level.
The key parameters determining the technical and economic operation of a
CO2 absorption system are the flue gas flow rate, CO2 content in flue gas, CO2
removal target, solvent flow rate, energy requirement and cooling requirement. The
main energy consumption of the process is due to the reboiler duty of the stripper
that, at a carbon capture rate of 90%, is around 3.5 MJth/kg of captured CO2 (DOE,
2007). There are absorption processes involving different solvents that are
commercially available for CO2 capture in post-combustion systems (Barchas and
Davis, 1992; Sander and Mariz, 1992; Chapel et al., 1999; Mimura et al., 1999).
Integration of the absorption process with an existing power plant will require
modifications of the low-pressure part of the steam cycle as a sizeable fraction of the
steam will be extracted for the reboiler duty and hence will not be available to
produce power (Nsakala et al., 2001; Mimura et al., 1997).
Among the emerging technologies for chemical absorption, various novel
solvents are being investigated with the objective of achieving reduced energy
consumption for solvent regeneration (Chakma, 1995; Mimura et al., 1999; Zheng et
al., 2003; Cullinane and Rochelle, 2003). Besides novel solvents, research is also
being carried out to improve upon the existing practices and packing types
(Aroonwilas et al., 2003). Novel process designs are also becoming available (Leites
et al., 2003; Cousins et al., 2001; Ahn et al., 2013). Ahn et al. (2013) also pointed out
that simultaneous application of more than one process improvement strategy to the
amine process configuration could achieve further reduction in reboiler duty.
Chemical solvents are also used to remove CO2 from syngas at partial
pressures below about 1.5 MPa (Astarita et al., 1983), which are similar to those used
for post-combustion capture. The solvent removes CO2 from the shifted syngas by
means of a chemical reaction, which can be reversed by pressure reduction and
heating. The tertiary amine methyldiethanolamine (MDEA) is widely used in modern

13
industrial processes due to the high CO2 loading possible and the low regenerator
heating load relative to other solvents. Hot potassium carbonate, of which the most
common commercial version is known as Benfield, had been used for CO2 removal
in most hydrogen plants until about 15 years ago. Table 1.2 lists the common
solvents used for the removal of CO2 from natural gas or shifted syngas in pre-
combustion capture processes.
Table 1.2: Common solvents used in pre-combustion capture processes (IPCC, 2005)
1.4.2 Physical absorption
There are over 30 acid gas removal processes based on physical absorption in
common commercial use throughout the oil, chemical and natural gas industries
(Kohl and Nielsen, 1997; DOE, 2007). Physical solvent (or absorption) processes are
mostly applicable to gas streams that have a high CO2 partial pressure and/or a high
total pressure. They are often used to remove the CO2 from the mixed gas stream of
CO2 and H2 that is usually produced by partial oxidation of coal and heavy
hydrocarbons followed by shift reaction. The leading physical solvent processes are
also shown in Table 1.2. The regeneration of solvent is carried out by a release of
pressure at which CO2 evolves from the solvent in one or more stages. If a deeper
regeneration is required, the solvent would be regenerated by heat. The process has
low energy consumption as only the energy for pressurising the solvent (liquid
pumping) is required. From Case 6 of the DOE report (2007), for example, the
specific energy consumption associated with the CO2 capture and compression
process of a pre-combustion IGCC is evaluated at 0.35 MJe/kg against a typical value
of 1.38 MJe/kg related to a post-combustion process using MEA (Ahn et al., 2013).

14
The use of high-sulfur fossil fuels in a pre-combustion capture process results
in syngas with H2S. Acid gas components must be removed. If transport and storage
of mixed CO2 and H2S are possible then both components can be removed together.
Sulfinol was developed to achieve significantly higher solubilities of acidic
components compared to amine solvents, without added problems of excessive
corrosion, foaming or solution degradation (IPCC, 2005). Sulfinol is a mixture of
diisopropanolamine (30–45%) or methyl diethanolamine (MDEA), sulfolane
(tetrahydrothiophene dioxide) (40–60%) and water (5–15%). If pure CO2 is required,
then a selective process is necessary using physical solvents – often Rectisol or
Selexol. The H2S must be separated at a sufficiently high concentration (generally
>30%) to be treated in a sulfur recovery plant.
1.4.3 Adsorption
In the adsorption process for flue gas CO2 recovery, molecular sieves or
activated carbons are used for adsorbing CO2. Desorbing CO2 is then done by
decreasing the pressure in a pressure swing adsorption operation (PSA) or increasing
the temperature in a temperature swing adsorption operation (TSA). Most
applications are associated with PSA (Ishibashi et al., 1999; Yokoyama, 2003). Much
less attention has been paid to CO2 removal via temperature swing adsorption
because this technique would require longer cycle times than a PSA. For bulk
separations at large scales, it is also essential to limit the length of the unused bed
and therefore opt for faster cycle times.
Although several authors have tried to apply the PSA technology in the field
of carbon capture, especially for post-combustion (Kikkinides et al., 1993; Liu et al.,
2011; Wang et al., 2012, Ko et al., 2003), it has not yet reached a commercial stage
for CO2 recovery from flue gases. In these works, different process conditions as
well as the use of multi-column systems were analysed with the intention of reducing
the energy consumption in order to accomplish the typical carbon capture targets of
90% CO2 recovery and >95% CO2 purity. Specific energy consumptions are in the
range of 0.7–1.5 MJe/kg of captured CO2 making this separation process a good
potential alternative to the amine process. The development of a new generation of

15
materials that would efficiently adsorb CO2 will undoubtedly enhance the
competitiveness of adsorptive separation in a flue gas application.
PSA cycles may also be applied to pre-combustion capture: PSA is the system
of choice for the purification of syngas, where high purity H2 is required. However,
in one single stage of separation, it does not selectively separate CO2 from the other
waste gases so that for an SMR application the CO2 concentration in the waste gas
would be 40–50% and require further upgrading to produce pure CO2 for storage.
Simultaneous H2 and CO2 separation is possible by using a particular multibed PSA
system capable to co-produce high purity H2 and CO2, such as the Air Products
Gemini-9 Process (Sircar, 1979).
1.4.4 Membranes
Membrane processes are used commercially for CO2 removal from natural gas
at high pressure and at high CO2 concentration. In flue gases, the low CO2 partial
pressure difference provides a low driving force for gas separation. The removal of
carbon dioxide using commercially available polymeric gas separation membranes
results in higher energy penalties on the power generation efficiency compared to a
standard chemical absorption process (Herzog et al., 1991; Van der Sluijs et al.,
1992; Feron, 1994). Improvements can be made if more selective membranes
become available, such as facilitated membranes, described below. The membrane
option currently receiving the most attention is a hybrid membrane–absorbent (or
solvent) system. These systems are being developed for flue gas CO2 recovery
(Feron, 1994). Membrane/solvent systems employ membranes to provide a very high
surface area to volume ratio for mass exchange between a gas stream and a solvent
resulting in a very compact system. This results in a membrane contactor system in
which the membrane forms a gas-permeable barrier between a liquid and a gaseous
phase. In general, the membrane is not involved in the separation process. In the case
of porous membranes, gaseous components diffuse through the pores and are
absorbed by the liquid; with non-porous membranes, they dissolve in the membrane
and diffuse through the membrane.
Several membranes can be configured in a multi-stage system with a different
flow pattern in order to meet the carbon capture targets and minimise the energy

16
consumption. It is reported in the literature that the associated energy consumption
would be around 2.1 MJe/kg of captured CO2 (Bocciardo et al., 2013).
1.4.5 Chemical looping
The chemical looping technology is based on the splitting of the combustion of
a hydrocarbon or carbonaceous fuel into separate oxidation and reduction reactions
by introducing a suitable metal oxide as an oxygen carrier to circulate between two
reactors. Unlike the oxy-fuel process technology, there is no need for air separation.
The reaction between fuel and oxygen occurs in a second reactor by the release of
oxygen from the metal oxide in a reducing atmosphere caused by the presence of a
hydrocarbon or carbonaceous fuel. The recycle rate of the solid material between the
two reactors and the average solid residence time in each reactor control the heat
balance and the temperature levels in each reactor. The fact that the combustion takes
place in two reactors compared to conventional combustion in a single stage
indicates that the CO2 is not being diluted with nitrogen gas, but being almost pure
after separation from water, without requiring any extra energy demand and costly
external equipment for CO2 separation (IPCC, 2007). Pioneering works in this field
have been reported by Richter and Knoche (1983) and Ishida and Jin (1994).
The oxides of some transition state metals, such as Fe, Ni, Cu and Mn, can be
used as oxidising agents (Zafar et al., 2005). The temperature in the reactor may be
in the range of 800 °C–1200 °C; NOx formation at these temperatures is low and the
fuel conversion in the reduction reactor may not be complete (Cho et al., 2002).
Brandvoll and Bolland (2004) studied the use of natural gas as a fuel in a chemical
looping configuration incorporated in a combined cycle plant and estimated the fuel-
to-electricity conversion efficiency to be in the range of 45–50%.
1.4.6 Cryogenic distillation
Cryogenic separation is another method that can be used to separate CO2 from
other components of a gas stream. While cryogenic separation has long been applied
to commercial air separation, it has also been considered as an option to achieve CO2
capture. The gas stream is transformed into liquid after a series of compressions and
expansions, and the components of interest are separated by distillation. This system

17
remains the preferred technology in the food and beverage industries where a very
high CO2 purity (>99.9%) is required (ISBT, 2006).
1.5 Carbon dioxide capture costs
Published estimates for CO2 capture costs vary widely, mainly as a result of
different assumptions regarding technical factors related to plant design and
operation (e.g., plant size, net efficiency, fuel properties and load factor), as well as
key economic and financial factors, such as fuel cost, interest rates and plant lifetime.
A number of recent papers have addressed this issue and identified the principal
sources of cost differences and variability (Herzog, 1999; Simbeck, 1999; Rubin and
Rao, 2003).
Figure 1.8: Levelised cost of electricity (LCOE) of PC and IGCC power plants
(Hoffmann and Szlo, 2011)
For example, Hoffman and Szklo (2011) reviewed the studies performed for
PC boiler and IGCC power plants in terms of the costs associated with them. They
reported two criteria to evaluate the plants studied: the levelised cost of electricity
(LCOE) and the cost of CO2 avoided. It is obvious that, as shown in Figures 1.8 and
1.9, most studies have demonstrated that IGCC power plants, regardless of the years

18
performed and the assumptions that the studies were based on, would be more
economical than the PC boiler power plants when CO2 capture units are integrated.
Figure 1.9: Cost of CO2 avoided of PC and IGCC power plants (Hoffmann and Szlo,
2011)
1.6 Global hydrogen demand
Hydrogen is the most abundant element in the universe. It cannot be destroyed,
unlike hydrocarbons, and it simply changes state from water to hydrogen and back to
water during consumption. When released, it quickly rises to the upper atmosphere
and dissipates, leaving virtually no hydrogen gas on the Earth’s surface. Because
hydrogen gas must be manufactured from feedstocks that contain hydrogen
compounds, it is considered to be an energy carrier, like electricity, rather than a
primary energy resource (DOE, 2008). Approximately 10–11 million metric tonnes
of hydrogen are produced in the US each year (DOE, 2008). For reference, this is
enough to power 20–30 million cars or about 5–8 million homes. Globally, around
50 million tonnes (equal to about 475 billion cubic meters) of hydrogen are produced
each year and the production is expected to grow 3.5% annually through to 2018
(Freedonia Group, Inc., 2014). Over the years, hydrogen demand has regularly
increased in every part of the world, as reported in Table 1.3.

19
Table 1.3: World hydrogen demand over years expressed in billion cubic meters
(Freedonia Group, Inc., 2014)
The majority of hydrogen is produced using fossil fuel feedstocks, as
extensively depicted in Figure 1.10. Around half is used to produce ammonia and
around a quarter is used for hydroprocessing in petroleum refining, with the balance
used to make methanol and other industrial applications, including coal-to-liquids
(Figure 1.10).
Figure 1.10: World hydrogen production and use (Evers, 2008)
A growing use of hydrogen is supporting emerging applications based on fuel
cell technology along with other ways to use hydrogen for electricity production or
energy storage. More than 50 types and sizes of commercial fuel cells are being sold
and the value of fuel cell shipments reached $500 million in 2009 (DOE, 2010).

20
1.7 Methods for producing hydrogen
Hydrogen can be produced from a variety of feedstocks. These include fossil
resources, such as natural gas and coal, as well as renewable resources, such as
biomass and water with input from renewable energy sources (e.g., sunlight, wind,
wave or hydro power). A variety of process technologies can be used, including
chemical, biological, electrolytic, photolytic and thermochemical. Each technology is
in a different stage of development and each offers unique opportunities, benefits and
challenges. Local availability of feedstock, the maturity of the technology, market
applications and demand, policy issues and costs will all influence the choice and
timing of the various options for hydrogen production (EIA, 2006). Several
technologies are already available in the marketplace for the industrial production of
hydrogen. The first commercial technology, dating from the late 1920s, was the
electrolysis of water to produce pure hydrogen. In the 1960s, the industrial
production of hydrogen shifted slowly towards a fossil-based feedstock, which is the
main source for hydrogen production today. An overview of the various feedstocks
and process technologies is presented in Figure 1.11. A detailed review of all the
hydrogen production methods can be found in the EIA’s report (2006).
The natural gas or steam reforming process involves pre-heating, purifying and
reacting the gas with steam in the presence of an active nickel catalyst to produce
hydrogen and carbon monoxide. The carbon monoxide is then reacted further with
water in the ‘shift’ reaction to produce additional hydrogen. The heat is often
supplied from the combustion of some of the methane feed gas. The process typically
occurs at temperatures of 700 to 850 °C and pressures of 3 to 25 bar. Process
efficiencies range typically between 65–75%. Other ways of producing hydrogen
from natural gas are the partial oxidation and autothermal reforming processes.
Hydrogen can be produced from coal through a variety of gasification
processes (e.g. fixed bed, fluidised bed or entrained flow). In practice, high-
temperature entrained flow processes are favoured to maximise carbon conversion to
gas, thus avoiding the formation of significant amounts of char, tars and phenols. A
coal gasifier converts pulverised coal into hydrogen and carbon monoxide when
steam and oxygen are added in a cycle known as the IGCC. Partial oxidisers produce

21
hydrogen from heavy hydrocarbons (e.g., oil), typically at process efficiencies of
about 50%.
Figure 1.11: Hydrogen sources and production processes (IGEM, 2012)
Water electrolysis is the process whereby water is split into hydrogen and
oxygen through the application of electrical energy. The total energy that is needed
for water electrolysis increases slightly with temperature, while the required
electrical energy decreases. Ideally, 39 kWh of electricity and 8.9 litres of water are
required to produce 1 kg of hydrogen at 25 °C and 1 atm. Typical commercial
electrolyser system efficiencies are between 56–73%, which corresponds to 53.4–
70.1 kWh/kg (some new technologies have been shown to achieve up to 80%
efficiency on a gross calorific value [GCV] basis).
Pyrolysis, photo-biological and thermo-chemical processes are the less well-
known hydrogen production routes. Gasification and pyrolysis are considered the
most promising medium-term technologies for the commercialisation of H2

22
production from biomass. Biomass pyrolysis, similar to the gasification process,
produces a variety of gases at temperatures in excess of 800 °C including hydrogen,
methane, carbon monoxide and carbon dioxide.
Photo-biological production of hydrogen is the process whereby photosynthetic
microbes undergo metabolic activities using light energy to produce hydrogen from
water. Examples of microbes with such metabolic capabilities include green algae
and cyanobacteria. Long-term basic and applied research is needed in this area, but if
successful, a long-term solution for renewable hydrogen production will result.
1.8 Carbon capture from hydrogen plants: Research
perspective
A lot of research has been carried out both by academia and companies in order
to investigate the feasibility and challenges associated with the CO2 capture process
applied to H2 plants. The following Table 1.4 summarises all these works, focusing
on type of hydrogen production plant, type of carbon capture unit and comments
related to key research points.
Table 1.4: Summary of research works on carbon capture processes from hydrogen
plants
Reference Organisation
H2
production
method
CO2
capture
method
Comments
Soltani et
al., 2014 Academia SMR N/A
Detailed investigation and
comparison were carried out on the
effect of steam-to-carbon ratio on
CO2 capture criteria from various
locations in the SMR process, such as
the syngas stream, the PSA tail gas
and the furnace flue gas.
Muradov
and
Veziroglu,
2005
Academia Methane
pyrolysis Not required
Technological, environmental and
economic aspects of large-scale
production of hydrogen and carbon
by the catalytic dissociation of
natural gas were discussed in detail
with focus on a new “hydrogen-
carbon”-based scenario.

23
Ogden,
2002 Academia SMR MEA
A techno-economic model of a large-
scale fossil H2 system with CO2
capture demonstrated that H2
production, distribution and
refuelling are the major costs
contributing to the delivered cost of
H2, while CO2 capture added only
~10%.
Dufour et
al., 2009 Academia
Methane
pyrolysis Not required
Autocatalytic decomposition of
methane was found to be the most
environmentally friendly process for
hydrogen production (lowest impact
and CO2 emission) compared with
the SMR with and without CO2
capture and storage.
Tarun et
al., 2007 Academia SMR
MEA,
Membrane
Best operating conditions that
minimise the energy penalty for CO2
capture while maximising H2
production were determined. Both
membrane and MEA capture process
were found comparable in terms of
energy penalty.
Cormos,
2014 Academia
Bioethanol
reforming
MDEA,
Syngas
chemical
loop,
Bioethanol
chemical
loop
Assessment of H2 production from
bioethanol at industrial scale was
performed comparing three carbon
capture designs: the results for
chemical looping processes showed
higher energy efficiencies than
MDEA (59–63% vs. 53–58%).
Mueller-
Langer et
al., 2007
Academia
SMR,
Coal gasif.,
Biomass
gasif.,
Electrolysis
MEA,
Selexol,
Not
required,
Not required
Different H2 production processes
involving different CO2 capture
methods were investigated
economically. Coal gasification will
be more competitive while biomass
gasification and electrolysis could
become relevant if technological
barriers are overcome.
Terrien et
al., 2014 Company SMR
Cryogenic
distillation,
Membrane
The new Air Liquid solution for
capturing CO2 from an SMR H2 plant
based on cryogenics was described in
detail. This could be a viable option
for EOR application and for massive
adoption of CCS as a CO2 mitigation
technique.
Lindsay et
al., 2009 Company
SMR,
ATR
MDEA,
Econamine
Several process designs for
production of H2 and simultaneous

24
FG plus capture of CO2 were examined. The
ATR/MDEA plant showed better
performances compared with
SMR/MDEA both in terms of
emissions cuts (81% vs. 74%) and
costs ($35/ton vs. $71/ton).
Molburg
and
Doctor,
2003
Company SMR MDEA
Detailed simulations were carried out
on the SMR process with heat
integration and MDEA capture
technology using Aspen Plus.
Sensitivity studies were addressed to
operating pressure, S/C ratio and
combustion air pre-heat.
Rostrup-
Nielsen
and
Rostrup-
Nielsen,
2002
Company SMR N/A
Steam methane reforming process
was described accurately in relation
to novel options such as the
membrane reforming and the
autothermal reforming: the latter
could become competitive at very
large-scale conversion.
Wu and
Kuo, 2015 Academia SMR
Oxy-
combustion
Traditional SMR process with oxy-
combustion capture was compared
with a novel design involving a CO2
reforming reactor between SMR and
WGS: this process was more efficient
from an energy utilisation viewpoint.
Montazer-
Rahmati
and
Binaee,
2010
Academia SMR DGA
An existing hydrogen plant with CO2
capture and a methanator was
simulated and optimised in terms of
maximisation of H2 product and
export steam flowrate. Sets of Pareto-
optimal operating conditions were
obtained.
Martinez
et al.,
2014
Academia SMR
Ca/Cu
Chemical
looping
It was demonstrated that the use of
more reactive reforming catalysts and
higher oxidation temperatures for Cu
improved the equivalent H2
efficiency of the Ca/Cu looping
process, resulting in 1.6 MJ/kg of
CO2 captured.
Ryden and
Lyngfelt,
2006
Academia SMR Chemical
looping
A new reactor was designed to
capture CO2 by chemical-looping
combustion from SMR H2 plant
while operating below 900 ºC. In
addition, this new process has
potential to achieve higher selectivity

25
towards H2 than conventional plant.
Chiesa et
al., 2008 Academia SMR
Chemical
looping
Intrinsic capture of CO2 from SMR
H2 plant was made possible by a
system consisting of three CL
reactors equipped with Fe oxides.
This process showed better
environmental results due to the
virtually complete CO2 removal.
1.9 Carbon capture from hydrogen plants: Industrial
perspective
In June 2010, the US Department of Energy (DOE) selected gas-specialty
company Air Products to receive American Recovery and Reinvestment Act
(ARRA) funding to design, construct and operate a system to capture CO2 from two
steam methane reformers located within the Valero refinery in Port Arthur, Texas.
The CO2 removal technology was retrofitted to the SMRs, which produce hydrogen
to assist in the manufacture of petrochemicals and the production of cleaner burning
transportation fuels by refinery customers on the Gulf Coast hydrogen pipeline
network. The DOE is providing a total of $284 million or approximately 66% of the
over $400 million project (Baade et al., 2012). The main objective of this CO2
capture project is to demonstrate an advanced technology that captures and
sequesters carbon dioxide emissions from large-scale industrial sources into
underground formations.
Figure 1.12 is a block flow diagram for the project that illustrates how the CO2
capture facility is integrated within the existing SMRs. The facility utilises a
proprietary design CO2 vacuum swing adsorption (VSA) system that is retrofitted to
each of the two existing SMR trains (PA-1 and PA-2). Each VSA unit is designed to
remove more than 90% of the CO2 contained in the reformer PSA feed gas with a
purity of >97%. Sweet syngas (CO2 removed) is returned from the CO2 VSA system
to feed the existing SMR hydrogen PSAs. CO2 produced from the VSA units is
compressed and dried in a single train located at PA-2. The CO2 is then delivered, via
a 12-mile connector pipeline, to Denbury's Green Pipeline, Texas. The CO2 will be
piped 100–150 km before injection for EOR in Denbury's onshore operations. The

26
CO2 will aid in recovering 1.6–3.1 million additional barrels of domestic oil
annually. In June 2014, Air Products announced that it had successfully captured
more than one million metric tons of CO2 at Port Arthur.
Figure 1.12: Block flow diagram of Port Arthur SMRs and integrated CO2 capture
facility (Baade et al., 2012)
1.10 The role of hydrogen in the future energy matrix
As discussed in the previous sub-sections, the production of hydrogen is both a
sought after target and an appropriate environmental solution. Ultrapure hydrogen is
commonly utilised as a feedstock in refineries as well as an energy carrier in fuel
cells (Mormilan and Veziroglu, 2005).
It is very likely that most refining complexes will face a significant deficiency
of their existing hydrogen production capacity. Hydrogen is needed for operating
their hydrotreating desulfurisation process, which removes mainly sulfur and other
impurities from raw petroleum products and hydrocracking units for upgrading low-
grade heavy residues to more valuable diesel and lube base oil. The need for H2 is
bound to increase due to the trends of: 1) more stringent sulfur and nitrogen
specifications in fuel oils; 2) increasing crack spread; and 3) the rapid change of
crude oil properties from ‘light and sweet’ to ‘heavy and sour’. Due to the
requirement of very high operational severity in both units for deep desulfurisation
and improved product quality, ultrapure hydrogen with a purity of >99.99 mol%

27
should be utilised for the hydroprocessing. Accordingly, most refineries are forced to
increase their hydrogen production capacities rapidly to cope with the increased H2
demand, but it is doubtful that, given the upcoming carbon emission regulation,
conventional steam methane reforming (SMR) H2 processes would still be the best
option to meet this demand.
A valid alternative to produce hydrogen is through coal gasification with CO2
capture. Relative to coal gasification with CO2 capture for power generation (IGCC),
there are few studies in the public domain on those for H2 production (NRC, 2004;
Parsons, 2002; Gray and Tomlinson, 2003; Chiesa et al., 2005; Kreutz et al., 2005).
With commercial technology, H2 can be produced via coal gasification and CO2
capture in a system similar to a coal IGCC plant with CO2 capture. While synthesis
gas can be produced by various routes, it is well-known that PSA is the only
economically feasible, commercialised separation process to produce ultrapure
hydrogen (99.99+ mol%) from a synthetic gas.
Recently, a novel process for cogenerating electricity and pure hydrogen from
coal gasification where a Polybed PSA unit was integrated with an IGCC was
investigated in detail (Luberti et al., 2014). Polybed PSA systems involve large
number of columns undergoing different cycle steps and complex process schedules
in order to exploit all the columns at the same time and to achieve crucial targets,
such as the maximisation of product recovery and bed productivity.
1.11 Objectives of the thesis
Since climate change is a grave challenge that the world is facing today and
coal is playing and will continue to play an important role in energy production
globally, the development of efficient CO2 capture technologies is urgently required
in order to effectively meet the targets set for the CO2 emission reduction. For
decarbonised power production, IGCC power plants can be an attractive option for
achieving this goal, since they have been reported to be more efficient and
economical than PC-fired boiler power plants. Physical absorption has been
attracting research interest for many decades as an effective technology, initially for
acid gas removal but also for the recovery of CO2 at a high purity for subsequent
CO2 storage or EOR. However, installing and running CO2 capture processes gives

28
rise to significant energy loss to the power plants. Therefore, it is necessary to
develop new and more efficient carbon capture process configurations to minimise
the energy penalty involved. The development of automated tools that realistically
represent the operation of an IGCC power plant in its entirety is essential to evaluate
quickly and accurately the performance of the power plant. At the same time, the
production of ultrapure hydrogen is an important and sought-after target to be
utilised in either refineries or as an energy carrier in fuel cells. IGCC power plants
can offer a clean and efficient way to cogenerate both hydrogen and electricity.
The aim of the thesis is to design a novel hydrogen PSA system integrated with
a pre-combustion IGCC plant and to evaluate its integrated efficiency. The main
objectives are:
Detailed simulation of a dry coal-fed IGCC process with pre-combustion
capture using a commercial steady-state simulator
Development of a numerical simulator for a dynamic hydrogen PSA unit for
process optimisation and scale-up
Process design of an advanced IGCC plant integrated with a H2 PSA unit for
co-producing electricity and hydrogen where more than 90% of carbon from
raw syngas can be captured using physical absorption
Optimisation of the cogenerating IGCC plant through process flow
modifications
Since there is the need to retrofit an H2 PSA unit to the IGCC plant, this work
will firstly investigate the overall IGCC process in order to rigorously obtain the info
on the pressure, temperature and composition of the stream that will become the feed
for the novel PSA system. This is due to the fact that H2 PSA performance is highly
affected by the CO conversion rate in the water gas shift reactors and the carbon
capture rate in the Selexol unit. Compared to a conventional H2 PSA unit applied to
the SMR process, better purification performances are expected in this novel PSA
because of the higher hydrogen partial pressure in the feed and the relatively lower
amount of impurities. In the retrofitted advanced IGCC plant, the H2-rich fuel gas
coming from the CO2 capture unit is split into two streams, one of which is fed to the

29
H2 PSA unit. The H2 PSA tail gas needs to be compressed up to the pressure of the
H2 fuel gas for feeding it to a high-pressure gas cycle for additional power
generation.
Numerical simulations will be carried out using multi-column systems in order
to meet the following specifications for hydrogen product:
H2 purity of 99.99+ mol%
Maximisation of H2 recovery so that H2 recovery is at least higher than that in
the Universal Oil Products (UOP) Polybed system applied to SMR (89%)
Minimisation of energy consumption for the operation of the H2 PSA tail gas
compressor
The last two objectives are intrinsically related because the higher the
hydrogen recovery is, the lower the off-gas flowrate to be recompressed will be.
Through the integration of the IGCC with H2 PSA it will be possible to optimise the
whole process. A detailed economic analysis of the H2 PSA unit will also be
presented and discussed.
Given such a cogenerating plant where several units are fully integrated,
another task of the present thesis relies on the improvement of the overall advanced
IGCC performance. By investigating modified process flow schemes having in
particular CO2 capture and H2 PSA units, it will be shown that it is possible to
increase the H2 yield and reduce the auxiliary power consumption at the carbon
capture unit, allowing a higher net plant efficiency within the IGCC.
In order to carry out these simulations a considerable number of commercial
and in-house software packages had to be employed. UniSim Design R400 steady
state simulator (Honeywell, 2011) was used for the simulation of the whole IGCC
plant including all the units with exception of the Claus plant. ProMax software
(BR&E, 2011) was considered for this particular unit because UniSim does not allow
to differentiate the various sulfur species. The dynamic simulations concerning the
lab-scale H2 PSA unit were performed with CySim in-house simulator (Friedrich et
al., 2013) developed within the carbon capture group at The University of Edinburgh.
Since CySim becomes unstable for high velocity regimes in the adsorption column,
the industrial H2 PSA unit simulations were carried out using a code in gPROMS

30
environment (PSE, 2010). Eventually, Origin 8.5 software (OriginLab, 2010) was
employed for the fitting of experimental isotherms while column and adsorbent
parameters were calculated utilising MATLAB (Mathworks, 2008).
1.12 Outline of the thesis
The present thesis is organised in six chapters, each with their own introduction
and bibliography. Chapter 1 represents a general introduction to the thesis concerned
with fossil fuels, global warming, CO2 emissions, and carbon capture options and
technologies, as well as the importance of ultrapure hydrogen in the future low-
decarbonised energy matrix. The motive and the aim of the whole thesis are also
revealed in detail.
Chapter 2 focuses on the modelling of integrated gasification combine cycles
(IGCCs) with pre-combustion carbon capture. Each section of the plant is thoroughly
described together with the simulation approach used for them. These sections
include: Shell gasifier, water gas shift reactors (WGSRs), air separation unit (ASU),
dual-stage Selexol unit, CO2 compression train, Claus plant, gas turbine (GT) and
heat recovery steam generation (HRSG). Simulation results are compared with the
DOE report (2007) data while energy penalties associated with auxiliary units as well
as plant efficiency are explained in detail.
Chapter 3 reports the fundamentals of adsorption and pressure swing
adsorption processes. All the equilibrium and kinetic mechanisms are explained in
depth as well as the mass, energy and momentum balances that govern the dynamic
behaviour of an adsorption column. Industrial applications using PSA technology are
also examined with particular emphasis on hydrogen purification applications.
Chapter 4 exhibits the design basis of a novel H2 PSA integrated with an IGCC
power plant. Numerical simulations are carried out in order to evaluate steady-state
performances of various PSA designs with different numbers of adsorption beds and
their associated step configurations. All these configurations are compared to each
other in terms of hydrogen recovery and bed productivity at the same ultrapure
hydrogen purity condition.
Chapter 5 describes how to integrate the H2 PSA with the IGCC plant for
cogenerating power and hydrogen from coal. A detailed economic analysis of the

31
entire cogenerating plant is reported with particular emphasis on the H2 PSA unit.
Innovative process configurations based on a recent patent application are also
presented in order to improve the overall plant performance.
Chapter 6 summarises the results and conclusions of the previous chapters and
proposes guidelines for future work.
References
Ahn H, Luberti M, Liu Z, Brandani S. Process configuration studies of the amine capture
process for coal-fired power plants. Int. J. Greenh. Gas. Con. 2013; 16: 29-40.
Aroonwilas A, Chakma A, Tontiwachwuthikul P, Veawab A. Mathematical modelling of
mass-transfer and hydrodynamics in CO2 absorbers packed with structured packings,
Chemical Engineering Science 2003; 58: 4037-4053.
Astarita G, Savage DW, Bisio A. Gas treating with chemical solvents. Chapter 9: Removal
of carbon dioxide. 1983; New York, USA.
Audus H, Kaarstad O, Kowal M. Decarbonisation of fossil fuels: Hydrogen as an energy
carrier. Proceedings of the 11th World Hydrogen Energy Conference 1996; Frankfurt,
Germany.
Baade W, Farnand S, Hutchinson R, Welch K. CO2 capture from SMRs: A demonstration
project. Hydrocarbon Processing 2012; Special report: 63-68.
Barchas R, Davis R. The Kerr-McGee / ABB Lummus crest technology for the recovery of
CO2 from stack gases. Energy Conversion and Management 1992; 33: 333-340.
Bocciardo D, Ferrrari MC, Brandani S. Modelling and multi-stage design of membrane
processes applied to carbon capture in coal-fired power plants. Energy Procedia 2013; 37:
932-940.
Bottoms RR. Organic bases for gas purification. Ind. Eng. Chem. 1931; 23: 501-504.
BR&E. ProMax, 2011.
Brandvoll O, Bolland O. Inherent CO2 capture using chemical looping combustion in a
natural gas fired power cycle. ASME Paper No. GT-2002-30129, ASME Journal of
Engineering for Gas Turbines and Power 2004; 126: 316-321.

32
Chakma A. An energy efficient mixed solvent for the separation of CO2. Energy Conversion
and Management 1995; 36: 427-430.
Chapel DG, Mariz CL, Ernest J. Recovery of CO2 from flue gases: commercial trends, paper
No. 340 at the Annual Meeting of the Canadian Society of Chemical Engineering 1999;
Saskatoon, Canada.
Chiesa P, Consonni S, Kreutz T, Williams R. Co-production of hydrogen, electricity and
CO2 from coal with commercially ready technology. Part A: Performance and emissions.
Hydrogen energy 2005; 30: 747-767.
Chiesa P, Lozza G, Malandrino A, Romano M, Piccolo V. Three-reactors chemical looping
process for hydrogen production. Int. J. of Hydrogen Energy 2008; 33: 2233–2245.
Cho P, Mattisson T, Lyngfelt A. Reactivity of iron oxide with methane in a laboratory
fluidised bed – application of chemical-looping combustion. 7th International Conference on
Circulating Fluidised Beds 2002; 599-606.
Central Intelligence Agency. The World Factbook; 2010.
Coates JF. Energy needs, choices, and possibilities scenarios to 2050: The global business
environment. Technological Forecasting and Social Change 2002; 69: 527-531.
Committee on Climate Change, Chapter 5: Reducing emissions from buildings and industry
through the 2020s; 2011.
Cormos CC. Renewable hydrogen production concepts from bioethanol reforming with
carbon capture. Int. J. of Hydrogen Energy 2014; 39: 5597-5606.
Cousins A, Wardhaugh LT, Feron PHM. A survey of process flow modifications for energy
efficient CO2 capture from flue gases using chemical absorption. Int. J. Greenh. Gas. Con.
2011; 5: 605-619.
Cullinane JT, Rochelle GT. Carbon dioxide absorption with aqueous potassium carbonate
promoted by piperazine, Greenhouse Gas Control Technologies 2003; Vol. II: 1603-1606.
Deb–Mondol J, Mcllven–Wright D, Rezvani S, Huang Y, Hewitt N. Techno-economic
evaluation of advanced IGCC lignite coal fuelled power plants with CO2 capture. Fuel 2009;
88: 2495-2506.
DECC. Final emissions estimates by fuel type and end-user sector; 2009.

33
Dillon, D J, Panesar R S, Wall A, Allam R J, White V, Gibbins J, Haines M R. Oxy-
combustion processes for CO2 capture from advanced supercritical PF and NGCC power
plant. Proceedings of 7th
International Conference on Greenhouse Gas Control Technologies.
2005; Volume I: 211-220.
DOE NETL. Cost and performance baseline for fossil energy plants; 2007.
DOE NETL. The impact of increased use of hydrogen on petroleum consumption and carbon
dioxide emissions; 2008.
DOE NETL. An integrated strategic plan for the research, development, and demonstration
of hydrogen and fuel cell technologies; 2010.
Dufour J, Serrano DP, Galvez JL, Moreno J, Garcia C. Life cycle assessment of processes
for hydrogen production. Environmental feasibility and reduction of greenhouse gases
emissions. Int. J. of Hydrogen Energy 2009; 34: 1370-1376.
EIA. Hydrogen production and storage – R&D priorities and gaps; 2006.
Emun F, Gadalla M, Majozi T, Boer D. Integrated gasification combined cycle (IGCC)
process simulation and optimization. Computers and Chemical Engineering 2010; 34: 331-
338.
Encyclopedia of Energy. 2004; Volumes 1-6.
EPA. Technical support document for the petroleum refining sector: proposed rule for
mandatory reporting of greenhouse gases; 2008.
Evers AA. Actual worldwide hydrogen production. Hannover FAIR Presentation; 2008.
Feron PHM. Membranes for carbon dioxide recovery from power plants. In Carbon Dioxide
Chemistry: Environmental Issues 1994; 236-249.
Friedrich D, Ferrari MC, Brandani S. Efficient simulation and acceleration of convergence
for a dual piston pressure swing adsorption system. Ind. Eng. Chem. Res. 2013; 52: 8897-
8905.
Freedonia Group, Inc. World hydrogen; 2014.
Gray D, Tomlinson G. Hydrogen from coal. Mitretek Technical Paper MTR-2003-13,
prepared for the National Energy Technology Laboratory, US DOE; 2003.

34
Hendriks CS. Carbon dioxide removal from coal-fired power plants, Dissertation, Utrecht
University 1994; Utrecht, The Netherlands.
Hendriks CS, Blok K, Turkenburg WC. The recovery of carbon dioxide from power plants.
Proceedings of the Symposium on Climate Change 1989; Utrecht, The Netherlands.
Herzog H, Golomb D, Zemba S. Feasibility, modeling and economics of sequestering power
plant CO2 emissions in the deep ocean. Environmental Progress 1991; 10: 64-74.
Herzog HJ. The economics of CO2 capture. Proceedings of the 4th International Conference
on Greenhouse Gas Control Technologies 1999; 101-106.
Hoffmann BS, Szklo A. Integrated gasification combined cycle and carbon capture: A risky
option to mitigate CO2 emissions of coal-fired power plants. Applied Energy 2011; 88:
3917-3929.
Honeywell. UniSim Design R400, 2011.
Horn FL, Steinberg M. Control of carbon dioxide emissions from a power plant (and use in
enhanced oil recovery). Fuel 1982; 61: 415-422.
Institution of Gas Engineers and Managers. Hydrogen – Untapped energy ?; 2012.
IPCC. Annex B: Glossary of terms. 2008.
IPCC. Couplings between changes in the climate system and biogeochemistry. 2007.
IPCC. Special report on carbon dioxide capture and storage. 2005.
International Society of Beverage Technologists (ISBT). Carbon dioxide quality guidelines
and analytical procedure bibliography; U.S. 2006.
Ishibashi M, Otake K, Kanamori S, Yasutake A. Study on CO2 removal technology from
flue gas of thermal power plant by physical adsorption method. Greenhouse Gas Control
Technologies 1999; 95-100.
Ishida M, Jin H. A New advanced power-generation system using chemical-looping.
Combustion Energy 1994; 19: 415-422.
Jacob D. Introduction to atmospheric chemistry. Princeton University Press 1999; Princeton,
USA.

35
Kikkinides ES, Yang RT, Cho SH. Concentration and recovery of CO2 from flue gas by
pressure swing adsorption. Ind. Eng. Chem. Res. 1993; 32: 2714-2720.
Ko D, Siriwardane R, Biegler LT. Optimization of a pressure swing adsorption process using
zeolite 13X for CO2 sequestration. Ind. Eng. Chem. Res. 2003; 42: 339-348.
Kohl AO, Nielsen RB. Gas purification, Gulf Publishing Co., 1997; Houston, USA.
Kreutz T, Williams R, Chiesa P, Consonni S. Coproduction of hydrogen, electricity and CO2
from coal with commercially ready technology. Part B: Economic analysis. Hydrogen
Energy 2005; 30: 769-784.
Lackner KS. Climate change: a guide to CO2 sequestration. Science 2003; 300: 1677-1678.
Leites IL, Sama DA, Lior N. The theory and practice of energy saving in the chemical
industry: some methods for reducing thermodynamic irreversibility in chemical technology
processes. Energy 2003; 28: 55-97.
Linsday I, Lowe C, Reddy S, Bhakta M, Balkenende S. Designing a climate friendly
hydrogen plant. Energy Procedia 2009; 1: 4095-4102.
Liu Z, Grande C, Li P, Yu J, Rodrigues AE. Multi-bed vacuum pressure swing adsorption
for carbon dioxide capture from flue gas. Sep. Purif. Technol. 2011; 81: 307-317.
Luberti M, Friedrich D, Brandani S, Ahn H. Design of H2 PSA for cogeneration of ultrapure
hydrogen and power at an advanced integrated gasification combined cycle with pre-
combustion capture. Adsorption 2014; 20: 511-524.
Martizez I, Romano MC, Fernandez JR, Chiesa P, Murillo L, Abanades JC. Process design
of a hydrogen production plant from natural gas with CO2 capture based on a novel Ca/Cu
chemical loop. Applied Energy 2014; 114: 192-208.
Mastandrea MD, Schneider SH. Probabilistic assessment of “dangerous” climate change and
emissions scenarios. International Symposium on Stabilisation of Greenhouse Gases 2005;
Exeter, UK.
Mathworks. MATLAB, 2008.
Mimura T, Simayoshi H, Suda T, Iijima M, Mitsuoka S. Development of energy saving
technology for flue gas carbon dioxide recovery in power plant by chemical absorption
method and steam system. Energy Conversion and Management 1997; 38: 57-62.

36
Mimura T, Satsumi S, Iijima M, Mitsuoka S. Development on energy saving technology for
flue gas carbon dioxide recovery by the chemical absorption method and steam system in
power plant, Greenhouse Gas Control Technologies 1999: 71-76.
Molburg JC, Doctor RD. Hydrogen from Steam-Methane Reforming with CO2 Capture. 20th
Annual International Pittsburgh Coal Conference 2003; Pittsburgh, USA.
Momirlan M, Veziroglu TN. The properties of hydrogen as fuel tomorrow in sustainable
energy system for a cleaner planet. Int. J. of Hydrogen Energy 2005; 30: 795-802.
Montazer-Rahmati MM, Binaee R. Multi-objective optimization of an industrial hydrogen
plant consisting of a CO2 absorber using DGA and a methanator. Computers and Chemical
Engineering 2010; 34: 1813-1821.
Mora C. The projected timing of climate departure from recent variability. Nature 2013; 502:
183–187.
Mueller-Langer F, Tzimas E, Kaltschmitt M, Peteves S. Techno-economic assessment of
hydrogen production processes for the hydrogen economy for the short and medium term.
Int. J. of Hydrogen Energy 2007; 32: 3797-3810.
Muradov NZ, Veziroglu TN. Designing a climate friendly hydrogen plant. Int. J. of
Hydrogen Energy 2005; 30: 225-237.
Nature 2014. Available at www.natureworldnews.com
NRC. The hydrogen economy: Opportunities, costs, barriers, and R&D needs, Prepared by
the Committee on Alternatives and Strategies for Future Hydrogen Production and Use;
2004.
Nsakala YN, Marion J, Bozzuto C, Liljedahl G, Palkes M, Vogel D, Gupta JC, Guha M,
Johnson H, Plasynski S. Engineering feasibility of CO2 capture on an existing US coal-fired
power plant, Paper presented at First National Conference on Carbon Sequestration 2001;
Washington DC, USA.
Ogden JM. Modelling infrastructure for a fossil hydrogen energy system with CO2
sequestration. 6th Greenhouse Gas Control Technologies conference 2002; Kyoto, Japan.
OriginLab. Data analysis and graphing software. Origin 8.5, 2010.

37
Parsons Infrastructure and Technology Group, Inc. Hydrogen production facilities: Plant
performance and cost comparisons. Final report, prepared for the National Energy
Technology Laboratory, US DOE; 2002.
PSE Ltd. 2010; available at http://www.psenterprise.com.
Ratafia-Brown JA, Manfredo LM, Hoffmann JW, Ramezan M, Stiegel GJ. An
environmental assessment of IGCC power systems. Proceedings of the 19th annual Pittsburgh
Coal Conference; 2002.
Richter HJ, Knoche K. Reversibility of combustion processes, efficiency and costing -
second law analysis of processes, ACS Symposium series 1983; 235: 71-85.
Riemer PWF, Ormerod WG. International perspectives and the results of carbon dioxide
capture disposal and utilisation studies. Energy Conversion and Management 1995; 36: 813-
818.
Rostrup-Nielsen JR, Rostrup-Nielsen T. Large-scale hydrogen production. 6th World
Congress of Chemical Engineering 2001; Melbourne, Australia.
Rubin ES, Rao AB. Uncertainties in CO2 capture and sequestration costs. Greenhouse Gas
Control Technologies, Proceedings of the 6th International Conference on Greenhouse Gas
Control Technologies 2003.
Ryden M, Lyngfelt A. Using steam reforming to produce hydrogen with carbon dioxide
capture by chemical-looping combustion. Int. J. of Hydrogen Energy 2006; 31: 1271–1283.
Sander MT, Mariz CL. The Fluor Daniel® Econamine™ FG process: Past experience and
present day focus. Energy Conversion Management 1992; 33: 341-348.
Schiffer HW. WEC energy policy scenarios to 2050. Energy Policy 2008; 36: 2464-2470.
SEPA. National air quality report; 2008.
Shilling N, Lee D. IGCC-Clean power generation alternative for solid fuels. Proceedings of
the PowerGen Asia 2003 Conference 2003; Ho Chi Minh City, Vietnam.
Simbeck DR. A portfolio selection approach for power plant CO2 capture, separation and
R&D options. Proceedings of the 4th International Conference on Greenhouse Gas Control
Technologies 1999.

38
Sircar S. Separation of multi-component gas mixtures 2009; US Patent No. 4171206.
Soltani R, Rosen MA, Dincer I. Assessment of CO2 capture options from various points in
steam methane reforming for hydrogen production. Int. J. of Hydrogen Energy 2014; 39:
20266–20275.
Takami KM, Mahmoudi J, Time RW. A simulated H2O/CO2 condenser design for oxy-fuel
CO2 capture process. Energy Procedia 2009; 1: 1443-1450.
Tarun CB, Croiset E, Douglas PL, Gupta M, Choudhury MHM. Techno-economic study of
CO2 capture from natural gas based hydrogen plants. Int. J. of Hydrogen Energy 2007; 1: 55-
61.
Terrien P, Lockwood F, Granados L, Morel T. CO2 capture from H2 plants: implementation
for EOR. Energy Procedia 2014; 63: 7861-7866.
Van der Sluijs JP, Hendriks CA, Blok K. Feasibility of polymer membranes for carbon
dioxide recovery from flue gases. Energy Conversion Management 1992; 33: 429-436.
Wang L, Yang Y, Shen W, Kong X, Li P, Yu J, Rodrigues AE. CO2 capture from flue gas in
an existing coal-fired power plant by two successive pilot-scale VPSA units. Ind. Eng.
Chem. Res. 2012.; 52: 7947-7955.
World Energy Outlook. International Energy Agency. 2004.
World Energy Outlook. International Energy Agency. 2013.
Wu W, Kuo PC. Conceptual designs of hydrogen production, purification, compression and
carbon dioxide capture. Energy Conversion and Management 2015; 103: 73-81.
Yokoyama T. Japanese R&D on CO2 capture. Greenhouse Gas Control Technologies, Proc.
of the 6th International Conference on Greenhouse Gas Control Technologies 2003; 13-18.
Zafar Q, Mattisson T, Gevert B. Integrated hydrogen and power production with CO2
Capture using chemical-looping reforming-redox reactivity of particles of CuO, Mn2O3,
NiO, and Fe2O3 using SiO2 as a support. Ind. Eng. Chem. Res. 2005; 44: 3485-3496.
Zheng XY, Diao YF, He BS, Chen CH, Xu XC, Feng W. Carbon dioxide recovery from Flue
gases by ammonia scrubbing. Greenhouse Gas Control Technologies, Proc. of the 6th
International Conference on Greenhouse Gas Control Technologies 2003; Kyoto, Japan.

39
Chapter 2: IGCC power plant design and simulation
There are 160 gasification plants operating already, with about 35 in planning
(Minchener, 2005), producing electricity, ammonia, methanol and hydrogen. For
power generation, initial projects were mainly based on coal feed but recently
refinery waste has also been considered as an alternative feed (Wall, 2007). Since the
technology was initially demonstrated in the 1980s, approximately 4 GWe of IGCC
power plants have been built globally. Most of them are fuelled by oil or petcoke and
only less than 1 GWe of the total was designed for coal (IEA CCC, 2005). Among
the IGCC projects, all coal-based IGCCs have been subsidised, while the only Italian
oil-based IGCC has been subsidised. Other polygeneration projects in Canada, the
Netherlands and the United States, as well as an oil-based IGCC in Japan, have not
been subsidised (Simbeck, 2001). IGCC has not yet been deployed more widely
because of strong competition with the natural gas combined cycle (NGCC)
wherever natural gas is readily available at low prices, because coal-based IGCC
plants are more costly than pulverised coal fired steam-electric plants and because of
their limited available number. IGCC availability has improved in recent years in
commercial-scale demonstration units (Wabash River Energy, 2000; McDaniel and
Hornick, 2002). Furthermore, the economics have become more favourable in the
case of its application to industrial polygeneration or oil refineries and chemical
plants where personnel are experienced with the chemical processes involved. The
recent rise in natural gas prices in the USA has also triggered general interest in
IGCCs (IPCC, 2005).
Gasification technologies can be classified into entrained flow, fluidised bed
and moving bed gasifiers with respect to solid fluid dynamics, oxygen and air blown
with respect to its oxidants, and dry or wet slurry fed with respect to the phase of the
coal feed (Collot, 2002). The gasifier is the “heart” of the IGCC power plant. It is the
part of the plant where coal is converted at high temperature and pressure into
synthesis gas (syngas).

40
2.1 IGCC power plants in the literature
Recent literature is inundated of works related to IGCC power plants. Doctor et
al. (1996) reported the evaluation of several commercially available CO2 capture
technologies that were incorporated into IGCC power plants for 90% carbon capture.
Chiesa and Consonni (1999) studied a Selexol process to recover 90% CO2 in
the shifted syngas and concluded that addition of the Selexol process would result in
a 5–7% reduction in the LHV-based power efficiency and around 40% increase in
the cost of electricity.
Haslbeck (2002) investigated the energy penalty involved in implementing
CO2 capture at two IGCC cases driven by Destec and Shell gasifiers, both of which
have a net power output of 400 MWe in the non-capture case. Selexol process was
selected for CO2 capture with an overall capture efficiency of 87%. In the Destec
IGCC case, the net power output was reduced by 42 MWe, which is equivalent to the
decrease of plant thermal efficiency by 6.6%. In the Shell IGCC case, the net power
output was reduced by 61 MWe resulting in a 7.3% decrease of the plant thermal
efficiency.
O’Keefe et al. (2002) studied a 960 MWe (gross) IGCC power plant driven by
a Texaco quench gasifier integrated with a Selexol unit for recovering 75% of the
carbon that the coal feed contains.
In a study by Foster Wheeler (2003), various pre-combustion capture
absorption processes were assessed for decarbonising a coal-based 750 MWe (gross)
IGCC. Several chemical solvents and physical solvents for H2S removal and CO2
capture were investigated to select the most suitable acid gas removal process and the
best arrangement of the shift reactors. The carbon capture target in this study was
85%.
Cormos and Agachi (2012) compared key performance indicators of two coal-
based power plants with and without carbon capture. The case studies evaluated the
process performance of IGCCs of a scale of around 400–500 MW net power and
those of PC boilers of a scale of 900–1000 MW net power at 90% overall carbon
capture rate.

41
Padurean et al. (2012) proposed an optimised IGCC plant design integrated
with CO2 capture absorption processes using different solvents. By carrying out
process simulations in Aspen Plus, they showed the performance results of the
various cases in terms of overall energy consumption, CO2-specific emissions, and
net electric power output and plant efficiency. The paper presented IGCC designs
with CO2 capture at three different CO2 capture efficiencies, 70%, 80% and 90%.
Maurstad et al. (2009) investigated the effect of coal quality on the
performance of an IGCC power plant, such as net power efficiency and CO2
emission factor based on net electricity production.
An IGCC power plant simulation with CO2 capture was conducted by Ng et al.
(2010) considering the different available gasification technologies. They showed
that the cost of electricity (COE) from the heat-integrated decarbonised IGCC sites is
significantly lower compared to IGCC sites without heat integration, making
application of CCS in IGCC sites economically competitive.
Robinson and Luyben (2010) carried out process simulations of a GEE gasifier
IGCC power plant with carbon capture and a hybrid IGCC/methanol plant in both
steady-state and dynamic modes using Aspen Plus.
Bhattacharyya et al. (2010) carried out the most complete steady-state
simulation in terms of units simulated in the plant for an GE gasifier-based IGCC
power plant with carbon capture.
Jones et al. (2011) focused their study on various process configurations of air
separation units (ASUs) in an IGCC power plant. They investigated the effect of
ASU process configurations on its power consumption.
Zheng and Furinsky (2005) compared different types of gasifiers, including
coal slurry and dry coal gasifiers for IGCC power plants. Among eight cases
simulated, they demonstrated that the overall thermal efficiency varies within less
than 0.5% but BGL gasifiers have better environmental performance.
Emun et al. (2010) optimised an IGCC power plant using Aspen Plus. The
optimum design was obtained by a pinch analysis in order to reveal opportunities of
heat integration among the units.
Huang et al. (2008) conducted a detailed techno-economic study on IGCC
power plants integrated with CO2 capture, including CO2 transport and storage costs.

42
They found that the specific CO2 transportation and storage cost depend strongly on
the internal and external parameters, such as onshore and offshore pipelines.
Several papers investigated the cogeneration of power and ultrapure hydrogen
using coal gasification, as discussed below.
Damen et al. (2006) performed a consistent comparison of state-of-the-art and
advanced electricity and hydrogen production technologies with CO2 capture using
coal and natural gas. This study is useful in the sense that it gives a complete
overview of electricity and hydrogen production technologies with CO2 capture and
standardised ranges in energetic and economic performance both in the short and
longer term.
Chiesa et al. (2005) and Kreutz et al. (2005) published a two-part paper
investigating performances, costs and prospects of using technologies ready for
commercialisation to convert coal to hydrogen and electricity with CO2 capture and
storage.
Cormos et al. (2008) investigated a number of H2 production plant
configurations based on standard entrained-flow gasification processes producing
hydrogen at pipeline pressure. The paper showed that the production of very pure
hydrogen can be achieved in the least penalty in plant efficiency by the use of a raw
syngas compressor between gasifier and shift reactors and by the use of CO2 as a
transport gas rather than N2 in a dry feed gasifier.
Cormos (2010) focused on the evaluation of energy integration aspects for
hydrogen and electricity co-production scheme based on coal gasification process
with CCS. A system optimisation has been carried out, including heat and power
integration among the main plant units and sensitivity analysis relating to ambient
conditions.
IGCC power plants would experience different energy penalties involved in
CO2 capture depending on gasifier types. Conventional IGCC power plants with
slurry coal-fed GE gasifiers typically have net plant efficiency on the HHV basis of
around 38%. In the case of IGCC with carbon capture, this efficiency decreases
approximately by 6%. An IGCC process with a Shell gasifier fed by dry coal has
41% net plant efficiency (HHV) without carbon capture but it ends up with 32% net
plant efficiency when integrated with a dual-stage Selexol process for carbon capture

43
(DOE, 2007). Figure 2.1 shows the block flow diagram of the Shell IGCC with
carbon capture.
ASU
Gasifier
Raw Gas
Quench
Coal
Dryer
Syngas
Scrubber
2-stage
WGSR
Sour
Water
Stripper
2-stage
Selexol
CO2
Purifier
CO2
Compres
-sor
TGTUClaus
Plant
Syngas
Humi
-difer
Syngas
Reheater
HRSG
Steam
Turbine
Gas
Turbine
Air
Air
Coal
To Stack
N2
N2
O2 to
Claus
O2
Steam
Slag
Water
Sour Water
Shift
Steam
Shifted Syngas
Treated Syngas
Steam Water
To Stack
CO2
Product
TGTU
Vent
O2 to
Claus
H2S
Sulphur
H2S to
Claus
Drying
Gas Prep
Air
N2
Treated Syngas
Figure 2.1: Block flow diagram of the Shell IGCC with carbon capture
2.2 Gasification process
Gasification is a chemical process of converting low-value solid feedstocks
such as coal, oil refining residues or biomass, to synthesis gas with oxidants and
moderators, aiming to produce high-value products (chemicals, electricity, clean
synthetic fuels) (Figure 2.2). Gasification is partial oxidation, although steam is also
supplied to the reactor in most processes. Fixed bed, fluidised bed or entrained flow
gasifiers can be used. These can have very different characteristics with respect to
oxidant (air or O2), operating temperature (up to 1350 ºC), operating pressure (0.1–7
MPa), feed system (dry or water slurry), syngas cooling method (water quench or via
radiative and convective heat exchangers) and gas clean-up systems. These
alternative design options determine the fraction of feedstock converted to syngas,
the syngas composition and the cost. The gasifier output contains CO, H2, CO2, H2O
and impurities (e.g., N2, COS, H2S, HCN, HCl, NH3, CH4, C2+, volatile trace
minerals and Hg) that must be managed appropriately.

44
As with any technology, widespread market penetration of gasification relies
on economic conditions and enabling infrastructures that allow it to be competitive
with other alternatives. For gasification, the largest potential market is electricity
generation from coal, where IGCC power plants are being proposed with increasing
frequency (Puigjaner, 2011).
Figure 2.2: Simplified schematic of a gasification process showing options with CO2
capture and electricity, hydrogen or chemical production (IPCC, 2005)
The gasification process takes place at temperatures in the range of 800 °C to
1800 °C. The reactor temperature depends on the characteristics of the feed, such as
the softening and melting temperatures of the ash. Pyrolysis or devolatilisation
followed by char gasification are the predominant reactions occurring in the gasifier,
and are common for any type of gasifier feed. Over the whole temperature range
described above, the reaction rates are high enough to make it possible to assume that
modelling on the basis of the thermodynamic equilibrium of chemical reactions can
generate results that approximate the performances actually observed in most
commercial gasification reactors (Higman and van der Burgt, 2003).
The principal chemical reactions occurring during the gasification process are
listed as follows. The combustion of carbon, CO and H2 to form CO2 and H2O are
described in eqns (2-1, 2-2 and 2-3). Carbon is also reacting with CO2 to form CO by

45
reverse Boudouard reaction described by eq. (2-4). The carbon gasification reaction
with steam is reported in eq. (2-5). Hydrogasification reaction (eq. (2-6)), water gas
shift reaction (eq. (2-7)) and steam methane reforming reaction (eq. (2-8)) also occur.
COOC 22
1 ∆Η= -111 kJ/mol (2-1)
222
1COOCO ∆Η= -283 kJ/mol (2-2)
OHOH 2222
1 ∆Η= -242 kJ/mol (2-3)
COCOC 22 ∆Η= +172 kJ/mol (2-4)
22 HCOOHC ∆Η= +131 kJ/mol (2-5)
422 CHHC ∆Η= -75 kJ/mol (2-6)
222 HCOOHCO ∆Η= -41 kJ/mol (2-7)
224 3HCOOHCH ∆Η= +206 kJ/mol (2-8)
The operation temperatures of coal gasifiers are generally so high that the formation
of C2+ hydrocarbons, including tar, can be suppressed (Higman and van der Burgt,
2003).
2.3 Gasification technologies
For the gasification process, several types of reactors have been used. These
reactors can be generally classified into one of the following three categories:
moving bed, fluidised bed and entrained flow. Some characteristics of the
aforementioned gasifiers are summarised in Table 2.1.
Moving-bed gasifiers utilise lump coal as the feed: coal feed moves slowly
down the bed under the effect of gravity and gasification occurs with the oxidant
flowing counter-currently. Heat and mass transfer is promoted in fluidised bed
gasifiers due to good mixing between the coal and the oxidant inside the reactor. The
size of the particles in the feed is a significant factor affecting the operation of the
fluidised bed gasifiers. In the entrained-flow gasifiers, the feed and the oxidant flow

46
concurrently along the reactor. Entrained-flow gasifiers operate at high temperatures
to ensure good carbon conversion. Entrained-flow gasifiers have fundamental
environmental advantages over fluidised bed and moving-bed gasifiers. They
produce no hydrocarbon liquids, and the only solid waste is an inert slag. The dry
feed entrained-flow gasifiers also have minor environmental advantages over the
slurry feed entrained-flow gasifiers. They produce a higher H2S/CO2 ratio acid gas,
which improves sulfur recovery and lessens some of the gray water processing and
the fixed salts blowdown problems associated with slurry feeding. Gasification
technology examined herein is the dry coal entrained flow technology developed by
Shell.
Table 2.1: Categories of gasification processes (Simbeck et al., 1993)
Moving-bed Fluidised-bed Entrained-flow
Typical process Lurgi, BGL Winkler, HTW,
CFB, KRW, U-Gas
Shell, GE, E-Gas,
GSP, KT
Feed rank Any/High Low/Any Any
Outlet gas
temperature 425–650 °C 900–1050 °C 1200–1600 °C
Oxidant demand Low Moderate High
Steam demand High/Low Moderate Low
2.4 Shell gasifier description and modelling
Development of the Shell gasification process for partial oxidation of oil began
in the early 1950s. More than 75 commercial Shell partial oxidation plants have been
built worldwide to convert a variety of hydrocarbons to carbon monoxide and
hydrogen. However, it was not until 1972 that coal started to be used as a gasifier
feed by Shell Internationale Petroleum Maatschappij B.V. Several pilot plants have
been built and demonstration projects have led to useful experience and conclusions
with regards to the quality of the coal used for the gasification as well as extensive
environmental monitoring and side stream testing of different acid gas removal
(AGR) technologies. Currently, Nuon IGCC power plant at Buggenum, in the

47
Netherlands, uses Shell technology for coal gasification (DOE, 2007). A schematic
of the Shell gasifier is shown in Figure 2.3.
The key advantage of the Shell coal gasification technology is its lack of feed
coal limitations. One of the major achievements of the Shell development program
has been the successful gasification of a wide variety of coals ranging from
anthracite to brown coal. The dry pulverised feed system developed by Shell uses all
coal types with essentially no operating and design modifications. The dry-fed Shell
gasifier also has the advantage of lower oxygen requirements than comparable
slurry-fed entrained flow gasifiers.
Figure 2.3: Shell gasifier schematic (DOE, 2007)
Characteristics desirable for coal considered for use in the Shell gasifier
include moderate ash fusion temperature and relatively low ash content. High ash
fusion temperature coals may require flux addition for optimal gasifier operation.
The ash content, fusion temperature and composition affect the required gasifier
operating temperature level, oxygen requirements, heat removal, slag management
and maintenance. However, dry feeding reduces the negative effects of high ash
content relative to slurry feed gasifiers.
Shell gasifier is simulated referring to Case 6 of the DOE report (DOE, 2007)
and using the commercial software Honeywell UniSim Design R400 (Honeywell,
2011). A detailed flow scheme of the process, including mass and energy balances
around the units, can be found in Appendix 1 of this thesis. After crushing, milling
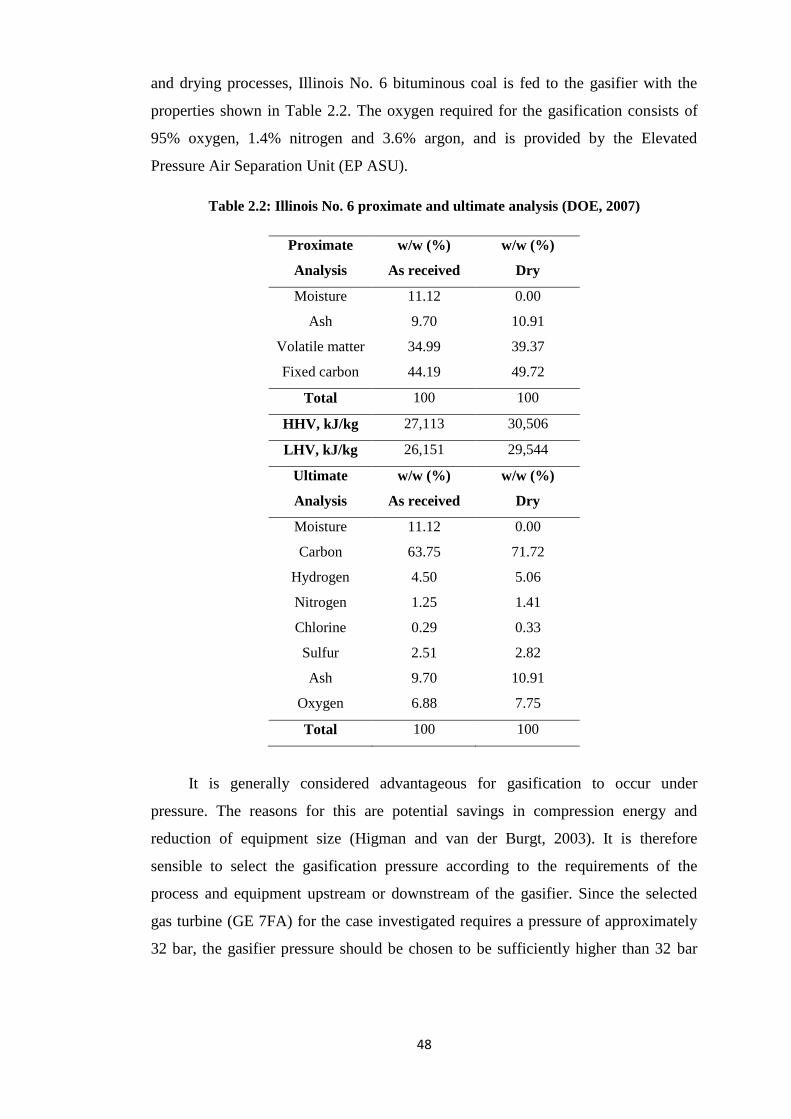
48
and drying processes, Illinois No. 6 bituminous coal is fed to the gasifier with the
properties shown in Table 2.2. The oxygen required for the gasification consists of
95% oxygen, 1.4% nitrogen and 3.6% argon, and is provided by the Elevated
Pressure Air Separation Unit (EP ASU).
Table 2.2: Illinois No. 6 proximate and ultimate analysis (DOE, 2007)
Proximate
Analysis
w/w (%)
As received
w/w (%)
Dry
Moisture 11.12 0.00
Ash 9.70 10.91
Volatile matter 34.99 39.37
Fixed carbon 44.19 49.72
Total 100 100
HHV, kJ/kg 27,113 30,506
LHV, kJ/kg 26,151 29,544
Ultimate
Analysis
w/w (%)
As received
w/w (%)
Dry
Moisture 11.12 0.00
Carbon 63.75 71.72
Hydrogen 4.50 5.06
Nitrogen 1.25 1.41
Chlorine 0.29 0.33
Sulfur 2.51 2.82
Ash 9.70 10.91
Oxygen 6.88 7.75
Total 100 100
It is generally considered advantageous for gasification to occur under
pressure. The reasons for this are potential savings in compression energy and
reduction of equipment size (Higman and van der Burgt, 2003). It is therefore
sensible to select the gasification pressure according to the requirements of the
process and equipment upstream or downstream of the gasifier. Since the selected
gas turbine (GE 7FA) for the case investigated requires a pressure of approximately
32 bar, the gasifier pressure should be chosen to be sufficiently higher than 32 bar

49
taking into account pressure losses at the units located between the gasifier and the
gas turbine. The minimum operating temperature is generally set on the basis of the
ash properties. Since the gasification process is assumed to operate at approximately
42 bar and 1,427 °C, the syngas produced contains a low methane concentration, as
also demonstrated by Figure 2.4.
Figure 2.4: Variation of syngas composition with temperature at 40 bar (Higman and
van der Burgt, 2003)
The gasifier was modelled as a “Conversion” reactor in UniSim Design R400
with Peng–Robinson EOS to account for non-ideality resulting from the high
pressure of the gasifier (Kapetaki et al., 2013). It was assumed that the following
reactions additionally take place in the gasifiers as well as eqns (2.1)-(2.8):
COSOSC 222 2 (2-9)
SHHS 22 (2-10)
HClHCl 222 (2-11)
322 23 NHHN (2-12)
The conversion rate of each reaction was carefully estimated to reproduce the
composition of the syngas at the outlet of the gasifier, as detailed in the DOE report
(2007).
Based on this model, the syngas composition estimated for the gasifier is reported in
Table 2.3. The simulated values perfectly match with the DOE report results.

50
The carbon conversion is defined as:
x100feedin Carbon
slagin Carbon -1(%) conversionCarbon
(2-13)
With an O2/Coal ratio of 0.827 kgO2/kgdrycoal, the total carbon conversion is evaluated
at 99.5%, resulting in a H2/CO fraction of 0.51.
Table 2.3: Validation of the simulation approach with DOE (2007) data for Shell
gasifier
Simulation DOE
Ar 0.0097 0.0097
CH4 0.0004 0.0004
CO 0.5720 0.5716
CO2 0.0211 0.0211
COS 0.0007 0.0007
H2 0.2900 0.2901
H2O 0.0364 0.0364
H2S 0.0081 0.0081
N2 0.0574 0.0585
NH3 0.0033 0.0033
O2 0.0000 0.0000
SO2 0.0000 0.0000
F (lb/h) 865,655 865,967
T (°F) 2,595 2,595
P (psia) 604.7 604.7
2.5 Gasifier and surroundings modification for carbon
capture
The Shell gasifier and its ancillary units designed for non-capture mode are
shown in Figure 2.5 and correspond to Case 5 of the DOE report (2007). High-
temperature heat recovery is accomplished in three steps, including the gasifier
jacket, which cools the syngas by maintaining the reaction temperature at 1427 °C.
The product gas from the gasifier is cooled to 885 °C by adding cooled recycled fuel

51
gas to lower the temperature below the ash melting point. Gas then goes through a
raw gas cooler, which lowers the gas temperature from 885 °C to 315 °C, and
produces high-pressure steam for use in the steam cycle. The syngas is further cooled
to 204 °C by heating water that is used to humidify the sweet syngas prior to the
combustion turbine.
Figure 2.5: Shell Gasifier, syngas scrubber and COS hydrolysis reactor for non-capture
mode (Kapetaki et al., 2013)
After passing through the raw gas cooler, the syngas passes through a cyclone
and a raw gas candle filter where the majority of the fine particles are removed and
returned to the gasifier with the coal fuel. About 45% of the raw gas from the filter is
recycled back to the gasifier as quench gas. A single-stage compressor is utilised to
boost the pressure of a cooled fuel gas stream from 40 bar to 42 bar to provide
quench gas to cool the gas stream from the gasifier. The raw synthesis gas exiting the
particulate filter then enters the scrubber for removal of chlorides and remaining
particulate. The sour water stripper removes NH3, SO2, and other impurities from the
waste stream of the scrubber. After the water scrubber, the gas is reheated to 177 °C
and fed to the COS hydrolysis reactor. The COS in the sour gas is hydrolysed with
steam over a catalyst bed to H2S, which is more easily removed by the following
AGR unit. If retrofitting a pre-combustion capture unit to an IGCC power plant, it
can be expected that additional fuel would be fed to the gasifier in order to operate
the same gas turbine. This is because the heating value of the fuel gas will be reduced
due to the exothermic shift reaction so more coal should be fed to the gasifier to
compensate the heat loss. The additional thermal input is almost equivalent to the
difference of heat generated in the shift reaction. Moreover, the different H2 and CO
recovery in the AGR units between the non-capture and capture cases would also
Shell Gasifier
Syngas
cooler
Candle filter
Syngas
scrubberDry coal + N2
Steam
BFW to Steam Jacket
Steam
BFW
HP SteamHot HP
BFW
Cold HP
BFW
Humidifier water
Recycle gas
Compressor
Syngas Recycle
COS Hydrolysis
Reactor
Scrubber
Blowdown
Syngas Cooling
204 °C
3,962 kPa
110 °C
3,896 kPa
177 °C
Slag
885 °C
315 °C

52
affect the coal input increment. Some modifications are therefore essential for the
Shell IGCC equipped for carbon capture, as reported in Figure 2.6.
Figure 2.6: Shell Gasifier, syngas scrubber and water gas shift reactors for carbon
capture mode (Kapetaki et al., 2013)
The first change is due to the requirement to cool down the raw syngas, making
use of quench water instead of using the syngas recycle in the non-capture Shell
IGCC. In non-capture Shell IGCC, the syngas recycle reduces the syngas
temperature to 885 °C, which facilitates the operation of the syngas cooler at a lower
temperature. In carbon capture Shell IGCC, however, the syngas is cooled by water
quench, which sacrifices most high pressure (HP) steam generation but enriches the
syngas with water for subsequent shift reaction. This change is beneficial in that the
amount of shift steam injection can be drastically reduced. The amount of water
quench and its temperature is determined so that the syngas at the syngas scrubber
outlet is saturated with water at 200 °C. In this case, heat recovery is obtained
beyond the gasifier jacket by means of two heat exchangers located between the
particulate filter and the syngas scrubber producing HP and IP steam. After the
scrubber, the syngas is ready to be shifted in a two-stage WGS reactor.
2.6 Water gas shift reactors
While in the conventional IGCC power plants without CO2 capture WGSRs are
not required, this is not the case when the IGCC power plants operate in a carbon
capture mode. The objective is to convert the CO of the syngas to H2 and CO2 by
reacting it with water over a bed of catalyst, as already described by eq. (2-7):
222 HCOOHCO ∆Η = -41 kJ/mol (2-7)
Shell Gasifier
Candle filter
Syngas
scrubber
Dry coal + N2
BFW to Steam Jacket
Steam
Shift Steam
399 °C
5,298 kmole/hr
HTSR
Scrubber
Blowdown
Syngas
Quench
Cooler
Quench Water
408 °C
4,031 kPa
HP Steam
HP BFW
IP Steam
IP BFW
LTSR
IP Steam
Hot IP
BFW
Syngas
Cooling
266 °C
200 °C, 3,447 kPa
CO : 10,901 kmole/hr
H2O : 16,998 kmole/hr
304 °C
316 °C
CO : 464 kmole/hr
516 °C 260 °C
O2 / Steam
Slag

53
Currently, there are two main classes of materials being used in industry as CO-shift
catalysts: Fe-based and Cu-based. However, further developments of catalysts have
been introduced and materials such as Co, Au and Pt can also be used, along with
Pd-based membrane reactors (Mendes et al., 2010). The molar ratio of H2O to CO
was set approximately 2 to 1 (DOE, 2007). This adjustment is achieved by utilising
intermediate pressure (IP) steam extracted from the steam cycle of the power plant.
As seen in Figure 2.6, the CO-shift sections consist of two fixed-bed reactors
arranged in series: a high temperature shift reactor (HTSR) operating at 516 °C and a
low temperature shift reactor (LTSR) operating at 260 °C. The syngas after the
scrubber is reheated to 285 °C and then steam is added. The two-stage WGSR results
in 95.7% overall conversion of the CO to CO2. In the simulation, adiabatic
equilibrium reactors (Gibbs reactors) were used in UniSim Design R400, considering
methane as an inert gas (Salazar et al., 2011) and allowing the simulator to calculate
the conversion rates at the given conditions.
The HTSR product is cooled before entering the LTSR to recover the
exothermic heat by generating steam. The heat exchanger is located after the HTSR
to produce IP steam from the BFW. The IP steam is subsequently injected into the
syngas for the shift reaction. The warm syngas from the second stage of the WGS is
cooled to 241 °C by preheating the syngas prior to the first stage of WGS. The WGS
catalyst also serves to hydrolyse COS, thus eliminating the need for a separate COS
hydrolysis reactor. Following the second stage of WGS, the syngas is further cooled
to 35 °C prior to the AGR unit.
2.7 Air separation unit
The very large quantities of oxygen required for CO2 capture using the
techniques of oxy-fuel combustion and pre-combustion de-carbonisation can only be
economically produced, at present, by using the established process of oxygen
separation from air by distillation at cryogenic temperatures (Latimer, 1967). This is
a technology that has been used for over 100 years since the first air separation plant
was built by Carl von Linde in 1902. Currently, there are three commercially
available technologies for air separation, including pressure swing adsorption
systems and membrane modules. Although cryogenic distillation is a mature

54
technology, there has been an average of twenty patents in the 1990s regarding this
process (Thorogood, 1991). It is still indispensable in terms of high product purities
and capacities, as shown in Figure 2.7 for nitrogen systems.
Figure 2.7: Technology comparison for nitrogen production systems
In a typical cryogenic air separation plant (Castle, 1991; Figure 2.8), air is
compressed to a pressure of 5 to 6 bar and purified to remove water, CO2, N2O and
trace hydrocarbons, which could accumulate to dangerous levels in oxygen-rich parts
of the plant, such as the reboiler-condenser. Two or more switching fixed-bed
adsorbers are used, which can be regenerated by either temperature or pressure
swing, using in each case, a low-pressure waste nitrogen stream. The air is cooled
against returning products (oxygen and nitrogen) in a battery of aluminium plate-fin
heat exchangers and separated into pure oxygen and nitrogen fractions in a double
distillation column, which uses aluminium packing.
Oxygen can be pumped as liquid and delivered as a high-pressure gas at up to
100 bar. Pumped oxygen plants have largely replaced the oxygen gas compression
systems. They have virtually identical power consumptions but in a pumped cycle, a
high-pressure air booster compressor provides a means of efficiently vaporising and
heating the liquid oxygen stream to ambient temperature. Current plant sizes range
up to 3500 tO2 d-1
and larger single train plants are being designed. Typical power
consumption for the delivery of 95% O2 at low pressure (1.7 bar, a typical pressure
for an oxy-fuel application) is 200 to 240 kWh/tO2. There are numerous process cycle
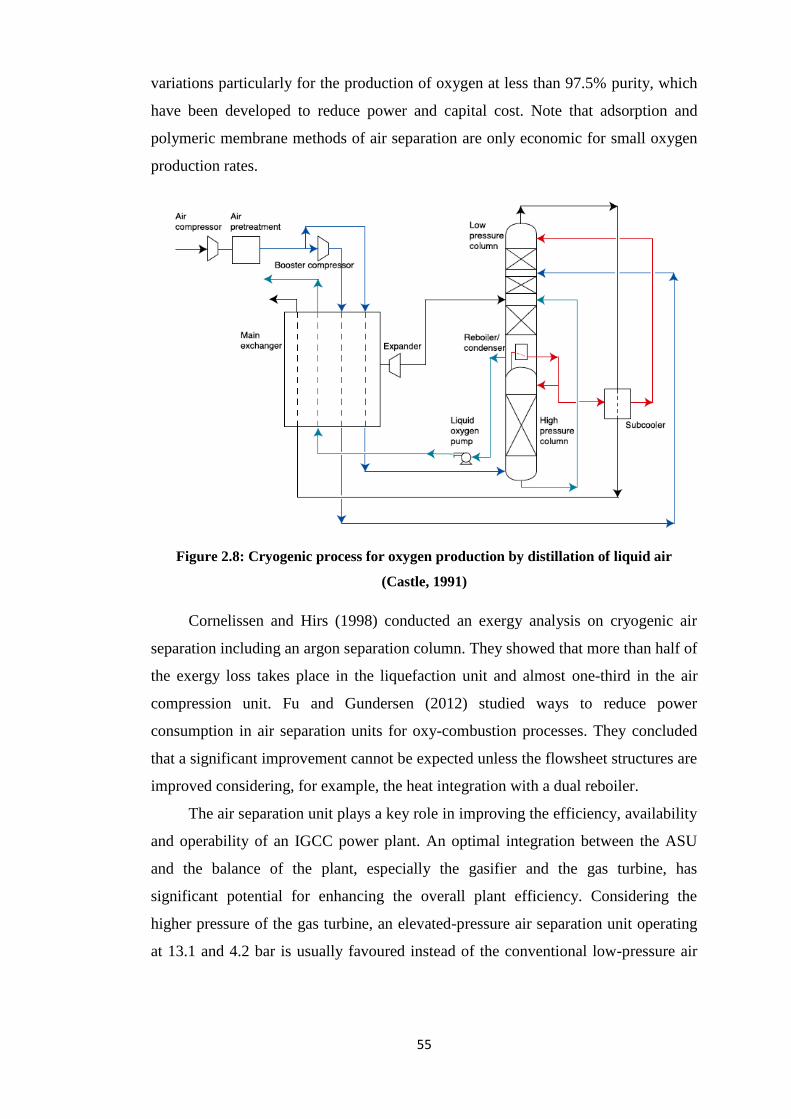
55
variations particularly for the production of oxygen at less than 97.5% purity, which
have been developed to reduce power and capital cost. Note that adsorption and
polymeric membrane methods of air separation are only economic for small oxygen
production rates.
Figure 2.8: Cryogenic process for oxygen production by distillation of liquid air
(Castle, 1991)
Cornelissen and Hirs (1998) conducted an exergy analysis on cryogenic air
separation including an argon separation column. They showed that more than half of
the exergy loss takes place in the liquefaction unit and almost one-third in the air
compression unit. Fu and Gundersen (2012) studied ways to reduce power
consumption in air separation units for oxy-combustion processes. They concluded
that a significant improvement cannot be expected unless the flowsheet structures are
improved considering, for example, the heat integration with a dual reboiler.
The air separation unit plays a key role in improving the efficiency, availability
and operability of an IGCC power plant. An optimal integration between the ASU
and the balance of the plant, especially the gasifier and the gas turbine, has
significant potential for enhancing the overall plant efficiency. Considering the
higher pressure of the gas turbine, an elevated-pressure air separation unit operating
at 13.1 and 4.2 bar is usually favoured instead of the conventional low-pressure air

56
separation unit operating at 6.0 and 1.5 bar. Three product streams from the ASU are
of interest for an IGCC plant: the oxygen stream with a purity of 95% is mainly used
in the gasifier while a small portion of it goes to the Claus unit for combusting
hydrogen sulfide. Nitrogen is produced in the ASU at two pressure levels. The
majority of the low-pressure nitrogen is compressed and fed to the gas turbine as a
fuel diluent for NOX reduction and power augmentation in the gas turbine. A small
fraction is used as a coal carrier for the Shell gasifier. The high-purity nitrogen at
high pressure is also produced from the ASU and it is further compressed and
directed to the gas turbine. Even though the power consumption in the oxygen and
nitrogen compressors decrease in an elevated-pressure ASU, the power consumption
in the main air compressor (MAC) increases to compensate. In addition, the higher
operating pressure also decreases the relative volatility of oxygen and nitrogen,
causing separation challenges.
The general scheme of the EP ASU adopted herein is based on Configuration 2
proposed by Jones et al. (2011) and is modified according to the simulation
requirements. The simulation schematic of the process is shown in Figure 2.9.
Figure 2.9: Simulation flowsheet of cryogenic air separation unit
The ASU consists of a multi-stream heat exchanger (main heat exchanger or
MHE) that recovers refrigeration from the product streams and cools the incoming
streams. Products leave the main heat exchanger at near ambient temperatures after
refrigerating one air stream and, if applicable, liquefying another air stream and the

57
nitrogen reflux. Refrigerated air leaving the main heat exchanger is superheated by
approximately 10 °C. The liquefied air stream, approximately 1% of total airflow,
leaves the main heat exchanger as a saturated liquid. The refrigerated air stream is
then sent to the bottom of the high-pressure column. The refrigerated air stream
provides the boil-up for the HP column and the LP column via the coupled
reboiler/condenser. The liquefied air stream is split with a portion being sent to the
nitrogen superheater for subcooling with the remainder being sent to an intermediate
stage of the HP column. The HP column, for this case, operates at a pressure of 13.1
bar. The HP column consists of 50 equilibrium stages. The HP column yields a crude
liquid oxygen product (~34 mol% O2) from the bottom and an ultra-pure, high-
pressure gaseous nitrogen product from the top. The crude oxygen from the bottom
and liquid nitrogen from the top of the HP column are subcooled in a multi-stream
heat exchanger (nitrogen superheater) against the nitrogen vapour from the top of the
LP column. The subcooled streams are sent to the LP column. The LP column
operates at 4.2 bar and consists of 25 equilibrium stages. Both oxygen and nitrogen
products are sent to the compressors for the related IGCC applications.
All simulation parameters and product specifications for the ASU are given in
Table 2.4. It should be noted that the low-pressure nitrogen purity requirement is
dependent on the fuel and combustor types used in the gas turbine. The EP-ASU
process model was simulated using UniSim Design R400 and the Peng–Robinson
equation of state. The oxygen and nitrogen produced are sufficient to accommodate
the requirements of oxygen and nitrogen for the units within the IGCC. A detailed
diagram including coal gasification and air separation unit is provided in Figure 2.10.

58
Table 2.4: Simulation parameters and product specifications for ASU simulation
Simulation parameter/product specification Value
Compressors isentropic efficiency (%) 85
Air feed flowrate (kmol/h) 25,500
Liquefied air flowrate (kmol/h) 300
HP column pressure (bar) 13.1
LP column pressure (bar) 4.2
Condenser/reboiler duty (MW) 30.4
Compression energy (MW) 59.0
HP column reboiler temperature (ºC) -160.7
LP column reboiler temperature (ºC) -167.2
N2 amount in the bleed stream (mol) 0.999
O2 amount in oxygen product stream (mol) 0.950
N2 amount in nitrogen product stream (mol) 0.981

59
Figure 2.10: Coal gasification and air separation unit schematic (Kapetaki, 2015)

60
2.8 Dual-stage SelexolTM
Since the partial pressure of acid gas in the syngas is generally high in IGCC
power plants, physical solvents appear to be favourable as a CO2 capture option. Like
all physical solvents, dimethyl ether of polyethylene glycol (DEPG) or SelexolTM
can
be used for the absorption of the acid gases taking advantage of their high solubility
into the solvent. Padurean et al. (2012) proposed a detailed study and optimisation of
plant design (column height and packed dimensions) with the CO2 capture process
using different solvents of: aqueous solutions of alkanolamine, dimethyl ethers of
polyethylene glycol, chilled methanol and N-methyl-2-pyrolidone. Simulation results
show that for the solvents evaluated for CO2 capture, the physical solvent, DEPG, is
more energy efficient that the other physical and chemical solvents investigated.
Robinson and Luyben (2010) proposed a scheme with the H2S removal unit prior to
WGSRs (sweet shift), while the CO2 capture part is located downstream.
Bhattacharyya et al. (2011) optimised the entire IGCC plant with CO2 capture
focusing on modelling assumptions, such as equilibrium tray calculations, in the
Selexol absorbers.
DEPG is a mixture of dimethyl ethers of polyethylene glycol of the following
chemical formula:
3423 )( CHOHCOCH n , with n being between 2 and 9
Compared to other solvents, DEPG has a higher viscosity, which reduces mass
transfer rates and tray efficiencies and increases packing or tray requirements,
especially at reduced temperatures. Since it is sometimes necessary to reduce the
temperature to increase acid gas solubility and reduce the solvent circulation rate,
this could be a disadvantage (Burr and Lyddon, 2008). Some physical properties of
DEPG and other solvents are listed in Table 2.5.

61
Table 2.5: Properties of physical solvents (Ranke and Mohr, 1985)
Solvent DEPG PC NMP MeOH
Process name Selexol or
Coastal
Fluor
Solvent Purisol Rectisol
Viscosity at 25 ºC (cP) 5.8 3.0 1.65 0.6
Density at 25 ºC (kg/m3) 1,030 1,195 1,027 785
Molecular weight (g/mol) 280 102 99 32
Vapour pressure at 25 ºC (Pa) 0.097 11.3 53 16,700
Freezing point (ºC) -28 -48 -24 -92
Boiling point at 1 atm (ºC) 275 240 202 65
Thermal conductivity (W/m/K) 0.19 0.21 0.16 0.21
Maximum operating temperature
(ºC) 175 65 - -
Specific heat at 25 ºC (kJ/kg/K) 2.05 1.4 1.68 2.37
CO2 solubility at 25 ºC
(m3
CO2/m3sol)
3.63 3.40 3.57 3.18
Typically, the Selexol process consists of two stages, where H2S is removed
prior to CO2 and the regeneration of the solvent is achieved in two sections:
In the stripper, by imposing a pressure drop along the column and steam
extracted from the low pressure (LP) section of the power plant’s steam
cycle.
By a series of pressure vessels downstream the CO2 removal stage.
Probably one of the first detailed schemes for the dual-stage Selexol process
was the one presented by Padurean et al. (2012), as shown in Figure 2.11.

62
Figure 2.11: Selexol process flow diagram for acid gas removal (Padurean et al., 2012)
2.8.1 Thermodynamics of the process
Fluid phase equilibria are at the heart of unit operation calculations in
Chemical Engineering and this also applies to the dual-stage Selexol process. In this
case, we face a gas–liquid equilibrium that has to be solved by applying the iso-
fugacity condition (Smith et al., 2005; Sandler, 1999). In IGCC power plants, since
the operating pressures are elevated, non-idealities in the gas phase must be taken
into account: this results in the evaluation of fugacity coefficients φi from a specific
equation of state. By contrast, the solubility behaviour of the solute gas in physical
solvents for the IGCC case conditions will closely approach Henry’s law, with the
acid gas loading in the solvent being proportional to the acid gas partial pressure
(Sciamanna and Lynn, 1988; Xu et al., 1992; Henni et al., 2005). Therefore, the gas–
liquid equilibrium can be expressed by:
L
i
G
i ff (2-14)

63
isi
G
ii xKPy , (2-15)
where Ki,s is the Henry’s law constant for the gas i in the Selexol solvent.
The temperature dependency of the Henry’s law constant for H2S and CO2 in Selexol
has been reported in the literature (Xu et al., 1992) and it is illustrated in Table 2.6.
Table 2.6: Henry’s law constants for H2S and CO2 in Selexol (Xu et al., 1992)
Temperature (°C)
Henry’s law constant (MPa)
H2S CO2
25 0.440 3.570
30 0.506 3.950
40 0.641 4.670
50 0.787 5.620
60 1.010 6.550
The enthalpy change from vapour to dissolved solute represents the heat of solution
(or heat of absorption) and can be evaluated by the variation of the Henry’s law
constants with temperature. The correlation between the Henry’s law constants and
the heat of absorption can be represented by eq. (2-16) (Clausius–Clapeyron equation
for gas–liquid equilibrium).
2
ln
RT
H
dT
Kd (2-16)
The enthalpy of absorption can be therefore calculated by the slope of a linear
equation obtained by integrating eq. (2-16) with an assumption of constant heat of
absorption, given the Henry constants at different temperatures. For H2S and CO2,
the corresponding values are presented in Table 2.7.
Table 2.7: Standard heats of absorption for H2S and CO2 in Selexol (Xu et al., 1992)
Standard state heats of absorption
(kJ/mol)
H2S CO2
19.1 14.3

64
Equilibrium solubility data for H2S and CO2 in various representative solvents have
been reported in the DOE report (2007), as shown in Figure 2.12. This figure exhibits
an order of magnitude higher solubility of H2S over CO2 at a given temperature,
which enables the selective absorption of H2S over CO2 with physical solvents. It
also illustrates that the acid gas solubility in physical solvents increases with lower
solvent temperatures. Moreover, Table 2.8 shows the gas solubilities of some
physical solvents relative to CO2.
Figure 2.12: Gas solubilities of H2S and CO2 in physical solvents (DOE, 2007)

65
Table 2.8: Gas solubilities of some physical solvents relative to CO2 (Burr and Lyddon,
2008)
Component DEPG at
25 ºC
PC at
25 ºC
NMP at
25 ºC
MeOH at
-25 ºC
CO2 1.000 1.000 1.000 1.000
H2 0.013 0.008 0.006 0.005
N2 0.020 0.0084 - 0.012
O2 - 0.026 0.035 0.020
CO 0.028 0.021 0.021 0.020
CH4 0.420 0.038 0.072 0.051
NH3 4.800 - - 23.200
H2S 8.820 3.290 10.200 7.060
H2O 730.000 300.000 4,000.000 -
HCN 1,200.000 - - -
Some additional advantages for the application of DEPG in the Selexol process
to gasification plants are listed below (Chen, 2005):
A very low vapour pressure that limits its losses to the treated gas
High chemical and thermal stability (no reclaiming or purge) because the solvent
is a true physical solvent and does not react chemically with the absorbed gases
Non-toxic for environmental compatibility and worker safety
Non-corrosive for mainly carbon steel construction
Non-foaming for operational stability
Compatibility with gasifier feed gas contaminants
High solubility for HCN and NH3 allows removal without solvent degradation
Low heat requirements for regeneration because the solvent can be regenerated
by a simple pressure let down
2.8.2 Gas–liquid equilibrium in UniSim Design
The simulation of the two-stage Selexol process was conducted using UniSim
Design R400. Although the software is sufficient to represent the unit operations
involved in the process, particular effort was made to build a simulation tool that

66
would accurately represent the thermodynamic regime described previously and in
particular the gas–liquid equilibrium of the shifted syngas components entering the
Selexol process into the solvent. Despite the fact that the software allows for the
simulation of chemical absorption using amines with a customised package (Amine
package), there is no such facility when physical solvents are to be used. Therefore,
the software database has to be calibrated accordingly to obtain an accurate
prediction of the gas solubilities.
Initially, flash calculations were performed using the software to examine the
predicted behaviour of the gas system in the DEPG solvent. Since the equilibrium
calculations were far away from the experimental data reported in Table 2.6,
calibration of the software was essential in order to produce a model capable of
accurately representing the gas–liquid equilibrium of the acid gases in the DEPG
solvent. For the gas phase, the Peng–Robinson equation of state was used, but since
there is no option of imposing Henry’s law explicitly, it was implemented indirectly
by adjusting the software’s database. In UniSim Design R400 the Henry’s law
constant can be described by eq. (2-17):
ETDTCT
BAK lnln (2-17)
where T is the temperature in K.
The parameters A, B, C, D and E should be regressed so that the temperature
dependency of the Henry’s law is described correctly. Nevertheless, by integrating
eq. (2-16), we obtain:
constRT
HK
ln (2-18)
Hence, the only parameters having a physical meaning are A, being the
logarithm of the Henry’s law constant at the reference temperature, and B, being the
heat of absorption divided by the universal gas constant. Therefore, the parameters C,
D and E are not required and were set as zero in the regression. Table 2.9 shows the
original parameters in the UniSim database and the new regressed parameters. Figure
2.13 illustrates that after parameter regression, the simulation results were in good
agreement with the experimental data reported in the literature. Once the gas–liquid
equilibrium was described well, it was possible to move to the overall simulation of
the dual stage Selexol process.

67
Table 2.9: Original and regressed parameters of Henry’s law equation for acid gases in
Selexol
A B C D E
Original UniSim parameters
CO2 69.68 -3,892 -8.408 1.07∙10-3
1
H2S 37.84 -2,972 -3.395 -3.15∙10-3
1
Regressed UniSim parameters
CO2 13.828 -1,719.99 0 0 0
H2S 13.678 -2,297.20 0 0 0
Figure 2.13: Solubilities of CO2 and H2S in Selexol solvent at 25 C. The Y-axis reports
the gas partial pressure while the X-axis reports the component mole fraction in the
liquid phase. Dotted lines represent UniSim original curves, continuous lines represent
UniSim regressed curves, dots represent experimental obtained values by Xu et al.
(1992)
2.8.3 Proposed configuration
Several configurations have been proposed for the capture of CO2 using DEPG
in the Selexol process. In this section, the key point was to set the target for carbon
capture rate to be achieved in the two-stage Selexol process. Additionally, very few
0
200
400
600
800
1000
1200
1400
1600
1800
2000
0 0.1 0.2 0.3 0.4 0.5
yP
[kP
a]
x [-]
CO2
H2S
P

68
studies have presented a detailed scheme of the two-stage Selexol process
incorporated for carbon capture.
EPRI and DOE reports (EPRI, 1987; DOE, 2007) suggested an integrated
scheme for the two-stage Selexol process, which is shown in Figure 2.14. Both
schemes operate in two solvent loops, which perform both the H2S removal and the
CO2 capture stages. In the configuration described here, the gas product of the
WGSRs enters the first absorber where H2S is preferentially removed using solvent
from the CO2 absorber. The gas exiting the H2S absorber passes through the second
absorber where CO2 is removed using regenerated solvent from the flash drums,
combined with the thermally regenerated solvent from the bottoms of the stripping
column. The clean gas exits the absorber and is sent either directly to the combustion
turbine or is partially humidified prior to entering the combustion turbine depending
on the gasification technology incorporated.
The CO2-loaded solvent exits the CO2 absorber and some of it is sent to the
H2S absorber, while the rest of the solvent is sent to a series of flash drums for
regeneration. The gas from the first flash drum is recycled to the CO2 absorber while
the CO2 product stream is obtained from the other two flash drums. After flash
regeneration, the solvent is chilled and returned to the CO2 absorber.
The rich solvent exiting the H2S absorber enters the H2S concentrator and
partially flashes. The solvent exiting the H2S concentrator is sent to a flash drum and
while the gas stream is recycled to the H2S absorber, the liquid product is sent to the
stripper. The acid gas from the stripper is sent to the Claus plant for further
processing. The lean solvent exiting the stripper is then cooled and recycled to the
top of the CO2 absorber.
This scheme is capable of capturing 90% of the carbon contained in the coal
feed of the power plant. The H2S recovery target of this configuration is set to 99.5%
and at the same time the CO2 product should have less than 10 ppm H2S. The amount
of hydrogen recovered from the syngas stream is dependent on the Selexol process
design conditions. Herein, the hydrogen recovery is set at 99%. The degree of
dilution is a parameter that has been investigated for the integrated two-stage Selexol
process: the fresh solvent composition is 45% H2O and 55% DEPG by mole.

69
Figure 2.14: Simplified schematic of the integrated Selexol process (Kapetaki, 2015)
Table 2.10 shows the major components contributing to the energy
consumption of the two-stage Selexol unit.
t-syn
ga
s to
ga
s tu
rbin
e
CO
2
ab
so
rbe
r
H2S
ab
so
rbe
r
H2S
str
ipp
er
Acid
ga
s to
Cla
us p
lan
t
CO
2 p
rod
uct
to s
tora
ge
r-syn
ga
s
H2S
co
nce
ntr
ato
r
Wa
ter,
Se
lexo
l
M/U
t-syn
ga
s to
H2S
co
nce
ntr
ato
r
t-syn
ga
s
str
ipp
ing
ga
s
Co
nd
en
sa
te
to r
ecycle
1st f
lash
dru
m
3rd
fla
sh
dru
m
2n
d fla
sh
dru
m
Ma
in s
yn
ga
s fro
m
me
rcu
ry r
em
ova
l
Re
cycle
ga
s fro
m
Cla
us p
lan
tF
lash
dru
m
Le
an
so
lve
nt
Se
mi le
an
so
lve
nt
CO
2-la
de
n
so
lve
nt
H2S
-la
de
n
so
lve
nt
LP
ste
am
Co
nd
en
sa
te

70
Table 2.10: Energy requirements for two-stage Selexol process
Simulation parameter Value
H2S stripper duty [MWth] 14.60
CO2 compression power [MWe] 32.09
Auxiliary power consumption in dual-stage Selexol unit
Total auxiliary power consumption [MWe] 20.01
H2S concentrator stripping gas compressor 0.14
1st
flashed gas compressor 0.68
2nd
flashed gas compressor 0.32
Gas compressor for recycle gas from 1st
flash drum 0.74
H2S-laden solvent pump 0.10
CO2-laden solvent pump 0.04
Lean solvent pump 2.24
Semi-lean solvent pump 15.57
Sour gas compressor 0.20
2.9 CO2 compression and dehydration
The CO2-laden solvent leaving the CO2 absorber is depressurised in stages in
three flash drums in series operating at three pressure levels. Since the CO2-laden
solvent also contains a significant amount of hydrogen as well as CO2, the vapour
stream at the first HP flash drum is recycled to the CO2 absorber to minimise H2
losses to the CO2 product pipeline. The HP CO2 stream is flashed at 1.2 MPa,
compressed and recycled back to the CO2 absorber. The MP CO2 stream is flashed at
0.35 MPa. The LP CO2 stream is flashed at 0.11 MPa, compressed to 0.35 MPa and
combined with the MP CO2 stream. The combined stream is compressed from 0.35
MPa to a supercritical condition at 15.3 MPa using a multiple-stage, intercooled
compressor. During compression, the CO2 stream is cooled to 25 ºC. The final CO2
product is dehydrated to a dew point of -40 ºC with triethylene glycol and reaches
around 99% CO2 purity. A detailed schematic of the syngas clean-up is reported in
Figure 2.15.

71
Figure 2.15: Syngas clean-up schematic (Kapetaki, 2015)

72
2.10 Claus plant
The sulfur recovery plant is a Claus process where H2S is converted to
elemental sulfur. The original Claus process was developed by C. F. Claus in 1883.
Several process implementations have been developed to increase the sulfur
recovery. However, all these processes are based on the same principles, which are
primarily the oxidation of hydrogen sulfide at high temperatures and the formation of
sulfur at low temperatures (Wozny and Hady, 2011). The Claus process principal
objective is the recovery of sulfur more commonly from acid gas streams containing
hydrogen sulfide in high concentrations. These streams typically result from acid
gases stripped off sour liquids, such as processes utilising physical solvents for the
purification of sour gases, i.e., the Selexol process. The effluent gases from the Claus
plant are not valuable and are either vented to the atmosphere or directed to a tail gas
treatment unit (Kohl and Nielsen, 1997). Established regulations worldwide strictly
prohibit sulfur compounds to be vented to the atmosphere. Therefore, the Claus
process is of considerable significance within the general scope of IGCC power plant
technology. Furthermore, the Claus process yields elementary sulfur products that
are of extremely good quality (Kohl and Nielsen, 1997).
Complete conversion of hydrogen sulfide to elemental sulfur under Claus plant
operating conditions is precluded by the equilibrium relationships of the chemical
reactions upon which the process is based. As a result of this limitation, the basic
Claus process has to be supplemented with another process specifically designed to
remove residual sulfur compounds from the Claus plant tail gas (Kohl and Nielsen,
1997). These processes are usually referred to as “tail gas clean-up” or “tail gas
treating” processes.
Since the disclosure of the process by Claus in 1883, it has undergone several
modifications. The most significant modification was that made by Farbenindustrie
A.G. in 1936, which introduced the process concept currently in use, which consists
of a thermal conversion step followed by one or more catalytic conversion steps
(Kohl and Nielsen, 1997). A schematic of this configuration is shown in Figure 2.16
where two converters are considered.

73
Figure 2.16: Schematic of the Claus process with two converters (El-Bishtawi and
Haimour, 2004)
A detailed model of the modified Claus process reaction furnace and the
implications on plant design and recovery were presented by Monnery et al. (1993).
El-Bishtawi and Haimour (2004) developed a new modification on conventional
Claus process to increase the overall sulfur recovery as well as to decrease the costs.
The modification combined both oxygen enrichment and recycling. McIntyre and
Lyddon (1997) investigated different sulfur recovery options, classifying acid gas
into three different categories based on composition and discussing different types of
Claus process modifications that may be used to lower sulfur emissions to an
acceptable level. Monnery et al. (2000) performed an experimental campaign and
published a new kinetic rate expression for the Claus reaction.
In the conventional Claus process, one-third of the acid gas is oxidised to SO2
in the reaction furnace using air:
OHSOOSH 22222
3 (2-19)
This combustion generates a large amount of heat. Further, the combustion products
undergo Claus reaction between H2S and SO2 in the converters.
OHSSOSH 2222 22
32 (2-20)
Reaction (2-20) is a reversible exothermic reaction. Thus, processing under adiabatic
conditions greatly increases temperature, which lowers equilibrium conversion to

74
about 75%. Effluent gas from the reaction furnace passes through a waste heat boiler
to recover heat and produce high-pressure steam. The sulfur in the vapour phase
exists as S2, S
6, and S
8 molecular species mainly, with S
2 being predominant at
higher temperatures and S8 predominant at lower temperatures (Kohl and Nielsen,
1997). The sulfur species S2 in the effluent gas undergoes the following changes:
623 SS (2-21)
824 SS (2-22)
Effluent gas from the WHB is cooled in a condenser to condense sulfur. Condenser
effluent gas is preheated and is sent to two or three catalytic reactors where Claus
reactions occur at lower temperatures. This leads to a higher equilibrium conversion
since the Claus reaction is exothermic. Sulfur is recovered after each catalytic stage
by cooling converter effluent gas in a sulfur condenser. The overall sulfur conversion
obtained in the conventional Claus process is about 94–97% (Nobles, 1977).
The Claus process examined here refers to the configuration reported by the
DOE (2007) and has several modifications:
Three sulfur catalytic converters
Oxygen enrichment
Hydrogenation reactor
Utilising oxygen instead of air in the Claus plant reduces the overall cost of the
sulfur recovery plant. The sulfur plant produces approximately 5,364 kg/h of
elemental sulfur. Feed for this case consists of acid gas from both the acid gas clean-
up unit and a vent stream from the sour water stripper in the gasifier section. Vent
gas from the tail gas treatment unit is combined with a slipstream of clean syngas,
passed through an incinerator, and then the hot, nearly inert incinerator off-gas is
used to dry coal before being vented to the atmosphere. The furnace waste heat boiler
produces 14,100 kg/h of 47 bar steam, which provides all of the Claus plant process
needs and provides some additional steam to the medium-pressure steam header. The
sulfur condensers produce 3.4 bar steam for the low-pressure steam header.
The simulation of the Claus process was conducted using the commercial
software ProMax (BR&E, 2011). UniSim Design R400 does not allow differentiation
of sulfur species, resulting in different heats of condensation/vaporisation for sulfur

75
and affecting the amount of steam generated within the process (Kapetaki, 2015).
The model developed in ProMax to represent the H2S conversion with the
temperatures occurring in the operation of the Claus plant was validated with data
reported in the literature (Paskall, 1979). The model utilised runs in the so-called
“Sulfur” environment in the simulator. The Sulfur property package is a Gibbs
Excess Energy/Activity Coefficient model that is designed to model the liquid phase
properties and compositions of liquid sulfur.
As shown in Figure 2.17, the model is capable of describing the fact that the
average molecular weight of sulfur vapour increases with decreasing temperature. At
temperatures below 700 °F, sulfur vapour is predominately S6 and S8, while at the
same partial pressure, but at temperatures above l600 °F, the sulfur is mostly S2
(Kohl and Nielsen, 1997). The Claus plant can recover sulfur from the fuel gas
stream with an efficiency of up to 99.7%.
The detailed process schematic is exhibited in Figure 2.18.
Figure 2.17: Sulfur conversion to species with temperature (♦ S2, ■ S6, ▲ S8)
0
10
20
30
40
50
60
70
700 800 900 1000 1100 1200 1300 1400 1500 1600
Temperature [F]
S C
on
ve
rsio
n [
%]

76
Figure 2.18: Sulfur recovery and tail gas recycle schematic (Kapetaki, 2015)

77
2.11 Gas turbine
Clean syngas from the AGR plant is combined with a small amount of clean
gas from the CO2 compression process and partially humidified because the nitrogen
available from the ASU is insufficient to provide adequate dilution. The moisturised
syngas is reheated to 196 °C using HP boiler feedwater, diluted with nitrogen, and
then enters the combustion turbine (CT) burner. The advanced F Class turbine
produces 464 MW of total electric energy in the IGCC. The oxygen required for the
combustion is provided by compressed ambient air. It has been assumed that issues
interconnected with high H2 fuel combustion, such as flame stability, flashback and
NOX formation, would be overcome in the time frame needed to support deployment
(DOE, 2007).
A gas turbine when fired on low calorific value syngas has the potential to
increase power output due to the increase in flowrate through the turbine. The higher
turbine flow and moisture content of the combustion products can contribute to
overheating of turbine components, affect rating criteria for the parts lives, and
require a reduction in syngas firing temperatures (compared to the natural gas firing)
to maintain design metal temperature (Brdar and Jones, 2000). Ong’iro et al. (1995)
developed a model in Aspen Plus to study the effects of design and performance
parameters on the efficiency and emissions from IGCC and IGHAT (integrated
gasification humified air turbine) cycles. Chiesa et al. (2005) discussed the
possibility of burning hydrogen in a large, heavy-duty gas turbine designed to run on
natural gas as a possible short-term measure to reduce the greenhouse emissions of
the power industry. The effects of variations of volume flow rate and of
thermophysical properties on the matching between turbine and compressor and on
the blade cooling of the hot rows of the gas turbine were analysed in detail. Jones et
al. (2011) reported on how the net IGCC power is affected by the choice of fuel
diluents in the GT. Nitrogen and steam were considered as fuel diluents and their
concentrations were varied while maintaining the NOX level constant.
The considered firing temperature is 1,318–1,327 °C. The primary diluent used
in the combustor is nitrogen produced in the ASU. The advantages of using nitrogen
are (DOE, 2007):

78
Nitrogen from the ASU is already partially compressed and using it for
dilution eliminates wasting the compression energy
Limiting the water content reduces the need to de-rate firing temperature,
particularly in the high-hydrogen CO2 capture case
However, there are some disadvantages when using nitrogen as the primary diluent,
and these are (DOE, 2007):
There is a significant auxiliary power requirement to further compress the
large nitrogen flow from the ASU pressures of 4.2 and 13.1 bar to the CT
pressure of 32 bar
Nitrogen is not as efficient as water in limiting NOx emissions
The combustion products are expanded in the three-stage turbine-expander. The CT
exhaust temperature is nominally 566 °C, given the assumed ambient conditions,
back-end loss and HRSG pressure drop (DOE, 2007).
The air compressor, combustor and expander block were simulated using
UniSim Design R400. The schematic of the process investigated was based on the
configuration reported from DOE (2007) and is presented in Figure 2.19. The
combustor was modelled as a Gibbs reactor. With this model, the phase and chemical
equilibria of the outlet streams can be attained. The Gibbs reactor model does not use
a specified reaction stoichiometry to compute the outlet stream composition. The
product mixture composition is calculated under the condition that the Gibbs free
energy of the reacting system at equilibrium is at its minimum.
The air compressor allows for extraction of cooling air for which no
information is available in the report regarding the flow ratio, conditions etc.
Although, the turbine cooling air is a crucial issue and has been investigated in detail
elsewhere (Kim et al., 2009), in this study, the flow ratio was determined to match
the combustor outlet temperature, as reported in the DOE report (2007).

79
Fuel gas
Combustor
Ambient Air
Air to combustor
Turbine cooling air
N2 Diluent
To HRSG
Figure 2.19: Carbon capture Shell IGCC power block schematic
Simulation results involving the combustor outlet stream information are
reported in Table 2.11 along with the comparison from the DOE report (2007) data.
Table 2.11: Combustion turbine exhaust gas for carbon capture Shell IGCC compared
with DOE report (2007) data
DOE Simulation
Ar 0.0091 0.0091
CH4 0.0000 0.0000
CO 0.0000 0.0000
CO2 0.0063 0.0064
COS 0.0000 0.0000
H2 0.0000 0.0000
H2O 0.1258 0.1245
H2S 0.0000 0.0001
N2 0.7513 0.7516
NH3 0.0000 0.0000
O2 0.1075 0.1084
SO2 0.0000 0.0000
F (lb/h) 8,438,000 8,447,000
T (°F) 1,051 1,051
P (psia) 15.2 15.2

80
2.12 Heat recovery steam generation
The heat recovery steam generator (HRSG) is a horizontal gas flow, drum-
type, multi-pressure design that is matched to the characteristics of the gas turbine
exhaust gas (DOE, 2007). The flue gas exiting the combustor, after passing through
the gas turbine is directed to the HRSG to recover the large quantity of thermal
energy that it contains. The flue gas passes through the HRSG and exits at
approximately 132 °C. In addition to generating and superheating steam, the HRSG
provides the heat duties for the cold/hot reheat steams for the steam turbine,
condensate and feedwater heating, and deaeration of the condensate. Natural
circulation of steam is accomplished in the HRSG by utilising differences in
densities due to temperature differences of the steam. The natural circulation HRSG
provides the most cost-effective and reliable design (DOE, 2007).
Particular research effort has been given to the HRSG section of the IGCC
power plants, as there is big potential of increasing its efficiency and as a
consequence improving the overall performance of the power plant. Ganapathy
reported several aspects interconnected with HRSG operation in his published works
(Ganapathy, 1996; Ganapathy, 1997). Franco and Casarosa (2002) examined
different HRSG configurations, such as parallel sections and off-limit subcritical
conditions. Franco and Russo (2002) examined the effect of HRSG operating
parameters in its performance and they conducted a thermodynamic and thermo-
economic optimisation procedure to achieve higher combined cycle efficiencies.
Najafi and Najafi (2009) performed a multi-objective optimisation of the HRSG to
obtain optimum design parameters that yield the maximum efficiency and the
minimum capital cost.
The steam turbine consists of a HP section, an IP section and a LP section, all
connected to the generator by a common shaft. Steam from the HRSG is combined
with steam from the gasifier island and enters the turbine at 12.4 MPa/538 °C. The
steam initially enters the turbine near the middle of the high-pressure span, flows
through the turbine, and returns to the HRSG for reheating. The reheat steam enters
the IP section at 2.6 to 2.9 MPa and 538 °C. After passing through the IP section, the
steam is transported to the LP section. The steam is finally directed into the

81
condenser. The condensate is sent to the deaerator, through the gland steam
condenser, gasifier and low-temperature economiser section in the HRSG. The
system consists of one main condenser, condensate pumps and one gland steam
condenser. The feedwater from the deaerator is pumped to the various feedwater
streams from the HRSG. Feed pumps are provided for each of the three pressure
levels, HP, IP and LP.
2.12.1 Main and reheat steam systems
The function of the main steam system is to convey main steam generated in
the synthesis gas cooler (SGC) and the HRSG to the HP turbine. The function of the
reheat system is to convey steam from the HP turbine exhaust to the HRSG reheater
and to the turbine reheat stop valves.
Main steam at approximately 12.4 MPa and 538 °C exits the HRSG
superheater and is routed to the HP turbine. Cold reheat steam at approximately 3.1
to 3.4 MPa and 341 °C exits the HP turbine and flows to the HRSG reheater. Hot
reheat steam at approximately 2.9 MPa and 538 °C exits the HRSG reheater and is
routed to the IP turbines.
2.12.2 Circulating water system
The circulating water system is a closed-cycle cooling water system that
supplies cooling water to the condenser to condense the main turbine exhaust steam.
The system also supplies cooling water to the AGR plant as required, and to the
auxiliary cooling system. The auxiliary cooling system is a closed-loop process that
utilises a higher quality water to remove heat from compressor intercoolers, oil
coolers and other ancillary equipment, and then transfers that heat to the main
circulating cooling water system in plate and frame heat exchangers. The heat
transferred to the circulating water in the condenser and other applications is
removed by a mechanical draft-cooling tower.

82
2.12.3 Raw water and cycle makeup water systems
The raw water system supplies cooling tower makeup, cycle makeup, service
water and potable water requirements. The water source was assumed to be
groundwater (DOE, 2007).
The makeup water system provides high-quality demineralised water for makeup to
the HRSG cycle and for steam injection ahead of the water gas shift reactors in CO2
capture cases.
Compared to a non-capture case, the feedwater requirements for the Shell
IGCC equipped with carbon capture unit appear to be higher and this can be justified
with the inevitable increase of steam requirements in the WGSRs and in the quench
configuration for the gasifier.
The simulation of the HRSG, steam and feedwater systems is part of the
overall process flow diagram performed in UniSim Design R400, based on the data
reported on the DOE report (2007) and briefly mentioned above. The Peng–
Robinson equation of state was used for the flue gas properties and the ASME steam
package was used for the water properties calculation. Several assumptions and
operating conditions had to be assumed when information required to represent the
full operation of the systems was not available from the report. The validation of the
simulation results was examined for the IGCC case investigated. The simulation is
capable of faithfully replicating the gas path of the combined cycle, as presented in
the DOE report (2007). The steam path results were compared with the reported data
and the stream properties of the condenser outlet are presented in Table 2.12. The
schematics of this part of the IGCC power plant are shown in Figures 2.20 and 2.21.
Table 2.12: Condenser outlet streams validation carbon capture Shell IGCC compared
with DOE report (2007) data
DOE Simulation
H2O Vapour fraction 0.0 0.0
F (lb/h) 2,059,500 2,059,206
T (°F) 101.1 101.1
P (psia) 1.0 1.0

83
Figure 2.20: Combined cycle power generation schematic (Kapetaki, 2015)

84
Figure 2.21: Steam and feedwater schematic (Kapetaki, 2015)

85
2.13 Overall plant performances
Once each section of the IGCC was carefully studied and simulated, it was
possible to integrate all the units together in the same flow sheet in order to evaluate
the overall plant performances. UniSim Design R400 enables the calculation of mass
and energy balances around the units in cascade so that the outputs of a section will
be the inputs of the following section. The presence of recycled streams among the
units and targeted product specifications makes the calculations iterative until all the
tolerances are respected. Figure 2.22 shows the complexity of the fully integrated
flow sheet for the Shell IGCC with carbon capture simulation.
IGCC power plants will inevitably be subject to a drop in the overall plant
efficiency as a result of the retrofit of the carbon capture process. In case of
retrofitting the carbon capture process, it can be expected that additional fuel would
be fed to the gasifier in order to operate the same gas turbine. This is because the
heating value of the fuel gas will be reduced due to exothermic shift reaction so more
coal should be fed to the gasifier to compensate for the heat loss. In addition, the
different H2 and CO recoveries in the AGR units between the non-capture and
capture cases would also affect the coal input increment. In non-capture Shell IGCC,
the syngas temperature is allowed to decrease below the COS hydrolysis temperature
as long as the water content is more than what is required in the reaction. However,
in carbon capture Shell IGCC, the syngas temperature should be kept higher than 200
°C until it enters the shift reactor since the amount of water quench was determined
as the amount of water needed to saturate the syngas with water at this temperature.
Table 2.13 shows the overall plant performances for the non-capture and
capture cases and demonstrates an efficiency drop larger than that reported by the
DOE (2007). The overall carbon capture rate defined in eq. (2-23) was set at 90%.
1002
slaginCarboncoalinCarbon
productCOinCarboncapturecarbonOverall (2-23)
The overall net plant efficiency was reduced mainly because of the higher power
consumption in the AGR unit predicted in this study. The energy penalty relating to
carbon capture is summarised in Table 2.14 while all the auxiliary consumptions
occurring in each section are presented in Table 2.15.

86
Figure 2.22: Fully integrated IGCC simulation flow sheet in UniSim Design R400
environment

87
Table 2.13: Comparison of DOE report (2007) data and simulation
Plant Performance (MWe)
Shell IGCC non-
capture
Shell IGCC with
capture
DOE This work DOE This work
Power summary
Thermal input (MWth) 1,547 1,547 1,618 1,618
Gas turbine power 464.0 464.0 463.6 464.0
Steam turbine power 284.0 284.0 230.0 230.0
Total power generation 748.0 748.0 693.6 694.0
Total Auxiliaries 112.2 111.4 176.4 189.2
Net Power 635.9 636.6 517.1 504.8
Net power plant
efficiency (HHV), % 41.1 41.1 32.0 31.2
Table 2.14: Simulated energy penalty in Shell IGCC with capture
Source of energy penalty Energy change Energy penalty
Heat input increase, kWth 70,279 –
Gas turbine, kWe 0 1.30 %
Steam turbine, kWe 54,046 4.14 %
Gross power generation, kWe 54,046 5.44 %
Auxiliary total, kWe 77,783 4.50 %
Total, kWe 131,829 9.94 %

88
Table 2.15: Auxiliary consumptions comparison between non-capture and carbon
capture IGCCs (DOE, 2007)
Shell IGCC
without capture
Shell IGCC
with capture
Coal handling 430 440
Coal milling 2,110 2,210
Slag handling (and dewatering) 540 570
Air separation unit auxiliaries 1,000 1,000
Air separation unit main air
compressor 41,630 62,970
Oxygen compressor 10,080 10,540
Nitrogen compressor 37,010 38,670
Syngas recycle compressor 1,650 0
Incinerator air blower 160 160
CO2 compressor – 28,050
Boiler feedwater pumps 4,670 3,290
Condensate pump 230 310
Flash bottom pump 200 200
Circulating water pumps 3,150 3,440
Cooling tower fans 1,630 1,780
Scrubber pumps 120 390
Selexol/Sulfinol unit auxiliaries 660 15,500
Gas turbine auxiliaries 1,000 1,000
Steam turbine auxiliaries 100 100
Claus plant auxiliaries 250 250
Miscellaneous balance of plant 3,000 3,000
Transformer loss 2,550 2,550
Total, kWe 112,170 176,420
2.14 Conclusions
When it comes to retrofitting IGCC power plants with CO2 capture processes,
almost all the parts of the conventional non-capture plant are affected. It is expected
that there will be increments in the fuel that is fed to the gasifiers to operate the same

89
gas turbine. It was found that the energy penalty associated with the capture process
reaches approximately 10% for the Shell IGCC.
Water gas shift reactors are an essential addition to the IGCC power plant
when it has to be operated with retrofitted carbon capture process. In order to
promote the conversion of CO to CO2, IP steam extracted from the steam cycle has
to be added. The conversion occurring is around 95.7%. The dual-stage Selexol
process is the state-of-art technology to be used for IGCC in order to not only to
remove H2S, but also to capture CO2. The CO2 compression train downstream of the
CO2 capture process is another additional component to the carbon capture IGCCs
where the CO2 product is compressed up to a pressure suitable for CO2 transport and
storage. The EP ASU part of the power plant is not modified as such for carbon
capture operation of the power plant. One obvious, yet significant, change in the
carbon capture IGCC case is the fact that there is no potential for air integration
between the GT compressor and the EP ASU. In the non-capture case about 4% of
the GT air is used to supply approximately 19% of the ASU requirements.
Conversely, since in the capture case most of CO2 is removed prior to the
combustion, once the syngas is diluted to the target heating value specified by the
combustion turbine vendor (around 4.5-4.8 MJ/Nm3; DOE, 2007), all of the available
combustion air is required to maintain mass flow through the turbine and hence
maintain power output. The steam cycle has to be redesigned mainly in order to
provide steam to the water gas shift reactors.
Most of the discussed modifications necessary for the carbon capture operation
of the IGCC power plant are inter-linked with an effect in the performance of the
plant and an energy penalty, which is interpreted as the loss in the net plant
efficiency.
References
Bhattacharyya D, Turton R, Zitney SE. Steady-state simulation and optimization of an
Integrated Gasification Combined Cycle Power Plant with CO2 capture. Industrial &
Engineering Chemistry Research 2010; 50: 1674-1690.
BR&E. ProMax, 2011.

90
Brdar RD, Jones RM. GE IGCC Technology and experience with advanced gas turbines.
Schenectady; GE Power Systems, 2000.
Burr B, Lyddon, L. A comparison of physical solvents for acid gas removal. 87th Annual
GPA Convention 2008, Grapevine.
Castle WF. Modern liquid pump oxygen plants: Equipment and performance, Cryogenic
Processes and Machinery. Eighth Intersociety Cryogenic Symposium 1991, Houston.
Chen C. A technical and economic assessment of CO2 capture technology for IGCC power
plants. Pittsburgh, 2005. PhD Thesis.
Chiesa P, Consonni S. Shift reactors and physical absorption for low-CO2 emission IGCCs.
Journal of Engineering for Gas Turbines and Power-transactions of The Asme 1999; 121:
295-305.
Chiesa P, Consonni S, Kreutz T, Williams R. Co-production of hydrogen, electricity and
CO2 from coal with commercially ready technology. Part A: Performance and emissions.
Hydrogen Energy 2005; 30: 747-767.
Collot AG. Matching gasifiers to coals IEA Clean Coal Centre, IEA 2002.
Cormos CC. Evaluation of energy integration aspects for IGCC-based hydrogen and
electricity co-production with carbon capture and storage. Hydrogen Energy 2010; 35: 7485-
7497.
Cormos CC, Agachi PS. Integrated assessment of carbon capture and storage technologies in
coal-based power generation using CAPE tools. 22 European Symposium on Computer
Aided Process Engineering 2012; 30: 56-60, London.
Cormos CC, Starr F, Tzimas E, Peteves S. Innovative concepts for hydrogen production
processes based on coal gasification with CO2 capture. Hydrogen Energy 2008; 33: 1286-
1294.
Cornelissen RL, Hirs GG. Exergy analysis of cryogenic air separation. Energy Conversion &
Management 1998; 39: 1821-1826.
Damen K, van Troost M, Faaij A, Turkenburg W. A comparison of electricity and hydrogen
production systems with CO2 capture and storage. Part A: Review and selection of promising

91
conversion and capture technologies. Progress in Energy and Combustion Science 2006; 32:
215-246.
Doctor RD, Molburg JC, Thimmapuram PR. KRW oxygen-blown gasification combined
cycle carbon dioxide recovery, transport, and disposal. ANL/ESD-34 1996.
DOE NETL. Cost and performance baseline for fossil energy plants; 2007.
El-Bishtawi R, Haimour N. Claus recycle with double combustion process. Fuel Processing
Technology 2004; 86: 245-260.
Emun F, Gadalla M, Majozi T, Boer D. Integrated gasification combined cycle (IGCC)
process simulation and optimization. Computers and Chemical Engineering 2010; 34: 331-
338.
EPRI. Process screening study of alternative gas treating and sulphur removal systems for
IGCC power plant applications. Mountain View, 1987.
Foster Wheeler. Potential for improvement in gasification combined cycle power generation
with CO2 capture. Report No. PH4/19 2003.
Franco A, Casarosa C. On some perspectives for increasing the efficiency of combined cycle
power plants. Applied Thermal Engineering 2002; 22: 1501-1518.
Franco A, Russo A. Combined cycle plant efficiency increase based on the optimization of
the heat recovery steam generator operating parameters. International Journal of Thermal
Sciences 2002; 41: 843-859.
Fu C, Gundersen T. Using exergy analysis to reduce power consumption in air separation
units for oxy-combustion processes. Energy 2012; 44: 60-68.
Ganapathy V. Heat-recovery steam generators: understand the basics. Chemical Engineering
Progress 1996.
Ganapathy V. Generating steam efficiently from cogeneration plants. Chemical Engineering
Progress 1997.
Haslbeck JL. Evaluation of fossil power plants with CO2 recovery. Parsons Infrastructure &
Technology Group Inc. 2002.

92
Henni A, Tontiwachwuthikul P, Chakma A. Solubility of carbon dioxide, methane and
ethane in fourteen promising physical solvents for gas sweetening. Greenhouse Gas Control
Technologies 2005; 7: 1887-1889.
Higman C, van der Burgt M. Gasification 2003, Elsevier.
Honeywell. UniSim Design R400, 2011.
Huang Y, Rezvani S, McIlveen-Wright D, Minchener A, Newitt N. Techno-economic study
of CO2 capture and storage in coal fired oxygen fed entrained flow IGCC power plants. Fuel
Processing Technology 2008; 89: 916-925.
IEA CCC (Clean Coal Centre). The world coal-fired power plants database 2005.
IPCC. Special report on carbon dioxide capture and storage. 2005.
Jones D, Bhattacharyya D, Turton R, Zitney ES. Optimal design and integration of an air
separation unit (ASU) for an integrated gasification combined cycle (IGCC) power plant
with CO2 capture. Fuel Processing Technology 2011; 92: 1685-1695.
Kapetaki Z. Analysis of Integrated Gasification Combined Cycle power plants and process
integration with pre-combustion carbon capture. PhD thesis, 2015; The University of
Edinburgh.
Kapetaki Z, Ahn H, Brandani S. Detailed process simulation of pre-combustion IGCC plants
using coal-slurry and dry coal gasifiers. Energy Procedia 2013; 37: 2196-2203.
Kim YS, Lee JJ, Cha KS, Kim TS, Sohn JL, Joo YJ. Analysis of gas turbine performance in
IGCC plants considering compressor operating condition and turbine metal temperature.
ASME TURBO EXPO 2009; New York.
Kohl AO, Nielsen RB. Gas purification, Gulf Publishing Co., 1997; Houston.
Kreutz T, Williams R, Consonni S, Chiesa P. Co-production of hydrogen, electricity and
CO2 from coal with commercially ready technology. Part B: Economic analysis. Hydrogen
Energy 2005; 7: 769-784.
Latimer RE. Distillation of air. Chem. Eng. Progress 1967; 63: 35-59.
Maurstad O, Herzog H, Bolland O, Beer J. Impact of coal quality and gasifier technology on
IGCC performance, 2009.

93
McDaniel JE, Hornick MJ. Tampa electric polk power station integrated gasification
combined cycle project, Final technical report to the National Energy Technology
Laboratory 2002.
McIntyre G, Lyddon L. Claus sulphur recovery options. Technical paper; Petroleum
Technology Quarterly Spring 1997: 57-61.
Mendes D, Chibante V, Zheng JM, Tosti S, Borgognoni F, Mendes A, Madeira LM.
Enhancing the production of hydrogen via water–gas shift reaction using Pd-based
membrane reactors. Hydrogen Energy 2010; 35: 12596-12608.
Minchener AJ. Coal gasification for advanced power generation. Fuel 2005; 84: 2222-2235.
Monnery WD, Svrcek WY, Behie LA. Modelling the modified Claus process reaction
furnace and the implications on plant design and recovery. The Canadian Journal of
Chemical Engineering 1993; 71: 711-724.
Monnery WD, Hawboldt KA, Pollock A, Svrcek WY. New experimental data and kinetic
rate expression for the Claus reaction. Chemical Engineering Science 2000; 55: 5141-5148.
Ng KS, Lopez Y, Campbell GM, Sadhukhan J. Heat integration and analysis of decarbonised
IGCC sites. Chemical Engineering Research and Design 2010; 88: 170-188.
Najafi H, Najafi B. Multi-objective optimization of a fire-tube heat recovery steam generator
system. Electrical Power & Energy Conference (EPEC), 2009.
Nobles JE. Plant performance process. Hydrocarbon Processing 1977; 56: 143-145.
O’Keefe LF, Griffiths J, Weissman RC, De Puy RA, Wainwright JM. A Single IGCC Design
for Variable CO2 Capture. Fifth European Gasification Conference 2002.
Ong'iro AO, Ugursal VI,Al Taweel AM, Blamire DK. Simulation of combined cycle power
plants using the Aspen Plus Shell. Heat Recovery System & CHP 1995; 15: 105-113.
Padurean A, Cormos CC, Agachi PS. Pre-combustion carbon dioxide capture by gas–liquid
absorption for Integrated Gasification Combined Cycle power plants. International Journal of
Greenhouse Gas Control 2012; 7: 1-11.
Paskall HG. Capability of the Modified Claus Process. Alberta/Canada Energy Resources
Research Fund, 1979.

94
Puigjaner L. Syngas from Waste: Emerging Technologies 2011, Springer.
Ranke G, Mohr VH. The Rectisol wash: New developments in acid gas removal from
synthesis gas. Acid and Sour Gas Treating Processes 1985; pp. 80-111.
Robinson PJ, Luyben WL. Integrated Gasification Combined Cycle dynamic model: H2S
absorption/stripping, water-gas shift reactors, and CO2 absorption/stripping. Industrial &
Engineering Chemistry Research 2010; 49: 4766-4781.
Salazar JM, Diwekar UM, Zitney SE. Rigorous-simulation pinch-technology refined
approach for process synthesis of the water–gas shift reaction system in an IGCC process
with carbon capture. Computers and Chemical Engineering 2011; 35: 1863-1875.
Sandler SI. Chemical Engineering Thermodynamics, 3rd
Edition 1999.
Sciamanna SF, Lynn S. Solubility of hydrogen sulfide, sulfur dioxide, carbon dioxide,
propane, and n-butane in poly(glycol ethers). Industrial & Engineering Chemistry Research
1988; 27: 492-499.
Simbeck DR. World gasification survey: industrial trends and developments. Gasification
Technology Conference 2001, San Francisco.
Simbeck DR, Korens DR, Biasca FE, Vejtasa S, Dickenson RL. Coal gasification
guidebook: status, applications, and technologies. Electric Power Research Institute (EPRI);
1993.
Smith JM, Van Ness HC, Abbott MM. Introduction to Chemical Engineering
Thermodynamics, 7th Edition 2005.
Sweny JW, Valentine JP. Physical solvent stars in gas treatment/purification. Chemical
Engineering 1970: 54-56.
Thorogood RM. Developments in air separation. Gas Separation & Purification 1991; 5: 83-
94.
Wabash River Energy Ltd. Wabash river coal gasification repowering project, Final
technical report to the National Energy Technology Laboratory 2000.
Wall TF. Combustion processes for carbon capture. Proceedings of the Combustion Institute
2007; 31: 31-47.

95
Wozny G, Hady L. Process Engineering and Chemical Plant Design. Berlin,
Universitatsverlag der TU Berlin, 2011.
Xu Y, Schutte RP, Hepler LG. Solubilities of carbon dioxide, hydrogen sulfide and sulfur
dioxide in physical solvents. The Canadian Journal of Chemical Engineering 1992; 70: 569-
573.
Zheng L, Furinsky E. Comparison of Shell, Texaco, BGL and KRW gasifiers as part of
IGCC plant computer simulations. Energy Conversion and Management 2005; 46: 1767-
1779.

96
Chapter 3: Fundamentals of adsorption and pressure
swing adsorption processes
The separation and purification of gas mixtures using adsorption systems is
widely used in the chemical, petrochemical, environmental, medical and electronic
gas industries (Keller et al., 1987; Sircar, 2000). According to the operating
conditions, the commercial adsorbents may allow different mass transfer
mechanisms between the gas and solid phases (Ruthven, 1984; Yang 1987; Suzuki,
1990), leading to different sets of partial differential equations (PDEs) to model the
adsorption dynamics. In formulating mathematical models for pressure swing
adsorption (PSA) processes, several assumptions can be made to simplify the
problem without losing the accuracy of the solution (Sircar and Hufton, 2000). The
overall performance of a PSA process depends on both equilibrium and kinetic
factors, but the relative importance of these factors varies greatly depending on the
system it is being applied to. The majority of PSA processes are equilibrium-driven
in a sense that the selectivity depends on differences in the equilibrium affinities
(Ruthven et al., 1994).
Fundamentals of adsorption phenomena and industrial PSA cycles for
hydrogen purification will be discussed in this chapter.
3.1 Adsorbents
The use of adsorption as a separation unit operation is based on the selective
retention of the gas molecules in the pores of the adsorbent (Ruthven, 1984); this
selective retention may be caused by differences in the adsorption equilibrium or in
the adsorption rate. The molecules of a gas mixture in the neighbourhood of a solid
experience a reduction in their potential energy due to the interaction forces between
the atoms of the solid and the gaseous molecules; consequently, the gas molecules
will tend to concentrate in this region leading to larger density in comparison with
the free gas phase zone. The nature of the surface forces will depend on the
adsorbent and the sorbates. If the interactions between the adsorbent and the sorbates
are Van der Waals forces or dipole fields, the phenomena can be classified as

97
physisorption; in the case that a transfer of electrons between the gas and the solid
phase takes place, a chemisorption phenomenon will occur (Ruthven, 1984).
The role of the adsorbents is to provide the surface area for the selective
sorption to take place: the specific selectivity and the adsorption capacity are
important factors that must be taken into account when choosing the sorbent as well
as the operating conditions for gas separation. The selectivity may be a consequence
of the “chemical similarity” (equilibrium-driven sorbents) between the surface of the
solid and the sorbate or else caused by steric restriction (kinetically driven sorbents).
According to the IUPAC classification, pores are divided into three categories:
Micropores: < 20 Å
Mesopores: 20–500 Å
Macropores > 500 Å
In a micropore, the guest molecule never escapes from the field of the solid surface,
even at the centre of the pore. It is therefore reasonable to consider all the molecules
within a micropore to be in the adsorbed phase. By contrast, in mesopores and
macropores, the molecules in the central region of the pore are essentially free from
the force field of the surface; therefore, it becomes physically reasonable to consider
the pore as a two-phase system containing both adsorbed molecules at the surface
and free gaseous molecules in the central region. Of course, the IUPAC classification
is arbitrary but PSA processes deal generally with relatively small molecules up to 20
Å. Commercial adsorbents can be classified into hydrophilic or hydrophobic,
amorphous or crystalline, as summarised in Table 3.1.
Table 3.1: Classification of commercial adsorbents
Equilibrium selective Kinetically selective
Hydrophilic Hydrophobic Amorphous Crystalline
Activated alumina
Silica gel
Al-rich zeolites
Polymeric resins
Activated carbon
Silicalite™
Other polymeric
resins
Carbon molecular
sieves (CMS) Small-pore zeolites

98
In the case of the equilibrium-driven sorbents, the gas separation is based on
the chemical similarity between the solid surface and the sorbate. The hydrophilic
adsorbents tend to retain polar molecules such as water or other polar gases/liquids;
on the contrary, activated carbon (hydrophobic) will be highly selective for the non-
polar species.
The most important characteristic of a sorbent is its high porosity. Thus,
physical characterisation is equally important as chemical characterisation. The
microporous structure of the sorbent can be characterised by standard techniques.
The most important physical characteristics include pore volume, pore size
distribution and surface area. Also of practical importance are bulk density, crush
strength and abrasion resistance. Many commercial adsorbents consist of composite
particle crystals (or char particles) aggregated together and formed into a
macroporous pellet, often with the aid of a binder. Such particles have a well-defined
bimodal pore size distribution in which the first peak represents the micropores and
the second peak represents the large intraparticle pores resulting from the
pelletisation process, as shown for 5A zeolite in Figure 3.1.
Figure 3.1: Pore size distribution for pelleted 5A zeolite (Ruthven et al., 1994)

99
Table 3.2 reports the physical properties of some common adsorbents and their
major uses for gas sorption. The following subsections are devoted to a brief
summary of the most important commercial adsorbents.
Table 3.2: Physical properties of some common adsorbents and their industrial
application (Yang, 1987; Ruthven et al., 1994)
Adsorbent
Specific
pore
volume
(cm3/g)
Average
pore
diameter
(Å)
Pore
size
distribution
Specific
area
(m2/g)
Particle
density
(g/cm3)
Major
applications
Silica gel 0.43 22 Unimodal 800 1.09 Drying
Gas chromatog.
Activated
alumina 0.50 30–3000 Unimodal 320 1.28
Drying
Gas chromatog.
Activated
carbon 0.15–0.5 Wide range Bimodal 200–2000 0.6–0.9
Removal of
VOCs
H2 purification
Carbon
molecular
sieve
0.25 - Bimodal 400 0.98 Air separation
Landfill gas
separation
Zeolites 0.26 < 10 Bimodal 430 1.12
Drying
H2 purification
Air separation
Aromatics
separation
Iso-paraffins
separation
Gas chromatog.
Carbon capture
3.1.1 Silica gel
Silica gel is a partially dehydrated form of polymeric colloidal silicic acid. The
chemical composition can be expressed as SiO2·nH2O. A variety of methods for the
manufacture of silica gel have been described, including the hydrolysis of soluble
alkali metal silicates with acid and the direct removal of sodium from sodium silicate
solutions by ion exchange (Ruthven, 1984). The presence of hydroxyl groups imparts
a degree of polarity to the surface so that polar molecules, such as water, alcohols,
phenols and amines and unsaturated hydrocarbons, are adsorbed in preference to
non-polar molecules, such as saturated hydrocarbons. Although water is adsorbed
more strongly on molecular sieves than on alumina or silica gel, the ultimate capacity
of silica gel, at least at low temperatures, is generally higher. Silica gel is therefore a

100
useful desiccant where high capacity is required at low temperature and moderate
vapour pressures.
3.1.2 Activated alumina
Activated alumina is a porous high-surface-area form of aluminium oxide,
prepared either from bauxite (Al2O3·3H2O) or from the monohydrate by dehydration
and recrystallisation at elevated temperature. The surface is more strongly polar than
that of silica gel and has both acid and basic character, reflecting the amphoteric
nature of the metal. At elevated temperature, the capacity of activated alumina is
higher than that of silica gel and it is therefore commonly used as a desiccant for
drying warm air or gas streams. However, for this application it has been largely
replaced by molecular sieve adsorbents, which exhibit both a higher capacity and a
lower equilibrium vapour pressure under most conditions of practical importance
(Ruthven, 1984).
3.1.3 Activated carbon
Activated carbon is normally made by thermal decomposition of carbonaceous
material followed by activation with steam or carbon dioxide at an elevated
temperature (700–1100 °C). The activation process essentially involves the removal
of tarry carbonisation products formed during the pyrolysis, thereby opening the
pores. The structure of activated carbon consists of elementary microcrystallites of
graphite, but these microcrystallites are stacked together in random orientation and it
is the spaces between the crystals that form the micropores. The surface of carbon is
essentially non-polar, although a slight polarity may arise from surface oxidation. As
a result, carbon adsorbents tend to be hydrophobic and organophilic. They are
therefore widely used for the adsorption of organics in decolourising sugar and oil,
water purification and solvent recovery systems, as well as for the adsorption of
gasoline vapours in automobiles and as a general-purpose adsorbent in air
purification systems (Ruthven, 1984).

101
3.1.4 Carbon molecular sieves
Activated carbon adsorbents generally show very little selectivity in the
adsorption of molecules of different sizes. However, by applying special activation
procedures it is possible to prepare carbon adsorbents with a very narrow distribution
of micropore size and which therefore behave as molecular sieves. Most commercial
carbon sieves are prepared from anthracite or hard coal by controlled oxidation and
subsequent thermal treatment. By these means, it is possible to prepare carbon
molecular sieves with effective micropores diameters ranging from about 4 to 9 Å
(Ruthven, 1984). The micropore size distribution of such sieves is much narrower
than in a typical activated carbon and both porosity and adsorptive capacity are
generally much smaller. Nevertheless, the kinetic selectivities that may be attained
with a well-prepared carbon sieve are remarkably high. At present, the most
important large-scale application is air separation. Another potential area of
application includes the clean-up of the off-gases from nuclear facilities.
3.1.5 Polymeric resins
The use of synthetic adsorbent polymers, particularly in drinking water
treatment, arose from the development in polymer science technology, allowing the
production of highly porous polymers of 800-1500 m2/g, which is similar to the
surface of activated carbons. Polymeric resins are characterized by lower energy
demand and, consequently, lower costs of regeneration or renewal of the adsorbents
in comparison with carbonaceous materials. Their main application consists in the
removal of various organic compounds including phenols, pharmaceuticals and
pesticides from aqueous solutions (Lin and Juang, 2009). Resins (synthetic or
natural) have also become popular and been used more and more frequently in high
performance liquid chromatography (HPLC) practice for the separation and
quantitative determination of commercial pesticides (Kyriakopoulos and Doulia,
2006).

102
3.1.6 Mesoporous silica
Silicate mesoporous materials possess well-defined pore sizes of about 2.0-
10.0 nm and surpass the pore-size constraint (<2.0 nm) of microporous zeolites. They
also have extremely high surface areas (>700 m2/g) and narrow pore size
distributions. Instead of using small organic molecules as templating compounds, as
in the case of zeolites, long chain surfactant molecules are employed as the structure-
directing agent during the synthesis of these highly ordered materials. The structure,
composition, and pore size of these materials can be tailored during synthesis by
variation of the reactant stoichiometry, the nature of the surfactant molecule, the
auxiliary chemicals, the reaction conditions, or by post-synthesis functionalisation
techniques (ALOthman, 2012). Mesoporous silica have generally received interest
because of their potential applications as supports for catalysis, gas separation,
selective adsorption and novel functional materials. Recently, it has been reported
that mesoporous silica nanoparticles as drug delivery systems show significant
advantages over traditional drug nano-carriers (Tang et al., 2012).
3.1.7 Zeolites
Zeolites are alumino-silicate crystallines containing alkali or alkali-earth
elements, such as sodium, potassium and calcium. The cations are necessary to
balance the electrical charge of the aluminium atoms, each having a net charge of -1.
The water molecules can be removed with ease upon heat and evacuation, leaving an
almost unaltered alumino-silicate skeleton with a void fraction between 0.2 and 0.5
(Yang, 1987). The skeleton has a regular structure of cages, which are usually
interconnected by six windows in each cage. The cages can imbibe or occlude large
amounts of guest molecules in place of water. The size of the window apertures,
which can be controlled by fixing the type and number of cations, ranges from 3 to
10 Å (Yang, 1987). The sorption may occur with great selectivity because of the size
of the aperture, hence the name molecular sieve.
The primary structural units of zeolites are the tetrahedra of silicon and
aluminium, SiO4 and AlO4. These units are assembled into secondary polyhedral
building units, such as cubes, hexagonal prisms, octahedra and truncated octahedra.
The silicon and aluminium atoms, located at the corners of the polyhedral, are joined

103
by a shared oxygen atom. The final zeolite structure consists of assemblages of the
secondary units in a regular three-dimensional crystalline framework. The ratio of
Si/Al is commonly one to five. The aluminium atom can be removed and replaced by
silicon in some zeolites, thereby reducing the number of cations, and the cations can
also be exchanged. The inner atoms in the windows are oxygen. The size of the
windows depends on the number of oxygen atoms in the ring, four, five, six, eight,
ten or 12. The aperture size, as well as the adsorptive properties, can be further
modified by the number and type of exchanged cations. The structural unit in type A
zeolite, as well as in types X and Y, is the truncated octahedron, as shown in Figure
3.2a. This unit is also called a sodalite cage, as sodalite is formed by directly fusing
the four-member rings of the unit. The sodalite units can also be linked through four-
member prisms or six-member prisms, generating type A zeolite and types X and Y
zeolites, respectively (Figure 3.2b). Commercial zeolites are used in a wide range of
applications, as seen in Table 3.2.
Figure 3.2a: Representation of a sodalite cage or truncated octahedron (Manske, 2009)

104
Figure 3.2b: Representation of type A zeolite unit cell (left) and unit cell of types X and
Y, or faujasite (right) (Averill and Eldredge, 2007)
3.1.8 Metal organic frameworks (MOFs)
MOFs are comprised of transition metal ions linked by organic ligand bridges
and assembled principally through strong coordination bonds. MOFs have
geometrically and crystallographically well-defined framework structures and in
most cases, these structures are robust enough to allow the removal of the included
guest species resulting in permanent porosity. The crystallinity of MOFs also allows
precise structural characterization by diffraction methods, thus facilitating their
rational design and the formulation of structure–function relationships. MOFs can be
conceptually designed and synthesized based on how building blocks come together
to form a net (an example is shown in Figure 3.3). MOFs can be made with
exceptionally high porosity and are typically synthesized by a self-assembly reaction
between various metal ions and organic linkers under mild conditions. MOFs hold
several records in porous materials including highest surface areas, hydrogen uptake
based on physical adsorption, methane and CO2 storage (Li et al., 2011). As porous
material, MOFs are therefore ideal adsorbents or membrane materials for gas storage
and separation, including CO2 capture due to their large surface areas, adjustable
pore sizes, and controllable pore surface properties.

105
Figure 3.3: X-ray crystal structure of indium soc-MOF, in which (a) is a cluster of
metal ions, (b) is an organic linker, (c) and (d) are representations of a cuboidal cage of
indium soc-MOF and (e) is a space filling representation of the framework viewed
along the y-direction (Wang et al., 2011)
3.2 Adsorption equilibrium
The adsorbed layer at the surface of a solid may be regarded as a distinct phase
in the thermodynamic sense. Equilibrium with the surrounding gas is governed by
the ordinary laws of thermodynamics. Physical adsorption from the gas phase is an
exothermic process, so equilibrium favours adsorption at lower temperatures and
desorption at higher temperatures. At sufficiently low concentrations, the equilibrium
relationship generally approaches a linear form (Henry’s law):
PKq ' or CKq (3-1)
and the constant of proportionality (K’ or K) is referred to as the Henry’s law
constant. It is evident that the Henry constant is simply the adsorption equilibrium
constant, and the temperature dependence can be described by the van’t Hoff
relations:
RTHeKK /
0'' or RTUeKK /
0
(3-2)
where ΔH = ΔU + RT is the enthalpy change on adsorption. Since for an exothermic
process ΔH and ΔU are negative, the Henry’s law constant decreases with increasing
temperature. At higher concentrations, the equilibrium relationship becomes curved.

106
The first systematic attempt to interpret adsorption isotherms for gas–solid
equilibria was introduced by Brunauer et al. (1938), who classified isotherms for
physical adsorption into five types. This classification has become the core of the
modern IUPAC classification (1985) together with an additional isotherm introduced
much later by Sing. The IUPAC classification is illustrated in Figure 3.4.
Figure 3.4: The IUPAC classification for adsorption isotherms (IUPAC, 1985)
The type I isotherm function corresponds to true microporous adsorbents for which
the pore size is not very much greater than the molecular diameter; for those
adsorbents, there is a definite saturation limit that is associated with complete filling
of the micropores. The type V isotherm can be observed if there is a strong molecular
interaction. An isotherm of type IV suggests the formation of two surface layers,
either on a plane surface or on the wall of a pore very much wider than the molecular
diameter of the sorbate. Types IV and V show adsorption hysteresis. The types II and
III isotherms are generally observed only in those adsorbents for which there is a
wide range of pore sizes (mesoporous and macroporous); in such systems there is a
continuous progression with increasing loading from monolayer to multilayer
adsorption and then to capillarity condensation taking place in the pores, which
enables a drastic increase of capacity when the pressure of the gas mixture is raised
(Ruthven, 1984). Finally, the new type VI isotherm has steps that are typical of
multi-layering.

107
When the dynamics of adsorption systems is under study, it is useful to define
the concept of a favourable and linear as well as a non-favourable adsorption
isotherm. This concept is based on the plot (x, y) shown in Figure 3.5. The
definitions for x and y are presented in the axis of the plot. As can be seen from the
plot, in the case of favourable adsorbents, the dimensionless adsorbed concentration
(x) is always larger than the dimensionless concentration (y) in the gas phase. Since
for desorption the initial and final states are reversed, an isotherm that is favourable
for adsorption will be unfavourable for desorption and vice versa.
Figure 3.5: Dimensionless equilibrium isotherms
The simplest theoretical model for monolayer adsorption was formulated by
Langmuir (1918). The Langmuir model was originally developed to represent
chemisorption on a set of distinct localised adsorption sites. The basic assumptions
on which the model is based are:
Molecules are adsorbed at a fixed number of well-defined localised sites
Each site can hold one adsorbate molecule
All sites are energetically equivalent
There is no interaction between molecules adsorbed on neighbouring
sites
The model can be described by:
o
o
c
cc
o
o
q
Favourable
Linear
Unfavourable

108
Pb
Pbqq s
1 (3-3)
This expression shows the correct asymptotic behaviour for monolayer adsorption
since at saturation P → ∞, q → qs while at low sorbate concentration it becomes the
Henry’s law constant:
'lim0
KqbP
qs
P
(3-4)
qs is supposed to represent a fixed number of surface sites and therefore it should be
constant regardless of temperature while the temperature dependence of the
equilibrium constant should follow a van’t Hoff equation:
TR
Hbb exp0 (3-5)
Since adsorption is exothermic, b should decrease with increasing temperature. The
assumption of identical sites with no interaction between adsorbed molecules implies
that the heat of adsorption is independent of coverage. The isosteric heat of
adsorption is therefore given by:
2
ln
TR
H
T
P
q
(3-6)
Although there are relatively few systems that conform accurately to the Langmuir
model, there are a great number of systems that show approximate conformity and
this model has the further advantage that it reduces to Henry’s law at the low-
concentration limit, which is a requirement for thermodynamic consistency in any
physical adsorption system. For these reasons, the Langmuir model has become
widely accepted as a reliable equilibrium model in analysing PSA systems.
The Langmuir model yields a simple extension to binary and multicomponent
systems, reflecting the competitive adsorption of different adsorbates on the
adsorption sites:
i
ii
iisi
Pb
Pbqq
1 (3-7)
This equation is known as the extended Langmuir model and for thermodynamic
consistency it requires that qs has to be the same for all the components. It is clear
that at a given temperature (which determines the value of b) and at a given partial

109
pressure, the adsorption amount of a component will be lower than for a single
component system at the same condition. This model is widely used in the modelling
of PSA systems because of its simplicity but also because when the loading is
relatively low the extended Langmuir model is generally accurate. The separation
factor or selectivity for a system described by eq. (3-7) is given simply by the ratio of
the adsorption equilibrium constants for the two components and it is independent of
concentration:
2
1
21
2112
/
/
b
b
yy
xx (3-8)
When the Langmuir model fails, more complicated isotherm models involving more
than two parameters are used, such as dual-site Langmuir, Langmuir–Freundlich,
Toth, Nitta, Unilan and O’Brien & Myers. Other adsorption theories can be found in
Dubinin–Polanyi theory, Ideal Adsorbed Solution Theory (IAST), vacancy solution
theory and potential theory.
3.3 Adsorption kinetics
The rate of physical adsorption can be controlled by diffusional limitations
rather than by the actual rate of equilibration at a surface, which, for physical
adsorption, is normally very rapid. From the perspective of sorption kinetics,
adsorbents may be divided into two broad classes: homogeneous and composite. In
the homogeneous adsorbents, the pore structure persists on the same scale through
the entire particle. By contrast, the composite adsorbent particles are formed by
aggregation of small microporous microparticles, sometimes with the aid of a binder.
In a composite adsorbent, there are three distinct resistances to mass transfer, as
illustrated in Figure 3.6. In homogeneous adsorbents, external film resistance also
exists.

110
Figure 3.6: The resistances to mass transfer in a composite adsorbent pellet
Under practical conditions of operation, the external film resistance is seldom rate
limiting, so the sorption/desorption rate is generally controlled by either macropore
or micropore diffusion or by the combined effects of these resistances (Ruthven et
al., 1994).
3.3.1 Diffusion in mesopores and macropores
There are four distinguishable mechanisms that contribute to the mass transfer
in the case of the mesopores and the macropores (pores where diameter is larger than
the diameter of the diffusing species). These mechanisms are:
Bulk or molecular diffusion
Knudsen diffusion
Poiseuille diffusion
Surface diffusion
Bulk or molecular diffusion becomes dominant when the pore diameter is
larger than the mean free path of the molecules (the distance that a molecule can
travel without having collisions with other molecules or with the wall of the pores).
Eq. (3-9) is the Chapman–Enskog equation, which shows the influence of pressure
and temperature on the binary molecular diffusivity (Poling et al., 2001):

111
ijij
ji
ijP
MMT
D
2
37 111088.1
(3-9)
where P is in bar, Dij is in m2/s while σij and Ωij are related to the characteristic
Lennard–Jones length and energy of pure components i and j. The molecular
diffusivity of the gas relating to component i is calculated as follows:
n
ijj ij
i
iim
D
y
yD
,1
,
1 (3-10)
The Knudsen diffusivity becomes relevant at low pressure or in those
adsorbents in which the pore diameters are lower than the molecular mean free path
since this mass transfer mechanism is a consequence of the collisions between the
diffusing molecules and the pore wall (Ruthven, 1984). The Knudsen diffusivity can
be estimated by the Kauzmann correlation (Yang, 1987):
i
pikM
TrD 9700,
(3-11)
where rp is in cm and Dk,i is in cm2/s.
In the transition region between the two mechanisms, it is valid to say that the
two diffusivities can be summed up as two resistances in parallel, also taking into
account the tortuosity, as described by the Bonsanquet equation (Yang, 1987):
1
,,
,
111
ikimp
ipDD
D
(3-12)
It is clear that at higher pressures, Dp tends to Dm, while at lower pressure and small
pore radius, Dp tends to Dk. Since the actual diffusion path does not equal the
distance in the radial direction, the tortuosity factor (τp) defines the ratio between the
actual diffusion path length and the radial distance.
There may be also a contribution related to the flux from forced flow
(Poiseuille flow). The equivalent Pouiseuille diffusivity is given by eq. (3-13) where
rp refers to the pore radius and μi to the viscosity of component i in the gas mixture
(Ruthven, 1984).

112
i
p
iv
rPD
8
2
, (3-13)
The Pouiseuille diffusivity becomes relevant only in relatively large pores and high
pressures; its effect is generally negligible in a packed bed since the pressure drop
over an individual particle is very small. The contribution of the Pouiseuille
diffusivity is directly additive to the one arising from the combination of the
Knudsen and molecular mechanisms (Ruthven et al., 1994).
When the adsorbed phase is sufficiently mobile and the concentration
sufficiently high, there may be an additional contribution from surface diffusion
(Kapoor et al., 1989) through the adsorbed layer on the pore wall:
TR
EDKD is
p
p
is exp1
,0,
(3-14)
Surface diffusion is an activation process and is in many ways similar to micropore
diffusion.
An overall macropore diffusivity can be obtained by combining all the four
mechanisms previously described (Ruthven et al., 1994):
isiv
ikimp
ip DDDD
D ,,
1
,,
,
111
(3-15)
3.3.2 Diffusion in micropores
Micropore diffusion is diffusion in pores of dimensions comparable with the
diameters of the diffusing molecules. In this situation, the diffusing molecule never
escapes from the force field of the pore wall. In such small pores, it no longer makes
sense to distinguish between adsorbed molecules on the pore wall and molecules in
the central region of the pore, and it is preferable to regard all sorbate molecules
within the micropores as the adsorbed phase. A strong concentration dependence of
the micropore diffusivity is commonly observed. The true driving force for any
diffusive process is the gradient of chemical potential, as assumed in the Fickian
formulation:
zqBJ
(3-16)

113
where B is the mobility of a molecule. Considering equilibrium with an ideal vapour
phase:
PTRaTR lnln 00 (3-17)
Therefore:
z
q
qd
PdTRBJ
ln
ln (3-18)
The Fickian diffusivity is given by:
qd
PdDD
ln
ln0 with TRBD 0 (3-19)
Eq. (3-19) is referred to as Darken’s relation and D0 is the corrected diffusivity. In
the vapour phase at low concentration, Henry’s law is obeyed; the system is linear
and dlnP/dlnq → 1, so the Fickian diffusivity becomes independent of concentration.
For most microporous adsorbents, however, the isotherm is of type I form; therefore,
eq. (3-19) predicts an increasing trend of diffusivity with concentration. In particular
for the Langmuir isotherm:
sqqqd
Pd
/1
1
ln
ln
(3-20)
for which it may be seen that, in the saturation region, the concentration dependence
is very strong. Micropore diffusion is an activation process; so, in contrast to
molecular or Knudsen diffusivities, the temperature dependence is strong and
generally follows the Arrhenius form:
TR
EDD exp (3-21)
where E is the adsorption activation energy. In small-pore zeolites and carbon
molecular sieves, the major energy barrier is simply the repulsive interactions
associated with the molecule passing through constrictions in the pore. As a result,
there is a well-defined correlation between activation energy and molecular diameter.
3.4 Adsorption column model
The model hierarchy for the adsorption column is derived from the mass,
energy and momentum balances. This model hierarchy, which is shown in Figure

114
3.7, contains models of varying complexity that are valid for different parameters
regimes.
Figure 3.7: Model hierarchy for the adsorption column: in each stage the different
options are only shown for one option of the previous stage but apply to all options of
the previous stage
The model hierarchy is traversed from left to right and in each stage one model is
chosen. For example, the choice of non-isothermal 1T, pressure drop, no film
resistance, no macropore and micropore diffusion will generate a unique set of
governing equations.
3.4.1 Column dimensions
A schematic of the adsorption column is shown in Figure 3.8. The flow
through a packed bed is described by the axial dispersed plug flow model. More
details, including radial dispersion, are generally not necessary (Ruthven, 1984),
while the ideal plug flow can be approximated by letting the dispersion coefficient go
to zero.

115
Figure 3.8: Schematic of an adsorption column showing the two inlets and the
adsorbent pellets: the inset shows a schematic of an idealised adsorbent pellet including
the spherical crystallites
Table 3.3 summarises the column and pellet dimensions as well as the densities
and void fractions, which will be used in following sub-sections. A list of the
abbreviations and the corresponding variables displayed in the table as well as in the
equations can be found in the list of symbols at the beginning of this thesis.
Table 3.3: Summary of column and pellet dimensions, densities and void fractions
Symbol Explanation Formula
𝐴𝑐,𝑎 Column axial surface area 𝐴𝑐,𝑎 = 𝜋𝑅𝑐2
𝐴𝑐,𝑙 Column lateral surface area 𝐴𝑐,𝑙 = 2𝜋𝑅𝑐𝐿𝑐
𝐴𝑐 Column area 𝐴𝑐 = 2𝐴𝑐,𝑎 + 𝐴𝑐,𝑙
𝑉𝑐 Column Volume 𝑉𝑐 = 𝜋𝑅𝑐2𝐿𝑐
𝐴𝑝 Pellet surface area 𝐴𝑝 =4𝜋𝑅𝑝
2
𝜑
𝑉𝑝 Pellet volume 𝑉𝑝 =4
3𝜋𝑅𝑝
3
𝜌𝑏𝑢𝑙𝑘 Bulk density 𝜌𝑏𝑢𝑙𝑘 =mp
𝑉𝑐
𝜌𝑝 Pellet density 𝜌𝑝 =mp
𝑉𝑝
𝜌𝑐𝑟𝑦 Crystal density 𝜌𝑐𝑟𝑦 =m𝑝
𝑉𝑐𝑟𝑦
𝜌𝑠𝑘𝑒𝑙 Skeletal density 𝜌𝑠𝑘𝑒𝑙 =m𝑝
𝑉𝑠𝑘𝑒𝑙
𝜀 Inter-particle void fraction 𝜀 = 1 −𝜌𝑏𝑢𝑙𝑘𝜌𝑝
𝜀𝑝 Pellet void fraction 𝜀𝑝 = 1 −𝜌𝑝𝜌𝑐𝑟𝑦
𝜀𝑐𝑟𝑦 Crystal void fraction 𝜀𝑐𝑟𝑦 = 1 −𝜌𝑐𝑟𝑦
𝜌𝑠𝑘𝑒𝑙

116
where φ represents the non-spherically coefficient of the particle.
3.4.2 Mass balance
The mass balance for the gas phase is described by the axial dispersed plug
flow model with an adsorption term as shown in eq. (3-22). From a numerical point
of view, it can be classified as a non-linear parabolic dispersive advection equation
with a “reaction term”.
0
1
z
J
z
vc
t
Q
t
c iiii
(3-22)
ip
m
ipi qcQ (3-23)
pR
i
p
i drrQr
Q0
2
3
3 (3-24)
pr
i
c
i drrqr
q0
2
3
3 (3-25)
z
ycDJ i
Tzi
(3-26)
The overall mass balance is given by:
0
1
z
vc
t
Q
t
c Tn
i
iT
(3-27)
Here, ci is the gas phase concentration of component i, cm
i is the macropore
concentration of component i, Qi is the concentration of component i in the adsorbent
pellet and qi is the sorbate concentration of component i. The bar at the top of Qi and
qi indicates the average concentration over the pellet and the micropore, respectively.
Eqs. (3-24) and (3-25) show the definition of iQ and iq in the pellet and in the
micropore but these equations are not used in the mass balance calculations. Dz is the
mass axial dispersion coefficient. The boundary conditions for the gas phase
concentrations are given by the Danckwerts boundary conditions (1953) for flow into
the column and the no diffusive flux for flow out of the column. With the
conventions that the positive flow directions are from 0 to L, these can be written in a
combined form as:

117
0,0,0 2iizi cc
vvJ
(3-28)
ccc
LiLiLzi ccvv
J ,,2
(3-29)
where the superscripts − and + indicate the concentrations values to the left and right
of the boundary, respectively.
The material balance in the adsorbent pellet can also be described by a
hierarchy of models of varying complexity. The concentration cm
i in the macropores
is governed by the diffusion equation with an effective diffusion coefficient Dp,i:
01 2
,2
r
crD
rrt
q
t
c m
i
ip
i
p
m
i
p (3-30)
The adsorbed concentration qi in the micropores is governed by the diffusion
equation with an effective diffusion coefficient Dμ,i:
01 2
,2
r
qrD
rrt
q i
i
i
(3-31)
Eqns (3-30) and (3-31) describe the mass balance in the adsorbent pellet in the most
general case, i.e., external film resistance, macropore diffusion and micropore
diffusion with film resistance or barrier resistance. In many cases, the behaviour of
the adsorption column can be adequately described by simpler models: the LDF
approximation is one of those (Glueckauf, 1949). The variables of interest will
change only with time and this change will be proportional (kLDF) to the difference
between the current values for it in the pore and the associated values for the closest
external gas phase. If the LDF model is assumed for the macropores, the parabolic
PDE defined by eq. (3-30) transforms into the ODE described by eq. (3-32):
m
ii
p
pp
ii
p
m
ip cc
V
Ak
dt
qd
dt
dc (3-32)
where kip refers to the combined macropore LDF coefficient that can be obtained
based on the correlation published by Nakao and Suzuki (1983):
2
,15
P
ipp
p
pp
ir
D
V
Ak
(3-33)
In the case of applying the LDF model to the micropores, it is possible to state that
the temporal evolution of the concentration in the adsorbed phase is proportional to

118
the difference between the one predicted using the equilibrium isotherm for the
concentration of the adsorbing species in the macropores (qi*) and the current value
of the concentration of the adsorbed phase, as shown in Eq. (3-34). Eq. (3-34)
therefore replaces eq. (3-31):
ii
p
cr
ii qq
rk
dt
qd 3
(3-34)
where kicr
is the combined micropore LDF coefficient and can be estimated by using
eq. (3-35):
2
,153
c
icry
c
cr
ir
D
rk
(3-35)
The LDF approximation reduces the complexity of the computational
implementation of the problem and it has had great success in modelling PSA cycles,
as reported by Sircar and Hufton (2000).
3.4.3 Energy balance
Assuming that thermal equilibrium is instantaneous between the gas phase and
the pellet (Tf = Tp) and considering a constant wall temperature, the energy balance
can be expressed as:
0
~
11
wf
c
cw
n
i
iiTfPfTT
V
Ah
z
HJ
z
J
z
vH
t
U
t
U (3-36)
dt
dU
dt
dU
dt
dU sP
P
fP
PP ,,
1 (3-37)
z
TkJ
f
zT
(3-38)
Here v is the interstitial flow velocity, Uf is the internal energy in the fluid phase per
unit volume, Up is the internal energy in the pellet per unit volume, Hf is the enthalpy
in the fluid phase per unit volume, Up,f is the internal energy in the macropore per
unit volume and Up,s is the internal energy in the solid and sorbate phase per unit
volume. The heat transfer coefficient between the bed fluid and the column wall is
given by hw. The thermal axial dispersion is represented by kz. The boundary
conditions for the gas phase concentrations and the enthalpy are given by the
Danckwerts boundary conditions for flow into the column and the no diffusive flux

119
for flow out of the column. With the conventions that the positive flow direction is
from 0 to L, these can be written in a combined form as:
0,0,0 2
ffzT HHvv
J
(3-39)
ccc
LfLfLzT HHvv
J ,,2
(3-40)
where the superscripts − and + indicate the concentration values to the left and right
of the boundary, respectively. The constitutive equations for the energy terms are
given by:
T
TVTreff
ref
dTccUU ' (3-41)
T
TPTreff
ref
dTccHH ' (3-42)
sppfppp UUU ,, 1 (3-43)
T
TV
m
Trefpfpref
dTccUU ',, (3-44)
adssolsp UUU , (3-45)
P
ref
T
TsPsrefsolsol dTcUU ',, (3-46)
p
P
refTads
T
TadsPTrefadsadsads HdTcqHHU ',,
(3-47)
'1
0 , i
N
i
q
qTiTads dqHHC
i
ijpp
(3-48)
T
TiPrefii
ref
dTcHH '~~
,, (3-49)
Usol and Uads are the internal energy per unit volume in the adsorbent and the
adsorbed phase, respectively. The total concentration in the fluid phase and in the
macropore is given by cT and cTm
, respectively. qT is the total adsorbed concentration
in the micropore and cp,sol is the specific heat capacity at constant pressure in the
solid phase. The total heat of adsorption per unit volume (−∆Hads) is calculated from
the component heat of adsorptions (−∆Hi).
The molar heat capacities at constant volume cv in the fluid phase and at
constant pressure in the fluid cp and in the adsorbed phase cp,ads are calculated from
the respective component heat capacities in the following way:
n
i
iviv cyc , ; n
i
ipip cyc , ; n
i
ip
T
iadsp c
q
qc ,, ;
n
i
iv
m
i
m
v cyc , (3-50)

120
The superscript ’m’ indicates the macropore concentrations and heat capacities and yi
are the component mole fractions.
3.4.4 Momentum balance
In most adsorption processes, the adsorbent is contacted by the fluid phase in a
packed column. Such variables as the particle size, fluid velocity and bed dimensions
determine the pressure drop and have an important impact on the economics of the
process since they determine the compression cost as well as the extent of the axial
mixing and the heat transfer properties. The pressure drop along the column is
estimated using the Ergun equation (Ergun, 1952):
vv
dv
dz
P
p
g
p
175.1115022
2
(3-51)
where μ is the fluid viscosity.
3.4.5 Transport parameters and physical properties of gases
Some transport parameters as well as physical properties of the gas
encountered in the previous sections are analysed here in detail. The axial mass
dispersion coefficient, Dz, and the axial thermal dispersion coefficient, kz, are
estimated using the correlations by Wakao and Funazkri (1978):
Re5.020
ScD
Dε
m
z (3-52)
RePr5.07 g
z
k
k (3-53)
where kg is gas thermal conductivity while the other dimensionless parameters are
listed in Table 3.4.

121
Table 3.4: Some dimensionless numbers used in the correlations
Dimensionless number Definition
Reynolds, Re
pg dv
Schmidt, Sc mg D
Prandtl, Pr g
p
k
c
Heat transfer between packed beds and column wall surroundings has been widely
studied. In the one-dimensional model, the overall heat transfer resistance may be
represented by the sum of internal, external and wall resistances (Ruthven, 1984):
lmw
c
extextc
c
w Dk
xD
hD
D
hh
,int
11 (3-54)
where x is the wall thickness (Dc,ext = Dc + 2x), kw is the wall thermal conductivity
and Dlm is the logarithmic mean diameter. Cooling at the external surface is normally
by natural convection and hence this term can be generally neglected considering the
same temperature between the external surface and the surroundings. For metal-
walled vessels, the heat transfer resistance of the wall is usually neglected; but, of
course, this term becomes important if the wall is insulated. The heat transfer
coefficient at the internal surface may be estimated Wasch and Froment’s correlation
(1972):
Re013396.0140
2
int
gp
c
c
g
kd
D
D
kh (3-55)
Gas density was evaluated applying the ideal gas law:
TR
MPg
(3-56)
The heat capacity at constant pressure of component i was calculated using a
polynomial function of temperature (Poling et al., 2001):
432
, TETDTCTBAc ip (3-57)
The viscosity of a pure gas was calculated according to the first order Chapman–
Enskog equation (Poling et al., 2001):

122
i
ii
TM5.0
610669.2 (3-58)
where μi is in Pa·s and Ωμ is related to the Lennard–Jones parameters of component
i. The viscosity of the gas mixture was calculated using the Wilke method (Poling et
al., 2001):
n
in
j
ijj
ii
y
y (3-59)
where Φij is function of the viscosities and molecular weights of the i,j components.
The thermal conductivity of a pure gas was calculated according to the
following equation proposed by Eucken (Poling et al., 2001):
i
i
ipigM
Rck
25.1ˆ
,, (3-60)
Gas mixture thermal conductivity was evaluated using the Wassiljewa method
(Poling et al., 2001):
n
in
j
ijj
igi
g
y
kyk
, (3-61)
A detailed explanation of the units of measurements for these entities is given in the
list of symbols at the beginning of the thesis.
3.5 Industrial use of adsorption for gas separation
Large-scale adsorptive processes may be conveniently divided into two broad
classes; cyclic batch systems, in which the adsorbent bed is alternately saturated and
regenerated in a cyclic manner, and continuous flow systems, generally involving
continuous contact between feed and adsorbent. It is also convenient to distinguish
between purification processes, where the aim is to remove an undesirable
component or components from a feed stream, and concentration processes, where
the valuable component or components are the most strongly adsorbed ones, which
need to be recovered. An example of the first case is a H2 purification process while
an example of the latter is a CO2 enrichment process. The process schemes used in
these types of separation are obviously somewhat different although the general

123
principles of design and operation are similar. Four basic sorbent regeneration
methods are in common employed although combinations of two or more methods
may also be used with advantage in particular situations (Ruthven, 1984):
Thermal swing: the bed is regenerated by heating, usually with a stream of
hot gas, to a temperature at which the adsorbed species are desorbed and
removed from the bed into the fluid stream
Pressure swing: desorption is accomplished by reducing the pressure and
then purging the bed at the low pressure. The basic difference between the
pressure swing and thermal swing operations is shown schematically in
Figure 3.9
Purge gas stripping: the bed is regenerated at essentially constant pressure
by purging with a non-adsorbing inert gas. This method of regeneration is
applicable only when the adsorbed species are weakly held
Displacement desorption: the temperature and pressure are maintained
essentially constant but instead of an inert purge the adsorbed species are
displaced by a stream containing a competitively adsorbed species
Figure 3.9: Schematic isotherms showing pressure swing, thermal swing and combined
pressure–temperature swing operation for an adsorption process (Ruthven et al., 1984)
In case of thermal swing adsorption (TSA), the difference of temperature is the
driving force for the separation. TSA cycles are mainly employed in gas purification

124
processes for which the concentration of the adsorbing specie is relatively low
(Sircar, 2001) like the case of gas sweeting systems or processes for air pollution
control; only in the case of gas drying TSA is used industrially for bulk gas
separation. The simplest configurations for TSA cycles operate with two beds, one in
which the adsorption takes place and the second where the desorption is carried out
to provide continuity of flow. For the regeneration of the bed, the hot stream is
circulated in a reverse way so that any possible residue of the sorbate remaining at
the end of the desorption cycle is concentrated at the bed inlet and does not affect the
raffinate purity in the subsequent adsorption cycle. The design and optimisation of
TSA cycles is extensively reported in the literature (Merel et al., 2006; Davis and
Levan, 1989; Ruthven, 1984).
In pressure swing adsorption (PSA) systems the regeneration of the adsorbent
during the desorption cycle is achieved simply by reducing the total pressure and by
purging the bed at low pressure with a small fraction of the stream that leaves from
the column in which the adsorption step is taking place. The most basic PSA
configurations consist of two beds, which are alternately pressurised and
depressurised according to a pre-programmed sequence. The major advantage of
PSA cycles comparing with other separation techniques is based on the fact that the
pressure can be changed much more rapidly than the temperature, thus a PSA
process can be operated on a much faster cycle and thus an increase of the
throughout per unit of adsorbent bed volume will be observed (Ruthven, 1984). The
first commercial uses of PSA cycles dated from the late 1960s with the patents by
Guerrin de Montgareuil and Domine (US patent No. 3155468, 1964) and Skarstrom
(US Patent No. 2944627, 1960); nowadays the PSA systems are widely used for the
separation of N2 and O2 from air.
Any PSA cycle can be considered as a sequence of elementary steps, the most
common of which are:
Pressurisation, with feed or raffinate product
High-pressure feed adsorption
Depressurisation or “blowdown”, cocurrent or countercurrent to the
feed

125
Desorption at the lower operating pressure; this may be accomplished
by evacuation or purging the bed with the raffinate product
Pressure equalisation, which is used in many cycles, prior to the
blowdown step, to conserve energy and for separative work
The processes differ from one another in the sequence of the elementary steps and in
the way in which these steps are carried out. In the original Skarstrom cycle, two
packed adsorbent beds were used for heatless drying process, as shown schematically
in Figure 3.10.
Figure 3.10: The basic two-bed pressure swing adsorption system (Skarstrom, 1960)
The following four steps comprise the cycle: adsorption, countercurent blowdown,
countercurrent purge and feed pressurisation. Both beds undergo these four
operations and their sequence is shown in Figure 3.11.

126
Figure 3.11: The sequence of steps in the basic Skarstrom cycle
Another successful application of the Skarstrom cycle is oxygen production from air
using 5A or 13X zeolite.
From a thermodynamic perspective, the essential difference between PSA and
TSA is that in the PSA system the energy required to achieve the separation is put
into the system as mechanical work rather than heat. Since mechanical energy is
generally more expensive than heat, efficient utilisation of energy is essential for an
economical PSA system. Such considerations become especially important in the
larger-scale units. A pressure swing system is well suited to rapid cycling and
generally operates at relatively low adsorbent loadings since selectivity is greatest in
the Henry’s law region. Low-temperature operation is also desirable to maximise
capacity and selectivity but cooling below ambient temperature is generally not
economical. The purging step is essential for an efficient separation. Reverse-flow
purge ensures that the more strongly adsorbed components are pushed back towards
the bed inlet and prevents the raffinate product in the following cycle end from being
contaminated by the more strongly adsorbed component. It is essential that sufficient
purge flow is used to flush completely the void spaces within the bed as well as to
desorb any of the more strongly adsorbed components from the outlet region of the
bed. Product purity increases as the purge flow increases, but after a certain point the
gain becomes marginal. In practice the volume of the purge flow, measured at low
pressure, should generally be between one and two times the volume of the feed
stream (Ruthven, 1984). The increase in gas volume by depressurisation means that
the actual fraction of the product stream required for purging is quite small and
varies with the operating pressures. Thus, high-pressure operation during adsorption

127
is desirable from the standpoint of minimising purge loss but this gain is to some
extent offset by the greater blowdown losses for a high-pressure system.
The first improvement over Skarstrom’s original cycle was the introduction of
a pressure equalisation step proposed by Berlin (1966). After the first bed is purged
and the second bed completes the high-pressure adsorption step, instead of blowing
down the second bed, the two beds are connected through their product ends to
equalise the pressure. The pressure equalisation step conserves energy since the
compressed gas from the high-pressure bed is used to partially pressurise the low-
pressure bed and, since this gas is partially depleted of the strongly adsorbed species,
separative work is also conserved. Blowdown losses are reduced to about half, with a
consequent improvement in the recovery of the raffinate product.
Further improvements in efficiency are generally achievable by using multiple
adsorption beds in order to incorporate pressure equalisation steps into the cycle
(Davis, 1972; Batta, 1971). In fact, multiple bed systems also enable the blowdown
gas to be used for purging other beds. Examples can be found in air separation and
hydrogen purification units. Moreover, the idea of product repressurisation was put
forward for the first time in a patent by Wagner (1969). Pressurisation with product
pushes the residual adsorbed components toward the feed end of the adsorber,
thereby enhancing the product purity. In multiple bed systems, greater conservation
of energy and separative work are achieved at the cost of a more complex process
scheme. In some large-scale hydrogen purification PSA systems up to 12 adsorbent
beds have been designed so far (Yang, 1987).
Another modification is a vacuum swing cycle, originally proposed by Guerin
and Domine (1964). In comparison to the original Skarstrom cycle, the vacuum
swing cycle can be discerned in that the low-pressure countercurrent product purge
step is replaced by a vacuum desorption. The product end of the column is kept
closed and the vacuum is pulled through the feed end. The gain in raffinate recovery
is achieved at the expense of the additional mechanical energy required for the
evacuation step. A significant energy saving is possible if the cycle is operated with a
high pressure slightly above atmospheric pressure and a very low desorption pressure
(Ruthven et al., 1994). A vacuum swing cycle will therefore be advantageous over a
Skarstrom cycle if a low-pressure product is valuable.

128
3.6 PSA process for hydrogen purification
Hydrogen purification is a necessary step in the production of hydrogen, which
at present is done by catalytic steam reforming of natural gas, naphtha or refinery
gases. It is also of use to recover hydrogen from catalytic reformer effluent gas,
ethylene plant effluent gas and ammonia plant purge gas, in addition to a number of
other sources (Yang, 1987). Since the first commercial PSA hydrogen purification
plant was installed in Toronto in 1966 (Stewart and Heck, 1969), it has become the
largest use of PSA in terms of both cumulative capacity and the number of installed
units. The compositions of the three major gas mixture sources for PSA hydrogen
purification are:
Steam methane reformer effluent (after water gas shift): 70–75% (by
volume) hydrogen. The major impurity is CO2, with smaller amounts of
CO, CH4 and sometimes N2
Catalytic reformer effluent: 65–85% hydrogen. The primary impurity is
methane, with lesser amounts of C2–C5 hydrocarbons
Ethylene plant effluent: 70–90% hydrogen, with methane as the main
impurity
The success of PSA hydrogen purification is largely due to the high selectivities for
the impurity gases over hydrogen. Out of the commercial sorbents applicable for H2
PSA, a combination of activated carbon and zeolites is used in practice. For example,
in the four-bed UOP process each bed is packed with activated carbon near the inlet
in the first section, whereas 5A zeolite is packed in the second section (Fuderer and
Rudelstorfer, 1976). Presumably, the carbon section acts as a guard bed, mainly
adsorbing and desorbing carbon dioxide and methane, while the zeolite layer
removes carbon monoxide and nitrogen. For capacities below 15 MMSCF/D, the
four-bed configuration based on Batta’s patent is employed (1971). For larger sizes,
UOP’s Polybed process, based on the patent of Fuderer and Rudelstorfer (1976), has
proved more economical. The Polybed process has a single-train capacity up to 40
MMSCF/D (Heck and Johansen, 1978; Corr et al., 1979). Cycle performances are
evaluated according to the common parameters of H2 purity, H2 recovery and H2
productivities defined as follows:

129
n
i
t
Lzi
t
LzH
AD
AD
dtuC
dtuCPurityH
0
02
2
(3-62)
AD
PRAD
t
zH
t
LzH
t
LzH
dtuC
dtuCdtuCRecoveryH
0 0
002
2
22
(3-63)
adscycle
c
t
LzH
t
LzH
mt
AdtuCdtuC
tyProductiviH
PRAD
00
2
22
(3-64)
Both processes can yield hydrogen at purities higher than 99.99%. The product
recovery for the four-bed process is 70–75%, whereas an improvement to 85–90% is
achieved by the Polybed process.
In both processes, the cycle steps are: (1) adsorption, (2) cocurrent
depressurisation, (3) countercurrent blowdown, (4) purge and (5) repressurisation.
The effluent gas from one bed is used to purge and repressurise other beds, the latter
being referred to as pressure equalisation. The difference between these processes
lies in the number and sequence of pressure equalisation steps, which yield
significant differences in separation results.
The four-bed process is illustrated in Figure 3.12.
FEED
PRODUCT
(RAFFINATE)
WASTE
(EXCTRACT)
Figure 3.12: UOP four-bed PSA system (Batta, 1971)
During the high-pressure adsorption step, a substantial fraction of the bed is not
covered by the deepest-reaching wavefront. Although the wavefronts are sharp, the
uncovered portion of the bed is not clean in a cyclic steady state because of the
accumulated impurities. With a limited number of beds, as in the four-bed process,
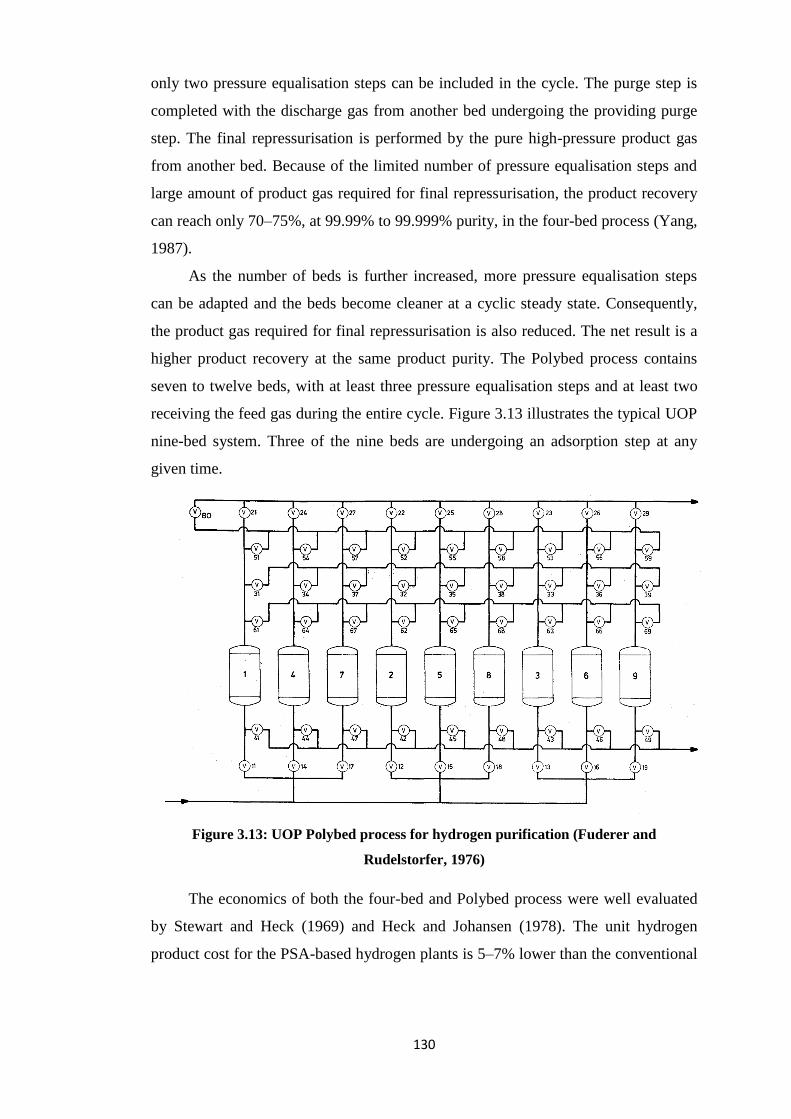
130
only two pressure equalisation steps can be included in the cycle. The purge step is
completed with the discharge gas from another bed undergoing the providing purge
step. The final repressurisation is performed by the pure high-pressure product gas
from another bed. Because of the limited number of pressure equalisation steps and
large amount of product gas required for final repressurisation, the product recovery
can reach only 70–75%, at 99.99% to 99.999% purity, in the four-bed process (Yang,
1987).
As the number of beds is further increased, more pressure equalisation steps
can be adapted and the beds become cleaner at a cyclic steady state. Consequently,
the product gas required for final repressurisation is also reduced. The net result is a
higher product recovery at the same product purity. The Polybed process contains
seven to twelve beds, with at least three pressure equalisation steps and at least two
receiving the feed gas during the entire cycle. Figure 3.13 illustrates the typical UOP
nine-bed system. Three of the nine beds are undergoing an adsorption step at any
given time.
Figure 3.13: UOP Polybed process for hydrogen purification (Fuderer and
Rudelstorfer, 1976)
The economics of both the four-bed and Polybed process were well evaluated
by Stewart and Heck (1969) and Heck and Johansen (1978). The unit hydrogen
product cost for the PSA-based hydrogen plants is 5–7% lower than the conventional

131
cryogenic and scrubbing (Stewart and Heck, 1969; Heck and Johansen, 1978). For
high-purity hydrogen production, 5A zeolite is used as the sorbent. Activated carbon
is not used because its selectivity for impurity/hydrogen is not high enough.
The literature contains a large amount of work on hydrogen purification by
PSA processes, both from an experimental and a modelling point of view. Table 3.5
summarises all these studies.
Table 3.5: Summary of research works on hydrogen purification by PSA processes
Reference Type of work Description
Yang et al.,
1997
Modelling/
experimental
The authors studied a two-bed six-step pressure swing
adsorption process using zeolite 5A experimentally and
theoretically for bulk separation of H2/CO and H2/CH4
systems (70/30 mol%) as major components in coke oven
gas. With a cycle pressure between 1 and 11 atm at ambient
temperature, 70% H2 in the feed could be concentrated to
99.99% in the product with a recovery of 75.9% in the H2/CO
mixture and 80.4% in the H2/CH4 mixture. The effects of
adsorption pressure, P/F ratio, adsorption/purge step time,
and pressure equalisation step time were investigated
experimentally and all the results were analysed by a
mathematical model incorporating heat and momentum
balances.
Yang and
Lee, 1998
Modelling/
experimental
The authors investigated the adsorption dynamics of a
layered bed packed with activated carbon and zeolite 5A. A
two-bed PSA process was studied experimentally and
theoretically for a coke oven gas purification (56.4% H2,
26.6% CH4, 8.4% CO, 5.5% N2, 3.1% CO2). The layered bed
PSA process was simulated as two single-adsorbent beds
linked in series. The dynamic model incorporating mass,
energy and momentum balances agreed well with the
experimental data.
Ahn et al.,
1999
Modelling/
experimental
The authors studied a backfill cycle of a two-bed PSA
process using activated carbon beds, zeolite 5A beds and
layered beds to recover high-purity hydrogen from coke oven
gas. In a layered bed PSA, a comparison was made between
two PSA processes with/without a backfill step before the
feed pressurisation step. The incorporation of a backfill step

132
resulted in an increase in product purity with a decrease in
recovery. The highest recovery for an ultrapure hydrogen
stream was 68%. The concentration profiles predicted by
simulation showed that CO and N2 played an important role
in obtaining high H2 purity.
Lee et al.,
1999
Modelling/
experimental
The authors studied the effects of carbon-to-zeolite ratio on a
layered bed H2 PSA using activated carbon and zeolite 5A
from coke oven gas. The PSA system consisted of a seven-
step two-bed configuration. The layered bed gave better
purity than the single-adsorbent bed at the same operating
conditions, except at low purge rate. For a high-purity H2
product an optimum carbon-to-zeolite ratio was determined
to control a leading wavefront of N2.
Lee et al.,
2008
Modelling/
experimental
The authors developed a heat-exchange pressure swing
adsorption to design a compact H2 PSA process for small
spatial occupancy in the hydrogen station for fuel cell
commercialisation. The adsorption dynamics and
performance of the newly designed bed were compared with
those of a conventional bed by using a feed mixture obtained
from a SMR process. It was found that the HE-PSA
performance was higher because the heat effects were
reduced by the heat exchange between the adsorption beds.
Ahn et al.,
2012
Modelling/
experimental
The authors focused on a PSA process involving layered two-
and four-bed systems for H2 recovery from coal gas with
relatively low H2 concentrations (38% H2, 50% CO2, 1%
CH4, 1% CO, 10% N2). The variations of purity and recovery
by operating variables were more significant in the two-bed
PSA process than in the four-bed one. It was shown that the
four-bed PSA process was able to produce H2 with a purity of
96–99.5% and a recovery of 71–85% together with N2 as the
major impurity.
You et al.,
2012
Modelling/
experimental
The authors developed a two-bed PSA purifier to produce
high purity hydrogen for fuel cell applications. Two feeds
were considered containing H2 and CO in the ratios of
99/0.85% and 95/4.55% plus other impurities. Under 6.5 bar
and 0.15 P/F ratio the first feed was purified to 1.1 ppm CO
with 99.99+% H2 purity and 80% recovery while the second
feed could be reduced to 6.7 ppm with 99.96% H2 purity and

133
78.4% recovery. The PVSA process, which combined
vacuum and purge steps, improved recovery by around 10%
compared to the PSA process.
Park et al.,
2000
Modelling/
experimental
The authors investigated a hydrogen purification process
from a typical cracked gas mixture (72.36% H2, 21.18% CO2,
2.49% CO, 3.97% CH4) at 23.6 atm by a layered four-bed
PSA process. The roles of the height of the activated carbon
layer, the superficial velocity of feed and the heat-transfer
resistance on the process were assessed. All the experimental
results were well predicted by the theoretical model. There
was an optimum carbon-to-zeolite layer, which maximises
not only the H2 recovery, but also the productivity at the
given H2 purity. It was found that for a 99.99% H2 purity the
optimum carbon-to-zeolite ratio is 1.5.
Yang et al.,
2008
Modelling/
experimental
The authors evaluated the performance of a four-bed nine-
step PSA process for producing high-purity hydrogen from
synthesis gas using layered beds of activated carbon and
zeolite 5A. The effect of the following PSA variables on
separation process were investigated: linear velocity of feed,
adsorption time and purge gas quantity. As a result, they
recovered 99.999% ultrapure hydrogen with a recovery of
66% when the pressure was cycled between 1 and 8 atm at
ambient temperature.
Jang et al.,
2011
Modelling/
experimental
The authors optimised the performance of an adsorption
layered bed consisting of zeolite 5A and activated carbon for
multicomponent gas separation (72.2% H2, 21.6% CO2,
2.03% CO, 4.17% CH4). At a pressure of 8 atm with a 16.67
L/min feed rate it was found that as the carbon ratio
increased, the average velocity of CH4 wavefront became
slow, and wavefronts of CO and CO2 propagated more
quickly. To produce ultrapure hydrogen the optimum carbon
ratio was evaluated at 0.7.
Ribeiro et
al., 2008 Modelling
The authors focused on the separation of hydrogen from a
five-component mixture (73.3% H2, 16.6% CO2, 3.5% CH4,
2.9% CO, 3.7% N2) by PSA. A mathematical model was
applied to a four-column PSA process with layered activated
carbon/zeolite beds with an eight-step cycle. The predictions
of reduced models were evaluated by comparing their results

134
with those obtained from the complete model. It was found
that the model that merely took into account the micropore
resistance and assumed thermal equilibrium between the gas
and the solid phases satisfactorily predicted the behaviour of
the PSA unit.
Ribeiro et
al., 2009 Modelling
The authors studied the purification of hydrogen from
synthesis gas at 7 bar saturated in water vapour. Simulation
results of a four-bed eight-step PSA process were presented
using an activated carbon as the adsorbent. Several operating
conditions were considered, such as different flow rates,
humid/dry feed and adiabatic/non-adiabatic operation.
Simulation results of a single-column PSA and a multi-
column system were also shown in detail. At the same
hydrogen purity of 99.999%, the recovery was decreased
from 71.3% to 62.7%.
Lopes et
al., 2011
Modelling/
experimental
The authors performed multicomponent breakthrough
experiments up to a five-component mixture of H2-CO2-CO-
CH4-N2 under different operating conditions in activated
carbon extrudates to validate the mathematical model. A 10-
step one-column VPSA experiment was also carried out. The
mathematical model was then employed to assess the effect
of operating conditions and the influence of step times and
pressure equalisations in the PSA unit. It was verified that
high-purity hydrogen (99.99+%) can be obtained at 5 bar
feed using this adsorbent with recoveries higher than 75%
and unit productivities of 160 molH2/kgads/d.
Silva et al.,
2013
Modelling/
experimental
The authors performed hydrogen purification experiments by
PSA using CuBTC (supplied by KRICT) MOF as adsorbent.
The PSA system consisted of a four-step cycle and the
experiments were performed starting from different feeds
(CO2/H2, CO2/H2/CH4, CO2/H2/CO and CO2/H2/N2).
Although the PSA cycles carried out experimentally were not
optimised, the mathematical model was validated
successfully and it can be used for the prediction of PSA
experiments, saving time, money and number of required
experiments.
Kumar et
al., 1995 Modelling
The authors proposed a new process concept to utilise low-
and high-pressure feed streams efficiently in a single PSA

135
process. The low-pressure feed is processed first in the PSA
unit to produce low-pressure product. Following this, the
high-pressure stream is processed in the same unit. The low
pressure generated in the first part of the process is used
internally in the process to assist the production of high-
pressure product. Considering a 25% CH4 / 75% H2 mixture,
the simulation showed that both recovery and adsorbent
productivity could be enhanced.
Malek and
Farooq,
1998
Modelling/
experimental
The authors investigated the performance of a six-bed, dual
sorbent PSA operation for hydrogen purification from
refinery fuel gas. Major impurities were methane, ethane,
propane and butane, and comprised 30–40% of the feed. The
dual-sorbent PSA bed consisted of an initial layer of silica gel
followed by an activated carbon layer. The simulation model
agreed well with the experimental results from a laboratory
unit as well as with available H2-PSA plant data from a
refinery.
Jiang et al.,
2004 Modelling
The authors developed a general PSA unibed framework
model simulating only one bed over a cycle and using storage
buffers to mimic the bed interactions. A five-bed 11-step
hydrocarbon separation process, which separates H2 from a
mixture of H2, N2, CO, CO2 and CH4, was used for
illustration. By manipulating valve constants, step times, flow
rates and bed geometry, the optimiser successfully
maximised H2 recovery, while meeting product purity and
pressure specifications.
Huang et
al., 2008
Modelling/
experimental
The authors optimised a PSA process for producing enriched
hydrogen from plasma reactor gas using gPROMS software.
The extensive simulation results involving parametric studies
of PSA separation performance were well matched with
experimental results using an activated carbon made from
coconut shell as an adsorbent. The investigated mixtures
were binary systems consisting of 50% H2, 50% CH4 and
25% H2, 75% CH4, representing exit gas from a plasma
reactor.
Majlan et
al., 2009 Experimental
The authors designed a compact pressure swing adsorption
system to produce purified hydrogen for use in fuel cells with
activated carbon as the adsorbent. With a four-bed system,

136
the CPSA was capable of reducing the CO concentration in a
H2/CO/CO2 mixture from 4000 to 1.4 ppm and the CO2
concentration from 5% to 7.0 ppm in 60 cycles and 3600 s.
Based on the mixture used in the experimental work, the H2
purity obtained was 99.999%, suitable for fuel cell
applications.
Casas et
al., 2013 Modelling
The authors carried out a multi-objective optimisation of a
PSA process for pre-combustion capture within an IGCC
power plant having the CO2 purity and recovery as
objectives. The results were presented in detail using sets of
optimal operating points, the so-called Pareto fronts. The
separation performance was found to mainly depend on the
operating temperature, on the adsorption pressure at which H2
is produced and on the desorption pressure at which CO2 is
produced.
Rahimpour
et al., 2013
Modelling/
experimental
The authors developed a mathematical model to simulate the
industrial four-bed layered PSA unit of a domestic
petrochemical plant that operates for purification of
hydrogen. The effects of cycle time and feed flow rate on
hydrogen recovery and purity were investigated and an
optimal value was estimated for cycle time and feed flow
rate. It was shown that by applying this optimum
configuration, H2 recovery increased from 75% to 80% with
almost the same H2 purity.
Yavary et
al., 2015 Modelling
The authors focused on the performance of a six-bed PSA
process for hydrogen purification in terms of cycle sequence
and number of pressure equalisation steps employed.
Simulation results showed that designs with more pressure
equalisation steps resulted in higher product recovery while
for higher product purity, loss of product in a PSA process
was more significant. In addition, a target function including
implicit economic factors for choosing the better PSA design
was presented and discussed.
3.7 Conclusions
The use of adsorption as a gas separation unit operation has been discussed in
this chapter, starting from the fundamentals of adsorption equilibrium and kinetics

137
and explaining how they may influence the modelling and the simulation of the
mass, energy and momentum balance equations. The linear driving force model was
also shown in detail as well as how to calculate all the transport parameters and gas
properties.
An extensive literature review regarding the application of adsorption as a gas
separation unit operation at the industrial level has been presented, starting from the
original Skarstrom cycle and proposing successive modifications, such as the
incorporation of pressure equalisation steps, the multibed system and the vacuum
pressure swing adsorption process. It was highlighted that for hydrogen purification
processes the valuable product is the raffinate, which is produced during the high-
pressure adsorption step. PSA cycle performance parameters of purity, recovery and
productivity have been introduced and explained for this type of separation.
An extensive literature survey has been conducted on H2 purification processes
by PSA systems.
References
Ahn H, Lee CH, Seo B, Yang J, Baek K. Backfill cycle of a layered bed H2 PSA process.
Adsorption 1999; 5: 419-433.
Ahn S, You YW, Lee DG, Kim KH, Oh M, Lee CH. Layered two- and four-bed PSA
processes for H2 recovery from coal gas. Chemical Engineering Science 2012; 68: 413-423.
ALOthman ZA. A review: fundamental aspects of silicate mesoporous materials. Materials
2012; 5: 2874-2902.
Averill BA, Eldredge P. General Chemistry: principles, patterns and application, 2007.
Batta LB. US Patent No. 3564816, to Union Carbide Corporation, 1971.
Berlin NH. US Patent No. 3280536, to Exxon Research and Engineering, 1966.
Brunauer S, Emmet PH, Teller E. Adsorption of gases in multi-molecular layers. J. Am.
Chem. Soc. 1938; 60: 309-319.
Casas N, Schell J, Joss L, Mazzotti M. A parametric study of a PSA process for pre-
combustion CO2 capture. Separation and Purification Technology 2013; 104: 183-192.

138
Corr F, Dropp F, Rudelstorfer E. Hydrocarbon Processing 1979; 58: 19.
Danckwerts PV. Continuous flow systems. Chemical Engineering Science 1953; 2: 1-13.
Davis MM, Levan DM. Experiments and optimization of thermal swing adsorption. Ind.
Chem. Res. 1989; 28: 778-785.
Davis JC. Chemical Engineering 1972; 16: p.88.
Ergun S. Fluid flow through packed columns. Chem. Eng. Prog. 1952; 48: 89-94.
Fuderer A, Rudelstorfer E. US Patent No. 3986849, to Union Carbide Corporation, 1976.
Glueckauf E. Theory of Chromatography VII. The general theory of two solutes following
non-linear isotherms. Discuss. Faraday Soc. 1949; 7: 12-25.
Guerin P, Domine D. US Patent No. 3155468, to Société L’Air Liquide, 1964.
Heck JL, Johansen T. Hydrocarbon Processing 1978; 57: 175-177.
Huang Q, Malekian A, Eic M. Optimisation of PSA process for producing enriched
hydrogen from plasma reactor gas. Separation&Purification Technology 1998; 62: 22-31.
IUPAC. Recommendations Pure Applied Chemistry 1985; 57: 603.
Jang SC, Yang SI, Oh SG, Choi DK. Adsorption dynamics and effects of carbon to zeolite
ratio of layered bed for multicomponent gas adsorption. Korean J. Chem. Eng. 2011; 28:
583-590.
Jiang L, Fox G, Biegler LT. Simulation and optimal design of multiple-bed pressure swing
adsorption systems. AIChE Journal 2004; 50: 2904-2917.
Kapoor A, Yang RT, Wong C. Surface diffusion. Catal. Rev. Sci. Eng. 1989; 31: 129-214.
Keller GE, Anderson RA, Yon CM. Handbook of Separation Process Technology, 1987.
Kumar R, Guro DE, Schmidt WP. A new concept to increase recovery from H2 PSA:
processing different pressure feed streams in a single unit. Gas. Sep. Purif. 1995; 9: 271-276.
Kyriakopoulos G, Doulia D. Adsorption of pesticides on carbonaceous and polymeric
materials from aqueous solution: a review. Separation & Purification Reviews 2006; 35: 97-
191.

139
Langmuir I. The adsorption of gases on plane surfaces of glass, mica and platinum. J. Chem.
Soc. 1918; 40: 1361-1403.
Lee CH, Yang J, Ahn H. Effects of carbon-to-zeolite ratio on layered bed H2 PSA for coke
oven gas. AIChE Journal 1999; 45: 535-545.
Lee JJ, Kim MK, Lee DG, Ahn H, Kim MJ, Lee CH. Heat-exchange pressure swing
adsorption process for hydrogen separation. AIChE Journal 2008; 54: 2054-2064.
Li JR, Ma Y, McCarthy MC, Sculley J, Yu J, Jeong HK, Balbuena PB, Zhou HC. Carbon
dioxide capture-related gas adsorption and separation in metal-organic frameworks.
Coordination Chemistry Reviews 2011; 255: 1791-1823.
Lin SH, Juang RS. Adsorption of phenol and its derivatives from water using synthetic resins
and low-cost natural adsorbents: a review. Journal of Environmental Management 2009; 90:
1336-1349.
Lopes FVS, Grande CA, Rodrigues AE. Activated carbon for hydrogen purification by
pressure swing adsorption: Multicomponent breakthrough curves and PSA performance.
Chemical Engineering Science 2011; 66: 303-317.
Majlan EH, Daud WRW, Iyuke SE, Mohamad AB, Kadhum AAH, Mohammad AW, Takriff
MS, Bahaman N. Hydrogen purification using compact pressure swing adsorption system for
fuel cell. Hydrogen Energy 2009; 34: 2771-2777.
Malek A, Farooq S. Hydrogen purification from refinery fuel gas by pressure swing
adsorption. AIChE Journal 1998; 44: 1985-1992.
Manske M. Sodalite picture (2009) available at https://en.wikipedia.org/wiki/Faujasite
Merel J, Clausse M, Meumier F. Carbon dioxide capture by indirect thermal swing
adsorption using 13X zeolite. Environmental Progress. 2006; 25: 327-333.
Nakao S, Suzuki M. Mass transfer coefficient in cyclic adsorption and desorption. J.Chem.
Eng. Jpn. 1983; 16: 114-119.
Park JH, Kim JN, Cho SH. Performance analysis of four-bed H2 PSA process using layered
beds. AIChE Journal 2000; 46: 790-802.
Poling BE, Prausnitz JM, O’Connell JP. The properties of gases and liquids, 2001.

140
Rahimpour MR, Ghaemi M, Jokar SM, Dehghani O, Jafari M, Amiri S, Raeissi S. The
enhancement of hydrogen recovery in PSA unit of domestic petrochemical plant. Chemical
Engineering Journal 2013; 226: 444-459.
Ribeiro AM, Grande CA, Lopes FVS, Loureiro JM, Rodrigues AE. A parametric study of
layered bed PSA for hydrogen purification. Chemical Engineering Science 2008; 63: 5258-
5273.
Ribeiro AM, Grande CA, Lopes FVS, Loureiro JM, Rodrigues AE. Four beds pressure
swing adsorption for hydrogen purification: case of humid feed and activated carbon beds.
AIChE Journal 2009; 55: 2292-2302.
Ruthven DM, Farooq S, Knaebel K. Pressure swing adsorption, 1994.
Ruthven DM. Principles of Adsorption and Adsorption Processes, 1984.
Skarstrom CW. US Patent No. 2944627, to Exxon Research and Engineering company,
1960.
Silva B, Solomon I, Ribeiro AM, Lee UH, Hwang YK, Chang JS, Loureiro JM, Rodrigues
AE. H2 purification by pressure swing adsorption using CuBTC. Separation and Purification
Technology 2013; 118: 744-756.
Sircar S. Publications on Adsorption Science and Technology. Adsorption 2000; 6: 359-365.
Sircar S. Applications of Gas Separation by Adsorption for the Future. Adsorpt. Sci.
Technol. 2001; 19: 347-366.
Sircar S, Hufton JR. Why Does the Linear Driving Force Model for Adsorption Kinetics
Work ? Adsorption 2000; 6: 137-147.
Stewart HA, Heck JL. Pressure swing adsorption. Chem. Eng. Prog. 1969; 65: 78-83.
Suzuki M. Adsorption Engineering, 1990.
Tang F, Li L, Chen D. Mesoporous silica nanoparticles: synthesis, biocompatibility and drug
delivery. Advanced Materials 2012; 24: 1504-1534.
Wagner JL. US Patent No. 3430418, to Union Carbide Corporation, 1969.
Wakao N, Funazkri T. Effect of fluid dispersion coefficients on particle-to-fluid mass
transfer coefficients in packed beds. Chemical Engineering Science 1978; 33: 1375-1384.

141
Wang Q, Luo J, Zhong Z, Borgna A. CO2 capture by solid adsorbents and their applications:
current status and new trends. Energy & Environmental Science 2011; 4: 42-55.
Wasch APD, Froment GF. Heat transfer in packed beds. Chemical Engineering Science
1972; 27: 567-576.
Yang RT. Gas separation by adsorption processes, 1987.
Yang J, Lee CH. Adsorption dynamics of a layered bed PSA for H2 recovery from coke oven
gas. AIChE Journal 1998; 44: 1325-1334.
Yang J, Lee CH, Chang JW. Separation of hydrogen mixtures by a two-bed pressure swing
adsorption process using zeolite 5A. Ind. Eng. Chem. Res. 1997; 36: 2789-2798.
Yang SI, Choi DY, Jang SC, Kim SH, Choi DK. Hydrogen separation by multi-bed pressure
swing adsorption of synthesis gas. Adsorption 2008; 14: 583-590.
Yavary M, Ebrahim HA, Falamaki C. The effect of number of pressure equalisation steps on
the performance of pressure swing adsorption process. Chemical Engineering and Processing
2015; 87: 35-44.
You YW, Lee DG, Yoon KY, Moon DK, Kim SM, Lee CH. H2 PSA purifier for CO
removal from hydrogen mixtures. Hydrogen Energy 2012; 37: 18175-18186.

142
Chapter 4: Design of a H2 PSA applied to an IGCC
with pre-combustion capture
This chapter describes a novel hydrogen pressure swing adsorption system that
is applied to an advanced integrated gasification combined cycle plant for
cogenerating power and ultrapure hydrogen (99.99+ mol%) with CO2 capture. In
designing the H2 PSA, it is essential to increase the recovery of ultrapure hydrogen
product to its maximum since the power consumption for compressing the H2 PSA
tail gas up to the gas turbine operating pressure should be minimised to save the total
auxiliary power consumption of the advanced IGCC plant. This is because a higher
hydrogen recovery in the product stream leads to a lower hydrogen flowrate in the
tail gas stream, and hence to a lower power consumption at the H2 PSA tail gas
compressor. In this study, it is sought to increase the H2 recovery by increasing the
complexity of the PSA step configuration, which enables the PSA cycle to have a
lower feed flow to one column for adsorption and at the same time to include more
pressure equalisation steps. As a result, the H2 recovery reaches a maximum around
93% with a Polybed H2 PSA system having twelve columns and the step
configuration contains simultaneous adsorption on three columns and four-stage
pressure equalisation.
4.1 Background of the study
In order to produce power and ultrapure hydrogen, the general approach would
consist of employing a PC boiler power plant, for example for power generation, and
a conventional steam methane reforming plant for ultrapure hydrogen production. By
applying a carbon capture unit to those plants, the effluent gas would be at nearly
atmospheric pressure in both cases, resulting in a large energy requirement due to the
associated lower CO2 partial pressure. By contrast, in IGCC power plants carbon
dioxide is captured in pre-combustion mode from a stream having a pressure higher
than 35 bar. IGCCs run gas turbines using H2-rich fuel gas (88–91 mol% H2 purity)
in CO2 capture cases instead of mixtures of CO and H2 in non-capture cases and it is
easy to produce ultrapure hydrogen product by purifying the H2-rich fuel gas. This

143
means that by replacing both the existing SMR H2 plant and the coal-fired power
plants with an advanced IGCC plant it would be possible to provide refining
complexes with ultrapure H2 and power simultaneously where CO2 can be inherently
captured, as depicted in Figure 4.1.
Figure 4.1: A conceptual diagram to compare general approach to capture CO2 from a
SMR H2 plant and a coal-fired power plant separately to an advanced IGCC process
for cogenerating power and ultrapure hydrogen with carbon capture (Luberti et al.,
2014a)
In producing ultrapure hydrogen (99.99+ mol%) from such a gas mixture as
composed of H2, CO2, CO, N2 and Ar, it is well-known that a PSA is the only
economically feasible separation process to be implemented in a commercial scale.
The multi-column PSA process, known as UOP Polybed, has been widely applied to
SMR H2 plants to produce ultrapure H2 from shifted syngas. However, the
conventional H2 PSA has been designed and optimised against a feed stream of
around 71% H2, 19% CO2, 4% CO and 5% CH4 at 20 bar found in a SMR H2
process. This composition and the pressure of the raw H2 feed in a SMR-based H2
plant is quite different from the raw H2 fuel gas in IGCC power plants with carbon
capture (88.75% H2, 2.12% CO2, 2.66% CO, 5.44% N2, 1.03% Ar at 34 bar). This
composition was obtained from both our previous simulation of the IGCC with
SMR H2 PlantCO2 Capture
(1-20 bar)
PC boiler Power Plant
CO2 Capture(1 bar)
IGCC + H2 PSA
AGR(35+ bar)
Existing Refining Plant
Carbon Capture
H2 + Power + Steam at a single plant
H2
PowerSteam
General approach This study
Coal/Heavy Residues(BottomlessRefinery)
NGLSR
Coal
Energy
Energy
LessEnergy

144
carbon capture and the DOE report (2007). Therefore, there is a need to revisit the
design of the H2 PSA process to estimate the H2 recovery and productivity obtained
at the operating conditions to meet the H2 product purity as high as 99.99+ mol%.
4.2 Design basis of a H2 PSA integrated with an IGCC
power plant
This study aims to design a H2 PSA system that is applicable to an advanced
IGCC plant for producing both ultrapure H2 and power. The advanced IGCC plant is
a modification of a conventional IGCC power plant with carbon capture to include a
new H2 PSA unit and its block flow diagram is illustrated in Figure 4.2.
Figure 4.2: Block flow diagram of an advanced IGCC process for cogenerating power
and ultrapure hydrogen
The process design of the conventional IGCC power plants with carbon capture
is based on an exemplary IGCC power plant using the Shell gasifier that was
described in detail in Chapter 2. In the conventional IGCC process, the treated
syngas leaving the AGR becomes saturated with water in a fuel gas saturation
column and then is fed to the combustion chamber of a gas turbine. In this study, the
treated syngas is split into two streams: one stream flows directly to a gas turbine for
power generation and the other is sent to a H2 PSA for ultrapure H2 production.
Given the plant capacity, the split ratio was determined to have a good balance
between the two cogenerating outputs in such a way to produce 110 MMSCFD of
ultrapure H2 and still to have the majority of the syngas used for electricity
generation in the combined cycle. The gross power generation is, in fact, decreased
2-stage
WGSRSyngas
Shift
steam
Shifted
syngas Dual-
stage
Selexol
H2S
CO2
H2
PSA
Gas
Turbine
Ultrapure
hydrogen
Flue gas to
HRSG
H2 PSA tail gas
Compressor

145
by around 31% from 694 MWe to 479 MWe. The H2 PSA tail gas obtained as a by-
product needs to be compressed up to the operating pressure of the gas turbine and
sent to the combustion chamber along with the H2-rich fuel gas.
Given the composition and the pressure of raw H2 feeds that a previous study
dealt with (Ahn et al., 2001), it was concluded that H2 PSA designs that were
configured with adsorption columns having two adsorbent layers would exhibit
better performance than those having adsorption columns packed with a single
adsorbent. This is because it is unlikely to find a versatile adsorbent that has better
working capacities than others for all the impurities contained in a raw H2 feed.
Therefore, a layered bed is usually configured such that an activated carbon layer
near the feed end plays a role in adsorbing mainly CO2 and CH4 while a zeolite layer
on top of the activated carbon layer removes CO and N2. The length ratio of the
carbon to zeolite layers is regarded as one of the key parameters that need to be
optimised (Ahn et al., 2001, 2012; Ribeiro et al., 2008; Yang and Lee, 1998; Park et
al., 1998). Given the composition of the new raw H2 feed that has relatively small
amount of CO2 and no CH4, however, it is plausible that an adsorption column
packed with zeolite 5A would perform better than those with a layered bed of
activated carbon and zeolite 5A.
The production of the H2 PSA tail gas should be minimised in order to reduce
the power consumption relating to its compression before being fed to the gas
turbine. In this study, the aim is to maximise H2 recovery by adding more columns to
the H2 PSA process to enable more complicated step configurations for minimising
the H2 loss and consumption. Knowing the maximum hydrogen recovery that a H2
PSA could achieve is essential in determining the mass balance around the H2 PSA,
i.e., the flowrate and the composition of both the ultrapure H2 product and the tail
gas. Once the mass balance is determined at the condition of maximum H2 recovery,
it is possible to estimate the auxiliary power consumption in the H2 PSA tail gas
compressor and the power generation in the gas and steam turbines accurately.
4.3 Adsorption equilibria
Adsorption equilibrium of pure hydrogen, carbon dioxide, carbon monoxide
and nitrogen on zeolite 5A were reported in the literature by Lopes et al. (2009). Data

146
were measured gravimetrically at 303, 323 and 343 K in the pressure range between
0 and 7 bar. Adsorption equilibrium isotherms of argon on zeolite 5A were found in
Miller et al. (1987) at 297, 233 and 203 K and at pressures up to 4 bar. Given the
high non-linearity of carbon dioxide isotherms, the adsorption equilibria were
predicted by the following extended dual-site Langmuir model:
cN
j jj
iis
n
j jj
iis
i
Pyb
Pybq
Pyb
Pybqq
1 ,2
,22,
1 ,1
,11,
11 (4-1)
with
RT
Hbb
in
inin
,
0,,,
~
exp n = 1,2
Experimental data (Lopes et al., 2009; Miller et al., 1987) were fitted using Origin
8.5 software (OriginLab, 2010). For the fitting purposes, the adsorbent capacities at
saturation qs,1 and qs,2 were determined as those of the most strongly adsorbed
component, which in this case is CO2, at the lowest temperature. Due to
thermodynamic consistency (Ruthven, 1984), these capacities were kept fixed for the
other temperatures and for all the other components’ isotherm fittings. Having three
isotherms at different temperatures for each component, it was possible to calculate
bi,0 and ΔHi with a linear regression of ln(bi) over 1/T. The isotherm parameters of
the dual-site Langmuir model with the relative standard errors are given in Table 4.1.
Note that these parameters are the optimal values for the fitting of experimental data
and do not have a rigorous physical meaning. Adsorption equilibrium data and
related dual-site Langmuir model predictions are shown in Figures 4.3 to 4.7.
Table 4.1: Isotherm parameters of dual-site Langmuir model for zeolite 5A
Gas qs,1
(mol/kg)
qs,2
(mol/kg)
b1,i,0
(bar-1
)
b2,i,0
(bar-1
)
(-ΔH1,i)
(J/mol)
(-ΔH2,i)
(J/mol)
H2 0.7077
± 0.00%
3.711
± 0.00%
4.227×10⁻⁷
± 4.15%
1.333×10⁻⁴
± 0.62%
19,674
± 8.17%
9,282
± 1.54%
CO2 0.7077
± 0.00%
3.711
± 0.00%
1.077×10⁻⁷
± 2.72%
1.233×10⁻⁴
± 7.23%
38,312
± 3.08%
29,808
± 5.87%
CO 0.7077
± 0.00%
3.711
± 0.00%
2.431×10⁻⁸
± 2.06%
2.321×10⁻⁵
± 0.03%
47,736
± 2.05%
20,994
± 0.05%
N2 0.7077
± 0.00%
3.711
± 0.00%
2.141×10⁻⁶
± 5.99%
8.987×10⁻⁵
± 3.66%
31,338
± 6.64%
14,956
± 6.09%
Ar 0.7077
± 0.00%
3.711
± 0.00%
5.952×10⁻⁸
± 7.71%
1.424×10⁻⁴
± 2.23%
26,828
± 9.32%
13,193
± 2.81%

147
Figure 4.3: Adsorption equilibrium of hydrogen on 5A zeolite. Solid lines: dual-site
Langmuir model. Experimental data by Lopes et al. (2009)
Figure 4.4: Adsorption equilibrium of carbon dioxide on 5A zeolite. Solid lines: dual-
site Langmuir model. Experimental data by Lopes et al. (2009)
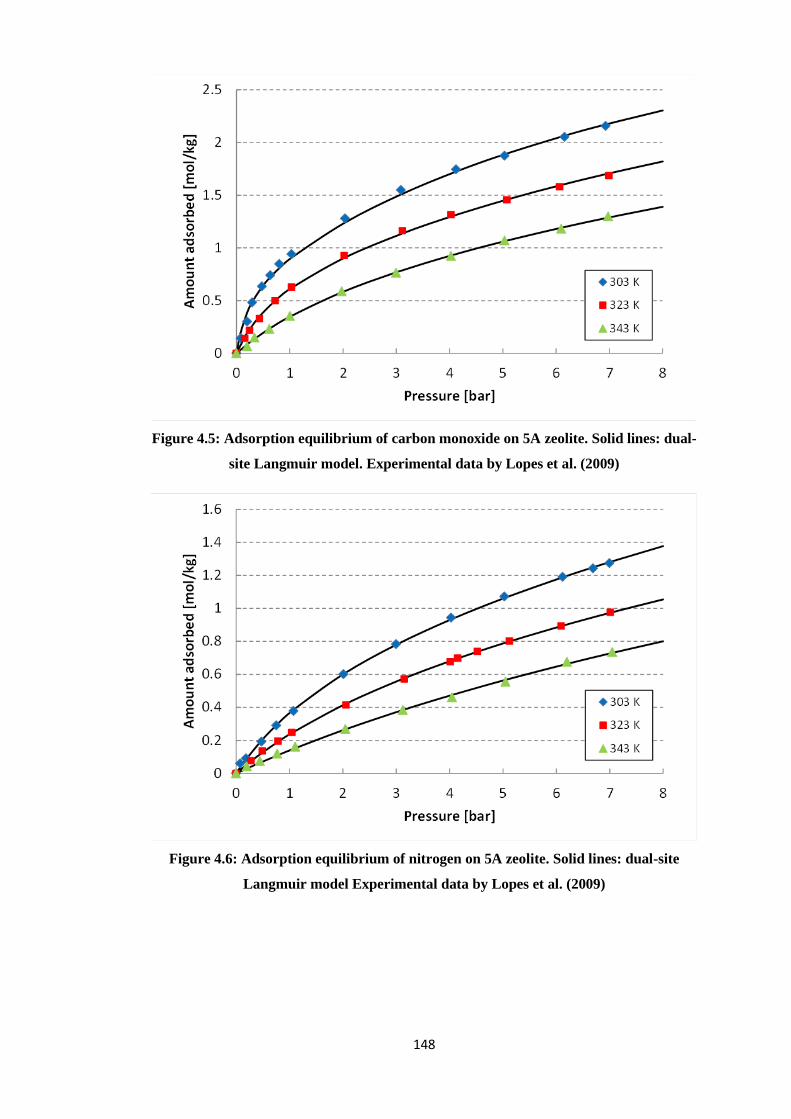
148
Figure 4.5: Adsorption equilibrium of carbon monoxide on 5A zeolite. Solid lines: dual-
site Langmuir model. Experimental data by Lopes et al. (2009)
Figure 4.6: Adsorption equilibrium of nitrogen on 5A zeolite. Solid lines: dual-site
Langmuir model Experimental data by Lopes et al. (2009)

149
Figure 4.7: Adsorption equilibrium of argon on 5A zeolite. Solid lines: dual-site
Langmuir model. Experimental data by Miller et al. (1987)
From the previous figures, it can be seen that the adsorption capacity of the 5A
zeolite is: CO2 > CO > N2 > Ar > H2. As expected, carbon dioxide isotherms are
much steeper than those of the other gases, with hydrogen isotherms being
practically linear in the examined range of temperatures and pressures. From the
fitting parameters shown in Table 4.1, it is clear that the heats of adsorption of CO2
are higher than the other gases: for the different components, it follows the same
order as the adsorption capacities. Figure 4.8 compares the equilibrium isotherms of
the five components of the IGCC feed stream entering the H2 PSA unit at 303 K.
Since argon isotherms become approximately linear going from 203 K to 297 K they
can be safely extended to higher temperatures as 303 K and above.

150
Figure 4.8: Adsorption equilibrium comparison of hydrogen, carbon dioxide, carbon
monoxide, nitrogen and argon on 5A zeolite at 303 K
4.4 Simulation of the H2 PSA unit
Due to its complicated nature and multiple decision parameters, including plant
dimensionality and operation conditions, the design of a PSA process is not a trivial
task. Some works in the literature focused on general heuristics for a preliminary
design of PSA, including the selection of adsorbent, particle size, bed size, bed
configuration, pressure equalisations, etc. (Jain et al., 2003). In a H2 PSA unit, a
complex configuration involving a higher number of beds is essential to increase the
product recovery at the same product purity. In order to simulate the behaviour of
such PSA configurations, two different approaches can be employed: the “unibed”
and the “multibed” (Jiang et al., 2004). The unibed approach assumes that all beds
undergo identical steps so only one bed is needed to simulate the multibed cycle.
Information about the effluent streams is stored in data buffers and linear
interpolation is used to obtain information between two time points. The multibed
approach considers a multibed process as a sequence of repetitive stages within the
cycle. Nikolic et al. (2008) developed a generic modelling framework for multibed
PSA flowsheets. The framework is general enough to support an arbitrary number of

151
beds, a customised complexity of the adsorbent bed model, one or more adsorbent
layers, all feasible PSA step configurations and interbed connectivities.
In all the simulations, the set of the partial and ordinary differential equations
and the algebraic equations were solved using the in-house CySim simulator
(Friedrich et al., 2013; Luberti et al., 2014a). After preliminary simulations using the
multibed approach for the four-column system, a unibed approach was developed
and validated by comparison with the multibed approach. For more complex cycle
configurations, the unibed approach was always utilised to save computational time.
The unibed CySim PSA flowsheet is depicted in Figure 4.9.
The complete modelling of a PSA process includes the mathematical model of
the different adsorption columns coupled with the individual models of ancillary
equipment. As well as the adsorption columns, the entire flowsheet includes:
Valves: They are considered as delay elements and can result in a significant
disturbance to the flow regime. They can be operated as mass flow controllers
(MFC) or pressure-driven controllers (PDC). The related equations are:
iFF (MFC) (4-2)
f
T
PccvF
(PDC) (4-3)
where cv is the valve coefficient. After calculating the flow rate, F, this value
is multiplied by the valve stem position. The stem position of the valve
indicates if the valve is open or closed. Here 0 indicates a closed valve, 0.5 a
half-open valve and 1 a fully open valve. CySim allows the opening and
closing of valves at specified times. Pressure, temperature and gas
composition are passed through the valve to the neighbouring units. In the
model the valves are opened and closed instantaneously without delay times.
Splitters/mixers: These units consist of a perfectly mixed tank (CSTR) and an
arbitrary number of connections. For all other connections, the flow rate of
the neighbouring unit is passed into the splitter/mixer. These flow rates define
if the unit works as a splitter, a mixer, or a combination of splitter and mixer.
A small default dead volume of 10-6
m3 is associated with these units.
Sources/sinks: These units set the boundary conditions for the simulated
system and calculate the number of moles of each component to pass through

152
the outlet. It establishes the real operating conditions of the connections to the
rest of the plant.
Buffers: They are essential for storing information (pressure, temperature,
composition) of streams leaving the column that will be returned in a
following step. They are used for purge and pressure equalisation steps.
Figure 4.9: Unibed CySim PSA flowsheet
The aim of this study is to design a H2 PSA process with a capacity of 110 H2
MMSCFD that is approximately equivalent to 1,609 H2 mol/s. Given the H2 mole

153
fraction in the raw H2 feed, the required flowrate of a raw H2 feed flowing to the H2
PSA would be around 2,015 mol/s, assuming 90% H2 recovery. According to the
design of the IGCC power plant with carbon capture using a Shell dry coal-fed
gasifier (DOE Case 6, 2007), the advanced IGCC plant for cogeneration of power
and ultrapure hydrogen would be configured such that around 40% of the raw H2 gas
is directed to the H2 PSA. The remaining 60% of this raw H2 gas flows to a syngas
humidifier and subsequently to a combustion chamber in the gas turbine, just as in
the conventional IGCC power plant (Figure 4.2).
Table 4.2: List of column parameters, particle parameters and operating conditions of
H2 PSA simulations (Luberti et al., 2014a)
Column parameters
Column length, Lc (m) 0.5
Column internal diameter, Dc (m) 0.025
External bed void fraction, ε (-) 0.391
Axial mass dispersion coefficient, Dz (m2/s) 1.2×10
4
Axial thermal dispersion coefficient, kz (W/m·K) 1.3
Wall heat transfer coefficient, hw (W/m2·K) 95.0
Adsorbent parameters
Pellet density, ρp (kg/m3) 1,126
Pellet void fraction, εp (-) 0.503
Adsorbent specific heat capacity, cP,s (J/kg·K) 920
Pellet averaged diameter, dp (mm) 1.70
Macropore LDF coefficient, kip·Ap/Vp
H2/CO2/CO/N2 /Ar (s-1
) 9.22/6.07/7.52/7.90/7.28
Micropore LDF coefficient, kicr·3/rc
H2/CO2/CO/N2 /Ar (s-1
)
0.7467/0.0017/0.0332/0.1697/0.1800
(Lopes et al., 2009)
Operating conditions
Pads (bar) 34
Pdes (bar) 1
Tfeed (K) 303
Qfeed (mol/s) 0.002
Feed composition, yH2/yCO2/yCO/yN2/yAr (molar) 0.8875/0.0212/0.0266/0.0544/0.0103
Planning as a future work an experimental campaign to validate the simulation
results subsequent to this study, the dimension of adsorption columns in this study
was determined to be the same as those of a lab-scale six-column PSA rig, as shown
in Table 4.2. Given the column size and dimensions, the feed flowrate was set at

154
0.002 mol/s with a scaling factor of approximately 106
. The values of other
parameters used in the simulation are also presented in Table 4.2: most of the column
and adsorbent parameters were estimated with the correlations described in detail in
Chapter 3 and the data reported by Lopes et al. (2009). The discretisation method for
the spatial domain in the column was central finite difference method with 20 grid
points along the column. In CySim the system of differential algebraic equations was
solved with the DAE solver SUNDIALS (Friedrich et al., 2013).
4.5 Adsorption breakthrough results
First, adsorption breakthroughs of the five-component mixture were simulated
using the parameters reported in Table 4.2. Figure 4.10 shows the mole fraction
profiles of all components with time at product end in two different scales of mole
fraction. It was assumed that the column was initially filled with pure hydrogen.
Figure 4.10: Breakthrough simulation results of the shifted syngas stream on zeolite 5A
bed at 303 K and 34 bar. Column size and feed condition are reported in Table 4.2
From Figure 4.10 it can be seen that the first contaminant to breakthrough the
column is argon, followed by nitrogen, carbon monoxide and carbon dioxide. Since
argon breakthroughs at around 420 s, the adsorption step time of any PSA cycle has
to be lower than this value in order to meet the required hydrogen purity (99.99+%).

155
Argon and nitrogen are expected to be the major impurities in the product hydrogen
stream since they are the least strongly adsorbed components. Carbon monoxide and
carbon dioxide are apparently not problematic because their breakthrough times are
much longer at around 1200 s and 8100 s, respectively, following the order dictated
by the adsorption capacity. Carbon monoxide content must, however, be monitored
because it is the most hazardous impurity for the product specification. For fuel cell
application, H2 should contain less than 10 ppm CO because CO works as a poison
on the anode catalyst and dramatically decreases the fuel cell performance (Majilan
et al., 2009; You et al., 2012).
4.6 PSA cycle simulation results
Six different H2 PSA systems were investigated to see the change of H2
recovery and productivity with different levels of complexity of the step
configuration, which is subject to the different number of columns. The H2 recovery
and productivity obtained at different configurations were compared under the
operating condition to meet the specification of the H2 purity (99.99+ mol%). Since
the aim is to maximise hydrogen recovery, a simple two-column system where only
one pressure equalisation step can be deployed was not investigated.
First, a four-column H2 PSA system was simulated and the targeted H2 purity
was obtained at a cycle time of 800 seconds. Since all the simulations were carried
out at a constant feed flowrate of 0.002 mol/s, the total cycle time became longer as
more columns that are identical in size and dimension were added to configure six-,
nine-, twelve- and sixteen-column H2 PSA systems. This is because either more than
one column can share the total feed gas for adsorption at the same time or more steps
need to be included in one cycle. To evaluate whether or not a simulation reaches its
cyclic steady state (CSS), the H2 purity and recovery from each cycle were compared
with those at the previous cycle. It was assumed that a cyclic steady state would be
reached if the differences of the H2 purity and recovery between the new and
previous cycles were both less than 106
.

156
4.6.1 Four-column H2 PSA
A four-column H2 PSA unit is designed such that a providing purge step is
located between the two depressurising pressure equalisation (DPE) steps while the
two pressurising pressure equalisation (PPE) steps take place in a row after the purge
step, as shown in Figure 4.11. The step configuration was reconstructed in reference
to the step configuration reported in the literature (Cassidy, 1980).
Figure 4.11: Step configuration of a four-column PSA cycle (AD: adsorption, DPE:
depressurising pressure equalisation, PP: providing purge, BD: blowdown, PU: purge,
PPE: pressurising pressure equalisation, PR: product pressurisation, tAD = tcycle/4; tPR =
3tcycle/16; tPP = tPU = tcycle/8; tBD = tDPE = tPPE = tcycle/16)
In the four-column H2 PSA simulation, the total cycle time was fixed at 800
seconds with the adsorption step-time equivalent to 1/4 of the cycle time, as shown in
Figure 4.11. The purge flow is generated by reducing the column pressure starting
from a pressure at the end of the first DPE step to a pressure that can be chosen at the
operator’s disposal. The equilibrated pressure at the start (or end) of the second DPE
step (or the second PPE step) is subject to how much purge flow is generated during
the providing purge step. Accordingly, the equilibrated pressure at the end (or start)
of the first DPE step (or the first PPE step) is also affected by the amount of purge
PPAD BD PU PPE2 PPE1DPE1 DPE2 PR
AD DPE1 PP DPE2 BD PU PPE2 PPE1 PR
BD PU PPE2 PPE1 PR AD DPE1 PP DPE2
DPE1 PP DPE2 BD PU PPE2 PPE1 PR AD
PPE1 PR AD DPE1 PP DPE2 BD PU PPE2

157
flow. The step configuration where the providing purge step is located between the
two DPE steps has a clear advantage over a cycle where the providing purge step
follows the two DPE steps in that it can increase the purge flowrate to a greater
extent since the providing purge step can start at a higher pressure. Therefore, this
configuration is capable of controlling the product purity in a wider range without
having to change the cycle time. It should be noted that the pressure recovery during
the pressure equalisation in this four-column H2 PSA would decrease with an
increasing purge flowrate since the equilibrated pressure at the end of each pressure
equalisation stage is affected by the amount of purge flow, as shown in Figure 4.12.
By contrast, the pressure recovery can be maintained at a constant level regardless of
the change of purge flowrate in the configuration where the providing purge step is
located after finishing all the DPE steps.
Figure 4.12: Pressure profiles at the product end of a column over a cycle at the cyclic
steady state of the four-column H2 PSA unit: effect of the different amounts of purge
flow
As shown in Figure 4.12, the pressure profile of a column over a cycle is varied
in response to the use of the different amounts of the purge flow investigated in this
section. The actual flowrate of the purge gas flowing between two columns under the
providing purge and purge steps must decrease with the step time since the driving
0 100 200 300 400 500 600 700 8000
5
10
15
20
25
30
35
Pre
ssure
[bar]
Time [s]
PP/F=0.1
PP/F=0.2
PP/F=0.3
DPE1 PP BD PU PPE2 PPE1 PRAD
DPE2

158
force diminishes with decreasing pressure difference between the columns.
Therefore, an index of PP/F to quantify the varying purge flow as an average purge
flow is introduced in this context. The PP/F denotes the ratio of an average molar
purge flowrate being generated from one column during the providing purge step to a
molar feed flowrate to one column for adsorption during one cycle. Note that the
amount of the feed flowing to one column is not the same as the total amount of the
feed flowing to a PSA system if more than one column shares the total feed flow.
The three different numbers of PP/F that were tested in the three runs are shown in
Figure 4.12 and Table 4.3. As expected, the start and end pressures during the
providing purge step become lower with increasing PP/F.
The targeted H2 purity of 99.99+ mol% was achieved in Run 2 where during
the providing purge step the column pressure changed from 21.5 to 17 bar, which
was equivalent to a PP/F of 0.2. At this operating condition, the H2 recovery and bed
productivity were 72.68% and 162.67 molH2/kg/day, respectively.
Table 4.3: Performances of the four-column H2 PSA system at different purge flow
rates
Adsorption
time [s]
H2 purity
[%]
H2 recovery
[%]
Bed productivity
[molH2/kgads/day]
Run 1 (PP/F = 0.1) 200 99.976 75.09 168.06
Run 2 (PP/F = 0.2) 200 99.995 72.68 162.67
Run 3 (PP/F = 0.3) 200 99.999 70.56 157.93
Figure 4.13 reports the component mole fraction profiles at the feed end over a
cycle at the cyclic steady state for Run 2. Hydrogen mole fraction is at feed
concentration during the adsorption step and progressively diminishes during the
depressurisation equalisation and blowdown steps. It starts to increase again from the
purge step because the providing purge stream is H2-rich, until it reaches a maximum
during the final repressurisation step with the ultrapure H2 product. An opposite trend
is observed for all the impurities having a very low mole fraction during adsorption
and pressurisation steps, and relatively high during blowdown and purge steps. Since
hydrogen is produced ultrapure in the raffinate, the off-gas stream leaving the
column during the blowdown and purge steps will be enriched by the impurities

159
proportionally to their content in the feed. With a H2 recovery of 72.68%, hydrogen
will still be the most abundant component in the off-gas, accounting for around 66%.
At cyclic steady state, the column is relatively saturated with impurities at the
end of the adsorption step, as shown in Figures 4.14 and 4.15 for Run 2. It is noticed
that within four-fifths of the column length, the hydrogen mole fraction reaches the
ultrapure condition target (99.99+ mol%) while all the impurities approach zero, but
in different column locations. Carbon dioxide and carbon monoxide, being the most
strongly adsorbed components, are adsorbed mainly in the first portion of the
column. Nitrogen and argon mole fractions show firstly an almost flat decrease in the
first 10 cm of the column and then are lowered more quickly after CO2 and CO are
abated.
Figure 4.13: Component mole fraction profiles at the feed end of a column over a cycle
at the cyclic steady state of the four-column H2 PSA unit (Run 2)
0 100 200 300 400 500 600 700 8000
0.1
0.2
0.3
0.4
0.5
0.6
0.7
0.8
0.9
1
Time [s]
Mole
fra
ction [
-]
H2
CO2
CO
N2
Ar
PPE2
PPE1 PRAD DPE1 PP DPE2 BD PU

160
Figure 4.14: Hydrogen mole fraction profile along the column at the end of adsorption
step at the cyclic steady state of the four-column H2 PSA unit (Run 2)
Figure 4.15: Impurities mole fraction profiles along the column at the end of adsorption
step at the cyclic steady state of the four-column H2 PSA unit (Run 2)
Figure 4.16 shows the evolution of the hydrogen purity and recovery with
cycle number for Run 2. It can be seen that a cyclic steady state is achieved only
after 400 cycles with an increasing recovery and a decreasing purity after each cycle.
0 0.1 0.2 0.3 0.4 0.50.88
0.9
0.92
0.94
0.96
0.98
1
Column length [m]
Mole
fra
ction [-]
H2
0 0.1 0.2 0.3 0.4 0.50
0.01
0.02
0.03
0.04
0.05
0.06
Column length [m]
Mole
fra
ction [-]
CO2
CO
N2
Ar

161
The main reason for this delay in achieving CSS is the complexity of the
mathematical model associated with the five-component mixture. These trends and
results are confirmed by other studies reported in the literature on PSA processes for
hydrogen purification (Riberio et al., 2008; Lopes et al., 2011).
Figure 4.16: Evolution of hydrogen purity and recovery through the cycles (Run 2)
4.6.2 Six-column H2 PSA
In the case of six-column H2 PSA systems, two different step configurations
were investigated. The first configuration (Figure 4.17) features feeding the raw H2
to two columns at the same time, that is to say, each of two columns receives half the
raw H2 feed (Malek and Farooq, 1997). Due to two columns being used for
adsorption in a cycle, the first configuration cannot accommodate an additional
pressure equalisation step but has the two-stage pressure equalisation, which is the
same as the above-mentioned four-column PSA system. Contrary to the four-column
PSA system, a providing purge step is placed after the two pressure equalisation
steps, as shown in Figure 4.17. It is anticipated that the alteration to the step
configuration would be capable of improving the H2 recovery since more pressure
can be recovered during the pressure equalisation steps. That is to say, less
consumption of pure hydrogen for product pressurisation and the reduced feed

162
flowrate to one column for adsorption enables more efficient use of the column due
to less ingress of impurities into the product end.
Figure 4.17: Step configurations of a six-column H2 PSA cycle with two-stage pressure
equalisation (AD: adsorption, DPE: depressurising pressure equalisation, ID: idle, PP:
providing purge, BD: blowdown, PU: purge, PPE: pressurising pressure equalisation,
PR: pressurisation, tAD = tcycle/3; tPP = tPU = tPR = tcycle/9; tBD = tDPE = tPPE= tcycle/18)
In the second configuration (Figure 4.18), however, only one column is taken
up for high-pressure adsorption in a cycle, just as in the four-column H2 PSA.
Therefore, it is possible to configure a PSA cycle with three-stage pressure
equalisation. The step configuration was reconstructed from a patent found in the
literature (Xu et al., 2002). It is generally expected that the more pressure
equalisation stages a PSA cycle contains, the higher the hydrogen recovery. This is
because less hydrogen product is required during the product pressurisation step
since the column can be pressurised to a higher pressure in advance during the PPE
steps. It should be noted that while the first six-column configuration has only an idle
step between the depressurising equalisation steps, the second configuration should
include two idle steps before and after the second pressurising equalisation step.
IDAD PP BD PPE2 PPE1DPE1 DPE2 PRPU
AD DPE1 ID DPE2 PP BD PU PPE2 PPE1 PR
PPE1 PR AD DPE1 ID DPE2 PP BD PU PPE2
PU PPE2 PPE1 PR AD DPE1 ID DPE2 PP BD
PP BD PU PPE2 PPE1 PR AD DPE1 ID DPE2
DPE1 ID DPE2 PP BD PU PPE2 PPE1 PR AD
AD DPE1 ID DPE2 PP BD PU PPE2 PPE1 PR AD

163
During an idle step, the column is completely disconnected from the surroundings
and this is necessary for the synchronisation of the entire system over a cycle.
Figure 4.18: Step configurations of a six-column H2 PSA cycle with three-stage pressure
equalisations (AD: adsorption, DPE: depressurising pressure equalisation, PP:
providing purge, BD: blowdown, PU: purge, ID: idle, PPE: pressurising pressure
equalisation, PR: pressurisation, tAD = tcycle/6; tPP = tPU = tPR = tcycle/9; tBD = tDPE = tPPE =
tID= tcycle/18)
Figures 4.19 and 4.20 clearly exhibit the change of the pressure profile caused
by adding one more pressure equalisation steps to a PSA cycle. The first
configuration with only two pressure equalisation steps (Figure 4.19) recovers less
pressure during the pressure equalisation steps and consumes more hydrogen product
during the product pressurisation step than the second configuration with three-stage
pressure equalisation (Figure 4.20). In both the configurations, it can be seen that
during the idle step the pressure remains constant for its duration.
ID1AD PP BD PPE3 PPE2DPE1 DPE2 PRPUDPE3 ID2 PPE1
AD DPE1 DPE2 DPE3 PP BD PU PPE3 ID1 PPE2 ID2 PPE1 PR
PPE1 PR AD DPE1 DPE2 DPE3 PP BD PU PPE3 ID1 PPE2 ID2
ID1 PPE2 ID2 PPE1 PR AD DPE1 DPE2 DPE3 PP BD PU PPE3
PU PPE3 ID1 PPE2 ID2 PPE1 PR AD DPE1 DPE2 DPE3 PP BD
PP BD PU PPE3 ID1 PPE2 ID2 PPE1 PR AD DPE1 DPE2 DPE3
DPE1 DPE2 DPE3 PP BD PU PPE3 ID1 PPE2 ID2 PPE1 PR AD

164
Figure 4.19: Pressure profile at the product end of a column over a cycle at the cyclic
steady state of six-column H2 PSA simulation at PP/F = 0.3 with two-stage pressure
equalisation (Run 6)
Figure 4.20: Pressure profile at the product end of a column over a cycle at the cyclic
steady state of six-column H2 PSA simulation at PP/F = 0.3 with three-stage pressure
equalisation (Run 10)
0 400 800 1200 1600 2000 24000
5
10
15
20
25
30
35
Pre
ssure
[bar]
Time [s]
(a)
ADID PP PU PRPDE2 PPE2BD PPE1
DPE1
0 250 500 750 1000 1250 15000
5
10
15
20
25
30
35
Pre
ssure
[bar]
Time [s]
(b)
AD
DPE1
PP BD PU ID1 PPE2 ID2 PRPDE2 PDE3 PPE3 PPE1

165
As observed in Table 4.4, the first and second configurations can achieve the
targeted H2 purity (99.99+ mol%) with cycle times of 2400 and 1500 seconds,
respectively (Runs 6 and 10). The adsorption time in Run 6 (800 seconds) is more
than three times longer than that in Run 10 (250 seconds) even though the feed gas
entering one column for adsorption is just halved in flowrate. This can be explained
by two reasons. Firstly, the reduced feed flow to one adsorption column for
adsorption prevents the ingress of impurities into the product end so it can allow a
cycle to have a longer adsorption time. Secondly, the first configuration with only
two-stage pressure equalisation has a better working capacity than the second
configuration since its column can be more thoroughly regenerated by a stream
having more hydrogen and pressurised by more ultrapure hydrogen during the
product pressurisation step. Therefore, it implies that the H2 recovery would increase
with more stages of pressure equalisation in a cycle but the working capacity of the
columns would deteriorate due to purging and pressurising the column with more
impure gases.
Table 4.4: Performance of six-column H2 PSA simulations
Adsorption
time [s]
H2 purity
[%]
H2 recovery
[%]
Bed productivity
[molH2/kgads/day]
First configuration (Two-stage pressure equalisation)
Run 4 600 99.999 78.75 117.51
Run 5 700 99.996 81.98 122.33
Run 6 800 99.994 84.41 125.95
Run 7 900 99.975 86.29 128.75
Second configuration (Three-stage pressure equalisation)
Run 8 150 99.999 76.11 113.57
Run 9 200 99.997 82.47 123.05
Run 10 250 99.994 86.26 128.71
Run 11 300 99.969 88.79 132.48
It is noteworthy that the hydrogen recovery is enhanced by around 12%
increasing from four columns (Run 2) to six columns (Runs 6) only by changing the
step configuration in spite of both having the same number of pressure equalisation

166
steps. This change is not only caused by less hydrogen consumption during the
product pressurisation step but also the longer adsorption time.
At the operating condition of Run 10, the H2 recovery increases further up to
86.26%, mainly due to enhanced pressure recovery taking place over the three-stage
pressure equalisation. The stream leaving the column in the course of reducing the
column pressure from 34 bar to 9 bar can be reused for pressurising other columns
and a significantly lower amount of hydrogen product is required for product
pressurisation.
The bed productivities of both six-column H2 PSA configurations are similar
but lowered in comparison to that of the four-column H2 PSA performance at the
targeted H2 purity. The change of the bed productivity can be explained with respect
to the increasing number of columns (or increasing total amount of adsorbents being
utilised) and the increasing H2 recovery. The reduction of the bed productivity from
four- to six-column H2 PSA is due to the increase of the H2 recovery being less than
the corresponding increase of the amount of adsorbent utilised during the adsorption
step.
4.6.3 Polybed H2 PSA (nine and twelve columns)
As mentioned above, the more columns that are deployed, the higher the
anticipated hydrogen recovery in a H2 PSA system. In this respect, Polybed H2 PSA
processes containing seven to sixteen beds with at least three pressure equalisation
steps and at least two columns receiving the feed gas for adsorption have been
commercially operated for the purpose of H2 purification (Yang, 1987). Complex
PSA cycle schedules involved in Polybed systems have been studied in detail in the
literature. Ebner et al. (2010) developed a graphical approach for obtaining various
PSA cycle schedules. This novel PSA scheduling method involves a systematic
procedure to fill the entire cycle schedule grid simultaneously, enabling complex,
multibed, multi-step, PSA systems. Mehrotra et al. (2011) improved this method by
filling only a portion of the schedule grid, called the unit block, making this approach
much quicker and easier to implement. Mehrotra et al. (2010) also introduced an
arithmetic approach for complex PSA cycle scheduling. This novel approach
involved a priori specifying the cycle steps, their sequence and any constraints, and

167
then required solving a set of algebraic equations. The solution identified all the
cycle schedules for a given number of beds, the minimum number of beds required to
operate the specified cycle step sequence, the minimum number and location of idle
steps to ensure alignment of coupled cycle steps, and a simple screening technique to
aid in identifying the best performing cycles that deserved further examination.
In this section a nine-column, 11-step system following the step configuration
found in the literature is investigated (Fuderer and Rudelstorfer, 1976), as shown in
Figure 4.21. Figure 4.22 shows the pressure profile of the nine-column PSA system
over a cycle at its cyclic steady state.
Figure 4.21: Step configurations of a nine-column H2 PSA cycle (AD: adsorption, DPE:
depressurising pressure equalisation, PP: providing purge, BD: blowdown, PU: purge,
PPE: pressurising pressure equalisation, PR: pressurisation, tAD = tcycle/3; tPP = tPU =
tcycle/9; tBD = tDPE = tPPE = tPR= tcycle/18)
AD PP BD PPE3 PPE2DPE1 DPE2 PRPUDPE3 PPE1
AD DPE1 DPE2 DPE3 PP BD PU PPE3 PPE2 PPE1 PR
PPE1 PR AD DPE1 DPE2 DPE3 PP BD PU PPE3 PPE2
PPE3 PPE2 PPE1 PR AD DPE1 DPE2 DPE3 PP BD PU
PU PPE3 PPE2 PPE1 PR AD DPE1 DPE2 DPE3 PP BD
PP BD PU PPE3 PPE2 PPE1 PR AD DPE1 DPE2 DPE3 PP
DPE3 PP BD PU PPE3 PPE2 PPE1 PR AD DPE1 DPE2
DPE1 DPE2 DPE3 PP BD PU PPE3 PPE2 PPE1 PR AD
AD DPE1 DPE2 DPE3 PP BD PU PPE3 PPE2 PPE1 PR AD
AD DPE1 DPE2 DPE3 PP BD PU PPE3 PPE2 PPE1 PR AD

168
Figure 4.22: Pressure profiles at the product end of a column over a cycle at the cyclic
steady state of a nine-column H2 PSA at PP/F = 0.3 (Run 14)
The nine-column 11-step H2 PSA system benefits from both reduced feed
flowrate to one column and intensified pressure equalisation at each of the two six-
column H2 PSA systems. The feed flowrate fed to one column for adsorption is
reduced to one-third of the total feed flowrate since three out of nine columns always
work for adsorption at the same time. The product pressurisation step starts at 26 bar
and the providing purge step commences at 8.5 bar, both of which are similar to
those at the second configuration of six-column H2 PSA system, as shown in Figures
4.20 and 4.22. This is because both PSA systems contain the same number of stages
of pressure equalisation in their cycle.
Furthermore, a twelve-column 13-step H2 PSA system was investigated in
order to increase the H2 recovery close to its maximum. The step configuration is
presented in Figure 4.23 and was originally shown in a patent (Xu et al., 2003). The
step configuration features simultaneous adsorption at three columns, simultaneous
providing purge and purge at two columns, and four-stage pressure equalisation.
Thanks to one additional pressure equalisation step, the product pressurisation step
starts at 27 bar and the providing purge step commences at 7.5 bar, as shown in
Figure 4.24.
0 600 1200 1800 2400 3000 36000
5
10
15
20
25
30
35
Pre
ssure
[bar]
Time [s]
AD
DPE1
PP BD PPE2 PPE1
PR
PUDPE2 DPE3 PPE3

169
Figure 4.23: Step configurations of a twelve-column H2 PSA cycle (AD: adsorption,
DPE: depressurising pressure equalisation, PP: providing purge, BD: blowdown, PU:
purge, PPE: pressurising pressure equalisation, PR: pressurisation, tAD = tcycle/4; tPP =
tPU = tcycle/6; tBD = tDPE = tPPE = tPR= tcycle/24)
Figure 4.24: Pressure profiles at the product end of a column over a cycle at the cyclic
steady state of a twelve-column H2 PSA at PP/F = 0.3 (Run 18)
AD DPE1 DPE2 DPE3 DPE4 PP BD PU PPE4 PPE3 PPE2 PPE1 PR
AD DPE1 DPE2 DPE3 DPE4 PP BD PU PPE4 PPE3 PPE2 PPE1 PR
PPE1 PR AD DPE1 DPE2 DPE3 DPE4 PP BD PU PPE4 PPE3 PPE2
PPE3 PPE2 PPE1 PR AD DPE1 DPE2 DPE3 DPE4 PP BD PU PPE4
PU PPE4 PPE3 PPE2 PPE1 PR AD DPE1 DPE2 DPE3 DPE4 PP BD PU
PU PPE4 PPE3 PPE2 PPE1 PR AD DPE1 DPE2 DPE3 DPE4 PP BD PU
BD PU PPE4 PPE3 PPE2 PPE1 PR AD DPE1 DPE2 DPE3 DPE4 PP
PP BD PU PPE4 PPE3 PPE2 PPE1 PR AD DPE1 DPE2 DPE3 DPE4 PP
PP BD PU PPE4 PPE3 PPE2 PPE1 PR AD DPE1 DPE2 DPE3 DPE4
DPE3 DPE4 PP BD PU PPE4 PPE3 PPE2 PPE1 PR AD DPE1 DPE2
DPE1 DPE2 DPE3 DPE4 PP BD PU PPE4 PPE3 PPE2 PPE1 PR AD
AD DPE1 DPE2 DPE3 DPE4 PP BD PU PPE4 PPE3 PPE2 PPE1 PR AD
AD DPE1 DPE2 DPE3 DPE4 PP BD PU PPE4 PPE3 PPE2 PPE1 PR AD
0 525 1050 1575 2100 2625 3150 3675 42000
5
10
15
20
25
30
35
Pre
ssure
[bar]
Time [s]
AD PP PU
PR
DPE3DPE4 BD
DPE1
PPE4DPE2 PPE3 PPE2PPE1

170
Table 4.5 lists the performance of the nine- and twelve-column H2 PSA
systems at their cyclic steady state. The nine-column H2 PSA system can achieve the
targeted H2 purity at the adsorption step time of 1200 seconds (Run 14). It should be
noted that the adsorption step time of the twelve-column H2 PSA to achieve the
targeted H2 purity (1050 seconds at Run 18) is shorter than that of the nine-column
H2 PSA in spite of the same feed flowrate fed to one column, i.e., one-third of the
total feed flowrate. This indicates that the column working capacity starts to
deteriorate due to more incomplete regeneration by a purge flow having less
hydrogen and by pressurising the column with more impure streams coming from
other columns during the PPE steps instead of ultrapure hydrogen during the product
pressurisation step. Nevertheless, the H2 recovery still increases from 91.85% in the
nine-column H2 PSA to 92.74% in the twelve-column H2 PSA. Since the
improvement of the H2 recovery is minimal, the bed productivity decreases
significantly from 91.41 molH2/kgads/day in the nine-column H2 PSA to 69.15
molH2/kgads/day with the twelve-column H2 PSA.
Table 4.5: Performance of nine- and twelve-column PSA simulations
Adsorption
time [s]
H2 purity
[%]
H2 recovery
[%]
Bed productivity
[molH2/kgads/day]
Nine-column H2 PSA
Run 12 800 99.998 87.05 86.64
Run 13 1000 99.996 89.94 89.51
Run 14 1200 99.993 91.85 91.41
Run 15 1300 99.974 92.58 92.14
Twelve-column H2 PSA
Run 16 750 99.999 89.11 66.52
Run 17 900 99.996 91.17 68.06
Run 18 1050 99.993 92.74 69.15
Run 19 1200 99.978 93.83 70.04

171
4.6.4 Sixteen-column H2 PSA
From the previous section, it was observed that switching from the nine-
column to the twelve-column Polybed system could achieve only a marginal
hydrogen recovery rise (less than 1%) at the sacrifice of a remarkable increase in the
CAPEX of the unit due to the significant reduction in the bed productivity. This
situation can be further exacerbated considering a final sixteen-column 15-step H2
PSA system. The step configuration is presented in Figure 4.25 and was again shown
in the patent by Xu et al. (2003). The step configuration features simultaneous
adsorption at four columns, simultaneous providing purge and purge at three
columns, and five-stage pressure equalisation. The time unit is 1/32 of the total cycle
time.
Figure 4.25: Step configurations of a sixteen-column H2 PSA cycle (AD: adsorption,
DPE: depressurising pressure equalisation, PP: providing purge, BD: blowdown, PU:
purge, PPE: pressurising pressure equalisation, PR: pressurisation, tAD = tcycle/4; tPP =
tPU = 3tcycle/16; tBD = tDPE = tPPE = tPR= tcycle/32)
AD DE1 DE2 DE3 DE4 DE5 PP BD PU PE5 PE4 PE3 PE2 PE1 PR
PE1 PR AD DE1 DE2 DE3 DE4 DE5 PP BD PU PE5 PE4 PE3 PE2
PE3 PE2 PE1 PR AD DE1 DE2 DE3 DE4 DE5 PP BD PU PE5 PE4
PE5 PE4 PE3 PE2 PE1 PR AD DE1 DE2 DE3 DE4 DE5 PP BD PU
PU PE5 PE4 PE3 PE2 PE1 PR AD DE1 DE2 DE3 DE4 DE5 PP BD PU
PU PE5 PE4 PE3 PE2 PE1 PR AD DE1 DE2 DE3 DE4 DE5 PP BD PU
PU PE5 PE4 PE3 PE2 PE1 PR AD DE1 DE2 DE3 DE4 DE5 PP BD
PP BD PU PE5 PE4 PE3 PE2 PE1 PR AD DE1 DE2 DE3 DE4 DE5 PP
PP BD PU PE5 PE4 PE3 PE2 PE1 PR AD DE1 DE2 DE3 DE4 DE5 PP
PP BD PU PE5 PE4 PE3 PE2 PE1 PR AD DE1 DE2 DE3 DE4 DE5 PP
DE5 PP BD PU PE5 PE4 PE3 PE2 PE1 PR AD DE1 DE2 DE3 DE4
DE3 DE4 DE5 PP BD PU PE5 PE4 PE3 PE2 PE1 PR AD DE1 DE2
DE1 DE2 DE3 DE4 DE5 PP BD PU PE5 PE4 PE3 PE2 PE1 PR AD
AD DE1 DE2 DE3 DE4 DE5 PP BD PU PE5 PE4 PE3 PE2 PE1 PR AD
AD DE1 DE2 DE3 DE4 DE5 PP BD PU PE5 PE4 PE3 PE2 PE1 PR AD
AD DE1 DE2 DE3 DE4 DE5 PP BD PU PE5 PE4 PE3 PE2 PE1 PR AD

172
From Table 4.6, it can be seen that with an additional pressure equalisation step
hydrogen recovery increases in Run 22 only by 0.3% compared to the twelve column
system while the productivity continues to diminish, mainly due to the reduction to
one-fourth of the total flowrate entering one bed. Because of the elevated CAPEX
associated with this unit and the extremely marginal H2 recovery increase, this
configuration was not taken into account for the following comparison among the
PSA cycles in the next section.
Table 4.6: Performance of sixteen-column PSA simulations
Adsorption
time [s]
H2 purity
[%]
H2 recovery
[%]
Bed productivity
[molH2/kgads/day]
Run 20 900 99.996 90.08 50.40
Run 21 1050 99.994 91.74 51.33
Run 22 1200 99.992 93.07 52.08
Run 23 1350 99.976 94.21 52.71
4.6.5 Comparison among various PSA cycles
So far, the hydrogen recovery and bed productivity have been compared at the
targeted H2 purity of around 99.99+ mol% among various H2 PSA cycles with
different numbers of columns and different step configurations. As already
mentioned, the bed productivity was reduced with the increasing number of columns
while the H2 recovery improved. The increased number of pressure equalisation steps
reduced the total amount of hydrogen lost in the blowdown and purge steps and
consumed in the final re-pressurisation step. The twelve-column system combined all
the previous benefits leading to a H2 recovery of around 93%. All the simulation
results are plotted on Figure 4.26, indicating a clear relation between hydrogen purity
and recovery.
It is expected that a more-than-sixteen-column H2 PSA configuration may
improve the H2 recovery further to more than 93%, but given the trend of improving
H2 recovery with the number of columns any further improvement of H2 recovery
would be extremely limited. In particular, more than five pressure equalisation steps
may not be necessary since the column pressure at the end of the fourth DPE (or

173
PPE) step in the twelve-column H2 PSA system is 7.5 bar (or 27 bar) and is close to
that at the end of the third DPE (or PPE) step in the nine-column H2 PSA system,
which is 8.5 bar (or 26 bar). Therefore, altering a PSA cycle to have more than five
pressure equalisation steps cannot recover a notable pressure nor save the amount of
ultrapure hydrogen consumed during the product pressurisation step significantly. In
addition, it is likely that the working capacity of the column would be badly affected
by incomplete regeneration with purge flow having less hydrogen and re-
pressurisation of the column by more impure gas streams than the pure product
streams.
Figure 4.26: Comparison of hydrogen purity and recovery at various H2 PSA systems
with the different number of columns and different step configurations
Figure 4.27 shows the hydrogen mole fraction profile along the column at the
end of the adsorption step at the cyclic steady state of all the PSA simulations
investigated in this chapter. It clearly shows that with the reduction of the feed flow
to one-column for adsorption from four-column to nine-column through six-column
with two-stage pressure equalisation the PSA system allows a cycle to have longer
adsorption step time so the H2 mass transfer zone (MTZ) can progress more to the
product end at the end of adsorption step. This results in less H2 remaining in the bed
at the end of the adsorption step, leading to higher H2 recovery. The figure also

174
shows that the twelve-column PSA has a broader H2 MTZ than the nine-column PSA
does due to the worse regeneration of the column during the purge step and the use
of a more impure stream for column pressurisation during the PPE steps. Figure 4.28
shows the hydrogen mole fraction profiles along the column at the end of the
blowdown step at the cyclic steady state of all the PSA simulations. Also in this case,
the H2 MTZ is more progressed toward the product end for the Polybed systems but
at the feed end the nine- and twelve-column configurations exhibit a higher hydrogen
mole fraction compared to the other configurations.
Figure 4.27: Hydrogen molar fraction profiles along the column at the end of the
adsorption step in various H2 PSA cycles at around 99.99% H2 purity

175
Figure 4.28: Hydrogen molar fraction profiles along the column at the end of the
blowdown step in various H2 PSA cycles at around 99.99% H2 purity
4.7 H2 PSA simulation results with fixed total cycle time
In the previous section (Luberti et al., 2014a), the column dimensions were
kept constant in all the PSA configurations so the total cycle time increases
considerably and the bed productivity decreases with increasing number of columns
from four to twelve. This is because more than one column simultaneously
undergoes the adsorption step so the feed flowrate to one adsorption column is
reduced to half or one-third of the total feed flowrate. In this section, the PSA
simulations were performed at a constant total cycle time of 1200 s (20 min)
regardless of the various configurations. As a result, the bed productivity can be kept
almost constant. Note that with the increasing number of columns, the volume of one
column should be reduced to keep the total cycle time constant but the ratio of
column length to diameter is kept constant at 20. In simulating the four-, six-, nine-
and twelve-column PSA systems, the same step configurations as in the previous
section were considered. The six-column configuration selected was the one having
two pressure equalisation stages. More details can be found in the reference (Luberti
et al., 2014b).
176
It has been explored at which one-column residence time during the adsorption
step (τ = V/F) the H2 PSA can achieve the target H2 purity of 99.99+ mol%. Table
4.7 shows the effect of residence time on the performance of each H2 PSA
configuration with respect to hydrogen purity, recovery and productivity. In the four-
, six- and nine-column systems, the targeted H2 purity is obtained with a H2 PSA run
with a column size to give a residence time in the vicinity of 172 s. This is because as
the feed flowrate to one column during the adsorption step is reduced from total feed
flowrate at the four-column PSA to one-third at the nine-column PSA through to
one-half at the six-column PSA, the required volume of one adsorption column is
reduced almost at the same ratio. However, the residence time is notably reduced to
154 s with the twelve-column PSA from 172 s with the nine-column PSA since the
feed flowrate to one column during the adsorption step does not change but the
adsorption step time decreases from one-third to one-fourth of cycle time, i.e., the
total amount of feed to be treated by one column during the adsorption step is
reduced.
It is clearly demonstrated that given the targeted H2 purity of 99.99+ mol%, the
H2 recovery increases from 75% to 93% with increasing number of columns, as
shown in Table 4.7. In addition, the twelve-column system shows the maximum
recovery with a slightly lower productivity compared to the nine-column system due
to the different ratio between the adsorption step and total cycle times in the step
configuration.

177
Table 4.7: Effect of the one-column residence time during adsorption step on hydrogen
purity, recovery and productivity at different H2 PSA configurations
One-column
residence
time [s]
Column
length [m]
Column
diameter [m]
H2 purity
[%]
H2 recovery
[%]
Bed productivity
[molH2/kgads/day
]
Four-column PSA with two-stage pressure equalisation
140 0.467 0.0233 99.979 78.25 218.39
172 0.500 0.0250 99.992 75.28 171.51
210 0.535 0.0267 99.996 71.85 133.69
245 0.563 0.0281 99.998 68.42 109.12
Six-column PSA with two-stage pressure equalisation
140 0.371 0.0185 99.976 86.38 321.44
172 0.400 0.0200 99.993 83.43 253.44
210 0.424 0.0212 99.997 80.32 199.26
245 0.447 0.0223 99.999 75.93 161.46
Nine-column PSA with three-stage pressure equalisation
140 0.324 0.0162 99.971 92.79 345.12
172 0.346 0.0173 99.992 91.48 277.78
210 0.371 0.0185 99.995 89.71 222.56
245 0.390 0.0195 99.998 86.96 184.39
Twelve-column PSA with four-stage pressure equalisation
140 0.324 0.0162 99.983 93.41 260.57
154 0.334 0.0167 99.992 92.94 235.92
172 0.346 0.0173 99.994 92.52 210.71
210 0.371 0.0185 99.997 90.48 168.35
4.8 Conclusions
A novel H2 PSA system to produce ultrapure hydrogen from a raw H2 gas
generated in an advanced IGCC process has been proposed in this chapter. The
advanced IGCC plant where CO2 is captured by a pre-combustion capture unit is
capable of cogenerating both power and ultrapure hydrogen more economically. The
advanced IGCC plant can be used in oil refineries experiencing difficulties in
sourcing ultrapure hydrogen, which is required to operate hydrotreaters and
hydrocrackers, and intending to reduce carbon emissions from their hydrogen and
power plants.

178
It is very important to know the maximum H2 recovery that a H2 PSA can
produce from the raw H2 gas in evaluating the performance of an advanced IGCC
plant for cogenerating power and ultrapure hydrogen. This is because the flowrate of
PSA tail gas, to be determined by the H2 recovery, should be compressed up to 34
bar from the purge pressure to get the PSA tail gas to be fed to the gas turbine along
with the fuel gas. Therefore, it is essential to design a H2 PSA such that its H2
recovery can be maximised in order to minimise the power consumption relating to
tail gas compression.
H2 PSAs in commercial SMR hydrogen plants are capable of achieving around
89% H2 recovery at 99.99+ mol% H2 purity. Compared to the raw H2 gas in the SMR
hydrogen plant, the raw H2 gas fed to the H2 PSA in the advanced IGCC plant has a
gas composition of higher hydrogen and lower impurities and the higher total
pressure at which conditions the H2 PSA is expected to perform better than the H2
PSA in a SMR H2 plant. As expected, the Polybed H2 PSA with twelve columns and
four-stage pressure equalisation achieves 93% H2 recovery at 99.99+ mol% H2
purity. This result was obtained for both the cases of fixed column dimensions and
varying cycle time and for fixed cycle time and varying column dimensions, at a
given total flowrate.
References
Ahn H, Yang J, Lee CH. Effects of feed composition of coke oven gas on a layered bed H2
PSA process. Adsorption 2001; 7: 339-356.
Ahn S, You YW, Lee DG, Kim KH, Oh M, Lee CH. Layered two- and four-bed PSA
processes for H2 recovery from coal gas. Chemical Engineering Science 2012; 68: 413-423.
Cassidy RT. Polybed pressure-swing adsorption hydrogen processing. ACS Symposium
Series 1980; volume 135 chapter 13: pages 247-259.
DOE NETL. Cost and performance baseline for fossil energy plants; 2007.
Ebner AD, Mehrotra A, Ritter JA. Graphical approach for complex PSA cycle scheduling.
Adsorption 2009; 15: 406-421.

179
Friedrich D, Ferrari MC, Brandani S. Efficient simulation and acceleration of convergence
for a dual piston pressure swing adsorption system. Ind. Eng. Chem. Res. 2013; 52: 8897-
8905.
Fuderer A, Rudelstorfer E. US Patent 3986849 to Union Carbide Corporation, 1976.
Jain S, Moharir AS, Li P, Wozny G. Heuristic design of pressure swing adsorption: a
preliminary study. Separation and Purification Technology 2003; 33: 25-43.
Jiang L, Biegler LT, Fox VG. Simulation and optimal design of multiple-bed pressure swing
adsorption systems. AIChE J. 2004; 50: 2904-2917.
Lopes FVS, Grande CA, Ribeiro AM, Loureiro JM, Evaggelos O, Nikolakis V, Rodrigues A
E. Adsorption of H2, CO2, CH4, CO, N2 and H2O in activated carbon and zeolite for
hydrogen production. Separation Science and Technology 2009; 44: 1045-1073.
Lopes FVS, Grande CA, Rodrigues AE. Activated carbon for hydrogen purification by
pressure swing adsorption: Multicomponent breakthrough curves and PSA performance.
Chemical Engineering Science 2011; 66: 303-317.
Luberti M, Friedrich D, Brandani S, Ahn H. Design of H2 PSA for cogeneration of ultrapure
hydrogen and power at an advanced integrated gasification combined cycle with pre-
combustion capture. Adsorption 2014a; 20: 511-524.
Luberti M, Friedrich D, Ozcan DC, Brandani S, Ahn H. A novel strategy to produce
ultrapure hydrogen from coal with pre-combustion carbon capture. Energy Procedia 2014b;
63: 2023-2030.
Majlan EH, Daud WRW, Iyuke SE, Mohamad AB, Kadhum AAH, Mohammad AW, Takriff
MS, Bahaman N. Hydrogen purification using compact pressure swing adsorption system for
fuel cell. Hydrogen Energy 2009; 34: 2771-2777.
Malek A, Farooq S. Study of a six-bed pressure swing adsorption process. AIChE J. 1997;
43: 2509-2523.
Mehrotra A, Ebner AD, Ritter JA. Arithmetic approach for complex PSA cycle scheduling.
Adsorption 2010; 16: 113-126.
Mehrotra A, Ebner AD, Ritter JA. Simplified graphical approach for complex PSA cycle
scheduling. Adsorption 2011; 17: 337-345.

180
Miller GW, Knaebel KS, Ikels KG. Equilibria of nitrogen, oxygen, argon, and air in
molecular sieve 5A. AIChE J. 1987; 33: 194-201.
Nikolic D, Giovanoglou A, Georgiadis MC, Kikkinides ES. Generic modelling framework
for gas separation using multibed pressure swing adsorption processes. Ind. Eng. Chem. Res.
2008; 47: 3156-3169.
OriginLab. Data analysis and graphing software. Origin 8.5, 2010.
Park JH, Kim JD, Yang RT. Adsorber dynamics and optimal design of layered beds for
multicomponent gas adsorption. Chemical Engineering Science 1998; 53: 3951-3963.
Ribeiro AM, Grande CA, Lopes FVS, Loureiro JM, Rodrigues AE. A parametric study of
layered bed PSA for hydrogen purification. Chemical Engineering Science 2008; 63: 5258-
5273.
Ruthven DM. Principles of Adsorption and Adsorption Processes, 1984.
Ruthven DM, Farooq S, Knaebel K. Pressure swing adsorption, 1994.
Xu J, Weist EL. US Patent 6454838 B1 to Air Products and Chemicals Inc., 2002.
Xu J, Rarig DL, Cook TA, Hsu KK, Schoonover M, Agrawal R. US Patent 6565628 B2 to
Air Products and Chemicals Inc., 2003.
Yang RT. Gas separation by adsorption processes. Butterworth Publishers, 1987.
Yang J, Lee CH. Adsorption dynamics of a layered bed PSA for H2 recovery from coke oven
gas. AIChE J. 1998; 44: 1325-1334.
You YW, Lee DG, Yoon KY, Moon DK, Kim SM, Lee CH. H2 PSA purifier for CO
removal from hydrogen mixtures. Hydrogen Energy 2012; 37: 18175-18186.

181
Chapter 5: Process integration of the industrial H2
PSA unit with the IGCC for cogenerating ultrapure
hydrogen and electricity, cost analysis and process
improvements
This chapter describes the process integration and optimisation of an industrial
H2 PSA unit with the IGCC described in Chapter 2 for cogenerating ultrapure
hydrogen and electricity. As already described in Chapter 4, improving the H2
recovery at the H2 PSA unit to its maximum can contribute to reducing the power
consumption for compressing the H2 PSA tail gas by minimising the yield of the H2
PSA tail gas by-product. Similarly to the results obtained in the previous chapter for
a lab-scale unit, it was found that, at the same H2 purity of 99.99+ mol%, the
hydrogen recovery could be enhanced up to 92% by increasing the number of
columns. A detailed economic analysis has been carried out to evaluate the capital
expenditure (CAPEX) of each PSA configuration analysed. After redesigning the
power section of the IGCC to take into account the retrofit of the H2 PSA unit, the
levelised cost of electricity (LCOE) was evaluated for the base, capture and
integrated cases. Furthermore, it was demonstrated that the H2 PSA can also be
designed to achieve at least 90% H2 recovery even when a portion of the tail gas is
recycled to the shift reactors or the dual-stage Selexol unit in order to improve the
advanced IGCC performances by reducing the auxiliary power consumption of the
carbon capture unit and the CO2 compression train. Additional novel configurations
proposed in a recent patent have also been simulated in this chapter to improve the
overall net plant efficiency. It was found that the ultimate configuration where a
portion of the H2 PSA tail gas is recycled at the same time to both the coal dryer and
the water gas shift reactors resulted in the highest increase of the overall net plant
efficiency compared with the base case and other process configurations.

182
5.1 Retrofit of the H2 PSA unit to the IGCC with pre-
combustion capture
The modified IGCC plant block diagram to simultaneously produce power and
ultrapure hydrogen is depicted in Figure 5.1.
ASU
Gasifier
Raw Gas
Quench
Coal
Dryer
Syngas
Scrubber
2-stage
WGSR
Sour
Water
Stripper
2-stage
Selexol
CO2
Purifier
CO2
Compres
-sor
TGTUClaus
Plant
Syngas
Humi
-difer
H2
PSA
Syngas
Reheater
HRSG
Steam
Turbine
Gas
Turbine
Air
Air
Coal
To Stack
N2
N2
O2 to
Claus
O2
Steam
Slag
Water
Sour Water
Shift
Steam
Shifted Syngas
Treated Syngas
Steam Water
To Stack
H2
Product
CO2
Product
TGTU
Vent
O2 to
Claus
H2S
Sulphur
H2 PSA
Tail Gas
Compressor
H2S to
Claus
Drying
Gas Prep
Air
N2
Treated Syngas
Figure 5.1: Block flow diagram of an advanced IGCC plant for cogenerating power
and ultrapure hydrogen with pre-combustion capture
As mentioned in Chapter 4, the starting point of the H2 PSA retrofit to the
IGCC is Case 6 of the DOE report (2007) where all the units and stream
specifications remain constant until downstream of the dual-stage Selexol process. In
the cogenerating IGCC plant, the H2-rich fuel gas is split into two streams and one of
the two is fed to a H2 PSA for producing ultrapure hydrogen. The split ratio is
determined so as to generate the ultrapure hydrogen at a flowrate of 100 MMSCFD
(10,030 kg/h). Figure 5.2 shows the overall mass balance around the industrial H2
PSA unit with a H2 recovery of 91.3%.

183
Figure 5.2: Overall mass balance around the industrial H2 PSA unit of the cogenerating
IGCC
The H2 PSA tail gas needs to be compressed up to the pressure of the H2 fuel
gas for feeding it to a high-pressure gas cycle. This strategy of utilising the H2 PSA
tail gas can augment the power generation at the combined cycle. Therefore, the net
power generation from the advanced IGCC should take into account additional
power consumption at the H2 PSA tail gas compressors and power generation at the
combined cycle relating to the H2 PSA tail gas in addition to the H2 fuel gas.
Since in this configuration a significant part of the syngas is sent to the H2 PSA
and hence it cannot be used for power generation, both gas turbines and steam cycle
have to be redesigned in order to take into account this change. With a fixed
ultrapure hydrogen production rate of 100 MMSFCD a new configuration for the gas
turbine was simulated considering a total power generation of 324 MWe. Given the
GE turbines types and specifications for IGCC syngas applications (GE, 2009) the
total power was comprehensive of a 232 MWe 7F turbine plus a 92 MWe 6FA
turbine (GE, 2009). The HRSG cycle was also redesigned to take into account the
reduction of steam generation, capable to produce 155 MWe of power. Sufficient
steam has still to be provided to other units of the plant, such as the WGSRs, as in
the non-integrated case.
In this chapter, the industrial H2 PSA unit has been simulated using gPROMS
software (PSE, 2010). The discretisation method for the spatial domain in the column
was the second order orthogonal collocation on finite element method with 100

184
nodes along the column where the absolute and relative numerical accuracies were
both set to 10-5
.
5.2 Design of an industrial H2 PSA at the advanced IGCC
In designing an industrial H2 PSA unit it is essential, as already mentioned, to
increase the hydrogen recovery at the H2 PSA close to its maximum in order to
minimise the required H2 PSA feed flowrate and the tail gas compression work at the
same time. This is because the tail gas compression involves significant power
consumption, up to a few MWs. Once the mass balance around the H2 PSA is
determined based on the required product flowrate and the maximum H2 recovery
achievable, it is possible to estimate net power generation taking into account the tail
gas compression work.
In the previous chapter, an in-depth study on the design of H2 PSA integrated
with an IGCC power plant was carried out to maximise H2 recovery in the H2 PSA
unit. The results demonstrated that the H2 recovery could be increased by increasing
the complexity of the PSA step configuration, which enables a PSA cycle to have a
lower feed flow to one column for adsorption and to accommodate more pressure
equalisation steps. In this previous study, the column dimensions were kept constant
in all the PSA configurations so that the total cycle time increases considerably and
the bed productivity decreases with increasing number of columns from four to
twelve. This is because more than one column simultaneously undergoes the
adsorption step so the total flowrate is reduced to half or one-third.
In this chapter, similarly to the last paragraph of Chapter 4, the industrial H2
PSA simulations were performed at a constant total cycle time of 420 s regardless of
varying PSA configurations. The total flowrate was evaluated from the IGCC
simulation at a value of 1.26 m3/s (1,745 mol/s) and kept constant for all the
configurations. Since this flowrate is huge, six PSA trains in parallel for the four-
column H2 PSA system, three trains for the six-column H2 PSA and two H2 PSA
trains for the nine- and twelve-column systems were considered in order to have the
same flowrate of 0.21 m3/s entering one single column. As a result, the column
dimensions were similar for all the configurations and close to the practical limits for
industrial PSA units. Limitations on diameter are generally due to gas distributions

185
and end-column effects. PSA units rarely exhibit a bed diameter of more than 1.5–
2.0 m to ensure even distribution of the gas flow along the column, i.e. axially
dispersed plug flow (Mhaskar and Moharir, 2012). Similarly, the limit on height is
mainly due to crush strength problems of the adsorbent particles and more elaborated
mechanical design related to wind load, seismic load, etc. Normally heights of beds
are not more than 10 m (Geankoplis, 1997; Megyesy, 1995).
It has been explored at which one-column residence time during the adsorption
step (τ = V/F) the H2 PSA unit can achieve the targeted H2 purity of 99.99+ mol%.
Table 5.1 shows information about column size as well as the associated mass of
adsorbent in one column and pressure drops. The table was constructed considering
an adsorption step at the H2 PSA feed conditions over one packed bed. For all the
simulations, the column length to diameter ratio was kept constant at a value of 5,
which is common for industrial applications (UOP, 2014) and extensively reported in
the literature (Nikolic et al., 2008; Mhaskar and Moharir, 2012). The calculated mass
of 5A zeolite sorbent in an industrial column ranges between 11.5 and 18.7 tons.
Table 5.1: List of column parameters and pressure drop evaluation for the industrial
H2 PSA simulations
τ (s) V (m3) D (m) L (m) mads (ton) ΔP (kPa) Reh (-)
130 27.3 1.91 9.55 18.7 3.9 78.6
120 25.2 1.86 9.30 17.3 4.2 82.9
110 23.1 1.80 9.00 15.8 4.5 88.5
100 21.0 1.75 8.75 14.4 4.9 93.7
90 18.9 1.69 8.45 13.0 5.4 100.4
80 16.8 1.62 8.10 11.5 6.0 109.3
Note that for packed beds the equivalent Reynolds number is evaluated as (Bird et al.,
2007):
p
h
du0
)1(3
2Re
(5-1)
Even if the superficial velocity of 0.1 m/s is considerably higher than the one
from the lab scale, the estimated pressure drops were limited to 0.06 bar in the case
of τ = 80 s. Figure 5.3 shows the evolution of the pressure drops with the change of
residence time where a fairly linear trend can be observed. Since the Reynolds

186
number calculated in Table 5.1 is in the vicinity of 100, the fluid flow through the
packed column results in the transition region between laminar and turbulent flow
(Bird et al., 2007).
Figure 5.3: Evolution of the pressure drops against one-column residence time for the
industrial H2 PSA simulations
Additional column parameters as well as the particle parameters and operating
conditions of the industrial H2 PSA simulations are reported in Table 5.2. As
expected, the transport properties become higher for the industrial process compared
to the lab-scale simulations, as shown in Table 5.2 for a one-column residence time
of 120 s. Lab-scale transport properties are reported in brackets next to the industrial-
scale properties. Figures 5.4–5.7 show the step configurations for the four-, six-,
nine- and twelve-bed PSA systems investigated in this chapter. Note that the six-
column configuration contains two stages of pressure equalisation. As already
mentioned, the total cycle time was maintained constant at 420 s.

187
Table 5.2: List of additional column parameters, particle parameters and operating
conditions of the industrial H2 PSA simulations for a one-column residence time of 120
s. Numbers in brackets represent transport parameters of lab-scale system
Additional column parameters
External bed void fraction, ε (-) 0.391
Axial mass dispersion coefficient, Dz (m2/s) 3.0×10
-4 (1.2×10
-4)
Axial thermal dispersion coefficient, kz (W/m·K) 4.6 (1.3)
Wall heat transfer coefficient, hw (W/m2·K) 433.4 (95.0)
Adsorbent parameters
Pellet density, ρp (kg/m3) 1,126
Pellet void fraction, εp (-) 0.503
Adsorbent specific heat capacity, cP,s (J/kg·K) 920
Pellet averaged diameter, dp (mm) 1.70
Micropore LDF coefficient, kicr·3/rc
H2/CO2/CO/N2 /Ar (s-1
)
0.7467/0.0017/0.0332/0.1697/0.1800
(Lopes et al., 2009)
Operating conditions
Pads (bar) 35
Pdes (bar) 1
Tfeed (K) 303
Qfeed (mol/s) 291
Feed composition, yH2/yCO2/yCO/yN2/yAr (molar) 0.8875/0.0212/0.0266/0.0544/0.0103
Figure 5.4: Step configuration of the industrial four-column H2 PSA cycle at PP/F = 0.2
(See Chapter 4 for configuration details)
PPAD BD PU PPE2 PPE1DPE1 DPE2 PR
AD DPE1 PP DPE2 BD PU PPE2 PPE1 PR
BD PU PPE2 PPE1 PR AD DPE1 PP DPE2
DPE1 PP DPE2 BD PU PPE2 PPE1 PR AD
PPE1 PR AD DPE1 PP DPE2 BD PU PPE2

188
Figure 5.5: Step configurations of the industrial six-column H2 PSA cycle with two-
stage pressure equalisation at PP/F = 0.3 (See Chapter 4 for configuration details)
Figure 5.6: Step configurations of the industrial nine-column H2 PSA cycle at PP/F =
0.3 (See Chapter 4 for configuration details)
IDAD PP BD PPE2 PPE1DPE1 DPE2 PRPU
AD DPE1 ID DPE2 PP BD PU PPE2 PPE1 PR
PPE1 PR AD DPE1 ID DPE2 PP BD PU PPE2
PU PPE2 PPE1 PR AD DPE1 ID DPE2 PP BD
PP BD PU PPE2 PPE1 PR AD DPE1 ID DPE2
DPE1 ID DPE2 PP BD PU PPE2 PPE1 PR AD
AD DPE1 ID DPE2 PP BD PU PPE2 PPE1 PR AD
AD PP BD PPE3 PPE2DPE1 DPE2 PRPUDPE3 PPE1
AD DPE1 DPE2 DPE3 PP BD PU PPE3 PPE2 PPE1 PR
PPE1 PR AD DPE1 DPE2 DPE3 PP BD PU PPE3 PPE2
PPE3 PPE2 PPE1 PR AD DPE1 DPE2 DPE3 PP BD PU
PU PPE3 PPE2 PPE1 PR AD DPE1 DPE2 DPE3 PP BD
PP BD PU PPE3 PPE2 PPE1 PR AD DPE1 DPE2 DPE3 PP
DPE3 PP BD PU PPE3 PPE2 PPE1 PR AD DPE1 DPE2
DPE1 DPE2 DPE3 PP BD PU PPE3 PPE2 PPE1 PR AD
AD DPE1 DPE2 DPE3 PP BD PU PPE3 PPE2 PPE1 PR AD
AD DPE1 DPE2 DPE3 PP BD PU PPE3 PPE2 PPE1 PR AD

189
Figure 5.7: Step configurations of the industrial twelve-column H2 PSA cycle at PP/F =
0.3 (See Chapter 4 for configuration details)
Table 5.3 shows the effect of residence time on the performance of each H2
PSA configuration with respect to hydrogen purity, recovery and bed productivity. It
is expected that with increasing residence time the H2 purity can be improved as a
sacrifice of H2 recovery and productivity. In the four-, six-, and nine-column
systems, the targeted H2 purity is obtained with a H2 PSA run having a column size
to give a residence time in the vicinity of 120 s. The six- and nine-column systems
have identical adsorption step times so this behaviour is expected. In the four-column
configuration, the adsorption time is shorter than the previous systems but the beds
are not well regenerated during the purge step due to a lower purge-to-feed ratio. As
a result, they require the same residence time in order to obtain the desired product
purity. However, the residence time is notably reduced to 90 s from the nine-column
PSA to the twelve-column PSA system since the feed flowrate to one column during
the adsorption step does not change but the adsorption step time decreases from one-
third to one-fourth of cycle time, i.e., the total amount of feed to be treated by one
column during adsorption step is reduced.
AD DPE1 DPE2 DPE3 DPE4 PP BD PU PPE4 PPE3 PPE2 PPE1 PR
AD DPE1 DPE2 DPE3 DPE4 PP BD PU PPE4 PPE3 PPE2 PPE1 PR
PPE1 PR AD DPE1 DPE2 DPE3 DPE4 PP BD PU PPE4 PPE3 PPE2
PPE3 PPE2 PPE1 PR AD DPE1 DPE2 DPE3 DPE4 PP BD PU PPE4
PU PPE4 PPE3 PPE2 PPE1 PR AD DPE1 DPE2 DPE3 DPE4 PP BD PU
PU PPE4 PPE3 PPE2 PPE1 PR AD DPE1 DPE2 DPE3 DPE4 PP BD PU
BD PU PPE4 PPE3 PPE2 PPE1 PR AD DPE1 DPE2 DPE3 DPE4 PP
PP BD PU PPE4 PPE3 PPE2 PPE1 PR AD DPE1 DPE2 DPE3 DPE4 PP
PP BD PU PPE4 PPE3 PPE2 PPE1 PR AD DPE1 DPE2 DPE3 DPE4
DPE3 DPE4 PP BD PU PPE4 PPE3 PPE2 PPE1 PR AD DPE1 DPE2
DPE1 DPE2 DPE3 DPE4 PP BD PU PPE4 PPE3 PPE2 PPE1 PR AD
AD DPE1 DPE2 DPE3 DPE4 PP BD PU PPE4 PPE3 PPE2 PPE1 PR AD
AD DPE1 DPE2 DPE3 DPE4 PP BD PU PPE4 PPE3 PPE2 PPE1 PR AD

190
Table 5.3: Effect of the one-column residence time during adsorption step on hydrogen
purity, recovery and bed productivity at different industrial H2 PSA configurations
with total cycle time of 420 s
One-column
residence
time (s)
D
(m)
L
(m)
H2 purity
(%)
H2 recovery
(%)
Bed productivity
(molH2/kgads/day)
Four-column PSA with two-stage pressure equalisation
130 1.91 9.55 99.995 75.63 225.4
120 1.86 9.30 99.992 77.26 249.4
110 1.80 9.00 99.981 80.24 282.6
100 1.75 8.75 99.973 82.30 318.8
Six-column PSA with two-stage pressure equalisation
130 1.91 9.55 99.996 82.52 327.8
120 1.86 9.30 99.993 84.22 362.5
110 1.80 9.00 99.986 86.17 404.6
100 1.75 8.75 99.977 87.73 453.1
Nine-column PSA with three-stage pressure equalisation
130 1.91 9.55 99.995 89.97 357.4
120 1.86 9.30 99.992 91.26 392.8
110 1.80 9.00 99.983 92.36 433.6
100 1.75 8.75 99.974 93.51 482.9
Twelve-column PSA with four-stage pressure equalisation
110 1.80 9.00 99.997 89.19 314.1
100 1.75 8.75 99.995 90.36 350.0
90 1.69 8.45 99.992 91.94 395.7
80 1.62 8.10 99.980 93.24 451.5
All the simulation results are plotted on Figure 5.8, indicating a clear trade-off
between H2 purity and recovery. This figure is similar to the one obtained from the
lab scale simulations. Figure 5.9 shows the trends of product purity against bed
productivity for the different configurations. Apart from the four-column system
where the recoveries are quite low, all the systems exhibit a close productivity for
each residence time, with the six-bed system having a productivity relatively lower
than the Polybed systems and the nine- and twelve-bed systems having almost

191
identical productivities. Since the hydrogen feed flowrate per PSA train and the total
cycle time are constant for all the configurations, the bed productivity results are
directly proportional to the hydrogen recovery and the adsorption step time, and
inversely proportional to the adsorbent amount. Table 5.4 lists the relevant variables
used to calculate the bed productivity for all the system configurations at 99.99+%
H2 purity. The nine- and twelve-bed curves of Figure 5.9 tend to overlap because the
slight increase in hydrogen recovery in the twelve-bed system together with the
lower amount of adsorbent in the column (smaller columns volume) perfectly
balance the longer adsorption step time of the nine-column system (Table 5.4). This
productivity resulted in around 395 molH2/kgads/d at the ultrapure hydrogen
condition.
Table 5.4: List of variables used to calculate the bed productivity for all the system
configurations at 99.99+% H2 purity
Configuration FH2
(mol/s)
tcycle
(s)
H2 Recovery
(%)
tads
(s)
mads
(ton)
Bed productivity
(molH2/kgads/day)
4-column PSA
258.3 420
77.26 105 17.3 249.4
6-column PSA 84.22 140 17.3 362.5
9-column PSA 91.26 140 17.3 392.8
12-column PSA 91.94 105 13.0 395.7
For H2 PSA the bed productivity is calculated by:
ads
ads
cycle
H
m
t
t
F
RecoveryHtyProductivi 22 (5-2)

192
Figure 5.8: Comparison of hydrogen purity against recovery for various industrial H2
PSA systems with different numbers of columns and different step configurations
Figure 5.9: Comparison of hydrogen purity against productivity for various industrial
H2 PSA systems with different numbers of columns and different step configurations
The increase in H2 recovery with the gradually more complex configurations at
the same H2 purity condition can be explained by looking at Figure 5.10, which
shows the weakly adsorbed impurities’ (nitrogen + argon) molar fraction profiles
along the column at the end of the adsorption step and at cyclic steady state for the

193
different configurations. Here a common dimensionless axial coordinate has been
considered for the x-axis to take into account the different one-column residence
times, and hence column size, of the various configurations at which the targeted H2
purity is met. Nitrogen and argon, which are practically the only impurities in the
raffinate stream, were grouped into a common weakly adsorbed impurities molar
fraction. It can be seen that the concentration front travels towards the end of the
column moving from the four-column to the twelve-column system. This means that
at the end of adsorption step the bed is more saturated with impurities, and therefore
less hydrogen is lost later during the blowdown step, leading to enhanced H2
recovery. The twelve-column molar fraction profile is very close to that of the nine-
column system, confirming the limited increase of H2 recovery. Unlike the lab-scale
simulations, the concentration profiles in the industrial configurations are more
affected by dispersion effects due to the higher velocities involved, leading to a
maximum H2 recovery of 91.9%. The maximum H2 recovery for the lab-scale
simulations was 92.7% (see Chapter 4).
Figure 5.10: Weakly adsorbed impurities (nitrogen + argon) molar fraction profiles
along a common dimensionless axial coordinate at the end of adsorption step at CSS
and at 99.99+% H2 purity among various industrial H2 PSA configurations

194
It is clearly demonstrated that given the targeted H2 purity of 99.99+ mol%, the
H2 recovery increases from 77% to 92% with increasing number of columns, as
shown in Tables 5.3 and 5.5. Along with the change in the H2 recovery, the ultrapure
hydrogen production rate and the required tail gas compression work are also
changed significantly. The hydrogen production rate increases with the increasing H2
recovery and the tail gas compression work decreases simultaneously (Table 5.5).
Moving from the four-column to the twelve-column system, the hydrogen production
rate increases by 16.0% while the tail gas compression work decreases by 39.7%.
The tail gas compression works were calculated using UniSim Design R400
considering a four-stage intercooling compression train with the adiabatic efficiency
set as 85% for all the turbomachinery. In Table 5.5, gross and net power generation
is also reported for the different PSA configurations showing a balance between the
production of ultrapure hydrogen and electricity. Of course, in order to design the
cogeneration plant, there is the need to define specific production rates.
Table 5.5: Ultrapure hydrogen production rate and tail gas compression work at
various industrial H2 PSA configurations at the condition of 99.99+ mol% H2 purity
and total cycle time of 420 s, including IGCC overall plant performances
H2 PSA
configuration
4-column PSA
with 2-stage PE
6-column PSA
with 2-stage PE
9-column PSA
with 3-stage PE
12-column PSA
with 4-stage PE
Thermal input
(MWth) 1,618 1,618 1,618 1,618
H2 recovery
(%) 77.26 84.22 91.26 91.94
H2 production
rate
(MMSCFD)
84.6 92.2 100.0 100.7
Tail gas
compression
work (MWe)
6.3 5.1 3.9 3.8
Total
auxiliaries
(MWe)
187.7 186.5 185.3 185.2
Gross power
(MWe) 528.8 504.0 479.0 476.5
Net power
(MWe) 341.1 317.5 293.7 291.3

195
5.3 Industrial H2 PSA economic analysis
A detailed economic analysis has been carried out for the different industrial
H2 PSA configurations simulated in the previous section of this chapter. Omitting the
cost associated to the control system, the capital expenditure (CAPEX) of a PSA unit
can be divided into four cost items: the cost related to the columns, the adsorbents,
the valves and the auxiliaries, which in this case is represented by the four-stage
compression train for the PSA tail gas recompression.
Once the residence time has been fixed to meet the hydrogen purity
specification, the size of the columns was also determined for all the different
configurations (Table 5.1). The column design was completed evaluating the
thickness of the cylindrical plating as well as the heads of the columns. The formulae
used for the calculations refer to the ASME VIII standards (ASME VIII, 2013)
providing the rules for the construction of pressure vessels. It was assumed that the
columns were made of carbon steel of which some physical parameters such as the
density and the hoop stress are given in Table 5.6. It was also assumed that the
column heads were hemispherical, which is in agreement with the range of operating
pressure (ASME VIII, 2013). For all the thicknesses, a safety factor of 2 was used
once the minimum values were calculated with the ASME formulae. The welding
efficiency was set at 85% (ASME VIII, 2013). The resulting thickness was evaluated
at 7.9 cm for the column plating and 6.5 cm for the column heads.
Once the all the thicknesses were known, it was possible to evaluate the
volume of metal needed and hence the weight of each column. This weight was
increased by 1.2 times (column factor in Table 5.6) to take into account extra weight
due to the support grid and headspaces (Green and Perry, 2007). With the knowledge
of the total column weight, the costing was estimated using Matches (Matches,
2014), which provides conceptual process equipment cost estimates for over 275
types of equipment used in the chemical and metallurgical industry.
The mass of adsorbent to be placed in one column was calculated from the
column volume and the bulk density. The commercial price for 5A zeolite of 1.7
$/kg was used (XaLvneng, 2014). By referring to the H2 PSA configurations
analysed by Luberti et al. (2014a), it was possible to know the number of valves

196
needed for each PSA train: this information is reported in Table 5.7. The number of
valves is a function of the number of beds in each configuration as well as of the
number of pressure equalisation steps employed. Since it is difficult to estimate the
price for the single automatic valves associated with the PSA units, it was assumed
that their cost accounted for around 6% of the total cost of the unit, whatever the size
of the unit. Eventually, the cost of the four-stage compressor for tail gas
recompression was again evaluated using Matches (Matches, 2014) considering a
centrifugal compressor made of carbon steel where the input variable was the
compressor power. This power had been previously evaluated using UniSim Design
R400 software.
Table 5.6: Design and economic parameters utilised in the economic analysis
Design/economic parameter Value Reference
Carbon steel density (kg/m3) 8,000 Green and Perry, 2007
Stainless steel hoop stress (MPa) 100 Green and Perry, 2007
Welding efficiency (%) 85 ASME VIII, 2013
Column factor (-) 1.2 Green and Perry, 2007
5A zeolite cost ($/kg) 1.7 XaLvneng, 2014
Installation factor (-) 2.1 IEA GHG, 2009
Actualisation factor
(CEPCI 2007/CEPCI 2014) (-) 1.09 CEPCI, 2014

197
Table 5.7: Economic analysis comparison among the different PSA configurations
including the comparison with the entire IGCC plant
4-column
PSA
6-column
PSA
9-column
PSA
12-column
PSA
No. trains 6 3 2 2
No. valves per train 17 31 55 85
Total no. columns 24 18 18 24
Column cost ($ × 1,000) 315.4 315.4 315.4 255.1
Column adsorbent cost ($ ×
1,000) 29.4 29.4 29.4 22.0
Tail gas compressor cost ($ ×
1,000) 906.4 764.3 613.1 597.9
Column valves cost ($ ×
1,000) 31.6 32.8 30.8 24.1
Total cost ($ × 1,000) 12,657.2 9,830.9 9,226.1 9,655.0
Total installed cost ($ × 1,000) 27,845.8 21,628.0 20,297.4 21,241.1
IGCC cost fraction (%) 1.85 1.44 1.35 1.41
The economic analysis results related to the different PSA configurations are
summarised in Table 5.7. Figure 5.11 exhibits the results expressed in terms of total
installed cost in $ millions on a histogram chart. This is the actual PSA unit cost
considering an installation equipment factor of 2.1 (IEA GHG, 2009) (Table 5.6). It
is possible to see that the previously discussed cost items are represented by different
colours and they result in different weights on the overall configuration cost. The
cost of the pressure vessels resulted the highest for all the configurations, followed
by the tail gas compressor, the valves and the adsorbent.
It can be clearly seen that a minimum cost is registered with the nine-column
PSA configuration. This can be explained considering the total number of columns
needed against the volume of each column. Although the twelve-column system has
smaller columns, less adsorbent and shows slightly higher recovery, it is composed
of 24 columns in total against only 18 columns of the nine-bed system because the
adsorption time is one-fourth of the total cycle time. After this techno-economic
analysis, it can be concluded that for a 100 MMSCFD ultrapure H2 production rate,

198
the CAPEX associated with the Polybed system exhibiting nine beds is the lowest
and hence this configuration has to be chosen for this separation. The total installed
cost of the units is consistent with data reported in the literature (Li et al., 2012),
given the hydrogen production rate and the plant capacity factor. The total installed
cost results in a fraction of the total IGCC plant cost for the base case (Table 5.7)
ranging between 1.85% for the four-column system and 1.35% for the nine-column
system. Note that since the overall CAPEX is based on the DOE report (2007), the
cost has been actualised using the actualisation factor based on the ratio of CEPCI
indices between the two years 2007/2014 (CEPCI 2014) (Table 5.6).
Figure 5.11: Economic analysis summary for the different PSA configurations
expressed in total installed cost ($ Millions)
5.4 Integrated IGCC cost analysis
From the first two chapters of this thesis it was shown how IGCC technology
could play an important role in the future low-carbonised energy matrix, especially
when a carbon capture unit is incorporated in their design. Nevertheless, a lower
energy penalty associated with the capture process should be accompanied by a
reasonable cost. In the UK Electricity Generation Costs Update report (DECC,

199
2010), an IGCC is shown to have a significant reduced cost versus an advanced
supercritical coal plant when a carbon capture is applied. Furthermore, the Zero
Emissions Platform (ZEP, 2011) showed that in terms of costs IGCCs are
competitive capture technologies considering the estimates for new power plants
with CO2 capture in Europe, based on new and actualised data. In particular, the
current cost of carbon capture and storage is a major factor (and barrier) to its
widespread use as a carbon reduction measure and it remains an open debate (IPCC,
2005).
At present, there are significant differences and inconsistences in the way CCS
costs are calculated and reported by various authors and organisations. Such
inconsistences can result in sizeable differences in the reported cost of otherwise
identical systems (Rubin, 2012). In a recent paper, Rubin et al. (2013) put effort into
harmonising the methods used to estimate and report the cost of carbon capture and
storage systems. This work was co-authored by the main organisations involved in
CCS, such as DOE/NETL, EPRI, IEA, ZEP and GCCSI. Any estimate of CCS cost
must begin with a clear definition of the scope and the boundaries of the project in
terms of greenfield plant/retrofitted plant and CO2 transport and storage systems.
Moreover, cost categories for CCS cost estimates are capital costs, operating and
maintenance costs and fuel costs (Rubin et al., 2013). Several cost metrics widely
used in CCS studies, including the levelised cost of electricity (LCOE), the cost of
CO2 avoided and the cost of CO2 captured, have been discussed in many works
(IPCC, 2005; Rubin et al., 2007; Rubin, 2012).
The LCOE is a constant unit price ($/MWh) for comparing the costs of power
plants that have different technologies, use different fuels, have different capital
expenditure paths, different annual costs, different net outputs and different
economic lives. It is a characteristic “cost of electricity generation” that incorporates
all the expenses for building and operating a power plant over its economic plant life
with an expected rate of return on invested capital, normalised over the total net
electricity generated. The levelised cost of electricity can be calculated by:
t
t
t
t
t
ttt
rySoldElectricit
rFuelMOCAPEXLCOE
)1/()(
)1/()&( (5-3)

200
The term “levelised” arises from the recognition that the calculations in eq. (5-3)
establish a single present value of overall cost that can be transformed into a series of
uniform annual values through the use of levelised factors. All the terms of eq. (5-3)
are explained in Table 5.8.
Table 5.8: Nomenclature used to define levelised cost of electricity
Parameter Definition
CAPEXt ($) Capital expenditure in year t associated with construction of the
plant
O&Mt ($) Total non-fuel operating and maintenance costs in year t
Fuelt ($) Total fuel costs in year t
Electricity Soldt (MWh) Net electricity produced and sold in year t
r (-) Annual rate used to discount values (interest rate or discount
factor)
Another important cost parameter is the cost of CO2 avoided ($/tCO2), defined
as:
CCSref
refCCS
SCESCE
LCOELCOEAC
(5-4)
This cost measure compares a plant with CCS to a “reference plant” without CCS in
order to quantify the average cost of avoiding a unit emission of CO2 to the air while
still providing a unit of useful product. Most commonly, the plants with and without
CCS are assumed to be of the same type and approximate size. SCE is the specific
carbon dioxide emissions measured in tCO2/MWh.
In this section, three levelised costs of electricity have been evaluated for the
cases of IGCC without CCS, IGCC with CCS, and IGCC with CCS and H2 co-
production. The carbon capture rate was fixed at 90% for the latter two cases. The
analysis of the IGCC without CSS has been taken into account as the reference case
for the cost of CO2 avoided calculation. All the capital, operating, maintenance and
fuel costs were updated to 2014 through CEPCI indices (2014). Table 5.9 reports all
the economic and plant parameters for the three cases analysed while Table 5.10 lists
the references for all the unit costs.
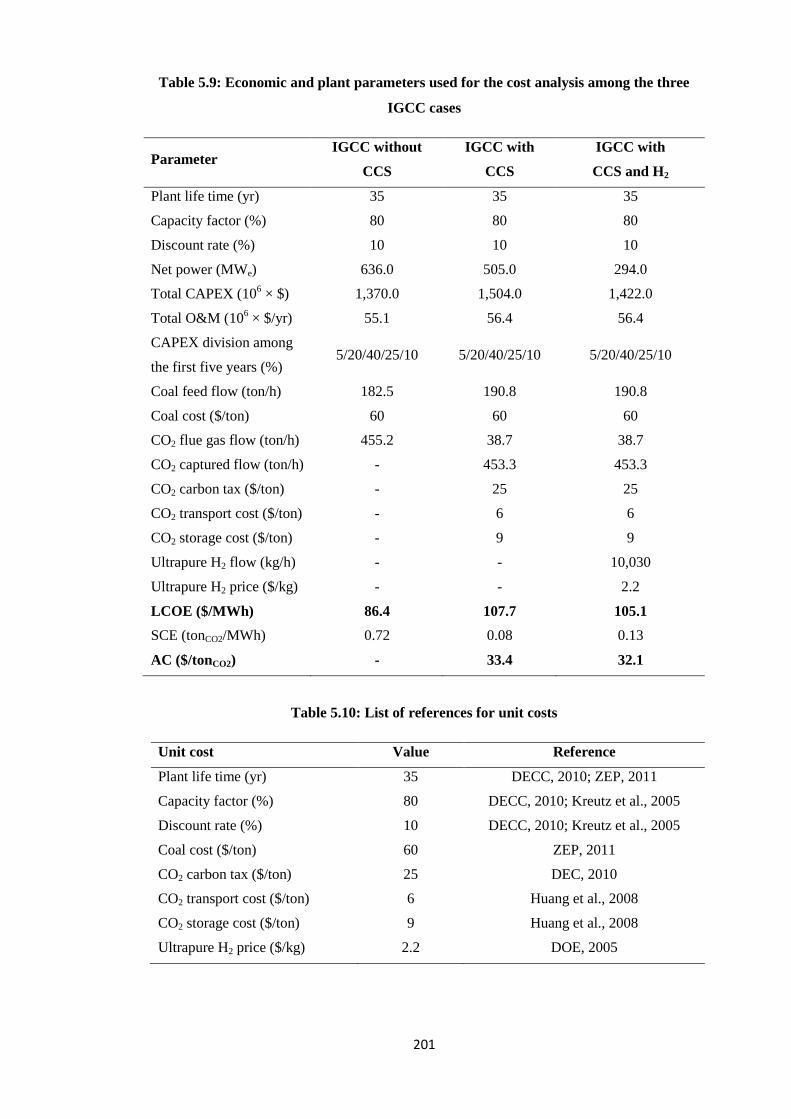
201
Table 5.9: Economic and plant parameters used for the cost analysis among the three
IGCC cases
Parameter IGCC without
CCS
IGCC with
CCS
IGCC with
CCS and H2
Plant life time (yr) 35 35 35
Capacity factor (%) 80 80 80
Discount rate (%) 10 10 10
Net power (MWe) 636.0 505.0 294.0
Total CAPEX (106 × $) 1,370.0 1,504.0 1,422.0
Total O&M (106 × $/yr) 55.1 56.4 56.4
CAPEX division among
the first five years (%) 5/20/40/25/10 5/20/40/25/10 5/20/40/25/10
Coal feed flow (ton/h) 182.5 190.8 190.8
Coal cost ($/ton) 60 60 60
CO2 flue gas flow (ton/h) 455.2 38.7 38.7
CO2 captured flow (ton/h) - 453.3 453.3
CO2 carbon tax ($/ton) - 25 25
CO2 transport cost ($/ton) - 6 6
CO2 storage cost ($/ton) - 9 9
Ultrapure H2 flow (kg/h) - - 10,030
Ultrapure H2 price ($/kg) - - 2.2
LCOE ($/MWh) 86.4 107.7 105.1
SCE (tonCO2/MWh) 0.72 0.08 0.13
AC ($/tonCO2) - 33.4 32.1
Table 5.10: List of references for unit costs
Unit cost Value Reference
Plant life time (yr) 35 DECC, 2010; ZEP, 2011
Capacity factor (%) 80 DECC, 2010; Kreutz et al., 2005
Discount rate (%) 10 DECC, 2010; Kreutz et al., 2005
Coal cost ($/ton) 60 ZEP, 2011
CO2 carbon tax ($/ton) 25 DEC, 2010
CO2 transport cost ($/ton) 6 Huang et al., 2008
CO2 storage cost ($/ton) 9 Huang et al., 2008
Ultrapure H2 price ($/kg) 2.2 DOE, 2005

202
The IGCC plant life time was set at 35 years for all the cases, which is
consistent with the cost analysis reports relating to IGCCs (DECC, 2010; ZEP,
2011). In addition, the selected capacity factor and the discount rate were found in
the DECC report (2010) and the literature on IGCCs (Kreutz et al., 2005). Net power
plant, coal feed flowrate, and CO2 flowrates in both the flue gas and captured streams
were derived from the overall IGCC simulation results (see Chapter 2) based on
cases 5 and 6 from the DOE report (2007). For the cogenerating case, the results
obtained from the previous sections of this chapter were used considering an
ultrapure H2 production rate of 100 MMSCFD (around 10,030 kg/h) and a nine-
column PSA configuration. Total CAPEX as well as total O&M costs were derived
from the economic analysis data provided by the DOE report (2007). Meanwhile, for
the cogenerating case, it was assumed a suitable CAPEX cost reduction due to the
lower energy generation in the power island and the cost of the Polybed PSA system
was accounted for, as reported in the previous section of this chapter. Following the
instructions issued by the DECC report (2010), the total capital expenditure cost was
spread across the first 5 years of plant life, assuming it would take 5 years for
construction. The relative year percentages of the construction cost are detailed in
Table 5.9. In order to evaluate the coal cost, the low fuel price scenario for hard coals
presented in the ZEP report (2011) was considered where, from a value of 2.3 $/GJ,
the price of 60 $/ton was obtained by means of coal LHV. The carbon tax of 25 $/ton
was chosen according to the minimum carbon cost to make CCS feasible, as reported
by DECC (2010). Considering 100 km of offshore pipelines and an offshore storage
facility, the CO2 transport price and CO2 storage price were evaluated respectively at
6 and 9 $/tonCO2 (Huang et al., 2008). Eventually, for the cogenerating case an
ultrapure hydrogen delivered price of 2.2 $/kg was assumed, which is in the lower
range of the DOE report concerning the hydrogen economy (2005).
Figure 5.12 shows the LCOE calculation results for the examined three cases
where the LCOE constituents are classified as capital, O&M, fuel, carbon tax, CO2
transport and storage costs, and H2 revenue.

203
Figure 5.12: LCOE calculation results for the three examined IGCC cases
It can be noticed that in both the cases with CCS the resulting LCOE is
relatively higher than that in the first case due to the energy penalty involved in the
carbon capture process. In the cogeneration case the capital, O&M and fuel costs are
sensibly higher but the overall evaluated LCOE is lower than the second case
because of the negative contribution of the hydrogen sale, accounting for -74
$/MWh. For all the three examined cases, the capital cost was the highest, followed
by the fuel and O&M costs. The carbon tax is only relevant in the first case where
there is no CCS while the CO2 transport and storage costs remain low in the other
two cases. Considering the first case as the reference case, the cost for CO2 emissions
avoided was estimated respectively for the capture case and cogenerating case at 33.4
and 32.1 $/tonCO2, following the trend of the LCOE.
Table 5.11 reports some data on IGCC plants with pre-combustion capture both
in terms of LCOE and AC. It can be clearly seen that the results obtained in this
study are in agreement with the others, particularly with those reported by the DOE
(2011) and the GCCSI (2011) calculations, which have been conducted more
recently. In fact, differently from the other studies, it should be noted that the results
presented in this section were updated to 2014.
86.4
107.7
105.1

204
Table 5.11: LCOE and AC results of various studies on hard coal IGCC with pre-
combustion capture (ZEP, 2011)
This
study
ZEP
(2009)
ENCAP
(2004)
MIT
(2007)
DOE
(2011)
EPRI
(2009)
Rubin
(2012)
GCCSI
(2011)
LCOE
($/MWh) 107.7 102.3 94.5 100.7 105.5 116.4 100.3 108.2
AC
($/tonCO2) 33.4 28.1 31.5 19.2 35.2 35.2 20.7 36.9
5.5 Recycle of the H2 PSA tail gas to shift reactors
It has been reported that the ultrapure hydrogen yield could be improved by
recycling the H2 PSA tail gas to shift reactors upstream of the H2 PSA (UOP, 2002),
as shown in Figure 5.13. This is because the CO contained in the tail gas could be
converted to CO2 and H2 in a reaction with steam by its recycle to the shift reactors.
This modification can also reduce the energy penalty involved in the carbon capture
unit. The power plant performances are affected by this modification and they will be
discussed in detail in the last sections of this chapter.
However, the more tail gas that is recycled to shift reactors, the lower the
hydrogen mole fraction of the raw H2 feed due to the impurities build-up in the
recycle loop, as depicted in Figure 5.14. Therefore, this process configuration would
be possible only when a substantial amount of impurities is removed out of the
recycle loop in order to maintain impurities levels low enough to enable the
downstream H2 PSA unit to achieve satisfactory H2 purity and recovery at the same
time. This implies that it is essential to bleed a portion of the tail gas out of the
recycle loop by sending it to the gas turbine, as shown in Figure 5.13.

205
Figure 5.13: Block flow diagram of an advanced IGCC plant with a recycle of H2 PSA
tail gas to water gas shift reactors
Figure 5.14: Variation of the hydrogen mole fraction percentage in the raw H2 feed
with the split ratio of the ‘tail gas recycle to shift reactors’ flow to total tail gas flow
It is important to see if the H2 PSA can also be designed to achieve as high as
90% H2 recovery even with the lowered H2 mole fraction in the feed resulting from
the recycle of a certain amount of tail gas to the shift reactors. An iterative

206
calculation has been conducted to evaluate a suitable split ratio of the tail gas recycle
to the shift reactors to obtain a satisfactory H2 recovery, resulting in a value of
around 35% and providing a new feed composition for the integrated PSA unit of
85.40% H2, 3.46% CO2, 2.55% CO, 7.33% N2 and 1.25% Ar on a molar basis.
Keeping the total cycle time of 420 s, the sought target was still 99.99+ mol% of
hydrogen purity with a production rate of 100 MMSCFD. As a result of the
simulation study, it has been estimated that the one-column residence time for a nine-
column PSA system should be increased to 130 s from 120 s in the base case without
recycle, i.e., the H2 PSA unit should be designed with larger columns to
accommodate the higher feed flowrate and to remove more impurities. Accordingly,
the H2 recovery is lowered to around 89.8% from 91.3% due to the increase in the
column volume. The nine-column system was selected because it corresponds to a
minimum capital cost investment, as demonstrated in the previous sections of this
chapter.
Figure 5.15 reports the hydrogen molar fraction along the column for the last
configuration examined at the end of adsorption step and at cyclic steady state.
Figure 5.15: Hydrogen molar fraction profile along the column at the end of adsorption
step and at CSS for the nine-column PSA system

207
With a one-column residence time of 130 s, the resulting column volume was
27.3 m3 while the column length was 9.55 m (Table 5.1). It can be noticed that the
hydrogen mole fraction increases progressively along the column starting from
85.4% at the feed condition until reaching the ultrapure condition at the product end
(99.99%). Even if the concentration front is located at around 3.5 m in the middle of
the column, the weakly adsorbed impurities continue to be gradually adsorbed along
the remaining part of the bed, allowing ultrapure hydrogen to be obtained only in the
proximity of z = L.
5.6 Cogenerating IGCC process improvements
As described in the previous sections, the configuration of the IGCC power
plant integrated with the H2 PSA unit is to have the H2 PSA tail gas sent to the
compressor and then to the gas turbine through the fuel gas saturator for additional
power generation, as depicted in Figure 5.16, referred hereinafter as the Base case.
This is because the extract stream still contains considerable amounts of hydrogen
and carbon monoxide, and hence its lowering heating value can be accordingly
exploited. A portion of the high-pressure clean syngas is also diverted to the coal
dryer to provide the required heat to the unit (Figure 5.16).
Figure 5.16: Block diagram of the Base case
The key idea of this section is to partially recycle the H2 PSA tail gas to other
units of the plant in order to increase the overall net plant efficiency. Given the fact
that the power generation in the power island is fixed at 479 MWe due to the
turbomachinery installed and that the ultrapure hydrogen production rate is also kept

208
fixed at 100 MMSCFD, the overall plant performance can be improved through the
reduction in the auxiliaries’ power consumption, particularly at the dual-stage
Selexol unit, the CO2 compression train and the H2 PSA tail gas compression train.
Moreover, the overall carbon capture rate was kept constant at 90% for all the
improved process configurations. In the following subsections, each change in the
process diagrams from the Base case is highlighted in red.
5.6.1 Case 1: H2 PSA tail gas recycle to water gas shift reactors
Figure 5.17 shows the configuration that was simulated in detail in section 5.5
of this chapter. A fraction of the H2 PSA tail gas is recycled to the WGSRs to
enhance the CO conversion to CO2 and facilitate the carbon capture process. The
other fraction must be sent to the gas turbine, as in the original Base case, to prevent
excessive build-up of the impurities in the recycle loop. Given a mandatory
requirement of a specific carbon capture rate to be achieved in the overall process
(90%), the operation severity in the CO2 removal unit could be alleviated with this
H2 PSA tail gas recycle since the feed to the CO2 removal unit could be given a
higher amount of CO2 than when it operates without the H2 PSA tail gas recycle.
Less power consumption is also expected at the CO2 compression train because,
since the CO2 loading is higher, the CO2 can be regenerated at higher pressures in the
flash drums. By contrast, the H2 PSA tail gas compression power is likely to increase
due to the increase of the H2 PSA tail gas flowrate.
Figure 5.17: Block diagram of the Case 1 with the H2 PSA tail gas recycle to the water
gas shift reactors

209
5.6.2 Case 2: H2 PSA tail gas recycle to dual-stage Selexol unit
In this configuration, the H2 PSA tail gas is directly recycled to the CO2
removal unit since the H2 PSA tail gas has a substantial amount of CO2 as well as
CO, as shown in Figure 5.18. In this case, the H2 PSA tail gas is mixed with the
synthetic gas stream flowing from the H2S removal unit to the CO2 removal unit or it
is fed to the CO2 removal unit separately from the main synthetic gas stream. The
benefit of the H2 PSA tail gas recycle that would be expected with respect to the
energy consumption reduction at both the carbon capture unit and at the CO2
compressor must be smaller than that with the recycle to the WGSRs because no
additional CO is converted to CO2. Accordingly, the power consumption at the H2
PSA tail gas compressor must be lower as well.
Figure 5.18: Block diagram of the Case 2 with the H2 PSA tail gas recycle to the Selexol
unit
5.6.3 Case 3: H2 PSA tail gas recycle to coal dryer
An alternative way to exploit the value of the H2 PSA tail gas is to send a
portion of it to the drying gas preparation, where it is combusted with air to provide
the heat for coal drying, as depicted in Figure 5.19. The original idea for this
configuration was presented in a recent patent (Ahn et al., 2015) and relies on the
fact that the H2 PSA tail gas can be utilised to dry the coal without being
recompressed, instead of the high-pressure clean syngas that would be used for
power generation in the combined cycle. Providing a sufficient lowering heating

210
value from the H2 PSA tail gas flow for the coal dryer, it is possible to save the
power that otherwise would have been utilised to recompress this portion of tail gas.
Therefore, this configuration is expected to exhibit a reduction in the tail gas
compressor power compared with the Base case.
Figure 5.19: Block diagram of the Case 3 with the H2 PSA tail gas recycle to the coal
dryer
5.6.4 Case 4: Multiple alterations with H2 PSA tail gas recycle to
WGSRs and coal dryer
This case allows multiple alterations combining the process modifications
proposed in the previous Cases 1 and 3 at the same time, having a portion of the H2
PSA tail gas recycled to the water gas shift reactors and another portion recycled to
the coal dryer, as shown in Figure 5.20. From the previous discussion, the H2 PSA
tail gas recycle to the dual-stage Selexol was not taken into account in this last
configuration due to the lower expected benefit. It is conceivable that this case would
benefit of the combined power reduction in all the three above-mentioned auxiliaries
relating to the dual-stage Selexol unit, the CO2 compression train and the H2 PSA tail
gas compression train.

211
Figure 5.20: Block diagram of the Case 4 with the H2 PSA tail gas recycle to the water
gas shift reactors and the coal dryer
5.6.5 Comparison for the proposed process modifications
Table 5.12 summarises the simulation results for the proposed configurations
described in the previous subsections. With a common total power output of 479
MWe, an ultrapure hydrogen production rate of 100 MMSFCD and an overall carbon
capture of 90% for all the cases, the outcome of the Base case was a net electrical
plant efficiency of 18.1%. The total auxiliaries’ power consumption accounted for
around 185 MWe, and therefore the resulting net power was 294 MWe.
Case 1 showed a higher net electrical plant efficiency (18.3%) because, even
with a lower PSA H2 recovery and consequently a higher PSA tail gas compression
work, the carbon capture auxiliaries and CO2 compression works decreased
significantly due to the tail gas recycle to WGSRs, which allowed less severe
operation conditions in the CO2 removal unit. In particular, the CO2 removal unit
auxiliaries decreased by 2.6% and the CO2 compression power was reduced by 6.1%,
while the H2 PSA tail gas compression work was incremented by 23.1%. As
expected, a lower improvement was seen for Case 2 where the net power was
increased only by 0.6 MWe. It should be noted that in this case both H2 purity after
the acid gas removal (86.1%) unit and H2 recovery at the PSA unit (90.2%) were in
between the values reported for the Base case and Case 1. Case 3, due to the H2 PSA
tail gas to the coal dryer, exhibited a substantial power reduction in the H2 PSA tail
gas compressor (43.6%) and a consequent increase of the overall net plant efficiency

212
up to 18.3%, with the same carbon capture auxiliaries’ power consumptions.
Eventually, the multiple alterations configuration simulated in Case 4 showed a
power reduction of 2.6% in the CO2 removal unit, of 5.5% in the CO2 compressor
and of 25.6% in the H2 PSA tail gas compressor. The resulting net power was around
3.3 MWe higher than that of the Base case, allowing the overall net plant efficiency
to increase to 18.4%.
Another method to evaluate the net plant efficiency is to add the lowering
heating value of the ultrapure hydrogen (334 MWth) times its flowrate to the
electricity generated and divide this sum by the coal thermal input. In this way, the
net plant efficiency for the base case was estimated at 38.8% while the efficiency for
Case 4 was 39.0% (Table 5.12). Of course, it is clear that the intent of such a
cogenerating plant is to sell the ultrapure hydrogen to refineries that are deficient in
hydrogen to operate their hydrotreater and hydrocracker units, and not to burn this
valuable product.

213
Table 5.12: Simulation results for the cogenerating IGCC plant performances among
the various cases
Plant summary Base case
Case 1 (Base
case + Tail
gas to
WGSRs)
Case 2 (Base
case + Tail
gas to
Selexol unit)
Case 3 (Base
case + Tail
gas to
coal dryer)
Case 4
(Multiple
alterations:
Cases 1 + 3)
Thermal input
(MWth) 1,618 1,618 1,618 1,618 1,618
WGSR CO
conversion (%) 95.7 95.5 95.7 95.7 95.5
AGR H2 purity
(%) 88.7 85.4 86.1 88.7 85.6
AGR H2 recovery
(%) 99.2 99.2 99.2 99.2 99.2
AGR H2S
recovery (%) 99.9 99.9 99.9 99.9 99.9
AGR CO2
recovery (%) 94.1 92.2 94.0 94.1 92.3
CO2 product
purity (%) 98.5 98.5 98.5 98.5 98.5
PSA H2 purity
(%) 99.99+ 99.99+ 99.99+ 99.99+ 99.99+
PSA H2 recovery
(%) 91.3 89.8 90.2 91.3 89.9
Overall carbon
capture (%) 90.0 90.0 90.0 90.0 90.0
H2 production
(MMSCFD) 100.0 100.0 100.0 100.0 100.0
AGR auxiliaries
(MWe) 18.9 18.4 18.6 18.9 18.4
CO2 compression
(MWe) 33.0 31.0 32.1 33.0 31.2
Tail gas
compression
(MWe)
3.9 4.8 4.5 2.2 2.9
Other auxiliaries
(MWe) 129.5 129.5 129.5 129.5 129.5
Total auxiliaries
(MWe) 185.3 183.7 184.7 183.6 182.0
GT power
(MWe) 324.0 324.0 324.0 324.0 324.0
ST power
(MWe) 155.0 155.0 155.0 155.0 155.0
Total power
(MWe) 479.0 479.0 479.0 479.0 479.0
Net power
(MWe)
293.7
(+334
MWth H2
LHV)
295.3
(+334 MWth
H2 LHV)
294.3
(+334 MWth
H2 LHV)
295.4
(+334 MWth
H2 LHV)
297.0
(+334 MWth
H2 LHV)
Net plant
efficiency (%) 18.1 (38.8) 18.3 (38.9) 18.2 (38.8) 18.3 (38.9) 18.4 (39.0)

214
5.7 Hydrogen plant process improvements
In order to obtain a higher benefit from the process improvements proposed in
the previous section, there is a need to increase the H2 PSA tail gas flow, and hence
to have different rates for the cogenerating products, favouring the production of
ultrapure hydrogen over electricity. The limiting case is represented by a hydrogen
plant where only ultrapure hydrogen is produced, as depicted in Figure 5.21. Keeping
the same 1,618 MWth coal thermal input and the same 90% overall carbon capture
rate it was assumed that the H2 PSA unit is capable to produce ultrapure hydrogen
(99.99+ mol%) with a recovery of 90%. The resulting hydrogen production rate was
evaluated at 286 MMSCFD for this new Base case (Ahn et al., 2015).
Table 5.13 summarises the hydrogen plant performances for the Base case and
three improved cases consisting of different ways to recycle the H2 PSA tail gas to
other parts of the plant, as shown in Figure 5.21. In Case 1, 21% of the tail gas is
recycled to upstream of the shift reactor and the H2 production rate is improved by
2.4% to 293 MMSCFD from 286 MMSCFD. When recycled, the tail gas is
compressed up to the pressure of main syngas stream flowing to the shift reactor,
resulting in an increase of total power consumption. Case 2 is as Case 1 with the
addition of a portion of the tail gas utilised to generate hot gases for the coal dryer by
combustion instead of using a portion of high pressure raw H2 feed to the H2 PSA
unit. As a result, the ultrapure hydrogen production rate was found to increase by
around 1.8% in comparison to Case 1, as indicated in Table 5.13. In accordance with
Case 3, beyond the partial tail gas recycle to the water gas shift reactor and the coal
dryer, the remaining tail gas is sent to the dual-stage Selexol process as hot flue gas
after combustion with air. In the dual-stage Selexol unit, the CO2-laden solvents are
regenerated by reducing the pressure over three flash drums in series. By heating the
CO2-laden solvents flowing to a flash vessel operating at medium pressure, more
CO2 product can be obtained at the high pressure resulting in improving the solvent
working capacity and reducing the power consumption at the CO2 compression train.
The enhanced solvent working capacity leads to lowering the power consumption for
CO2 capture due to a reduced H2 slip to the circulating solvents. By utilising 100% of
the H2 PSA tail gas at three locations upstream of the process, the production rate of

215
ultrapure hydrogen was found to increase by around 4.2% and the power
consumptions at the dual-stage Selexol unit and the CO2 compression train were
found to reduce by around 15% and 6%, respectively. Accordingly, it is appreciated
that in Case 3 the total auxiliaries’ power consumption can be reduced by around
3.5% compared to the Base case.
Figure 5.21: Block diagram of the hydrogen plant (HP). Red arrows define the
improved cases of Table 5.13 with different ways to recycle the H2 PSA tail gas to the
water gas shift reactor, the coal dryer and the CO2 regenerator
Table 5.13: Simulation results for the hydrogen plant (HP) performances for the
various cases (Ahn et al., 2015)
Plant summary
HP
base
case
HP Case 1
(HP base case
+ Tail gas to
WGSRs)
HP Case 2
(HP Case 1
+ Tail gas to
coal dryer)
HP Case 3
(HP case 2 +
Tail gas to
CO2 regen.)
Thermal input (MWth) 1,618 1,618 1,618 1,618
Fuel gas flowrate (MMSCFD) 79 72 62 0
Overall carbon capture (%) 90.1 90.1 90.1 90.1
PSA H2 purity (%) 99.99+ 99.99+ 99.99+ 99.99+
PSA H2 recovery (%) 90.0 90.0 90.0 90.0
H2 production (MMSCFD) 286 293 298 298
H2S reboiler duty (MWth) 14.6 14.6 14.6 11.8
AGR auxiliaries (MWe) 20.2 19.3 19.3 17.2
CO2 compression (MWe) 31.7 31.7 31.7 29.8
Tail gas compression (MWe) N/A 3.1 3.1 3.1
Total power consumption
(MWe) 51.9 54.1 54.1 50.1

216
5.8 Conclusions
A detailed simulation of an advanced IGCC plant to produce power and
ultrapure hydrogen simultaneously where CO2 is intrinsically captured by a pre-
combustion capture has been proposed in this chapter. The H2 PSA unit was
designed such that its H2 recovery can be increased close to its maximum in order to
avoid the excessive power consumption involved in tail gas compression and
minimise the H2 PSA feed gas flowrate. Different configurations involving from four
to twelve industrial columns were investigated considering different residence times
and bed sizes. It was found that at the same hydrogen purity of 99.99+ mol%, the
recovery can be increased to 92% in the twelve-column system.
A comprehensive economic analysis based on four cost items – columns,
adsorbent, valves, tail gas compressor – revealed that the minimum CAPEX of 20.3
million $ is associated with the nine-bed system composed of two PSA trains. The
related cost fraction to the simple capture case of the IGCC was found to be as high
as 1.35%.
A detailed economic analysis was also carried out considering the entire IGCC
plants. For the simple capture case, the associated LCOE and cost of CO2 avoided
(AC) were evaluated at 107.7 $/MWh and 33.4 $/tonCO2, respectively. These results
are in perfect agreement with those reported by other organisations and research
groups. For the cogenerating case, they were respectively found at 105.1 $/MWh and
32.1 $/tonCO2.
The advanced cogenerating IGCC plant can be improved by implementing the
H2 PSA tail gas recycle to other units of the plant, such as the water gas shift
reactors, the dual-stage Selexol unit and the coal dryer. These process modifications
led to a rise in the overall net plant efficiency because they can alleviate the power
consumption at the CO2 removal unit, the CO2 compressor and the H2 PSA tail gas
compressor. Keeping fixed the plant power output at 479 MWe, the ultrapure
hydrogen production rate at 100 MMSCFD and the overall carbon capture at 90% for
all the configurations, the case where a portion of the tail gas is recycled to both the
WGSRs and the coal dryer showed a net electrical plant efficiency of 18.4% against
18.1% for the base case.

217
Furthermore, with reference to a hydrogen plant where the ultrapure production
rate and the total power consumption for the base case were evaluated at 286
MMSCFD and 51.9 MWe, respectively, it was found that an improved configuration
with the total recycle of the H2 PSA tail gas to three locations upstream of the
process – the water gas shift reactor, the coal dryer and the acid gas removal unit –
could increase the ultrapure hydrogen production rate by 4.2% and reduce the total
auxiliaries’ power consumption by 3.5%.
References
Ahn H, Brandani S, Luberti M, Lee CH. Hydrogen production processing. WO 2015/104532
A1, 2015.
ASME’s Boiler and Pressure Vessel Code (BPVC). Section VIII: Pressure Vessels. 2013;
available at www.asme.org.
Bird RB, Stewart WE, Lightfoot EN. Transport Phenomena 2nd
Edition, 2007.
Chemical Engineering’s Plant Cost Index. 2014; available at www.che.com/pci.
DECC. UK Electricity Generation Costs Update, 2010.
DOE NETL. Roadmap on manufacturing R&D for the hydrogen economy, 2005.
DOE NETL. Cost and performance baseline for fossil energy plants, 2007.
DOE NETL. Cost estimation methodology for NETL assessments of power plant
performance, 2011.
ENCAP. Periodic activity report in Sustainable Energy Systems, 2004.
EPRI. Updated cost and performance estimates for advanced coal technologies including
CO2 capture, 2009.
Fuderer A, Rudelstorfer E. US Patent No. 3986849, to Union Carbide Corporation, 1976.
GCCSI. Economic assesment of carbon capture and storage technologies, 2011.
Geankoplis CJ. Transport processes and unit operations, 1997.

218
General Electric. Heavy duty gas turbine products (GEA12985H). 2009; available at
https://powergen.gepower.com/plan-build/products/gas-turbines/index.html.
Green DW, Perry RH. Perry’s Chemical Engineering Handbook, 8th Edition, 2007.
Honeywell. UniSim Design R400, 2011.
Huang Y, Rezvani S, McIlveen-Wright D, Minchener A, Hewitt N. Techno-economic study
of CO2 capture and storage in coal fired oxygen fed entrained flow IGCC power plants. Fuel
Processing Technology 2008; 89: 916-925.
IEA GHG. 2009; available at www.iea.org/publications.
IPCC. Special report on carbon dioxide capture and storage. 2005.
Li M, Rao AD, Samuelsen GS. Performance and costs of advanced sustainable central power
plants with CCS and H2 co-production. Applied Energy 2012; 91: 43-50.
Kreutz T, Williams R, Chiesa P, Consonni S. Coproduction of hydrogen, electricity and CO2
from coal with commercially ready technology. Part B: Economic analysis. Hydrogen
Energy 2005; 30: 769-784.
Luberti M, Friedrich D, Brandani S, Ahn H. Design of H2 PSA for cogeneration of ultrapure
hydrogen and power at an advanced integrated gasification combined cycle with pre-
combustion capture. Adsorption 2014; 20: 511-524.
Matches’ Process Equipment Cost Estimates. 2014; available at
www.matche.com/equipcost.
Megyesy EF. Pressure vessel handbook. Pressure vessel publishing Inc., USA. 1995.
Mhaskar PR, Moharir AS. Heuristics for synthesis and design of pressure-swing adsorption
processes. Adsorption 2012; 18: 275-295.
MIT. The future of coal, 2007.
Nikolic D, Georgiadis MC, Kikkinides ES. An optimization framework of multibed pressure
swing adsorption systems. 18th European Symposium on Computer Aided Process
Engineering – ESCAPE 18, 2008.
PSE Ltd. 2010; available at http://www.psenterprise.com.

219
Rubin ES, Chen C, Rao AB. Cost and performance of fossil fuel power plants with CO2
capture and storage. Energy Policy 2007; 35: 4444-4454.
Rubin ES. Understanding the pitfalls of CCS cost estimates. International Journal of
Greenhouse Gas Control 2012; 10: 181-190.
Rubin ES, Short C, Booras G, Davison J, Ekstrom C, Matuszewski M, McCoy S. A
proposed methodology for CO2 capture and storage cost estimates. International Journal of
Greenhouse Gas Control 2013; 17: 488-503.
UOP. Recent SelexolTM
, PolySepTM
and PolyBedTM
operating experience with gasification
for power and hydrogen. Gasification Technologies 2002.
UOP, 2014. Available at www.uop.com/equipment/hydrogen-separation/#pressure-swing-
adsorption.
Xi’an Lvneng Purification Technology Co, Ltd, 2014, available at
http://xalvneng.en.alibaba.com.
ZEP. Annual report 2009, available at www.zeroemissionsplatform.eu.
ZEP. The costs of CO2 capture: post-demonstration CCS in the EU. 2011, available at
www.zeroemissionsplatform.eu.

220
Chapter 6: Conclusions and directions for future
work
The aim of this thesis was to explore the challenges associated with the process
integration of PSA technology for hydrogen purification with an advanced IGCC
power plant with pre-combustion capture. Three main subjects were discussed in this
thesis: the detailed simulation of an advanced IGCC power plant (Chapter 2), the
design and numerical simulation of a new PSA unit for hydrogen purification from a
lab-scale perspective (Chapters 3 and 4) and the retrofit of an industrial H2 PSA unit
to the IGCC plant for cogenerating ultrapure hydrogen and power (Chapter 5).
Conclusions and recommendations for future work in these areas are listed in the
following sections.
6.1 IGCC power plant modelling
Integrated gasification combined cycles (IGCCs) are one of the emerging clean
coal technologies that pave the way for producing power from coal with a higher net
power efficiency than conventional PC-fired boiler power plants. It is also
advantageous that in an IGCC power plant a carbon capture unit can be applied to a
stream with a very high CO2 partial pressure upstream of gas combustion that would
not be available in the case of a PC-fired boiler power plant, leading to a lower
energy penalty involved in the carbon capture.
Despite the fact that IGCC is a well-established industrial process for power
generation, there is huge potential for improving its performance, hence the research
effort that has been made for the last decades. However, a realistic and reliable
representation of the IGCC operation is not trivial or simple to accomplish. This is
due to the challenges posed by the complexity of the simulation and by the need to
examine the overall performance of the plant. More than 300 units are, in fact,
involved in the complete and continuous process flow diagrams developed,
depending on the case examined. IGCC power plant operation and performance have
received significant research interest, but only a few previous studies have presented

221
detailed continuous designs for IGCC power plants with carbon capture targets as
high as 90%.
When it comes to retrofitting IGCC power plants with CO2 capture processes,
almost all the parts of the conventional, non-capture plant are affected. It is expected
that there will be increments in the fuel that are fed to the gasifiers to operate the
same gas turbine. With reference on the DOE report (2007), it was found that the
IGCC power plant with Shell gasifier has a 41.1% net plant efficiency without
carbon capture but this efficiency drops to approximately 31.2% when carbon
capture is integrated. Water gas shift reactors are an essential addition to the IGCC
power plant when it has to be operated with retrofitted carbon capture process. In
order to promote the conversion of CO to CO2, IP steam extracted from the steam
cycle has to be added. The resulting conversion was around 95.7%.
The dual-stage Selexol process is the state-of-art technology to be used for
IGCC in order to not only remove H2S, but also to capture CO2. The CO2
compression train downstream of the CO2 capture process is another additional
component to the carbon capture IGCCs where the CO2 product is compressed to a
pressure suitable for CO2 transport and storage. Most of the modifications necessary
for the carbon capture operation of the IGCC power plant are directly connected with
an effect on the performance of the plant and an energy penalty, which is interpreted
as a loss in the net plant efficiency. The absorption regime occurring with DEPG
solvent in the Selexol process was successfully modelled by a predictive simulation
tool developed to describe the behaviour of the acid/shifted syngas in the solvent.
CO2 capture processes using DEPG in a Selexol process have been examined in
detail for the IGCC power plant and were presented. One substantial improvement of
the Selexol unit could be the employment of solvent warming just before phase
separation in the last flash drum to enhance the solvent working capacity, leading to
decreased auxiliaries and therefore increased power plant efficiency. Further work is
also essential to develop power plant configurations in which solvents other than
Selexol, and mixed solvents such as Sulfinol-M and Sulfinol-D, are used for AGR
and CO2 capture.
Pressure swing adsorption technology (PSA) applied to IGCC pre-combustion
capture can be considered another possible research area of interest. Alike in the

222
post-combustion capture process, promising results are expected in terms of lower
energy penalty associated to the carbon capture unit as reported in recent literature.
Other plant units were successfully simulated, such as the EP ASU, the Claus
plant and the power island. One obvious, yet significant, change in the carbon
capture IGCC cases is the fact that there is no potential for air integration between
the GT compressor and the EP ASU. The steam cycle had to be redesigned mainly in
order to provide steam to the water gas shift reactors. Specific software has to be
used to develop a simulation tool capable of realistically representing the operation
of the combustor, air compressor and gas turbine block.
Eventually, considering the net plant efficiency loss, the effect of the CO2
capture process on the power plant’s performance is of significant importance but it
is unrealistic to assume that only the CO2 capture process that will cause energy
losses as the power plant operation is a continuous process and all plant units are
interconnected.
6.2 Design of a novel H2 PSA unit applied to an IGCC H2-
rich feed
The production of hydrogen is both a sought-after target and an appropriate
environmental solution because it is commonly utilised as a feedstock in refineries as
well as an energy carrier in fuel cells. It is well known, in fact, that most refining
complexes face a significant deficiency in their existing hydrogen production
capacity. Hydrogen is needed for operating their hydrotreating desulfurisation
process, which removes mainly sulfur and other impurities from raw petroleum
products and hydrocracking units to upgrade low-grade heavy residues to more
valuable diesel and lube base oil. Due to the requirement for very high operational
severity in both units for deep desulfurisation and improved product quality,
ultrapure hydrogen with a purity of 99.99+ mol% should be utilised for the
hydroprocessing.
A valid way to produce hydrogen is through IGCC with CO2 capture. In
producing ultrapure hydrogen from such a gas mixture as composed of H2, CO2, CO,
N2 and Ar, it is well known that pressure swing adsorption (PSA) is the only
economically feasible, commercialised separation process. Therefore, it is essential

223
to retrofit a H2 PSA unit to the IGCC in order to cogenerate hydrogen and power
simultaneously. Knowing the maximum H2 recovery that a H2 PSA can produce from
the raw H2 gas is very important in evaluating the performance of the advanced
IGCC plant for cogenerating power and ultrapure hydrogen. This is because the
flowrate of PSA tail gas, to be determined by the H2 recovery, should be
recompressed and fed to the gas turbine along with the fuel gas. Therefore, it is
essential to design a H2 PSA such that its H2 recovery can be maximised in order to
minimise the power consumption relating to tail gas compression.
Accordingly, lab-scale simulations were carried out to increase the H2 recovery
by increasing the complexity of the PSA step configuration, which enables a PSA
cycle to have a lower feed flow to one column for adsorption and more pressure
equalisation steps. As a result, the H2 recovery reached a maximum of around 93%
with a Polybed H2 PSA system with twelve columns and the step configuration
containing simultaneous adsorption at three columns and four-stage pressure
equalisation (Luberti et al., 2014). This result was obtained for both the cases of
fixed column dimensions with varying cycle time and for fixed cycle time with
varying column dimensions, at a given total flowrate. Further work would be needed
to experimentally validate these results because the size of the adsorption columns in
this investigation was determined to be the same as those of a lab-scale six-column
PSA rig in the process-engineering laboratory at the University of Edinburgh. The rig
construction has, in fact, just been completed and the rig interface work is nearly
done.
An additional research direction for the future might be related to the use of
novel adsorbents for the hydrogen purification process, such as metal organic
frameworks (MOFs). Unlike a conventional H2 PSA unit from SMR, in the IGCC H2
PSA the main impurities in the raffinate stream are represented by the weakly
adsorbed nitrogen and argon components. Future work should focus on synthesising
novel adsorbents that, for the given range of partial pressures, would exhibit lower
capacity for hydrogen and higher selectivity for N2/H2 and Ar/H2, compared to the
referential 5A zeolite adsorbent.

224
6.3 Retrofit of an industrial H2 PSA unit to an IGCC
After the lab-scale simulations, different configurations involving from four to
twelve columns were also studied considering an industrial scale H2 PSA unit
capable to produce 100 MMSCFD of ultrapure hydrogen and using different
residence times and bed sizes. It was found that the recovery could be increased to
92% while the productivity was 395 molH2/kgads/d for the twelve-column system.
Moreover, a comprehensive economic analysis based on four cost items – columns,
adsorbent, valves, tail gas compressor – revealed that the minimum CAPEX of 20.3
million $ is associated with the nine-bed system composed of two PSA trains. The
related cost fraction of the simple capture case of the IGCC was found to be as high
as 1.35%. A detailed economic analysis was also carried out considering the entire
IGCC plant. For the simple capture case, the associated levelised cost of electricity
(LCOE) and cost of CO2 avoided (AC) were evaluated at 107.7 $/MWh and 33.4
$/tonCO2. These results are in perfect agreement with those reported by other
organisations and research groups. For the cogenerating case they were respectively
found to be 105.1 $/MWh and 32.1 $/tonCO2.
In the base case, the cogenerating IGCC is designed so that a portion of the
high-pressure clean syngas is sent to the coal dryer while the entire H2 PSA tail gas is
recompressed and sent to the gas turbine. This configuration can be improved by
implementing the H2 PSA tail gas recycle to other units of the plant, such as the
water gas shift reactors, the dual-stage Selexol unit and the coal dryer. These process
modifications led to a rise in the overall net plant efficiency because they can
alleviate the power consumption of the CO2 removal unit, the CO2 compressor and
the H2 PSA tail gas compressor. Keeping the power output at 479 MWe, the ultrapure
hydrogen production rate at 100 MMSCFD and 90% overall carbon capture for all
the configurations, the case where a portion of the tail gas is recycled to both the
WGSRs and the coal dryer showed a net electrical plant efficiency of 18.4% against
the 18.1% of the base case.
Part of the proposed modifications and the related simulation results were
presented in a recent patent (Ahn et al., 2015) and they may have commercial interest
for companies, such as Honeywell UOP, Air Products, Air Liquide and refining

225
companies in general. In the limiting case where a coal gasification hydrogen plant
produces only ultrapure hydrogen with a production rate of 286 MSCFD and 90%
overall carbon capture, it was demonstrated that it is possible to efficiently recycle
the total H2 PSA tail gas to three locations upstream of the PSA unit, such as the
water gas reactor, the coal dryer and the dual-stage Selexol unit, in order to increase
the hydrogen yield by 4.2% and decrease the total auxiliaries’ power consumption by
3.5%.
Future work could rely on the design and simulation of other cogenerating
IGCC scenarios with different H2/electricity production rates in order to make the
IGCC plant more flexible to the market demands of these two valuable products. The
ultimate, relatively low CO2 capture cost penalty for H2 from coal and the prospect
that, even with current technology, H2 from coal with CCS might soon become
competitive compared to H2 from natural gas with CO2 venting, suggest that
cogenerating IGCC plants have a promising future in a climate-constrained low-
carbonised world if H2 becomes a major energy carrier and if the CO2 storage
challenges can be addressed effectively.
References
Ahn H, Brandani S, Luberti M, Lee CH. Hydrogen production processing. WO 2015/104532
A1, 2015.
DOE NETL. Cost and performance baseline for fossil energy plants, 2007.
Luberti M, Friedrich D, Brandani S, Ahn H. Design of H2 PSA for cogeneration of ultrapure
hydrogen and power at an advanced integrated gasification combined cycle with pre-
combustion capture. Adsorption 2014; 20: 511-524.

226
Appendix 1: DOE case 6 block flow diagram and
data

227
V-L Mole
Fraction 1 2 3 4 5 6
Ar 0.0094 0.0263 0.0360 0.0024 0.0360 0.0000
CH4 0.0000 0.0000 0.0000 0.0000 0.0000 0.0000
CO 0.0000 0.0000 0.0000 0.0000 0.0000 0.0000
CO2 0.0003 0.0091 0.0000 0.0000 0.0000 0.0000
COS 0.0000 0.0000 0.0000 0.0000 0.0000 0.0000
H2 0.0000 0.0000 0.0000 0.0000 0.0000 0.0000
H2O 0.0104 0.2820 0.0000 0.0004 0.0000 1.0000
H2S 0.0000 0.000 0.0000 0.0000 0.0000 0.0000
N2 0.7722 0.4591 0.0140 0.9918 0.0140 0.0000
NH3 0.0000 0.0000 0.0000 0.000 0.0000 0.0000
O2 0.2077 0.2235 0.9500 0.0054 0.9500 0.0000
SO2 0.0000 0.000 0.0000 0.0000 0.0000 0.0000
Total 1.0000 1.0000 1.0000 1.0000 1.0000 1.0000
Temperature
(°F) 238 70 90 385 518 750
Pressure
(psia) 190.0 16.4 125.0 460.0 740.0 740
Enthalpy
(Btu/lb) 56.9 26.8 11.4 88.0 107.7 1,409.5
Density
(lb/ft3)
0.732 0.104 0.688 1.424 2.272 1.027
V-L FIowrate
(lbmol/hr) 56,388 2,025 230 40,650 11,358 2,534
V-L Flowrate
(lb/hr) 1,627,030 53,746 7,428 1,140,640 366,070 46,657
Solids
Flowrate
(lb/hr)
0 0 0 0 0 0

228
V-L Mole
Fraction 7 8 9 10 11 12
Ar 0.0000 0.0102 0.0000 0.0000 0.0000 0.0097
CH4 0.0000 0.0004 0.0000 0.0000 0.0000 0.0004
CO 0.0000 0.0265 0.0000 0.0000 0.0000 0.5716
CO2 0.0000 0.0211 0.0000 0.0000 0.0000 0.0211
COS 0.0000 0.0000 0.0000 0.0000 0.0000 0.0007
H2 0.0000 0.8874 0.0000 0.0000 0.0000 0.2901
H2O 0.0000 0.0001 1.0000 1.0000 0.0000 0.0364
H2S 0.0000 0.0000 0.0000 0.0000 0.0000 0.0081
N2 1.0000 0.0543 0.0000 0.0000 0.0000 0.0585
NH3 0.0000 0.0000 0.0000 0.0000 0.0000 0.0033
O2 0.0000 0.0000 0.0000 0.0000 0.0000 0.0000
SO2 0.0000 0.0000 0.0000 0.0000 0.0000 0.0000
Total 1.0000 1.0000 1.0000 1.0000 0.0000 1.0000
Temperature
(ºF) 560 121 59 215 2,595 2,595
Pressure
(psia) 815.0 469.6 14.7 14.7 614.7 604.7
Enthalpy
(Btu/lb) 132.2 113.8 11,676.0 - - 1,012.8
Density
(lb/ft3)
2.086 0.407 - - - 0.563
V-L FIowrate
(lbmol/hr) 2,110 491 2,923 1,218 0 42,059
V-L Flowrate
(lb/hr) 59,121 2,651 52,617 21,935 0 865,967
Solids
Flowrate
(lb/hr)
0 0 420,559 420,559 47,374 0

229
V-L Mole
Fraction 13 14 15 16 17 18
Ar 0.0052 0.0000 0.0064 0.0064 0.0064 0.0102
CH4 0.0002 0.0000 0.0002 0.0002 0.0002 0.0004
CO 0.3070 0.0000 0.0166 0.0166 0.0166 0.0265
CO2 0.0113 0.0000 0.3771 0.3771 0.3771 0.0211
COS 0.0004 0.0000 0.0000 0.0000 0.0000 0.0000
H2 0.1559 0.0000 0.5547 0.5547 0.5547 0.8874
H2O 0.4826 1.0000 0.0014 0.0014 0.0014 0.0001
H2S 0.0043 0.0000 0.0050 0.0050 0.0050 0.0000
N2 0.0314 0.0000 0.0385 0.0385 0.0385 0.0543
NH3 0.0018 0.0000 0.0000 0.0000 0.0000 0.0000
O2 0.0000 0.0000 0.0000 0.0000 0.0000 0.0000
SO2 0.0000 0.0000 0.0000 0.0000 0.0000 0.0000
Total 1.0000 1.0000 1.0000 1.0000 1.0000 1.0000
Temperature
(ºF) 500 750 574 95 95 121
Pressure
(psia) 564.4 825.0 544.7 482.6 472.6 469.6
Enthalpy
(Btu/lb) 665.9 1,368.0 767.7 25.6 25.6 113.8
Density
(lb/ft3)
1.064 1.145 0.944 1.598 1.565 0.407
V-L
FIowrate
(lbmol/hr)
78, 325 11,679 89,158 63,376 63,376 39,127
V-L Flowrate
(lb/hr)
1,519,30
0 210,400
1,714,46
0
1,246,47
0
1,246,47
0
211,22
6
Solids
Flowrate
(lb/hr)
0 0 0 0 0 0

230
V-L Mole
Fraction 19 20 21 22 23
Ar 0.0099 0.0099 0.0000 0.0000 0.0000
CH4 0.0004 0.0004 0.0000 0.0000 0.0000
CO 0.0256 0.0256 0.0000 0.0000 0.0000
CO2 0.0204 0.0204 1.0000 0.3526 1.0000
COS 0.0000 0.0000 0.0000 0.0006 0.0000
H2 0.8584 0.8584 0.0000 0.0000 0.0000
H2O 0.0327 0.0327 0.0000 0.0502 0.0000
H2S 0.0000 0.0000 0.0000 0.3122 0.0000
N2 0.0526 0.0526 0.0000 0.2845 0.0000
NH3 0.0000 0.0000 0.0000 0.0000 0.0000
O2 0.0000 0.0000 0.0000 0.0000 0.0000
SO2 0.0000 0.0000 0.0000 0.0000 0.0000
Total 1.0000 1.0000 1.0000 1.0000 0.0000
Temperature
(°F) 213 385 156 124 352
Pressure
(psia) 453.9 448.9 2,214.7 60.0 23.6
Enthalpy
(Btu/Ib) 327.0 535.7 -46.4 37.9 362.5
Density
(lb/ft3)
0.365 0.288 30.929 0.343 0.080
V-L
FIowrate
(lbmol/hr)
40,448 40,448 22,707 1,017 0
V-L
Flowrate
(lb/hr)
235,031 235,031 999,309 35,657 0
Solids
Flowrate
(lb/hr)
0 0 11,307 0 11,825

231
V-L Mole
Fraction 24 25 26 27
Ar 0.0074 0.0094 0.0091 0.0091
CH4 0.0000 0.0000 0.0000 0.0000
CO 0.0792 0.0000 0.0000 0.0000
CO2 0.2293 0.0003 0.0063 0.0063
COS 0.0003 0.0000 0.0000 0.0000
H2 0.0417 0.0000 0.0000 0.0000
H2O 0.4003 0.0108 0.1258 0.1258
H2S 0.0013 0.0000 0.0000 0.0000
N2 0.2379 0.7719 0.7513 0.7513
NH3 0.0000 0.0000 0.0000 0.0000
O2 0.0000 0.2076 0.1075 0.1075
SO2 0.0026 0.0000 0.0000 0.0000
Total 1.0000 1.0000 1.0000 1.0000
Temperature
(°F) 280 59 1,051 270
Pressure
(psia) 23.6 14.7 15.2 15.2
Enthalpy
(Btu/Ib) 362.5 13.8 364.1 150.8
Density
(lb/ft3)
0.080 0.076 0.026 0.053
V-L FIowrate
(lbmol/hr) 1,603 244,799 308,019 308,019
V-L Flowrate
(lb/hr) 42,962 7,062,330 8,438,000 8,438,000
Solids
Flowrate
(lb/hr)
0 0 0 0

232
Appendix 2: Design of H2 PSA for cogeneration of
ultrapure hydrogen and power at an advanced
integrated gasification combined cycle with pre-
combustion capture by Luberti et al., 2014

Design of a H2 PSA for cogeneration of ultrapure hydrogenand power at an advanced integrated gasification combined cyclewith pre-combustion capture
Mauro Luberti • Daniel Friedrich • Stefano Brandani •
Hyungwoong Ahn
Received: 18 May 2013 / Accepted: 29 November 2013 / Published online: 14 December 2013
� Springer Science+Business Media New York 2013
Abstract A novel hydrogen pressure swing adsorption
system has been studied that is applied to an advanced inte-
grated gasification combined cycle plant for cogenerating
power and ultrapure hydrogen (99.99? mol%) with CO2
capture. In designing the H2 PSA, it is essential to increase the
recovery of ultrapure hydrogen product to its maximum since
the power consumption for compressing the H2 PSA tail gas
up to the gas turbine operating pressure should be minimised
to save the total auxiliary power consumption of the advanced
IGCC plant. In this study, it is sought to increase the H2
recovery by increasing the complexity of the PSA step con-
figuration that enables a PSA cycle to have a lower feed flow to
one column for adsorption and more pressure equalisation
steps. As a result the H2 recovery reaches a maximum around
93 % with a Polybed H2 PSA system having twelve columns
and the step configuration contains simultaneous adsorption at
three columns and four-stage pressure equalisation.
Keywords IGCC � Pressure swing adsorption �Hydrogen purification � Cogeneration
Nomenclature
Ac Internal column surface area, m2
Ap Pellet surface area, m2
bij Adsorption equilibrium constant of site j for
comp. i, bar-1
bi,0j Pre-exponential adsorption equilibrium
constant coefficient of site j for comp. i, bar-1
ci Gas concentration of component i, mol m-3
cim Gas concentration of component i in the
macropore, mol m-3
cT Total gas concentration, mol m-3
cP;s Specific heat capacity at constant pressure of
the adsorbent, J kg-1 K-1
DL Axial mass dispersion coefficient, m2s-1
Dc Column diameter, m
Dm Molecular diffusivity, m2 s-1
Dp,i Macropore diffusivity of component i, m2 s-1
dp Pellet averaged diameter, m
hw Heat transfer coefficient at the column wall,
W m-2 K-1
Hf Enthalpy in the fluid phase per unit volume,
J m-3
eHiPartial molar enthalpy in the fluid phase of
component i, J mol-1
DeH ji
Heat of adsorption of site j for component i,
J mol-1
Ji Diffusive flux of component i, mol m-2 s-1
JT Thermal diffusive flux, W m-2
kg Gas conductivity, W m-1 K-1
kip�Ap/Vp LDF mass transfer coefficient of component i
in the pellet, s-1
kicr�3/rc LDF mass transfer coefficient of component i
in the crystal, s-1
Lc Column length, m
Mads Adsorbent mass, kg
P Pressure, bar
Pr Prandtl number, [-]
�qi Average adsorbed concentration of component
i in the crystal, mol kg-1
qi* Adsorbed concentration of component i at
equilibrium, mol kg-1
qi,sj Saturation capacity of site j for comp. i,
mol kg-1
M. Luberti � D. Friedrich � S. Brandani � H. Ahn (&)
Scottish Carbon Capture and Storage Centre, Institute for
Materials and Processes, School of Engineering, The University
of Edinburgh, Mayfield Road, Edinburgh EH9 3JL, UK
e-mail: [email protected]
123
Adsorption (2014) 20:511–524
DOI 10.1007/s10450-013-9598-0

�Qi Average adsorbed concentration of component
i in the pellet, mol m-3
Qfeed Feed flow rate, mol s-1
R Ideal gas constant J mol-1 K-1
Re Reynolds number, [-]
rc Crystal radius, m
rp Pellet radius, m
Sc Schimdt number, [-]
t Time, s
tcycle Cycle time, s
T Temperature, K
Tf Fluid temperature, K
Tw Column wall temperature, K
u Velocity, m s-1
Uf Internal energy in the fluid phase per unit
volume, J m-3
UP Internal energy in the pellet per unit volume,
J m-3
UP,f Internal energy in the macropore per unit
volume, J m-3
UP,s Internal energy in the solid phase per unit
volume, J m-3
v Interstitial flow velocity, m s-1
Vc Column volume, m3
Vp Pellet volume, m3
xi, yi Molar fraction of component i, [-]
z Spatial dimension, m
Greek letters
e External bed void fraction, [-]
ep Pellet void fraction, [-]
kL Axial thermal dispersion coefficient, W m-1 K-1
l Viscosity, bar s
qf Fluid density, kg m-3
qp Pellet density, kg m-3
1 Introduction
Eight refineries in the UK are currently emitting 14.9
MtCO2 which accounts for around 3 % of total UK CO2
emission in 2009 (DECC 2009). The INEOS refining plant
in Grangemouth, for example, emits around 2.2 MtCO2 per
annum, which is equivalent to 4 % of total CO2 emissions
in Scotland (SEPA 2008). The Committee on Climate
Change (CCC) estimated that there will be a chance to
curtail around 3.5 MtCO2 out of 14.9 MtCO2 from refin-
eries by 2030 by improving their energy efficiency. The
CCC also foresaw that beyond this target of abatement, a
further reduction would be possible by deploying carbon
capture units on H2 plants and replacing combustion fuels
with carbon–neutral biomass (Committee on Climate
Change 2011).
It is well known that most refining complexes face a
significant deficiency of their existing hydrogen production
capacity. Hydrogen is needed for operating their hydro-
treating desulphurisation process that removes mainly
sulphur and other impurities from raw petroleum products
and hydrocracking units for upgrading low-grade heavy
residues to more valuable diesel and lube base oil. The
need for H2 is bound to increase due to the trends of (1)
more stringent sulphur and nitrogen specification in fuel
oils, (2) increasing crack spread, and (3) the rapid change
of crude oil properties from ‘light and sweet’ to ‘heavy and
sour’. Due to the requirement of very high operational
severity in both units for deep desulphurisation and
improved product quality, ultrapure hydrogen with a purity
of 99.99? mol% should be utilised for the hydroprocess-
ing. Accordingly, most refineries are forced to increase
rapidly their hydrogen production capacities to cope with
the increased H2 demand but it is doubtful that given the
upcoming carbon emission regulation conventional steam
methane reforming (SMR) H2 processes would be still the
best option to meet this demand.
Most refineries have their own power plant to provide
various units with the utilities such as steam and electricity.
In particular, when integrated with a carbon capture unit,
integrated gasification combined cycle (IGCC) power
plants would have significantly lower energy penalty than
coal-fired power plants since a carbon capture unit can be
applied to a gas stream having higher CO2 partial pressure
in IGCC power plants. As a result, it has been reported that
IGCC power plants integrated with pre-combustion capture
would have notably higher net power efficiency than coal
fired power plants (DOE 2007).
It should also be noted that IGCC power plants run gas
turbines using H2-rich fuel gas (88–91 mol% H2 purity) in
CO2 capture cases instead of mixtures of CO and H2 in
non-capture cases and it is easy to produce ultrapure
hydrogen product by purifying the H2-rich fuel gas. This
means that by replacing both the existing SMR H2 plant
and the coal-fired power plants with an advanced IGCC
plant it would be possible to provide refining complexes
with ultrapure H2 and power simultaneously where CO2
can be inherently captured as depicted in Fig. 1.
In producing ultrapure hydrogen (99.99? mol%) from
such a gas mixture as composed of H2, CO2, CO, N2 and
Ar, it is well-known that a pressure swing adsorption (PSA)
is the only economically feasible, commercialised separa-
tion process. The multi-column PSA process, known as
UOP Polybed, has been widely applied to SMR H2 plants
to produce ultrapure H2 from shifted syngas. However, the
conventional H2 PSA has been designed and optimised
against a feed stream of around 71 % H2, 19 % CO2, 4 %
CO and 5 % CH4 at 20 bar found in a SMR H2 process.
This composition and the pressure of the raw H2 feed in a
512 Adsorption (2014) 20:511–524
123

SMR-based H2 plant is quite different from the raw H2 fuel
gas in IGCC power plants with carbon capture (88.75 %
H2, 2.12 % CO2, 2.66 % CO, 5.44 % N2, 1.03 % Ar at
34 bar). Therefore, there is a need to revisit the design of
the H2 PSA process to estimate the H2 recovery and pro-
ductivity obtained at the operating conditions to meet the
H2 product purity as high as 99.99? mol%.
2 Design basis of a H2 PSA integrated with an IGCC
power plant
This study is aimed at the design of a H2 PSA system that is
applicable to an advanced IGCC plant for producing both
ultrapure H2 and power. The advanced IGCC plant is a
modification of a conventional IGCC power plant with
carbon capture to include a new H2 PSA unit and its block
flow diagram is illustrated in Fig. 2.
The process design of the conventional IGCC power
plants with carbon capture is based on an exemplary IGCC
power plant using a Shell gasifier (DOE 2007; Kapetaki
et al. 2013). The syngas stream from the shift reactors is
fed to an acid gas removal unit (AGR), such as a dual-stage
Selexol unit, to remove CO2 as well as H2S from the
syngas. In the conventional IGCC process, the treated
syngas leaving the AGR becomes saturated with water in a
fuel gas saturation column and then is fed to the combus-
tion chamber of a gas turbine. But in this study the treated
syngas is split into two streams: one stream flows directly
to a gas turbine for power generation and the other is sent
to a H2 PSA for ultrapure H2 production. The H2 PSA tail
gas obtained as by-product needs to be compressed up to
the operating pressure of the gas turbine and sent to the
combustion chamber with the H2-rich fuel gas.
Various H2 PSA designs have been studied so far in
order to estimate their performance when they are applied
to conventional SMR H2 plants (Ribeiro et al. 2008, 2009;
Lopes et al. 2011). Even though the H2 recovery that is
expected of a commercial Polybed H2 PSA in a SMR H2
plant is as high as 89 %, they could obtain 52 to 80 % H2
recovery at around 99.99 mol% H2 purity. This is because
the H2 PSA systems in their design were configured with
maximum four columns while commercial Polybed H2
PSA systems in most cases contain seven to sixteen
adsorption columns to enable enhanced hydrogen recovery.
In this study, H2 PSA systems having up to twelve columns
have been simulated to see the effect of different PSA step
configurations that are subject to the chosen number of
Fig. 1 A conceptual diagram to
compare general approach to
capture CO2 from a SMR H2
plant and a coal-fired power
plant separately to an advanced
IGCC process for cogenerating
power and ultrapure hydrogen
with carbon capture (this study)
2-stageWGSR
Syngas
Shiftsteam
Shiftedsyngas Dual-
stageSelexol
H2S
CO2H2
PSA
GasTurbine
Ultrapurehydrogen
Flue gas toHRSG
H2 PSA tail gas
Compressor
Fig. 2 Block flow diagram of
an advanced IGCC process for
cogenerating power and
ultrapure hydrogen
Adsorption (2014) 20:511–524 513
123

columns on the H2 recovery using an in-house cyclic
adsorption process simulator (Friedrich et al. 2013).
Given the composition and the pressure of raw H2 feeds
that previous study dealt with (Ahn et al. 2001), it was con-
cluded that H2 PSA designs that were configured with
adsorption columns having two adsorbent layers would
exhibit a better performance than those having adsorption
columns packed with a single adsorbent. This is because it is
unlikely to find a versatile adsorbent that has better working
capacities than others for all impurities being contained in a
raw H2 feed. Therefore, a layered bed is usually configured
such that an activated carbon layer near the feed end plays a
role in adsorbing mainly CO2 and CH4 while a zeolite layer
on top of the activated carbon layer removes CO and N2. The
length ratio of the carbon to zeolite layers is regarded as one
of the key parameters that need to be optimised (Ahn et al.
2001, 2012; Ribeiro et al. 2008; Yang and Lee 1998; Park
et al. 1998). Given the composition of the new raw H2 feed
that has relatively small CO2 and no CH4, however, it is
plausible that an adsorption column packed with zeolite 5A
performs better than those with a layered bed of activated
carbon and zeolite 5A.
The production of the H2 PSA tail gas should be mini-
mised in order to reduce the power consumption relating to
its compression before feeding it to the gas turbine. In this
study the aim is to maximise H2 recovery by adding more
columns to the H2 PSA process to enable more complicated
step configurations for minimising the H2 loss and con-
sumption. To know the maximum hydrogen recovery that a
H2 PSA could achieve is essential in determining the mass
balance around the H2 PSA, i.e. the flowrate and the
composition of both ultrapure hydrogen product and PSA
tail gas. Once the mass balance is constructed at the con-
dition of achieving the maximum H2 recovery, it is possible
to estimate the auxiliary power consumption in compress-
ing the H2 PSA tail gas and the power generation in the gas
and steam turbines accurately.
3 H2 PSA simulation
The dynamic behaviour of a H2 PSA is described by a
mathematical model which couples mass, momentum and
energy balances over a packed bed with the appropriate
boundary conditions for each step of the cycle (Friedrich
et al. 2013).
Since the flow is assumed to be a dispersed plug flow the
component and overall material balances along the column
are given by:
oci
otþ 1� eð Þ
e� o
�Qi
otþ o ci � vð Þ
ozþ oJi
oz¼ 0 ð1Þ
�Qi ¼ epcmi þ qp �qi ð2Þ
Ji ¼ �DLcT
oxi
ozð3Þ
ocT
otþ 1� eð Þ
e�X
i
o �Qi
otþ o cT � vð Þ
oz¼ 0 ð4Þ
Since the column undergoes significant temperature excursions
over a cycle caused by the heat of adsorption, constitutive
energy balances are coupled with the mass balance:
eoUf
otþ 1� eð Þ oUP
otþ e
o Hf � v� �
ozþ oJT
ozþX
Nc
i¼1
o Ji~Hi
� �
oz
þ hw
Ac
Vc
Tf � Tw
� �
¼ 0 ð5Þ
dUP
dt¼ eP
dUP;f
dtþ 1� ePð Þ dUP;s
dtð6Þ
JT ¼ �kLeoTf
ozð7Þ
In Eq. (5), Tw is assumed to be equal to ambient
temperature since a heat balance around the wall is not
taken into account.
In this work the adsorption rate is represented by Linear
Driving Force (LDF) model for both macropores and
micropores.
ep
dcmi
dtþ qp
d�qi
dt¼ k
pi
Ap
Vp
ci � cmi
� �
ð8Þ
kpi
Ap
Vp
¼ 15 � ep � Dp;i
r2P
ð9Þ
d�qi
dt¼ kcr
i
3
rc
q�i � �qi
� �
ð10Þ
The axial mass dispersion coefficient DL and the axial
thermal dispersion coefficient kL are estimated using the
correlations by Wakao and Funazkri (1978):
e � DL
Dm
¼ 20þ 0:5 � Sc � Re ð11Þ
kL
kg
¼ 7þ 0:5 � Pr � Re ð12Þ
The pressure drop along the column is evaluated using the
Ergun equation (Ergun 1952):
� oP
oz¼ 150l 1� eð Þ2
d2pe
2vþ
1:75qf 1� eð Þdpe
v vj j ð13Þ
The boundary conditions for the gas phase
concentrations and the enthalpies are given by the
Danckwerts boundary conditions. With the conventions
that the positive flow direction is from 0 (feed end) to L
(product end) these can be written in a general form as:
514 Adsorption (2014) 20:511–524
123

JT jz¼0¼vþ vj j
2Hf ;0� � Hf ;0
� �
ð14Þ
JT jz¼Lc¼ v� vj j
2Hf ;Lcþ � Hf ;Lc
� �
ð15Þ
Jijz¼0¼vþ vj j
2ci;0� � ci;0
� �
ð16Þ
Jijz¼Lc¼ v� vj j
2ci;Lcþ � ci;Lc
� �
ð17Þ
Adsorption equilibrium of pure hydrogen, carbon
dioxide, carbon monoxide, nitrogen and argon on zeolite
5A are reported in the literature in the range of the pressure
up to 7.5 bar (Lopes et al. 2009). The adsorption equilibria
are predicted by the following extended dual-site Langmuir
model:
q�i ¼q1
i;sb1i Pxi
1þPNc
j¼1 b1j Pxj
þq2
i;sb2i Pxi
1þPNc
j¼1 b2j Pxj
ð18Þ
with bli ¼ bl
i;0 exp�D ~Hl
i
RT
� �
:Experimental data (Lopes et al. 2009) are fitted using
Origin 8.5 (OriginLab 2010). The isotherm parameters of
dual-site Langmuir model are given in Table 1.
Cycle performances are evaluated according to the
common parameters of H2 purity, H2 recovery and H2
productivity defined as follows:
H2 Purity ¼R tAD
0CH2
ujz¼Ldt
P
Nc
i
R tAD
0Ciujz¼Ldt
ð19Þ
H2 Recovery ¼R tAD
0CH2
ujz¼Ldt �R tPR
0CH2
ujz¼LdtR tAD
0CH2
ujz¼0dtð20Þ
H2 Productivity ¼R tAD
0CH2
ujz¼Ldt �R tPR
0CH2
ujz¼Ldt� �
Ac
tcycleMads
ð21Þ
The aim is to design a H2 PSA process having a capacity
of 110 H2 MMSCFD that is approximately equivalent to
1,609 H2 mol/s. Given the H2 mol fraction in the raw H2
feed, the required flowrate of a raw H2 feed flowing to the
H2 PSA would be around 2,015 mol/s assuming 90 % H2
recovery. According to the design of the IGCC power plant
with carbon capture using a Shell dry coal-fed gasifier
(DOE Case 6, 2007), the advanced IGCC plant for
cogeneration of power and ultrapure hydrogen would be
configured such that around 40 % of the raw H2 gas is
directed to the H2 PSA while the remaining 60 % flows to a
syngas humidifier and subsequently a combustion chamber
in the gas turbine just as in the conventional IGCC power
plant.
Planning as a future work an experimental campaign to
validate the simulation results subsequent to this study, the
dimension of adsorption columns in this study was deter-
mined to be the same as those of a lab-scale six-column
PSA rig as shown in Table 2. Given the column size and
dimension, the feed flowrate is set at 0.002 mol/s with a
scaling factor of 10-6. The figures of other parameters used
in the simulation are also presented in Table 2. In all the
simulations, the set of the partial and ordinary differential
equations and the algebraic equations were solved using
the in-house CySim simulator. The discretization method
for the spatial domain in the column was central finite
difference method (CFDM) with 20 grid points along the
column. The system of differential algebraic equations was
solved with the DAE solver SUNDIALS (Friedrich et al.
2013).
4 Simulation results
Five different H2 PSA systems have been investigated to
see the change of H2 recovery and productivity with dif-
ferent levels of complexity of the step configuration that is
subject to the number of columns. The H2 recovery and
productivity obtained at different configurations are com-
pared under the operating condition to meet the specifica-
tion of the H2 purity (99.99 mol%) at each configuration.
First of all, a four-column H2 PSA system was simulated
and the targeted H2 purity was obtained at a cycle time of
800 s. Since all the simulations were carried out at constant
feed flowrate of 0.002 mol/s, the total cycle time became
longer as more columns that are identical in size and
dimension were added to configure six-, nine- and twelve-
column H2 PSA systems. This is because either more than
one column can share the total feed gas for adsorption at
Table 1 Isotherm parameters of dual-site Langmuir model for zeolite 5A
Gas qi,s1 (mol/kg) qi,s
2 (mol/kg) bi,01 (bar-1) bi,0
2 (bar-1) (-DHi1) (J/mol) (-DHi
2) (J/mol)
CO2 0.7077 3.711 1.077 9 10-7 1.233 9 10-4 38,312 29,808
H2 0.7077 3.711 4.227 9 10-7 1.333 9 10-4 19,674 9,282
CO 0.7077 3.711 2.431 9 10-8 2.321 9 10-5 47,736 20,994
N2 0.7077 3.711 2.141 9 10-6 8.987 9 10-5 31,338 14,956
Ar 0.7077 3.711 1.399 9 10-9 4.901 9 10-4 50,239 11,171
Adsorption (2014) 20:511–524 515
123

the same time or more steps need to be included in one
cycle. To evaluate whether or not a simulation reaches its
cyclic steady state (CSS), the H2 purity and recovery at a
cycle were compared with those at the previous cycle. It
was assumed that a cyclic steady state would be reached if
the differences of the H2 purity and recovery between the
new and previous cycles were both less than 10-6.
4.1 Four-column H2 PSA
A four-column H2 PSA unit is designed such that a pro-
viding purge step is located between the two depressuring
pressure equalisation (DPE) steps while the two pressu-
rising pressure equalisation (PPE) steps take place in a row
after the purge step as shown in Fig. 3. The step configu-
ration was reconstructed referring to those in the literature
(Cassidy 1980).
In the four-column H2 PSA simulation, the total cycle
time was fixed at 800 s with the adsorption step time
equivalent to 1/4th of the cycle time as shown in Fig. 3.
The purge flow is generated by reducing the column
pressure starting from a pressure at the end of the first DPE
step to a pressure that can be chosen at an operator’s dis-
posal. The equilibrated pressure at the start (or end) of the
second DPE step (or its associated PPE step) is subject to
how much purge flow is generated during the providing
purge step. Accordingly, the equilibrated pressure at the
end (or start) of the first DPE step (or its associated PPE
step) is also affected by the amount of purge flow. The step
configuration where the providing purge step is located
between the two DPE steps has a clear advantage over a
cycle where the providing purge step follows the two DPE
steps in that it can increase the purge flowrate to a greater
extent since the providing purge step can start at a higher
pressure. Therefore, this configuration is capable of con-
trolling the product purity in a wider range without having
to change the cycle time. It should be noted that the
pressure recovery during the pressure equalisation in this
four-column H2 PSA would decrease with an increasing
purge flowrate since the equilibrated pressure at the end of
each pressure equalisation stage is affected by the amount
of purge flow as shown in Fig. 4. By contrast the pressure
recovery can be maintained at a constant level regardless of
the change of purge flowrate in the configuration where the
providing purge step is located after finishing all the DPE
steps.
As shown in Fig. 4, the pressure profile of a column
over a cycle is varied in response to the use of the different
amounts of the purge flow investigated in this study. The
actual flowrate of the purge gas flowing between two col-
umns under the providing purge and purge steps respec-
tively must decrease with the step time since the driving
Table 2 List of column parameters, particle parameters, and operating conditions of H2 PSA simulations
Column parameters
Column length, Lc [m] 0.5
Column internal diameter, Dc [m] 0.025
External bed void fraction, e [-] 0.391
Axial mass dispersion coefficient, DL [m2/s] 1.165 9 10-4
Axial thermal dispersion coefficient, kL [W/m K] 1.279
Wall heat transfer coefficient, hw [W/m2 K] 95
Adsorbent parameters
Pellet density, qp [kg/m3] 1,126
Pellet void fraction, ep [-] 0.503
Adsorbent specific heat capacity, cP,s [J/kg K] 920
Pellet averaged diameter, dp [mm] 1.70
Macropore LDF coefficient, kip 9 Ap/Vp H2/CO2/CO/N2/Ar [s-1] 9.222/6.073/7.518/7.897/7.284
Micropore LDF coefficient, kicr 9 3/rc H2/CO2/CO/N2/Ar [s-1] 0.7467/0.0017/0.0332/0.1697/0.1800 (Lopes et al. 2009)
Operating conditions
Pads [bar] 34
Pdes [bar] 1
Tfeed [K] 303
Qfeed [mol/s] 0.002
Feed composition, yH2/yCO2/yCO/yN2/yAr [molar] 0.8875/0.0212/0.0266/0.0544/0.0103
516 Adsorption (2014) 20:511–524
123

force diminishes with decreasing pressure difference
between the columns. Therefore, an index of PP/F to
quantify the varying purge flow as an average purge flow is
introduced in this study. The PP/F denotes the ratio of an
average purge flowrate being generated from one column
during the providing purge step to a feed flowrate to one
column for adsorption during one cycle. Note that the
amount of the feed flowing to one column is not the same
as the total amount of the feed flowing to a PSA system in
case that more than one column share total feed flow. The
different numbers of PP/F chosen at the three runs are
shown in Fig. 4 and Table 3. As expected, the start and end
pressures during the providing purge step becomes lower
with an increase of the PP/F.
The targeted H2 purity of 99.99? mol% is achieved in
Run 2 where during the providing purge step the column
pressure changes from 21.5 to 17 bar that is equivalent to a
PP/F of 0.2. At this operating condition, the H2 recovery
and productivity are 72.68 % and 162.67 molH2/kg/day,
respectively.
Fig. 3 Step configuration of a
four-column PSA cycle (AD
adsorption, DPE depressurising
pressure equalisation, PP
providing purge, BD blowdown,
PU purge, PPE pressurising
pressure equalisation, PR
product pressurisation,
tAD = tcycle/4; tPR = 3tcycle/16;
tPP = tPU = tcycle/8;
tBD = tDPE = tPPE = tcycle/16)
0 100 200 300 400 500 600 700 8000
5
10
15
20
25
30
35
Pre
ssur
e [b
ar]
Time [s]
PP/F=0.1PP/F=0.2PP/F=0.3
DPE1 PP BD PU PPE2 PPE1 PRAD
DPE2
Fig. 4 Pressure profiles at the
product end of a column over a
cycle at the cyclic steady state
of the four-column H2 PSA unit:
effect of the different amounts
of purge flow
Table 3 Performances of the four-column PSA system at different
purge flow rates
Run Adsorption
time (s)
H2
purity
(%)
H2
recovery
(%)
H2 productivity
(molH2/kgads/day)
Run 1
(PP/F = 0.1)
200 99.976 75.09 168.06
Run 2
(PP/F = 0.2)
200 99.995 72.68 162.67
Run 3
(PP/F = 0.3)
200 99.999 70.56 157.93
Adsorption (2014) 20:511–524 517
123

4.2 Six-column H2 PSA
In the case of six-column H2 PSA systems, two different step
configurations were investigated. The first configuration
(Fig. 5) features feeding the raw H2 to two columns at the
same time, that is to say, each of two columns receiving half
the raw H2 feed (Malek and Farooq 1997). Due to two columns
being used for adsorption in a cycle, the first configuration
cannot accommodate an additional pressure equalisation step
but has the two-stage pressure equalisation that is the same as
the above-mentioned four-column PSA system. Contrary to
the four-column PSA system, a providing purge step is placed
after the two pressure equalisation steps as shown in Fig. 5. It
is anticipated that the alteration to the step configuration
would be capable of improving the H2 recovery since more
pressure can be recovered during the pressure equalisation
steps, that is to say, less consumption of pure hydrogen for
product pressurisation and the reduced feed flowrate to one
column for adsorption enables more efficient use of column
due to less ingress of impurities into the product end.
In the second configuration (Fig. 6), however, only one
column is taken up for high pressure adsorption in a cycle
Fig. 5 Step configurations of a
six-column PSA cycle with two-
stage pressure equalisation (AD
adsorption, DPE depressurising
pressure equalisation, ID idle, PP
providing purge, BD blowdown,
PU purge, PPE pressurising
pressure equalisation, PR
pressurisation, tAD = tcycle/3;
tPP = tPU = tPR = tcycle/9;
tBD = tDPE = tPPE = tID =
tcycle/18)
Fig. 6 Step configurations of a
six-column PSA cycle with
three-stage pressure
equalisations (AD adsorption,
DPE depressurising pressure
equalisation, PP providing
purge, BD blowdown, PU
purge, ID: idle, PPE
pressurising pressure
equalisation, PR pressurisation,
tAD = tcycle/6; tPP =
tPU = tPR = tcycle/9;
tBD = tDPE =
tPPE = tID = tcycle/18)
518 Adsorption (2014) 20:511–524
123

just as in the four-column H2 PSA. Therefore, it is possible
to configure a PSA cycle with three-stage pressure equal-
isation (Xu 2002). It is generally expected that the more
pressure equalisation stages a PSA cycle contains the
higher hydrogen recovery can be obtained. This is because
less hydrogen product is required during the product
pressurisation step since the column can be pressurised to a
higher pressure in advance during the PPE steps.
Figure 7 clearly exhibits the change of the pressure
profile caused by adding one more pressure equalisation
step to a PSA cycle. The first configuration having only two
pressure equalisation steps (Fig. 7a) recovers less pressure
during the pressure equalisation steps and consumes more
hydrogen product during the product pressurisation step
than the second configuration with three-stage pressure
equalisation (Fig. 7b) does.
As observed in Table 4, the first and second configura-
tions can achieve the targeted H2 purity (99.99? mol%) at
the cycle times of 2,400 and 1,500 s, respectively (Run 6
and 10). The adsorption time in Run 6 (800 s) is more than
three times longer than that in Run 10 (250 s) even though
the feed gas entering one column for adsorption is just
halved in flowrate. This can be explained by two reasons.
Firstly, the reduced feed flow to one adsorption column for
adsorption prevents the ingress of impurities into the
product end so it can allow a cycle to have a longer
adsorption time. Secondly, the first configuration with only
two-stage pressure equalisation has a better working
capacity than the second configuration. This is because the
column can be more thoroughly regenerated by a stream
having more hydrogen and pressurised by more ultrapure
hydrogen during the product pressurisation step, in other
0 400 800 1200 1600 2000 24000
5
10
15
20
25
30
35
Pre
ssur
e [b
ar]
Time [s]
(a)
ADID PDE2 PP BD PU PPE2PPE1 PR
DPE1
0 250 500 750 1000 1250 15000
5
10
15
20
25
30
35
Pre
ssur
e [b
ar]
Time [s]
(b)
AD
DPE1
PP BD PUPDE2 PPE3 ID1 PPE2 ID2 PPE1 PRPDE3
Fig. 7 Pressure profiles at the
product end of a column over a
cycle at the cyclic steady state
of six-column H2 PSA
simulations at PP/F = 0.3 with
a two-stage pressure
equalisation (Run 6) and
b three-stage pressure
equalisation (Run 10)
Adsorption (2014) 20:511–524 519
123

words, the column is pressurised by gas streams coming
from other columns during the pressure equalisation steps
to a lesser extent. Therefore, it implies that the H2 recovery
would increase with more stages of pressure equalisation in
a cycle but the working capacity of columns would dete-
riorate due to purging and pressurising the column with
more impure gases.
It is noteworthy that the hydrogen recovery is enhanced
around 12 % with the addition of two columns from four
columns (Run 2) to six columns (Runs 6) only by changing the
step configuration in spite of both having the same number of
pressure equalisation steps. This change is not caused only by
less hydrogen consumption during the product pressurisation
step but also by the longer adsorption time.
At the operating condition of Run 10, the H2 recovery
increases further up to 86.26 % mainly due to enhanced
pressure recovery taking place over the three-stage pres-
sure equalisation. The stream leaving the column in the
course of reducing the column pressure from 34 to 9 bar
can be reused for pressurising other columns and signifi-
cantly lower amount of hydrogen product is required for
product pressurisation.
The H2 productivities of both six-column H2 PSA con-
figurations are similar but lowered in comparison to that of
the four-column H2 PSA performance at the targeted H2
purity. The change of the H2 productivity can be explained
with respect to the increasing number of columns (or
increasing total amount of adsorbents being utilised) and
the increasing H2 recovery. The reduction of the H2 pro-
ductivity from four-column to six-column H2 PSA is due to
the increase of the H2 recovery being less than the corre-
sponding increase of the amount of adsorbent utilised.
4.3 Polybed H2 PSA (nine and twelve columns)
As mentioned above, as more columns are deployed a
higher hydrogen recovery would be anticipated in a H2
PSA system. In this respect Polybed H2 PSA processes
containing seven to sixteen beds with at least three pressure
equalisation steps and at least two columns receiving the
feed gas for adsorption have been commercially operating
for the purpose of H2 purification (Yang 1987). In this
study a nine-column eleven-step system is investigated
following the step configuration found in the literature
(Fuderer and Rudelstorfer 1976) as shown in Fig. 8. Fig-
ure 9 shows the pressure profile of the nine-column PSA
system over a cycle at its cyclic steady state.
The nine-column eleven-step H2 PSA system benefits
from both reduced feed flowrate to one column and
intensified pressure equalisation that each of the two six-
column H2 PSA systems has. The feed flowrate fed to one
column for adsorption is reduced to one-third of the total
feed flowrate since three out of nine columns always work
for adsorption at the same time. The product pressurisation
step starts at 26 bar and the providing purge step com-
mences at 9 bar both of which are similar to those at the
second configuration of six-column H2 PSA system as
shown in Figs. 7b and 9. This is because both PSA systems
contain the same number of stages of pressure equalisation
in their cycle.
Finally, a twelve-column thirteen-step H2 PSA system
was investigated in order to increase the H2 recovery close
to its maximum. The step configuration is presented in
Fig. 10 that was originally shown in a patent (Xu et al.
2003). The step configuration features simultaneous
adsorption at three columns, simultaneous providing purge
and purge at two columns, and four-stage pressure equal-
isation. Thanks to one additional pressure equalisation step,
the product pressurisation step starts at 27 bar and the
providing purge step commences at 7.5 bar as shown in
Fig. 11.
Table 5 lists the performance of the nine- and twelve-
column H2 PSA systems at their cyclic steady state. The
nine-column H2 PSA system can achieve the targeted H2
purity at the adsorption step time of 1,200 s (Run 14). It
should be noted that the adsorption step time of the twelve-
column H2 PSA to achieve the targeted H2 purity (1,050 s
at Run 18) is shorter than that of the nine-column H2 PSA
in spite of the same feed flowrate fed to one column, i.e.
one-third of the total feed flowrate. This indicates that the
column working capacity starts to deteriorate due to more
incomplete regeneration by a purge flow having less
hydrogen and by pressurising the column with more impure
streams coming from other columns during the PPE steps
instead of ultrapure hydrogen during the product pressuri-
sation step. Nevertheless, the H2 recovery still increases
from 91.85 % at the nine-column H2 PSA to 92.74 % at the
twelve-column H2 PSA. Since the improvement of the H2
recovery is minimal, the H2 productivity decreases signif-
icantly from 91.41 molH2/kgads/day at the nine-column H2
Table 4 Performance of six-column H2 PSA simulations
Run Adsorption
time (s)
H2 purity
(%)
H2 recovery
(%)
H2 productivity
(molH2/kgads/day)
First configuration (two-stage pressure equalisation)
Run 4 600 99.999 78.75 117.51
Run 5 700 99.996 81.98 122.33
Run 6 800 99.994 84.41 125.95
Run 7 900 99.975 86.29 128.75
Second configuration (three-stage pressure equalisation)
Run 8 150 99.999 76.11 113.57
Run 9 200 99.997 82.47 123.05
Run 10 250 99.994 86.26 128.71
Run 11 300 99.969 88.79 132.48
520 Adsorption (2014) 20:511–524
123

PSA to 69.15 molH2/kgads/day at the twelve-column H2
PSA.
4.4 Comparison among various PSA cycles
Up to now the H2 recovery and productivity are compared
at the targeted H2 purity of around 99.99? mol% among
various H2 PSA cycles having different number of columns
and different step configurations. Again the H2 productivity
is reduced with the increasing number of columns while the
H2 recovery improves. All the simulation results are plotted
on Fig. 12 indicating a clear trade-off between hydrogen
purity and recovery.
It is expected that more-than-twelve-column H2 PSA
configuration may improve the H2 recovery further to more
than 93 % but given the trend of improving H2 recovery
with the number of columns a further improvement of H2
recovery would be very limited. In particular, more than
Fig. 8 Step configurations of a nine-column PSA cycle (AD adsorp-
tion, DPE depressurising pressure equalisation, PP providing purge,
BD blowdown, PU purge, PPE pressurising pressure equalisation, PR
pressurisation, tAD = tcycle/3; tPP = tPU = tcycle/9; tBD = tDPE =
tPPE = tPR = tcycle/18)
0 600 1200 1800 2400 3000 36000
5
10
15
20
25
30
35
Pre
ssur
e [b
ar]
Time [s]
AD
DPE1
PP BD PPE2 PPE1
PR
PUDPE2 DPE3 PPE3
Fig. 9 Pressure profiles at the
product end of a column over a
cycle at the cyclic steady state
of a nine-column H2 PSA at
PP/F = 0.3
Adsorption (2014) 20:511–524 521
123

five stage pressure equalisation steps may not be necessary
since the column pressure at the end of the fourth DPE (or
PPE) step in the twelve-column H2 PSA is very close to
that at the end of the third DPE (or PPE) step in the nine-
column H2 PSA systems. Therefore, altering a PSA cycle
to have more than five pressure equalisation steps cannot
Fig. 10 Step configurations of a twelve-column PSA cycle (AD
adsorption, DPE depressurising pressure equalisation, PP providing
purge, BD blowdown, PU purge, PPE pressurising pressure
equalisation, PR pressurisation, tAD = tcycle/4; tPP = tPU = tcycle/6;
tBD = tDPE = tPPE = tPR = tcycle/24)
0 525 1050 1575 2100 2625 3150 3675 42000
5
10
15
20
25
30
35
Pre
ssur
e [b
ar]
Time [s]
AD PP PU PPE3 PPE2PPE1
PR
DPE3DPE4 BDDPE2
DPE1
PPE4
Fig. 11 Pressure profiles at the
product end of a column over a
cycle at the cyclic steady state
of a twelve-column H2 PSA at
PP/F = 0.3
522 Adsorption (2014) 20:511–524
123

recover a notable pressure nor save the amount of ultrapure
hydrogen consumed during the product pressurisation step
significantly. In addition, it is likely that the working
capacity of the column would be badly affected by
incomplete regeneration with purge flow having less
hydrogen and pressurisation of the column by more impure
gas streams than the pure product streams.
Figure 13 shows the hydrogen mole fraction profile along
the column at the end of the adsorption step at the cyclic steady
state of all the PSA simulation investigated in this study. It
clearly shows that with the reduction of the feed flow to one-
column for adsorption from four-column to nine-column
through six-column with two-stage pressure equalisation the
PSA system allows a cycle to have longer adsorption step time
so the H2 mass transfer zone (MTZ) can progress more to the
product end at the end of adsorption step. This results in less
H2 remaining at the end of the adsorption step leading to a
higher H2 recovery. The figure also shows that the twelve-
column PSA has a broader H2 MTZ than the nine-column
PSA does due to worse regeneration of the column during the
purge step and pressurisation with more impure stream while
the column is pressurised.
Table 5 Performance of nine-column and twelve-column PSA
simulations
Run Adsorption
time (s)
H2 purity
(%)
H2 recovery
(%)
H2 productivity
(molH2/kgads/day)
Nine-column H2 PSA
Run 12 800 99.998 87.05 86.64
Run 13 1,000 99.996 89.94 89.51
Run 14 1,200 99.993 91.85 91.41
Run 15 1,300 99.974 92.58 92.14
Twelve-column H2 PSA
Run 16 750 99.999 89.11 66.52
Run 17 900 99.996 91.17 68.06
Run 18 1,050 99.993 92.74 69.15
Run 19 1,200 99.978 93.83 70.04
99.965
99.97
99.975
99.98
99.985
99.99
99.995
100
65 70 75 80 85 90 95
H2
Pur
ity [m
ol%
]
H2 Recovery [%]
4-column PSA6-column PSA, two-stage PE6-column PSA, three-stage PE9-column PSA12-column PSA
Fig. 12 Comparison of
hydrogen purity and recovery at
various H2 PSA systems with
the different number of columns
and different step configurations
0.89
0.9
0.91
0.92
0.93
0.94
0.95
0.96
0.97
0.98
0.99
1
0 0.05 0.1 0.15 0.2 0.25 0.3 0.35 0.4 0.45 0.5
H2
mol
ar fr
actio
n [-]
Column length [m]
4-column PSA
6-column PSA, two-stage PE
6-column PSA, three-stage PE
9-column PSA
12-column PSA
Fig. 13 Hydrogen molar
fraction profiles along the
column at the end of the
adsorption step in various PSA
cycles at around 99.99 % H2
purity
Adsorption (2014) 20:511–524 523
123

5 Conclusions
A novel H2 PSA system to produce ultrapure hydrogen
from a raw H2 gas generated in an advanced IGCC process
has been proposed in this study. The advanced IGCC plant
where CO2 is intrinsically captured by a pre-combustion
capture unit is capable of cogenerating both power and
ultrapure hydrogen more economically. The advanced
IGCC plant can be used in oil refineries having difficulty in
sourcing ultrapure hydrogen that is required to operate
hydrotreaters and hydrocrackers and intending to reduce
carbon emission from their hydrogen and power plants.
To know the maximum H2 recovery that a H2 PSA can
produce from the raw H2 gas is very important in evalu-
ating the performance of the advanced IGCC plant for
cogenerating power and ultrapure hydrogen. This is
because the flowrate of PSA tail gas, to be determined by
the H2 recovery, should be compressed up to 34 bar from
the purge pressure to get the PSA tail gas fed to the gas
turbine along with the fuel gas. Therefore, it is essential to
design a H2 PSA such that its H2 recovery can be maxi-
mised in order to minimise the power consumption relating
to tail gas compression.
H2 PSA in commercial SMR hydrogen plants is capable
of achieving around 89 % H2 recovery at the 99.99? % H2
purity. Compared to the raw H2 gas in the SMR hydrogen
plant, the raw H2 gas fed to the H2 PSA in the advanced
IGCC plant has a gas composition of higher hydrogen and
lower impurities and the higher total pressure at which
conditions the H2 PSA is expected to perform better than
the H2 PSA in a SMR H2 plant. As expected, the Polybed
H2 PSA having twelve columns achieves 93 % H2 recovery
at 99.99? mol% H2 purity.
Acknowledgments We would like to express our gratitude for the
financial support from KETEP (Grant No.: 2011-8510020030) and EP-
SRC (Grant Nos.: EP/F034520/1, EP/G062129/1, and EP/J018198/1).
References
Ahn, H., Yang, J., Lee, C.-H.: Effects of feed composition of coke
oven gas on a layered bed H2 PSA process. Adsorption 7,
339–356 (2001)
Ahn, S., You, Y.-W., Lee, D.-G., Kim, K.-H., Oh, M., Lee, C.-H.:
Layered two- and four-bed PSA processes for H2 recovery from
coal gas. Chem. Eng. Sci. 68, 413–423 (2012)
Cassidy, R.T.: Polybed pressure-swing adsorption hydrogen process-
ing. ACS Symposium Series, vol. 135, Chapter 13, pp. 247–259
(1980)
Committee on climate change, reducing emissions from buildings and
industry through the 2020s, Chapter 5 (2011)
DECC, Final emissions estimates by fuel type and end-user sector
(2009)
DOE NETL, Cost and performance baseline for fossil energy plants
(2007)
Ergun, S.: Fluid flow through packed columns. Chem. Eng. Prog. 48,
89–94 (1952)
Friedrich, D., Ferrari, M.-C., Brandani, S.: Efficient simulation and
acceleration of convergence for a dual piston pressure swing
adsorption system. Ind. Eng. Chem. Res. 52, 8897–8905 (2013)
Fuderer, A., Rudelstorfer, E.: US Patent 3986849 to Union Carbide
Corporation (1976)
Kapetaki, Z., Ahn, H., Brandani, S.: Detailed process simulation of
pre-combustion IGCC plants using coal-slurry and dry coal
gasifiers. Energy Procedia 37, 2196–2203 (2013)
Lopes, F.V.S., Grande, C.A., Ribeiro, A.M., Loureiro, J.M., Evagge-
los, O., Nikolakis, V., Rodrigues, A.E.: Adsorption of H2, CO2,
CH4, CO, N2 and H2O in activated carbon and zeolite for
hydrogen production. Sep. Sci. Technol. 44, 1045–1073 (2009)
Lopes, F.V.S., Grande, C.A., Rodrigues, A.E.: Activated carbon for
hydrogen purification by pressure swing adsorption: multicom-
ponent breackthrough curves and PSA performance. Chem. Eng.
Sci. 66, 303–317 (2011)
Malek, A., Farooq, S.: Study of a six-bed pressure swing adsorption
process. AIChE J. 43, 2509–2523 (1997)
OriginLab: Data analysis and graphing software. Origin 8, 5 (2010)
Park, J.-H., Kim, J.-D., Yang, R.T.: Adsorber dynamics and optimal
design of layered beds for multicomponent gas adsorption.
Chem. Eng. Sci. 53, 3951–3963 (1998)
Ribeiro, A.M., Grande, C.A., Lopes, F.V.S., Loureiro, J.M., Rodri-
gues, A.E.: A parametric study of layered bed PSA for hydrogen
purification. Chem. Eng. Sci. 63, 5258–5273 (2008)
Ribeiro, A.M., Grande, C.A., Lopes, F.V.S., Loureiro, J.M., Rodri-
gues, A.E.: Four beds pressure swing adsorption for hydrogen
purification: case of humid feed and activated carbon beds.
AIChE J. 55, 2292–2302 (2009)
SEPA’s National Air Quality Report (2008)
Wakao, N., Funazkri, T.: Effect of fluid dispersion coefficients on
particle-to-fluid mass transfer coefficients in packed beds. Chem.
Eng. Sci. 33, 1375–1384 (1978)
Xu, J., Weist, E.L.: US Patent 6454838 B1 to Air Products and
Chemicals Inc (2002)
Xu, J., Rarig, D.L., Cook, T.A., Hsu, K.K., Schoonover, M., Agrawal,
R.: US Patent 6565628 B2 to Air Products and Chemicals Inc
(2003)
Yang, R.T.: Gas separation by adsorption processes. Butterworth
Publishers (1987)
Yang, J., Lee, C.-H.: Adsorption dynamics of a layered bed PSA for
H2 recovery from coke oven gas. AIChE J. 44, 1325–1334
(1998)
524 Adsorption (2014) 20:511–524
123

247
Appendix 3: A novel strategy to produce ultrapure
hydrogen from coal with pre-combustion carbon
capture by Luberti et al., 2014

Energy Procedia 63 ( 2014 ) 2023 – 2030
Available online at www.sciencedirect.com
ScienceDirect
1876-6102 © 2014 The Authors. Published by Elsevier Ltd. This is an open access article under the CC BY-NC-ND license (http://creativecommons.org/licenses/by-nc-nd/3.0/).Peer-review under responsibility of the Organizing Committee of GHGT-12doi: 10.1016/j.egypro.2014.11.217
© 2014 The Authors. Published by Elsevier Ltd. This is an open access article under the CC BY-NC-ND license (http://creativecommons.org/licenses/by-nc-nd/3.0/).Peer-review under responsibility of the Organizing Committee of GHGT-12

2024 Mauro Luberti et al. / Energy Procedia 63 ( 2014 ) 2023 – 2030

Mauro Luberti et al. / Energy Procedia 63 ( 2014 ) 2023 – 2030 2025

2026 Mauro Luberti et al. / Energy Procedia 63 ( 2014 ) 2023 – 2030

Mauro Luberti et al. / Energy Procedia 63 ( 2014 ) 2023 – 2030 2027

2028 Mauro Luberti et al. / Energy Procedia 63 ( 2014 ) 2023 – 2030

Mauro Luberti et al. / Energy Procedia 63 ( 2014 ) 2023 – 2030 2029

2030 Mauro Luberti et al. / Energy Procedia 63 ( 2014 ) 2023 – 2030

256
Appendix 4: Hydrogen production processing by Ahn
et al., 2015