design of a real-time inspection system for nde of reactor
TRANSCRIPT

Int. J. Pres. Ves. & Piping 20 (1985) 17-41
Design of a Real-Time Inspection System for NDE of Reactor Vessels and Piping Components
S. G a n a p a t h y & B. Schmul t
Ultrasonic Imaging Laboratory, Department of Electrical and Computer Engineering, The University of Michigan, Ann Arbor, MI 48109, USA
(Received: 18 March, 1985)
ABSTRACT
Progress in the development of a special-purpose system for use in a real time in-service inspection system for reactor vessels and piping components is described in this report. An analysis of the synthetic aperture processing algorithm is presented and new methods of speedup are described. A number of special purpose processor architectures are presented and two of the more promising ones are described in detail and are compared and evaluated. Proposed specifications for an initial field inspection system are presented. A brief description of the capabilities of a laboratory prototype processor (to be fabricated) is given.
I N T R O D U C T I O N
It has been apparent for some time that more advanced techniques are required for reliable in-service inspection of nuclear reactor pressure vessels and piping components. Several such advanced systems are under development, including the ALOK system, 1 the Acoustic Holography system 2 and systems based on Synthetic Aperture Focusing Techniques or SAFT. It has been reported previously 3 that a SAFT-based system can give an order of magnitude improvement in resolution over conventional inspection methods.
17

18 S. Ganapathy, B. Schrnult
The Ultrasonic Imaging Laboratory at the University of Michigan has been developing a SAFT-based inspection system with two goals in mind. The first goal is to develop hardware and algorithms that can handle the computational complexities of real-time SAFT, since previous implemen- tations of SAFT were found to be inadequate for reactor inspection. 4 Secondly, we have been developing designs for a complete system capable of real-time in-service inspection in the field. This paper describes results of work in both of these areas.
Any system suitable for use in the field must be able to inspect three major classes of reactor components:
1. Circumferential and longitudinal welds on the pressure vessel walls.
2. All welds on piping coming from the vessel. 3. Nozzles, where pipes join the vessel wall.
It is expected that a SAFT-based system will be able to handle all three of these areas. However, the complexity of these parts varies and nozzles are particularly difficult. The main objective of this research is to create an initial field system that will prove the viability of SAFT inspection techniques. For this reason the system described in this paper has been kept simple and will only inspect the first class of components (vessel welds).
S C A N N I N G l t ! PROCESSING - DISPLAY DECISION M A K I N G j
Fig. 1. Different phases of SAFT-UT.
A SAFT inspection system as envisaged by us consists of four major parts: Scanning, Processing, Display and Automated Decision Making (see Fig. 1). Each of these areas will be described in detail in the next four sections. This paper concludes an initial design of a complete system for field inspection and presents current plans for the fabrication of prototypes.
Documentation on all aspects of research done by this laboratory is available in the form of reports submitted to the United States Nuclear Regulatory Commission (hereinafter the NRC). The interested reader is referred to Refs. 3, 5-10.

Real-time inspection of reactor vessels and piping components 19
SCANNERS FOR SAFT-BASED SYSTEMS
The scanning system deserves attention here because the scanning methods represent a departure from normal practices. Data collection is done on an A-scan basis with each A-scan representing amplitudes going down into the wall thickness. Note that most of the SAFT system is digital. As soon as an A-scan is collected it is digitized and the digital data are passed to the rest of the system.
Our laboratory scanning is currently done with focused transducers moving in a point to point fashion, using a raster scan pattern as shown in Fig. 2. The distance between any two adjacent points will be equal to the wavelength of the current transducer. The sampling rate, which determines how precisely measurements are taken in the depth direction, is expected to correspond to a distance equal to one eighth of the wavelength. At 2.25 MHz Operation the wavelength will be about 0" 1 in.
) ×
Fig. 2. Scanning in a raster pattern.
The field system must use the same type of raster scan pattern as is used in the laboratory. This is necessary for two reasons. First, the collection points must be aligned on a grid for accurate processing. If the scanner is allowed to go around the entire reactor, the points on the second row will not be aligned as well as they would if they had been collected on a raster pattern, since the transducer covers a much smaller total distance to fill an aperture while raster scanning. Secondly, collected data must be stored until a complete two-dimensional aperture is filled. If an entire

20 S. Ganapathy, B. Schmult
circumference were collected at a time, many such datasets would have to be collected in order to get one full aperture. This would require a very large storage area for raw data. Raster scanning requires much less.
The scanning mechanism must also be capable of maintaining a constant angle of incidence with the front surface and capable of maintaining the transducer at a constant distance from the surface. The system will permit both normal and squint mode scanning, with shear waves being included in squint scanning.
Since the definition of real-time operation is to process the data as fast as they become available, the maximum speed of the scanner determines how fast the rest of the system must operate. Currently available mechanisms can operate at about 0.1 in per 0" 1 s in point to point mode, with signal averaging. The maximum size of an A-scan is expected to be about 12 in. Thus on a 0.1 × 0" 1 in grid, this amounts to a collection rate of 1.2 in3/s or 72 in3/min. Since it is possible for speedup to come from mechanical improvements or by use of a linear array of transducers, the processor is being designed to handle collection rates of 250 300 ina/min. Note, however, that some of the collected data are required only to fill out apertures of center A-scans on the boundary of the area being imaged and will not themselves be processed. For typical scanning tasks these could account for around 25 % of the total data, so the data rate in the rest of the system need only be around 200--250 in3/min.
Scanners suitable for field use are currently under development by other NRC contractors.
DIGITAL SYNTHETIC A P E R T U R E PROCESSING
The computer processing time involved in SAFT has long been considered to be too high for use in the field. The development of techniques to do SAFT processing in real time has been one of the major accomplishments of this laboratory. The research to attain this goal has been done in three phases. First, concepts and algorithms were developed to determine exactly what processing had to be done. Secondly, the algorithms were studied and benchmarks and simulations were done to determine how the processing could be speeded up. Finally, based on the results of this analysis, special purpose hardware has been designed that will handle the real-time data rates. The rest of this section describes the results from these three areas.
Real-time inspection of reactor vessels and piping components 21
Concepts of digital SAFF processing
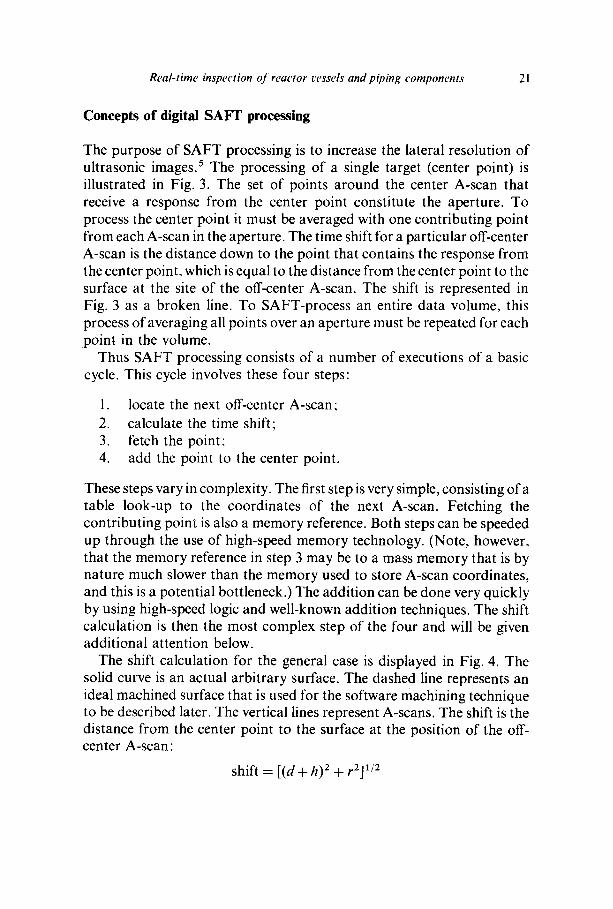
The purpose of SAFT processing is to increase the lateral resolution of ultrasonic images. 5 The processing of a single target (center point) is illustrated in Fig. 3. The set of points around the center A-scan that receive a response from the center point constitute the aperture. To process the center point it must be averaged with one contributing point from each A-scan in the aperture. The time shift for a particular off-center A-scan is the distance down to the point that contains the response from the center point, which is equal to the distance from the center point to the surface at the site of the off-center A-scan. The shift is represented in Fig. 3 as a broken line. To SAFT-process an entire data volume, this process of averaging all points over an aperture must be repeated for each point in the volume.
Thus SAFT processing consists of a number of executions of a basic cycle. This cycle involves these four steps:
1. locate the next off-center A-scan; 2. calculate the time shift; 3. fetch the point; 4. add the point to the center point.
These steps vary in complexity. The first step is very simple, consisting of a table look-up to the coordinates of the next A-scan. Fetching the contributing point is also a memory reference. Both steps can be speeded up through the use of high-speed memory technology. (Note, however, that the memory reference in step 3 may be to a mass memory that is by nature much slower than the memory used to store A-scan coordinates, and this is a potential bottleneck.) The addition can be done very quickly by using high-speed logic and well-known addition techniques. The shift calculation is then the most complex step of the four and will be given additional attention below.
The shift calculation for the general case is displayed in Fig. 4. The solid curve is an actual arbitrary surface. The dashed line represents an ideal machined surface that is used for the software machining technique to be described later. The vertical lines represent A-scans. The shift is the distance from the center point to the surface at the position of the off- center A-scan:
shift = [(d + h) 2 + r2] 1/2

Fig. 3.
Y
Z ' : :
CENTER A-SCAN
OFF-CENTER A-SCAN
Relationship between center point, off-center A-scan, and time shift in SAFI processing.
~/ h
'6
Fig. 4. SAFT time shift calculation for general case.

Real-time inspection of reactor vessels and piping components 23
where d is the depth of the center point from the surface directly over it, h is the difference in surface heights between the center and off-center A- scans, and r is the radial distance from the center A-scan to the off-center A-scan.
Although the equation is mathematically simple, the multiplications and particularly the square root are time-consuming operations. These operations make the shift calculation the most time-consuming step in the basic cycle. The shift calculation can be speeded up substantially just by eliminating the square root operation. This is possible under certain conditions.
If the object being scanned has a surface with the proper symmetry then shift calculations are greatly simplified. This will be illustrated with a fiat sample although the same simplification holds for other types of geometries. For further details on the use of look-up tables for other geometries see Appendix A of Ref. 6. For the case shown in Fig. 5:
shift = (d 2 + r2) 1/2
Although this case looks very similar to the previous general case, there is an important difference. The two shift parameters, d and r, are now independent of the position of the center A-scan. So, if adequate memory is available, the shifts for an A-scan can be computed once, and then used for every A-scan that is to be processed. For this technique, the parameters d and r would be used to index into the table. This table look- up is much faster than the multiplications and square root operations used in the general case.
This look-up table technique can actually be done with a one- dimensional look-up table, instead of the two-dimensional one described
r
d
P
Fig. 5. SAFT time shift calculation for a flat surface.

24 S. Ganapathy, B. Schmult
above. Such a table is much smaller and can be accessed faster. Since many center points can be imaged at a single depth, a look-up table can be calculated for that depth only. When the depth changes a new table is calculated or read in from secondary memory. Note that this read or calculation could go on while the previous depth is being processed.
In summary, a one-dimensional look-up table does not require much memory and will produce time shifts in around 30 ns, which is much faster than calculating them with square roots. The ability to do this results from the invariance of shifts with respect to the (x,y) position of the center A-scan, which is a direct result of the symmetrical surface.
Computational analysis of SAFT
The performance of a SAFT processor will be determined by the time taken to execute the basic cycle or inner loop. Before a processor can be designed the maximum allowable cycle time must be known. This section analyzes the SAFT algorithm and determines the number of basic operations per unit volume that must be performed as a function of processing parameters such as frequency and the included angle of the aperture. When these figures are combined with performance require- ments the maximum basic cycle time can be determined.
The most complex part of the basic operation is the time delay calculation which involves path lengths and sound velocities in both the sample and the coupling medium. The path length calculation requires the coordinates of the transducer at each position and, depending on how the transducer is focused, the calculation could be a simple direct computation or a more complicated iterative process. Algorithms for calculating time delays for flat and cylindrical surfaces for various cases of focusing at the surface and above and below the front surface are derived and can be found in earlier reports. 5
The overall speed of the synthetic aperture processing is also dependent on how much is known about the boundary and the geometry of the synthetic aperture. The speed of the process is bounded by the following two extreme cases:
1. Nothing is known about the sampling boundary except that the transducer has been made to track it and record its coordinates at each scan point. This means that the entire set of time delay calculations must be repeated for every point in every A-scan every time another off-axis A-scan within the aperture is to be used.

Real-time inspection of reactor w'ssels and piping components 25
. The sampling boundary is mathematically describable and the aperture geometry remains constant over the entire boundary. The most common examples are a plane, a cylinder, or a sphere. Since the aperture geometry remains constant, the time delay calculations for the entire aperture need to be done only once. They could then be stored in a look-up table and used to process the entire sample.
Nevertheless, real-time synthetic aperture processing remains a formid- able task even for the second case.
This subsection will analyze the computational complexity of expanding square aperture SAFT. Although real apertures will probably not be square, their size will be close to that of a square aperture and it is the number of points accessed that determines processing time.
Consider a point A in a metal block (Fig. 6) of thickness d and let the included angle of the aperture be 2tp. Then the width of the aperture required at A is 2ztan q~. To achieve good resolution with SAFT, the sampling interval in the X and Y dimensions should be at most one wavelength (one 2). Hence the number of points in the square aperture is
'z tan ~o'~ ~ - - W - ) + l y (1)
which is
4(zt )2 Therefore the number of additions to the point A is
4 ( ~ ) 2 + 4 ( z 2tan q~) (2)
An A-scan of N z points corresponds to a depth of
z = 0 . 5 V 6 N ~
where 6=sampling interval, V=velocity of sound in metal, N z = number of points in A-scan with depth z, and 0-5 = allowance for round trip of sound.
The sampling interval in the Z dimension must be consistent with sampling theory to avoid aliasing. This means that the sampling

26 S. Ganapathy, B. Schmult
z d
~ n s d u c e r
Fig. 6. Metal block of depth d.
frequency must be at least twice the frequency of the transducer and preferably twice the upper frequency in the spectrum of the transducer. Thus
1
rf wherefis the center frequency of the transducer and r is a constant chosen such that usually 2 < r < 8.
Therefore, 2rz
N z - t
or
For z = d:
Nz). 2r
2rd Na- i
Therefore, the total number of computations needed per A-scan for a depth of d is given by substituting eqn (2) into eqn (1) to yield
2rd/2
N~ 4 2 I ( ~ tan q~)2 + (~-r tan q~)l
Nz=l
Real-time inspection of reactor vessels and piping components 27
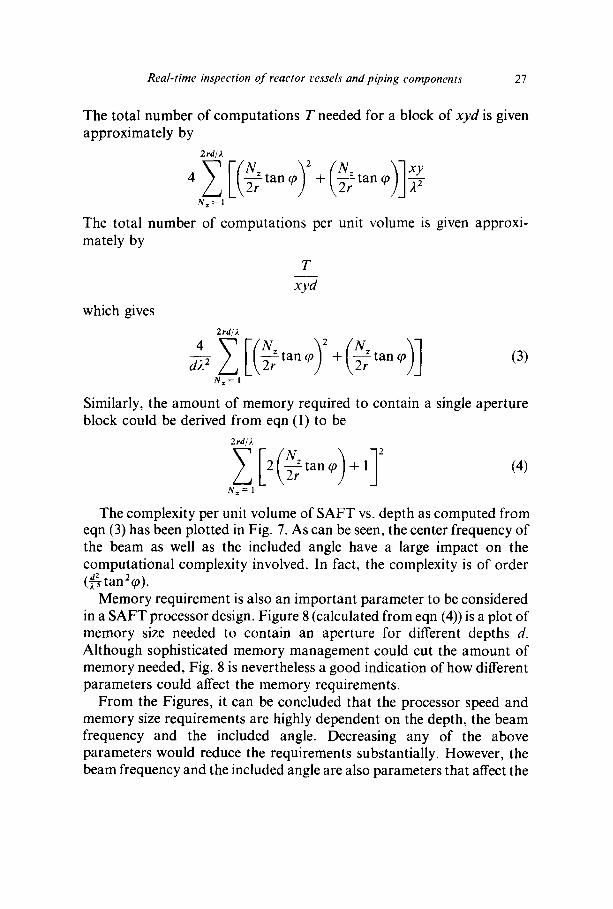
The total number of computations T needed for a block of xyd is given approximately by
2rd/2
N z xy 4 ~-~ I(~-r tan q~)2 + (~-t~ tan ~0)] 22
Nz=l
The total number of computations per unit volume is given approxi- mately by
T xyd
which gives 2rd/2
4 N z N~
Nz= 1
Similarly, the amount of memory required to contain a single aperture block could be derived from eqn (1) to be
2rd/2
~-~ I2 (2~tan q~) + 112 (4)
Nz=l
The complexity per unit volume of SAFT vs. depth as computed from eqn (3) has been plotted in Fig. 7. As can be seen, the center frequency of the beam as well as the included angle have a large impact on the computational complexity involved. In fact, the complexity is of order (a2 tan 2 , ~-~ q~).
Memory requirement is also an important parameter to be considered in a SAFT processor design. Figure 8 (calculated from eqn (4)) is a plot of memory size needed to contain an aperture for different depths d. Although sophisticated memory management could cut the amount of memory needed, Fig. 8 is nevertheless a good indication of how different parameters could affect the memory requirements.
From the Figures, it can be concluded that the processor speed and memory size requirements are highly dependent on the depth, the beam frequency and the included angle. Decreasing any of the above parameters would reduce the requirements substantially. However, the beam frequency and the included angle are also parameters that affect the

28 S. Ganapathy, B. Schmult
109
108
m c
.9 107
0 e~
d Z
106
105
104
Fig . 7 .
- - + 1 M H Z . . . . . & 2 M H z . . . . • 3 M H z . . . . . . . O 4 M H z ............. 0 5 M H z
Degree Resolution ..0 30 ° 0'0Z
.......... rn ..... .,....n 50" 0.03
.D....aa ..~ ........ El"" A 40 ° 0.04 d ~ PdPIB 0.... .,'D'' . .O ' " "~ 60" 0'03
...... ' : " .,:, ......... :j~:-:'" ~ ' D" o""~ ....o":~6" ~,
....... • ...... . " " ~ ' ~."-" : : '~ ~ 40" 0"05 .... ~ ..,-,...::...o- ..j~.::.~'- .o.....o.--B ' ~ " ~ : " " ' ~ " """ ~ :~ .< -~ll 5~ 0{)4 0"06 • : r ' ~ " ~ C r " ~ ' ~
(~05
.... . , , - ' - _ . 40"
'" ," / ~ - r . . I ~ I " ~- I30 ° 0"08 /'/" JIl~'" I " . ~ I I - - ~ I ' "
, / .~, _ ~ . . . , . . i i ~ . ~ ....~ 60" 0-06 • .~ , / # ~ / ~ i ~ ~ ..., ~-"
.," j . • I / 1 1 ~.,./" . . . . .'" ~ r 0'08 • I / / _ 1 ~" . ~ . ~ ~ . ~ . ur
P ' / i / 1 / I / ~ &- . - _ .~ 40" 0'10 / • / • / . ~ " ¢ . - ' _ t ' / . / ~ , / . . ~ "
I I " I / / ~ . i . ~ . j ~ , . t ~. , I .~ 30" 0'12 / / / / . / '~: . / -~" ~ . / ' ~ ~ . . ~ . ~ ' ~
/ ~ . / / ~ . / . ~ . ~ . / ' ~ / / ,
' / • . / ~ , " ,~" ,~ . - " / ~ . / . / - / / / ~
/ . / )~ ' , , 4 ' ~ 60" O-lZ / I . ~ / ~,,/
a / / / ~ ~p,1-- ~ 40" 049
• • 30" 0.25
1 2 3 4 5 6 ? 8 9 10 11 12
Thickness, d (in)
Operations per unit volume as a function of depth. N = (8rd 2 tan 2 ~b)/325.

=:
"c
...-L
... -
:..~ '\
,.~', \
, ,~ ,..
\\ \
\ \
:-. :-.
\ '..
. -5\
~ \
', '\
\ ",.
\ '\
\
• : .~
- :
"-.A~ \
, ~
". ~
\ \
\ -
~- '\
:, \
':A'\ ~
\ \
\. \"~
"\ "\
".. ,
. "-
, '-X
\ \
\ \
\ \
\ \
\ • ...
":: \..:
\ '...\\.
\.., \
\ \
.\ '\
\
[:2 o,~q
~ UQ =m
.~. U~
h
~..~,~/.~..~".:'. '"
'. \%
,,~ ~,
• -... -..... \
.-....-.\ -...~\
\\\. ,
' .\
\ .
\ '..
". "
".. "- '..X
'. \
" \
\. \\\',
"
• .. .........\ ....... -\. '.~.:,\.
\,',,:\\".\",,\.\ ".\
....... • ~ ""-0.-o '-a.o '.~ ",,::o, •
,~,:,, ......
• .\'...\ "....~
.,...\ .,',,.,,
... "...
. .
.....~.. \\
"- ~
~--
...... r-, 'E]."O.."O.'b.
'~J::). m.o."m.
~'.
NN
NN
N
+ ~moB
"...
~\~
~,
• \ "\
\ \
-\ .\
t '~.\
~, ,.\
'~
\ ~... ~
. "~
\
kl I
I I
I I
P
Jill i
i t
I I
~lll I
I I
I [
(O~O
)~'--~l~r,,k ") -4" ~
N ~e..,O
")(O~(O
l.¢ ') "d"
~
seanlaed
ols),u
jod
~o 'O
N
II ~
I I
i I
I
~OO
')'00~'.,-E) t~ -4'
0
0
(I:) ~'
e- e"
~
< 0
Z
o X N

30 S. Ganapathy, B. Schmult
resolution. The resolution of SAFT is of the order of 2/(4 sin~0). Higher frequencies or higher included angles give better resolution but also result in higher computational costs. A good compromise between com- putational requirement (cost) and resolution is being analyzed and will be reported in the future.
Once the resolution is fixed, it can be achieved in most cases by increasing the included angle or increasing the center frequency of the transducer. Because computat ion only goes up as the square of the included angle (for small angles tan ~p = ~p) and goes up as the fifth power of frequency (both approximations), it is always better to increase the angle whenever it is appropriate and feasible. As an example, consider the two points marked A (5 MHz, 40 °) and B (3 MHz, 60 °) in Fig. 7. While both combinations of parameters give a resolution of 0.04in, the combination at point A using 5 MHz requires five times the number of computations as does point B.
Speedup attempts for SAFT
We have implemented several SAFT processing systems in software on our laboratory computer systems. These programs have given best-case processing rates of around 2in3/min for laboratory conditions. As pointed out above, a field system will require processing rates of the order of 200 in3/min. A basic question then is whether a conventional computer can handle the processing rates for field conditions. From the results of the previous section one can determine how fast a SAFT processor must operate (in terms of the execution time of the basic cycle) under given conditions. This section summarizes work done to determine how fast conventional processors can operate under any conditions.
The results of this work, reported more fully in a recent report, 9 involved benchmarks done on several available computers and show that a special-purpose system is needed to achieve the required speeds. The measure used in these benchmarks was the time to shift and add one off- center data point to a center point, referred to here as z (see Fig. 3 to visualize the operation). This value was determined for several computers through program benchmarks or simulations and the results are given in Table 1. Note that the model of SAFT computation used to compute r assumed the use of look-up tables. If this assumption does not hold for use in the field then these z values will be increased substantially. Also included is the corresponding processing rate for a 12 in thick sample.

Real-time inspection o f reactor vessels and piping components 31
This assumes a frequency of 2.25 MHz and an included aperture angle of 45 °
From Table 1, it can be seen that while available minicomputers, like the VAX or PRIME, may give a reasonable speed for small volumes, the processing rate is not sufficient for real-time synthetic aperture processing under field conditions. The FPS-120B array processor shows consider- able improvement over the minicomputer and the cost is reasonable, but much of the processor is wasted. The CRAY-1 was used as a boundary condition and shows a significant improvement in speed, but the cost is several million dollars.
TABLE 1 SAFT Inner Loop Processing Time for Various Processors
Processor r (ps) In3/min based on Approximate 12 in thick sample cost
lnterdata 7/32 14.750 0" 18 $50 000 Perkin-Elmer 3240 6.940 0.38 $110 000 D.E.C. VAX-I 1,/780 5.500 0.47 $140000 Prime 750 4.500 b 0.58 $150 000 F PS- 120B" 0.500 5.22 $60 000 CRAY- I 0.100 26.10 $8 000 000 Special purpose
(I 6 processor) 0.010 261 $150 000
" FPS-120B is an Array Processor that must be attached to a mainframe. b Estimated.
The algorithms used in these benchmarks were all implemented in soft- ware, but could be used just as effectively in a special-purpose hardware system. With a given system the goal is to reduce the number of operations needed to shift and add one off-center data point to a center data point. This is done by eliminating memory references and performing operations in parallel. Any of the four steps in the basic cycle (see the section on concepts of digital SAFT processing) could consist of several machine instructions, depending on the application and assumptions made. Therefore, all four operations must be considered when developing a system. The programs we used to benchmark used a table look-up for the shift value and thus the shift calculation assumed a symmetric surface. In general, the shift calculation could be much more complicated, since it involves determining the distance between two points in a three-
32 S. Ganapathy, B. Schmult
dimensional coordinate system. This involves multiplications and square roots, which are much more time consuming than an add or memory reference. It is then desirable to be able to use a table look-up for the shift calculation to reduce the required processing time.
F rom these benchmarks it is evident that currently available computers do not offer the required performance at a reasonable cost and thus a special-purpose processor is the most viable alternative. This would allow parallelism to be exploited to best advantage, while only including the necessary hardware. The design of such a processor is the subject of the next section.
A SAFT processor architecture
The results of the previous section make it apparent that a parallel architecture is required to achieve real-time speeds. Such a parallel processor puts n identical processing elements (PEs) to work at the same time and gives a speedup of n', n ' < n. Data will be processed n ~ times as fast as if a single processor were used, or alternatively, if a total cycle time of -c seconds is required, each PE can be operated with a cycle time of n'z seconds, allowing slower hardware to get the job done.
Several different parallel architectures have been considered and one, known as the data broadcast architecture, has been selected for implementation. 1 o The application of parallelism to SAFT processing by this architecture is illustrated in Fig. 9. There are two PEs assigned to two adjacent center A-scans. (In general, n PEs will be assigned to n adjacent center A-scans.) The surrounding A-scans represent the union of the apertures of both center A-scans. In operation each point from each A- scan is broadcast to both PEs. Each PE decides where (if anywhere) each particular data point contributes to its center A-scan. After all A-scans have been broadcast, there will be two completely processed center A- scans.
Most of the points broadcast are in the apertures of both PEs. Points on the left and right boundaries are only in the aperture of one, so when these points are broadcast one of the PEs will be idle. This means that using n PEs will not get data processed n times as fast as using just one. However, the speedup is sufficiently high for real-time operation. We expect that a PE can be built to operate with a cycle time of about 160 ns. For apertures 63 points wide, a SAFT processor with 10 PEs will offer a speedup of about 8.75, resulting in an overall cycle time of about 18 ns.

Real-time inspection oJ reactor vessels and piping components
FE2 APERTURE
I I
33
Fig. 9.
FEI PE2
! t
.1 I
PEI APERTURE
Combined aperture forseveralprocessing elements.
This is under the 20 ns figure given previously as a requirement for field operation.
The organization of the PEs is illustrated in Fig. 10. Each PE has storage for its center A-scan and a queue for incoming data points. The basis for shift calculations and aperture membership determination is a set of control tables. The table determines how an off-center A-scan must be shifted and added to a center A-scan. There is one table for each A-scan position in the aperture and one command in the table for each point in an A-scan.
As an A-scan is broadcast the appropriate control table is sent, one command at a time, to each PE. Each command can be ADD, SHIFT or A D D & SHIFT. Each command is executed by its PE as it arrives. After one A-scan is broadcast, the next A-scan will be the next in a line parallel to the PE line. Thus the table that one PE needs for the next A-scan will be the same table used by its neighbor on the previous A-scan. So an external controller feeds a new table to one PE and each PE loads its used commands into a buffer. The other end of each buffer feeds the next PE. A more detailed explanation of this operation is given in section 3 of Ref. 10.
The simplicity and lack of computat ion in the PEs make it easy to build high-speed PEs with standard hardware. The major reason this speed is possible is the use of table look-up methods. This means all shift

34 S. Ganapathy, B. Schmult
BROADCAST DATA
t DATA C~UEUE
PREVIOUS ELEMENT
CONTROL
Fig. 10,
CENTER
A-SCAN
T POIHTER
ADDER
CONTROL
DELAY
Block diagram of a processing element.
--~ READOUT
NEXT > ELEMENT
calculations are done once and incorporated into the control tables. Compensation for surface variations is obtained with the software machining technique.I° Because raw A-scans are machined before being written into main memory, the PEs can implement pure table look-up SAFT, giving high-speed operation with tolerance for surface variations.
Design of a SAFT processor
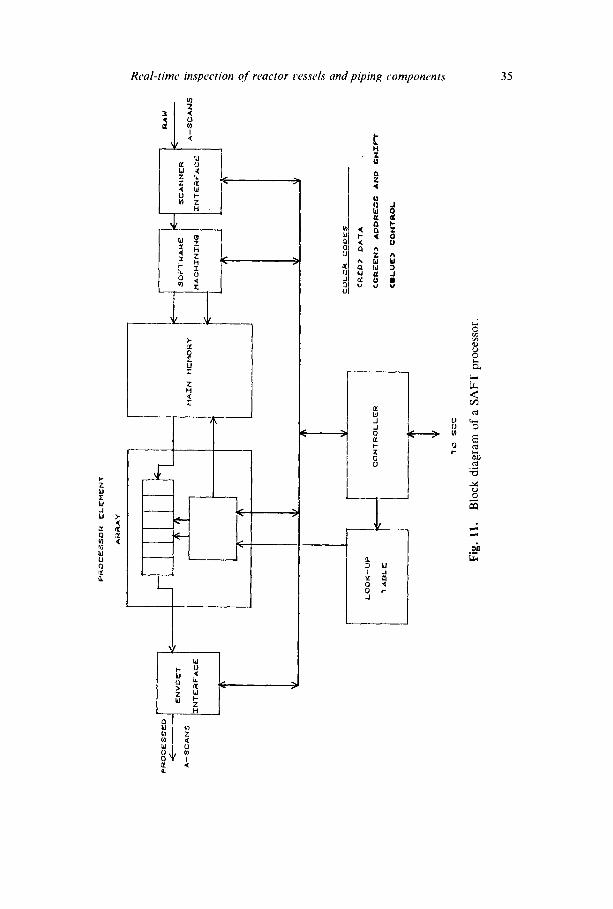
Figure 11 shows a block diagram of a complete SAFT processor. This processor forms a part of an overall inspection system. It is connected to
A--S
CANS
I-t
-NT E
RF-A
C E
PRO
CESS
OR
EL£M
~NT
AR
RA
Y
rI[l~
lib
F
LOO
K--U
P t
TABL
~
I CO
N'IR
OLL
ER I'I
AIN
HE
'rtO
~Y
XO S
~C
Fig.
11.
I r
Blo
ck d
iag
ram
of
a S
AF
T p
roce
ssor
.
SO
F'*
I'W
AR
~
HA C
H]'t4
~i~G
~N
T£R
F'Ar
'~ I
COLC
R CC
D~$
C~£
D~
DA
~A
C~R
E£N
) A
DD
R~
AN
D
SH
~F~"
CB
LU
~)
CO
NT
RO
L
L ..
.
% 5 %
2"
2

36 S. Ganapathy, B. Schmult
and controlled by a minicomputer that forms the core of the whole system.
The controller coordinates all operations in the processor based on commands received from the minicomputer. Raw data and surface position information arrive directly from the scanner system. The software machining module adjusts the A-scans to compensate for surface variation, and the updated A-scans are written into main memory. The controller reads A-scans out of main memory as needed and broadcasts them to the processor element array, along with the control tables. Control tables, like other parameters, are calculated by the minicomputer and loaded before processing begins. When complete processed A-scans are available they are read out of the PE array and output, usually to an envelope detector.
DISPLAY TECHNIQUES
The SAFT-based inspection system incorporates several new display techniques that attempt to display images of flaw regions rather than raw A-scan data. The principal display method will be a technique called real- time walkthru. The details of this technique appear in a NRC report currently in preparation.
The basis for walkthru is pseudo color imaging. This technique is used on two-dimensional planes of data that are cross-sections of the collected data volume. Each data point in the plane is assigned a color based on its relative amplitude. The color scale assigns 'cold' colors like blue to low background amplitudes and 'hot' colors such as red to peaks.
The walkthru technique presents data as a sequence of pseudo colored planes. Each plane represents a single row of A-scans and is a cross-section of the weld perpendicular to the weld centerline. New planes will overwrite old ones as they become available and thus give the effect of ~walking through' the weld region. Updating the display device for a new plane should require only about 64K bytes of data and several seconds are available to transmit it (the time to scan one row). Thus real-time operation will be easy to achieve and the display can be done as the data are collected.
There will also be available several forms of ~non-real-time' display techniques. As data are collected they are not only displayed but also stored on a disk system. These other display methods operate on these

Real-time #tspection of reactor vessels and piping components 37
stored data. The first technique is an interactive walkthru. The operator can inspect any desired region and can modify the display rate to a maximum of about two frames per second. Planes can also be frozen, or the sequence reversed. If the scan takes a long time this technique can also be used to view the data after they have been collected, in much less time than the scan takes. It should be noted that a laboratory version of walkthru has already been implemented, completely in software. Under a timesharing system it gives speeds of around 2.25-3 s per frame. Thus a speedup factor of only about 5 is necessary to achieve the two frame per second goal. This should be easily accomplished with hardware aids.
Specific planes or regions located with walkthru can then be subject to additional display techniques. Some of these are perspective contour plots and display of shaded images to convey 3-D orientation. Perspective views can be generated from any user viewing angle and further it is possible to rotate these images to convey complete three-dimensional information about depth and orientation of flaws inside an inspection volume. Hardcopy can also be made of single displays. Finally, it is possible to retrieve saved data from previous scans to rerun the displays.
A U T O M A T E D DECISION MAKING
Automated decision making is the least developed of the four phases outlined in the introduction. Research into the basic problems in this area is under way. The basis for decision making is the extraction of the boundary of the flaw to convey size and shape information. Two- and three-dimensional edge detectors are being developed that will perform this extraction.
It is not expected that automated decision making will be incorporated into an initial field system.
TOWARD A C O M P L E T E INSPECTION SYSTEM
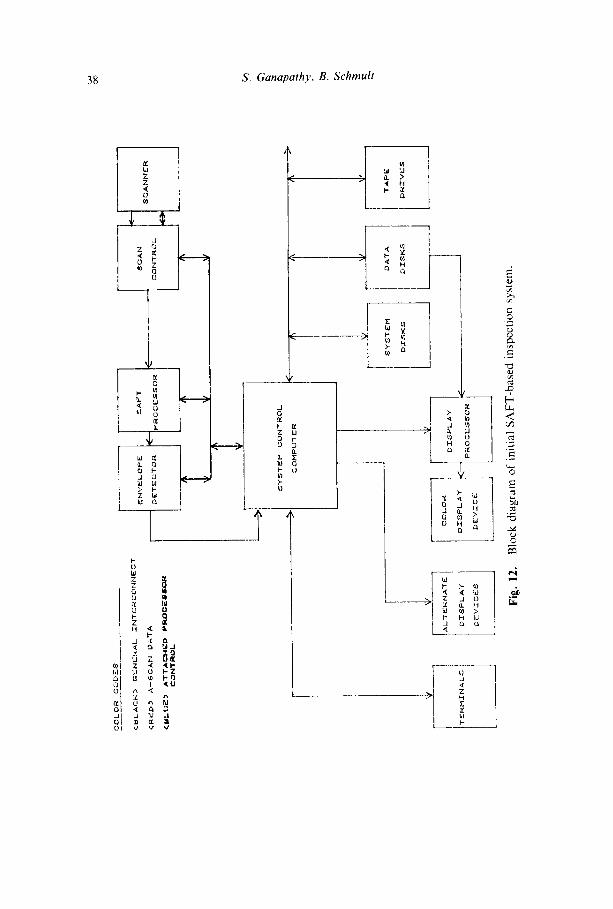
The four phases described in the introduction must be combined to form a complete inspection system. An initial fieldable system can be put together with only the first three phases (scanning, processing and display). A block diagram of such a system appears in Fig. 12.
The entire system is built around and controlled by a general purpose
COLO
R CO
DES
(BLA
CK}
G
ENER
AL
~NTE
~CO
N~JE
CT
<RED
) A-
-~CA
N PA
PA
~LtJ
E)
AT
TA
CH
ED
p
I~JD
CE
~OH
C
ON
TR
OL
AL -r
EK
rJ~.'T
E
£~'S
PLA'
( j
Fig.
12.
COLO
~ D
ISPL
AY
DEV
ICE EN
VIFL
OPE
DE
TECT
OR l
J~l
~.~A
P-T
IC
pRG
~ESS
OR
J
..~YS
TFM
CO
NTRO
L CO
t.IPU
'T E
R I
~ D'r
SpLA
Y P~
.OCE
~SCR
t <
SCAN
C~
I'-IT
ROL I
SYST
EM
DATA
DT
SKS
D~SK~5
[
Blo
ck d
iagr
am o
f in
itial
SA
FT-b
ased
ins
pect
ion
syst
em.
~J SQAN
NER
"r~PE
~:rvkGs
> 1
c~
Real-time inspection of reactor vessels and piping components 39
16 or 32 bit minicomputer known as the system control computer (SCC). It manages all the collected data and uses external devices and processors to complete functions. All operator interaction takes place through terminals connected to the SCC.
The scanner is the only unit actually attached to the reactor. It consists of a multiple axis mechanism, data collection electronics and a microcomputer controller. It can receive direct positioning commands from the SCC and return individual A-scans for analysis. In normal operation it is given a region to scan by the SCC and will do the scanning without intervention. Surface mapping information, if kept, is sent to the SCC for storage. Raw data and surface height are sent directly to the SAFT processor.
The SAFT processor also runs without intervention. It simply receives raw A-scans and outputs processed A-scans at the same rate. All processing parameters, such as A-scan size, are loaded from the SCC before processing starts. The shift table and aperture profile definition are both encompassed by the control tables. These tables are computed once by the SCC and are also preloaded.
Processed data are still RF and are unsuitable for display and thus envelope detected. Real-time rates require special-purpose hardware or at least a dedicated high-speed microprocessor. Like the SAFT processor it just sits in the data stream and outputs A-scans at the same rate as they come in.
The disk system is used to store programs for the SCC and data for the current weld. The current weld data can also be saved on magnetic tape for future use. Thus it is possible to go back and review previous scans, or to compare two scans of the same flaw to check for growth.
Note that this system organization permits easy expansion. Future complex operations can be added simply by building a special-purpose box that does the operation and inserting it into the data stream, just like the SAFT processor. Processing support for automated decision making can be implemented in this manner.
CONCLUSIONS
This paper has presented the results of research toward the design of a complete SAFT-based inspection system for field use. The area thought to be the major bottleneck, SAFT processing, has been overcome and the

40 s. Ganapathy, B. Schmult
fabrication of a prototype processor to demonstrate this is under way. Likewise, we feel that a display system can be fabricated that will display data at the same rate as they are collected. These two components will then be able to keep up with collection rates of current and future scanners, thus constituting a real-time system. Scanners suitable for use for this system are currently under development by other NRC contractors and should be available in the near future. Completion of this final development and fabrication will permit the construction of an initial fieldable system that can demonstrate the capabilities of SAFT. The future addition of automated decision making and other enhancements is expected to create an advanced N D E system uniquely suited for the inspection of nuclear reactor vessels and piping components.
A C K N O W L E D G E M E N T S
This research has been supported in part by the Nuclear Regulatory Commission under contract NRC-05-75-182. Thanks are also due to several members of the Ultrasonic Imaging Labora tory for contributions to several aspects of the system design.
R E F E R E N C E S
1. Grohs, B. et al., Characterization of flaw location, shape, and dimensions with the ALOK system, Materials Evaluation, 40 (1982), pp. 84 9.
2. Kiefer, R., Schmitz, V. and Wendel, H., Fast recording and numerical reconstruction of holograms, Proc. 3rd Int. Conf on Nondestructive Evaluation in the Nuclear Industry, Salt Lake City, Utah, 11 13 February, 1980, pp. 499-512.
3. Frederick, J. R., Seydel, J. A. and Fairchild, R. C., Improved ultrasonic nondestructive testing of pressure vessels first annual report, Nuclear Regulatory Commission Report NUREG-O007-1, January 1976.
4. Ganapathy, S., Wu, W. S. and Schmult, B. Analysis and design considerations for a real-time system for nondestrctive evaluation in the nuclear industry, to appear in Ultrasonics.
5. Frederick, J. R., Fairchild, R. C. and Anderson, B. H., Improved ultrasonic nondestructive testing of pressure vessels, Nuclear Regulator), Commission Report NUREG-O007-2, September 1977.
6. Frederick, J. R., Vanden Broek, C. J., Fairchild, R. C. and Elzinga, M. B., Improved ultrasonic nondestructive testing of pressure vessels, Nuclear Regulatory Commission Report NUREG/CR-O135, May 1978.

Real-time inspection of reactor ressels and piping components 41
7. Frederick, J. R. et al., Improved ultrasonic nondestructive testing of pressure vessels, Nuclear Regulatory Commission Report NUREG/CR-0581, January 1979.
8. Frederick, J. R. et al., Improved ultrasonic nondestructive testing of pressure vessels, Nuclear Regulatory Commission Report NUREG/CR-0909, September 1979.
9. Ganapathy, S. et al., Ultrasonic imaging techniques for real-time in-service inspection of nuclear power reactors, Nuclear Regulatory Commission Report NUREG/CR-2154, October 1981.
0. Ganapathy, S., Schmult, B., Wu, W. S., Hamano, N. and Bristor, D., Investigation of special purpose processors for real-time synthetic aperture focusing techniques for nondestructive evaluation of nuclear reactor vessels and piping components, Nuclear Regulatory Commission Report NUREG/CR-2703, to be published.