design of a wastewater collection system for the ...web.mit.edu/watsan/docs/student...
TRANSCRIPT

DESIGN OF A WASTEWATER COLLECTION SYSTEM FOR THE HISTORICAL CENTER OF PARATY, BRAZIL
By
NANCY CHOI
Bachelor of Science in Environmental Engineering School of Engineering, Massachusetts Institute of Technology (2002)
Submitted to the Department of Civil and Environmental Engineering
In Partial Fulfillment of the Requirements for the Degree of
MASTER OF ENGINEERING IN CIVIL AND ENVIRONMENTAL ENGINEERING
At the
MASSACHUSETTS INSTITUTE OF TECHNOLOGY
June 2003
© 2003 Nancy Choi All right reserved
The author hereby grants to MIT permission to reproduce and distribute publicly paper
and electronic copies of this thesis document in whole or in part
Signature of the Author_____________________________________________________ Department of Civil and Environmental Engineering
May 9, 2003
Certified by______________________________________________________________ Professor Donald R.F. Harleman
Ford Professor Emeritus of Civil and Environmental Engineering Thesis Supervisor
Accepted by_____________________________________________________________ Professor Oral Buyukozturk
Professor of Civil and Environmental Engineering Chairman, Department Committee on Graduate Studies
2
DESIGN OF A WASTEWATER COLLECTION SYSTEM FOR THE HISTORICAL CENTER OF PARATY, BRAZIL
By
NANCY CHOI
Submitted to the Department of Civil and Environmental Engineering on May 9, 2003 in partial fulfillment of the requirements for the degree of Master of Engineering in Civil
and Environmental Engineering
Abstract
The city of Paraty in the State of Rio de Janeiro, currently lacks a wastewater collection and treatment system. Untreated wastewater is carried by two rivers surrounding the city and discharged into a bay in front of the city. This creates many potential health, environmental, and social risks for the city. The city is in need of a plan to deal with its wastewater. The following thesis presents a conceptual design for a wastewater collection system in the historical center of Paraty, Brazil. Such a design can serve as a model that can be implemented to the other sections of the city. The design of this collection system involved investigating wastewater flow requirements, alternatives for wastewater collection, possible locations for a treatment plant, a feasibility study, and cost estimates for the system. A conventional gravity collection system was designed based on the conclusion that for the city of Paraty, a uniform, consistent, simple collection system would be the most appropriate.
Thesis Supervisor: Donald R. F. Harleman Title: Ford Professor of the Department of Civil and Environmental Engineering

3
Acknowledgments
I would like to thank a few people for all their guidance and help with this thesis project. Many thanks go to my advisor, Professor Harleman and my other unofficial co-advisor Frederic Chagnon. Thanks to Ricardo Tsukamoto for all the unbelievable amount of help he has provided to our whole team. Thanks to Sylvia Lee for meeting with me and providing much wisdom and guidance. Thanks to all the other engineers I have talked to and acquired invaluable help and information. I’d like to also thank my group mates, Claire Kfouri, Hyo Jin Kweon, and Eun Chu You. They have made this project fun and enjoyable, and it has been my pleasure working with them. Finally I would like to acknowledge and thank my family and friends for all their prayers and encouragement. They have been a tremendous source of support and “fighting” during this year.
4
TABLE OF CONTENTS
1. INTRODUCTION…………………………………………………………………
7
2. BACKGROUND………………………………………………………………….. 8 2.1 Introduction……………………………………………………………………. 8 2.2 Sanitation in Brazil…………………………………………………………….. 9 2.3 Current Situation in Paraty…………………………………………………….. 11 2.4 Plan for Mangueira…………………………………………………………….. 13 2.5 City Goals, Requirements and Issues………………………………………….. 13 2.6 Thesis Focus…………………………………………………………………… 13 2.7 Challenge for Paraty……………………………………………………………
14
3. METHODOLOGY………………………………………………………………... 15 3.1 Objective………………………………………………………………………. 15 3.2 Project Understanding…………………………………………………………. 15 3.2.1 Field Visit………………………………………………………………… 15 3.2.2 Paraty’s Mapping………………………………………………………… 16 3.2.3 Wastewater Collection Systems………………………………………….. 17 3.3 System Criteria………………………………………………………………… 19 3.4 Choice of System: Gravity Collection System………………………………... 26 3.5 Technical Approach…………………………………………………………… 27 3.5.1 Treatment Plant Location………………………………………………… 27 3.5.2 Overall Layout…………………………………………………………… 29 3.5.3 Gravity Sewer Design…………………………………………………….
30
4. CAPITAL COST ESTIMATES………………………………………………….
40
5. DISCUSSION/ANALYSIS……………………………………………………….
42
6. SYSTEM RECOMMENDATIONS……………………………………………..
49
7. CONCLUSION……………………………………………………………………
52
8. APPENDICES…………………………………………………………………….
53
9. REFERENCES…………………………………………………………………… 65
5
LIST OF TABLES
Table 2.1 Water and wastewater data reported by CEDAE on State of Rio de Janeiro
Table 2.2 Water and Sanitation Data on Municipality of Paraty
Table 3.1 Typical Costs for Sewer Systems
Table 3.2 Phillippi Creek Project – Summary of Estimated Uniform Annual Costs
Table 1.3 Wastewater Flows
Table 3.2 Wastewater Loads
Table 3.5 Recommended slopes for different pipe (PVC) diameters
Table 3.6 Pipe Segment Data
Table 4.1 Costs Estimates

6
LIST OF FIGURES
Figure 2.1 Map of the State of Rio de Janeiro
Figure 2.2 Map of Paraty, Brazil
Figure 3.1 Per capita construction costs for different sanitary sewer systems at various
population densities
Figure 3.2 Aerial Photo of Paraty – Potential Locations of Treatment Plant
Figure 3.5 Sewer Network Layout Designs
Figure 3.6 Gravity Sewer Network of the Historical Center
Figure 3.7 Profile of the Main Trunk Line
Figure 5.1 Velocity versus Peaking Factor
Figure 5.2 Total Flow versus Peaking Factor
Figure 5.3 Total Flow versus Infiltration Rate
Figure 5.4 Velocity versus Roughness Coefficient
7
1. Introduction
The purpose of this thesis is to present a conceptual, preliminary design of a wastewater
collection system for the historical center of the city of Paraty, Brazil. The city of Paraty
currently has no collection or treatment of wastewater. The preliminary design for the
historical center presents a step towards the overall goal to collect and treat all of Paraty’s
wastewater. The process to design this collection system involved an investigation of the
wastewater flow requirements of the project, alternatives for wastewater collection,
possible locations for a wastewater treatment plant, feasibility study of a collection
system and cost estimates.
Chapter 2 provides some background on Paraty, sanitation in Brazil, and the current
situation in Paraty. Chapter 3 goes into the methodology of the design and discusses the
project understanding, system criteria, and technical approach. The following sections
provide cost estimates (Chapter 4), analysis (Chapter 5), and system recommendations
(Chapter 6) on the proposed system.

8
2. Background
2.1 Introduction
Figure 2.1 Map of the State of Rio de Janeiro
Paraty is a small city on the coast of Brazil in the state of Rio de Janeiro (See Figure 2.1).
Established sometime in the 17th century, Paraty played an important role as a main port
for gold from the Minas Gerais State in the 18th century, and for coffee in the 19th
century. Due to the decline of both industries and the geographic isolation of Paraty for
most of it’s history, the historic city was well preserved. The opening of the Rio-Santos
highway in the 1980s led to an economic boost from a new industry – tourism. The
preservation of historical architecture, the surrounding landscapes and numerous islands
and beaches has made Paraty a National and World Historical Monument as well as a
desirable location for many tourists.

9
2.2 Sanitation in Brazil
Until the end of the 1960s, Brazil did not have any federal, state or regional policy on the
water and sanitation sector. Local governments were responsible for delivering water
and sanitation services. In 1971 the federal government established PLANASA (Plano
Nacional de Saneamento), a national plan created to improve water supply and sanitation
services. According to the plan, each State created its own State-owned public water and
sewage company. The individual municipality then decided to turn over their
concessions to the state agency or independently manage their system. Local
governments were encouraged to turn to the state water company in exchange for federal
funding. About 85 percent of the population is served by the state companies today1.
The Plan brought great improvements to water supply and sanitation in Brazil, although
its goals were not completely met. The urban water coverage, which was 45 percent in
1970, achieved 83 percent coverage by 1985. The percentage of people connected to
public sewage systems increased to 35 percent from 24 percent. Although the sewage
system increased, wastewater treatment lagged far behind: only about 10 percent of total
wastewater received any form of treatment2.
Despite the improvements, many of the state companies had a series of problems such as:
technical and operational problems; high unaccounted-for water; limited service
expansion that could not cope with population growth; commercial and financial
problems; human and institutional problems; and environmental problems. The
1 US Department of Commerce, 1999 2 US Department of Commerce, 1999
10
PLANASA model remains operational as a backbone of sanitation in Brazil, but has since
become extinct and a new model is being developed.
The Brazilian Constitution of 1988 defined the municipalities as responsible and legally
empowered to grant authority for local services, including water supply and sewage.
State companies operate local services by concessions granted by the municipalities.
Most concessions were granted in the 1970s, for a duration of 25-30 years. The
municipality of Paraty recently aquired responsibility of their water and sewage back
from CEDAE. CEDAE is the public state company for the State of Rio de Janeiro.
However, due to the dependency on CEDAE, the city has not been able to provide their
own technical support, the water supply and sewage services have been contracted back
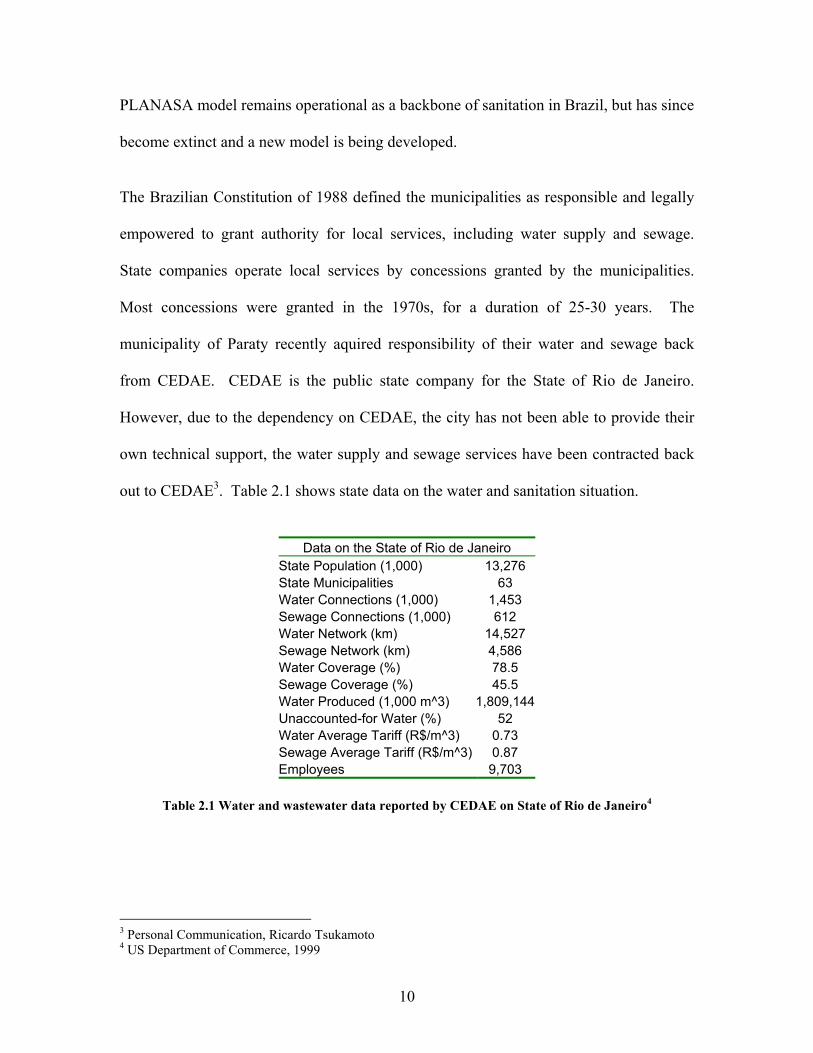
out to CEDAE3. Table 2.1 shows state data on the water and sanitation situation.
Data on the State of Rio de Janeiro State Population (1,000) 13,276 State Municipalities 63 Water Connections (1,000) 1,453 Sewage Connections (1,000) 612 Water Network (km) 14,527 Sewage Network (km) 4,586 Water Coverage (%) 78.5 Sewage Coverage (%) 45.5 Water Produced (1,000 m^3) 1,809,144Unaccounted-for Water (%) 52 Water Average Tariff (R$/m^3) 0.73 Sewage Average Tariff (R$/m^3) 0.87 Employees 9,703
Table 2.1 Water and wastewater data reported by CEDAE on State of Rio de Janeiro4
3 Personal Communication, Ricardo Tsukamoto 4 US Department of Commerce, 1999

11
2.3 Current Situation in Paraty
Paraty has a summertime population growing up to three times as much as its fixed urban
population of 15,0005. This annual flux causes large variations in water and sanitation
loads. The untreated sewage is carried by the two rivers surrounding the city and
eventually the waste is discharged out into the bay in front of the city (See Figure 2.2).
Figure 2.2 Map of Paraty, Brazil: 1. Historical Center; 2. “Upper” part of the city; 3. Mangueira; 4. Pereque River; 5. Matheus Nunes River
Currently, water is collected from a surface source in the surrounding mountains, and
distributed in buried pipelines without any treatment other than chlorination. In addition, 5 Prefeitura Municipal de Paraty, 2001

12
the supply suffers from low pressure, especially during the summer tourist season. The
present sewerage infrastructure includes many septic tanks, nonfunctional pipes (some of
which are periodically immersed in seawater), and discharges to the river.
The Historical Center is the centuries-old part of the city adjacent to the sea. This section
has cobblestone streets and cars are not allowed. The buildings are preserved and many
are used for shops and hotels. The streets immediately adjacent to the sea are flooded
during high tides. The “upper” part of the city, away from the sea, has a normal city
structure: the water table there is from 0.5 to 1.0 meter deep. Mangueira, the third main
section of the city, is home to many lower income people. This area has grown to be the
largest portion of the city. Figure 2.2 indicates the three main sections of Paraty. There
is no separate sanitary collection system in Paraty. The sections outside the historical
center have a storm water collection system that residents have connected haphazardly to
discharge wastewater. The sewage is taken directly into channels that end up in Paraty
Bay. All of Paraty’s wastewater goes untreated. Table 2.2 summarizes water supply and
sanitation data from the city of Paraty.
Data on the Municipality of Paraty Total Population 30,000 Urban Population 15,000
Urban Population Supplied with Water 15,000 Urban Homes with Water Supply 4,300
Supply Capacity (L/sec) 30 Distribution By gravity
Sanitation No sanitary sewage system in the urban area
Table 2.2 Water and Sanitation Data on Municipality of Paraty6
6 Prefeitura Municipal de Paraty, December 2001
13
2.4 Plan for Mangueira
There is currently a plan for a collection and treatment project in the Mangueira section
of Paraty. Mangueira has obtained special outside grants for this project because of its
status as a poorer community. The rest of the city does not qualify for such funding. The
plan however is not complete. The plan is incomplete as it includes a design for a basic
trunk line and a treatment plant. There are no plans to build a network within the
residential area. The incomplete system is therefore rendered useless because homes are
not able to connect to the collection system. Refer to Appendix A for a more detailed
description of this project in Mangueira as well as a layout of the plan.
2.5 City Goals, Requirements, and Issues
The city of Paraty is making efforts to qualify the historical center as a UNESCO World
Heritage Site. Before this can be accomplished, the city must solve two main problems:
1) treat its wastewater and 2) conceal its aerial electric distribution system, by burying it
underground. In addition to the economic and status benefits of sewage treatment, there
are associated health benefits to treatment of sewage7. In order for sewage to be
effectively and efficiently treated, a wastewater collection system is needed.
2.6 Thesis Focus
The whole city of Paraty is in need of sewage collection and treatment development
project. Due to funding and logistics, a project of this magnitude needs to be taken in
steps. The focus for this thesis is on the historical center of Paraty for several reasons.
7 Refer to thesis by Eun Chu You (2003) for more information.

14
First, there is an obvious and pressing motivation to build a collection system in the
historical center in order to qualify for UNESCO recognition. Secondly, the focus on one
section can provide a model for each successive step in a longterm project to provide
sanitation services for all of Paraty.
2.7 The Challenge for Paraty
Although the Historical Center is well preserved, it is a fragile environment for big
change and the people of the city want to keep the city in its’ original form. The water
table is high in the Center and floods with the high tides every day. The land is also flat
within the Historical Center.

15
3. Methodology
3.1 Objective
The objective of this thesis is to provide a conceptual design of a wastewater collection
system for the Historical Center of Paraty, Brazil. This section describes the
methodology into creating a design. The process investigates the wastewater flow
requirements of the project, the alternatives for wastewater collection, the possible
locations for a wastewater treatment plant and the cost estimates.
3.2 Project Understanding
Investigation of the area in need of sewerage is important for design and construction.
Paraty’s sewer design is based on a field visit of the proposed sewer area, a review of the
city’s mapping, and a preliminary analysis of the different alternatives of collection.
3.2.1 Field Visit
The land of the city is generally flat. The elevation seems to be no more than a half-
meter above sea level. The tide floods the streets each day in the area closer to the water.
The streets are in poor condition. Due to past road excavation, the stones that make up
the streets were put back improperly and subsequently the streets are slanted and rough to
walk on. The streets vary in width ranging between 4 and 7 meters. There is a mix of
one and two story buildings, and there are no basements in any of the buildings. The
existing underground structures include a water distribution system, a telephone wire
system and an old, incomplete and nonfunctional sewer collection system. The existing
16
sewer is a gravity sewer which was implemented 20 years ago in the Historical Center. It
was built with a line of short pipes of concrete (1 meter in length) and has its lowest point
close to the sea at depths of around 3.5 meters8. Because of the material used to build the
sewer, the infiltration is too high for use as a sewer.
3.2.2 Paraty’s Mapping
The city lacks appropriate and accurate maps of the existing infrastructures. Most of the
surveying was performed by interviews with people and by observation. An aerial photo
was obtained9 and the map was then digitized and georeferenced using ArcView GIS.
The coordinates are based in Universal Trans Mercator (UTM) projection. The scale of
the map is 1:2000 (See Figure 3.2). This map provided means to plan out a collection
system with accurate spatial data.
3.2.3 Wastewater Collection Systems
Combined sewers are used to collect wastewater from residential, commercial,
institutional, and industrial sources and storm water. These sewers are common in many
older parts of major cities. Old combined sewers discharge wastewater into receiving
waters. To reduce or eliminate pollution problems from combined sewers, a separate
sewer system is needed. Stormwater is generally less polluted than wastewater, and that
treatment of combined wastewater and stormwater is difficult during heavy rainfalls,
resulting in untreated overflows (commonly termed combined sewer overflow, CSO)10.
Combined sewage is harder and more expensive to treat. In a city like Paraty, where 8 Personal Interview, Wilson Rocha 9 Aerial photo was obtained through personal contact and communication with Tymur Klink. 10 Heaney, 1999
17
there are large influxes of storm water, a separate sewer system would be best suited.
Four options for a wastewater collection systeem serving the city of Paraty are discussed
here. The four types are: 1) gravity sewers; 2) pressure sewers; 3) vacuum sewers; and 4)
small diameter gravity sewers.
Conventional Gravity Sewers
Conventional gravity sewers11 transport wastewater by gravity flow from high to low
points. They are designed so that the slope and size of the pipe is adequate to maintain
flow towards the discharge point without surcharging manholes or pressurizing the pipe.
Conventional gravity sewers remain the most common technology used to collect and
transport domestic wastewater. Properly designed systems can handle grit and solids in
sanitary sewage as well as maintain a minimum velocity which reduces the production of
hydrogen sulfide and methane. The need for a self cleansing slope can require deep
excavations and/or additions of pumping or lift stations.
Several different types of wastewater collection systems have been developed as
alternatives to conventional sewers. The network of piping for an alternative collection
system can be laid in much shallower and narrower trenches. The pipes are usually of a
smaller diameter than those used in a conventional system (100 mm compared to 300 mm
in diameter)12. They also do not need to be laid in a straight line nor with a uniform
gradient. This means they can be laid in such a manner as to easily avoid obstacles. The
three main types of alternative collection systems are pressure sewers, vacuum sewers
and small-diameter gravity sewers (SDGS). 11 Metcalf and Eddy, 1981 12 US EPA, 1991
18
Pressure Sewers
Pressure sewers13 use the pressure force supplied by pumps to deliver wastewater to a
central location from each property. A pressure system is a small diameter pipeline
(typically 100mm), shallowly buried, and following the contour of the land. The systems
eliminate the need for lift stations of a conventional system and also infiltration is
eliminated because manholes are not required, thus piping materials are not exposed to
groundwater fluctuations. There are two types of pressure systems distinguished by the
type of pump used. A septic tank effluent pump (STEP) uses septic tanks to capture the
solids, grit, grease and stringy material that allows for smaller diameter piping. The
effluent pump then provides the necessary pressure to move the wastewater through the
system. The second type of pump is a grinder pump (GP) which grinds the solids in the
wastewater into tiny particles. The slurry is then pumped into the sewer system that
requires a pipe diameter slightly larger than in the STEP system because of the mixture.
In the GP system, each household requires a tank containing the pump with grinder
blades. Both pump systems require periodic cleaning of local tanks as well as localized
electrical supply for each pump.
Vacuum Sewers
Vacuum sewer systems14 take wastewater from a holding tank. When the wastewater
reaches a certain level, sensors within the holding tank open a vacuum valve that allows
the contents of the tank to be sucked into the network of collection piping. The vacuum
13 US EPA, 1991 14 US EPA, 1991

19
within the system is created by a vacuum station at a central location. Vacuum stations
are small buildings that house a large storage tank and a system of vacuum pumps.
Small Diameter Gravity Sewers
Small diameter gravity sewers15 provide primary treatment at each connection and
convey only the effluent. This system is similar to the STEP system in that it would
require homeowners to maintain their existing septic tank. Grit, grease and other
troublesome solids which might cause obstructions in the collector mains are separated
from the flow and retained in the septic tanks. Effluent from each tank is discharged to
the collector sewer via gravity. There is a lower required velocity in the sewers because
solids are not transported through the system. Therefore the pipes do not have to be as
large or as sloped.
3.3 System Criteria
While analyzing the different types of collection systems, there were four criterion to
guide the decision in choosing the best fit option for the historical center. These four
criterion are: economics, adaptability, expandability, and simplicity. Addressing the
issues associated with these criteria is key to developing the right choice of sewers for the
Historical Center.
15 US EPA, 1991
20
3.3.1 Economics
Capital Costs
Cost is always a main factor in any project decision. The capital costs for any of the
options available involves a number of factors such as house connections, sewer mains
and pumping stations. The primary cost trade-offs to develop a plan are discussed here.
Table 3.1 provides a summary of the cost comparisons described below.
House Connections ($/household)
Sewer Mains ($/meter)
Pump Stations starting costs ($)
Gravity Sewer 2,500 230-330 200,000 Vacuum Sewer 5,000 130-200 400,000 Pressure Sewer 7,000 115-165 None
Table 3.1 Typical Costs for Sewer Systems16
House Connections. Gravity sewers have the simplest and lowest typical cost17 of about
$2,500 for a house connection. Vacuum sewers require a vacuum valve station at each
property with typical costs starting at $5000 per household. Pressure sewers are the most
expensive option with pump costs approaching $7,000 per household. SDGS have a
house connection cost of installing and maintaining the interceptor tanks. Similar to
pressure sewers, the cost of installing interceptor tanks is a significant cost. Usually
existing septic tanks cannot be used as interceptor tanks because they are not watertight
and cannot be inspected and repaired cost effectively. Pressure and small diameter
gravity sewers are both well suited for communities with houses that are far apart. The
historical center of Paraty, where the houses are close together, is therefore not conducive
for pressure and small diameter gravity systems.
16 Harrington, 2003 17 Harrington, 2003

21
Sewer Mains. The conventional gravity system has slope requirements to maintain
gravity flow. This demands deep excavations and/or additions of pumping or lift stations
which drive up construction costs. Pressure sewers are the most cost effective sewer
mains to implement. They do not require deep excavation and typical cost per meter
range from $115-16518. Small diameter gravity sewers have a small diameter (~100mm)
and can be also busied at a relatively shallow depth. Vacuum sewers are typically 15-
25% higher in cost than pressure sewers and gravity sewers are generally more than
100% higher in cost than the lower cost pressure sewers. The historical center of Paraty
is not a large area (14 hectares), and therefore, deep excavation is not a large concern.
Where the required length of sewer between service connections is comparatively short,
the cost of providing conventional sewers is usually affordable unless some other
obstacle is present.
Pump Stations. Pump systems must have sufficient head to transfer wastewater all the
way to the treatment plant. Therefore there are no additional associated costs for pump
stations. Standard pumping stations for gravity systems begin at $200,000 (Reference)
while vacuum stations for the same design flows can cost up to 100% more than a
sanitary pump station. The average number of customers per station in vacuum systems
is about 200-30019. Although it is possible to have a station serve the whole historical
center, which would need to serve about 700, it could not serve the whole city of Paraty.
More stations would need to be built and drive up costs.
18 Harrington, 2003 19 Hassett, 1995
22
Operation and Maintenance
The operation and maintenance cost for pressure systems tend to be high because of the
pumps. In areas where electric supply is not reliable, these systems could be more
trouble then help in that constant monitoring or the addition of backup power is needed at
each household. There is less risk with a vacuum system since the vacuum station has a
central location, so just one back up power system is required. There is also a cost of
cleaning and maintaining each tank at each home. In higher density areas, this could
prove to be more costly than the savings from pipe network installations fees for pressure
sewers and SDGS.
Site Examples
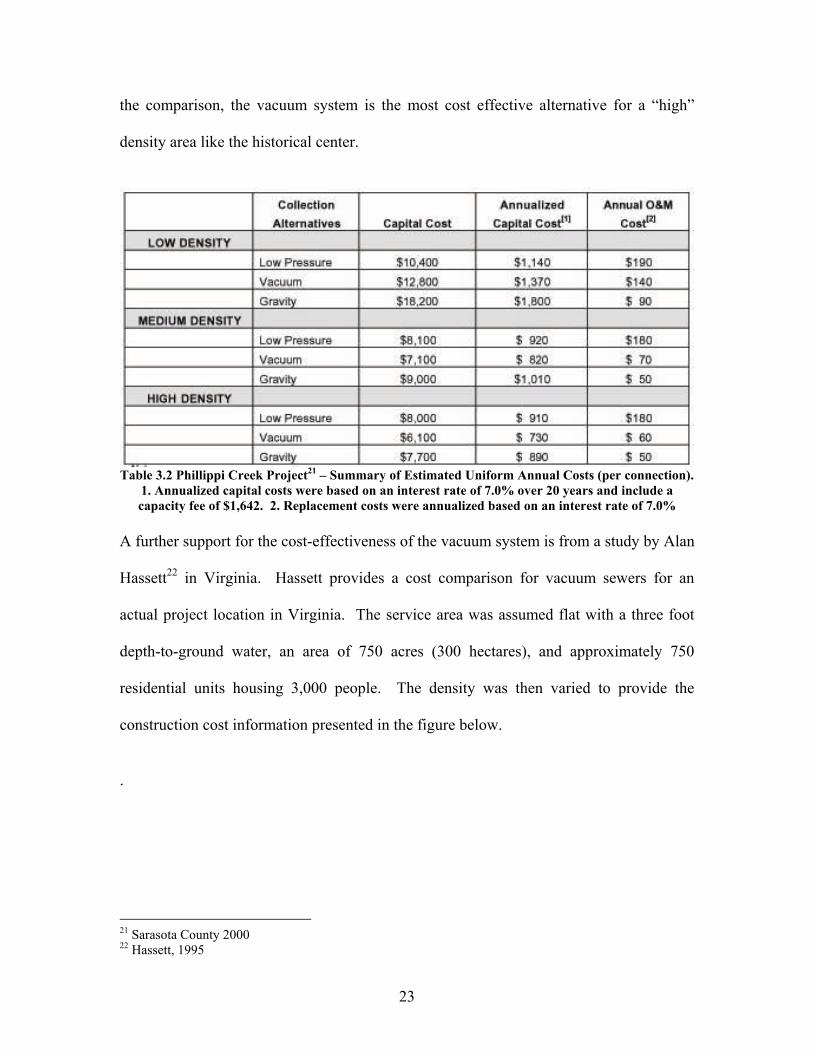
Table 3.2 shows some capital cost as well as O&M estimates of different collection
systems for a project in Sarasota, Florida. In Sarasota, Florida, an evaluation was
performed on possible wastewater collection system alternatives on a project there.
Preliminary design and cost information for low pressure and vacuum sewer systems
were obtained from various equipment manufacturers. Table 3.2 provides the estimated
annual costs per connection for each collection system alternative based on different
densities selected for analysis. The densities were categorized as either low (>0.5 acre
average lot size), medium (0.25-0.5 acre average lot size), or high (<0.25 acre average lot
size) density20. The historical center falls into a high density category for this case. The
analysis reiterates the economic impracticality of a pressure system for Paraty. Based on
20 Sarasota County, 2000
23
the comparison, the vacuum system is the most cost effective alternative for a “high”
density area like the historical center.
Table 3.2 Phillippi Creek Project21 – Summary of Estimated Uniform Annual Costs (per connection).
1. Annualized capital costs were based on an interest rate of 7.0% over 20 years and include a capacity fee of $1,642. 2. Replacement costs were annualized based on an interest rate of 7.0%
A further support for the cost-effectiveness of the vacuum system is from a study by Alan
Hassett22 in Virginia. Hassett provides a cost comparison for vacuum sewers for an
actual project location in Virginia. The service area was assumed flat with a three foot
depth-to-ground water, an area of 750 acres (300 hectares), and approximately 750
residential units housing 3,000 people. The density was then varied to provide the
construction cost information presented in the figure below.
.
21 Sarasota County 2000 22 Hassett, 1995

24
Figure 3.1 Per capita construction costs for different sanitary sewer systems at various population densities23. Note: MVS means modern vacuum system and VS 2001 represents 21st century vacuum
system. Wet means that the system includes lift stations and is below the water table.
The population density in Paraty is around 200 persons/ha (refer to section 3.5.3 for
population data). In the above figure, the vacuum system costs about $60 dollars less
than the wet gravity system at that population density. A wet gravity system is a system
that includes lift stations and is below the water table. The graph is used for comparative
purposes so the exact dollar amount cannot be taken literally. This suggests that for a
city like Paraty, a vacuum system can be slightly more cost effective than a gravity
system. 23 Hassett, 1995
25
3.3.2 Expandability
The overall longterm goal of Paraty would be collect and treat all of its wastewater. This
report goes through a plan for only the historical center section of the city. Expandability
is therefore a criterion for the system to be selected for Paraty. Future collection
additions must be taken into account. Being comparatively large in diameter and
capacity, conventional sewers are often seen as being growth inducing. Both pressure
sewer and vacuum technology have less flexibility than gravity sewers in accommodating
future flow increases. For example a disadvantage of the vacuum system is that the
length and amount of pumping possible is restricted due to head limitations24.
3.3.3 Adaptability
A third criterion for this system is adaptability and flexibility to seasonal fluxes. Paraty is
a tourist city and has a large flux in population as well as rain in the summer months. All
four systems can handle such a variation in flow, but a gravity system can probably
handle these peak flows the best because of it’s comparatively larger size and capacity.
3.3.4 Simplicity
The final criterion is simplicity. Given the history and political climate in Paraty, a
simple system is needed. Having a system that is widely known enables ease of
transition from changing administrations. An advantage to conventional collection is that
the technology is well established with relatively simple operation and maintenance.
Pressure sewer and SDGS systems involve maintenance of septic tanks and pressure
24 US EPA, 1991

26
sewers require even more operation and maintenance due to the addition of pumps at
each household. Vacuum systems require a full-time system operator with the necessary
training. Possible vacuum leaks can render the whole system inoperable. The city lacks
the expertise and resources to handle such involved systems as the pressure, vacuum and
small diameter gravity sewers. Also the irregular electrical supply in the city, especially
during the summer can cause a problem for the pressure and vacuum systems.
A gravity system is the simplest alternative. There are plans to build a gravity collection
system in the Mangueira section of Paraty (Appendix A). This would be another reason
to pursue gravity collection for the historical center and have gravity collection in the
whole city. The more of a mix of collection systems, the harder it will be to operate and
maintain. A uniform, consistent collection system would be the most simple in Paraty,
where technical support is limited.
3.4 Choice of System: Conventional Gravity Collection
A conventional gravity design was chosen for the historical center of Paraty based on a
preliminary analysis of collection systems. Although the conventional sewers are slightly
more expensive than vacuum sewers, their use may be preferred as conventional
sewerage is an old and mature practice. Vacuum sewers are not well established in Brazil
and are found mostly in large cities25. Paraty needs a system that is easy to maintain and
does not require much technical support. The overall plan for a treatment and collection
system needs to be expandable, adaptable and centralized. This thesis covers only the
design of one section of the city of Paraty, but the entire city is in need of an adequate
25 Personal Communication, Fernando Craveiro
27
wastewater treatment and collection system. A conventional gravity sewer system is
more easily expandable than the alternate systems of collection. Paraty also needs an
overall collection and treatment system that is adaptable and robust to the different fluxes
in seasonal population and rain. A conventional gravity system coupled with Chemically
Enhanced Primary Treatment (CEPT) is ideal for these types of seasonal fluxes. CEPT is
a type of wastewater treatment that can handle such variations26. Finally a simple system
that is adaptable and expandable would be ideal for Paraty, because it would minimize
the personnel needed to handle operation and maintenance.
3.5 Technical Approach
The first step in developing a plan was to identify the alternatives for a preliminary
design evaluation. After a review of the factors previously discussed, the next step in this
process was to evaluate the feasibility for the chosen system. This section will discuss a
conceptual design of a gravity sewer collection system for the historical center of Paraty.
3.5.1 Treatment Plant Location
Before sewer networks can be drawn, the location for a potential treatment plant must be
determined. This will shape the layout of pipes. Two potential locations were considered
– the first near the city’s hospital (Location 1 – see figure below) and the second in
Mangueira (Location 2 – see figure below)
26 Refer to thesis by Kfouri and Kweon (2003) for more information.

28
Figure 3.2 Aerial Photo of Paraty – Potential Locations of Treatment Plant27.
Both locations are situated strategically near the historical center as well as close to the
bay. Location 1 is approximately 3000 square meters in area and Location 2 is
approximately 6500 square meters. The proximity to the water will allow for a marine
outfall of treated wastewater. Although the site near the hospital is closer to the historical
center, it is an undesirable location because of its proximity to a beach. The site on
Mangueira is more desirable because since there is already a plan to build a plant there
(Appendix A), the cost of upgrading the plant is less than building another treatment
plant. Also the area is larger for Location 2, allowing space for future upgrades. In
conclusion, Manguiera (Location 2) was chosen as the treatment plant site for the
wastewater in the historical center.
27 Klink, 2003
29
3.5.2 Overall Layout
ESRI’s ArcView GIS was used to lay out the general pipe network in the Historical
Center. GIS allows for easy “management, analysis, and mapping of infrastructure and
geographic information and descriptive data with cartographic accuracy.”28. A line was
drawn to represent the proposed sewer in each street to be served. Two different pipe
networks were designed (See Figure 3.5). Design 1 places the trunk line along the edge
of the historical center and Design 2 places the trunk line through the middle of the
historical center. Design 2 was chosen because it potential saves on excavation costs.
Gravity sewers need to be sloped in order to create velocities large enough to convey
wastewater. As pipe segments increase in length, the downstream depth of the pipe also
increases. By having the trunk line in a more central location for the network, sewer lines
do not have to go as deep because sewer line segments are not as long. Therefore, there
is a decrease in installation/excavation costs because of the decrease in the depth of pipe.
Each line has an arrow indicating the direction in which the wastewater is to flow.
Manholes were then placed at 1) changes in direction; 2) changes in slope; 3) at pipe
junctions; and 4) at the upper ends of all laterals for cleaning and flushing the lines. The
catchment areas were then established and quantified in ArcView. The catchment areas,
manholes, and pipe segments between manholes were all assigned with labels.
28 Shamsi, 2002

30
Figure 3.5 Sewer Network Layout Designs
3.5.3 Gravity Sewer Design
Gravity flow sanitary system design involved reviewing design considerations and
selecting basic design data and criteria. Once these factors were set, the system was
designed, which included preparation of a preliminary sewer system design and design of
the individual sewers. The system was designed for peak hourly flow of the base
population.
Design Factors
Average Daily Flow. The wastewater flow in Paraty consists of wastewater from
residential, commercial and institutional sources and infiltration. Determining the rate of
flow is crucial in the design of a collection system. A common indicator and quantifier
of wastewater flow is drinking water consumption and use. According to the city of
Paraty29, the average potable water consumption is 180 liters/person*day. Few
assumptions were made about the population in the historical center. The base
population of the historical center was assumed to be 3,000. This is reasonable
29 Prefeitura Municipal de Paraty, 2001
31
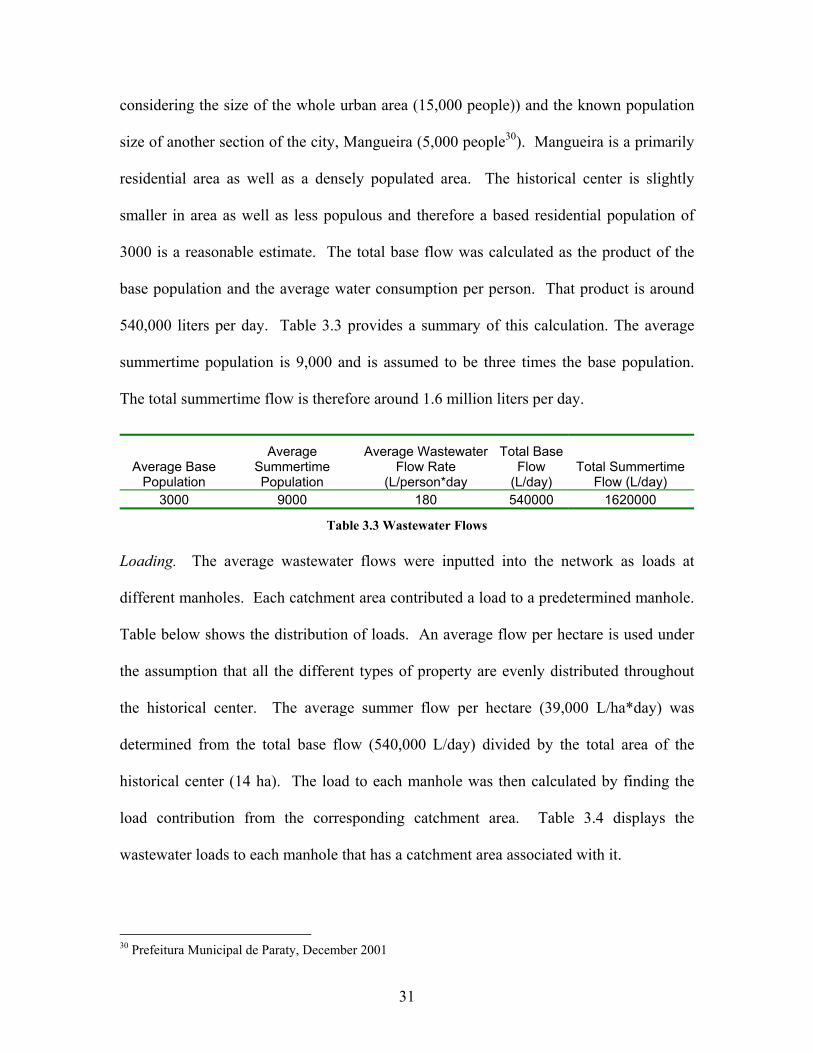
considering the size of the whole urban area (15,000 people)) and the known population
size of another section of the city, Mangueira (5,000 people30). Mangueira is a primarily
residential area as well as a densely populated area. The historical center is slightly
smaller in area as well as less populous and therefore a based residential population of
3000 is a reasonable estimate. The total base flow was calculated as the product of the
base population and the average water consumption per person. That product is around
540,000 liters per day. Table 3.3 provides a summary of this calculation. The average
summertime population is 9,000 and is assumed to be three times the base population.
The total summertime flow is therefore around 1.6 million liters per day.
Average Base Population
Average Summertime Population
Average Wastewater Flow Rate
(L/person*day
Total Base Flow
(L/day) Total Summertime
Flow (L/day) 3000 9000 180 540000 1620000
Table 3.3 Wastewater Flows
Loading. The average wastewater flows were inputted into the network as loads at
different manholes. Each catchment area contributed a load to a predetermined manhole.
Table below shows the distribution of loads. An average flow per hectare is used under
the assumption that all the different types of property are evenly distributed throughout
the historical center. The average summer flow per hectare (39,000 L/ha*day) was
determined from the total base flow (540,000 L/day) divided by the total area of the
historical center (14 ha). The load to each manhole was then calculated by finding the
load contribution from the corresponding catchment area. Table 3.4 displays the
wastewater loads to each manhole that has a catchment area associated with it.
30 Prefeitura Municipal de Paraty, December 2001
32
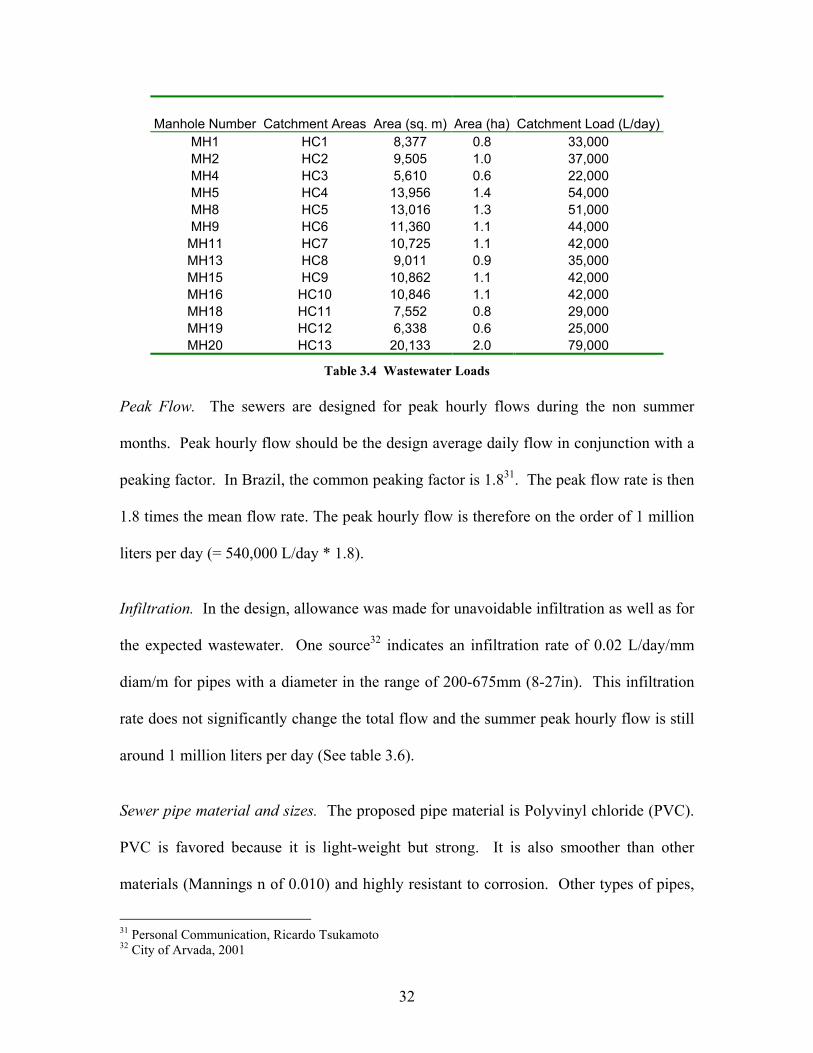
Manhole Number Catchment Areas Area (sq. m) Area (ha) Catchment Load (L/day)MH1 HC1 8,377 0.8 33,000 MH2 HC2 9,505 1.0 37,000 MH4 HC3 5,610 0.6 22,000 MH5 HC4 13,956 1.4 54,000 MH8 HC5 13,016 1.3 51,000 MH9 HC6 11,360 1.1 44,000 MH11 HC7 10,725 1.1 42,000 MH13 HC8 9,011 0.9 35,000 MH15 HC9 10,862 1.1 42,000 MH16 HC10 10,846 1.1 42,000 MH18 HC11 7,552 0.8 29,000 MH19 HC12 6,338 0.6 25,000 MH20 HC13 20,133 2.0 79,000
Table 3.4 Wastewater Loads
Peak Flow. The sewers are designed for peak hourly flows during the non summer
months. Peak hourly flow should be the design average daily flow in conjunction with a
peaking factor. In Brazil, the common peaking factor is 1.831. The peak flow rate is then
1.8 times the mean flow rate. The peak hourly flow is therefore on the order of 1 million
liters per day (= 540,000 L/day * 1.8).
Infiltration. In the design, allowance was made for unavoidable infiltration as well as for
the expected wastewater. One source32 indicates an infiltration rate of 0.02 L/day/mm
diam/m for pipes with a diameter in the range of 200-675mm (8-27in). This infiltration
rate does not significantly change the total flow and the summer peak hourly flow is still
around 1 million liters per day (See table 3.6).
Sewer pipe material and sizes. The proposed pipe material is Polyvinyl chloride (PVC).
PVC is favored because it is light-weight but strong. It is also smoother than other
materials (Mannings n of 0.010) and highly resistant to corrosion. Other types of pipes,
31 Personal Communication, Ricardo Tsukamoto 32 City of Arvada, 2001
33
such as concrete pipes (n=0.013), are susceptible to corrosion due to acid and hydrogen
sulfide attack33. Sewer pipes must have a minimum diameter to account for large objects
that may enter the sewers. The minimum pipe size is 150 mm in diameter. The pipe size
used for the historical center range from 150 to 375 mm in diameter.
Depth of cover. The depth of a sewer depends upon the depth of existing underground
structures, specifically water lines and basements. In Paraty there are no basements so
the depth of the basement is of no concern. The water distribution lines are close to the
surface as well as close to the sidewalks. Therefore the minimum pipe depth of sewers
for this design is 0.4 meter below ground surface within the historical center. In Brazil
the typical standards for minimum cover is 0.6 meters, but for the historical center since
there is no vehicle traffic, 0.4 meter is acceptable. In addition, a relatively inexpensive
geotextile can be applied above pipes to absorb pressure and allow for the shallower
depth of cover.
Depth of Excavation. A maximum excavation depth was set because it is expensive and
impractical to excavate deeper than a certain level, especially in the historical center
where the water table is high. The maximum excavation depth was set at one meter below
mean sea level. This value was based upon input from various engineers working in an
areas with a high water table much like Paraty.
Velocity. The flow within the sewers must retain a sufficient velocity in order to flush
out any solids that deposit during low flow. The typical minimum velocity for grabity
33 Metcalf and Eddy, 1981

34
pipes in Brazil as well as in the U.S. is 0.6 m/s34. Table 3.5 lists a recommendation for
PVC pipe slopes at corresponding pipe sizes. It is based on a minimum velocity, when
flowing 75% full, of 0.6 m/s.
Table 3.5 Recommended slopes for different pipe (PVC) diameters35
These slopes were a starting point when designing the sewer network. The velocity at
less than one-half full depth will be less than 0.6 m/s.
Elevation. The land in the historical center is flat. The tidal range in the region is 0.9 m
in the sea (difference between highest and lowest tide)36. Groundwater levels therefore
range between 0.5 m above mean sea level (msl) to 0.4m below msl. Since tidal flooding
has been observed in the historical center the elevation of the ground is probably around
0.3 m above msl. The elevation for modeling purposes was assumed to be 0.5 meters
above mean sea level.
Profiling and Modeling
After all the design factors and constraints were set, a more detailed profile and model of
the sewer network was created. A spreadsheet was prepared in Microsoft Excel to record
the data and steps in the computations for each section of sewer between manholes. In
conjunction with Haestad Method’s SewerCAD, the sewer invert elevations, pipe
34 Metcalf and Eddy, 1981 and Tsukamoto, 2003 35 City of Arvada, 2001 36 Personal Communication, Paulo Cesar Colonna Rosman
Diameter (mm) Slope 200 0.004 250 0.003 300 0.002

35
diameters, pipe slopes and velocities were determined by trial and error to find the best fit
design given the design factors and constraints.
SewerCAD37 is a powerful design and analysis tool that allows you to layout a collection
system, develop and compute sanitary loads, and simulate the hydraulic response of the
entire system - including gravity collection piping and pressure force mains. SewerCAD
has features such as steady-state analysis using various standard peaking factors,
extended-period simulations of complete collection systems, and advanced automatic
system design. The program provides import and export wizards to transfer data between
GIS and the model in SewerCAD. This enabled an initial layout within GIS, an import of
that layout into SewerCAD, and an export of the model back into GIS. Figure 3.5
provides a SewerCAD layout of the pipe network and Figure 3.7 that displays the profile
of the main trunk line of the optimal preliminary design. All other profiles for the
network can be found in Appendix B.
37 Haestad, 2002
36
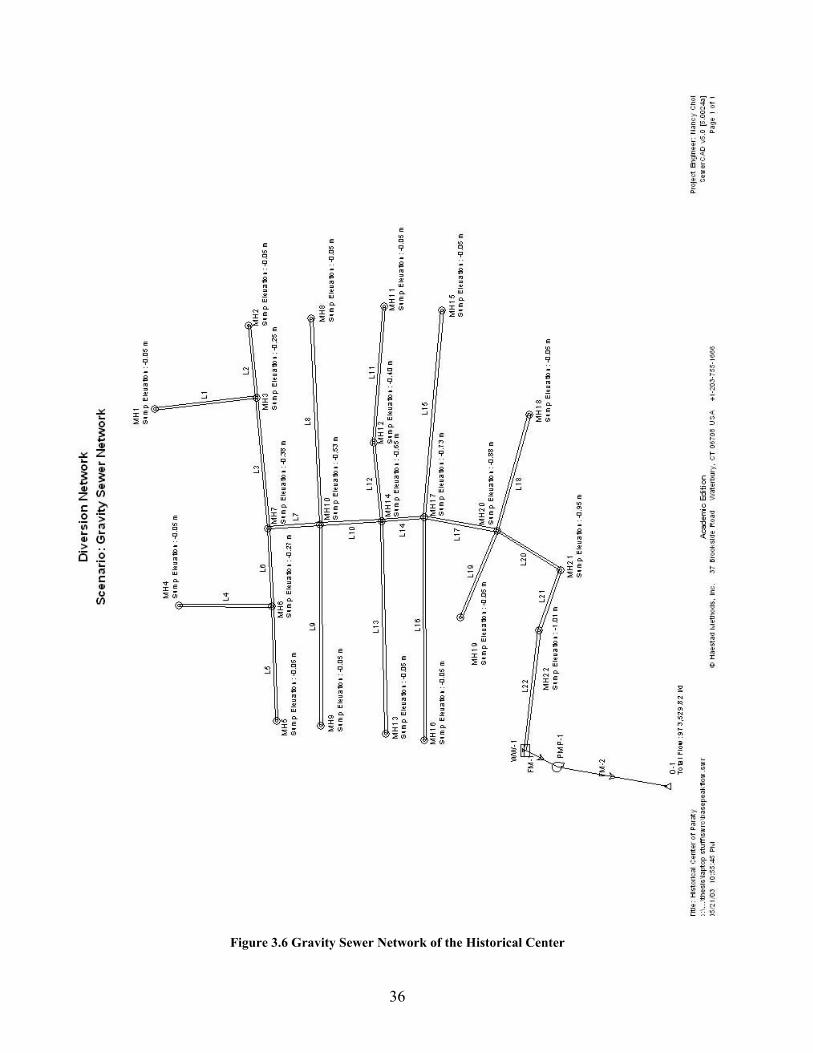
Figure 3.6 Gravity Sewer Network of the Historical Center

37
Figure 3.7 Profile of the Main Trunk Line
38
Using the loads, the sewer network components (elevation, pipe diameter, slope,
velocity) were designed for a peak hourly flow and a maximum excavation depth of one
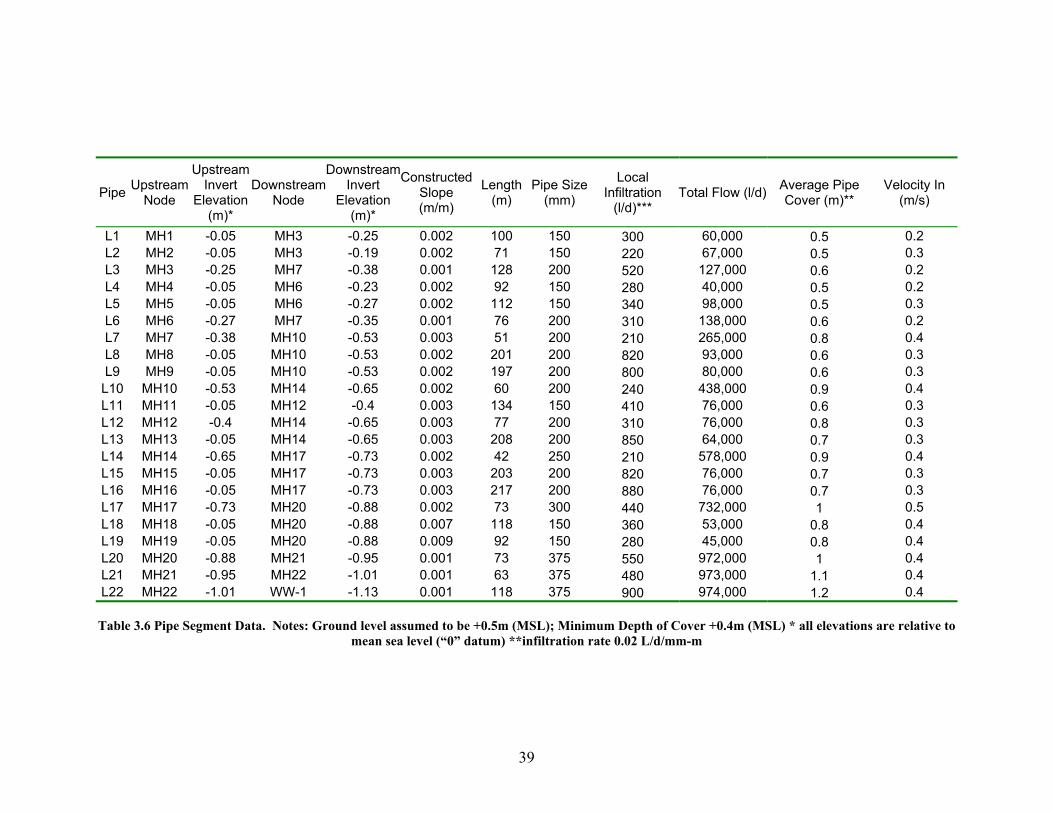
meter. Table 3.6 presents the network component data for each pipe segment. All
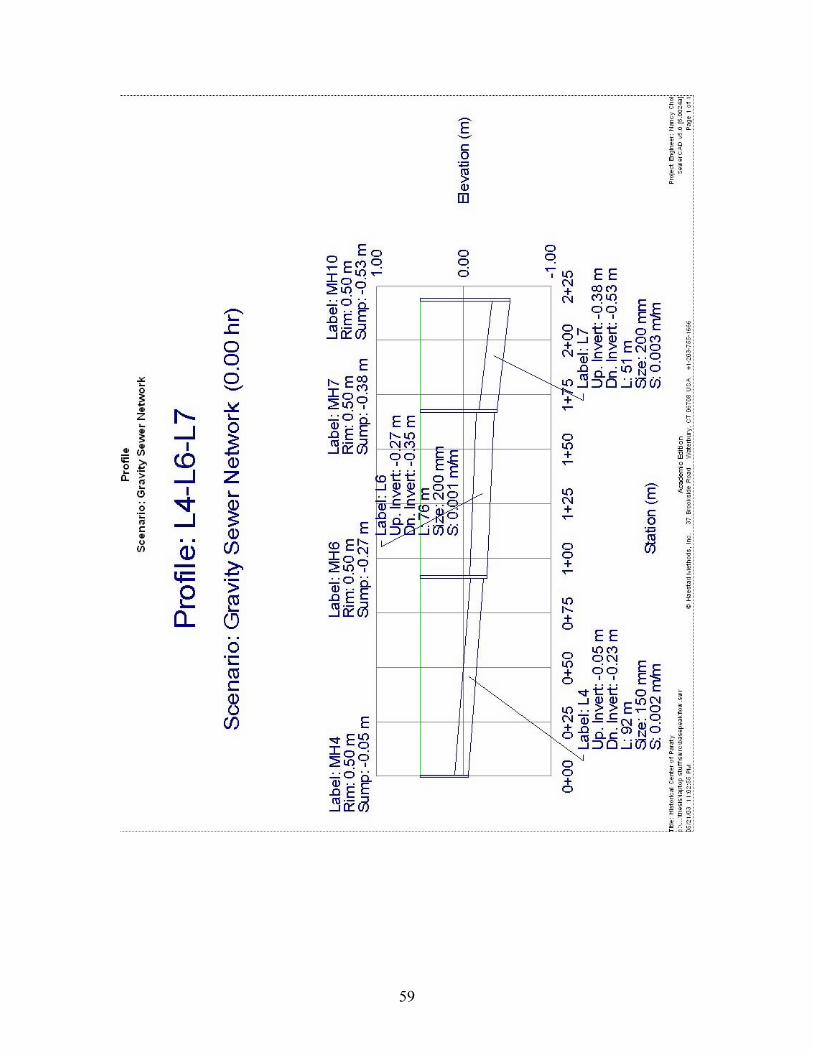
elevations were relative to mean sea level. The maximum depth of a sewer segment was
the most downstream segment, L22, with an invert elevation of around -1 m relative to
mean sea level. The length in pipe ranges from 40-200 meters and all the average pipe
depth of cover were above the minimum constraint of 0.4 meter. The contribution of
local infiltration is small compared to the total flow. The total flow of the entire system
is found at the most downstream point of 1 million liters/day. The velocities at the
upstream point of each pipe did not meet the minimum velocity requirement of 0.6 m/s.
The flow within all of the piipes were less than half full.
39
Pipe Upstream Node
Upstream Invert
Elevation (m)*
DownstreamNode
Downstream Invert
Elevation (m)*
Constructed Slope (m/m)
Length (m)
Pipe Size (mm)
Local Infiltration
(l/d)*** Total Flow (l/d) Average Pipe
Cover (m)** Velocity In
(m/s)
L1 MH1 -0.05 MH3 -0.25 0.002 100 150 300 60,000 0.5 0.2 L2 MH2 -0.05 MH3 -0.19 0.002 71 150 220 67,000 0.5 0.3 L3 MH3 -0.25 MH7 -0.38 0.001 128 200 520 127,000 0.6 0.2 L4 MH4 -0.05 MH6 -0.23 0.002 92 150 280 40,000 0.5 0.2 L5 MH5 -0.05 MH6 -0.27 0.002 112 150 340 98,000 0.5 0.3 L6 MH6 -0.27 MH7 -0.35 0.001 76 200 310 138,000 0.6 0.2 L7 MH7 -0.38 MH10 -0.53 0.003 51 200 210 265,000 0.8 0.4 L8 MH8 -0.05 MH10 -0.53 0.002 201 200 820 93,000 0.6 0.3 L9 MH9 -0.05 MH10 -0.53 0.002 197 200 800 80,000 0.6 0.3
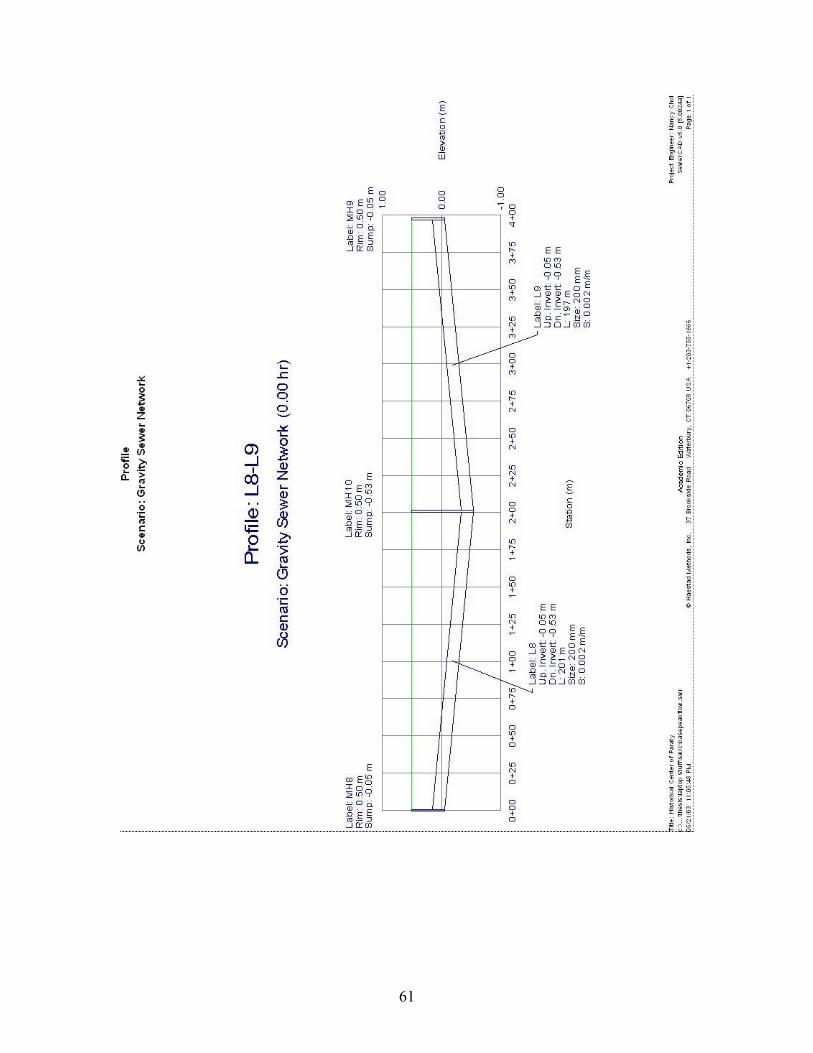
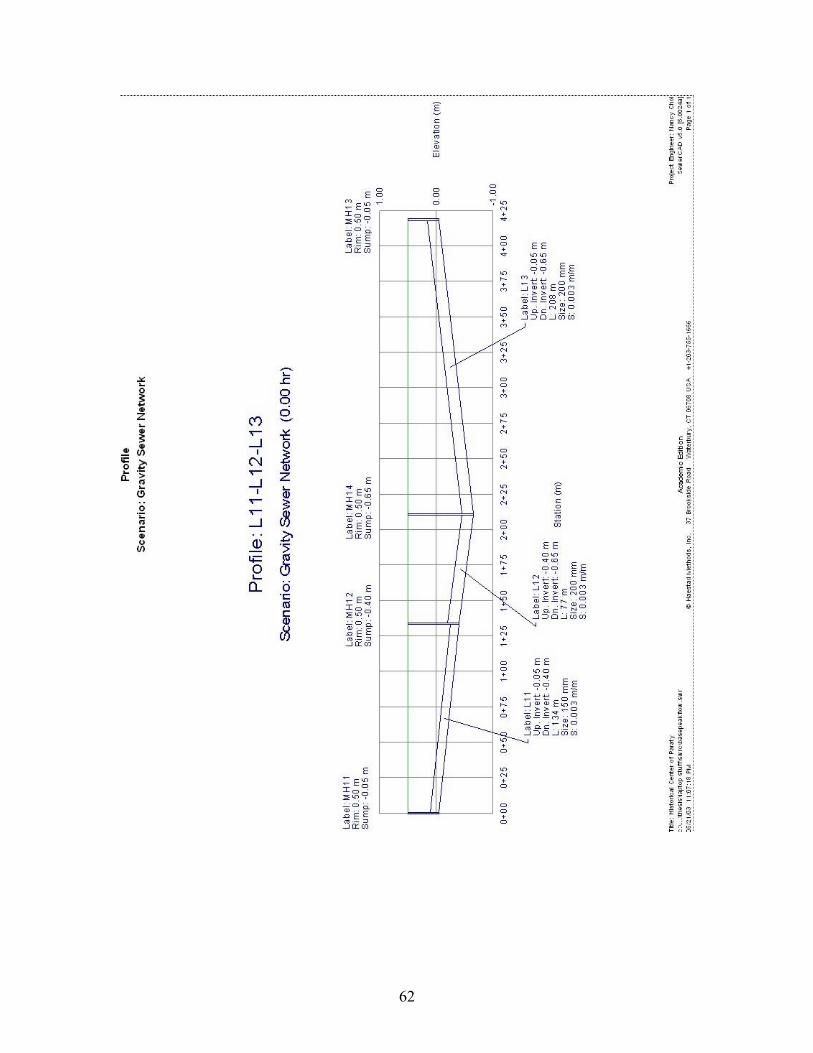
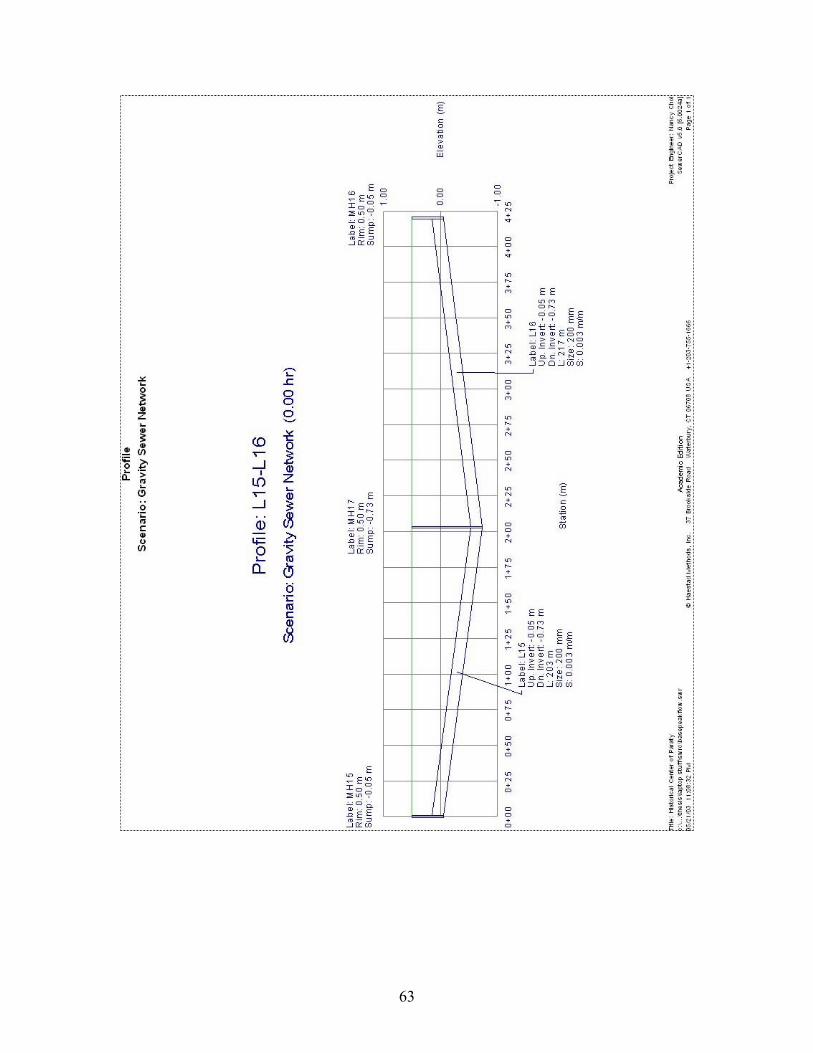
L10 MH10 -0.53 MH14 -0.65 0.002 60 200 240 438,000 0.9 0.4 L11 MH11 -0.05 MH12 -0.4 0.003 134 150 410 76,000 0.6 0.3 L12 MH12 -0.4 MH14 -0.65 0.003 77 200 310 76,000 0.8 0.3 L13 MH13 -0.05 MH14 -0.65 0.003 208 200 850 64,000 0.7 0.3 L14 MH14 -0.65 MH17 -0.73 0.002 42 250 210 578,000 0.9 0.4 L15 MH15 -0.05 MH17 -0.73 0.003 203 200 820 76,000 0.7 0.3 L16 MH16 -0.05 MH17 -0.73 0.003 217 200 880 76,000 0.7 0.3 L17 MH17 -0.73 MH20 -0.88 0.002 73 300 440 732,000 1 0.5 L18 MH18 -0.05 MH20 -0.88 0.007 118 150 360 53,000 0.8 0.4 L19 MH19 -0.05 MH20 -0.88 0.009 92 150 280 45,000 0.8 0.4 L20 MH20 -0.88 MH21 -0.95 0.001 73 375 550 972,000 1 0.4 L21 MH21 -0.95 MH22 -1.01 0.001 63 375 480 973,000 1.1 0.4 L22 MH22 -1.01 WW-1 -1.13 0.001 118 375 900 974,000 1.2 0.4
Table 3.6 Pipe Segment Data. Notes: Ground level assumed to be +0.5m (MSL); Minimum Depth of Cover +0.4m (MSL) * all elevations are relative to
mean sea level (“0” datum) **infiltration rate 0.02 L/d/mm-m
40
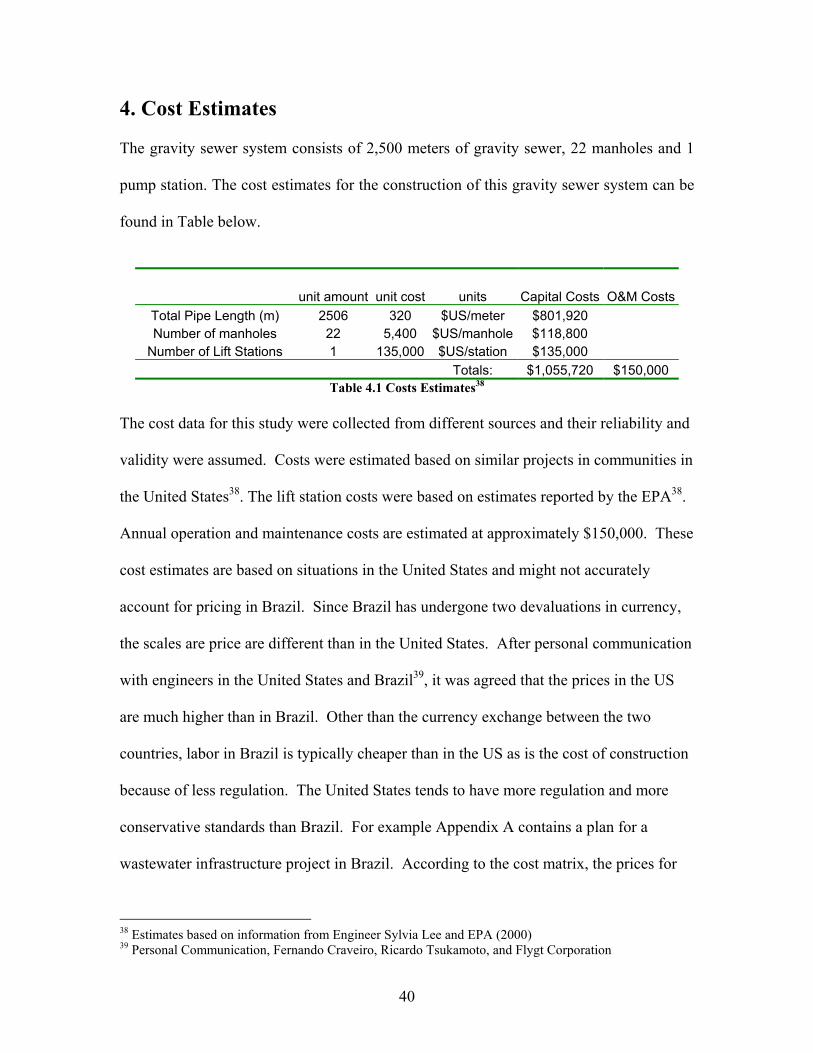
4. Cost Estimates
The gravity sewer system consists of 2,500 meters of gravity sewer, 22 manholes and 1
pump station. The cost estimates for the construction of this gravity sewer system can be
found in Table below.
unit amount unit cost units Capital Costs O&M CostsTotal Pipe Length (m) 2506 320 $US/meter $801,920 Number of manholes 22 5,400 $US/manhole $118,800
Number of Lift Stations 1 135,000 $US/station $135,000 Totals: $1,055,720 $150,000
Table 4.1 Costs Estimates38
The cost data for this study were collected from different sources and their reliability and
validity were assumed. Costs were estimated based on similar projects in communities in
the United States38. The lift station costs were based on estimates reported by the EPA38.
Annual operation and maintenance costs are estimated at approximately $150,000. These
cost estimates are based on situations in the United States and might not accurately
account for pricing in Brazil. Since Brazil has undergone two devaluations in currency,
the scales are price are different than in the United States. After personal communication
with engineers in the United States and Brazil39, it was agreed that the prices in the US
are much higher than in Brazil. Other than the currency exchange between the two
countries, labor in Brazil is typically cheaper than in the US as is the cost of construction
because of less regulation. The United States tends to have more regulation and more
conservative standards than Brazil. For example Appendix A contains a plan for a
wastewater infrastructure project in Brazil. According to the cost matrix, the prices for
38 Estimates based on information from Engineer Sylvia Lee and EPA (2000) 39 Personal Communication, Fernando Craveiro, Ricardo Tsukamoto, and Flygt Corporation

41
each of the items in the table below are much less. Since the currency in Brazil has been
changing so much in the last couple of years it is hard to compare solidly between the
two countries.
42
5. Discussion/Analysis
Due to a lack of available information, numerous assumptions and extrapolations of data
were made leaving a large margin of error. This section will discuss all the assumptions
made in the design and also explore the robustness of the system through a sensitivity
analysis. The main assumptions made were on population, flow, peaking factor,
infiltration rate, elevation, and pumping.
The collection system was designed for peak hourly flow. Several choices were involved
in determining the peak hourly flow. Paraty lacks data on wastewater flows throughout
the city. The city did however, have information on potable water use, which is often a
valid indicator of wastewater flow when actual data does not exist. This goes in line with
the idea of continuity, that what goes in (potable water), must come out (wastewater).
The water use was based on per person per day consumption, so a population of the
historical center needed to be found to find an appropriate wastewater flow for the area.
The base yearly population as well as the the three fold increase in the summer tourist
season were both assumptions made by observations of people of the city. In order to
separate the total wastewater flow into each catchment area, it was assumed that flow is
evenly distributed throughout the city. In this preliminary design it was not necessary to
get an exact measure of the wastewater flow. In a survey conducted by the city the
historical center contains about 700 properties40. Of those 700, 400 are residential, 200
are commercial, and the rest are other types of property (includes vacant lots). Another
method to quantify the flows would be to break down the area by property and take
40 Prefeitura Municipal de Paraty, 2002
43
typical wastewater flows for each type of property. For example in Brazil a high class
house typically has a wastewater flow rate of 150 L/person/day, a hotel discharges 100
L/person/day, and a restaurant has flows of 25 L/meal/day41. However because there is
not an explicit detailed breakdown of the types and locations of each property, many
more assumptions would need to be made. Therefore, the result from taking the
population and average water consumption data is the most appropriate number for this
preliminary design.
In the proposed system it is found that pipe flow is not half full, and therefore it is
unknown what an acceptable minimum velocity would be. However changing some
parameters such as pipe diameters or pipe roughness coefficient has a lot of effect to flow
and velocity and hence sediment transport in the pipes. Since there are assumptions
being made, a sensitivity analysis was performed to look at different flows and the affects
of different magnitudes of flow on the wastewater velocity within the pipes as well as the
total overall flow capacity. In order to see the effects of different magnitudes of load, the
peaking factor was varied in order to see the robustness of the designed system.
Typically an hourly peaking factor of 1.8 is used in Brazil42. Figure 5.1 shows the affect
of different peaking factors on the velocities within the pipes. Many of the points overlap
and therefore cannot be seen. It is important to note the trend of increasing velocities
with increasing peaking factors.
41 Tsukamoto, 2003 42 Tsukamoto, 2003

44
0
0.1
0.2
0.3
0.4
0.5
0.6
0.7
0.8
0.9
0 1 2 3 4 5 6 7
Peaking Factor
Velo
city
(m/s
)
L1L2L3L4L5L6L7L8L9L10L11L12L13L14L15L16L17L18L19L20L21L22
Figure 5.1 Velocity versus Peaking Factor
It can be seen in the figure above that the velocity in many branches is less than 0.6 m/s.
This means some deposition of sediment may occur. However after some preliminary
studies of Paraty’s wastewater43, there does not appear to be much sediment or suspended
solids. Therefore the lower velocities may be effective in self cleansing mechanisms.
This suggests that the design needs to be further calibrated with an acceptable minimum
velocity and that periodic cleanouts may be needed for the system if deposition of
sediment is to occur in the off peak seasons. The system has the capability to handle a
peaking factor of about 6, where above that point, the sewers and manholes become
flooded and pressurized. This limit to capacity may be a reflection of the capacity of the
pumping station. It is observed that the pump operation has a lot of effect on the systems
43 Kfouri and Kweon, 2003

45
operation. Different pump operation curves can give different flow conditions in pipes.
For the purpose of the preliminary model, a single point pump was used which had a
specified design head of 5 meters and a discharge of 2.5 m^3/min. This basic pump was
used to represent a pumping station but was not meant to be an exact model of an actual
station that will need to be built. Refinement of pump operation rules are needed but will
not be addressed in this model. The pumping station is necessary for this network as the
depth of excavation at the final collection point of the entire catchment area is at a
maximum.
Another analysis was performed on the effect the peaking factor as well as the
infiltration rate had on the total flow. The figures below show that obviously as either
factor increases, the total flow will increase. The impact the peaking factor has on the
total flow is much greater than the impact of a change in infiltration rates. There is about
a four fold difference between the slopes of the two trends. Since the infiltration rate
does not have such a profound effect on the total flow within small ranges, the accuracy
of the infiltration rate assumption is not as large a factor as other assumptions, as shown
here. The concern is whether the infiltration rate is extremely underestimated because at
smaller infiltration rates, the amount of infiltration is not a significant portion of the flow.
This can be noted in the results for the proposed design in Table 3.6. If the infiltration
rates are vastly underestimated however, the potential affect on the system is great
because it will contribute a majority of the flow. This is highly unlikely however,
especially with a new system with PVC pipes.

46
0
500000
1000000
1500000
2000000
2500000
3000000
3500000
0 1 2 3 4 5 6 7
Peaking Factor
Tota
l Flo
w (L
/day
)
Figure 5.2 Total Flow versus Peaking Factor
0
500000
1000000
1500000
2000000
2500000
3000000
3500000
0 1 2 3 4 5 6
Infiltration Rate (L/day/mm-m)
Tota
l Flo
w (L
/day
)
Figure 5.3 Total Flow versus Infiltration Rate
A third sensitivity analysis was performed on the roughness coefficient of the pipes. The
range of coefficients studied was 0.010 to 0.013. The velocity of each segment was
observed with the range of roughness coefficients. Most manufacturers have advocated
the smaller n value for plastics, but some guides recommend using a Manning n value of
0.013 for a new sewer regardless of the smoother material. As seen in Figure 5.4, the
velocities of flow within the pipes decrease as the roughness coefficient increases.
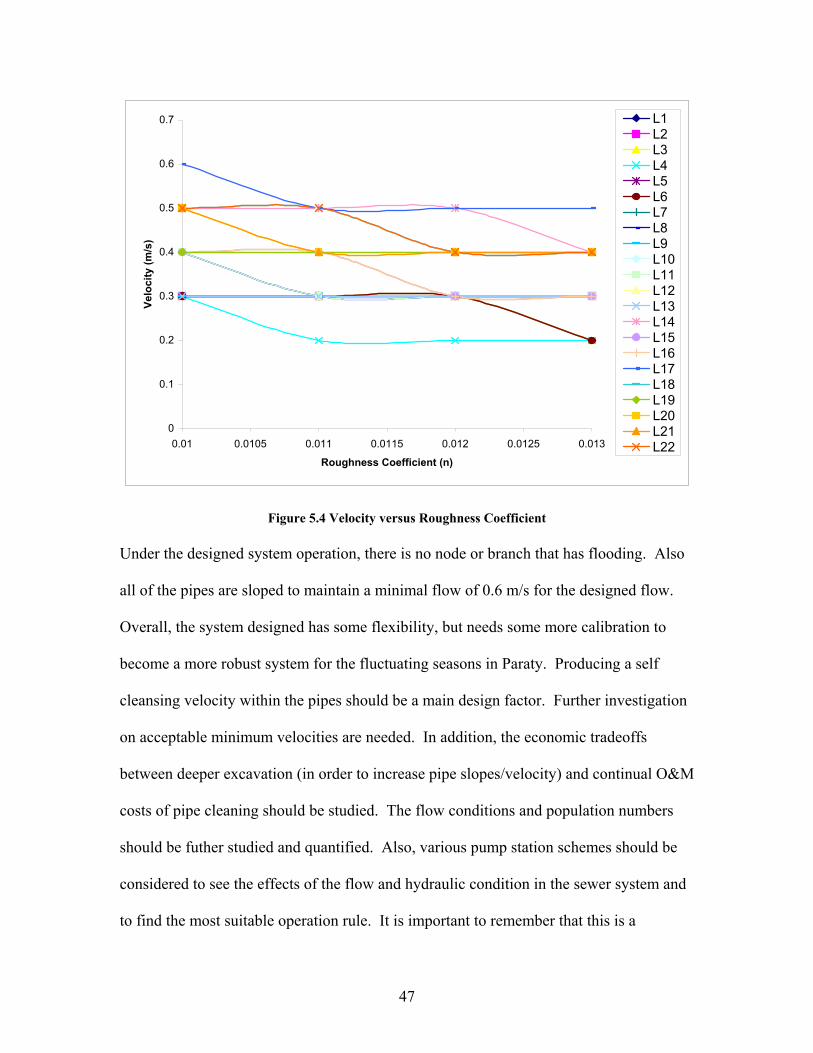
47
0
0.1
0.2
0.3
0.4
0.5
0.6
0.7
0.01 0.0105 0.011 0.0115 0.012 0.0125 0.013
Roughness Coefficient (n)
Velo
city
(m/s
)
L1L2L3L4L5L6L7L8L9L10L11L12L13L14L15L16L17L18L19L20L21L22
Figure 5.4 Velocity versus Roughness Coefficient
Under the designed system operation, there is no node or branch that has flooding. Also
all of the pipes are sloped to maintain a minimal flow of 0.6 m/s for the designed flow.
Overall, the system designed has some flexibility, but needs some more calibration to
become a more robust system for the fluctuating seasons in Paraty. Producing a self
cleansing velocity within the pipes should be a main design factor. Further investigation
on acceptable minimum velocities are needed. In addition, the economic tradeoffs
between deeper excavation (in order to increase pipe slopes/velocity) and continual O&M
costs of pipe cleaning should be studied. The flow conditions and population numbers
should be futher studied and quantified. Also, various pump station schemes should be
considered to see the effects of the flow and hydraulic condition in the sewer system and
to find the most suitable operation rule. It is important to remember that this is a

48
conceptual preliminary design. Further investigations should also be made into vacuum
sewerage in addition to gravity sewerage. While it may be best to stay uniform
throughout the city with a gravity system, a feasibility study should still be looked into
the apparently cheaper vacuum system. The results from this study suggest that a gravity
collection system is a feasible and viable option for the historical center of Paraty.
49
6. System Recommendations
Several options exist for the construction of a wastewater collection system to serve the
historical center of Paraty. Based on a review of current and future service areas,
projected wastewater flows, topography, collection system and transport options, capital
costs, and operation and maintenance costs, a conventional gravity collection system is
recommended. The capital cost is estimated to be around $1.1 million with an annual
operation and maintenance cost of $150,000.
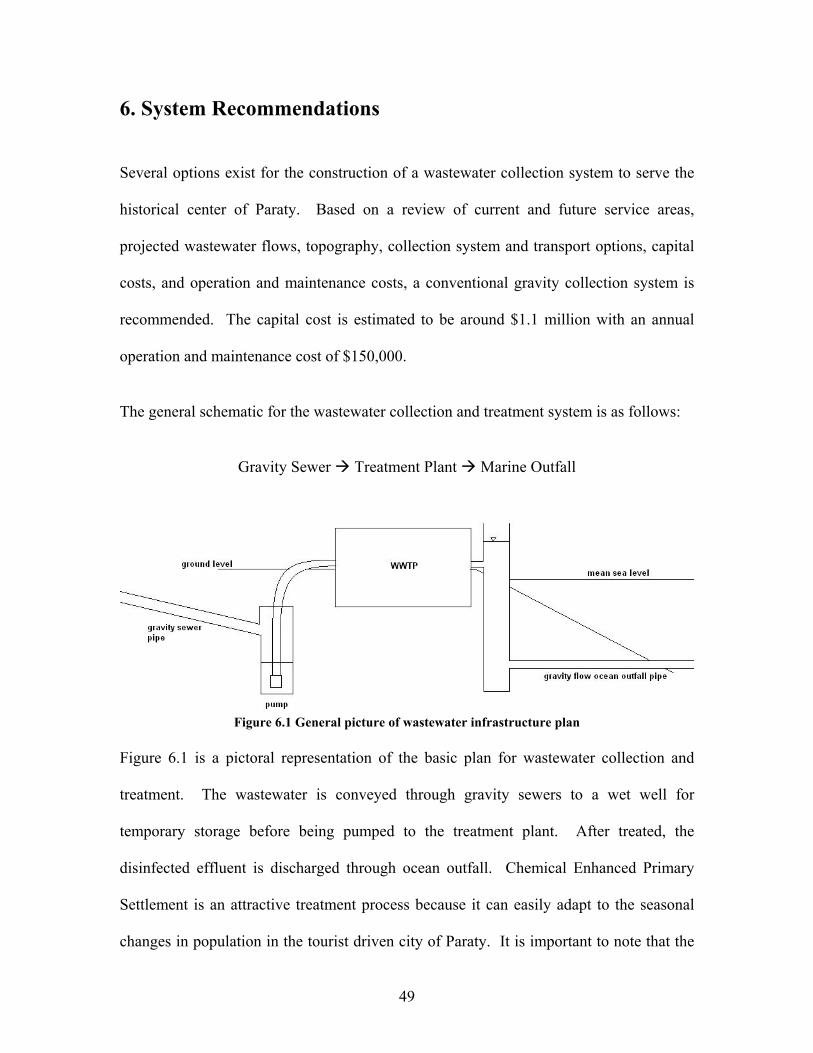
The general schematic for the wastewater collection and treatment system is as follows:
Gravity Sewer Treatment Plant Marine Outfall
Figure 6.1 General picture of wastewater infrastructure plan
Figure 6.1 is a pictoral representation of the basic plan for wastewater collection and
treatment. The wastewater is conveyed through gravity sewers to a wet well for
temporary storage before being pumped to the treatment plant. After treated, the
disinfected effluent is discharged through ocean outfall. Chemical Enhanced Primary
Settlement is an attractive treatment process because it can easily adapt to the seasonal
changes in population in the tourist driven city of Paraty. It is important to note that the
50
head of the effluent from the treatment plant must be high in order to maintain a gravity
flow ocean outfall. The collection system is designed for peak hourly flow of 1 million
L/day. The wastewater treatment plant should be sized for the average daily flow of
500,000 L/day.
There are three possibilities to install the gravity sewers – 1) revive and reuse existing
structures, 2) noninvasive, nondestructive installation, and 3) trench excavation.
Revive and reuse existing structures. It is recommended to review and explore the
condition of the existing collection structures in the historical center. Although the
system itself probably could not be used for a wastewater collection system directly,
perhaps it could be cleaned and used for a new collection system to be layed within the
existing structures. The existing collection system consists of 1 meter in length sections
of concrete pipe with a diameter of about 1 meter, making it more than possible for the
new pipes to fit inside.
Noninvasive, nondestructive installation. Microtunneling is a process that uses a
remotely controlled Microtunnel Boring Machine44 (MTBM) combined with the pipe
jacking technique to directly install product pipelines underground in a single pass. This
process avoids the need to have long stretches of open trench for pipe laying, which
causes extreme disruption to the community. This process can be extremely cost
effective and cost efficient for a place like the historical center, where the water table is
high and the buildings are old.
44 http://www.huxtedtunnel.com

51
Trench excavation. Open trench excavation is the traditional method of installing sewer
pipes. This installation process could be favored over the two previously mentioned ones
because of the added benefit projects of rehabilitating the roads and burying electrical
lines. The streets within the historical center are in horrible position because of a road
renovation in the past where the stones in the roads were placed back misaligned. Given
this project, excavation would be favored to provide an opportunity o renovate the exist
roads as well as place all electrical wires underground. Another qualification for the
UNESCO recognition is to place all electrical wires underground. If these additional
projects were to be taken, much planning would be needed to organize a much larger
project.
Further study needs to be taken in all three of these possibilities as well as in further
designing for a gravity sewer collection system. This project provided a conceptual
design as well as a feasibility study of a design for the historical center of Paraty. May
any further developments to this project provide as a model for the rest of the city for
future expansion and planning.
A strong recommendation is given to the city to plan for both a wastewater collection
system and a wastewater treatment system. The two components should not stand alone
and another strong recommendation is made to look into the treatment of Paraty’s
wastewater by Chemically Enhanced Primary Treatment.

52
7. Conclusions
This thesis proposes a conceptual design of a gravity collection system for the historical
center of Paraty, Brazil. The report investigated wastewater flow requirements,
wastewater collection and transport alternatives, possible wastewater treatment plant
locations, capital requirements, and operation and maintenance costs.
Four criterions were used to choose gravity sewers as the system of collection in the
historical center. The criteria were economics, expandability, adaptability and simplicity.
The results of the analysis concluded that the two major systems to consider would be a
vacuum system and a gravity system. Although the study revealed that a vacuum system
might be less expensive to construct, there were other costs that factored in the decision
to pursue a gravity collection system. One hindering cost for the vacuum system was the
future operation and maintenance of such a relatively new technology in a city that does
not have much expertise or knowledge with collection systems. It has been concluded
that for the city of Paraty, a uniform, consistent, simple collection system would be the
most appropriate.
As a result of the feasibility study, it is recommended that the city of Paraty pursue
construction of a gravity sewer system, pumping stations, and a wastewater treatment
plant. This appears to be the best fit solution for the community. Paraty is in need of
infrastructure development and the construction of wastewater collection facilities will
allow Paraty to minimize the impact of wastewater on public health and environmental
resources.

53
Appendix A
Plan for Manguera – Summary and rough translation of plan described in “Programa
Morar Melhor – Acao Saneamento Basico Plano de Trabalho: Tronco Coleter Estacao de
Tratamento de Esgotos”
Cost of project: R$643200.00
The work consists of the construction of 1800 meters of a gravity main collector of 200
mm in diameter of PVC. There are 25 manholes with a medium height of 2.5 meters and
a wastewater treatment plant using slime with a capacity for 5,000 inhabitants (60
m^3/hour). The intent is to handle approximately 16.6% of the urban population of the
mucipality.
The Station of handling as well as the log collector that will be built and maintained by
the Municipal city Hall of Paraty, specifically from the Municipal Office of the secretary
of Works.
Type Material Unit Quantity Cost (R$) Construction Time (Months)
Trunk Collector PVC 200 mm Meter 1800 114,229.99 3 Manholes Concrete NA 25 12,740.42 3
Pump Station Premade NA 1 26,048.00 3
Treatment Plant Capacity: 60 m^3/hr NA 1 398,106.47 3
Table A.1 Cost Estimates
Population to benefit from project:
Actual population - 4000, 800 families
Projected population and design - 5000, 1000 families
54
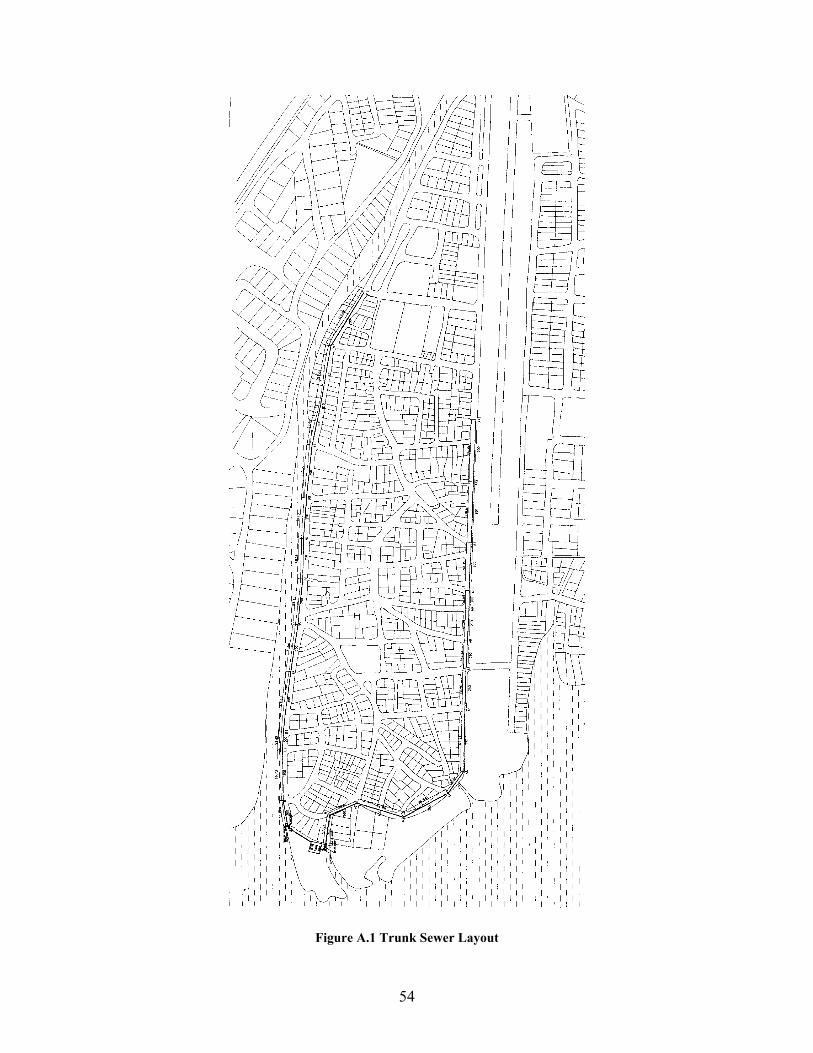
Figure A.1 Trunk Sewer Layout

55
Appendix B
Profile Drawings
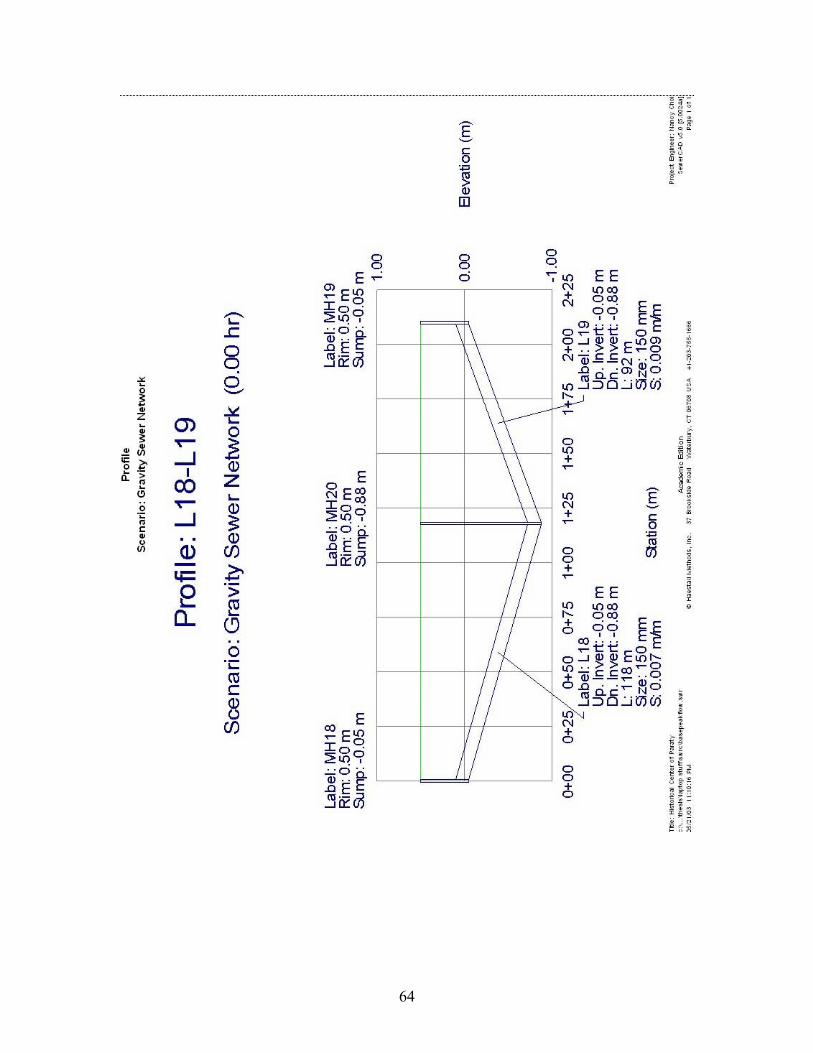
All these profiles were created using Haestad Method’s SewerCAD.

56

57

58
59

60
61
62
63
64
65
References
Arvada, City of. Minimum Design Standards Section 110 Sanitary Sewers. Arvada, Colorado: http://www.ci.arvada.co.us/HTML/Spec_Book/New-S-SEC110-2001.pdf, 2001. Craveiro, Fernando. Personal communication with Regional Water Business Group Manager CH2M HILL of Brazil. May 2003. Flygt Corporation. Personal communication with Engineer. May 2003. Haestad Mathods. Computer Applications in Hydraulic Engineering – Connecting Theory to Practice. 5th ed. Waterbury: Haestad Press, 2002. Harrington, Brian. Personal communication with Engineer at Metcalf and Eddy. March 2003. Hassett, Alan F. Vacuum Sewerage – Ready for the 21st Century. Proceedings from “Sewers of the Future” Conference, September 10-13, 1995, Houston Texas. Published in Virginia: Water Environment Federation, 1995. James P. Heaney, Robert Pitt, Richard Field. Innovative Urban Wet-Weather Flow Management Systems. Cincinnati: U.S. Environmental Protection Agency, 1999. Kfouri, Claire and Hyo Jin Kweon. Seawater as a Substitute Coagulant and Effects on Disinfection in Chemically Enhanced Primary Treatment: A Case Study of Paraty, Brazil and Deer Island, Boston. Thesis (M. Eng.) – Massachusetts Institute of Technology, Dept. of Civil and Environmental Engineering, 2003. Klink, Tymur. Personal communication with architect and land owner in Paraty. January 2003. Lee, Sylvia. Personal communication with Engineer at Montgomery Watson Harza. January – May 2003. Metcalf and Eddy. Wastewater Engineering: Collection and Pumping of Wastewaster. New York: McGraw-Hill, 1981. Prefeitura Municipal de Paraty. Divisao de Vigilancia Sanitaria. Paraty: GPO, 2002. Prefeitura Municipal de Paraty. Programa Morar Melhor – Acao Saneamento Basico Plano de Trabalho. Paraty: GPO, December 2001. Prefeitura Municipal de Paraty. Vigilancia da Qualidade da Agua de Consumo Humano – VQACH. Paraty: GPO, 2001.

66
Rocha, Wilson. Personal interview with past water and sanitation engineer for Paraty. January 2003. Rosman, Paulo Cesar Colonna. Personal communication with Professor at the Universidade Federal do Rio de Janeiro, 14 April 2003. Sarasota County Environmental Services. “Evaluation of Onsite Wastewater Treatment and Wastewater Collection System Alternatives.” Phillippi Creek Septic System Replacement Program: September 2000 Executive Summary TM No. 7 (2000). Shamsi, U.M. GIS Tools For Water,Wastewater and Stormwater Systems. United States: ASCE Press, 2002. Tsukamoto, Ricardo. Personal communication with Engineer and concerned citizen of Paraty. January – May 2003. U.S. Department of Commerce. Market Assessment. http://strategis.ic.gc.ca/SSG/dd73927e.html: STAT-USA on the Internet, 1999. U.S. Environmental Protection Agency. Collection Systems Technology Fact Sheet: Sewers, Lift Station. Washington D.C.: U.S. Government Printing Office, September 2000. U.S. Environmental Protection Agency. Manual: Alternative Wastewater Collection Systems for Small Communities. Washington D.C.: U.S. Government Printing Office, October 1991.
You, Eun Chu. Policy for Development of Water and Sanitation Infrastructure in Paraty, Brazil. Thesis (M. Eng) – Massachusetts Institute of Technology, Dept. of Civil and Environmental Engineering, 2003.