design of flexible pavements - · pdf filedesign traffic as per irc sp20:2002 traffic is...
TRANSCRIPT

DESIGN OF FLEXIBLE PAVEMENTS
for Low Volume Roads - IRC SP 72:2007
Dr. CSRK Prasad
NIT, Warangal

3/16/2012 CSRK PRASAD NIT WARANGAL
MYTH
Rural Roads Require no Design
Rural Roads will not Have High Traffic Loads
Iron-tyred Animal Drawn Vehicles do not Cause Significant Damage
Rural Road Construction require no Soil and Material Investigation
Thumb Rule Design will be Adequate for Rural Roads
CONSEQUENCE
Considerable length of Rural Roads built every year using Resources of Different Rural Developmental Programmes fail Prematurely

3/16/2012 CSRK PRASAD NIT WARANGAL
Objectives of Pavement Design
To provide a stable surface under the
wheel loads.
To provide good riding surface.
To have durability.
To have cost effectiveness

3/16/2012 CSRK PRASAD NIT WARANGAL
Problems
High Moisture
Weak and Soft Sub-grade
Yielding under Heavy Wheel Loads
Unevenness
Increased VOC
Discomfort
Fatigue

3/16/2012 CSRK PRASAD NIT WARANGAL
Requirements of Pavements
Stable, Non Yielding Surface
To limit elastic deformation
Least Rolling Resistance
Smooth Riding Surface
Transfer Stresses over a Wider Area on Soil Sub-grade
To arrest capillarity

3/16/2012 CSRK PRASAD NIT WARANGAL
Structural Requirements
Traffic loads
Load repetition
Climatic variables (rain, temperatures)
Environmental factors

3/16/2012 CSRK PRASAD NIT WARANGAL
Functional Requirements
Riding comfort
Economic operation
Safe operation

3/16/2012 CSRK PRASAD NIT WARANGAL
Choice of Type of Pavement
Gravel Roads
Flexible Pavement (BT Surface)
Cement Concrete Pavement

3/16/2012 CSRK PRASAD NIT WARANGAL
FACTORS GOVERNING CHOICE OF
PAVEMENT
o Initial Cost
o Rainfall and Temperature
o Type and Strength of Soil along the Alignment
o Availability of Good Aggregates
o Availability of Industrial Wastes (Fly ash, Slag etc.) in the Proximity

3/16/2012 CSRK PRASAD NIT WARANGAL

3/16/2012 CSRK PRASAD NIT WARANGAL
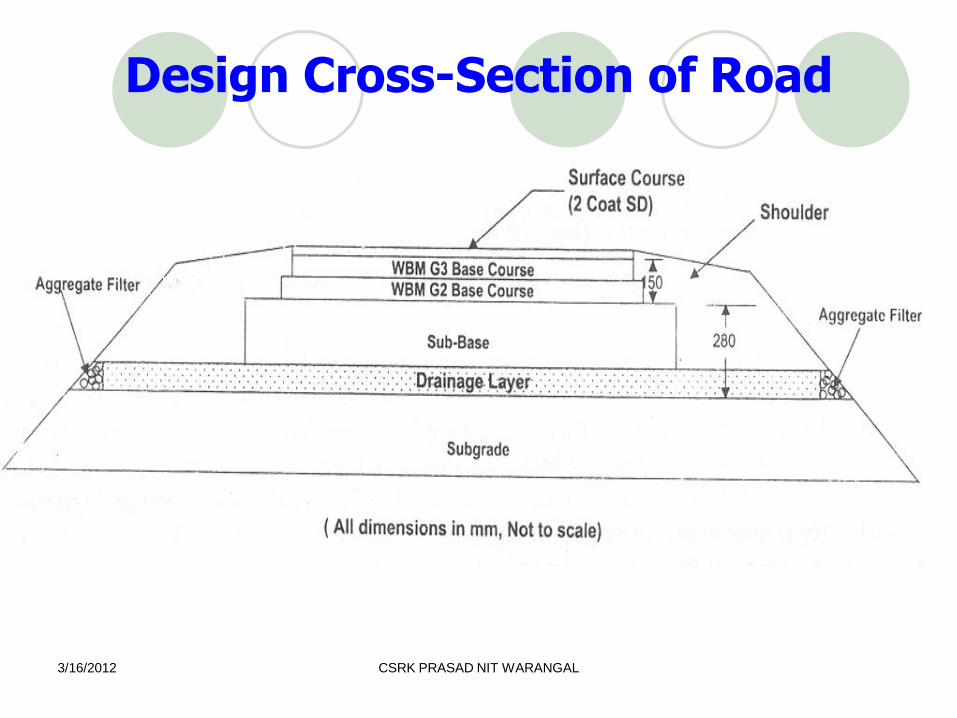
Wearing Course
Base Course
Sub Base
Sub Grade
Pavement Component Layers
3/16/2012 CSRK PRASAD NIT WARANGAL
Design Cross-Section of Road

3/16/2012 CSRK PRASAD NIT WARANGAL
Functions of Sub-base and
Base Courses
To Provide Stress Transmitting Medium
To Spread Wheel Loads
To Prevent Shear and Consolidation
Deformation
Functions of Wearing Course
Seal and protect the base and provides
strength at the road surface
Transmit to the base the vertical and
horizontal forces imposed by moving traffic
Protect the pavement from moisture ingress
Improve safety by providing a superior skid
resistance surface, free from corrugations,
dust and mud
Prevent gravel loss
3/16/2012 CSRK PRASAD NIT WARANGAL

3/16/2012 CSRK PRASAD NIT WARANGAL
Factors Influencing Design
• Design Traffic
• Sub-grade Soil Strength
• Climatic & Environmental Factors
• Pavement Component Materials

3/16/2012 CSRK PRASAD NIT WARANGAL
Design Traffic
Gross Wheel load, ‘P’
Contact pressure, ‘p’
Multiple wheel load and ESWL
Repetition of wheel load and EWL factors
Cumulative standard axles, CSA in msa
Other factors - pavement width and
coverage or lane distribution factor,
speed etc.

Design Traffic
1. DESIGN WHEEL LOAD
AXLE LOAD
Revised = 10.2 t
Old = 8.17 t
2. TYRE INFLATION
PRESSURE
1.2 – 7 – 14 Kg/Sq.Cm
1/3W 2/3W

3/16/2012 CSRK PRASAD NIT WARANGAL
3. TOTAL LOAD 0 2 4 6 8 10 12
25
50
75
100
125
1.8t
36t
De
pth
-Cm
Vertical Stress Kg/Cm
2P
P
d/2 2S
LOG DEPTH
LO
G L
OA
D
4. ESWL
Up to d/2
- independent, P
Beyond 2s
- overlap, Single
load 2P
In Between
-Interpolate
Bullock cart
Truck

Design Traffic as per IRC SP20:2002
Traffic is evaluated in terms of number of CommercialVehicles Per Day (CVPD).
Design Curves A, B, C, D for different categories of trafficnamely 0-15, 15-45, 45-150 and 150-450 CVPD.
Limitations:
Categorization of Commercial vehicles include heavycommercial vehicles like trucks or full size buses, lightcommercial vehicles like tractors, tractor trailers, pick upvans, mini buses and tempos.
No distinction made between laden, unladen andoverloaded vehicles.

Design Traffic as per IRC SP72:2007
Traffic intensity in terms of cumulative 80kN (8.16tonnes) Equivalent Standard Axle Load (ESAL)applications during the design life.
For Low Volume Roads the maximum ESALconsidered is 1 million in its design life.

Estimation of Design Traffic
New Roads: Carry out traffic counts on an
existing road, preferably in the vicinity with similar
conditions.
Upgradation / Rehabilitation of Existing Roads:
actual traffic counts on existing road.
3 day count, both during peak harvesting season and
also during the lean season for various vehicle types
Carry out classified Traffic Volume Count with laden
and unladen categorization for motorized commercial
vehicles of gross laden weight of 3 tonnes and above.

Adjustment for Seasonal Variations
Annual Traffic = T x 365 + 2nT [0.6 t]
Average Annual Daily Traffic (AADT)= T + 1.2nTt
365

Axle Equivalency factors
Equivalency Factor = (W/Ws)4
W = Single axle load (in KN) of the rural
vehicle
Ws = Single axle load of the Standard
Commercial Vehicle (Generally Taken
as 80KN)
3/16/2012 CSRK PRASAD NIT WARANGAL

Equivalency Factors for different Axle Loads
Axle Load Equivalency
Factor(Tonnes) kN
3.0 29.4 0.02
4.0 39.2 0.06
5.0 49.1 0.14
6.0 58.8 0.29
7.0 68.7 0.54
8.0 78.5 0.92
9.0 88.3 1.48
10.0 98.1 2.25
11.0 107.9 3.30
12.0 117.7 4.70
13.0 127.5 6.40
14.0 137.3 8.66
15.0 147.1 11.42

Vehicle Damage Factor (VDF)
Vehicle Type Laden Unladen /
Partially Laden
HCV (Heavy trucks & full-
sized buses)
2.86 0.31
MCV (Tractor-trailers,
Mini buses, pick-up vans)
0.34 0.02
3/16/2012 CSRK PRASAD NIT WARANGAL
VDF is a multiplier for converting the number of
commercial vehicles of different axle loads to the
number of standard axle load repetitions and it is
defined as “equivalent number of standard axles per
commercial vehicle”.
Traffic Growth Rate
Trend Analysis
Tn = T0(1+r)n
Econometric model
Recommended growth rate – 6%
Design Life – 10 years
3/16/2012 CSRK PRASAD NIT WARANGAL

Estimation of Design Traffic Assuming a uniform traffic growth rate r (6%) and
design life of n years (10 years) the cumulativeESAL applications (N) may be obtained as
N= T0 X 365 X (1+0.01r) n -1 X L
0.01r
= T0 X 365 X (1+0.06) 10 -1 X L
0.06
= T0 X 4811 X L
Where T0= ESAL per day = number of commercial vehicles per dayin the year of opening X VDF
and L = Lane distribution factor;
= 1 for single lane/ intermediate lane, and
= 0.75 for two-lane roads

Correction factor for Solid Wheeled Carts (SWC)

Traffic Categories
The final design traffic is classified into 7 categories asshown below:
Traffic Category Cumulative ESAL Applications
T1 10,000–30,000
T2 30,000–60,000
T3 60,000–100,000
T4 100,000–200,000
T5 200,000–300,000
T6 300,000–600,000
T7 600,000–1,000,000

Cumulative ESAL for 10 year Design Life
3/16/2012 CSRK PRASAD NIT WARANGAL
ADT CVPD Break up of CV Cumulative
ESALHCV MCV
100 25 0 25 19,380
150 35 5 30 60,969
200 50 10 40 96,482
300 75 15 60 149,952
400 100 20 80 192,961
500 125 25 100 257,225
1000 300 60 240 663,120
• CV – HCV (0 to 20%); MCV (80%)
10% of CVPD are overloaded to the extent of 20% of the
maximum permissible load

3/16/2012 CSRK PRASAD NIT WARANGAL
Sub-grade “Subgrade can be defined as a compacted
layer, generally of naturally occurring local soil,
assumed to be 300mm in thickness, just
beneath the pavement crust, providing a
suitable foundation for the pavement.”
Soil type and index properties
Strength properties (CBR, K - value
or E-value)
Drainage characteristics

Subgrade Strength Evaluation
as per IRC SP20:2002
Subgrade strength parameter is evaluated in terms of 4 -day soaked CBR, except in areas with annual rainfall lessthan 500 mm and where the water table is too deep.

Subgrade Strength Evaluation
as per IRC SP 72 2007
During soil survey depth and fluctuation ofground water table need to be recorded.
Minimum 3 samples are to be taken per kmlength.
Simple classification tests (wet sieve analysis,liquid and plastic limits) are to be carried out toidentify soil group. And then to identify uniformstretches.
For each of the soil groups identified, at leastone CBR test should be conducted.

Subgrade CBR Evaluation for the Design of
New RoadsThe following 4 methods are available for the estimation ofsubgrade CBR:
By IS Soil classification.
By using nomograph based on wet sieve analysis.
By empirical formulae.
By conducting actual CBR ( For each one kmlength, at least one CBR test, in case there is novariation in the soil type).
Typical presumption design CBR ValuesDescription of Subgrade
Soil
IS Soil Classification Typical Soaked CBR
Value (%)
Highly Plastic Clays and
SiltsCH, MH * 2-3
Silty Clays and Sandy
Clays
ML, MI
CL, CI4-5
Clayey Sands and Silty
SandsSC, SM 6-10

3/16/2012 CSRK PRASAD NIT WARANGAL
Nomo graph for
Computing Soaked
CBR value from Wet
Sieve Analysis
0
50
10
3020
60
40
1
1
90
2
80
100
70
0
50
10
3020
60
40
90
80
100
70
DX2
50
10
30
20
60
40
90
80
100
70
C
B
T
0
6
2
3
7
10
9
12
8
1
30
5040
B
S
%Passing 425
Micron & Retained
on 75 Micron IS
Sieve
% Passing 75
Micron Sieve
Pro
jecte
d V
alu
e F
rom
AA
+
Pe
rce
nt R
eta
ine
d o
n 4
25
Mic
ron
IS
Sie
ve
So
ake
d
C.B
.R(%
)
STEPWISE PROCEDURE
1. Mark the % passing 75 µ ISS
on axis 1-1; join with fixed point
X and extend to axis AA (Say,
at S)
2. Mark the % fraction (-425 µ,
+75 µ) on axis 2-2; join with
fixed point X and extend to axis
AA (SAT, AT T)
3. Starting with O on axis BB,
mark OC-ST. Further ADD the
% fraction (+425 µ) on axis BB,
getting to D (SAY)
4. Perpendicular line from D
reads the soaked C.B.R. (%).
B
A
A

Quick Estimation of CBR for Empirical
Formulae
Plastic Soil
CBR = 75/(1+0.728 WPI), R2 = 0.67
where WPI = Weighted Plasticity Index = P0.075 x PI
P0.075 = % Passing 0.075mm sieve in decimal
PI = Plasticity Index of the soil, %.
Non-Plastic Soil
CBR = 28.091 (D60)0.3581, R2 = 0.84
where D60 = Diameter in mm of the grain size corresponding to 60% finer.
Soil Classification can be used for preliminary report preparation.

Determination of Subgrade Moisture Content
LimitPlastic
Content Moisture Subgrade
Subgrade Classification Estimating Subgrade Moisture Content
I Where the GWT is close enough to the ground
surface to influence the subgrade moisture content.
In non-plastic soils, GWT will influence the
subgrade moisture content, if it rises to within 1m of
the road surface; in clays of low plasticity (PI<20), if
GWT rises within 3m of the road surface and in
heavy clays (PI>40), if GWT rises within 7m of the
road surface. This category also includes coastal
areas and flood plains where the GWT is
maintained by the sea, by a lake or by a river,besides areas where GWT is maintained by rainfall
1. The most direct method is to measure the moisture content in
subgrades below existing pavements in similar situations at the
time of the year when the GWT is at its highest level.
2. The subgrade moisture content for different soil types can be
estimated by using the ratio
which is about the same when GWT
and climatic conditions are similar.
3. Where such measurements are not possible, the subgrade
strength may be determined in terms of 4 day soaked CBR
value.
II Subgrades with deep GWT but where seasonal
rainfall brings about significant changes in moisture
conditions under the road.
1.The subgrade moisture condition will depend on the balance
between the water entering the subgrade through pavement
edges/shoulders during rains and the moisture leaving the ground
during dry periods. The design moisture content can be taken as
optimum moisture content obtained from Proctor Compaction Test
IS:2720 (Part 7) corresponding to maximum dry density or from thenomograph given in Fig.2, whichever is higher.
2.The possibility of local perched GWTs and effects of seasonal
flooding should, however, also be considered while deciding on
GWT depth. Where such situations are encountered, the subgradestrength may be determined in terms of 4-day soaked CBR value.

Nomogram for the Computation of Equilibrium
Subgrade Moisture Content

Design CBR for Upgradation
The in-situ subgrade strength of an existingroad will be determined in terms of CBRvalue on remoulded to the in-situ density atthe field equilibrium moisture content, afterthe recession of the rainy season.
If the above is not possible, 4 days soakedCBR value of the remoulded subgrade soilsamples, compacted to field density, istaken as design CBR.
CBR can be determined by using DynamicCone Penetrometer (DCP).

Details of DCP

DCP - CBR Relationship

Subgrade Strength Classes for Design Catalogue
Quality of
Subgrade
ClassRange
(CBR%)
Very Poor S1 2
Poor S2 3 – 4
Fair S3 5 – 6
Good S4 7 – 9
Very Good S5 10 – 15
* Where the CBR of subgrade soil is less than 2, the economic feasibility of
replacing 300 mm subgrade with suitable soil needs to be explored and, if found
feasible, the pavement should then be designed based on the CBR value of the
improved subgrade. Alternatively, a capping layer of thickness not less than 100
mm of modified soil (with CBR not less than 10) should be provided.

Limitations of the IRC SP 20 2002 Methodology
Minimum base course thickness of 150mm forcurves A & B and of 225mm for curves C & D.
The sub base course thickness have been arrivedat by subtracting the minimum base coursethickness from the total pavement thicknessrequirement.
Mostly bituminous surface treatment
The Unsealed Gravel Roads, as wearing course,do not have explicit design guidelines.

Recommended Design Approach
Categorization of roads :
a) Gravel/ Aggregate Surfaced Roads (Unpaved andUnsealed) – 10,000 to 100,000 ESAL (Below10,000 ESAL applications, even Earth Roads aresuitable) Gravel is defined as mix of stone, sand and fine-sized
particles used as sub-base, base or surfacing on a road
b) Flexible Pavements (Paved Roads) (50,000 to 1million ESAL applications)
Performance based Design Approach based onAASTHO Guide for Design of Pavement Structure.
Serviceability rating on 5 point scale with terminalserviceability index as 2.0.

Design Criteria
For Unpaved Roads
Serviceability over the design life is limited to 2, whenrehabilitation will be due with or without overlay.
Allowable rut depth under a 3 m straight edge isgenerally not more than 50 mm.
For Paved Roads
The thickness of Flexible Pavement (Paved) is basedon Structural Number (SN) recommended by AASHTOfor Low Volume Roads at 50% reliability level.

Steps in the Design Process
For New Roads & Upgradation
Estimation of traffic in terms of ESAL.
Assessment of subgrade strength andidentification of uniform stretches.
Determination of pavement thickness andcomposition based on the design catalog.

Pavement Design Catalogue

Pavement Design
Gravel roads perform satisfactorily upto
about 60,000 ESAL applications during
design life of 10 years for any subgrade
CBR above 2%.
If the subgrade CBR is above 5%, gravel
roads can perform satisfactorily up to
about 100,000 ESAL applications during
the design life of 10 years
3/16/2012 CSRK PRASAD NIT WARANGAL
Pavement Design
Black-topped flexible pavements need to
be designed for a minimum ADT of 200 or
design traffic of 100,000 ESAL
applications, during the design life of 10
years
A minimum 150mm thick base course
should be provided in the flexible
pavement designs for ESAL applications
from 100,000 to 10,00,000
3/16/2012 CSRK PRASAD NIT WARANGAL

Pavement Composition
Subgrade should to be compacted in two layersto 100% MDD achieved by Standard ProctorTest. Minimum dry density is 16.5 k N/m3 .
Subbase course: As per MoRD SpecificationsClause 401, 403 (lime treated sub base), 404(cement treated sub base), 409 (lime & flyashstabilisation), 410 (industrial waste).
Materials passing 425 micron sieve should haveLL and PI of not more than 25 and 6 respectively.
The soaked CBR value should not be less than20%.
The thickness of subbase, where provided, shallnot be less than 100mm

Pavement Composition
Base Course : For Rural Roads designed for cumulativeESAL more than 100,000, unbound granular bases likeWBM, WMM, CRMB, soil cement base as per MoRDSpecifications Clauses 405, 406, 411 & 404. Where it isdifficult to get hard stone within economic leads, cementstabilized based can be provided as per Clause 404.
For less than 100,000 ESAL, a gravel base isrecommended, except for a very poor subgradestrength under traffic categories 30,000 to 60,000 and60,000 to 100,000 and for poor subgrade strengthunder the traffic category of 60,000 to 100,000 ESAL.
Grading, Plasticity and other requirements for Gravelbase are as per Clause 402.
3/16/2012 CSRK PRASAD NIT WARANGAL

Pavement Composition
Surfacing: For roads with ESAL morethan 100,000, a bituminous surfacetreatment of 2 - coat surface dressing or20 mm PMC is recommended.
For traffic less than 100,000 ESAL nonbituminous gravel surfacing isrecommended, except for very poorsubgrade under traffic categories T2 & T3and for poor subgrade strength for trafficcategory T3, where a bituminous surfacetreatment is recommended.
3/16/2012 CSRK PRASAD NIT WARANGAL

Warrants for Bituminous Surfacing Fast Moving Vehicles like Commercial vehicles, Damage
unprotected granular bases and create dust nuisance.
The operating cost of such vehicles is highly influence by thesmoothness of the road pavement.
Bituminous surfacing will be advantages where subgrade ispoor (CBR < 4) and the design traffic exceeds 60,000 ESALand annual rainfall generally exceeds 1000 mm.
Guidelines for providing bituminous surface treatment.Annual Rainfall Type of Surfacing
Traffic Category
T1
(ADT<100)
T2
(ADT=100-150)
T3
(ADT=150-200)
T4
(ADT>200)
Over 1500mm/year Gravel BT BT BT
1000-1500mm/year Gravel Gravel BT BT
Less than 1000mm/year Gravel Gravel Gravel BT

Grading Requirements for Sub-base course
IS Sieve Grading I Grading II Grading III
75.0 mm 100 - -
53.0 mm - 100 -
26.5 mm 55-75 50-80 100
9.50 mm - - -
4.75 mm 10-30 15-35 25-45
2.36 mm - - -
0.425 mm - - -
0.075 mm Less than 10 Less than 10 Less than 10
3/16/2012 CSRK PRASAD NIT WARANGAL
Sub-base course: As per MoRD Specifications Clause 401 (Granular Sub-base), 403 (Lime Treated Soil for Improved Subgrade / sub-base), 404(Cement treated soil sub-base / base)
The material passing 425 micron sieve for all the three gradings shall have LL
and PI not more than 25 & 6 percent respectively.

Grading Requirements for Base course
IS Sieve A B C
53 mm 100 - -
37.5 mm 97-100 100 -
26.5 mm - 97-100 100
19 mm 67-81 - 97-100
9.5 mm - 56-70 67-79
4.75 mm 33-47 39-53 47-59
0.425 mm 10-19 12-21 12-21
0.075 mm 4-8 4-8 4-8
3/16/2012 CSRK PRASAD NIT WARANGAL
As per MORD specification 402: Gravel / Soil-Aggregate Base and Surface
Course (%gravel 50-70%; % sand 25-40%; %silt & Clay 5-10%)

Grading Requirements for Surface Course
IS Sieve % by mass passing
designated sieve
26.5 mm 100
19 mm 97-100
4.75 mm 41-71
0.425 mm 12-28
.075 mm 9-16
PI 4-10
3/16/2012 CSRK PRASAD NIT WARANGAL
As per MORD specification 402: Gravel / Soil-Aggregate Base and
Surface Course (%gravel 50-70%; % sand 25-40%; %silt & Clay 8-15%)

Dust Control & Stabilisation
Chlorides (Calcium chloride, Magnesium
chloride & Sodium chloride)
Resins (lignin sulfonate – byproduct of
pulp milling industry)
Natural clays
Asphalts (cut back liquid asphalt,
emulsified asphalt)
Soybean oil
3/16/2012 CSRK PRASAD NIT WARANGAL

Bituminous Surfacing Types
Sand seal (prime, binder, sand)
Single chip seal (prime, binder, stone)
Double Chip Seal (prime, binder, large stone,
binder, small stone)
Cape Seal (prime, binder, stone, slurry)
Single Otta Seal (No prime, binder, graded
aggregate)
Double Otta Seal (No prime, binder, graded
aggregate)
Asphalt Concrete (prime, asphalt premix)
3/16/2012 CSRK PRASAD NIT WARANGAL

Expected Service Lives for some of
the Typical Surface Seals
Type of Seal Typical Service Life (years)
Sand Seal 2-4
Slurry seal 2-6
Single chip seal 4-6
Double sand seal 6-9
Double chip seal 7-10
Single otta seal + sand seal 8-10
Cape seal (13mm+Single slurry) 8-10
Cape seal (19mm+double slurry) 12-16
Double Otta Seal 10-14
3/16/2012 CSRK PRASAD NIT WARANGAL

Thank you!