design optimization of pressure sensing floor for multimodal human
TRANSCRIPT

10
Design Optimization of Pressure Sensing Floor
for Multimodal Human-Computer Interaction
Sankar Rangarajan, Assegid Kidané, Gang Qian, Stjepan Rajko Arts, Media and Engineering Program
Arizona State University Tempe, AZ 85287 USA
1. Introduction
Human-computer interaction is a discipline concerned with the design, evaluation and implementation of interactive computing systems for human use. Humans communicate with each other, intentionally or unintentionally, using various interpersonal communication modes such as static and dynamic full-body, limb, and hand gestures, facial expressions, speech and sounds, and haptics, just to name a few. It is natural to design human-computer interaction systems with which users can communicate using these interpersonal communication modes. To this end, multimodal human-computer interaction (MMHCI) systems are receiving increasing attention recently. An overview of the recent advances of MMHCI can be found in (Jaimes and Sebe, 2007). Our research mainly focuses on movement analysis based on visual and pressure sensing for movement based MMHCI, which read the movement of user(s), and respond accordingly through real-time visual and audio feedback. Such movement based MMHCI systems have immediate applications in a number of areas with significant impact on our daily lives, including biomedical, e.g. rehabilitation of stroke patients (Chen, et al., 2006), culture and arts, e.g. studying patterns and cues in complex dance performances, and interactive dance performances (Qian, et al., 2004), K-12 education, e.g. collaborative and embodied learning (Birchfield, et al., 2006), sports (e.g. analyzing and improving athletic performance based on weight distributions), and security (e.g. movement based smart surveillance systems), just to name a few.
Movement based MMHCI mainly deals with looking at dynamic characteristics of a person or a group of people such as joint angles, position of body parts, force and torque associated with limb movements, instantaneous velocity, acceleration and direction of body motion. In order to enable such a system to understand the user’s movement robustly and accurately, it is important to augment the user’s environment with novel sensors for accurate detection and estimation of the above movement qualities. It is worthy to understand that all the above movement qualities have underlying shape and/or effort attached which forms vital degrees of freedom for sensing modalities. Optical motion capture systems have become the obvious choice of researchers and technologists today for visual sensing of movement. However visual sensing alone is not sufficient for holistic
www.intechopen.com

Human-Computer Interaction
136
inference of human movement since it can comprehend only shapes e.g. joint angles, orientation of body parts associated with human movement and give no clue about effort. Also visual sensing suffers from occlusion. Haptic sensing such as pressure sensing becomes inevitable for the above reasons as it aids to understand and comprehend the motivation driven physical effort attached to every movement and thereby exploring the inherent nature of the human body as a powerful communication medium.
Taking all the above factors into account, multimodal movement based human computer interaction system has been envisioned using both the pressure sensing floor (haptic) and motion capture system (visual) in order to perform holistic human movement analysis. The motion capture system that we use is commercially available and has been purchased for our research. However the pressure sensing floor is an in-house system developed specifically to address the research problem which thereby forms the core focus of this chapter. In this chapter, we present the system level description of pressure sensing floor followed by a discussion on hardware and software developments. Then we discuss the design methodologies for integration of the floor system with the marker based motion capture system as a first step towards the creation of an integrated multimodal environment.
2. Problem Statement
Pressure sensing system design targeting human computer interaction applications should confirm to certain requirements. In order to meet the sensing needs of such an application several design challenges need to be overcome. Firstly, the pressure sensing system should have a large sensing area to allow for unconstrained movement in the capture space. Secondly, high sensor densities are required for precise pressure localization and detailed analysis of pressure patterns. Thirdly high frame rate and low sensing latency are indeed critical for real time human computer interaction to capture rapidly changing human activities. It is worth mentioning here that there is a performance trade off between frame rate/ sensing latency and sensing area/sensor densities. Large sensing area with high sensor densities results in large number of sensors for scanning and data acquisition thereby decreasing the maximum achievable frame rate and increasing the sensing latency. Hence the performance optimization of the pressure sensing system to ensure large sensing area, high sensor resolution at reasonably good frame rate and low sensing latency is a major challenge. Fourthly, in many cases, there are only few users and large portion of the sensing space is not active at all. So proper data compression scheme to avoid network congestion and effectively utilize the given bandwidth poses a challenge. Fifthly, smart sensing systems should be inevitably equipped with context aware capabilities to sense the state of the environment and users and make a perception regarding the context of the environment or the user. Reliable person location tracking by clustering and tracking of active disjoint floor regions forms a vital part of perceiving context and emerges as a major implementation challenge. Finally, to allow movement based human computer interaction using multiple communication channels, such as gesture, pose and pressure distributions, the pressure sensing floor needs to be integrable with other sensing modalities to create a smart multimodal environment. Fast and accurate alignment of floor sensing data in space and time with other sensing modalities is another challenge. Furthermore, a need exists for a
www.intechopen.com

Design Optimization of Pressure Sensing Floor for Multimodal Human-Computer Interaction
137
design of a modular and scalable system to allow for easy expansion and reconfiguration to suit external environments of different shapes and sizes.
In related prior work, various pressure sensing systems had been developed to capture and view pressure information associated with human movement across a floor. A detailed performance comparison study of those existing pressure sensing systems in terms of the above mentioned desired features are listed in Table 1.
Table 1. Performance comparison table of existing pressure sensing systems
The ranking in each dimension (column) is color-coded such that the best system is
in dark green, the second best in lighter green and the third in very light green. MIT magic carpet (Paradiso et al., 1997) and Litefoot (Griffith & Fernström, 1998) had fairly large sensing area and frame rate but were limited by poor sensor densities. ORL active floor (Addlesee et al., 1997) used load cells which lack the capability of detailed pressure measurement and cannot be used for applications requiring high sensor densities. High resolution pressure sensor distributed floor (Morishita et al., 2002) has the best sensor density so far but was a binary floor (poor data resolution) that just detects presence or absence of pressure and does not give any measurement of pressure values on an analog scale. Z-tiles floor space (Richardson et al., 2004) utilized a modular design, had high frame rate and data resolution but again suffers from low sensor density. Floor sensor system (Middleton et al., 2005) is a low cost design but again a binary floor with poor data resolution. Also most of the sensing systems except MIT magic carpet (Paradiso et al., 1997) were stand alone systems and lacked the capability to be integrated in a multimodal environment which is vital requirement for our application. In-shoe sensors (Paradiso et al.,
www.intechopen.com
Human-Computer Interaction
138
2000) have also been considered for force and pressure measurements but they have a limited scope of foot pressure measurement only. Also in-shoe systems tend to alter the subject’s pressure application due to foot orientations by close contact.
It is quite obvious that all the sensing systems listed above have at least one serious limitation rendering it unsuitable to meet our application goals. It is worth mentioning that two generations of pressure sensing floor systems were developed with very similar goals as ours at the Arts, Media and Engineering (AME) Program at Arizona State University, namely, AME Floor I (Kidané et al., 2004) and AME Floor II (Srinivasan et al., 2005) listed at the bottom of the table. It is apparent from the comparison table that the second generation did see pronounced feature improvements over the first generation. AME floor I (Kidané et al., 2004) was a smaller prototype floor with 256 force sensing resistors arranged in less dense sensor matrix. During tests (Kidané et al., 2004) , it was found that there were large zones of no pressure detection during several activities. Also the scan rate was low deeming it unsuitable for real time human-computer interaction applications. These shortcomings were addressed by AME floor II (Srinivasan et al., 2005) with high sensor densities and high frame rate. Although AME Floor II (Srinivasan et al., 2005) showed significant advances and extended capabilities over AME floor I (Kidané et al., 2004) , it covered only a fraction of the sensing area required for our application, showed high sensing latency and lacked user friendliness. Also it showed preliminary multimodal integrable capabilities in temporal domain only and not spatial domain.
To fully address these issues, we have developed an improved, ingenious and in-house pressure sensing floor system (AME Floor-III) described in this chapter and listed in the last row of Table 1. AME Floor-III system is characterized by large sensing area, higher frame rate, smaller latency, enhanced user friendliness, spatial and temporal integrability with motion capture system to create a multimodal environment, modular/scalable design thereby matching our ideal pressure sensing demands for real time movement based human computer interaction. Comparison with other systems reveals that our proposed system in this chapter ranks among the top three in most of the dimensions of the performance criteria. Although there are four systems with frame rates higher than ours, the sensing area and sensor resolutions of these systems are much lower than our system. This chapter is an extension of our previous paper (Rangarajan, et al, 2007a) based on (Rangarajan, 2007b).
3. Pressure Sensing Floor Overview
This section provides essential information on pressure sensors, modular design approach used in building the large area pressure sensing floor. Later this section dives in deeper to explain the specifics of the embedded floor hardware and floor control software. Floor control hardware used in AME Floor-II (Srinivasan et al., 2005) has been retained in AME Floor-III but however the microcontroller firmware has been optimized to achieve high frame rate and reduced latency. Hardware overview given in this section creates a solid foundation to explain the optimization techniques in section 4.
3.1 Pressure Sensors: Force Sensing Resistors
Force sensing resistors have been used as individual sensor entities for AME Floor-III system. They are made up of pressure sensitive polymer between conductive traces on sheets of Mylar. As the name implies, these sensors exhibit a change in resistance when
www.intechopen.com

Design Optimization of Pressure Sensing Floor for Multimodal Human-Computer Interaction
139
pressure or force is applied on them. The value of resistance is of the order of mega ohms under no pressure and drops to few kilo ohms when pressure is applied. Each pressure sensor element has an approximate sensing area of 6 mm x 6 mm and measure 10 mm x 10 mm including the non-sensing area. Such a small size paves way for dense aggregation of sensors in the sensing space thereby resulting in higher sensor densities. It is important to note that the force sensing resistors does not give very accurate measurements of pressure or force applied as there may be 15% to 20% variation between each other. Also they suffer from a property called creep or drift where the measured resistance values tend to slowly vary when subjected to constant pressure over a long period of time thereby inducing an error in pressure measurements. However force sensing resistors can be used very effectively for relative pressure measurements and acquiring pressure distribution data which serves the purpose of wide variety of applications such as medicine for diagnosis of various gait pathologies, automotive, robotics and interactive arts applications.
Fig. 1. Sub-floor steel framework (top left), surface floor wooden framework (top right), Complete view of AME Floor-III after assembly (bottom).
3.2 Pressure Sensing Mat
Force sensing resistors are generally available in several shapes and sizes like sensor pads, two dimensional sensor array matrix, continuous force sensing strips or several other forms depending on the application. Pressure sensing mat is a dense aggregation of force sensing resistors forming a two dimensional sensor array matrix. Tekscan 5315 pressure mat
www.intechopen.com

Human-Computer Interaction
140
consisting of 2016 force sensing resistors arranged in grid of 42 rows x 48 columns have been used for AME Floor-III design.The dimension of each pressure mat is approximately 62 cm x 53 cm with an active area of 48.8 cm x 42.7 cm .The sensor mat is rated at 30 pounds per square inch (PSI). There are 2016 sensors in an active area of 322.98 square inch giving sensor densities of about 6.25 sensors/square inch.
3.3 Pressure Sensing Panel
Pressure sensing panel is constructed with eight such pressure sensing mats (Srinivasan, P., 2006). Eight Tekscan-5315 mats are arranged in 4 rows x 2 columns mounted on a wooden floor frame as shown in Fig. 1 (top right). Each pressure sensing mat has a non-sensing zone at the borders surrounding the active area. The pressure sensing mats are so laid and affixed on the floor panel in such a way that the active area of one mat overlaps the inactive area of another thereby avoiding such inactive zones (Srinivasan, P., 2006). Each pressure sensing mat has a connection tab where the pressure data of all the sensors collectively arrive. This connection tab passes through a slit on the front side of the panel and is back-folded to interface with hardware control board. Thus each panel has eight hardware control boards (one for each pressure sensing mat) mounted on the back side.
Fig. 2. Floor System overview and related network architecture
www.intechopen.com

Design Optimization of Pressure Sensing Floor for Multimodal Human-Computer Interaction
141
3.4 Large Area Pressure Floor
AME Floor-III is constructed by assembling 12 such pressure sensing panels (explained above) in 3 x 4 panel matrix. Thus the entire floor consists of a total of 96 networked pressure sensing mats assembled in 12 rows x 8 columns as shown in Fig. 2 and spanning a total sensing area of 180 square feet (15 feet x 12 feet). Such a modular design ensures large sensing area while still maintaining smaller frames for ease of use and installation. Also modularity in design paves way for creation of floor of different shapes and sizes (walkways, dance floor) and easy reconfiguration to suit external environments. The related network architecture used in AME Floor-III is illustrated in Fig. 2. All the 96 pressure sensing units are assigned static IP addresses and they form a local private network. Each and every pressure sensing unit has an associated hardware control board with an ethernet interface. There are two layers of network switches as shown in the Fig. 2. Multiple switches in multiple layers are deployed to share the network load and ensure sufficient leeway so that network switches are not operating to its rated full capacity which in turn increases performance and life time. All the twelve pressure units in one column are connected to a single fast ethernet switch on the first layer by means of ethernet cables. In a similar fashion, all pressure sensing units in 8 columns communicate with the fast ethernet network switch of their respective columns. The output port of eight fast ethernet switches is wired to the gigabit switch on the second layer. The output of the gigabit switch communicates with the host computer running the floor control software viz. Floor Control and Visualization Engine (FCAVE). FCAVE collects the pressure data arriving from 96 different IP’s on 96 different ports and uses the source IP to identify and index the pressure data pertaining to different mats. The software further assembles all the 96 data packets (arriving from 96 mats) based on their location to create one large floor packet for each frame and sends it out to a multicast network. By this arrangement several ends users listening to the multicast network get access to the pressure data.
The mechanical design and installation of AME Floor-III is implemented in three layers namely the sub floor framework, surface floor (shown in Fig 1) and marley layer. The sub floor framework forming the bottom most layer is constructed using long steel rails welded to form a grid like structure and mounted on wooden blocks. This layer serves as a raised pedestal for the entire floor giving an elevation of approximately 4 inches above ground and provides the required spring and resilience to prevent injuries due to user activity like falling, jumping etc. Also such a raised installation paves way for all the necessary interconnect, ethernet wiring, power distribution and cabling to be housed beneath the floor in a neat and coherent fashion. The surface floor is made of a solid wooden framework and made to rest on the sub-floor layer. This layer forms the solid rigid structure supporting the users on the floor system. The pressure sensing mats and the hardware control circuitry for data collection are affixed to the surface floor structure on the frontal and dorsal side respectively. The third and the topmost layer is sheet of marley which is a vinyl surface, covering the entire area of the floor. The marley serves two main purposes. Firstly it aids in protection of the sensor matrix which are easily susceptible to damage by sharp and pointed objects and thereby increasing the longevity of the sensors. Secondly, it provides the necessary friction and contact grip for the subjects thereby preventing slips and fall injuries. Marley surface is generally preferred over standard wood or tiled surface structures for better movement control and less slipperiness.
www.intechopen.com

Human-Computer Interaction
142
3.5 Floor Control Hardware
The hardware control circuitry used in AME Floor–II (Srinivasan, P., 2006) has been retained in AME Floor –III but the microcontroller firmware has been optimized in AME Floor-III to achieve a higher frame rate. The floor hardware (Srinivasan, P., 2006) comprises of microcontroller, multiplexers, A/D converter and ethernet enabled rabbit controller which are all wired together on a hardware control board and collectively termed as ‘mat based controller’. The block diagram of the floor hardware (Srinivasan, P., 2006) is shown in Fig 3.
Fig. 3. System level block diagram of the mat-based controller
The microcontroller (PIC18F6585) forms the heart of the mat-based controller which generates the timing and control signals for all the components on the hardware control board to coordinate and sequence their operation of scanning sensors and reading pressure values. It has programmable capabilities to synchronize the sensor scan based on an internal timer or from an external clock signal. The latter has been currently implemented whereby the scan of all 2016 sensors on a single mat are synchronized with the external clock from the motion capture system. This implementation paves way for temporal synchronization of AME Floor-III and motion capture system for multimodal sensing. At the onset of falling edge of the synchronization clock, the microcontroller initiates a sequential scanning process of 2016 sensors arranged in 42 x 48 matrix. The pressure sensors (force sensing resistors) indicate a change in resistance when pressure is applied. This change in resistance is converted to a proportional analog voltage by a simple resistor divider network. Signal multiplexing has been implemented using a bank of six CD74HC4067 16-to-1 multiplexers
www.intechopen.com

Design Optimization of Pressure Sensing Floor for Multimodal Human-Computer Interaction
143
to read the pressure voltage signals. Three multiplexers are used for the row lines and three for the column lines of the sensor matrix and each input line of the multiplexer is wired to a single pressure sensor output. The microcontroller streams out the multiplexer selects signals in a sequence to read the pressure values from sensor 1 to sensor 2016 one at a time. A bunch of gain control operational amplifiers follows the multiplexers which performs the necessary amplification and signal conditioning of the analog voltage. The outputs of the operational amplifiers are fed to a high speed ADC0820 converter which coverts the sensed analog voltage to 8 bit digital pressure value on the reception of the read/start- conversion signal from the microcontroller. Digitized pressure data is transferred to RCM 3200 module (Rabbit controller) through an input port after interrupt enabled handshaking signals with the microcontroller. The RCM3200 module contains Rabbit 3000 processor running at 44.2 MHz and 10/100 Base-T Ethernet connectivity. It is worth mentioning again that the multiplexer select signals, ADC read signal and rabbit interrupt signals are all generated by the microcontroller which are the major control signals used to synchronize/sequence the operation of the components on the hardware control board. Rabbit units are assigned unique static IP addresses. The Rabbit module collects 8 bit digital pressure data of all 2016 sensors and assembles them to create a pressure packet pertaining to that mat. It attaches a frame number at the end of each pressure packet and sends it out onto the network to the host computer running the floor control software through an array of switches. The host computer software listens to the IP addresses and port numbers to which the rabbit has been programmed to send the pressure data thereby collecting pressure data for further processing.
3.6 Floor Control and Visualization Engine (FCAVE)
Floor Control and Visualization Engine (FCAVE) software developed at the host computer has an interactive graphical user interface with various control buttons and indicators (Fig. 4) and it is programmed to respond dynamically to user input. This software receives the raw pressure data packet for each mat separately, assembles the data of all 96 mats, assigns an incremental frame number and creates floor data frame which is ready for processing.
Fig. 4. Graphical user interface of Floor Control and Visualization Engine
www.intechopen.com

Human-Computer Interaction
144
FCAVE software has two operating modes namely ‘live mode’ and ‘playback mode’. As the name implies, real time data collection and processing is done in the ‘live mode’ whereas offline data processing from a recorded pressure data file is usually done in the ‘playback mode’. Furthermore playback can be done in synchronous and asynchronous ways. Synchronous playback streams the recorded pressure data synchronous with the motion capture playback stream. Asynchronous playback streams the recorded pressure data at the desired frame rate without any synchronization with motion capture system. FCAVE also offers various other controls like multicast pressure data to users on network, grayscale display of pressure information, set noise filter value, perform mean shift tracking of pressure clusters ,frame counter reset , record to file etc. FCAVE software development paved way for enhanced user-friendliness (with a lot of features as shown in Fig. 4), efficient data compression and mean shift tracking of active, disjoint pressure clusters in real time.
4. Hardware and Software Developments
This section mainly talks about hardware improvements done on AME Floor-II (Srinivasan, P., 2006) and new software developments to result in AME Floor-III. AME Floor II (Srinivasan, P., 2006) operated at frequency of 33 Hz and also suffered from significant latency of 200 milliseconds. Latency experiments are done to measure and quantify the latency along the data path and further optimizing them for latency reduction. Hardware optimizations in AME Floor-III eventually lead to increased frame rate (33 Hz to 43 Hz) , reduced mean latency (200 ms to 25 ms) and improved real time performance over its precursor AME Floor-II (Srinivasan, P., 2006).New software developments like data compression and mean shift tracking have imparted context aware capabilities to the system. This section elaborates on the hardware optimization techniques used to reduce latency and increase frame rate and new software developments namely data compression and mean shift.
4.1 Optimization of System Latency
Small latency is critical for real time sensing systems used in human-computer interaction applications. Latency is defined as the time lag between the time instant of the true event and the time instant the pressure data pertaining to the true event arrives at the end users on a multicast network. The overall system latency is the sum of two components namely intrinsic latency and extrinsic latency. Intrinsic latency is defined as the latency induced by the sensor scanning process. Each sensing unit has a pressure mat with 2016 sensors and an associated mat based controller for pressure data collection and signal conditioning. All sensors are scanned sequentially from sensor 1 to sensor 2016 to read the pressure values. There is an inherent delay for the scanning process to complete and pressure packet to be produced. This delay is called as the intrinsic latency which is present due to lag in various hardware components on the mat based controller. The microcontroller generates the sensor scan signals and the scan routine incorporates all the hardware component delays. Thus the total execution time of the microcontroller scan routine Tscan determines the frame rate F (F = 1/ Tscan) of the system. After a complete mat scan of 2016 sensors, the pressure data packet for that mat is produced. Extrinsic latency is defined as the time taken for such a pressure data packet to reach the end users on the multicast network and it accounts for the network
www.intechopen.com

Design Optimization of Pressure Sensing Floor for Multimodal Human-Computer Interaction
145
transmission delay and FCAVE software delay. Due to sequential scanning process, the intrinsic latency is direct function of the active sensor location given by a sensor address (An active sensor would be one that has pressure applied on it and sensors are addressed sequentially from 1 to 2016). A mathematical relationship is first established which gives an expected range of the intrinsic latency values based on the system scan rate and active sensor location. From this theoretical model, it becomes apparent on what latency distribution to expect when pressure is applied on a particular sensor location and later latency experiments are done to verify the same. The following section presents the mathematical relationship between intrinsic latency, frame rate and active sensor location.
4.1.1 Theoretical approach – relationship of intrinsic latency, active sensor location and frame rate
Let’s assume that the system is running at a frame rate F and the time taken for one complete scan cycle of N sensors (N = 2016 in our case) is Tscan. Pressure sensors applied with active load are defined as active sensors. Let L be the address of such an active sensor. The intrinsic latency related to this sensor at L needs to be determined. Let U be the address of the sensor currently being scanned at the time instant when the pressure application occurs on sensor L. Let XL and XU be time elapsed since the start of the scan until the sensor L and sensor U are reached respectively by the scan routine, i.e.
XL = 1/N × L × Tscan (1)
XU = 1/N × U × Tscan (2)
According to the relationship between XL and XU, there are two different cases to be considered which are pictorially represented in Fig 5.
Fig. 5. Sequential mat scan process and depiction of Case 1 and Case 2
Case 1: XU ≤ XL, pressure applied on sensel L is registered in the current scan cycle. Case 2: XU > XL , pressure applied on sensel L is registered in the next scan cycle.
Hence, given L, the intrinsic latency τ caused by system scan is a function of XU,
www.intechopen.com

Human-Computer Interaction
146
⎩⎨⎧
<<−≤≤−=
scanULUscan
LUUscanU
TXXwhenXT
XXwhenXTX
,2
0,)(τ (3)
Since XU assumes a uniform distribution in [0, Tscan] it can be easily shown that τ is uniformed distributed in the range given below
LscanLscan XTXT −≤− < 2τ (4)
Therefore, the mean intrinsic latency for the sensel at L is given by
Lscanm XT −= 5.1τ (5)
Thus the mean intrinsic latency is a direct function of Tscan and active sensor location XL. Furthermore, since L can also be treated as a uniform random variable between 1 and N, the mean average intrinsic latency of all sensels on a mat is given by
scanLscanm T}X{ET5.1}{E =−=τ (6)
Equation 6 clearly reveals that the intrinsic latency depends on the frame rate F (1/Tscan) and active sensor location XL. As expected, the intrinsic latency decreases as the frame rate is increased. Equation 6 implies that as the active sensor location becomes closer and closer relative to the end of mat, the intrinsic latency decreases linearly. This can be justified by the sequential nature of the scanning process. Latency experiments have been conducted (explained in the following section) to verify the above statement and check the validity of Equation 6.
4.1.2 Experimental approach for measurements of system latency
The experimental set up shown in Fig 6 is used to measure both intrinsic and extrinsic latency and thereby overall system latency.
Fig. 6. Experimental set up to measure the latency of each and every component along the data path.
www.intechopen.com

Design Optimization of Pressure Sensing Floor for Multimodal Human-Computer Interaction
147
In order to measure the latency, a time reference is required which gives the time
instant of the true event (e.g. pressure strike). The time of arrival of the actual data packet pertaining to the true event is then recorded and the displacement in time between the time reference and arrival time gives the measure of latency. A single physical test sensor (shown under zoom lens in Fig 6), National Instruments data acquisition hardware (NI-DAQ 6020E) and Labview application are used to get the time reference of the true event. The test sensor is placed directly above the sensor on the mat on which the pressure is going to be applied (active sensor). The Labview application is programmed to read the incoming data from two input ports namely reference data port and actual data port. The test sensor output feeds to the NI-DAQ hardware and in turn to the reference data port of the Labview software application to create the reference data path. The components in the reference data path are chosen to be relatively fast and responsive to give a solid reference for accurate latency measurements. Actual data path is the normal data flow through the switches and floor control software given by the system architecture. Actual data port of the Labview software is connected to fetch the data anywhere along the actual data path as shown in Fig 6. Pressure applied by a swift strike on the test sensor is the event used in the experiment. Sensor beneath the test sensor suffers the event at the same instant of time as that of the test sensor and hence the test sensor can be used a reference. When an event occurs, two different channels (reference data path and actual data path) carry information about the same event to the Labview software application. Labview software reads the data from the test sensor arriving at the reference data port and records the arrival time. Under the assumption that the transmission delays along the reference data path are at negligible levels, the reference time stamp gives the time instant of the true event. Also the active sensor on the pressure mat transmits the event through the actual data path to the actual data port of the Labview application. Labview records the arrival time of the actual data packet as well. The time displacement between the actual data arrival time and reference data arrival time is computed by the Labview application as a true value of latency.
Different read out points namely (T1, T2, T3, T4) are taken to measure and quantify
the latency at each and every point along the data path. Intrinsic latency is obtained from T4 and TREF values. Extrinsic latency is mainly caused by the various components in the data path like the two network switches and host computer running the floor control software. T1,T2 and T3 measurements are used to quantify the latency added by switch 1, switch 2 and floor control software respectively using the formulas given below.
TINL = T4 - TREF (7)
LATENCYSW 1 = T1 – TINL – TREF (8)
LATENCYSW 2 = T2 – T1 (9)
LATENCYFCAVE = T3 – T2 (10)
Extrinsic latency measurements done on AME Floor-II (Srinivasan, P., 2006)
revealed a major contribution of 167 milliseconds (LATENCYFCAVE) from floor control software and negligible additions by the network switches (LATENCYSW1 & LATENCYSW2 ).
www.intechopen.com

Human-Computer Interaction
148
The floor computer was then upgraded to dual processor, dual core and multithreading techniques were used to improve the real time performance of floor control software and reduce extrinsic latency to negligible levels in AME Floor-III.
Having reduced the extrinsic latency to negligible levels, focus is shifted to intrinsic
latency reduction. This experimental set up is further used to get empirical measurements of intrinsic latency TINL and validate the mathematical model derived in section 4.1.1. Pressure is applied on a set of fixed sensor locations on the mat and the mean system latency is computed for over 100 trials for the floor system running at 40 Hz. Equation 6 gives the theoretical estimate of the mean latency given the active sensor location and frame rate. Fig 7 shows the correlation between the mean latency values computed from theoretical and practical data sets when the system is running at 40Hz. The offset between theoretical and practical values is mainly due to the DAQ polling frequency by Labview application. It is found that Labview application polls the data acquisition card (NI-DAQ 6020E) at 5 millisecond intervals (DAQ polling error) on an average. Hence the time reference TREF is delayed from the true value by a time period t, where t is a random variable (0 ≤ t ≤ DAQ polling error).This explains why the practical value of latency is less than the theoretical value by an offset ‘t’. In other words the offset or mean error between the theoretical and practical data sets should always be less than or equal to the DAQ polling error which is proved by means of Table 2.
Fig. 7. Plot of mean latency (ms) vs. active sensor location for theoretical and practical data.
www.intechopen.com

Design Optimization of Pressure Sensing Floor for Multimodal Human-Computer Interaction
149
Active Sensor Location (0-2015)
Theoretical Mean
Practical Mean ( > 75 Trials)
Mean Error DAQ Polling error
48 36. 5 31. 36 5.14 6
815 27 23 4 4
905 26 22 4 5
1455 19. 5 14. 88 4.62 5
2015 12. 5 10. 53 1.97 4
Table 2. Mean error between theoretical and practical data sets for different sensor locations
Equation 6 states that we can minimize intrinsic latency by minimizing Tscan, or
equivalently maximizing the frame rate (F = 1/Tscan). Hence efforts were invested to increase the frame rate and reduce intrinsic latency which is described in section 4.2.
4.2 Maximization of Frame Rate
Frame rate of floor system is determined by the speed of hardware components on the hardware control board. Every hardware component has certain delay or lag associated with it. The microcontroller scan routine incorporates all the hardware component delays and accordingly generates the control signals. The sum of all hardware component delays gives minimum Tscan required whose reciprocal gives the maximum achievable frame rate.Fig 8 shows the block diagram of floor hardware (Srinivasan, P., 2006) annotated with delay values for each hardware component explaining how we had achieved a maximum frame rate of 43 Hz in AME Floor- III from an old value of 33 Hz in AME Floor-II prototype (Srinivasan, P., 2006). It is important to note that suffix (II) on Fig 8 refers to AME Floor-II whereas suffix (III) refers to AME Floor-III system. The block diagram quantifies the time savings obtained on each hardware component in the current system relative to AME Floor-II. These time savings and hence increase in frame rate are obtained by doing a more refined timing analysis on each hardware component to determine their operational delay and accordingly generating the timing and control signals from the microcontroller. Section 4.2.1 enumerates the technique used to increase the frame rate from 33 Hz to 43 Hz.
www.intechopen.com

Human-Computer Interaction
150
Fig. 8. Block diagram of Floor hardware annotated with hardware component delays
4.2.1 Frame rate increase technique
It is apparent from Fig 8 that the time savings obtained in the A/D converter, multiplexer and rabbit controller lead to an overall increase in frame rate from 33 Hz to 43 Hz. The operational delay of the A/D converter and rabbit controllers are determined by trial and error procedure. Repeated iterations are done with different delay values (for A/D and rabbit) in the microcontroller routine and the least delay for correct operation is then determined. Major time saving is obtained in the multiplexers by non-uniform multiplexing technique. It is important to note that the time taken for each sensor to be scanned and pressure value to be read is not uniform for all 2016 sensors on the pressure sensing mat. The reason behind the above statement can be explained with the aid of Fig 9. The floor control hardware includes three 16 x 1 row multiplexers and three 16 x 1 column multiplexers. Each input line of the multiplexer is wired to single sensor output. The microcontroller generates the multiplexer enable signal to enable a particular row and column multiplexer. Soon afterwards, the multiplexer select signals are also sent out by the microcontroller to read a particular input line. Additional instructions are required in the microcontroller scan routine when there is a switch from one multiplexer to another. The sensors wired to the first input line of multiplexer accounts for such a switch thereby taking more time to complete. For example, sensor 17 on the mat requires a switch from row mux-1 to row mux-2 which is achieved by additional instructions and hence longer completion time. Sensor 1345 takes even longer time to complete because it requires two switches namely column mux-2 to column mux-3 and row mux-3 to row mux-1.
www.intechopen.com

Design Optimization of Pressure Sensing Floor for Multimodal Human-Computer Interaction
151
Fig. 9. The arrangement of multiplexers for a pressure sensing mat and sensors that require longer scanning time due to multiplexer switching.
AME Floor-II (Srinivasan, P., 2006) resorted to a uniform multiplexing technique whereby the time taken to scan each sensor was made uniform throughout the pressure sensing mat. The worst case or longest sensor scanning delay was determined and all sensors were scanned uniformly with that delay value. This was achieved by incorporating additional delays even for sensors that could have finished scanning in lesser time. In AME Floor-III all these extra delays were removed and the multiplexing is made non-uniform. Currently, each sensor is scanned at the fastest rate possible which eventually leads to significant savings in multiplexer to finish operation and thereby increase in frame rate.
4.3 Data Compression
Each pressure mat has 2016 sensors and each sensor in turn sends one byte of pressure data at 43 Hz. Thus each mat data packet size adds to 2017 bytes which includes 2016 bytes of pressure data and one byte of frame number. The data volume from the entire floor comprising of 96 mats running at 43 Hz is a whopping 8.4 MB/sec. Usually, except a small area where the subject is in contact with the pressure sensing floor, most of the sensors do not have any load acting on them. Consequently a large proportion of the sensor data are null values of pressure or noise serving no interest to applications. Also there has been slight random noise observed in few sensors because of the nature of the sensing material which reports small values of pressure. Hence a simple but elegant compression algorithm is implemented by the floor control software to filter out all pressure values below the chosen noise threshold and pack only “active” sensor values and their addresses (location on floor system matrix) to be sent out to the end users on the network. Compression ratio as high as
www.intechopen.com

Human-Computer Interaction
152
0.9 is observed under normal case with five subjects which proves significant data volume reduction on the network. It is known that compressed data packet comprise of only active sensor values and their address whereas the uncompressed data packet comprise of all sensor values (arranged in a sequence) and no address information since its address is implied by its location in the data packet. Thus the compression algorithm adds an additional overhead of sensor address which works well for low user activity with less active sensors. However as the user activity on the floor increase or when large numbers of sensors are active, the packet size also grows and a point is reached when compressed data volume exceeds uncompressed data volume. It is determined that this breakeven point is generally high and beyond bounds for normal usage. Hence the algorithm works well for most of the situations.
4.4 Mean Shift Tracking of Pressure Clusters
Context awareness is the vital part of any smart environment. Perceiving context means sensing the state of the environment and users and it can be done with regard to a person or an activity. This may involve a variety of tasks such as person recognition, person location tracking, activity detection, activity recognition, activity learning etc. The primary step to accomplish the above tasks is to develop an efficient tracking procedure that shall ascertain the person location on the floor and also shift in the pressure gradient. The latter may lead to the study of various pressure patterns tied to each and every user activity. A mean shift algorithm is used to achieve the above mentioned goal. Mean shift is a simple iterative procedure that shifts each pressure data point to the average of the pressure data points in the neighbourhood.
4.4.1 Mean shift: an introduction
Mean shift is the process of repetitively shifting the centre t to the sample mean. The sample mean of samples S under a kernel K(x) centred at t, with sample weights w(s), can be found using this equation:
∑∑∈
∈−−≡
Ss
Ss
swtsK
sswtsKtm
)()(
)()()( (11)
where m(t) is the new sample mean (Cheng., 1995). It’s proven (Comaniciu et al., 2000) that if the kernel K(x) has a convex and monotonically decreasing profile k(||x||²), then the centre t will converge onto a single point. The kernel used in our tracking algorithm is the truncated Gaussian kernel which is the combination of the flat kernel and Gaussian kernel. The truncated Gaussian kernel is given by
⎪⎩⎪⎨⎧
>≤= −λλβ
βλ xif
xifexGFx
0
))((
2
(12)
where λ is the radius of the Gaussian kernel and β is the Gaussian kernel coefficient.
www.intechopen.com

Design Optimization of Pressure Sensing Floor for Multimodal Human-Computer Interaction
153
4.4.2 Clustering and tracking algorithm
The algorithm is iterated for every frame of pressure data. Each and every frame of pressure data contains information about the location of pressure and value of pressure at that location. The pressure values constitute the weights and pressure location constitutes the data points that need to be iterated using the mean shift algorithm. The full algorithm for finding and tracking the pressure clusters is given below. 1) For the first frame of pressure data or new cluster formation , cluster centres and the data points are one and the same i.e. the centre set T is the same as the data set S, and both evolve with each iteration using the mean shift formula in equation 11 and truncated Gaussian in equation 12. Data points are clustered through the blurring process (Cheng, 1995) using the observed pressure data as the weight used in eqn. 11. Once the process has converged, the data set will be tightly packed into clusters, with all of the data points located closely to the centre of that cluster. (The process is said to the converged either after the maximum number of iterations defined by the algorithm or earlier when the mean shift of centres becomes less than the convergence threshold) After convergence, each cluster has a ‘centre’ and ‘label’ associated with it. All data points not associated with any cluster centre are classified as orphan pressure points. 2) For every subsequent pressure data frame, centres from the previous frame are updated through the mean shift algorithm (eqn. 11) using current observed pressure values as weights and checked for convergence. In practice, entirely new data points resulting in new cluster centres (new labels) can occur which is computed in step (3). 3) Calculate the number of orphan pressure points. If the number of orphan pressure points exceeds a chosen threshold then repeat step (1) to find new cluster centres. Orphan pressure points fewer than the chosen threshold are discarded. 4) Perform mean shift using the new set of cluster centres (repeat steps 2 & 3).
Fig. 10. Snapshot showing clustering and tracking by mean shift on left foot and right foot. Two pressure clusters are formed for each foot (one for heel and one for toe) and cluster centres are depicted by red dots.
5. System Integration for Multimodal Sensing This section presents the system integration of AME Floor-III and motion capture system to create a multimodal environment for holistic movement sensing. Multimodal systems have always proved to be robust and effective than unimodal systems because it provides wide varieties of information for better realization of the subject movement in capture space. In a
www.intechopen.com

Human-Computer Interaction
154
multimodal system, users have the flexibility to interact with the environment through multiple communication channels e.g. gesture, voice and pressure distribution paving way for increased expressive power and user friendliness. Multimodal systems provide high redundancy of content information and hence high reliability. Also the weakness of one modality is offset by the strength of the other. In this manner, multiple sensing modalities possessing symbiotic relationships are found to be very effective for human computer interaction. Hence after the completion of pressure sensing floor, efforts have been put in to integrate it with the motion capture system to create a smart multimodal environment.
Fig. 11. Common capture volume of the floor and motion capture system.
A common capture volume (12’ by 15’) is first created within the sensing
capabilities of the floor and motion capture system. The motion capture cameras are arranged around a capture volume and the floor forms a part of the capture volume as shown in Fig. 11. The location of the floor with respect to the coverage area of the cameras is important when pressure data about some movement needs to be interpreted with the marker. The pressure floor and motion capture system are integrated with respect to time and spatial domains. A subject moving in the capture space is sensed by both systems and they give information about the location and activity of the subject. Motion capture data contains the 3D location coordinates of the markers in physical space whereas the pressure data contains the pressure values and 2D location. Both sensing systems have independent coordinate set and hence spatial alignment by means of coordinate transformation becomes essential to ascertain the location of the subject in common capture space. Also any activity done by the subject is being detected by both systems simultaneously and hence both sensing modalities must operate synchronously. Thus time synchronization and spatial alignment are critical for two data sets to be highly correlated for holistic inference.
5.1 Temporal Alignment
Temporal alignment is defined as the process of synchronization of both sensing modalities so that both systems record an event in the common capture volume at the same time instant. Perfect temporal alignment leads to a holistic inference on the time of occurrence of the event. Temporal Alignment of the floor and motion capture system is achieved by
www.intechopen.com

Design Optimization of Pressure Sensing Floor for Multimodal Human-Computer Interaction
155
means of a common sync clock. This sync clock is generated by the master camera of the motion capture system and is used to trigger the scan of the floor. This sync clock is used by the motion capture system to control the camera shutters. The clock signal feeds as an external signal to the micro-controller (in the local mast based controller) to initiate floor sensor scan. In this way, the scan of the floor and the camera image capture are synchronized in time domain if both are operating at the same frame rate or frame rate multiples of one another. The maximum achievable frame rate of the motion capture system and AME Floor-III are not equal. The motion capture system is capable of running at higher frequencies than the floor. Running the motion capture system at the same frequency of the floor results in a situation where the full sensitivity of the motion capture system is not utilized. Thus for temporal alignment, motion capture system is always set to run at multiples of the floor frequency. The common sync clock runs at the frequency of the motion capture system and that clock is down sampled by a factor to generate the scan frequency (or frame rate) of the floor. Currently the motion capture system is set to run at 120 Hz and the floor at 40 Hz. The frequency set for the floor system should be less than the maximum achievable floor frame rate i.e. 43 Hz. This arrangement generates 3 motion capture data frames for every single pressure date frame. So the motion capture data frames are down-sampled (redundant frames are ignored) to create an equal number of floor and motion capture data frames for comparison purposes. All data frames are referenced by means of frame numbers to track the same event detected by both systems. The time of occurrence of the event (relative to the start of data capture) can be computed from the frame number of the data pertaining to the event and frame rate of the sensing modality.
A frame alignment experiment is conducted to verify the temporal alignment of the AME Floor-III and motion capture system. The motion capture system is set to run at 120 Hz and AME Floor-III at 40 Hz. A predefined start up procedure is resorted to ensure the start of both sensing modalities at the same time instant. A mallet with a single marker on its head is banged on a single pressure sensor of the floor from a fixed height. The motion capture system tracks the movement of the marker on the mallet whereas the pressure sensing system monitors the pressure value on the single pressure sensor. The vertical coordinate (Y- coordinate) of the marker given by the motion capture system and pressure value on that sensor given by the pressure sensing floor are monitored over time. Ideally the pressure value on that sensor should peak when the marker coordinate is at the lowest position (ground level). In other words, the pressure peak should occur at the same time instant when the vertical height of the marker is at its lowest value. Since the motion capture system is running at three times the frequency of AME Floor-III, motion capture frames are down-sampled to create an equal number of floor frames for comparison and check of frame alignment between the two data sets. Fig 12 gives the time-sampled plot of the pressure sensor values (green dots) and marker vertical height (pink dots) from data captured during the experiment. It can be seen that the ‘first’ pressure peak detected by the pressure floor and the ‘first’ lowest marker height detected by the motion capture system occurs at frame number 46 (after down-sampling of motion capture data frames). It is clear that the results obtained agree with our expectation thereby demonstrating a perfect temporal alignment between the floor and motion capture system.
www.intechopen.com

Human-Computer Interaction
156
Fig. 12. Plot of pressure and marker data v.s. floor frame numbers showing perfect temporal alignment.
5.2 Spatial Alignment
Spatial alignment (in this context) is defined as the process of determining the transformation parameters for conversion of a spatial coordinate in one coordinate system to an equivalent coordinate in another coordinate system for a holistic inference on the location of the subject. The floor coordinate system is a two dimensional system in sensor units whereas the motion capture coordinate system is a three dimensional system in mm units. Hence it is essential to implement coordinate transformation between the floor and motion capture system so that we can view the events in one coordinate space for ease of inference and visualization
A spatial calibration procedure is in order to align the floor and motion capture system in physical space. Firstly the motion capture system is calibrated and stabilized. Three reflective markers are placed on the floor as shown in Figure 13. Origin marker is placed on the first sensor of mat 19, x-axis marker on the first sensor of mat 23 and z-axis marker on the first sensor of mat 75. Three points inside the floor are chosen so that they are well within the coverage areas of the cameras. The positional coordinates of these three markers are then gathered which in turn denotes the position of the floor in the motion capture coordinate space. Using this information, three co-ordinate transformation parameters namely rotation, translation and scaling are computed. These parameters constitute the coordinate transformation matrix which is then applied to each and every floor coordinate to get the respective coordinate in the motion capture system. The converse also can be computed to view the data in the floor coordinate space alone. Spatial alignment computations are done by floor control software in real time. The theory and math behind the calculation of scaling, translation and rotation parameters is explained in the following sections.
www.intechopen.com

Design Optimization of Pressure Sensing Floor for Multimodal Human-Computer Interaction
157
Fig. 13. Placement of markers at the floor for spatial alignment
Let the positional coordinates of the origin, x-axis and z-axis markers obtained from the motion capture system be represented as (x1, 0, z1), (x2, 0, z2), (x3, 0, z3) respectively. The y-coordinate is always at zero because the floor is parallel with the X-Z plane and intercepts at the zero point on the y-axis of the motion capture coordinate space. Using the above positional information the scaling, rotation and translation parameters are computed as follows.
5.2.1 Scaling
Scaling parameter in X-direction (SX) is computed from the positional coordinates of origin and x-axis markers. Scaling factor (SX) is obtained when the distance between origin point and x-axis point is divided by the number of sensors in between the two points. It is expressed in mm/sensel.
448
)()( 212
212
×−+−= zzxx
S X (13)
Scaling parameter in Z-direction (SZ) can be derived similarly.
www.intechopen.com

Human-Computer Interaction
158
742
)()( 213
213
×−+−= zzxx
SZ (14)
It is worth mentioning here that ideally SX = SZ since the sensors are uniformly distributed over the entire area. 5.2.2 Rotation
The angle of rotation from the floor coordinate system to the motion capture coordinate system is computed as follows. Vector OX is computed from the positional coordinates of origin and x-axis markers.
),( 1212 zzxxOX −−= (15)
The rotation angle θ is given by atan2 (z2-z1, x2-x1), which is the counter-clockwise angle in radians between the x-axis of motion capture coordinate system and the vector OX (x-axis) of the floor coordinate system.
5.2.3 Translation
Since the origin marker is placed two mats from the top and two mats from the left of the actual floor boundary, the translation TSX = -96 (since 2 mats x 48 columns/mat = 96 columns) and TSZ = -84 (since 2 mats x 42 rows/mat = 84 rows). Thus the translation in ‘mm’ units is obtained by multiplying with their respective scaling factors.
XMX ST ×−= 96 ZMZ ST ×−= 84 (16)
The actual translation parameters (TX, TZ) are then calculated by rotating the above parameters by an angle θ and adding to the origin vector.
⎥⎦⎤⎢⎣
⎡−+= θθ
θθcossin
sincos),(),(),( 11 MZMXZX TTzxTT (17)
5.2.4 Coordinate transformation equations
The coordinate transformation parameters namely scaling (SX, SZ), rotation (θ) and translation (TX, TZ) are computed from the above equations. Now given the actual floor coordinate (XF, ZF) of a point and the coordinate transformation parameters, (XM, ZM) the coordinate of the point in the motion capture coordinate space is given by
⎥⎥⎥⎦
⎤⎢⎢⎢⎣
⎡⎥⎥⎥⎦
⎤⎢⎢⎢⎣
⎡ −=
⎥⎥⎥⎦
⎤⎢⎢⎢⎣
⎡1
100
cossin
sincos
1
F
F
ZYX
XYX
M
M
Z
X
TSS
TSS
Z
X
θθθθ
(18)
www.intechopen.com

Design Optimization of Pressure Sensing Floor for Multimodal Human-Computer Interaction
159
After the implementation of spatial alignment, experimental data are collected and shown in Table 3. Pressure is applied on the sensors in the neighbourhood of the origin of the motion capture system including the sensor situated at the origin. Sensor 0 of mat 36 corresponds to the origin of the motion capture coordinate system. Transformed coordinates of this sensor gives a value (1.94395, 0, -3.53732) which reveals a good accuracy of spatial alignment. Each sensor has a total area of 10 mm x 10 mm thereby explaining the reason for this offset.
FRAME
# XF ZF VALUE
MAT
#
SENSOR
INDEX XM YM ZM
38939 192 167 29 28 41 1.01874 0 -13.6887
38939 192 168 27 36 0 1.94395 0 -3.53732
38939 192 169 22 36 1 2.86916 0 6.61411
Table 3. Tabulation of collected pressure data in an around the origin of the motion capture coordinate space. Transformed floor coordinates in the motion capture coordinate space are also shown in last three columns.
6. Applications in Multimodal Movement Sensing and Analysis
6.1 Balance Analysis
Falling is one of the major health concerns for elderly people and incidence of falls is high for persons aged over 75. Hence an efficient fall detection system is necessary to detect potential situations of fall and signal the user of an impending fall or alert for assistance after the person is immobilized by fall. The state of body balance is the feature of interest in fall detection systems. The state of body balance is characterized by centre of gravity (COG) and centre of pressure (COP). COG is computed from the motion capture data by assigning weight to each marker and computing the weighted mean. If the weight of each marker represents the weight of the body mass around that marker, the weighted mean is a good approximation of the centre of gravity. Similarly the COP is the weighted mean of all the pressure data points. The subject’s overall state of balance is determined by the relative positions of the COG and COP. If the COG is directly above the COP, the subject is in a state of balance.As COP and COG moves away from each other, the subject slowly transitions into a state of off-balance. Thus it is obvious that time synchronization and spatial alignment of both sensing systems are critical for such an exercise. Since feelings of balance are visceral in human beings, such a quantitative approach paves way to tie the behavior of the system to a sensation/feeling that is very internal and apparent to the user and thereby complementing human computer interaction.
www.intechopen.com
Human-Computer Interaction
160
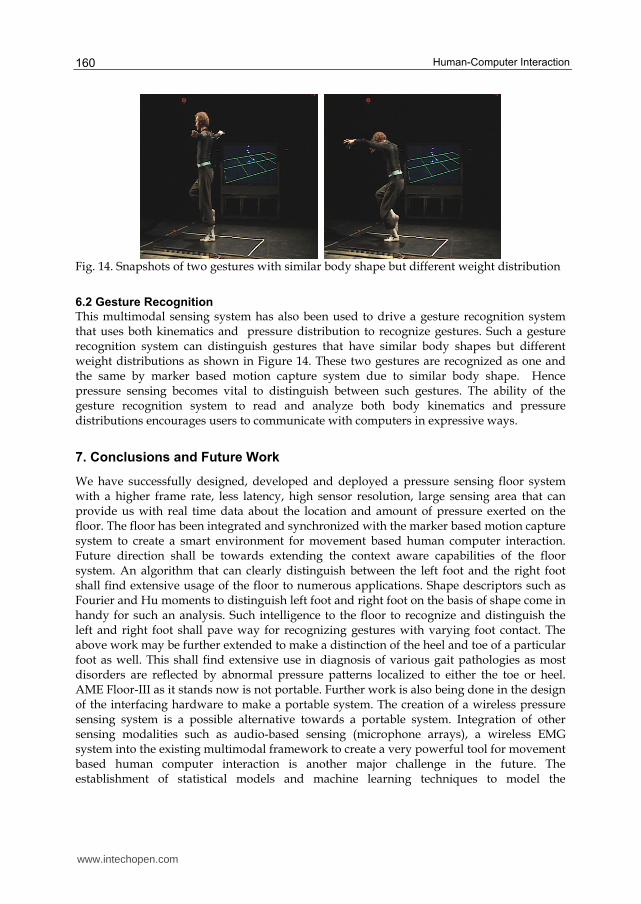
Fig. 14. Snapshots of two gestures with similar body shape but different weight distribution
6.2 Gesture Recognition
This multimodal sensing system has also been used to drive a gesture recognition system that uses both kinematics and pressure distribution to recognize gestures. Such a gesture recognition system can distinguish gestures that have similar body shapes but different weight distributions as shown in Figure 14. These two gestures are recognized as one and the same by marker based motion capture system due to similar body shape. Hence pressure sensing becomes vital to distinguish between such gestures. The ability of the gesture recognition system to read and analyze both body kinematics and pressure distributions encourages users to communicate with computers in expressive ways.
7. Conclusions and Future Work
We have successfully designed, developed and deployed a pressure sensing floor system with a higher frame rate, less latency, high sensor resolution, large sensing area that can provide us with real time data about the location and amount of pressure exerted on the floor. The floor has been integrated and synchronized with the marker based motion capture system to create a smart environment for movement based human computer interaction. Future direction shall be towards extending the context aware capabilities of the floor system. An algorithm that can clearly distinguish between the left foot and the right foot shall find extensive usage of the floor to numerous applications. Shape descriptors such as Fourier and Hu moments to distinguish left foot and right foot on the basis of shape come in handy for such an analysis. Such intelligence to the floor to recognize and distinguish the left and right foot shall pave way for recognizing gestures with varying foot contact. The above work may be further extended to make a distinction of the heel and toe of a particular foot as well. This shall find extensive use in diagnosis of various gait pathologies as most disorders are reflected by abnormal pressure patterns localized to either the toe or heel. AME Floor-III as it stands now is not portable. Further work is also being done in the design of the interfacing hardware to make a portable system. The creation of a wireless pressure sensing system is a possible alternative towards a portable system. Integration of other sensing modalities such as audio-based sensing (microphone arrays), a wireless EMG system into the existing multimodal framework to create a very powerful tool for movement based human computer interaction is another major challenge in the future. The establishment of statistical models and machine learning techniques to model the
www.intechopen.com

Design Optimization of Pressure Sensing Floor for Multimodal Human-Computer Interaction
161
underlying relationships of human movement information sensed by the system are also being investigated.
8. Acknowledgement
The authors thank Mr. David Lorig of Arts, Media and Engineering Program, Arizona State University for building the floor supporting frame and installing the floor. This chapter is based upon work partly supported by U.S. National Science Foundation on CISE-RI no. 0403428 and IGERT no. 0504647. Any opinions, findings and conclusions or recommendations expressed in this material are those of the author(s) and do not necessarily reflect the views of the U.S. National Science Foundation (NSF).
9. References
Addlesee, M.; Jones, A., Livesey, F. & Samaria, F, (1997). The ORL active floor. IEEE Personal Communications, 97, 35-41.
Birchfield, D.; Ciufo, T., Minyard, G., Qian, G., Savenye, W., Sundaram, H., Thornburg, H. & Todd, C. (2006). SMALLab: a mediated platform for education. Proceedings of the 33rd International Conference and Exhibition on Computer Graphics and Interactive Techniques in conjunction with SIGGRAPH, Boston, MA, 2006.
Chen, Y.; Huang, H., Xu, W., Wallis, R. I. , Sundaram, H., Rikakis, T., He, J., Ingalls, T. & Olson, L. The design of a real-time, multimodal feedback system for stroke patient rehabilitation. (2006). Proceedings of ACM Multimedia
Cheng, Y. (1995). Mean shift, mode seeking and clustering, IEEE Transactions on Pattern Analysis and Machine Intelligence, Vol. 17, No. 8, pp.790-799.
Comaniciu, D.; Ramesh, V. & Meer, P. (2000). Real-time tracking of non-rigid objects using mean shift, IEEE Conf. Computer Vision and Pattern Recognition, pp.142-149.
Griffith, N. & Fernström, M. (1998). LiteFoot:A floor space for recording dance and controlling media.Proceedings of International Computer Music Conference, pp.475-481.
Jaimes, A. & Sebe, N. (2007). Multimodal Human-Computer Interaction: A Survey, Computer Vision and Image Understanding, Vol. 108, No. 1-2, pp. 116-134.
Kidané, A.; Rodriguez, A., Cifdaloz, O. & Harikrishnan, V. (2004). ISAfloor: A high resolution floor sensor with 3D visualization and multimedia interface capability. Technical Report, AME Program, Arizona State University.
Middleton, L., Buss, A. A., Bazin, A. I. and Nixon, M. S. (2005) A floor sensor system for gait recognition. Proceedings of the Fourth IEEE Workshop on Automatic Identification Advanced Technologies, pp 171-176., Buffalo, New York, USA, 17-18 October, 2005
Morishita, H.; Fukui, R. & Sato, T. (2002) .High resolution pressure sensor distributed floor for future human-robot symbiosis environments. International Conference on Intelligent Robots and Systems, pp. 7803-7398.
Paradiso, J.; Hsiao, K., Benbasat, A. & Teegarden, Z. (2000). Design and implementation of Expressive Footwear, IBM Systems Journal, Vol. 39, No. 3 - 4, pp. 511-52.
Paradiso, J.; Abler, C., Hsiao, K. & Reynolds, M. (1997). The Magic Carpet: Physical sensing for immersive environments. ACM Press, Ext. Abstracts CHI, pp. 277- 278.
www.intechopen.com

Human-Computer Interaction
162
Qian, G.; Guo, F., Ingalls, T., Olson, L., James, J. & Rikakis, T. (2004). A gesture-driven multimodal interactive dance system. Proceedings of IEEE International Conference on Multimedia and Expo, Taibei, Taiwan, China, 2004
Richardson, B.; Leydon, K., Fernström, M. & Paradiso, J. (2004). Z-Tiles: building blocks for modular, pressure-sensing floorspaces. Extended Abstracts of the conference on Human factors and computing systems, pp. 1529-1532.
Rangarajan, S., ; Kidané, A., Qian, G., Rajko, S. & Birchfield D. (2007a). Design of a pressure sensing floor for movement based human computer interaction. Proceedings of European Conference on Smart Sensing and Context (EuroSSC), pp. 46-61. Lake District, UK, LNCS 4793, Springer-Verlag Berlin Heidelberg.
Rangarajan, S. (2007b). Design optimization and multimodal integration of a large area pressure sensing floor, Master’s Thesis, Arizona State University
Srinivasan, P., (2006). Design of a Large area pressure sensing floor – A thesis presented for the requirements Master of Science Degree, Arizona State University, 06.
Srinivasan, P.; Birchfield, D., Qian, G. & Kidané, A., (2005). A Pressure Sensing Floor for Interactive Media Applications. Proceedings of ACM SIGCHI International Conference on Advances in Computer Entertainment Technology, pp. 278-281
www.intechopen.com

Human Computer InteractionEdited by Ioannis Pavlidis
ISBN 978-953-7619-19-0Hard cover, 522 pagesPublisher InTechPublished online 01, October, 2008Published in print edition October, 2008
InTech EuropeUniversity Campus STeP Ri Slavka Krautzeka 83/A 51000 Rijeka, Croatia Phone: +385 (51) 770 447 Fax: +385 (51) 686 166www.intechopen.com
InTech ChinaUnit 405, Office Block, Hotel Equatorial Shanghai No.65, Yan An Road (West), Shanghai, 200040, China
Phone: +86-21-62489820 Fax: +86-21-62489821
This book includes 23 chapters introducing basic research, advanced developments and applications. Thebook covers topics such us modeling and practical realization of robotic control for different applications,researching of the problems of stability and robustness, automation in algorithm and program developmentswith application in speech signal processing and linguistic research, system's applied control, computations,and control theory application in mechanics and electronics.
How to referenceIn order to correctly reference this scholarly work, feel free to copy and paste the following:
Sankar Rangarajan, Assegid Kidane, Gang Qian and Stjepan Rajko (2008). Design Optimization of PressureSensing Floor for Multimodal Human-Computer Interaction, Human Computer Interaction, Ioannis Pavlidis(Ed.), ISBN: 978-953-7619-19-0, InTech, Available from:http://www.intechopen.com/books/human_computer_interaction/design_optimization_of_pressure_sensing_floor_for_multimodal_human-computer_interaction

© 2008 The Author(s). Licensee IntechOpen. This chapter is distributedunder the terms of the Creative Commons Attribution-NonCommercial-ShareAlike-3.0 License, which permits use, distribution and reproduction fornon-commercial purposes, provided the original is properly cited andderivative works building on this content are distributed under the samelicense.