designed by alok nanda and company, printed by … marico bangladesh limited kaya middle east fze...
TRANSCRIPT

Designed by Alok Nanda and Company, Printed by Dhote Offset Technokrafts Pvt. Ltd.

1
MARICO BANGLADESH LIMITED
Company Information ..........................................................3
Chairman’s Letter to Shareholders ......................................4
Corporate Governance Report ............................................5
Corporate Governance Compliance Report ........................6
Directors’ Report ..................................................................9
Directors’ Report Annexure-1 ............................................13
Directors’ Report Annexure-2 ...........................................14
Auditors’ Report .................................................................15
Balance Sheet ...................................................................16
Profi t and Loss Account .....................................................17
Statement of Comprehensive Income ...............................17
Cash Flows Stateme nt ......................................................18
Statement of Changes in Shareholders’ Equity .................19
Notes to the Financial Statements.....................................20
MBL INDUSTRIES LIMITED
Company Information ........................................................41
Directors’ Report ................................................................42
Auditors’ Report .................................................................43
Balance sheet ....................................................................44
Profi t and loss account ......................................................45
Cash Flow Statement ........................................................46
Statement of changes in Shareholders’ Equity ..................47
Notes to the Financial Statements.....................................48
KAYA LIMITED
Company Information ........................................................53
Directors’ Report ................................................................54
Auditors’ Report ................................................................57
Annexure to Auditor’s Report ............................................58
Balance Sheet ...................................................................60
Statement of Profi t and Loss .............................................61
Cash Flow Statement ........................................................62
Notes To Financial Statements ..........................................63
DERMA - Rx INTERNATIONAL AESTHETICS PTE LTD.
Company Information ........................................................86
Directors’ Report ................................................................87
Statement by Directors’ ....................................................88
Independent Auditor’s Report ............................................89
Statement of Comprehensive Income ...............................90
Balance Sheet ...................................................................91
Statement of Changes in Equity ........................................92
Statement of Cash Flows ..................................................93
Notes to The Financial Statements ...................................94
THE DRx CLINIC PTE LTD.
Company Information ...................................................... 110
Report of the Directors’ ................................................... 111
INDEXStatement by Directors .................................................... 112
Independent Auditors’ Report .......................................... 113
Balance Sheet ................................................................ 114
Statement of comprehensive income .............................. 115
Statement of Changes in Equity ...................................... 116
Statement of Cash Flows ................................................ 117
Notes to the Financial Statements ................................. 118
THE DRx MEDISPA PTE LTD.
Company Information ......................................................130
Report of the Directors’ ...................................................131
Statement by Directors ....................................................132
Independent Auditor’s Report ..........................................133
Balance Sheet ................................................................134
Statement of Comprehensive Income .............................135
Statement of Changes in Equity ......................................136
Statement of Cash Flows ................................................137
Notes to the Financial Statements ................................138
DRx INVESTMENTS PTE LTD
Company Information ......................................................151
Report of the Directors’ ...................................................152
Statement by Directors ....................................................153
Independent Auditor’s Report ..........................................154
Balance Sheet ................................................................155
Statement of Comprehensive Income .............................156
Statement of Changes in Equity ......................................157
Notes to the Financial Statements .................................159
DRx AESTHETICS SDN. BHD
Company Information ......................................................164
Directors’ report ...............................................................165
Statement by Directors ....................................................168
Statutory Declaration .......................................................169
Independent Auditors’ Report .........................................170
Income Statement ...........................................................172
Balance Sheet ................................................................173
Statement of Changes in Equity ......................................174
Statement of Cash Flows ................................................175
Notes to the Financial Statements ..................................176
Income statement ............................................................183
Schedule of Expenses .....................................................184
MARICO MIDDLE EAST FZE
Company Information ......................................................186
Independent Auditor’s Report .........................................187
Statement of Financial Position .......................................188
Statement of Comprehensive Income .............................189
Statement of Cash Flows ................................................190
Notes to The Financial Statements .................................191

2
M A R I C O B A N G L A D E S H L I M I T E D
2
KAYA MIDDLE EAST FZE
Company Information ......................................................204
Independent Auditors’ Report ..........................................205
Balance Sheet .................................................................206
Statement of Comprehensive Income .............................207
Statement of Changes In Equity ......................................208
Cash Flow Statement ......................................................209
Notes to The Financial Statements ................................210
MEL CONSUMER CARE SAE
Company Information ......................................................224
Independent Auditors’ Report ..........................................225
Balance Sheet .................................................................226
Income Statement ...........................................................227
Statement of Changes In Equity ......................................228
Unconsolidated Cash Flow Statement ...........................229
Notes to the Unconsolidated fi nancial Statement ............230
EGYPTIAN AMERICAN INVESTMENT AND INDUSTRIAL DEVELOPMENT COMPANY SAE
Company Information ......................................................238
Independent Auditors’ Report ..........................................239
Balance Sheet .................................................................240
Income Statement ...........................................................241
Statement of Changes In Equity ......................................242
Cash Flows Statement ....................................................243
Notes to The Financial Statements .................................244
MARICO EGYPT FOR INDUSTRIES (SAE)
Company Information ......................................................255
Independent Auditors’ Report ..........................................256
Balance Sheet .................................................................257
Income Statement ...........................................................258
Statement of Changes in Shareholders’ Equity ...............259
Cash Flow Statement ......................................................260
Notes to The Financial Statements .................................261
MARICO SOUTH AFRICA CONSUMER CARE (PTY) LIMITED
Company Information ......................................................273
Statement of Directors’ Responsibility ............................274
Report of The Directors’...................................................275
Independent Auditor’s Report to The Members ...............276
Statement of Financial Position .......................................277
Statement of Comprehensive Income .............................278
Statement of Changes In Equity ......................................279
Statement of Cash Flows ................................................280
Notes to The Financial Statements .................................281
MARICO SOUTH AFRICA (PTY) LIMITED
Company Information ......................................................299
Statement of Directors’ Responsibility .............................300
Independent Auditor’s Report ..........................................301
Report of The Directors’...................................................302
Statement of Financial Position .......................................303
Statement of Comprehensive Income .............................304
Statement of Changes In Equity ......................................305
Statement of Cash Flows ................................................306
Notes to The Financial Statements .................................307
MARICO MALAYSIA SDN. BHD
Company Information ......................................................322
Directors’ Report ..............................................................323
Statement by Directors ....................................................325
Statutory Declaration .......................................................325
Auditors’ Report ...............................................................326
Balance Sheet .................................................................327
Income Statement ...........................................................328
Statement of Changes in Equity ......................................329
Cash Flow Statement ......................................................330
Notes to The Financial Statements .................................331
Income Statements..........................................................338
INTERNATIONAL CONSUMER PRODUCTS CORPORATION
Company Information ......................................................341
Report of The Board of Management ..............................342
Independent Auditors’ Report ..........................................345
Balance Sheet .................................................................346
Separate Income Statement ............................................348
Cash Flow Statement ......................................................349
Notes to The Financial Statements .................................350
BEAUTÉ COSMÉTIQUE SOCIETÉ PAR ACTIONS
Company Information ......................................................370
Report of The Board of Management ..............................371
Independent Auditors’ Report ..........................................373
Balance Sheet .................................................................374
Income Statement ...........................................................376
Cash Flow Statement ......................................................377
Notes to The Financial Statements .................................378
THUAN PHAT FOODSTUFF JOINT STOCK COMPANY
Company Information ......................................................394
Report of The Board of Management ..............................395
Independent Auditors’ Report ..........................................397
Balance Sheet .................................................................398
Income Statement ...........................................................400
Cash Flow Statement ......................................................401
Notes To The Financial Statements .................................402
3
M A R I C O B A N G L A D E S H L I M I T E D
3
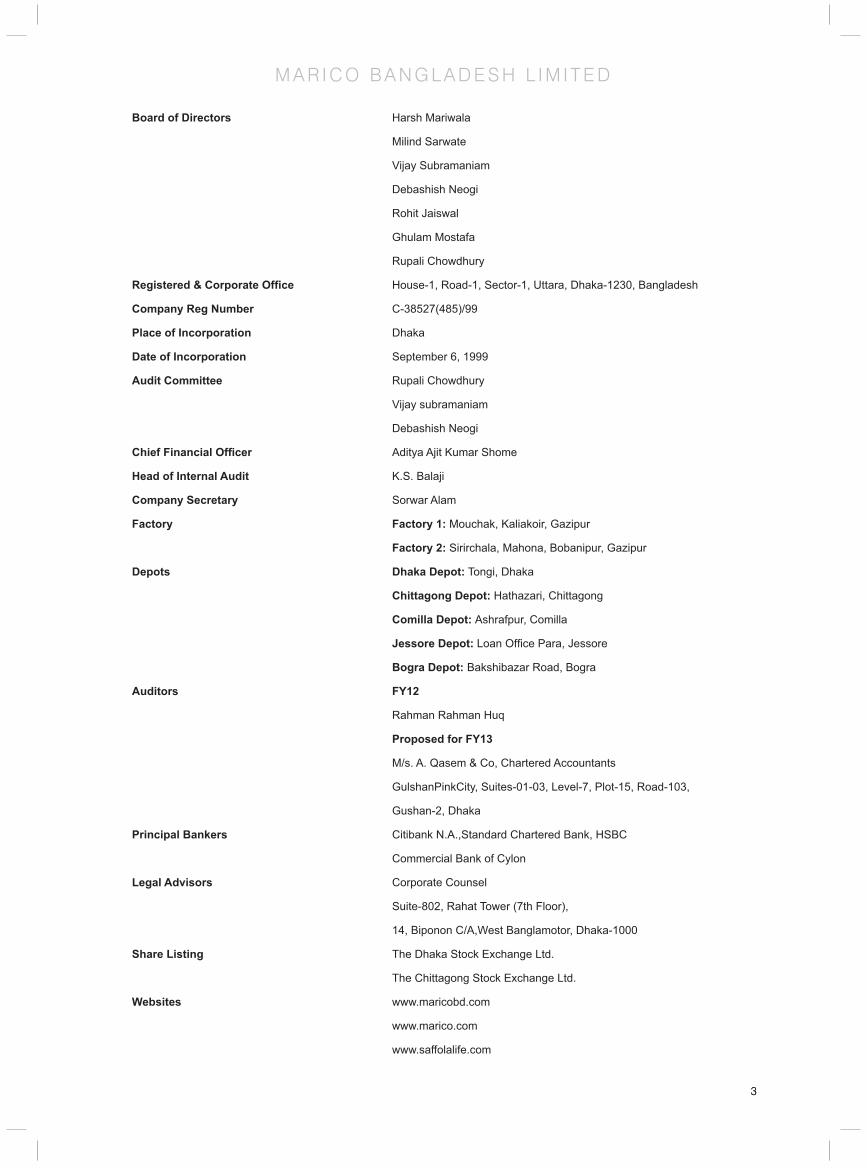
Board of Directors Harsh Mariwala
Milind Sarwate
Vijay Subramaniam
Debashish Neogi
Rohit Jaiswal
Ghulam Mostafa
Rupali Chowdhury
Registered & Corporate Offi ce House-1, Road-1, Sector-1, Uttara, Dhaka-1230, Bangladesh
Company Reg Number C-38527(485)/99
Place of Incorporation Dhaka
Date of Incorporation September 6, 1999
Audit Committee Rupali Chowdhury
Vijay subramaniam
Debashish Neogi
Chief Financial Offi cer Aditya Ajit Kumar Shome
Head of Internal Audit K.S. Balaji
Company Secretary Sorwar Alam
Factory Factory 1: Mouchak, Kaliakoir, Gazipur
Factory 2: Sirirchala, Mahona, Bobanipur, Gazipur
Depots Dhaka Depot: Tongi, Dhaka
Chittagong Depot: Hathazari, Chittagong
Comilla Depot: Ashrafpur, Comilla
Jessore Depot: Loan Offi ce Para, Jessore
Bogra Depot: Bakshibazar Road, Bogra
Auditors FY12
Rahman Rahman Huq
Proposed for FY13
M/s. A. Qasem & Co, Chartered Accountants
GulshanPinkCity, Suites-01-03, Level-7, Plot-15, Road-103,
Gushan-2, Dhaka
Principal Bankers Citibank N.A.,Standard Chartered Bank, HSBC
Commercial Bank of Cylon
Legal Advisors Corporate Counsel
Suite-802, Rahat Tower (7th Floor),
14, Biponon C/A,West Banglamotor, Dhaka-1000
Share Listing The Dhaka Stock Exchange Ltd.
The Chittagong Stock Exchange Ltd.
Websites www.maricobd.com
www.marico.com
www.saffolalife.com

4
M A R I C O B A N G L A D E S H L I M I T E D
4
Dear Shareholders,
We have completed a rather challenging year for FMCG companies including Marico Bangladesh. The year ended March 31, 2012 (FY’12) witnessed high infl ation, particularly food infl ation, unprecedented cost push especially in one of your company’s key input materials - copra, a rise in interest rates and devaluation of taka against the US dollar. In addition, political uncertainty and economic instability resulted in a severe liquidity crunch and shrinkage in Forex reserves of Bangladesh, which in turn adversely impacted the general business environment within the country.
Notwithstanding the challenges for the year, your company turned in a good performance. Your company registered a business growth of 11% over the previous fi nancial year. During the year however, a change in accounting practice covering depot VAT operations from truncated VAT to MOD-VAT, has led to a marginal decline of 1% in turnover over the previous year being reported. The acute cost push resulted in EBDITA margins declining by about 600 basis points as compared to corresponding period. Consequently, Earnings per Share (EPS) dropped from Tk. 24.46 in corresponding period to Tk. 17 in FY’12.
Your company’s fl agship brand Parachute maintained its clear leadership position and I believe with its loyal consumer franchise, Parachute is now amongst the top fi ve leading brands in the country. At the same time, in the hair dye segment, Hair Code has now become a market leader with signifi cant market share. In order to create future growth engines, your company had launched Value Added Hair Oils in select segments through its focused approach. During FY’12, your company witnessed signifi cant market share gain in these.Our conviction in the long term potential of your business in Bangladesh continues to be strong. Your company continues to invest in infrastructure to support future growth. During the year, it made strategic investments in distribution by setting up new depot. It is also augmenting production capacity by establishing a new factory.
The strong foundation that has enabled us to realize success in the past will help us in preparing for the future. We remain committed to generating long term value for our investors through superior value propositions to consumers, widening our distribution reach, excellence in operations, innovative technology and continued efforts in brand building.
The road ahead is promising and I am sure you share my excitement about the future. Thank you for placing faith in the company. I also wish to thank all members of the Marico team and all our business associates for their contribution to Marico Bangladesh’s success. I look forward to your continued support and co-operation.
With warm regards,
Harsh MariwalaChairman
CHAIRMAN’S LETTER TO SHAREHOLDERS

5
M A R I C O B A N G L A D E S H L I M I T E D
5
CORPORATE GOVERNANCE REPORTMarico Bangladesh Limited (MBL) believes that Corporate Governance is not an end in itself but is a catalyst in the process towards maximization of shareholder value. Therefore, shareholder value as an objective is woven into all aspects of Corporate Governance - the underlying philosophy, development of roles, creation of structures and continuous compliance with standard practices, compliance with SEC Corporate Governance Guideline Notifi cation. MBL follows Securities & Exchange Commission Corporate Governance guideline issued on February 20, 2006 vide notifi cation no. SEC/CMRRCD/2006-158/Admin/02-08.
Board of Directors:
MBL’s Board of Directors consists of 7 (seven) members including the Managing Director. Among the members, two are non-shareholding non-executive independent directors. The Managing Director sits as a member of the Board of Directors.
Chief Financial Offi cer, Head of Internal Audit and Company Secretary:
The Board of Directors has engaged Mr. Aditya Shome as Chief Financial Offi cer, Mr. Balaji K.S. as Head of Internal Audit and Mr. Sorwar Alam as Company Secretary of the company.
Audit Committee:
The Board of Directors has constituted an Audit Committee as a sub-committee of the Board. There are 3 (three) members to the committee (excluding the Company Secretary).
External/Statutory Auditors:
Till to 12th Annual General Meeting (AGM) to be held on July 19, 2012, M/s. Rahman Rahman Huq is acting as statutory auditors. They are not involved with any other services of the company in the period. As per Securities & Exchange Commissioner (SEC) notifi cation No.SEC/CMRRCD/2009-193/104/Admin dated on July 27, 2011; every publicly listed company shall not appoint any fi rm of chartered accountants as its statutory auditors for a consecutive period exceeding three years. Therefore, the board of directors has proposed M/s. A. Qasem & Co. to engage as statutory auditors (subject to approval at the 12th Annual General Mee ng to be held on July 19, 2012 by members of the company) up to 13th Annual General Meeting to be held on 2013.
Status of Compliance with Securities and Exchange Commission’s Notifi cation No- SEC/CMRRCD/2006-158/ Admin/02-08 dated 20th February, 2006. The checklist is attached hereunder:-
SEC Compliance Status
Condition No. Title Compliance
Status
Explanation for Non Compliance
with the Condition
1.1 Board’s Size: Board members should not be less than 5 (fi ve) or more than 20 (twenty)
Complied
1.2 (i) Independent Director: At least 1/10th Complied
1.2 (ii) Appointment of Independent Director by Elected Directors Complied
1.3 Individual Chairman of the Board and Chief Execu ve Offi cer, with defi ned roles and responsibilities
Complied
1.4 The Directors to report shareholder on:
1.4 (a) Fairness of Financial Statements Complied
1.4 (b) Maintenance of proper Books of Accounts Complied
1.4 (c) Adaptation of proper accounting policies and estimates Complied
1.4 (d) Compliance with International Accounting Standard Complied
1.4 (e) Soundness on Internal Control Systems Complied
1.4 (f) Ability to continue as a Going Concern Complied
1.4 (g) Signifi cant deviation from last year Complied
1.4 (h) Presentation of last three years data Complied
1.4 (i) Declaration of Dividend Complied
6
M A R I C O B A N G L A D E S H L I M I T E D
6
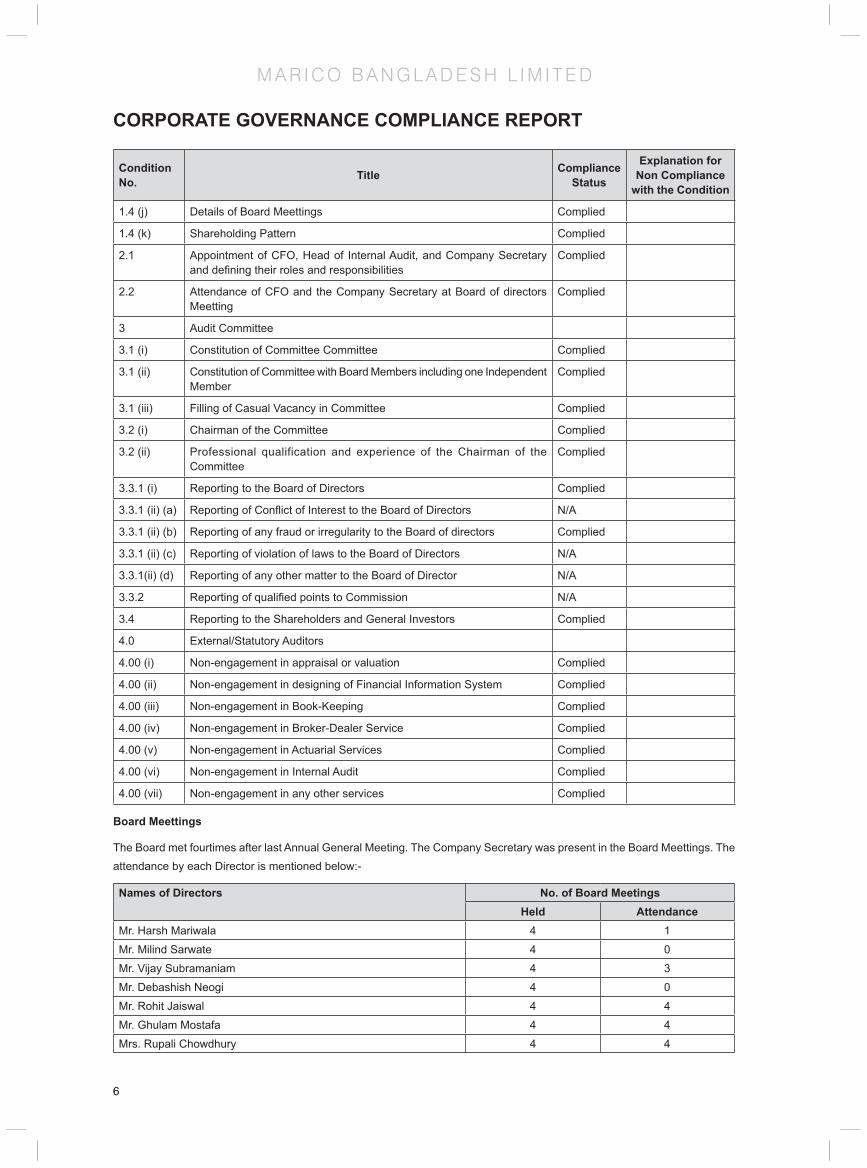
CORPORATE GOVERNANCE COMPLIANCE REPORT
Condition No. Title Compliance
Status
Explanation for Non Compliance
with the Condition
1.4 (j) Details of Board Meettings Complied
1.4 (k) Shareholding Pattern Complied
2.1 Appointment of CFO, Head of Internal Audit, and Company Secretary and defi ning their roles and responsibilities
Complied
2.2 Attendance of CFO and the Company Secretary at Board of directors Meetting
Complied
3 Audit Committee
3.1 (i) Constitution of Committee Committee Complied
3.1 (ii) Constitution of Committee with Board Members including one Independent Member
Complied
3.1 (iii) Filling of Casual Vacancy in Committee Complied
3.2 (i) Chairman of the Committee Complied
3.2 (ii) Professional qualification and experience of the Chairman of the Committee
Complied
3.3.1 (i) Reporting to the Board of Directors Complied
3.3.1 (ii) (a) Reporting of Confl ict of Interest to the Board of Directors N/A
3.3.1 (ii) (b) Reporting of any fraud or irregularity to the Board of directors Complied
3.3.1 (ii) (c) Reporting of violation of laws to the Board of Directors N/A
3.3.1(ii) (d) Reporting of any other matter to the Board of Director N/A
3.3.2 Reporting of qualifi ed points to Commission N/A
3.4 Reporting to the Shareholders and General Investors Complied
4.0 External/Statutory Auditors
4.00 (i) Non-engagement in appraisal or valuation Complied
4.00 (ii) Non-engagement in designing of Financial Information System Complied
4.00 (iii) Non-engagement in Book-Keeping Complied
4.00 (iv) Non-engagement in Broker-Dealer Service Complied
4.00 (v) Non-engagement in Actuarial Services Complied
4.00 (vi) Non-engagement in Internal Audit Complied
4.00 (vii) Non-engagement in any other services Complied
Board Meettings
The Board met fourtimes after last Annual General Meeting. The Company Secretary was present in the Board Meettings. The attendance by each Director is mentioned below:-
Names of Directors No. of Board MeetingsHeld Attendance
Mr. Harsh Mariwala 4 1
Mr. Milind Sarwate 4 0
Mr. Vijay Subramaniam 4 3
Mr. Debashish Neogi 4 0
Mr. Rohit Jaiswal 4 4
Mr. Ghulam Mostafa 4 4
Mrs. Rupali Chowdhury 4 4
7
M A R I C O B A N G L A D E S H L I M I T E D
7
CORPORATE GOVERNANCE COMPLIANCE REPORTAUDIT COMMITTEE
Constitution:
The Audit Committee was constituted by the Board of Directors at its meeting held on November 26, 2009, in accordance with Securities and Exchange Commission, Corporate Governance Guideline vide notifi cation no SEC/CMRRCD/2006-158/Admin/02-08 dated February 20, 2006. The Audit Committee was last reconstituted by the Board of Directors on March 22, 2010.
The Audit Commi!ee now comprises the following Members:
Mrs. Rupali Chowdhury Chairman
Mr. Vijay Subramaniam Member
Mr. Debashish Neogi Member
The Company Secretary acts as the secretary to the Audit Committee. The Audit Committee reports to the Board of Directors. It usually notifi es Board of Directors along with oversight of the Company’s fi nancial reporting process and the disclosure of its fi nancial information to ensure that the fi nancial statement is correct, suffi cient and credible.
Moreover, M/s Hossain Farhad & Co., a local Chartered Accountant Firm that conducts audits throughout the year and M/s Ernst & Young, India a Chartered Accountants Firm from India reports to the audit committee which is undertaken on a continuous basis covering areas across the value chain such as manufacturing operations, sales and distribution, marketing and fi nance. The Committee has not met during the year for any meetting.
Details of Directors seeking reappointment at the forthcoming Annual General Meetting:
Mr. Ghulam Mostafa
Mr. Mostafa is the Managing Director of Kallol Group of Companies. Kallol group of companies now represents leading FMCG brands such as Cadbury, Kellogg, and internationally renowned brands of watches and writing instruments. Mr. Mostafa has been awarded the status of CIP for three times. He has also been twice honored by the National Board of Revenue as the highest VAT payer in business category.
Mrs. Rupali Chowdhury
Mrs. Chowdhury is the Managing Director of Berger Paints Bangladesh Limited. She brings with her a rich experience of managing various functions at Berger Paints. She is a Member of the Executive Committee of Foreign Investors’ Chamber of Commerce & Industry (FICCI). She is also a Member of the Holiday Sub Committee of Metropolitan Chamber of Commerce and Industry, Dhaka (MCCI) and a Member of the Labour Law Sub-Committee of Bangladesh Employers’ Federation (BEF). She has received several prestigious awards for her contribution in the areas of management and business in Bangladesh.
Stock Price Information and Stock Performance
Our common stock is traded on the Dhaka Stock Exchange and Chittagong Stock Exchange under the symbol MARICO.
Securities Transactions Insider Trading Policy
The Company has a formal Insider Trading Policy and Disclosure of Dealings in Securities Policy on dealings in the securities of the Company, which sets out the implications of insider trading and guidance on such dealings. The policy has been distributed to the directors and offi cers. In compliance with SEC (Prohibi on of Insider Trading) Rules, 1995 & relevant notifi cations on best practices on dealing in securities, the Company issues circulars to its Directors and offi cers informing that the Company and its offi cers must not deal in listed securities of the Company two month before the release of the full-year results and before closing day of quarterly fi nancial statements to the day of board meeting to be held and before the release of quarterly results, and if they are in possession of unpublished price sensitive information.
8
M A R I C O B A N G L A D E S H L I M I T E D
8
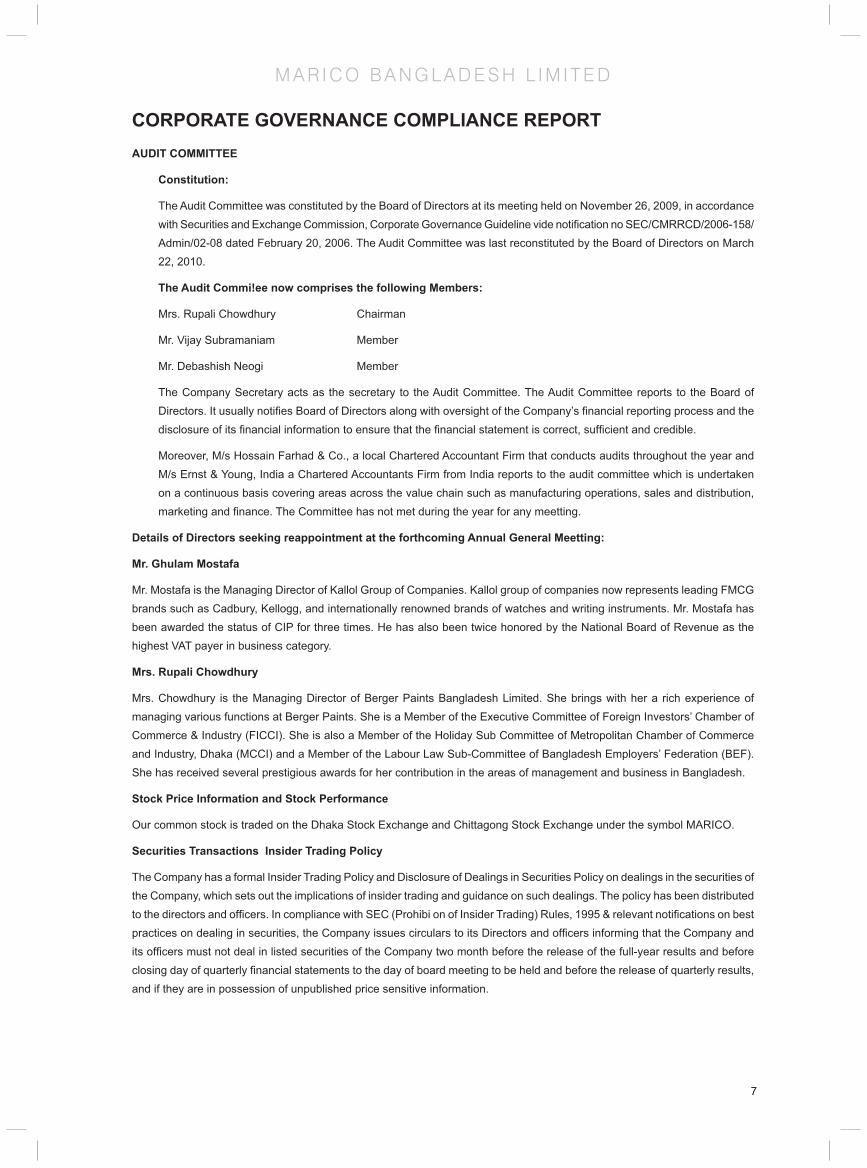
CORPORATE GOVERNANCE COMPLIANCE REPORTPattern of Shareholding on Record Date-May 21, 2012
Particulars No of Shares Percentage
Parent Company:
Marico Limited 28,349,993 90.00%
Other Related Parties:
Board of Directors:
Hash Mariwala, Chairman 1
Milind Sarwate, Director 1
Vijay Subramaniam, Director 1
Debashish Neogi, Director 1
Rohit Jaiswal, Managing Director 1
Aditya Shome, CFO and Spouse and Minor Children: –
Balaji K.S. Head of Internal Audit and Spouse and Minor Children: 1
Sorwar Alam, CS and Spouse and Minor Children: 2,800
Executives (Top 5 Salaried Person Other than MD, CFO, HIA, CS):
Ashikur Rahman –
Subir De –
Mohammad Iqbal Chowdhury 4,150
Moin Uddin Ahmed Khan 6,050
Shahid Hossain 5,000
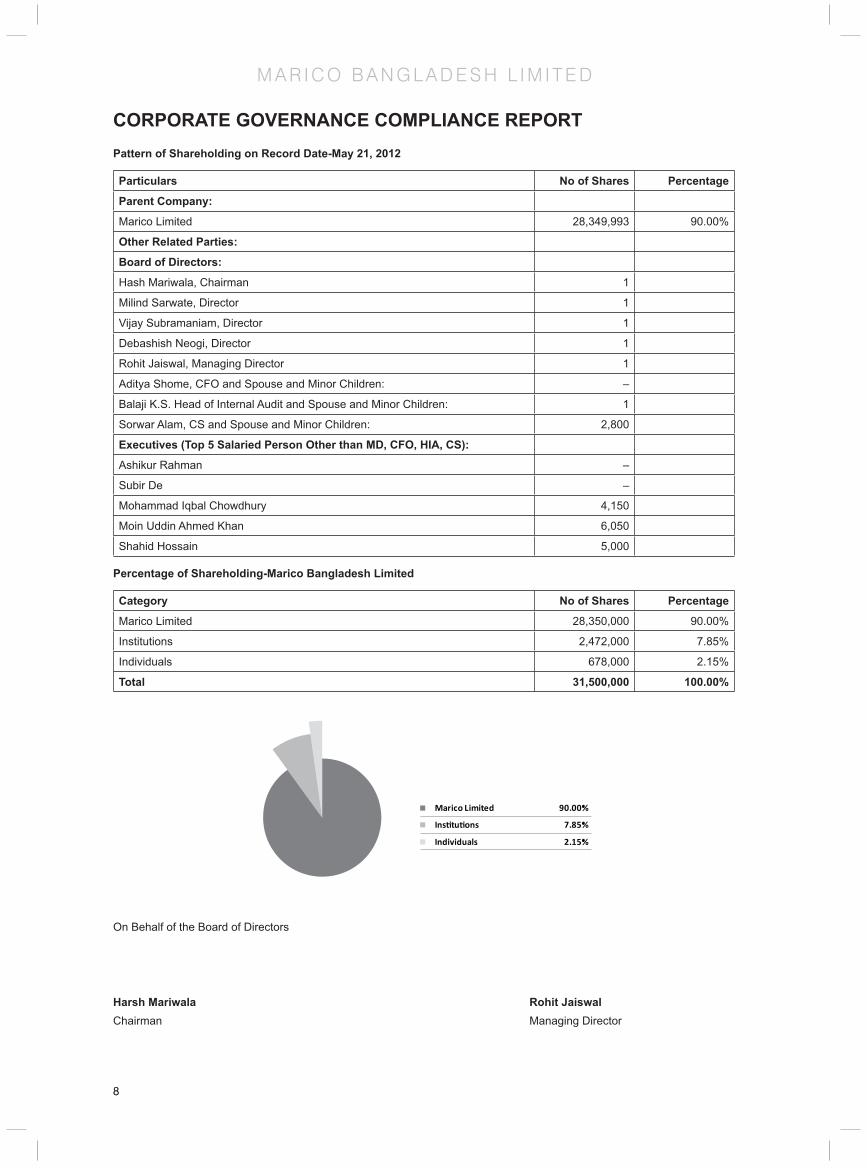
Percentage of Shareholding-Marico Bangladesh Limited
Category No of Shares Percentage
Marico Limited 28,350,000 90.00%
Institutions 2,472,000 7.85%
Individuals 678,000 2.15%
Total 31,500,000 100.00%
On Behalf of the Board of Directors
Harsh Mariwala Rohit JaiswalChairman Managing Director
9
M A R I C O B A N G L A D E S H L I M I T E D
9
DIRECTORS’ REPORTTo the Members
Your Board of Directors (“Board”) is pleased to present the third Annual Report of your company, Marico Bangladesh Limited after being listed to stock exchanges for the period ended March 31, 2012 (‘the period under review’, ‘the reporting period’, or ‘FY12’).
This report is prepared in compliance with section 184 of the Companies Act 1994 and Securities & Exchange Commission Order no-SEC/CMRRCD/2006-158/Admin/02-08 dated February 20, 2006.
Principal Activities
The principal activities of the company continued to be manufacturing and marketing of Fast Moving Consumer Goods (‘FMCG’). The company is the manufacturer and marketer of well-known brands like Parachute, Parachute Advansed, Parachute Beliphool, Parachute Advansed Cooling Hair Oil, Haircode, Nihar, etc.
Key Brands Performances
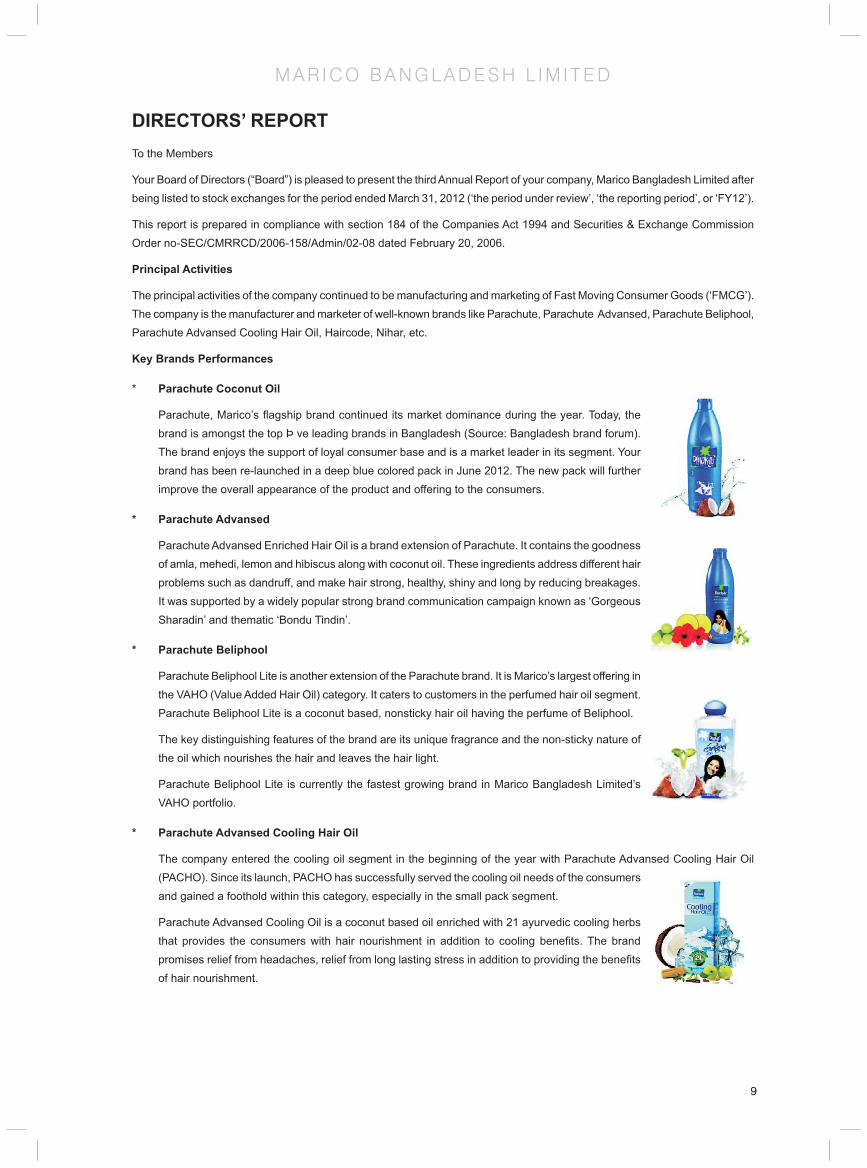
* Parachute Coconut Oil
Parachute, Marico’s fl agship brand continued its market dominance during the year. Today, the brand is amongst the top Þ ve leading brands in Bangladesh (Source: Bangladesh brand forum). The brand enjoys the support of loyal consumer base and is a market leader in its segment. Your brand has been re-launched in a deep blue colored pack in June 2012. The new pack will further improve the overall appearance of the product and offering to the consumers.
* Parachute Advansed
Parachute Advansed Enriched Hair Oil is a brand extension of Parachute. It contains the goodness of amla, mehedi, lemon and hibiscus along with coconut oil. These ingredients address different hair problems such as dandruff, and make hair strong, healthy, shiny and long by reducing breakages. It was supported by a widely popular strong brand communication campaign known as ‘Gorgeous Sharadin’ and thematic ‘Bondu Tindin’.
* Parachute Beliphool
Parachute Beliphool Lite is another extension of the Parachute brand. It is Marico’s largest offering in the VAHO (Value Added Hair Oil) category. It caters to customers in the perfumed hair oil segment. Parachute Beliphool Lite is a coconut based, nonsticky hair oil having the perfume of Beliphool.
The key distinguishing features of the brand are its unique fragrance and the non-sticky nature of the oil which nourishes the hair and leaves the hair light.
Parachute Beliphool Lite is currently the fastest growing brand in Marico Bangladesh Limited’s VAHO portfolio.
* Parachute Advansed Cooling Hair Oil
The company entered the cooling oil segment in the beginning of the year with Parachute Advansed Cooling Hair Oil (PACHO). Since its launch, PACHO has successfully served the cooling oil needs of the consumers and gained a foothold within this category, especially in the small pack segment.
Parachute Advansed Cooling Oil is a coconut based oil enriched with 21 ayurvedic cooling herbs that provides the consumers with hair nourishment in addition to cooling benefi ts. The brand promises relief from headaches, relief from long lasting stress in addition to providing the benefi ts of hair nourishment.
10
M A R I C O B A N G L A D E S H L I M I T E D
10
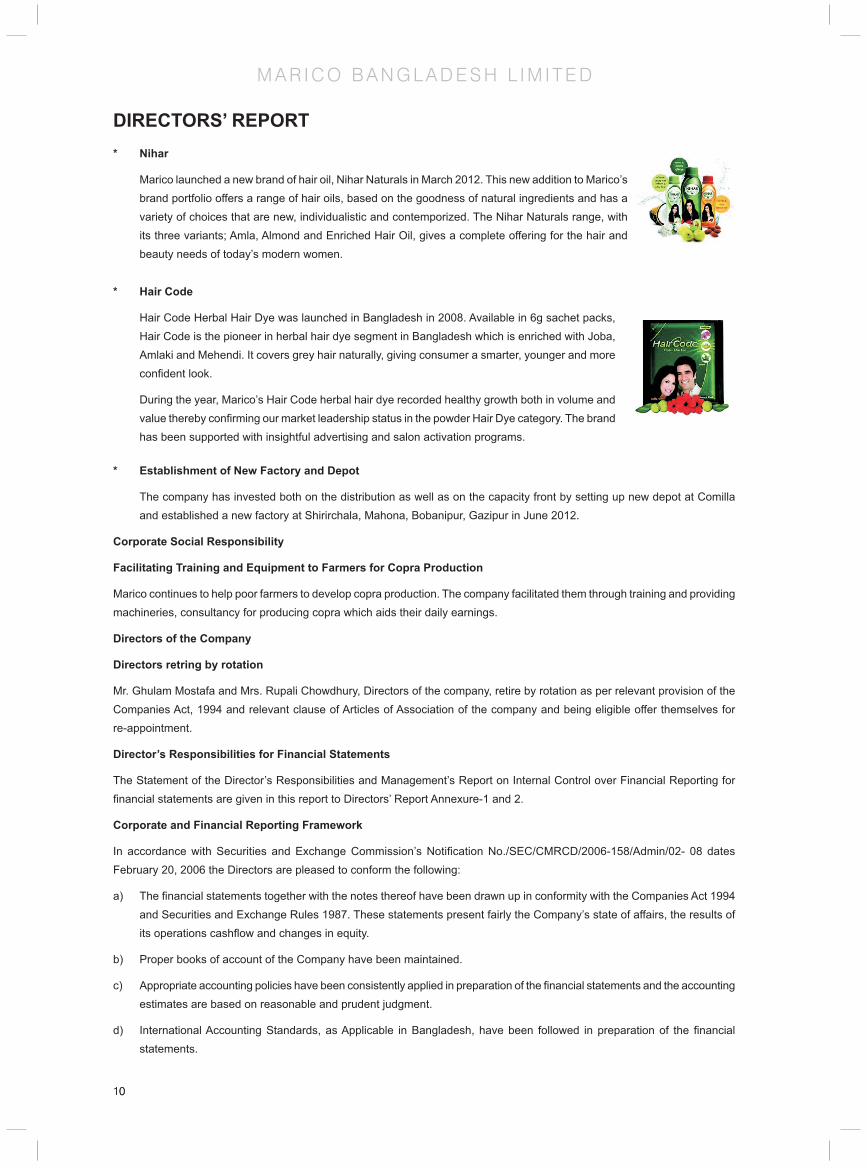
DIRECTORS’ REPORT* Nihar
Marico launched a new brand of hair oil, Nihar Naturals in March 2012. This new addition to Marico’s brand portfolio offers a range of hair oils, based on the goodness of natural ingredients and has a variety of choices that are new, individualistic and contemporized. The Nihar Naturals range, with its three variants; Amla, Almond and Enriched Hair Oil, gives a complete offering for the hair and beauty needs of today’s modern women.
* Hair Code
Hair Code Herbal Hair Dye was launched in Bangladesh in 2008. Available in 6g sachet packs, Hair Code is the pioneer in herbal hair dye segment in Bangladesh which is enriched with Joba, Amlaki and Mehendi. It covers grey hair naturally, giving consumer a smarter, younger and more confi dent look.
During the year, Marico’s Hair Code herbal hair dye recorded healthy growth both in volume and value thereby confi rming our market leadership status in the powder Hair Dye category. The brand has been supported with insightful advertising and salon activation programs.
* Establishment of New Factory and Depot
The company has invested both on the distribution as well as on the capacity front by setting up new depot at Comilla and established a new factory at Shirirchala, Mahona, Bobanipur, Gazipur in June 2012.
Corporate Social Responsibility
Facilitating Training and Equipment to Farmers for Copra Production
Marico continues to help poor farmers to develop copra production. The company facilitated them through training and providing machineries, consultancy for producing copra which aids their daily earnings.
Directors of the Company
Directors retring by rotation
Mr. Ghulam Mostafa and Mrs. Rupali Chowdhury, Directors of the company, retire by rotation as per relevant provision of the Companies Act, 1994 and relevant clause of Articles of Association of the company and being eligible offer themselves for re-appointment.
Director’s Responsibilities for Financial Statements
The Statement of the Director’s Responsibilities and Management’s Report on Internal Control over Financial Reporting for fi nancial statements are given in this report to Directors’ Report Annexure-1 and 2.
Corporate and Financial Reporting Framework
In accordance with Securities and Exchange Commission’s Notifi cation No./SEC/CMRCD/2006-158/Admin/02- 08 dates February 20, 2006 the Directors are pleased to conform the following:
a) The fi nancial statements together with the notes thereof have been drawn up in conformity with the Companies Act 1994 and Securities and Exchange Rules 1987. These statements present fairly the Company’s state of affairs, the results of its operations cashfl ow and changes in equity.
b) Proper books of account of the Company have been maintained.
c) Appropriate accounting policies have been consistently applied in preparation of the fi nancial statements and the accounting estimates are based on reasonable and prudent judgment.
d) International Accounting Standards, as Applicable in Bangladesh, have been followed in preparation of the fi nancial statements.

11
M A R I C O B A N G L A D E S H L I M I T E D
11
DIRECTORS’ REPORTe) The systems of internal controls are sound and have been effectively implemented and monitored.
f) There are no signifi cant doubts about the Company’s ability to continue as a going concern.
g) The signifi cant deviations from last year in operating results of the company have been highlighted in the report and reasons thereof have been explained.
h) The key operating and fi nancial data for the last fi ve years are annexed.
Results of Operations
Financial Year 2011-12 (FY12) Performance
Taka in Crore, except per share amounts 2012 2011
Turnover 604 612
Net earnings 54 77
Net earnings per share 17.00 24.46
Dividends per share 10 4.5*
Operating cash fl ow -16.87 15.65
Return on assets 12.15% 18.45%
Return on equity 21.15% 33.09%
*18 months period
For Financial Year ended March 31, 2012, Marico posted a turnover of Tk. 604 Crore under the new accounting method of MOD-VAT. However if the old VAT accounting system was to be followed, the turnover would have been Tk. 680 Crore net profi t after tax and earnings per share stood at Tk. 54 Crore and Tk. 17 per share respectively.
Dividend Distribution
Company’s distribution of dividend for the fi nancial year 2011-12 (FY12) comprised the following; Interim dividend of 100% on the paid up capital was Tk. 31.50 Crore.
No fi nal dividend has been recommended at the ensuing Annual General Meeting.
The total cash dividend for the reported fi nancial year (FY12) would be Tk. 31.50 Crore.
Contribution to National Exchequer
During the reporting period, your company paid Tk. 143 Crore (appx.) to the National Exchequer in the form of Corporate Income Tax, Customs Duties, Supplementary Duties, VAT and others.
Reserves
The total reserves of the company stood Tk. 232.50 Crore, details of which are shown in the Statement of Financial Position as share premium and retained earnings to the fi nancial statements.
Events subsequent to the Statement of Financial Posi on
No event has occurred since the Financial Position date, which would require adjustment or disclosure in the fi nancial statements.
Appointment of New Auditors
The auditors, M/s. Rahman Rahman Huq, Chartered Accountants, will retire at the conclusion of the ensuing Annual General Mee! ng. As per Securities & Exchange Commissioner (SEC) notifi tion No. SEC/CMRRCD/2009-193/104/Admin dated on July 27, 2011; every publicly listed company shall not appoint any fi rm of chartered accountants as its statutory auditors for a consecutive period exceeding three years. Therefore, the board of directors has proposed M/s. A. Qasem & Co to engage as statutory auditors (subject to approval at the 12th Annual General Meeting to be held on July 19, 2012 by members of the company) up to 13th Annual General Meeting to be held on 2013 with proposed Audit Fees of Tk. 4,00,000. M/s. A. Qasem & Co., Chartered
12
M A R I C O B A N G L A D E S H L I M I T E D
12
DIRECTORS’ REPORTAccountants have expressed their willingness to accept appointment as statutory auditors.
Acknowledgement
The members of the Board of Directors would like to take this opportunity to express their heartfelt thanks to all stakeholders such as employees, customers, consumers, Banks and fi nancial institutions, Regulatory bodies, Auditors, SEC, DSE, CSE, CDBL, Business Associates and fi nally the shareholders for their immense support and contribution towards the success of the Company.
On behalf of Board of Directors,
Harsh Mariwala Rohit Jaiswal
Chairman Managing Director

13
M A R I C O B A N G L A D E S H L I M I T E D
13
DIRECTORS’ REPORT ANNEXURE-1Directors’ Responsibilities for Financial Statements
The directors of the company are responsible for the integrity and accuracy of the fi nancial statements. The Board believes that the fi nancial statements for the year ended March 31, 2012 have been prepared in conformity with Bangladesh Accounting Standard (BAS), BFRS, Companies Act, 1994, SEC guidelines, Stock Exchanges Listing Regulations appropriate in the circumstances. In preparing the fi nancial statements, management with the consultation of the board makes informed judgments and estimates where necessary to refl ect the expected effects of events and transactions that have not been completed.
The Company’s disclosure controls and procedures ensure that material information required to be disclosed is recorded, processed, summarized and communicated to management and reported within the required time periods. In meeting its responsibility for the reliability of the fi nancial statements, management relies on a system of internal accounting control. This system is designed to provide reasonable assurance that assets are safeguarded and transactions are executed in accordance with the management’s authorization and recorded properly to permit the preparation of fi nancial statements in accordance with BAS/BFRS/IFRS. The design of this system recognizes that errors or irregularities may occur and that estimates and judgments are required to assess the relative cost and expected benefi ts of the controls.
Directors believe that the Company’s internal accoun ng controls provide reasonable assurance that errors or irregularities that could be material to the fi nancial statements are prevented or would be detected within a timely period. The Audit Committee of the Board of Directors, which is composed solely of independent directors, is responsible for overseeing the Company’s fi nancial reporting process.
The Audit Commttee meets with management and sees the report of the Company’s internal auditors periodically to review the work of each and to monitor the discharge by each of its responsibilities. The independent auditors are engaged to express an opinion on the Company’s fi nancial statements and on the Company’s internal control over fi nancial reporting. Their opinions are based on procedures that they believe to be suffi cient to provide reasonable assurance that the fi nancial statements contain no material errors and that the Company’s internal controls are effective.
On behalf of the board
Rohit JaiswalManaging Director
14
M A R I C O B A N G L A D E S H L I M I T E D
14
DIRECTORS’ REPORT ANNEXURE-2
Management’s Report on Internal Control over Financial Reporting
The Company’s management is responsible for establishing and maintaining adequate internal control over Financial reporting for the Company. With the participation of the Chief Financial Offi cer and Head of Internal Audit, management conducted an evaluation of the effectiveness of internal control over fi nancial reporting based on the framework and the criteria established in Internal Control - Integrated Framework, issued by the Audit Committee.
Based on this evaluation, management has concluded that internal control over fi nancial reporting was effective as of March 31, 2012. The Company’s auditor, Rahman Rahman Huq, Chartered Accountants, statutory auditors enlisted with The Institute of Chartered Accountants of Bangladesh (ICAB), has issued an audit report on the fi nancial statements.
Aditya Shome K.S. Balaji
Chief Financial Offi cer Head of Internal Audit
15
M A R I C O B A N G L A D E S H L I M I T E D
15
AUDITORS’ REPORTTo the Shareholders of Marico Bangladesh Limited
We have audited the accompanying fi nancial statements of Marico Bangladesh Limited ("the Company") which comprise the statement of fi nancial position as at 31 March 2012, and the related income statement, statement of comprehensive income, statement of changes in equity and statement of cash fl ows for the year then ended and a summary of signifi cant accounting policies and other relevant explanatory notes thereon.
Management’s responsibility for the fi nancial statements
Management is responsible for the preparation and fair presentation of these fi nancial statements in accordance with Bangladesh Financial Reporting Standards (BFRSs), and for such internal control as management determines is necessary to enable the preparation of fi nancial statements that are free from material misstatement, whether due to fraud or error.
Auditors’ responsibility
Our responsibility is to express an opinion on these fi nancial statements based on our audit. We conducted our audit in accordance with the Bangladesh Standards on Auditing (BSA). Those standards require that we comply with ethical requirements and plan and perform the audit to obtain reasonable assurance about whether the fi nancial statements are free of material misstatement.
An audit involves performing procedures to obtain audit evidence about the amounts and disclosures in the fi nancial statements. The procedures selected depend on the auditors’ judgment, including the assessment of the risks of material misstatement of the fi nancial statements, whether due to fraud or error. In making those risk assessments, the auditors consider internal control relevant to the entity’s preparation and fair presentation of the fi nancial statements in order to design audit procedures that are appropriate in the circumstances, but not for the purpose of expressing an opinion on the effectiveness of the entity’s internal control. An audit also includes evaluating the appropriateness of accounting policies used and the reasonableness of accounting estimates made by management, as well as evaluating the overall presentation of the fi nancial statements.
We believe that the audit evidence we have obtained is suffi cient and appropriate to provide a basis for our audit opinion.
Opinion
In our opinion, the fi nancial statements prepared in accordance with the Bangladesh Financial Reporting Standards (BFRSs), give a true and fair view of the fi nancial position of Marico Bangladesh Limited as at 31 March 2012, and of its fi nancial performance and its cash fl ows for the year then ended and comply with the Companies Act 1994, the Securities and Exchange Rules 1987 and other applicable laws and regulations.
We also report that:
a) we have obtained all the information and explanations which to the best of our knowledge and belief were necessary for the purpose of our audit and made due verifi cation thereof;
b) in our opinion, proper books of account as required by law have been kept by the Company so far as it appeared from our examination of those books;
c) the statement of fi nancial position and income statement dealt with by the report are in agreement with the books of account; and
d) the expenditure incurred were for the purpose of the Company's business.
Rahman Rahman Huq
Auditor
Dhaka, 24 April 2012
16
M A R I C O B A N G L A D E S H L I M I T E D
16
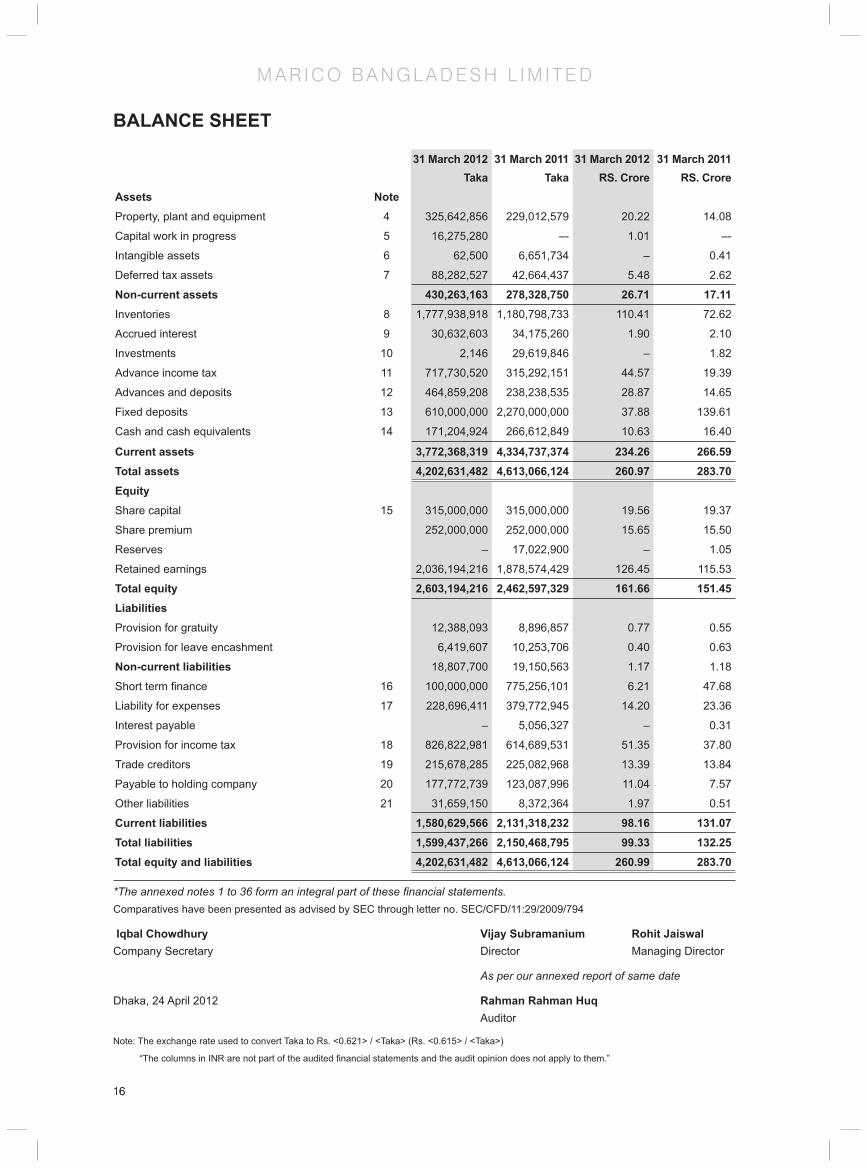
BALANCE SHEET
Note: The exchange rate used to convert Taka to Rs. <0.621> / <Taka> (Rs. <0.615> / <Taka>)
“The columns in INR are not part of the audited fi nancial statements and the audit opinion does not apply to them.”
*The annexed notes 1 to 36 form an integral part of these fi nancial statements.Comparatives have been presented as advised by SEC through letter no. SEC/CFD/11:29/2009/794
IIqbal ChowdhuryIqbal Chowdhury Vijay Subramaniumium Rohit JaiswalCompany Secretary Director Managing Director
As per our annexed report of same date
Dhaka, 24 April 2012 Rahman Rahman Huq Auditor
31 March 2012Taka
31 March 2011Taka
31 March 2012RS. Crore
31 March 2011 RS. Crore
Assets NoteProperty, plant and equipment 4 325,642,856 229,012,579 20.22 14.08
Capital work in progress 5 16,275,280 –- 1.01 –-
Intangible assets 6 62,500 6,651,734 – 0.41
Deferred tax assets 7 88,282,527 42,664,437 5.48 2.62
Non-current assets 430,263,163 278,328,750 26.71 17.11Inventories 8 1,777,938,918 1,180,798,733 110.41 72.62
Accrued interest 9 30,632,603 34,175,260 1.90 2.10
Investments 10 2,146 29,619,846 – 1.82
Advance income tax 11 717,730,520 315,292,151 44.57 19.39
Advances and deposits 12 464,859,208 238,238,535 28.87 14.65
Fixed deposits 13 610,000,000 2,270,000,000 37.88 139.61
Cash and cash equivalents 14 171,204,924 266,612,849 10.63 16.40
Current assets 3,772,368,319 4,334,737,374 234.26 266.59Total assets 4,202,631,482 4,613,066,124 260.97 283.70EquityShare capital 15 315,000,000 315,000,000 19.56 19.37
Share premium 252,000,000 252,000,000 15.65 15.50
Reserves – 17,022,900 – 1.05
Retained earnings 2,036,194,216 1,878,574,429 126.45 115.53
Total equity 2,603,194,216 2,462,597,329 161.66 151.45LiabilitiesProvision for gratuity 12,388,093 8,896,857 0.77 0.55
Provision for leave encashment 6,419,607 10,253,706 0.40 0.63
Non-current liabilities 18,807,700 19,150,563 1.17 1.18
Short term fi nance 16 100,000,000 775,256,101 6.21 47.68
Liability for expenses 17 228,696,411 379,772,945 14.20 23.36
Interest payable – 5,056,327 – 0.31
Provision for income tax 18 826,822,981 614,689,531 51.35 37.80
Trade creditors 19 215,678,285 225,082,968 13.39 13.84
Payable to holding company 20 177,772,739 123,087,996 11.04 7.57
Other liabilities 21 31,659,150 8,372,364 1.97 0.51
Current liabilities 1,580,629,566 2,131,318,232 98.16 131.07Total liabilities 1,599,437,266 2,150,468,795 99.33 132.25Total equity and liabilities 4,202,631,482 4,613,066,124 260.99 283.70
17
M A R I C O B A N G L A D E S H L I M I T E D
17
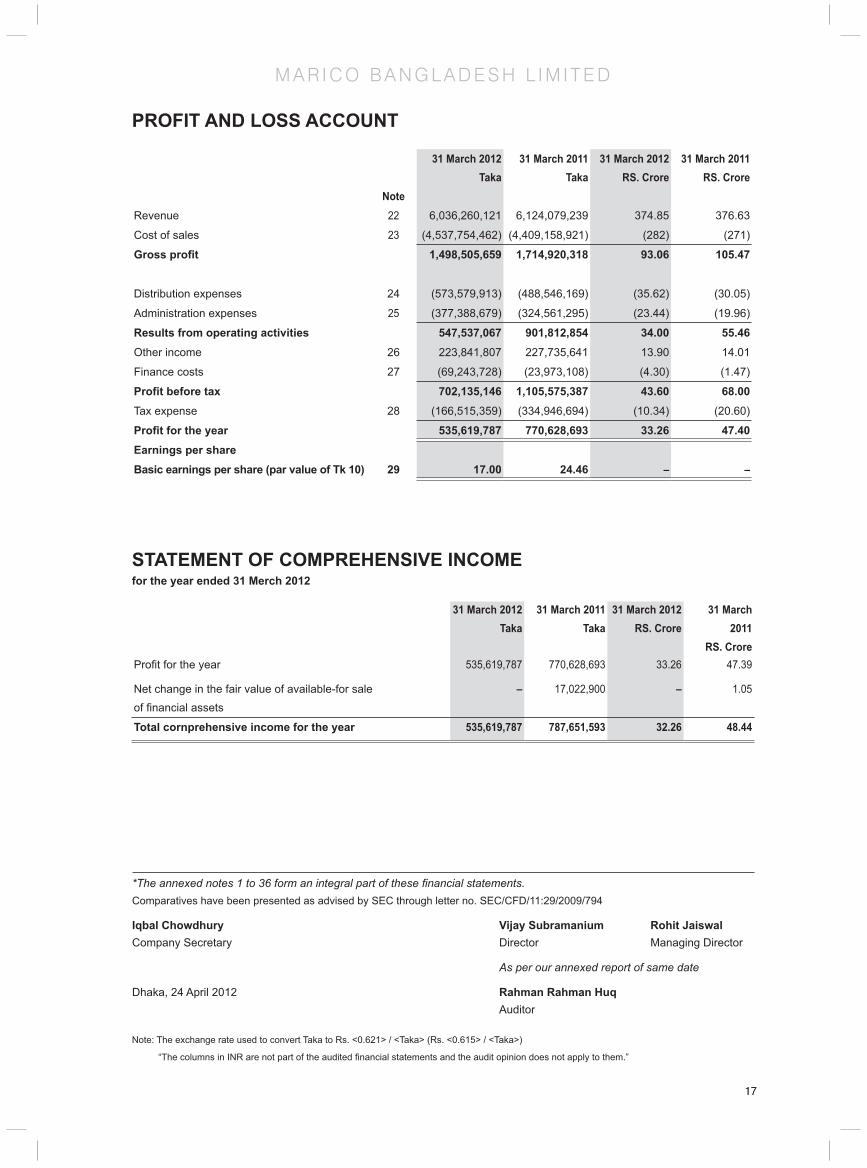
PROFIT AND LOSS ACCOUNT
*The annexed notes 1 to 36 form an integral part of these fi nancial statements.Comparatives have been presented as advised by SEC through letter no. SEC/CFD/11:29/2009/794
Iqbal Chowdhury Vijay Subramanium Rohit JaiswalCompany Secretary Director Managing Director
As per our annexed report of same date
Dhaka, 24 April 2012 Rahman Rahman Huq Auditor
31 March 2012Taka
31 March 2011Taka
31 March 2012RS. Crore
31 March 2011RS. Crore
NoteRevenue 22 6,036,260,121 6,124,079,239 374.85 376.63
Cost of sales 23 (4,537,754,462) (4,409,158,921) (282) (271)
Gross profi t 1,498,505,659 1,714,920,318 93.06 105.47
Distribution expenses 24 (573,579,913) (488,546,169) (35.62) (30.05)
Administration expenses 25 (377,388,679) (324,561,295) (23.44) (19.96)
Results from operating activities 547,537,067 901,812,854 34.00 55.46Other income 26 223,841,807 227,735,641 13.90 14.01
Finance costs 27 (69,243,728) (23,973,108) (4.30) (1.47)
Profi t before tax 702,135,146 1,105,575,387 43.60 68.00Tax expense 28 (166,515,359) (334,946,694) (10.34) (20.60)
Profi t for the year 535,619,787 770,628,693 33.26 47.40Earnings per shareBasic earnings per share (par value of Tk 10) 29 17.00 24.46 – –
Note: The exchange rate used to convert Taka to Rs. <0.621> / <Taka> (Rs. <0.615> / <Taka>)
“The columns in INR are not part of the audited fi nancial statements and the audit opinion does not apply to them.”
STATEMENT OF COMPREHENSIVE INCOMEfor the year ended 31 Merch 2012
31 March 2012Taka
31 March 2011Taka
31 March 2012RS. Crore
31 March 2011
RS. CroreProfi t for the year 535,619,787 770,628,693 33.26 47.39
Net change in the fair value of available-for saleof fi nancial assets
– 17,022,900 – 1.05
Total cornprehensive income for the year 535,619,787 787,651,593 32.26 48.44

18
M A R I C O B A N G L A D E S H L I M I T E D
18
CASH FLOWS STATEME NT
31 March 2012Taka
31 March 2011Taka
31 March 2012RS. Crore
31 March 2011RS. Crore
Cash fl ows from operating activities
Collection from customers 6,036,260,121 6,124,079,239 374.85 376.63
Payment to suppliers and operating expenses (6,314,604,097) (5,674,606,788) (392.14) (348.99)
Interest paid (74,300,055) (19,359,281) (4.61) (1.19)
Interest received 223,630,323 244,590,486 13.89 15.04
Income tax paid (402,438,367) (181,725,005) (24.99) (11.18)
Net cash (used in)/from operating activities (531,452,075) 492,978,651 (33.00) 30.31
Cash fl ows from investing activitiesAcquisition of fi xed assets (204,071,590) (51,559,172) (12.67) (3.17)
Dividend income 3,754,141 1,617,176 0.23 0.10
Encashment of investment in quoted shares 29,617,700 – 1.84 –
Encashment of (Investment in) fi xed deposits 1,660,000,000 (721,704,378) 103.09 (44.38)
Net cash from/(used in) investing activities 1,489,300,251 (771,646,374) 92.49 (47.45)
Cash fl ows from fi nancing activitiesDividend paid (378,000,000) (78,750,000) (23.47) (4.84)
Short term fi nance (675,256,101) 550,927,061 (41.93) 33.88
Net cash (used in)/from fi nancing activities (1,053,256,101) 472,177,061 (65.40) 29.04
Net (decrease)/increase in cash and cash equivalents (95,407,925) 193,509,338 (5.92) 11.90
Cash and cash equivalents at 1 April 266,612,849 73,103,511 16.56 4.50
Cash and cash equivalents at 31 March 171,204,924 266,612,849 10.64 16.40
Note: The exchange rate used to convert Taka to Rs. <0.621> / <Taka> (Rs. <0.615> / <Taka>)
“The columns in INR are not part of the audited fi nancial statements and the audit opinion does not apply to them.”
*The annexed notes 1 to 36 form an integral part of these fi nancial statements.Comparatives have been presented as advised by SEC through letter no. SEC/CFD/11:29/2009/794
Iqbal Chowdhury Vijay Subramaniumnium Rohit JaiswalCompany Secretary Director Managing Director
As per our annexed report of same date
Dhaka, 24 April 2012 Rahman Rahman Huq Auditor

19
M A R I C O B A N G L A D E S H L I M I T E D
19
STATEMENT OF CHANGES IN SHAREHOLDERS’ EQUITYFor the year ended 31 March, 2012
Shar
e
capi
tal
Taka
Shar
e
prem
ium
Taka
Fair
valu
e
rese
rve
Taka
Reta
ined
earn
ings
Taka
Tota
l
equi
ty
Taka
Shar
e
capi
tal
Rs.C
rore
Shar
e
prem
ium
Rs.C
rore
Fair
valu
e
rese
rve
Rs.C
rore
Reta
ined
earn
ings
Rs.C
rore
Tota
l
equi
ty
Rs.C
rore
Balan
ce at
1 Ap
ril 20
1031
5,00
0,00
025
2,00
0,00
0–
1,18
6,69
5,73
61,
753,
695,
736
20.4
416
.35
–77
.02
113.
81
Net p
rofi t
for t
he ye
ar e
nded
31
Mar
ch 2
011
––
–77
0,62
8,69
377
0,62
8,69
3–
––
50.0
150
.01
Divid
ends
––
–(7
8,75
0,00
0)(7
8,75
0,00
0)–
––
(5.11
)(5
.11)
Chan
ge in
the
fair
value
of a
vaila
ble fo
r sale
of fi
nanc
ial a
sset
s
––
17,0
22,9
00–
17,0
22,9
00–
–1.
10–
1.10
Balan
ce at
31 M
arch
2011
315,0
00,00
025
2,000
,000
17,02
2,900
1,878
,574,4
292,4
62,59
7,329
20.44
16.35
1.10
121.9
215
9.81
Balan
ce at
1 Ap
ril 20
1131
5,000
,000
252,0
00,00
017
,022,9
001,8
78,57
4,429
2,462
,597,3
2919
.5615
.651.0
611
6.66
152.9
3
Net p
rofi t
for t
he ye
ar e
nded
31
Mar
ch 2
012
––
–53
5,61
9,78
753
5,61
9,78
7–
––
33.2
633
.26
Divid
ends
–
––
(378
,000
,000
)(3
78,0
00,0
00)
––
–(2
3.47
)(2
3.47
)
Reali
satio
n of
chan
ge in
the
fair
value
of a
vaila
ble fo
r sale
of fi
nanc
ial
asse
ts
––
(17,
022,
900)
–(1
7,02
2,90
0)–
–(1
.06)
–(1
.06)
Balan
ce at
31 M
arch
2012
315,0
00,00
025
2,000
,000
–2,0
36,19
4,216
2,603
,194,2
1619
.5615
.65–
126.4
5 16
1.66
Not
e: T
he e
xcha
nge
rate
use
d to
con
vert
Taka
to R
s. <
0.62
1> /
<Tak
a> (R
s. <
0.61
5> /
<Tak
a>)
“T
he c
olum
ns in
INR
are
not
par
t of t
he a
udite
d fi n
anci
al s
tate
men
ts a
nd th
e au
dit o
pini
on d
oes
not a
pply
to th
em.”
20
M A R I C O B A N G L A D E S H L I M I T E D
20
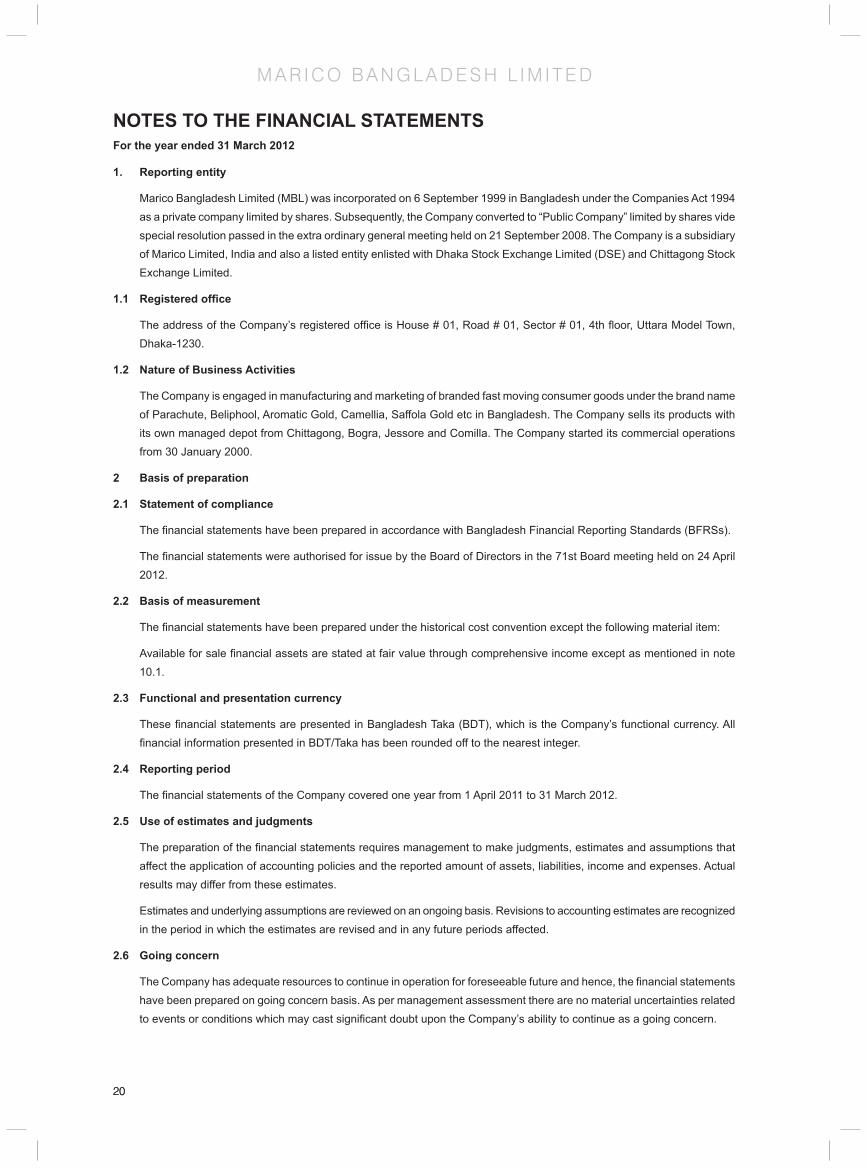
NOTES TO THE FINANCIAL STATEMENTSFor the year ended 31 March 2012
1. Reporting entity
Marico Bangladesh Limited (MBL) was incorporated on 6 September 1999 in Bangladesh under the Companies Act 1994 as a private company limited by shares. Subsequently, the Company converted to “Public Company” limited by shares vide special resolution passed in the extra ordinary general meeting held on 21 September 2008. The Company is a subsidiary of Marico Limited, India and also a listed entity enlisted with Dhaka Stock Exchange Limited (DSE) and Chittagong Stock Exchange Limited.
1.1 Registered offi ce
The address of the Company’s registered offi ce is House # 01, Road # 01, Sector # 01, 4th fl oor, Uttara Model Town, Dhaka-1230.
1.2 Nature of Business Activities
The Company is engaged in manufacturing and marketing of branded fast moving consumer goods under the brand name of Parachute, Beliphool, Aromatic Gold, Camellia, Saffola Gold etc in Bangladesh. The Company sells its products with its own managed depot from Chittagong, Bogra, Jessore and Comilla. The Company started its commercial operations from 30 January 2000.
2 Basis of preparation
2.1 Statement of compliance
The fi nancial statements have been prepared in accordance with Bangladesh Financial Reporting Standards (BFRSs).
The fi nancial statements were authorised for issue by the Board of Directors in the 71st Board meeting held on 24 April 2012.
2.2 Basis of measurement
The fi nancial statements have been prepared under the historical cost convention except the following material item:
Available for sale fi nancial assets are stated at fair value through comprehensive income except as mentioned in note 10.1.
2.3 Functional and presentation currency
These fi nancial statements are presented in Bangladesh Taka (BDT), which is the Company’s functional currency. All fi nancial information presented in BDT/Taka has been rounded off to the nearest integer.
2.4 Reporting period
The fi nancial statements of the Company covered one year from 1 April 2011 to 31 March 2012.
2.5 Use of estimates and judgments
The preparation of the fi nancial statements requires management to make judgments, estimates and assumptions that affect the application of accounting policies and the reported amount of assets, liabilities, income and expenses. Actual results may differ from these estimates.
Estimates and underlying assumptions are reviewed on an ongoing basis. Revisions to accounting estimates are recognized in the period in which the estimates are revised and in any future periods affected.
2.6 Going concern
The Company has adequate resources to continue in operation for foreseeable future and hence, the fi nancial statements have been prepared on going concern basis. As per management assessment there are no material uncertainties related to events or conditions which may cast signifi cant doubt upon the Company’s ability to continue as a going concern.

21
M A R I C O B A N G L A D E S H L I M I T E D
21
NOTES TO THE FINANCIAL STATEMENTSFor the year ended 31 March 2012
3 Signifi cant accounting policies
The accounting policies set out below have been applied consistently (otherwise stated) to all periods presented in these fi nancial statements.
3.1 Foreign currency
Transactions in foreign currencies are translated to the functional currency (BDT) at exchange rates at the dates of transactions. Monetary assets and liabilities denominated in foreign currencies at reporting date are re-translated into Bangladesh Taka at the exchange rates ruling at the statement of fi nancial position date. Non-monetary assets and liabilities denominated in foreign currencies, stated at historical cost, are translated into Bangladesh Taka at the exchange rate ruling at the date of transaction. Foreign exchange differences arising on translation are recognized in profi t or loss.
3.2 Property, plant and equipment
i) Recognition and measurement
Items of property, plant and equipment are measured at cost less accumulated depreciation and accumulated impairment losses. Cost includes expenditure that are directly attributable to the acquisition of the assets.
Parts of an item of property, plant and equipment having different useful lives, are accounted for as separate items (major components) of property, plant and equipment.
The gain or loss on disposal of an item of property, plant and equipment is determined by comparing the proceeds from disposal with the property amount of the property, plant and equipment and is recognised with other income/general and administrative expenses in profi t or loss.
ii) Subsequent cost
The cost of replacing component of an item of property, plant and equipment is recognised in the carrying amount of the item if it is probable that the future economic benefi ts embodied within the component will fl ow to the company and its cost can be measured reliably. The costs of the day to day servicing of property, plant and equipment are recognized in profi t or loss as incurred.
iii) Depreciation
Depreciation is based on the cost of an asset less its residual value. Signifi cant components of individual assets are assessed and if a component has a useful life that is different from the reminder of that asset, that component is depreciated separately.
Depreciation is recognized in profi t or loss on straight line method over the estimated useful lives of each component of an item of property, plant and equipment. Land is not depreciated. Considering the estimated useful lives of the assets the following rates have been applied in current and comparative years:
Assets Depreciation rate
Plant and machinery 10-33%
Factory equipment 10-33%
Moulds 20-50%
Factory building 10-20%
Laboratory equipment 20-33%
Offi ce equipment 20-50%
Vehicles 20-33%
Computers 20-33%

22
M A R I C O B A N G L A D E S H L I M I T E D
22
NOTES TO THE FINANCIAL STATEMENTSFor the year ended 31 March 2012
Furniture 20-33%
Fixtures 20-33%
Air conditioner, refrigerator 20-33%
Depreciation methods, useful lives and residual value are reviewed annually and adjusted if appropriate.
Depreciation is charged from the month of acquisition of property, plant and equipment but no depreciation is charged in the month of disposal.
3.3 Intangible assets
Intangible assets have fi nite useful lives and are stated at cost less accumulated amortisation using straight line method. Intangible assets include cost of acquisition of the intellectual property, copyright and other costs incidental to such capital expenditure.
Amortisation
Amortisation is recognised in the income statement on straight line basis over the estimated useful lives of intangible assets from the date they are available for use.
3.4 Impairment
3.4.1 Non-derivative fi nancial assets
A fi nancial assets not classifi ed as at fair value through profi t or loss is assessed at each reporting date to determine whether there is objective evidence that it is impaired. A fi nancial asset is impaired if objective evidence indicates that a loss event has occurred after initial recognition of the asset, and that the loss event had a negative effect on the estimated future cash fl ows of that asset that can be estimated reliably.
Loans and receivables and held-to-maturity investment securities
The Company considers evidence of impairment for loans and receivables and held-to-maturity investment securities at both a specifi c asset and collective levels. All individually signifi cant receivables and held-to-maturity investment securities are assessed for specifi c impairment . Those found not to be specifi cally impaired are then collectively assessed for any impairment that has been incurred but not yet identifi ed. Assets that are not individually signifi cant are collectively assessed for impairment by grouping together assets with similar risk characteristics.
Available-for-sale fi nancial assets
Impairment losses on available-for-sale fi nancial assets are recognised by reclassifying the losses accumulated in the fair value reserve in equity, to profi t or loss. The cumulative loss that is reclassifi ed from equity to profi t or loss is the difference between the acquisition cost, net of any principal repayment and amortisation, and the current fair value, less any impairment loss recognised previously in profi t or loss. Changes in impairment provisions attributable to application of the effective interest method are refl ected as a component of interest income. If, in a subsequent period, the fair value of an impaired available-for-sale debt security increases and the increase can be related objectively to an event occurring after the impairment loss was recognised in profi t or loss, then the impairment loss is reversed, with the amount of the reversal recognised in profi t or loss. However, any subsequent recovery in the fair value of an impaired available-for-sale equity security is recognised in comprehensive income.
3.4.2 Non-fi nancial assets
The carrying amounts of the Company’s non-fi nancial assets, other than biological assets, investment property, inventories and deferred tax assets, are reviewed at each reporting date to determine whether there is any indication of impairment. If any such indication exists, then the asset’s recoverable amount is estimated. For goodwill, and intangible assets that have indefi nite useful lives or that are not yet available for use, the recoverable amount is estimated each year at the same time. An impairment loss is recognised if the carrying amount of an asset or its related cash generated unit (CGU) exceeds its estimated recoverable amount.

23
M A R I C O B A N G L A D E S H L I M I T E D
23
NOTES TO THE FINANCIAL STATEMENTSFor the year ended 31 March 2012
The recoverable amount of an asset or CGU is the greater of its value in use and its fair value less cost to sell. In assessing value in use, the estimated future cash fl ows are discounted to their present value using a pre tax discount rate that refl ects current market assessments of the time value of money and the risks specifi c to the assets or CGU. For the purpose of impairment testing, assets that can not be tested individually are grouped together into the smallest group of assets that generates cash infl ows from continuing use that are largely independent of the cash infl ows of other assets or CGU.
Impairment losses are recognised in profi t or loss. Impairment losses recognised in respect of CGUs are allocated fi rst to reduce the carrying amount of any goodwill allocated to the CGU (group of CGUs), and then to reduce the carrying amounts of the other assets in the CGU (group of CGUs) on a pro rata basis.
An impairment loss in respect of goodwill is not reversed. For other assets, an impairment loss is reversed only to the extent that the asset’s carrying amount does not exceed the carrying amount that would have been determined, net of depreciation or amortisation, if no impairment loss had been recognised.
3.5 Finance costs
Finance costs comprise interest expense on borrowings, unwinding of the discount on provisions and contingent consideration, losses on disposal of available-for-sale fi nancial assets, dividends on preference shares classifi ed as liabilities, fair value losses on fi nancial assets at fair value through profi t or loss, impairment losses recognised on fi nancial assets (other than trade receivables).
Borrowing costs that are not directly attributable to the acquisition, construction or production of a qualifying asset are recognised in profi t or loss using the effective interest method.
3.6 Income tax
Income tax expense comprises current and deferred tax. Current tax and deferred tax is recognised in profi t or loss except to the extent that it relates to a business combination, or items recognised directly in equity or in comprehensive income.
Current tax is the expected tax payable or receivable on the taxable income or loss for the year, using tax rates enacted or substantively enacted at the reporting date, and any adjustment to tax payable in respect of previous years. Current tax payable also includes any tax liability arising from the declaration of dividends.
Deferred tax is recognised in respect of temporary differences between the carrying amounts of assets and liabilities for fi nancial reporting purposes and the amounts used for taxation purposes. Deferred tax is measured at the tax rates that are expected to be applied to temporary differences when they reverse, using tax rates enacted or substantively enacted by the reporting date.
Deferred tax assets and liabilities are offset if there is a legally enforceable right to offset current tax liabilities and assets, and they relate to taxes levied by the same tax authority on the same taxable entity, or on different tax entities, but they intend to settle current tax liabilities and assets on a net basis or their tax assets and liabilities will be realised simultaneously.
A deferred tax asset is recognised for unused tax losses, tax credits and deductible temporary differences, to the extent that it is probable that future taxable profi ts will be available against which they can be utilised. Deferred tax assets are reviewed at each reporting date and are reduced to the extent that it is no longer probable that the related tax benefi t will be realised.
3.7 Revenue
(i) Goods sold
Revenue from sale of goods is measured at fair value of the consideration received or receivable, net off return and allowance, trade discount, volume rebates exclusive of VAT. Revenue is recognised when the risk and reward of the ownership is transferred to the buyer, recovery of the consideration is probable, the associated cost and possible return of goods can be estimated reliably, and there is no continuing management involvement with the goods sold. Transfer of risk and rewards occurs for the sale of goods when the product is delivered along with dispatch documents and invoiced to customers.
24
M A R I C O B A N G L A D E S H L I M I T E D
24
NOTES TO THE FINANCIAL STATEMENTSFor the year ended 31 March 2012
(ii) Services
Revenue from services rendered recognised in the profi t and loss on completion of the services performed. The Company is involved in providing various skin care treatments under the name “Kaya Skin Clinic”. There are two skin care clinics in Bangladesh.
3.8 Inventories
Inventories are measured at the lower of cost and net realisable value. The cost of inventories is based on weighted average cost method, and includes expenditure incurred in acquiring the inventories, production or conversion costs, and other costs incurred in bringing them to their existing location and condition. In the case of manufactured inventories and work in progress, cost includes an appropriate share of production overheads based on normal operating capacity.
Net realisable value is the estimated selling price in the ordinary course of business, less the estimated costs of completion and selling expenses.
3.9 Provisions
A provision is recognized in the statement of fi nancial position when the Company has a legal or constructive obligation as a result of past event and it is probable that an outfl ow of resources embodying economic benefi ts will be required to settle the obligation and a reliable estimate thereof can be made.
3.10 Employee benefi ts
(i) Defi ned benefi t plans
A defi ned benefi t plan is a post-employment benefi t plan other than a defi ned contribution plan. The Company’s net obligation in respect of defi ned benefi t pension plan is calculated separately for each plan by estimating the amount of future benefi t that employees have earned in return for their service in current and prior periods; that benefi t is discounted to determine its present value. Any unrecognised past service costs and the fair value of any plan assets are deducted.
The calculation is performed annually by a qualifi ed actuary using the projected unit credit method. When the calculation results in a benefi t to the Company, the recognised asset is limited to the total of any unrecognised past service costs and the present value of economic benefi ts available in the form of any future refunds from the plan or reductions in future contributions to the plan. When the benefi ts of the plan are improved, the portion of the increased benefi t related to past service by employees is recognised in profi t and loss on a straight line basis over the average period until the benefi ts become vested. To the extent that the benefi ts vest immediately, the expense is recognised immediately in profi t and loss.
The Company recognises all expenses and all actuarial gains and losses arising from defi ned plan in profi t and loss.
(ii) Short term employee benefi ts
Short term employee benefi t obligations are measured based on undiscounted basis and are expensed as the related service is rendered. A liability is recognised for the amount expected to be paid under short-term cash bonus or profi t sharing plans if the Company has a present legal or constructive obligation to pay this amount as a result of past service provided by the employee, and the obligation can be estimated reliably.
3.11 Contingencies
Contingencies arising from claims, litigations, assessments, fi nes, penalties, etc. are recorded when it is probable that a liability has been incurred and the amount can be reasonably estimated.

25
M A R I C O B A N G L A D E S H L I M I T E D
25
NOTES TO THE FINANCIAL STATEMENTSFor the year ended 31 March 2012
3.12 Earnings per share
The Company presents basic and diluted earnings per share data for its ordinary shares. Basic earnings per share is calculated by dividing the profi t or loss attributable to ordinary shareholders of the Company by the weighted average number of ordinary shares outstanding during the year, adjusted for own shares held. Diluted earnings per share is determined by adjusting the profi t or loss attributable to ordinary shareholders and the weighted average number of ordinary shares outstanding, adjusted for own shares held, for the effects of all dilutive potential ordinary shares, which comprise convertible notes and share options granted to employees.
3.13 Events after the reporting period
Events after statement of fi nancial position date that provide additional information about the company’s positions at the statement of fi nancial position date are refl ected in the fi nancial statements. Events after the statement of fi nancial position date that are non-adjusting events are disclosed in the notes when material.
3.14 Financial instruments
Non-derivative fi nancial instruments comprise investments in shares and Fixed Deposit Receipts (FDR), cash and cash equivalents, advance from customers, trade creditors, share capital, and interest-bearing borrowings.
Investment in shares
Investment in share are non-derivative fi nancial assets that are designated as available for sale. Initially they are recognised at cost and subsequent to initial recognition, they are measured at fair value and changes therein, other than impairment losses and foreign currency differences on available-for-sale are recognised in comprehensive income and presented in the fair value reserve in equity. When an investment is derecognised, the gain or loss accumulated in equity is reclassifi ed to profi t or loss.
Investment in Fixed Deposit Receipts (FDR)
The company has the positive intent and ability to hold FDR to maturity, and as such fi nancial assets are classifi ed as held to maturity. Held-to-maturity fi nancial assets are recognised initially at fair value plus any directly attributable transaction costs. Subsequent to initial recognition, held-to-maturity fi nancial assets are measured at amortised cost using the effective interest method, less any impairment losses.
Cash and cash equivalents
Cash and cash equivalents comprise cash and bank balances. Bank overdrafts that are repayable on demand form an integral part of the Company’s cash management are included as a component of cash and cash equivalents for the purpose only of the statement of cash fl ows.
Share capital
Ordinary shares are classifi ed as equity. Incremental cost directly attributable to the issue of ordinary share are recognised as a deduction from equity, net of any tax effects.
Trade creditors
Trade creditors are recognised at fair value.
Interest-bearing borrowings
Interest-bearing borrowings are recognised initially at fair value less attributable transaction costs. Subsequent to initial recognition, interest-bearing borrowings are stated at amortised cost using the effective interest method, less any impairment losses.

26
M A R I C O B A N G L A D E S H L I M I T E D
26
NOTES TO THE FINANCIAL STATEMENTSFor the year ended 31 March 2012
Advances from customers
Advances from customers are recognised initially at fair value. Subsequent to initial recognition, they are measured at amortised cost using the effective interest method.
3.15 Financial risk management
The company management has overall responsibility for the establishment and oversight of the Company’s risk management framework. The company’s management policies are established to identify and analyse the risks faced by the Company to set appropriate risk limits and controls and to monitor risks and adherence to limit. Risk management policies, procedures and systems are reviewed regularly to refl ect changes in market conditions and the company’s activities. The Company has exposure for measuring and managing risks from its use of fi nancial instruments which are as follows:
i) Credit risk
Credit risk is risk of fi nancial loss if a customer or counterpart to a fi nancial instrument fails to meet its contractual obligations which arises principally from the Company’s receivables from customers.
ii) Liquidity risk
Liquidity risk is the risk that the Company will encounter diffi culty in meeting the obligations associated with its fi nancial liabilities that are settled by delivering cash or another fi nancial asset. The Company’s approach to managing liquidity is to ensure, as far as possible, that it will always have suffi cient liquidity to meet its liabilities when due, under both normal and stressed conditions, without incurring unacceptable losses or risking damage to the Company’s reputation.
iii) Market risk
Market risk is the risk that changes in market prices such as foreign exchange rates, interest rates and equity prices will affect the Company’s income or the value of its holdings of fi nancial instruments. The objective of market risk management is to manage and control market risk exposures within acceptable parameters, while optimising the return.
Market risk includes the followings:
Currency risk:
Translation risk
Translation risk is the risk that the Company will make exchange losses when the accounting results are translated into the home currency.
Economic risk
Economic risk refers to the effect of exchange rate movements on the international competitiveness of the Company.
Interest rate risk:
Interest rate risk arises from movement in interest rates. The Company needs to manage interest rate risk so as to be able to repay debts as they fall due and to minimise the risks surrounding interest payments and receipts.

27
M A R I C O B A N G L A D E S H L I M I T E D
27
NOTES TO THE FINANCIAL STATEMENTSFor the year ended 31 March 2012
4. Property, plant and equipment
At 31 March 2012
Cost Accumulated depreciation Carrying value
Particulars AS at1 April 2011
Addition during the
year
Disposal during the
year
As at 31 March 2012
As at 1 April 2011
Charged for the period
Adjustment for the period
As at 31 March 2012
As at 31 March 2012
Taka Taka Taka Taka Taka Taka Taka Taka Taka
Plant and machinery 319,236,036 17,321,532 (166,410,794) 170,146,774 227,058,053 61,116,686 (166,444,343) 121,730,396 48,416,378
Freehold land 36,394,486 138,317,580 – 174,712,066 – – – – 174,712,066
Vehicles 26,444,848 11,105,428 (6,713,950) 30,836,326 11,309,252 6,263,792 (6,713,950) 10,859,094 19,977,232
Factory equipment 5,418,521 109,760 (1,875,211) 3,653,071 3,000,390 862,848 (1,875,200) 1,988,038 1,665,033
Moulds 13,259,944 10,213,543 (3,588,440) 19,885,048 8,931,791 4,300,178 (3,672,845) 9,559,124 10,325,924
Factory building 4,669,572 – (1,759,582) 2,909,990 2,162,283 131,501 (1,689,277) 604,507 2,305,483
Offi ce building 56,550,264 5,642,912 – 62,193,176 13,608,796 6,313,366 – 19,922,162 42,271,014
Laboratory equipment 1,275,822 559,663 (537,500) 1,297,985 635,866 301,759 (537,501) 400,124 897,861
Offi ce equipments 12,462,924 1,239,507 (1,818,068) 11,884,363 4,368,004 2,686,959 (1,836,068) 5,218,895 6,665,468
Computers 5,133,210 909,450 (213,500) 5,829,160 2,883,889 1,304,558 (213,499) 3,974,948 1,854,212
Furniture and fi xtures 26,300,574 1,800,362 (980,852) 27,120,084 9,314,412 5,704,947 (980,852) 14,038,507 13,081,577
A/C, refrigerator, water coolers
7,076,795 463,600 (687,020) 6,853,375 1,937,681 2,132,093 (687,007) 3,382,767 3,470,608
At 31 March 2012 514,222,996 187,683,337 (184,584,916) 517,321,418 285,210,417 91,118,687 (184,650,542) 191,678,562 325,642,856
At 31 March 2012
Cost Accumulated depreciation Carrying value
Particulars AS at1 April 2011
Addition during the
year
Disposal during the
year
As at 31 March 2012
As at 1 April 2011
Charged for the period
Adjustment for the period
As at 31 March 2012
As at 31 March 2012
Rs.Crore Rs.Crore Rs.Crore Rs.Crore Rs.Crore Rs.Crore Rs.Crore Rs.Crore Rs.Crore
Plant and machinery 19.82 1.08 (10.33) 10.57 14.10 3.80 (10.34) 7.56 3.01
Freehold land 2.26 8.59 – 10.85 – – – – 10.85
Vehicles 1.64 0.69 (0.42) 1.91 0.70 0.39 (0.42) 0.67 1.24
Factory equipment 0.34 0.01 (0.12) 1.23 0.19 0.05 (0.12) 0.12 1.11
Moulds 0.82 0.63 (0.22) 1.23 0.55 0.27 (0.23) 0.59 0.64
Factory building 0.29 – (0.11) 0.18 0.13 0.01 (0.10) 0.04 0.14
Offi ce building 3.51 0.35 – 3.86 0.85 0.39 – 1.24 2.62
Laboratory equipment 0.08 0.03 (0.03) 0.08 0.04 0.02 (0.04) 0.02 0.06
Offi ce equipments 0.77 0.08 (0.11) 0.74 0.27 0.17 (0.12) 0.32 0.42
Computers 0.32 0.06 (0.01) 0.37 0.18 0.08 (0.01) 0.25 0.12
Furniture and fi xtures 1.63 0.11 (0.06) 1.68 0.58 0.35 (0.06) 0.87 0.81
A/C, refrigerator, water coolers
0.44 0.03 (0.04) 0.43 0.12 0.13 (0.04) 0.21 0.22
At 31 March 2012 31.92 11.66 (11.45) 33.13 17.71 5.66 (11.48) 11.89 21.24

28
M A R I C O B A N G L A D E S H L I M I T E D
28
NOTES TO THE FINANCIAL STATEMENTSFor the year ended 31 March 2012
At 31 March 2012
Cost Accumulated depreciation Carrying value
Particulars AS at1 April 2010
Addition during the
year
Disposal during the
year
As at 31 March 2011
As at 1 April 2010
Charged for the period
Adjustment for the period
As at 31 March 2011
As at 31 March 2011
Taka Taka Taka Taka Taka Taka Taka Taka Taka
Plant and machinery 292,849,806 26,486,230 (100,000) 319,236,036 139,691,570 87,466,483 (100,000) 227,058,053 92,177,983
Freehold land 36,394,486 – – 36,394,486 – – – – 36,394,486
Vehicles 20,865,690 8,510,870 (2,931,712) 26,444,848 8,548,051 4,618,357 (1,857,156) 11,309,252 15,135,596
Factory equipment 4,184,066 1,234,455 – 5,418,521 2,223,191 777,199 – 3,000,390 2,418,131
Moulds 12,902,537 357,407 – 13,259,944 6,217,413 2,714,378 – 8,931,791 4,328,153
Factory building 4,669,572 – – 4,669,572 1,894,407 267,876 – 2,162,283 2,507,289
Offi ce building 56,550,264 – – 56,550,264 7,953,770 5,655,026 – 13,608,796 42,941,468
Laboratory equipment 548,000 727,822 – 1,275,822 543,625 92,241 – 635,866 639,956
Offi ce equipments 9,902,964 2,626,760 (66,800) 12,462,924 2,157,980 2,276,819 (66,795) 4,368,004 8,094,920
Computers 4,330,025 1,060,185 (257,000) 5,133,210 1,921,993 1,218,870 (256,974) 2,883,889 2,249,321
Furniture and fi xtures 19,571,579 6,838,785 (109,790) 26,300,574 4,997,689 4,420,226 (103,503) 9,314,412 16,986,162
A/C, refrigerator, water coolers
2,363,564 4,746,181 (32,950) 7,076,795 947,983 1,022,648 (32,950) 1,937,681 5,139,114
At 31 March 2011 465,132,553 52,588,695 (3,498,252) 514,222,996 177,097,672 110,530,123 (2,417,378) 285,210,417 229,012,579
At 31 March 2011
Cost Accumulated depreciation Carrying value
Particulars AS at1 April 2010
Addition during the
year
Disposal during the
year
As at 31 March 2011
As at 1 April 2010
Charged for the period
Adjustment for the period
As at 31 March 2011
As at 31 March 2011
Rs.Crore Rs.Crore Rs.Crore Rs.Crore Rs.Crore Rs.Crore Rs.Crore Rs.Crore Rs.Crore
Plant and machinery 18.01 1.63 (0.01) 19.63 8.59 5.38 (0.01) 13.96 5.67
Freehold land 2.24 – – 2.24 – – – – 2.24
Vehicles 1.28 0.52 (0.18) 1.62 0.53 0.28 (0.11) 0.70 0.92
Factory equipment 0.26 0.08 – 0.34 0.14 0.05 – 0.19 0.15
Moulds 0.79 0.02 – 0.81 0.38 0.17 – 0.55 0.26
Factory building 0.29 – – 0.29 0.12 0.02 – 0.14 0.15
Offi ce building 3.48 – – 3.48 0.49 0.35 – 0.84 2.64
Laboratory equipment 0.03 0.04 – 0.07 0.03 0.01 – 0.04 0.03
Offi ce equipments 0.61 0.16 – 0.77 0.13 0.14 – 0.27 0.50
Computers 0.27 0.07 (0.02) 0.32 0.12 0.07 (0.02) 0.17 0.15
Furniture and fi xtures 1.20 0.42 (0.01) 1.61 0.31 0.27 (0.01) 0.57 1.04
A/C, refrigerator, water coolers
0.15 0.29 – 0.44 0.06 0.06 – 0.12 0.32
At 31 March 2011 28.61 3.23 (0.22) 31.62 10.90 6.80 (0.15) 17.55 14.07

29
M A R I C O B A N G L A D E S H L I M I T E D
29
NOTES TO THE FINANCIAL STATEMENTSFor the year ended 31 March 2012
4.1 Depreciation allocated to:
For the yearended 31
March 2012Taka
For the yearended 31
March 2011Taka
For the yearended 31
March 2012Rs.Crore
For the yearended 31
March 2011Rs.Crore
Manufacturing 68,230,695 92,177,561 4.24 5.67
Administration 22,887,992 18,352,562 1.42 1.13
91,118,687 110,530,123 5.66 6.80
2012Taka
2011Taka
2012Rs.Crore
2011Rs.Crore
5. Capital work in progress 16,275,280 – 1.01 –
6. Intangible assets
MBL through an agreement dated 25 April 2005 with Marks & Allys Limited, paid Taka 5,000,000 for acquiring the intellectual property right and copyright of “Camelia” and “Magnolia” soaps. Taka 15,000,000 had also been paid for acquiring the intellectual property right and copyright of “Aromatic” brand vide an agreement dated 7 October 2005 with Aromatic Cosmetic Limited.
CostMarks & Allys Limited: Intellectual property right 2,500,000 2,500,000 0.16 0.15
Copyright 2,500,000 2,500,000 0.16 0.15
5,000,000 5,000,000 0.32 0.30
Aromatic Cosmetics Limited:Intellectual property right 7,500,000 7,500,000 0.47 0.46
Copyright 7,500,000 7,500,000 0.47 0.46
15,000,000 15,000,000 0.94 0.92
Incidental to capital expenditure 3,075,125 3,075,125 0.19 0.19
23,075,125 23,075,125 1.45 1.41
Accumulated amortization
As at 1 April 16,423,391 11,808,366 1.02 0.73
Charge during the year 6,589,234 4,615,025 0.41 0.28
As at 31 March 23,012,625 16,423,391 1.43 1.01
Carrying value 62,500 6,651,734 0.02 0.40

30
M A R I C O B A N G L A D E S H L I M I T E D
30
NOTES TO THE FINANCIAL STATEMENTSFor the year ended 31 March 2012
7. Deferred tax assets
Deferred tax asset/(liability) is arrived as follows:
BDT Rs.CroreCarrying
value as at 31 March
Tax baseas at
31 March
Temporary Difference
Taxable/ (deductible)
Carrying value as at
31 March
Tax base as at 31
March
Temporary Difference
Taxable/ (deductible)
Year 2012Non-current assets 148,671,988 317,703,037 (169,031,049) 9.23 19.73 (10.50)
Provision for gratuity (12,388,093) – (12,388,093) (0.77) – (0.77)
Provision for leave encashment (6,399,181) – (6,399,181) (0.40) – (0.40)
Royalty payable (168,878,754) – (168,878,754) (10.49) – (10.49)
Net deductible temporary difference
(356,697,077) (22.16)
Income tax rate * 24.75% 24.75%
Deferred tax asset (A) (88,282,527) (5.48)
*The Company has declared 100% interim dividend and thus it’s tax rate is 24.75% for the relevant assessment year.
Year 2011Non-current assets 191,653,431 223,682,588 (32,029,157) 11.79 13.76 (1.97)
Provision for gratuity (8,896,857) – (8,896,857) (0.55) – (0.55)
Royalty payable (114,217,394) –- (114,217,394) (7.02) – (7.02)
Net deduct ible temporary difference
(155,143,408) – (9.54)
Income tax rate 27.50% 27.50%
Deferred tax asset (B) (42,664,437) (2.62)
Deferred tax income (A-B) 45,618,089 2.86
8. Inventories
31 March 2012Taka
31 March 2011Taka
31 March 2012Rs. Crore
31 March 2011Rs. Crore
Raw materials 1,241,885,840 698,025,156 77.12 42.93Packing materials 108,864,923 82,302,743 6.76 5.06Finished goods 224,018,376 247,581,606 13.91 15.23Goods in transit 203,169,779 152,889,228 12.62 9.40
1,777,938,918 1,180,798,733 110.41 72.62
9. Accrued interest
31 March 2012Taka
31 March 2011Taka
31 March 2012Rs. Crore
31 March 2011Rs. Crore
Interest on FDR 30,632,603 34,175,260 1.90 2.10
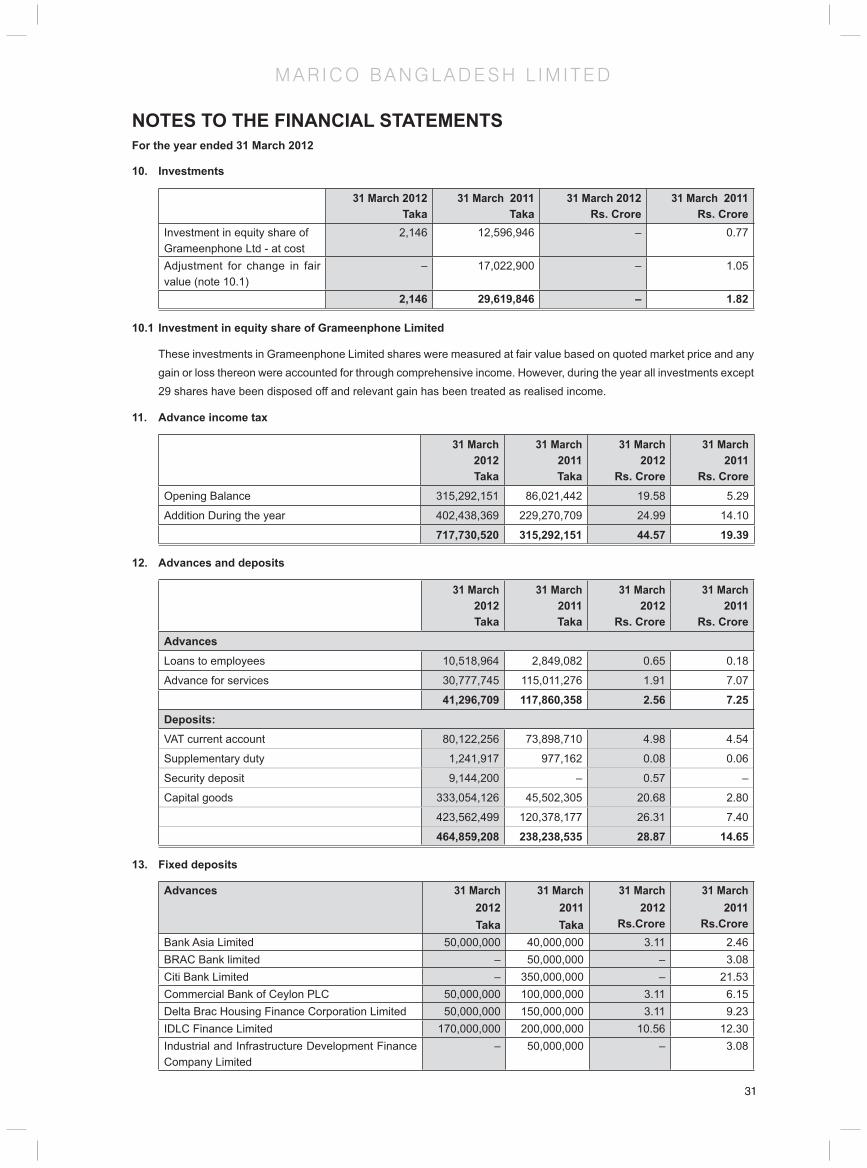
31
M A R I C O B A N G L A D E S H L I M I T E D
31
NOTES TO THE FINANCIAL STATEMENTSFor the year ended 31 March 2012
10. Investments
31 March 2012Taka
31 March 2011Taka
31 March 2012Rs. Crore
31 March 2011Rs. Crore
Investment in equity share ofGrameenphone Ltd - at cost
2,146 12,596,946 – 0.77
Adjustment for change in fair value (note 10.1)
– 17,022,900 – 1.05
2,146 29,619,846 – 1.82
10.1 Investment in equity share of Grameenphone Limited
These investments in Grameenphone Limited shares were measured at fair value based on quoted market price and any gain or loss thereon were accounted for through comprehensive income. However, during the year all investments except 29 shares have been disposed off and relevant gain has been treated as realised income.
11. Advance income tax
31 March 2012Taka
31 March 2011Taka
31 March 2012
Rs. Crore
31 March 2011
Rs. CroreOpening Balance 315,292,151 86,021,442 19.58 5.29
Addition During the year 402,438,369 229,270,709 24.99 14.10
717,730,520 315,292,151 44.57 19.39
12. Advances and deposits
31 March 2012Taka
31 March 2011Taka
31 March 2012
Rs. Crore
31 March 2011
Rs. CroreAdvancesLoans to employees 10,518,964 2,849,082 0.65 0.18
Advance for services 30,777,745 115,011,276 1.91 7.07
41,296,709 117,860,358 2.56 7.25Deposits:VAT current account 80,122,256 73,898,710 4.98 4.54
Supplementary duty 1,241,917 977,162 0.08 0.06
Security deposit 9,144,200 – 0.57 –
Capital goods 333,054,126 45,502,305 20.68 2.80
423,562,499 120,378,177 26.31 7.40
464,859,208 238,238,535 28.87 14.65
13. Fixed deposits
Advances 31 March 2012Taka
31 March 2011Taka
31 March 2012
Rs.Crore
31 March 2011
Rs.CroreBank Asia Limited 50,000,000 40,000,000 3.11 2.46BRAC Bank limited – 50,000,000 – 3.08Citi Bank Limited – 350,000,000 – 21.53Commercial Bank of Ceylon PLC 50,000,000 100,000,000 3.11 6.15Delta Brac Housing Finance Corporation Limited 50,000,000 150,000,000 3.11 9.23IDLC Finance Limited 170,000,000 200,000,000 10.56 12.30Industrial and Infrastructure Development Finance Company Limited
– 50,000,000 – 3.08
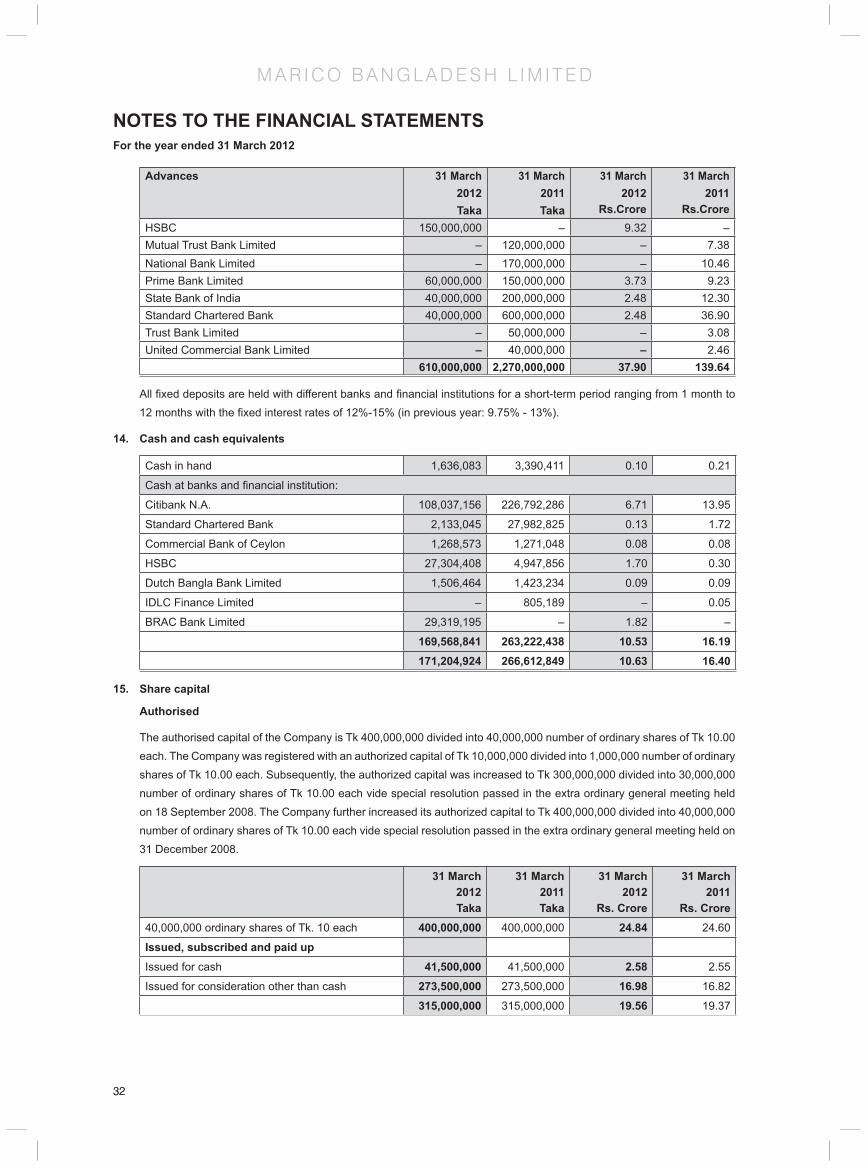
32
M A R I C O B A N G L A D E S H L I M I T E D
32
NOTES TO THE FINANCIAL STATEMENTSFor the year ended 31 March 2012
Advances 31 March 2012Taka
31 March 2011Taka
31 March 2012
Rs.Crore
31 March 2011
Rs.CroreHSBC 150,000,000 – 9.32 –Mutual Trust Bank Limited – 120,000,000 – 7.38National Bank Limited – 170,000,000 – 10.46Prime Bank Limited 60,000,000 150,000,000 3.73 9.23State Bank of India 40,000,000 200,000,000 2.48 12.30Standard Chartered Bank 40,000,000 600,000,000 2.48 36.90Trust Bank Limited – 50,000,000 – 3.08United Commercial Bank Limited – 40,000,000 – 2.46
610,000,000 2,270,000,000 37.90 139.64
All fi xed deposits are held with different banks and fi nancial institutions for a short-term period ranging from 1 month to 12 months with the fi xed interest rates of 12%-15% (in previous year: 9.75% - 13%).
14. Cash and cash equivalents
Cash in hand 1,636,083 3,390,411 0.10 0.21
Cash at banks and fi nancial institution:
Citibank N.A. 108,037,156 226,792,286 6.71 13.95
Standard Chartered Bank 2,133,045 27,982,825 0.13 1.72
Commercial Bank of Ceylon 1,268,573 1,271,048 0.08 0.08
HSBC 27,304,408 4,947,856 1.70 0.30
Dutch Bangla Bank Limited 1,506,464 1,423,234 0.09 0.09
IDLC Finance Limited – 805,189 – 0.05
BRAC Bank Limited 29,319,195 – 1.82 –
169,568,841 263,222,438 10.53 16.19171,204,924 266,612,849 10.63 16.40
15. Share capital
Authorised
The authorised capital of the Company is Tk 400,000,000 divided into 40,000,000 number of ordinary shares of Tk 10.00 each. The Company was registered with an authorized capital of Tk 10,000,000 divided into 1,000,000 number of ordinary shares of Tk 10.00 each. Subsequently, the authorized capital was increased to Tk 300,000,000 divided into 30,000,000 number of ordinary shares of Tk 10.00 each vide special resolution passed in the extra ordinary general meeting held on 18 September 2008. The Company further increased its authorized capital to Tk 400,000,000 divided into 40,000,000 number of ordinary shares of Tk 10.00 each vide special resolution passed in the extra ordinary general meeting held on 31 December 2008.
31 March 2012Taka
31 March 2011Taka
31 March 2012
Rs. Crore
31 March 2011
Rs. Crore40,000,000 ordinary shares of Tk. 10 each 400,000,000 400,000,000 24.84 24.60
Issued, subscribed and paid upIssued for cash 41,500,000 41,500,000 2.58 2.55
Issued for consideration other than cash 273,500,000 273,500,000 16.98 16.82
315,000,000 315,000,000 19.56 19.37

33
M A R I C O B A N G L A D E S H L I M I T E D
33
NOTES TO THE FINANCIAL STATEMENTSFor the year ended 31 March 2012
15.1. Percentage of shareholdings
% of shareholdings Taka % of shareholdings Rs. Crore
Marico Limited, India 90% 283,500,000 90% 17.61%
Other shareholders 10% 31,500,000 10% 1.96%
100% 315,000,000 100% 19.56%
15.2. Classifi cation of shareholders by holding
Holdings Number of holders
No of shares
Total holding (%)
Less than 500 shares 2,818 208,900 0.66%
500 to 5,000 shares 220 314,000 1.00%
5,001 to 10,000 shares 20 150,000 0.48%
10,001 to 20,000 shares 18 247,050 0.78%
20,001 to 30,000 shares 8 196,600 0.62%
30,001 to 40,000 shares 1 36,750 0.12%
40,001 to 50,000 shares 2 91,900 0.29%
50,001 to 100,000 shares 5 333,650 1.06%
100,001 to 1,000,000 shares 3 425,800 1.35%
Over 1,000,000 shares 2 29,495,350 93.64%
3,097 31,500,000 100%
16. Short term fi nance
31 March 2012Taka
31 March 2011Taka
31 March 2012
Rs. Crore
31 March 2011
Rs. Crore
Short term loan:
Citibank N.A. 100,000,000 319,274,019 6.21 19.64
HSBC – 357,466,882 – 21.98
Standard Chartered Bank – 98,515,200 – 6.06
100,000,000 775,256,101 6.21 47.68
16.1 Citibank N.A.
a) Limit
Total aggregate limit of short term loan and bank overdraft is Tk 1,552.5 million. Short term loan is taken whenever required.
b) Nature of security (Short term loan and bank overdraft)
Demand promissory note and letter of continuity for Tk 1,552.5 million.
c) Rate of interest
Rate of interest has been varied from 14% to 16% depending on the money market and inter relationship.

34
M A R I C O B A N G L A D E S H L I M I T E D
34
NOTES TO THE FINANCIAL STATEMENTSFor the year ended 31 March 2012
16.2 HSBC
a) Limit
Total aggregate limit of short term loan and bank overdraft is Tk 695 million. Short term loan is taken whenever required.
b) Nature of security (Short term loan and bank overdraft)
Demand promissory note for Tk 700 million and lender’s fi rst charge over the borrower’s (MBL) stocks, book debts and receivables up to the aggregate value of Tk 700 million.
c) Rate of interest
Rate of interest has been varied from 14% to 16% depending on the money market and inter relationship.
17. Liability for expenses
31 March 2012Taka
31 March 2011Taka
31 March 2012
Rs. Crore
31 March 2011
Rs. Crore
Business promotion expenses 80,388,416 163,490,269 4.99 10.05
Advertisement expenses 87,107,626 100,871,139 5.41 6.20
Audit fees 548,625 766,250 0.03 0.05
Creditors for supplies 36,581,015 74,924,074 2.27 4.61
Other expenses 24,070,729 39,721,213 1.49 2.44
228,696,411 379,772,945 14.19 23.35
18. Provision for income tax
Opening balance 614,689,532 239,275,393 38.17 14.72
Add: Provision during the year 212,133,449 375,414,138 13.17 23.09
826,822,981 614,689,531 51.34 37.81
19. Trade creditors
Marico Limited, India 131,873,368 63,597,164 8.19 3.91
Other creditors 42,732,360 24,553,477 2.65 1.51
Import duty and related charges 41,072,557 136,932,327 2.55 8.42
215,678,285 225,082,968 13.39 13.84
20. Payable to holding company
Royalty 168,878,753 114,194,010 10.49 7.02
Bank guarantee commission 8,893,986 8,893,986 0.55 0.55
177,772,739 123,087,996 11.04 7.57
21. Other liabilities
Advance from customers 16,790,898 3,388,513 1.04 0.21
Tax and VAT deducted from vendors’ bills 14,868,252 4,983,851 0.92 0.31
31,659,150 8,372,364 1.96 0.52
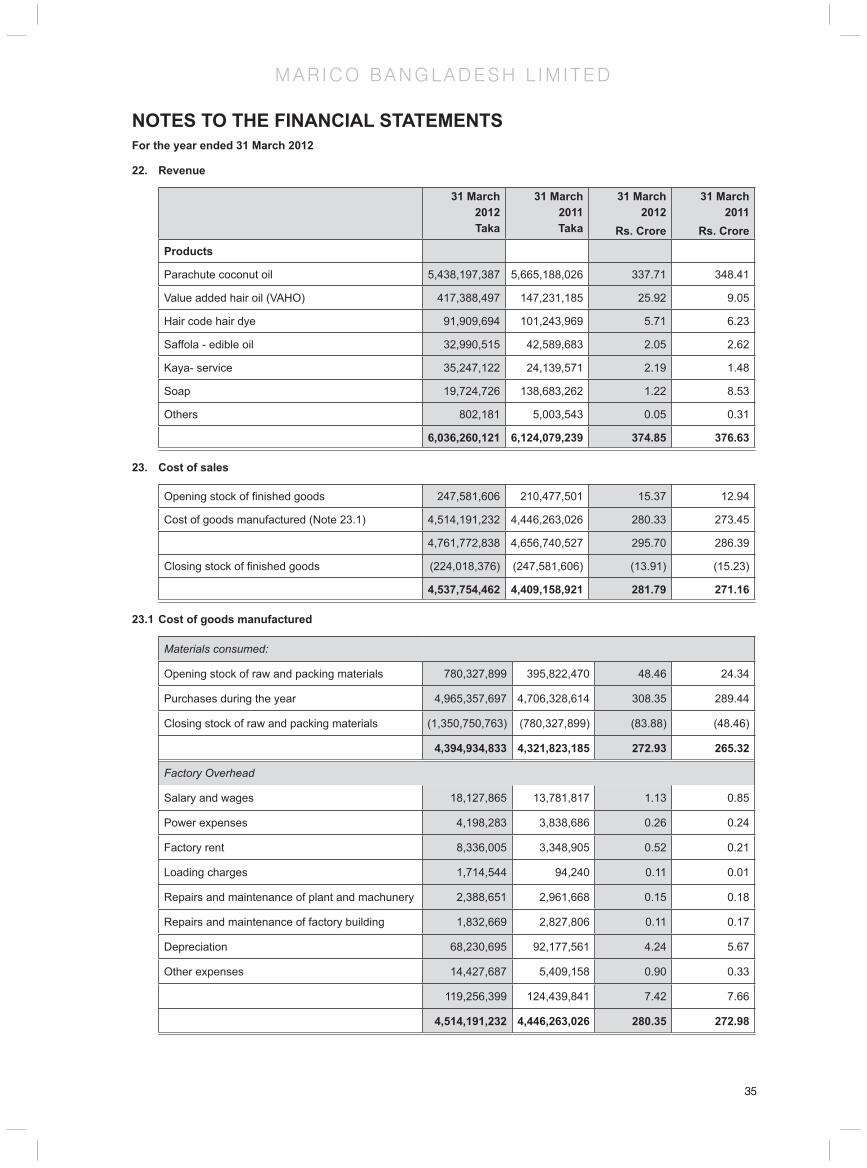
35
M A R I C O B A N G L A D E S H L I M I T E D
35
NOTES TO THE FINANCIAL STATEMENTSFor the year ended 31 March 2012
22. Revenue
31 March 2012Taka
31 March 2011Taka
31 March 2012
Rs. Crore
31 March 2011
Rs. Crore
Products
Parachute coconut oil 5,438,197,387 5,665,188,026 337.71 348.41
Value added hair oil (VAHO) 417,388,497 147,231,185 25.92 9.05
Hair code hair dye 91,909,694 101,243,969 5.71 6.23
Saffola - edible oil 32,990,515 42,589,683 2.05 2.62
Kaya- service 35,247,122 24,139,571 2.19 1.48
Soap 19,724,726 138,683,262 1.22 8.53
Others 802,181 5,003,543 0.05 0.31
6,036,260,121 6,124,079,239 374.85 376.63
23. Cost of sales
Opening stock of fi nished goods 247,581,606 210,477,501 15.37 12.94
Cost of goods manufactured (Note 23.1) 4,514,191,232 4,446,263,026 280.33 273.45
4,761,772,838 4,656,740,527 295.70 286.39
Closing stock of fi nished goods (224,018,376) (247,581,606) (13.91) (15.23)
4,537,754,462 4,409,158,921 281.79 271.16
23.1 Cost of goods manufactured
Materials consumed:
Opening stock of raw and packing materials 780,327,899 395,822,470 48.46 24.34
Purchases during the year 4,965,357,697 4,706,328,614 308.35 289.44
Closing stock of raw and packing materials (1,350,750,763) (780,327,899) (83.88) (48.46)
4,394,934,833 4,321,823,185 272.93 265.32
Factory Overhead
Salary and wages 18,127,865 13,781,817 1.13 0.85
Power expenses 4,198,283 3,838,686 0.26 0.24
Factory rent 8,336,005 3,348,905 0.52 0.21
Loading charges 1,714,544 94,240 0.11 0.01
Repairs and maintenance of plant and machunery 2,388,651 2,961,668 0.15 0.18
Repairs and maintenance of factory building 1,832,669 2,827,806 0.11 0.17
Depreciation 68,230,695 92,177,561 4.24 5.67
Other expenses 14,427,687 5,409,158 0.90 0.33
119,256,399 124,439,841 7.42 7.66
4,514,191,232 4,446,263,026 280.35 272.98
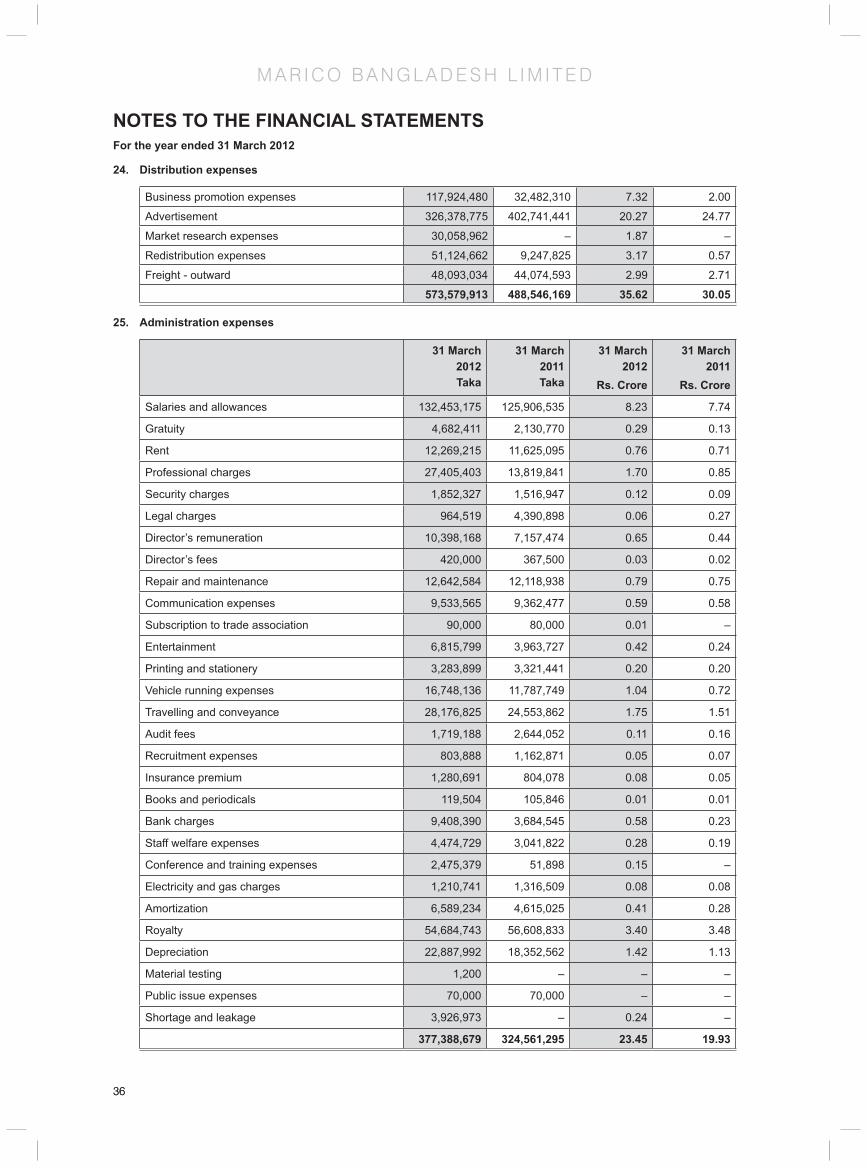
36
M A R I C O B A N G L A D E S H L I M I T E D
36
NOTES TO THE FINANCIAL STATEMENTSFor the year ended 31 March 2012
24. Distribution expenses
Business promotion expenses 117,924,480 32,482,310 7.32 2.00
Advertisement 326,378,775 402,741,441 20.27 24.77
Market research expenses 30,058,962 – 1.87 –
Redistribution expenses 51,124,662 9,247,825 3.17 0.57
Freight - outward 48,093,034 44,074,593 2.99 2.71
573,579,913 488,546,169 35.62 30.05
25. Administration expenses
31 March 2012Taka
31 March 2011Taka
31 March 2012
Rs. Crore
31 March 2011
Rs. Crore
Salaries and allowances 132,453,175 125,906,535 8.23 7.74
Gratuity 4,682,411 2,130,770 0.29 0.13
Rent 12,269,215 11,625,095 0.76 0.71
Professional charges 27,405,403 13,819,841 1.70 0.85
Security charges 1,852,327 1,516,947 0.12 0.09
Legal charges 964,519 4,390,898 0.06 0.27
Director’s remuneration 10,398,168 7,157,474 0.65 0.44
Director’s fees 420,000 367,500 0.03 0.02
Repair and maintenance 12,642,584 12,118,938 0.79 0.75
Communication expenses 9,533,565 9,362,477 0.59 0.58
Subscription to trade association 90,000 80,000 0.01 –
Entertainment 6,815,799 3,963,727 0.42 0.24
Printing and stationery 3,283,899 3,321,441 0.20 0.20
Vehicle running expenses 16,748,136 11,787,749 1.04 0.72
Travelling and conveyance 28,176,825 24,553,862 1.75 1.51
Audit fees 1,719,188 2,644,052 0.11 0.16
Recruitment expenses 803,888 1,162,871 0.05 0.07
Insurance premium 1,280,691 804,078 0.08 0.05
Books and periodicals 119,504 105,846 0.01 0.01
Bank charges 9,408,390 3,684,545 0.58 0.23
Staff welfare expenses 4,474,729 3,041,822 0.28 0.19
Conference and training expenses 2,475,379 51,898 0.15 –
Electricity and gas charges 1,210,741 1,316,509 0.08 0.08
Amortization 6,589,234 4,615,025 0.41 0.28
Royalty 54,684,743 56,608,833 3.40 3.48
Depreciation 22,887,992 18,352,562 1.42 1.13
Material testing 1,200 – – –
Public issue expenses 70,000 70,000 – –
Shortage and leakage 3,926,973 – 0.24 –
377,388,679 324,561,295 23.45 19.93

37
M A R I C O B A N G L A D E S H L I M I T E D
37
NOTES TO THE FINANCIAL STATEMENTSFor the year ended 31 March 2012
26. Other income
Interest on fi xed deposit 202,869,404 222,418,384 12.60 13.68
Dividend income 3,754,141 1,617,176 0.23 0.10
Interest on call deposit 206,508 3,680,955 0.01 0.23
Gain on sale of asset 17,011,754 19,126 1.06 –
223,841,807 227,735,641 13.90 14.01
27. Finance costs
Interest on term loan 13,995,309 16,220,717 0.87 1.00
Interest on overdraft 3,474,614 30,074 0.22 –
Net foreign exchange loss 51,773,805 7,722,317 3.22 0.47
69,243,728 23,973,108 4.31 1.47
28. Income tax expense
31 March 2012Taka
31 March 2011Taka
31 March 2012
Rs. Crore
31 March 2011
Rs. CroreCurrent tax expense 212,133,449 375,414,138 13.17 23.09
Deferred tax income (45,618,090) (40,467,444) (2.83) (2.49)
166,515,359 334,946,694 10.34 20.60
28.1 Reconciliation of effective tax
Profi t before income tax as per income statement 702,135,146 43.60
Income tax using the domestic corporate tax rate (@ 24.75%)
173,778,449 10.79
Factors affecting the tax charge for current period
Non deductible expenses 224,611,857 24.75% 55,591,435 3.45
Deductible expenses 55,317,279 24.75% (13,691,027) (0.85)
Tax savings from reduced tax rates from dividend 4.75% (178,322) (0.01)
Deferred tax income (45,618,090) (2.83)
Total income tax expenses 166,515,359 10.34
29. Earnings per share
29.1 Basic Earnings Per Share
The computation of EPS is given below:
Earnings attributable to ordinary shareholders(Net profi t after tax)
535,619,787 770,628,693 33.26 47.39
Weighted average number of ordinary sharesoutstanding during the year
31,500,000 31,500,000 1.96 1.94
Earnings per share (EPS) in Taka 17.00 24.46 16.97 24.43

38
M A R I C O B A N G L A D E S H L I M I T E D
38
NOTES TO THE FINANCIAL STATEMENTSFor the year ended 31 March 2012
29.2 Diluted earnings per share
Since there is no dilutive factors, diluted earnings per share is not required to be calculated.
30. Related party transactions
Name of the related party
Relationship Nature of transaction TransactionAmount
TransactionAmount
Marico Limited, India Parent company Import of raw materials and
fi nished goods 1,887,537,333 117.22
Dividend 306,180,000 19.01
Royalty and bank guarantee
commission 54,684,744 3.40
Marico Middle East FZE Subsidiary of parent company Import of raw materials 831,286,362 51.62
Kaya Limited Subsidiary of parent company Import of fi nished goods 6,726,986 0.42
Total 3,086,415,425 191.67
31. Capacity
Major product
Unit ofMeasure
Budgeted capacity
during the year
Actualproduction
during the year
Percentage of capacity
utilised
Remarks
PCNO KL 20,000 18,500 93% Excess capacity to meet future demand
32. Contingent Liabilities
At 31 March 2012 At 31 March 2011 At 31 March 2012 At 31 March 2011US dollar US dollar Rs.Crore Rs.Crore
Outstanding L/Cs 4,114,990 6,549,324 20.94 29.20
Contingent liabilities include L/C amount for import of raw material which were not received till the reporting date.
33. Financial risk management
33.1 Credit risk
Credit risk is risk of fi nancial loss if a customer or counterpart to a fi nancial instrument fails to meet its contractual obligations which arises principally from the Company’s receivables from customers.
The company makes sales on advance basis i.e. it receives advance from customers prior to sale so there is no credit risk due to uncollectibility from the customers. However, the company maintains most of the fi nancial assets with short-term deposits and cash and cash equivalents.
The following are the fi nancial assets of the Company as at 31 March 2012:
Exposure of fi nancial assetsBDT Rs.Crore
Investments 2,146 –
Accrued interest 30,632,603 1.90
Fixed deposits 610,000,000 37.88
Cash and cash equivalents 171,204,924 10.63
Total fi nancial assets 811,839,673 50.41
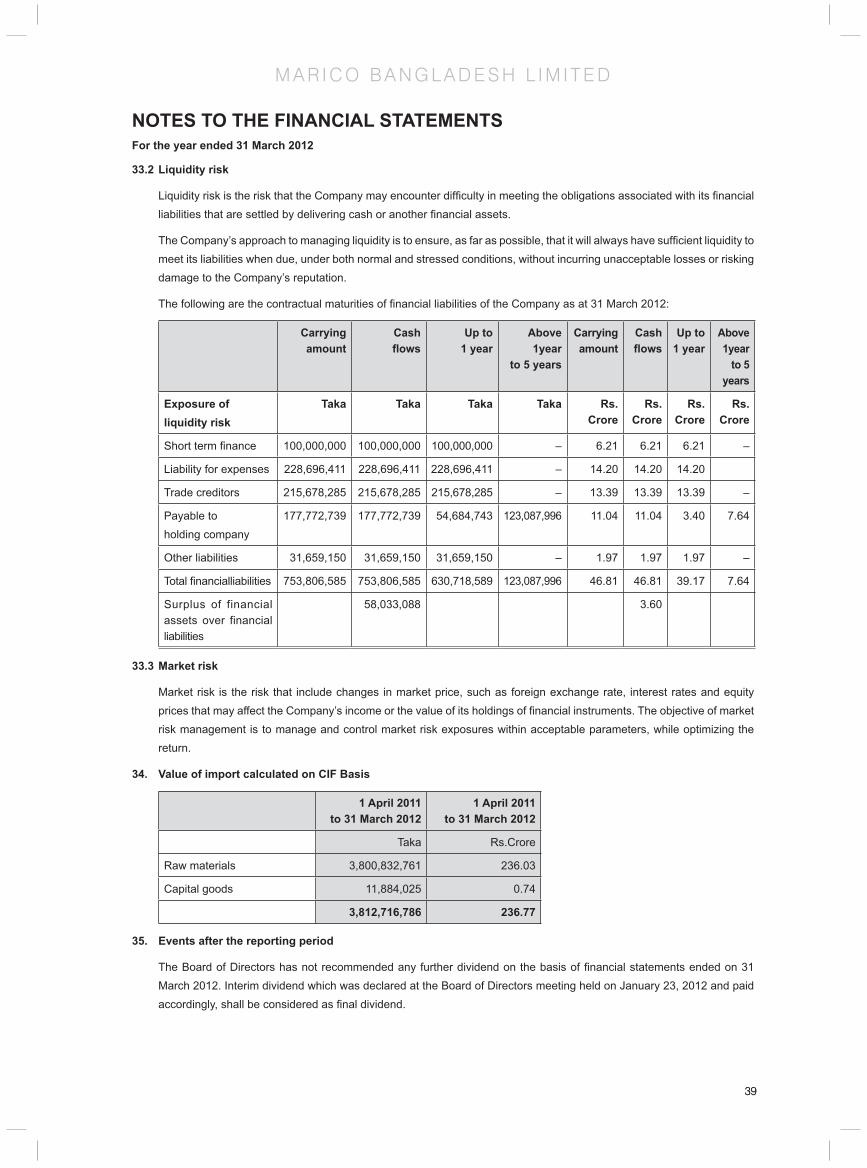
39
M A R I C O B A N G L A D E S H L I M I T E D
39
NOTES TO THE FINANCIAL STATEMENTSFor the year ended 31 March 2012
33.2 Liquidity risk
Liquidity risk is the risk that the Company may encounter diffi culty in meeting the obligations associated with its fi nancial liabilities that are settled by delivering cash or another fi nancial assets.
The Company’s approach to managing liquidity is to ensure, as far as possible, that it will always have suffi cient liquidity to meet its liabilities when due, under both normal and stressed conditions, without incurring unacceptable losses or risking damage to the Company’s reputation.
The following are the contractual maturities of fi nancial liabilities of the Company as at 31 March 2012:
Carryingamount
Cashfl ows
Up to1 year
Above 1year
to 5 years
Carryingamount
Cashfl ows
Up to1 year
Above 1year
to 5 years
Exposure of liquidity risk
Taka Taka Taka Taka Rs.Crore
Rs.Crore
Rs.Crore
Rs.Crore
Short term fi nance 100,000,000 100,000,000 100,000,000 – 6.21 6.21 6.21 –
Liability for expenses 228,696,411 228,696,411 228,696,411 – 14.20 14.20 14.20
Trade creditors 215,678,285 215,678,285 215,678,285 – 13.39 13.39 13.39 –
Payable to holding company
177,772,739 177,772,739 54,684,743 123,087,996 11.04 11.04 3.40 7.64
Other liabilities 31,659,150 31,659,150 31,659,150 – 1.97 1.97 1.97 –
Total fi nancialliabilities 753,806,585 753,806,585 630,718,589 123,087,996 46.81 46.81 39.17 7.64
Surplus of financial assets over financial liabilities
58,033,088 3.60
33.3 Market risk
Market risk is the risk that include changes in market price, such as foreign exchange rate, interest rates and equity prices that may affect the Company’s income or the value of its holdings of fi nancial instruments. The objective of market risk management is to manage and control market risk exposures within acceptable parameters, while optimizing the return.
34. Value of import calculated on CIF Basis
1 April 2011to 31 March 2012
1 April 2011to 31 March 2012
Taka Rs.Crore
Raw materials 3,800,832,761 236.03
Capital goods 11,884,025 0.74
3,812,716,786 236.77
35. Events after the reporting period
The Board of Directors has not recommended any further dividend on the basis of fi nancial statements ended on 31 March 2012. Interim dividend which was declared at the Board of Directors meeting held on January 23, 2012 and paid accordingly, shall be considered as fi nal dividend.
40
M A R I C O B A N G L A D E S H L I M I T E D
40
The Board of Directors has approved transfer of land measuring 40 decimals situated at Sirirchala, Mahona, Bobanipur, Gazipur to Rural Electrifi cation Board (REB) for getting uninterrupted electricity supply for smooth operations of new factory.
36. General
The number of employees engaged for the whole period or part thereof who received a total salary of Tk 36,000 p.a. and above was 124 (previous year: 104).
Previous year’s fi gures have been rearranged wherever considered necessary.
NOTES TO THE FINANCIAL STATEMENTSFor the year ended 31 March 2012

41
M B L I N D U S T R I E S L I M I T E D
41
Board of Directors Harsh Mariwala
Milind Sarwate
Debashish Neogi
Vijay Subramaniam
Registered Offi ce House-1, Road-1, Sector-1,
Uttara, Dhaka – 1230, Bangladesh
Auditors Rahman Rahman Huq
Chartered Accountants
Internal Auditors Farhad Hussain & Co.
Bankers Standard Chartered Bank
Citibank N.A.
Legal Advisors Corporate Counsel
Suite-802, Rahat Tower (7th Floor),
14, Biponon C/A,
West Banglamotor, Dhaka-1000

42
M B L I N D U S T R I E S L I M I T E D
42
DIRECTORS’ REPORTTo,
The Members
The Board of Directors is pleased to present the Annual Report together with audited accounts of your Company for the year ended September 30, 2011.
FINANCIAL RESULTS (Taka Crore) (Rs. Crore)Particulars 2011 2010 2011 2010
Sales and Other Income – 1.79 0.00 1.05
Profi t before tax 0.22 (0.61) (0.14) (0.35)
Tax – (0.001) – (0.00)
Profi t after Tax (0.22) (0.62) (0.14) (0.37)
Add : Surplus brought forward 2.50 3.12 1.61 1.84
Surplus carried forward 2.72 2.50 1.76 1.47
Note: The exchange rate used to convert Taka to Rs. is Rs. 0.65 /Taka)
SALES TURNOVER & PROFITABILITY
During the year ended September 30, 2011 (FY10), there was on trading transaction except other income on which it earned a profi t/income before tax of Taka 0.22 Crore and a profi t after tax of Taka 0.22 Crore.
DIVIDEND
No dividend is being proposed for this year.
DIRECTORS
The Board of Directors was same as previous period
AUDITORS
M/s. Rahman Rahman Huq, Chartered Accountants, retire and a new auditor will be appointed of the Company.
HUMAN RESOURCES
The Board wishes to place on record its appreciation of the co-operation and support received from all members of the organization.
ACKNOWLEDGEMENT
The Board acknowledges the continued support and assistance received from the Government of Bangladesh, Bankers, Vendors, Distributors and other business associates and looks forward to continued support of all these partners in progress.
For and on behalf of Board of Directors
Place: Dhaka Debashish Neogi Vijay Subramaniam Date: January 13, 2012 Director Director
DIRECTORS’ REPORT
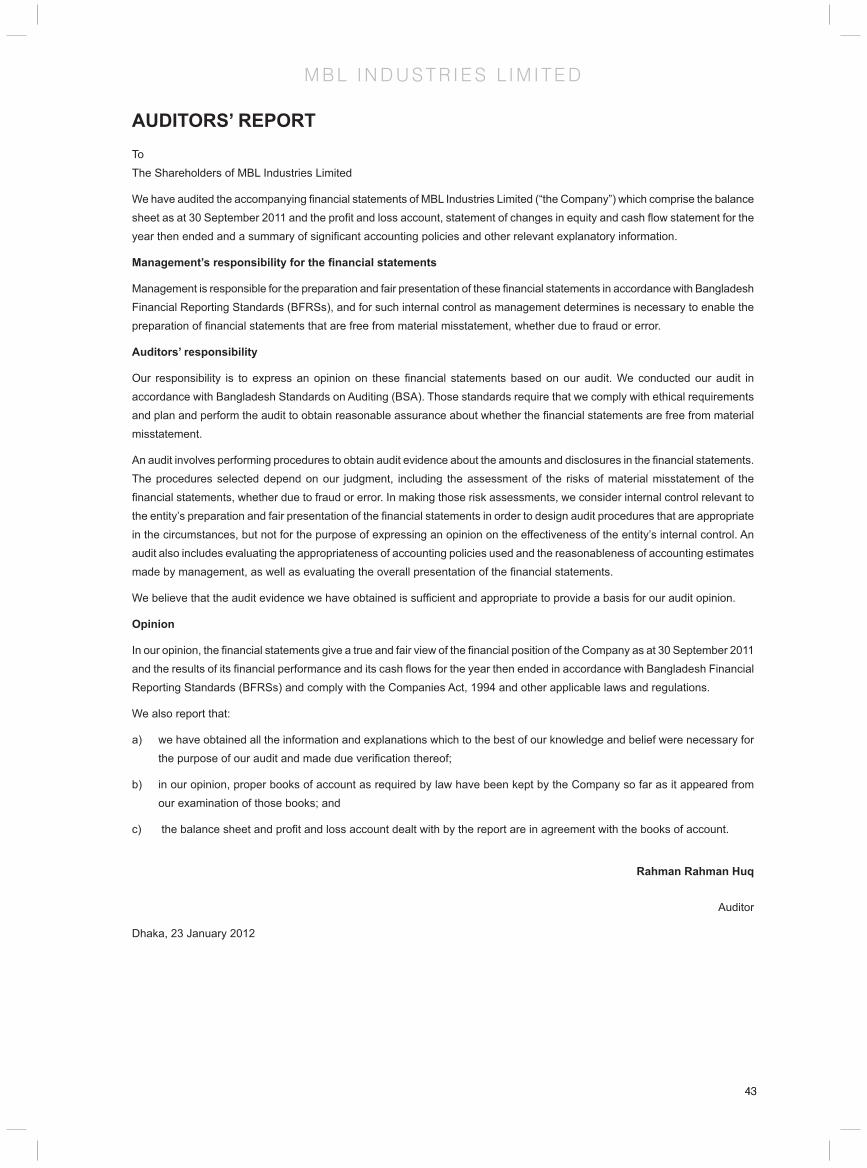
43
M B L I N D U S T R I E S L I M I T E D
43
AUDITORS’ REPORTTo The Shareholders of MBL Industries Limited
We have audited the accompanying fi nancial statements of MBL Industries Limited (“the Company”) which comprise the balance sheet as at 30 September 2011 and the profi t and loss account, statement of changes in equity and cash fl ow statement for the year then ended and a summary of signifi cant accounting policies and other relevant explanatory information.
Management’s responsibility for the fi nancial statements
Management is responsible for the preparation and fair presentation of these fi nancial statements in accordance with Bangladesh Financial Reporting Standards (BFRSs), and for such internal control as management determines is necessary to enable the preparation of fi nancial statements that are free from material misstatement, whether due to fraud or error.
Auditors’ responsibility
Our responsibility is to express an opinion on these fi nancial statements based on our audit. We conducted our audit in accordance with Bangladesh Standards on Auditing (BSA). Those standards require that we comply with ethical requirements and plan and perform the audit to obtain reasonable assurance about whether the fi nancial statements are free from material misstatement.
An audit involves performing procedures to obtain audit evidence about the amounts and disclosures in the fi nancial statements. The procedures selected depend on our judgment, including the assessment of the risks of material misstatement of the fi nancial statements, whether due to fraud or error. In making those risk assessments, we consider internal control relevant to the entity’s preparation and fair presentation of the fi nancial statements in order to design audit procedures that are appropriate in the circumstances, but not for the purpose of expressing an opinion on the effectiveness of the entity’s internal control. An audit also includes evaluating the appropriateness of accounting policies used and the reasonableness of accounting estimates made by management, as well as evaluating the overall presentation of the fi nancial statements.
We believe that the audit evidence we have obtained is suffi cient and appropriate to provide a basis for our audit opinion.
Opinion
In our opinion, the fi nancial statements give a true and fair view of the fi nancial position of the Company as at 30 September 2011 and the results of its fi nancial performance and its cash fl ows for the year then ended in accordance with Bangladesh Financial Reporting Standards (BFRSs) and comply with the Companies Act, 1994 and other applicable laws and regulations.
We also report that:
a) we have obtained all the information and explanations which to the best of our knowledge and belief were necessary for the purpose of our audit and made due verifi cation thereof;
b) in our opinion, proper books of account as required by law have been kept by the Company so far as it appeared from our examination of those books; and
c) the balance sheet and profi t and loss account dealt with by the report are in agreement with the books of account.
Rahman Rahman Huq
Auditor
Dhaka, 23 January 2012

44
M B L I N D U S T R I E S L I M I T E D
44
As at 30 September 2011
2011 2010 2011 2010 Note Taka Taka Rs. Crore Rs. Crore
Source Of funds
Shareholders Funds
Share capital 4 1,000,000 1,000,000 0.07 0.06
Reserves and surplus 27,159,648 24,998,799 1.77 1.62
Total 28,159,648 25,998,799 1.84 1.68
Application of funds
Current assets: Loans & advances
Advance income tax 5 40,009,557 39,765,879 2.60 2.57
Accrued interest 6 1,142,260 734,041 0.07 0.05
Cash and cash equivalents 7 30,545,235 29,015,932 1.99 1.88
71,697,052 69,515,852 4.66 4.50
Current liabilities & Provisions
Liability for expenses 8 583,074 623,324 0.04 0.04
Provision for tax 9 37,799,831 37,799,831 2.46 2.45
Payable to holding company 10 3,609,981 3,609,981 0.24 0.23
Other liabilities 11 1,544,517 1,483,917 0.10 0.10
43,537,404 43,517,053 2.84 2.82
Net current assets 28,159,648 25,998,799 1.82 1.68
Total 28,159,648 25,998,799 1.82 1.68
The accompanying notes 1 to 19 form an integral part of these fi nancial statements.
BALANCE SHEET
As per our annexed report of same date.
Rahman Rahman Huq Debashish Neogi Vijay Subramaniam
Auditors Director Director
Place : DhakaDate : 5 June 2012
Note: The exchange rate used to convert Taka to Rs. <0.651> / <Taka> (Rs. <0.647> / <Taka>) “The columns in INR are not part of the audited fi nancial statements and the audit opinion does not apply to them.”

45
M B L I N D U S T R I E S L I M I T E D
45
Year ended 30 September 2011
2011 2010 2011 2010 Note Taka Taka Rs. Crore Rs. Crore
Turnover 12 – 17,847,669 – 1.15
Cost of sales 13 – (15,187,906) – (0.98)
Gross profi t – 2,659,762 – 0.17
General and administrative expenses 14 684,148 (294,347) 0.04 (0.02)
Selling and distribution expenses 15 – 11,069,158 – 0.72
684,148 10,774,811 0.04 0.70Results from operating activities (684,148) (8,115,049) (0.04) (0.53)Finance income 16 2,844,997 2,061,978 0.19 0.13Profi t/(loss) before taxation 2,160,849 (6,053,071) 0.15 (0.40)Tax expensesCurrent tax expenses 17 – – – –Deferred tax expenses – (101,493) – (0.01) – (101,493) – (0.01)Profi t/(loss) for the year 2,160,849 (6,154,564) 0.15 (0.41)
The accompanying notes 1 to 19 form an integral part of these fi nancial statements.
PROFIT AND LOSS ACCOUNT
Note: The exchange rate used to convert Taka to Rs. <0.651> / <Taka> (Rs. <0.647> / <Taka>) “The columns in INR are not part of the audited fi nancial statements and the audit opinion does not apply to them.”
As per our annexed report of same date.
Rahman Rahman Huq Debashish Neogi Vijay Subramaniam
Auditors Director Director
Place : DhakaDate : 5 June 2012

46
M B L I N D U S T R I E S L I M I T E D
46
Year ended 30 September 2011
2011 2010 2011 2010 Note Taka Taka Rs. Crore Rs. Crore
Cash fl ows from operating activities
Profi t/(loss) before taxation 2,160,849 (6,053,071) 0.14 (0.39)
Adjustment for:
Depreciation – 1,278 – –
Written of fi xed assets – 2,555 – –
–- 3,833 – –
Increase/(decrease) in liabilities for expenses (40,250) (2,609,144) – (0.17)
Increase/(decrease) in other liabilities 60,600 (2,000,891) – (0.13)
Decrease in inventory of fi nished goods – 11,084,529 – 0.72
Decrease in trade debtors – 3,209,443 – 0.21
(Increase)/decrease in accrued interest (408,219) 1,915,877 (0.03) 0.12
Cash generated from operation (387,869) 11,603,647 (0.03) 0.75
Income tax paid (243,678) (1,872,068) (0.02) (0.12)
Net cash from operating activities 1,529,302 3,678,508 0.09 0.24
Cash fl ows from investing activities – – – –
Net cash infl ow/(outfl ow) from investing activities – – – –
Cash fl ows from fi nancing activities – – – –
Net cash infl ow/(outfl ow) from fi nancing activities – – – –
Net increase in cash and cash equivalents 1,529,302 3,678,508 0.09 0.24
Cash and cash equivalents as at 1 October 29,015,933 25,337,424 1.89 1.65
Cash and cash equivalents as at 30 September 30,545,235 29,015,932 1.98 1.89
CASH FLOW STATEMENT
Note: The exchange rate used to convert Taka to Rs. <0.651> / <Taka> (Rs. <0.647> / <Taka>) “The columns in INR are not part of the audited fi nancial statements and the audit opinion does not apply to them.”

47
M B L I N D U S T R I E S L I M I T E D
47
STATEMENT OF CHANGES IN SHAREHOLDERS’ EQUITY
Year ended 30 September 2011
Share Accumulated Share Accumulated capital profi t/(loss) Total capital profi t/(loss) Total Taka Taka Taka Rs. Crore Rs. Crore Rs. Crore
Balance at 1 October 2009 1,000,000 31,153,363 32,153,363 0.07 2.17 2.24
Loss for the year – (6,154,564) (6,154,564) – (0.43) (0.43)
Balance at 30 September 2010 1,000,000 24,998,799 25,998,799 0.07 1.74 1.81
Balance at 1 October 2010 1,000,000 24,998,799 25,998,799 0.06 1.62 1.68
Profi t for the year – 2,160,849 2,160,849 – 0.14 0.14
Balance at 30 September 2011 1,000,000 27,159,648 28,159,648 0.06 1.76 1.82
Note: The exchange rate used to convert Taka to Rs. <0.651> / <Taka> (Rs. <0.647> / <Taka>) “The columns in INR are not part of the audited fi nancial statements and the audit opinion does not apply to them.”
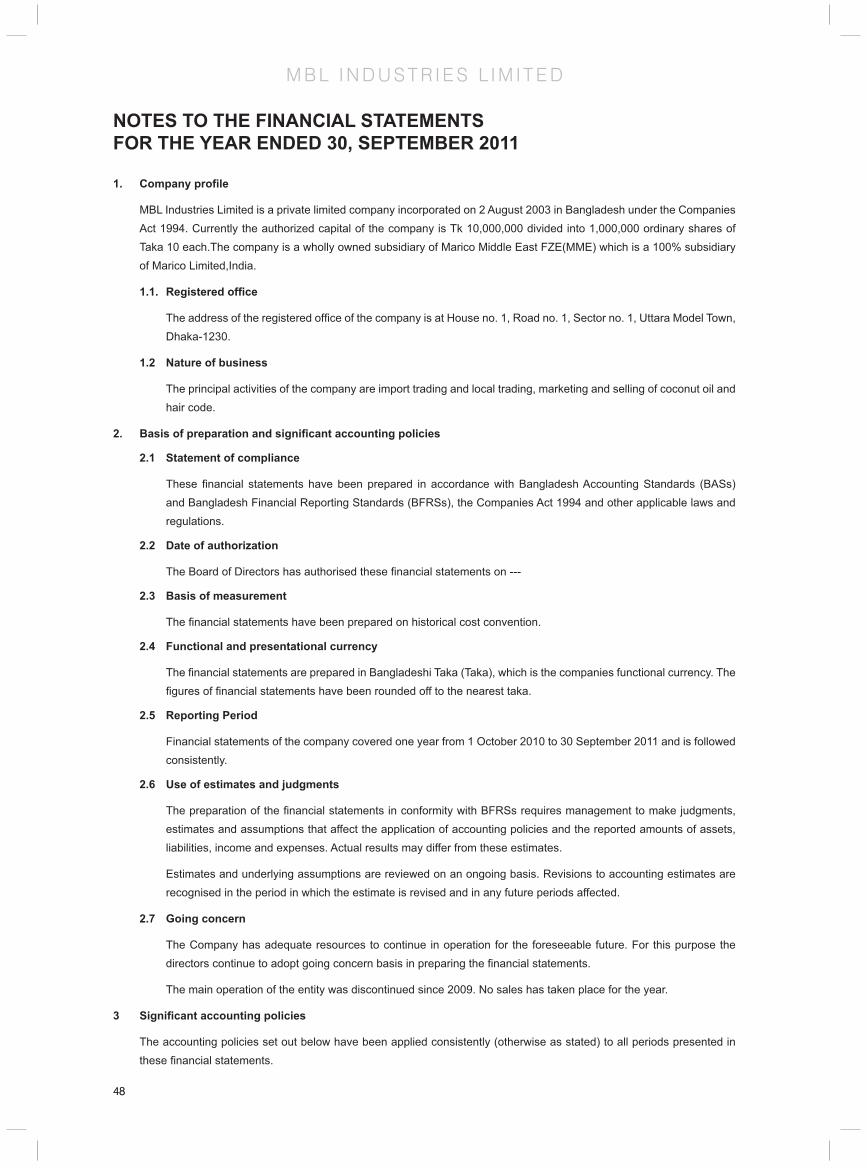
48
M B L I N D U S T R I E S L I M I T E D
48
NOTES TO THE FINANCIAL STATEMENTSFOR THE YEAR ENDED 30, SEPTEMBER 2011
1. Company profi le
MBL Industries Limited is a private limited company incorporated on 2 August 2003 in Bangladesh under the Companies Act 1994. Currently the authorized capital of the company is Tk 10,000,000 divided into 1,000,000 ordinary shares of Taka 10 each.The company is a wholly owned subsidiary of Marico Middle East FZE(MME) which is a 100% subsidiary of Marico Limited,India.
1.1. Registered offi ce
The address of the registered offi ce of the company is at House no. 1, Road no. 1, Sector no. 1, Uttara Model Town, Dhaka-1230.
1.2 Nature of business
The principal activities of the company are import trading and local trading, marketing and selling of coconut oil and hair code.
2. Basis of preparation and signifi cant accounting policies
2.1 Statement of compliance
These fi nancial statements have been prepared in accordance with Bangladesh Accounting Standards (BASs) and Bangladesh Financial Reporting Standards (BFRSs), the Companies Act 1994 and other applicable laws and regulations.
2.2 Date of authorization
The Board of Directors has authorised these fi nancial statements on ---
2.3 Basis of measurement
The fi nancial statements have been prepared on historical cost convention.
2.4 Functional and presentational currency
The fi nancial statements are prepared in Bangladeshi Taka (Taka), which is the companies functional currency. The fi gures of fi nancial statements have been rounded off to the nearest taka.
2.5 Reporting Period
Financial statements of the company covered one year from 1 October 2010 to 30 September 2011 and is followed consistently.
2.6 Use of estimates and judgments
The preparation of the fi nancial statements in conformity with BFRSs requires management to make judgments, estimates and assumptions that affect the application of accounting policies and the reported amounts of assets, liabilities, income and expenses. Actual results may differ from these estimates.
Estimates and underlying assumptions are reviewed on an ongoing basis. Revisions to accounting estimates are recognised in the period in which the estimate is revised and in any future periods affected.
2.7 Going concern
The Company has adequate resources to continue in operation for the foreseeable future. For this purpose the directors continue to adopt going concern basis in preparing the fi nancial statements.
The main operation of the entity was discontinued since 2009. No sales has taken place for the year.
3 Signifi cant accounting policies
The accounting policies set out below have been applied consistently (otherwise as stated) to all periods presented in these fi nancial statements.

49
M B L I N D U S T R I E S L I M I T E D
49
NOTES TO THE FINANCIAL STATEMENTSFOR THE YEAR ENDED 30, SEPTEMBER 2011
3.1 Revenue recognition
Revenue is recognized when the signifi cant risks and rewards of ownership have been transferred to the distributors and are exclusive of VAT as per company policy and in line with BAS 18 Revenue.
3.2 Cash and cash equivalents
Cash and cash equivalents comprise cash in hand, cash at bank and fi xed deposits.
The net cash fl ow from operating activities is determined by adjusting profi t (loss) for the year under indirect method as per BAS 7 Statement of Cash Flows.
3.3 Provisions
A provision is recognised in the balance sheet when the Company has a legal or constructive obligation as a result of past event and it is probable that an outfl ow of resources embodying economic benefi ts will be require to settle the obligation and a reliable estimate thereof can be made.
3.4 Taxation
Income tax expenses comprises current and deferred tax . Current tax and deferred tax is recognised in the statement of comprehensive income except to the extent that its relates to a item recognised directly in equity in which case it is recognized in equity.
3.4.1 Current tax
Current tax is expected tax payable or receivable on the taxable income or loss for the year, using tax rates enacted or substantively enacted at the reporting date, and any adjustment to tax payable in respect of previous years.
3.4.2 Deferred tax
Deferred tax is recognised in respect of temporary differences between the carrying amount of assets and liabilities for fi nancial reporting purpose and the amounts used for taxation purposes. Deferred tax is not recognised for:
a) Temporary differences on the initial recognition of assets or liabilities in a transaction that is not a business combination and that effects neither accounting nor taxable profi t or loss.
b) Temporary differences related to investment in subsidiaries and jointly controlled entities to the extent that it is probable that they will not reverse in the foreseeable future, and
c) Taxable temporary differences arising on the initial recognition of good will.
Deferred tax is measured at the tax rates that are expected to be applied to the temporary differences when they reverse, based on the laws that have been enacted or substantively enacted by the reporting date.
Deferred tax assets and liabilities are offset if there is legally enforceable right to offset current tax liabilities and assets, and they relate to income taxes levied by the same tax authority on the same taxable entity, or on different tax entities, but they intend to settle current tax liabilities and assets on a net basis or there tax assets and liabilities will be realised simultaneously.
A deferred tax asset is recognised to the extent that it is probable that future taxable profi ts will be available against which temporary difference can be utilised. Deferred tax assets are reviewed at each reporting date and are reduced to the extent that it is no longer probable that the related tax benefi t will be realised.
3.5 Events after the balance sheet date
Events after balance sheet date that provide additional information about the company’s positions at the balance sheet date are refl ected in the fi nancial statements. Events after the balance sheet date that are non-adjusting events are disclosed in the notes when material.
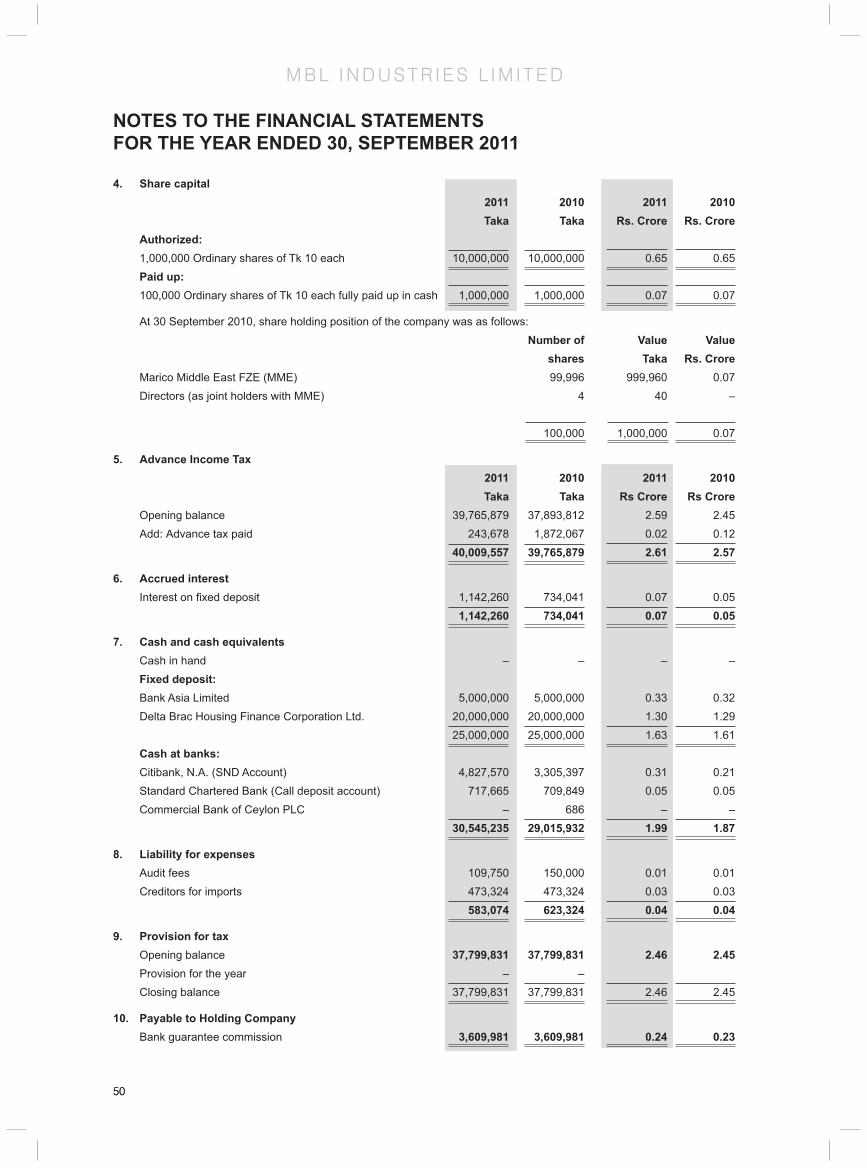
50
M B L I N D U S T R I E S L I M I T E D
50
NOTES TO THE FINANCIAL STATEMENTSFOR THE YEAR ENDED 30, SEPTEMBER 2011
4. Share capital 2011 2010 2011 2010 Taka Taka Rs. Crore Rs. Crore Authorized: 1,000,000 Ordinary shares of Tk 10 each 10,000,000 10,000,000 0.65 0.65 Paid up: 100,000 Ordinary shares of Tk 10 each fully paid up in cash 1,000,000 1,000,000 0.07 0.07
At 30 September 2010, share holding position of the company was as follows: Number of Value Value shares Taka Rs. Crore Marico Middle East FZE (MME) 99,996 999,960 0.07 Directors (as joint holders with MME) 4 40 – 100,000 1,000,000 0.07
5. Advance Income Tax 2011 2010 2011 2010 Taka Taka Rs Crore Rs Crore Opening balance 39,765,879 37,893,812 2.59 2.45 Add: Advance tax paid 243,678 1,872,067 0.02 0.12 40,009,557 39,765,879 2.61 2.57
6. Accrued interest Interest on fi xed deposit 1,142,260 734,041 0.07 0.05 1,142,260 734,041 0.07 0.05
7. Cash and cash equivalents Cash in hand – – – – Fixed deposit: Bank Asia Limited 5,000,000 5,000,000 0.33 0.32 Delta Brac Housing Finance Corporation Ltd. 20,000,000 20,000,000 1.30 1.29 25,000,000 25,000,000 1.63 1.61 Cash at banks: Citibank, N.A. (SND Account) 4,827,570 3,305,397 0.31 0.21 Standard Chartered Bank (Call deposit account) 717,665 709,849 0.05 0.05 Commercial Bank of Ceylon PLC – 686 – – 30,545,235 29,015,932 1.99 1.87
8. Liability for expenses Audit fees 109,750 150,000 0.01 0.01 Creditors for imports 473,324 473,324 0.03 0.03 583,074 623,324 0.04 0.04
9. Provision for tax Opening balance 37,799,831 37,799,831 2.46 2.45 Provision for the year – – Closing balance 37,799,831 37,799,831 2.46 2.45
10. Payable to Holding Company Bank guarantee commission 3,609,981 3,609,981 0.24 0.23

51
M B L I N D U S T R I E S L I M I T E D
51
NOTES TO THE FINANCIAL STATEMENTSFOR THE YEAR ENDED 30, SEPTEMBER 2011
11. Other liabilities 2011 2010 2011 2010 Taka Taka Rs Crore Rs Crore VAT and SD payable 1,463,917 1,463,917 0.10 0.09 Tax deducted from vendors’ bills 80,600 20,000 0.01 - 1,544,517 1,483,917 0.11 0.0912. Turnover Product Parachute – 3,068,172 – 0.20 Hair code – 14,377,289 – 0.93 Parachute extension – 402,208 – 0.03 – 17,847,669 – 1.1613. Cost of sales Product Parachute – 3,688,662 – 0.24 Hair code – 8,516,193 – 0.55 Parachute extension – 2,983,052 –- 0.19 – 15,187,906 – 0.9814. General and administrative expenses Salaries and allowances – (749,749) – (0.05) Professional charges 672,750 209,000 0.04 0.01 Communication expenses – 14,000 – – Audit fees – 131,750 – 0.01 Bank charges 11,398 71,903 – – Insurance – 24,917 – – Depreciation – 1,278 – – Loss on sale of fi xed assets – 2,555 – – 684,148 (294,347) 0.04 (0.03)15. Selling and distribution expenses Advertisement – 10,645,009 – 0.69 Market research expenses – 424,149 – 0.03 – 11,069,158 – 0.7216. Finance income 2011 2010 2011 2010 Taka Taka Rs Crore Rs Crore Interest on savings account 45,528 238,874 – 0.02 Interest on fi xed deposits 2,799,469 1,674,123 0.18 0.11 Exchange gain – 148,981 – 0.01 2,844,997 2,061,978 0.18 0.1417. Current tax expenses (unrecognised) Current year tax expense 244,346 – 0.02 – Prior year tax expense For 2009 3,067,454 – 0.20 – For 2010 880,340 – 0.06 - 4,192,140 – 0.28 –
The above provisions have not been recognised in the fi nancial statements. However, tax had been paid for the year 2009 and 2010 by the Company.

52
M B L I N D U S T R I E S L I M I T E D
52
18. Number of employees
MBL Industries Limited has no employees since July 2009.(All employees resigned on 30 June 2009) The employees of Marico Bangladesh Limited provide support for continuing its operations. Preparation and presentation of the fi nancial statements was also done by the employees of Marico Bangladesh Limited.
19. General
Previous year’s figures have been rearranged wherever considered necessary to conform to current year’s presentation.
NOTES TO THE FINANCIAL STATEMENTSFOR THE YEAR ENDED 30, SEPTEMBER 2011

53
K A Y A L I M I T E D
Board of Directors Harsh Mariwala
Ravindra Mariwala
Rajen Mariwala (appointed w.e.f November 1, 2011)
Rishabh Mariwala (appointed w.e.f November 1, 2011)
Registered Offi ce Rang Sharda, K. C. Marg
Bandra Reclamation, Bandra (W), Mumbai – 400 050
Auditors M/s Price Waterhouse
Chartered Accountants
Internal Auditors Aneja Associates, Chartered Accountants
Bankers Citibank NA
HDFC Bank Limited
ICICI Bank Limited
Standard Chartered Bank
Website www.kayaclinic.com

54
K A Y A L I M I T E D
DIRECTORS’ REPORTTo
The Members
Your Board of Directors (‘Board’) is pleased to present the Ninth Annual Report together with audited accounts of your Company for the year ended March 31, 2012.
FINANCIAL RESULTS - AN OVERVIEW
During the year under review, your Company reported total revenue of Rs. 141.74 Crores inclusive of Rs 11.96 crore towards dividend income received from Derma Rx International Aesthetics Pte Limited and an operating loss of Rs. 2.94 crore.
Year ended March 31,
2012 2011 Rs. Crore Rs. Crore
Total Revenue 141.74 108.02
Profi t / (Loss) Before Tax and Exceptional Items (2.51) (33.53)
Exceptional Items (0.46) (7.74)
Profi t / (Loss) Before Tax (2.97) (41.27)
Profi t / (Loss) Before Tax from Continuing Operations (2.97) (40.86)
Less : Provision for Tax for Current Period
(Fringe Benefi t Tax +Deferred Tax) (0.02) (0.00)
Profi t / (Loss) after Tax from Continuing Operations (2.94) (40.86)
Profi t / (Loss) Before Tax from Discontinuing Operations (0.00) (0.40)
Less: Provision for Tax for Current Period
(Fringe Benefi t Tax +Deferred Tax) (0.00) (0.00)
Profi t / Loss after Tax from Discontinuing Operations (0.00) (0.40)
Total Profi t / (Loss) after Tax for current period (2.94) (41.26)
Add: Profi t / (Loss) Brought Forward (72.06) (30.79)
Profi t / (Loss) carried forward (75.00) (72.05)
DISTRIBUTION TO SHAREHOLDERS
No dividend is being proposed for the year.
REVIEW OF OPERATIONS
The business of your company comprises offering skin care solutions to its customers. The service revenue includes packaged services for which the consideration is collected upfront towards services to be availed by the customers over a period of time. These advances are non-refundable and hence are designed to constitute revenue at some point of time in the future. Pending the installation of requisite information technology to enable measuring of the actual utilization of services by customers against each package, your company had been recognizing revenue based on estimates for any given period insofar as packaged services are concerned. The company had developed and deployed Point of Sale (POS) software last year to track the utilization of services by customers against these packages and has accordingly refi ned the said policy so as to strictly align the recognition of revenue with the services rendered. Accordingly, during the year under review, additional amounts of INR 10.78 crore (~USD 2 mio) collected during the period in respect of which services have been considered to be pending to be rendered as at the period end have been deferred for recognition upon rendering of services in the subsequent periods. Total deferred collection as on 31st March 2012 stands at 33.95 Crore. The deferred collections are included under the head Current Liabilities. However these advances are non-refundable and hence are designed to constitute revenue at some point of time in the future. Had Kaya not made the said refi nement of the accounting estimates, your company’s total revenue would have been higher by INR 10.78 Crores and would have resulted in a year on year growth of 34%.

55
K A Y A L I M I T E D
Accounting standard require impairment testing on a clinic by clinic basis. The company has carried this out during the year under review which resulted in an additional impairment of Rs. 0.46 Crores (shown as Exceptional Item in the table above). Your company however remains confi dent about the potential of the Kaya business as a whole. An application of the impairment test to the business as a whole would yield a positive result as other clinics are performing well.
Your company’s turnover comprises service revenue and product revenue. In FY12, the company clocked a service turnover of Rs. 98.98 Crores as against Rs. 81.39 Crores during FY11. The sale of the skin care products of your Company increased to Rs. 30.65 Crores in FY12from Rs. 23.73 Crores in FY11.
The management believes that the building blocks are in place for turning in a better operating and fi nancial performance in future.
OTHER CORPORATE DEVELOPMENTS
NEW RETAIL SET UP
During the year your Company initiated a change in its positioning from ‘cure’ to ‘cure + care’. The new services introduced to take care of regular skin care needs received good traction. The focus on increasing revenue from products, led by introducing products from the Derma Rx range into the clinics in India has resulted in the contribution from the sales of products increasing from 13% to about 23%. These initiatives also helped Kaya business in India and Middle East to achieve the same clinic growth of 15%. Sustaining same store growth would reinforce Marico’s belief in the Kaya Business model, especially as we perceive a signifi cant long term opportunity in skin care solutions.
CONSERVATION OF ENERGY
Your Company’s operations are not energy-intensive and as such at present no additional investments and proposals are contemplated for reduction of consumption of energy. However, your Company is conscious of the importance of conserving energy and continuous monitoring is done in each of the clinics to reduce any wastage.
RESEARCH & DEVELOPMENT (R & D)
During the year under review, your Company continued its efforts to launch new products and services. Certain new services viz.,Kaya Spot HairFree, Aqua Fairness, Juvederm XC, Kaya Signature Face Therapies, Aqua Fairness Luxe, Gold Caviar Riche Face Therapy were launched. The R&D team also developed new products viz., Hyaluronic Moisturising Serum, Firm & Lift Serum and Skin Rejuvenating Serum, Insta Brightening Micro Mask .
TECHNOLOGY ABSORPTION, ADAPTATION AND INNOVATION
Your Company invests actively in training its in-clinic staff to gain expertise of the equipment imported to impart the various skin care services. Such training creates a learning curve, which helps the staff absorb any new techniques that may get introduced from time to time as and when a new service is introduced.
FOREIGN EXCHANGE EARNING AND OUTGO
Foreign exchange earning and outgo during the period is as mentioned in Schedule No. “30 & 31”.
PUBLIC DEPOSITS
During the year, your Company did not accept any Public Deposits.
PARTICULARS OF EMPLOYEES
Your Company had no employee of the category indicated under Section 217 (2A) of the Companies Act, 1956 read with the Companies (Particulars of Employees) Rules, 1975, as amended from time to time. Your Company has therefore no particulars to disclose under these rules.
DIRECTORS’ RESPONSIBILITY STATEMENT
Pursuant to Section 217(2AA) of the Companies Act, 1956 (the Act), the Directors confi rm that:
1. in preparation of the annual accounts, the applicable accounting standards have been followed and that no material departures have been made from the same;
2. they have selected such accounting policies and applied them consistently and made judgements and estimates that are reasonable and prudent so as to give a true and fair view of the state of affairs of your Company as at March 31, 2012 and the loss of your Company for the year ended March 31, 2012;
DIRECTORS’ REPORT
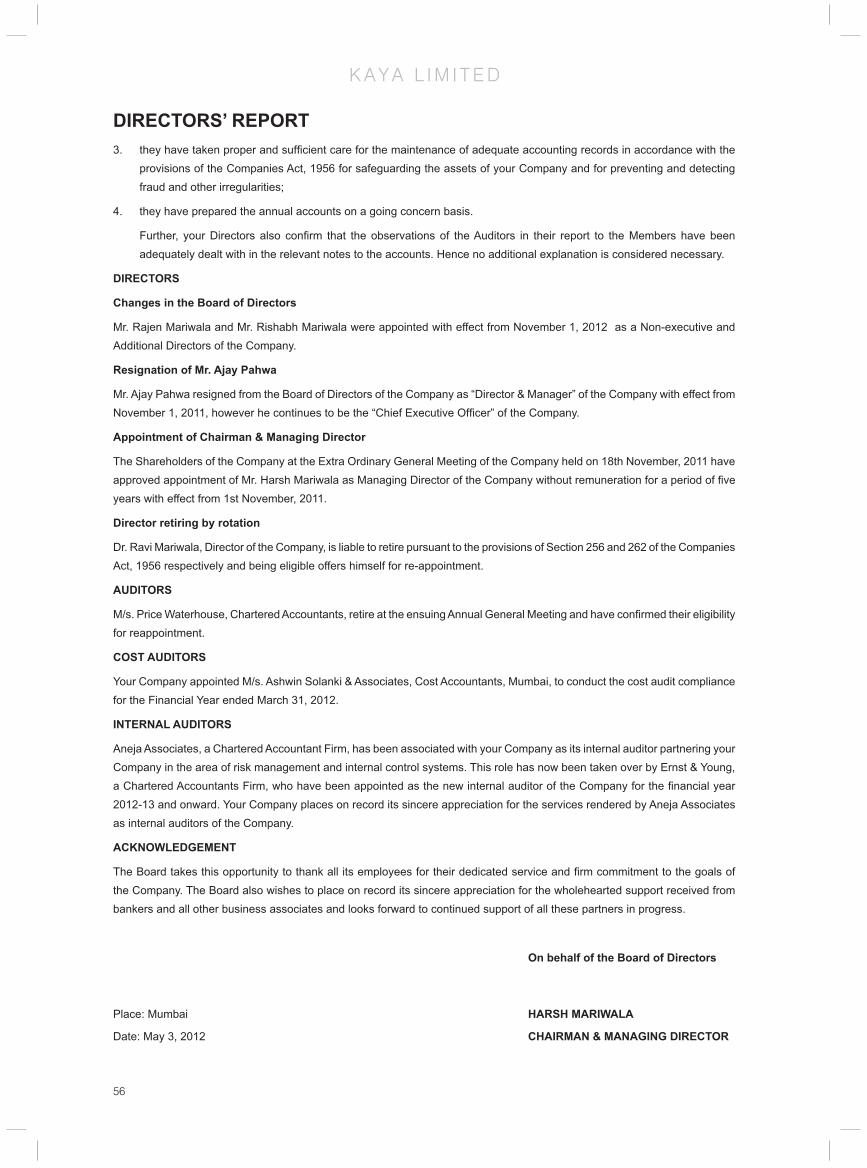
56
K A Y A L I M I T E D
DIRECTORS’ REPORT3. they have taken proper and suffi cient care for the maintenance of adequate accounting records in accordance with the
provisions of the Companies Act, 1956 for safeguarding the assets of your Company and for preventing and detecting fraud and other irregularities;
4. they have prepared the annual accounts on a going concern basis.
Further, your Directors also confi rm that the observations of the Auditors in their report to the Members have been adequately dealt with in the relevant notes to the accounts. Hence no additional explanation is considered necessary.
DIRECTORS
Changes in the Board of Directors
Mr. Rajen Mariwala and Mr. Rishabh Mariwala were appointed with effect from November 1, 2012 as a Non-executive and Additional Directors of the Company.
Resignation of Mr. Ajay Pahwa
Mr. Ajay Pahwa resigned from the Board of Directors of the Company as “Director & Manager” of the Company with effect from November 1, 2011, however he continues to be the “Chief Executive Offi cer” of the Company.
Appointment of Chairman & Managing Director
The Shareholders of the Company at the Extra Ordinary General Meeting of the Company held on 18th November, 2011 have approved appointment of Mr. Harsh Mariwala as Managing Director of the Company without remuneration for a period of fi ve years with effect from 1st November, 2011.
Director retiring by rotation
Dr. Ravi Mariwala, Director of the Company, is liable to retire pursuant to the provisions of Section 256 and 262 of the Companies Act, 1956 respectively and being eligible offers himself for re-appointment.
AUDITORS
M/s. Price Waterhouse, Chartered Accountants, retire at the ensuing Annual General Meeting and have confi rmed their eligibility for reappointment.
COST AUDITORS
Your Company appointed M/s. Ashwin Solanki & Associates, Cost Accountants, Mumbai, to conduct the cost audit compliance for the Financial Year ended March 31, 2012.
INTERNAL AUDITORS
Aneja Associates, a Chartered Accountant Firm, has been associated with your Company as its internal auditor partnering your Company in the area of risk management and internal control systems. This role has now been taken over by Ernst & Young, a Chartered Accountants Firm, who have been appointed as the new internal auditor of the Company for the fi nancial year 2012-13 and onward. Your Company places on record its sincere appreciation for the services rendered by Aneja Associates as internal auditors of the Company.
ACKNOWLEDGEMENT
The Board takes this opportunity to thank all its employees for their dedicated service and fi rm commitment to the goals of the Company. The Board also wishes to place on record its sincere appreciation for the wholehearted support received from bankers and all other business associates and looks forward to continued support of all these partners in progress.
On behalf of the Board of Directors
Place: Mumbai HARSH MARIWALA
Date: May 3, 2012 CHAIRMAN & MANAGING DIRECTOR

57
K A Y A L I M I T E D
AUDITORS’ REPORT Auditors’ Report to the Members of Kaya Limited
1. We have audited the attached Balance Sheet of Kaya Limited (the “Company”) as at March 31, 2012, and the related Statement of Profi t and Loss and Cash Flow Statement for the year ended on that date annexed thereto, which we have signed under reference to this report. These fi nancial statements are the responsibility of the Company’s Management. Our responsibility is to express an opinion on these fi nancial statements based on our audit.
2. We conducted our audit in accordance with the auditing standards generally accepted in India. Those Standards require that we plan and perform the audit to obtain reasonable assurance about whether the fi nancial statements are free of material misstatement. An audit includes examining, on a test basis, evidence supporting the amounts and disclosures in the fi nancial statements. An audit also includes assessing the accounting principles used and signifi cant estimates made by Management, as well as evaluating the overall fi nancial statement presentation. We believe that our audit provides a reasonable basis for our opinion.
3. As required by the Companies (Auditor’s Report) Order, 2003, as amended by the Companies (Auditor’s Report) (Amendment) Order, 2004 (together the “Order”), issued by the Central Government of India in terms of sub-section (4A) of Section 227 of ‘The Companies Act, 1956’ of India (the ‘Act’) and on the basis of such checks of the books and records of the Company as we considered appropriate and according to the information and explanations given to us, we give in the Annexure a statement on the matters specifi ed in paragraphs 4 and 5 of the Order.
4. Further to our comments in the Annexure referred to in paragraph 3 above, we report that:
(a) We have obtained all the information and explanations which, to the best of our knowledge and belief, were necessary for the purposes of our audit;
(b) In our opinion, proper books of account as required by law have been kept by the Company so far as appears from our examination of those books;
(c) The Balance Sheet, Statement of Profi t and Loss and Cash Flow Statement dealt with by this report are in agreement with the books of account;
(d) In our opinion, the Balance Sheet, Statement of Profi t and Loss and Cash Flow Statement dealt with by this report comply with the accounting standards referred to in sub-section (3C) of Section 211 of the Act;
(e) On the basis of written representations received from the directors, as on March 31, 2012 and taken on record by the Board of Directors, none of the directors is disqualifi ed as on March 31, 2012 from being appointed as a director in terms of clause (g) of sub-section (1) of Section 274 of the Act;
(f) In our opinion and to the best of our information and according to the explanations given to us, the said fi nancial statements together with the notes thereon and attached thereto give, in the prescribed manner, the information required by the Act, and give a true and fair view in conformity with the accounting principles generally accepted in India:
(i) in the case of the Balance Sheet, of the state of affairs of the Company as at March 31, 2012;
(ii) in the case of the Statement of Profi t and Loss, of the loss for the year ended on that date; and
(iii) in the case of the Cash Flow Statement, of the cash fl ows for the year ended on that date.
For Price WaterhouseFirm Registration Number: 301112EChartered AccountantsUday ShahPartnerMembership Number F - 46061
Place : MumbaiDate : May 3, 2012

58
K A Y A L I M I T E D
ANNEXURE TO AUDITOR’S REPORTReferred to in paragraph 3 of the Auditors’ Report of even date to the members ofKaya Limited on the fi nancial statements for the year ended March 31, 2012.
1. (a) The Company is maintaining proper records showing full particulars, including quantitative details and situation, of fi xed assets.
(b) The fi xed assets are physically verifi ed by the Management according to a phased programme designed to cover all the items over a period of two years which, in our opinion, is reasonable having regard to the size of the Company and the nature of its assets. Pursuant to the programme, a portion of the fi xed assets has been physically verifi ed by the Management during the year and no material discrepancies between the book records and the physical inventory have been noticed.
(c) In our opinion, and according to the information and explanations given to us, a substantial part of fi xed assets has not been disposed of by the Company during the year.
2. (a) The inventory has been physically verifi ed by the Management during the year. In our opinion, the frequency of verifi cation is reasonable.
(b) In our opinion, the procedures of physical verifi cation of inventory followed by the Management are reasonable and adequate in relation to the size of the Company and the nature of its business.
(c) On the basis of our examination of the inventory records, in our opinion, the Company is maintaining proper records of inventory. The discrepancies noticed on physical verifi cation of inventory as compared to book records were not material.
3. (a) The Company has not granted any loans, secured or unsecured, to companies, fi rms or other parties covered in the register maintained under Section 301 of the Act.
(b) The Company has taken interest free unsecured loans from the Holding Company covered in the register maintained under Section 301 of the Act. The maximum amount involved during the year and the year-end balance of such loans aggregated to Rs. 1,372,627,847 and Rs. 1,021,477,149, respectively.
(c) In our opinion, the rate of interest and other terms and conditions of such loans are not prima facie prejudicial to the interest of the Company.
(d) The said loan has not become due for repayment as at the year end.
4. In our opinion, and according to the information and explanations given to us, there is an adequate internal control system commensurate with the size of the Company and the nature of its business for the purchase of inventory and fi xed assets and for the sale of goods and services. Further, on the basis of our examination of the books and records of the Company, and according to the information and explanations given to us, we have neither come across, nor have been informed of, any continuing failure to correct major weaknesses in the aforesaid internal control system.
5. According to the information and explanations given to us, there have been no contracts or arrangements referred to in Section 301 of the Act during the year to be entered in the register required to be maintained under that Section, except for loans taken from the holding company as referred in Paragraph 3 above and reimbursement of expenses. The transactions being nature of interest free loan and reimbursement, question of commenting on comparison with prevailing market price at the relevant time does not arise.
6. The Company has not accepted any deposits from the public within the meaning of Sections 58A and 58AA of the Act and the rules framed there under.
7. In our opinion, the Company has an internal audit system commensurate with its size and the nature of its business.
8. We have broadly reviewed the books of account maintained by the Company in respect of products where, pursuant to the rules made by the Central Government of India, the maintenance of cost records has been prescribed under clause (d) of sub-section (1) of Section 209 of the Act, and are of the opinion that, prima facie, the prescribed accounts and records have been made and maintained. We have not, however, made a detailed examination of the records with a view to determine whether they are accurate or complete.
9. (a) According to the information and explanations given to us and the records of the Company examined by us, in our opinion, the Company is regular in depositing the undisputed statutory dues, including provident fund, employees’
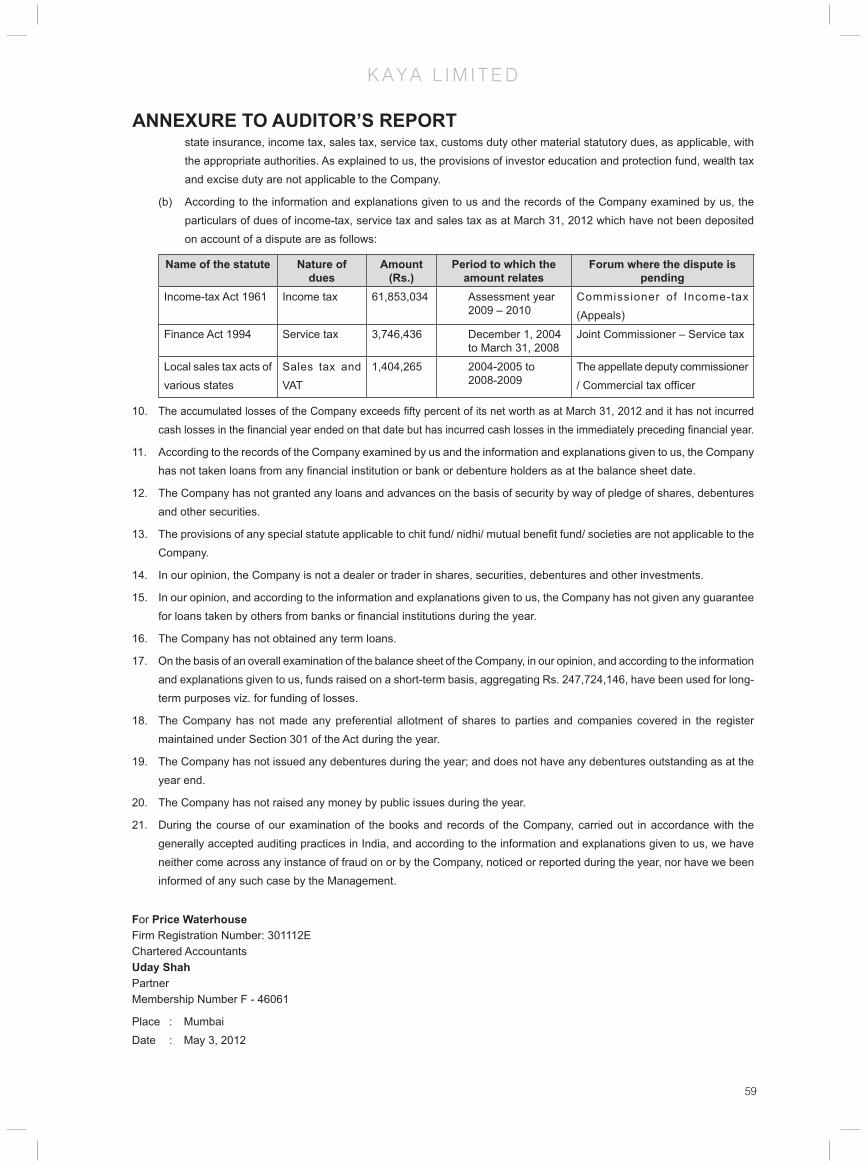
59
K A Y A L I M I T E D
state insurance, income tax, sales tax, service tax, customs duty other material statutory dues, as applicable, with the appropriate authorities. As explained to us, the provisions of investor education and protection fund, wealth tax and excise duty are not applicable to the Company.
(b) According to the information and explanations given to us and the records of the Company examined by us, the particulars of dues of income-tax, service tax and sales tax as at March 31, 2012 which have not been deposited on account of a dispute are as follows:
Name of the statute Nature of dues
Amount(Rs.)
Period to which the amount relates
Forum where the dispute is pending
Income-tax Act 1961 Income tax 61,853,034 Assessment year 2009 – 2010
Commissioner of Income-tax (Appeals)
Finance Act 1994 Service tax 3,746,436 December 1, 2004 to March 31, 2008
Joint Commissioner – Service tax
Local sales tax acts of various states
Sales tax and VAT
1,404,265 2004-2005 to 2008-2009
The appellate deputy commissioner / Commercial tax offi cer
10. The accumulated losses of the Company exceeds fi fty percent of its net worth as at March 31, 2012 and it has not incurred cash losses in the fi nancial year ended on that date but has incurred cash losses in the immediately preceding fi nancial year.
11. According to the records of the Company examined by us and the information and explanations given to us, the Company has not taken loans from any fi nancial institution or bank or debenture holders as at the balance sheet date.
12. The Company has not granted any loans and advances on the basis of security by way of pledge of shares, debentures and other securities.
13. The provisions of any special statute applicable to chit fund/ nidhi/ mutual benefi t fund/ societies are not applicable to the Company.
14. In our opinion, the Company is not a dealer or trader in shares, securities, debentures and other investments.
15. In our opinion, and according to the information and explanations given to us, the Company has not given any guarantee for loans taken by others from banks or fi nancial institutions during the year.
16. The Company has not obtained any term loans.
17. On the basis of an overall examination of the balance sheet of the Company, in our opinion, and according to the information and explanations given to us, funds raised on a short-term basis, aggregating Rs. 247,724,146, have been used for long-term purposes viz. for funding of losses.
18. The Company has not made any preferential allotment of shares to parties and companies covered in the register maintained under Section 301 of the Act during the year.
19. The Company has not issued any debentures during the year; and does not have any debentures outstanding as at the year end.
20. The Company has not raised any money by public issues during the year.
21. During the course of our examination of the books and records of the Company, carried out in accordance with the generally accepted auditing practices in India, and according to the information and explanations given to us, we have neither come across any instance of fraud on or by the Company, noticed or reported during the year, nor have we been informed of any such case by the Management.
For Price WaterhouseFirm Registration Number: 301112EChartered AccountantsUday ShahPartnerMembership Number F - 46061
Place : MumbaiDate : May 3, 2012
ANNEXURE TO AUDITOR’S REPORT

60
K A Y A L I M I T E D
BALANCE SHEET As at March 31, Note 2012 2011 Rs. Crore Rs. CroreEQUITY AND LIABILITIESSHAREHOLDERS’ FUNDSShare capital 3 14.50 14.50 Reserves and surplus 4 (59.09) (56.14) (44.59) (41.64)NON - CURRENT LIABILITIESLong-term borrowings 5 102.15 108.02 Long-term provisions 6 3.64 3.34 105.79 111.36 CURRENT LIABILITIESTrade payables 7 10.39 9.07 Other current liabilities 8 40.33 31.96 Short-term provisions 9 1.59 1.08 52.31 42.11 Total 113.52 111.83 ASSETSNON - CURRENT ASSETSFixed assets - Tangible assets 10 43.14 48.46 - Intangible assets 10 0.05 0.16 - Capital work-in-progress 2.16 0.28 45.35 48.90 Non-current investments 11 22.98 22.98 Long-term loans and advances 12 17.38 15.56 Other non-current assets 13 0.27 0.27 40.63 38.82 CURRENT ASSETS Inventories 14 15.63 13.95 Trade receivables 15 0.25 0.27 Cash and bank balances 16 1.29 0.98 Short-term loans and advances 17 9.40 8.20 Other current assets 18 0.96 0.71 27.53 24.11 Total 113.52 111.83
As per our attached report of even date
For Price Waterhouse For and on behalf of the Board of DirectorsChartered Accountants Firm Registration Number: 301112E HARSH MARIWALA Chairman and Managing Director RAJEN MARIWALA DirectorUday ShahPartner Deepali Heroor Company SecretaryMembership No. : F-46061 Place : Mumbai Date : May 3, 2012

61
K A Y A L I M I T E D
STATEMENT OF PROFIT AND LOSS Year Ended March 31,
SCHEDULE 2012 2011 Rs. Crore Rs. CroreREVENUE :Revenue from operations 21 129.63 105.12 Other income 22 12.11 2.89 TOTAL REVENUE 141.74 108.02 EXPENSES:Cost of material consumed 23 7.70 5.49 Purchases of stock-in-trade 1.51 1.83 Changes in inventories of fi nished goods, work-in-progress and stock-in-trade - (Increase) / decrease 24 0.14 (0.73)Employee benefi ts expenses 25 30.48 31.19 Finance costs 26 2.02 1.71 Depreciation and amortisation expenses 10 9.57 16.25 Other expenses 27 92.83 85.79 TOTAL EXPENSES 144.25 141.54 PROFIT / (LOSS) BEFORE EXCEPTIONAL ITEMS AND TAX (2.51) (33.52)Exceptional Items - expenses 28 0.46 7.74 PROFIT / (LOSS) BEFORE TAX (2.97) (41.27)PROFIT / (LOSS) BEFORE TAX FROM CONTINUING OPERATIONS (2.97) (40.86)Tax Expenses- Current tax (Refer note 40(a)) - - - Deferred tax (Refer note 40(b)) - - - Fringe benefi t tax - prior year revenue (0.02) (0.00)PROFIT / (LOSS) AFTER TAX FROM CONTINUING OPERATIONS (2.94) (40.86)PROFIT / (LOSS) BEFORE TAX FROM DISCONTINUING OPERATIONS 33 - (0.40)Tax expenses of discontinuing operations - - PROFIT / (LOSS) AFTER TAXATION FROM DISCONTINUING OPERATIONS - (0.40)PROFIT / (LOSS) FOR THE YEAR (2.94) (41.26)Earnings per equity share: [Nominal Value per share: Rs.10 (Previous year - Rs.10)] 39Basic (2.03) (28.46)Diluted (2.03) (28.46)
As per our attached report of even date
For Price Waterhouse For and on behalf of the Board of DirectorsChartered Accountants Firm Registration Number: 301112E HARSH MARIWALA Chairman and Managing Director RAJEN MARIWALA DirectorUday ShahPartner Deepali Heroor Company SecretaryMembership No. : F-46061 Place : Mumbai Date : May 3, 2012

62
K A Y A L I M I T E D
2012 2011 Rs. Crore Rs. CroreA CASH FLOW FROM OPERATING ACTIVITIES Profi t / (Loss) before tax (2.97) (41.27) Adjustments for: Depreciation and amortisation expenses 9.57 16.25 Provision for impairment of fi xed assets (Refer note 28) 0.46 7.74 Finance costs 2.02 1.71 Interest income (0.01) (1.56) Loss / (profi t) on sale / discarding of assets (net) (0.07) 2.47 Provision for impairment of fi xed assets written back (Refer note 27) – (2.34) Dividend Income (11.96) – Provision for doubtful debts / advances – 0.00 (0.00) 24.29 Operating profi t / (loss) before working capital changes (2.97) (16.98) Adjustments for: (Increase) / decrease in inventories (1.68) (3.85) (Increase) / decrease in trade receivables 0.02 0.00 (Increase) / decrease in loans and advances and other current and non-current assets (0.40) (2.03) Increase / (decrease) in trade payables and other current and non-current liabilities and provisions 10.50 22.78 8.44 16.90 Cash generated from / (used in) operations 5.48 (0.08) Taxes paid 2.83 0.21 NET CASH INFLOW / (OUTFLOW) FROM OPERATING ACTIVITIES 2.64 (0.29)B CASH FLOW FROM INVESTING ACTIVITIES Purchase of fi xed assets (6.68) (5.57) Sale of fi xed assets 0.29 0.58 Investments in a subsidiary – (22.98) Dividend income received 11.96 – Interest income received 0.00 1.54 NET CASH INFLOW / (OUTFLOW) FROM INVESTING ACTIVITIES 5.57 (26.43)C CASH FLOW FROM FINANCING ACTIVITIES Loans taken / (repaid) from the Holding Company (net of repayments) (5.87) 28.05 Finance costs paid (2.02) (1.71) NET CASH INFLOW / (OUTFLOW) FROM FINANCING ACTIVITIES (7.89) 26.34 D NET INCREASE / (DECREASE) IN CASH & CASH EQUIVALENTS 0.31 (0.38)E Cash and cash equivalents - opening balance (Refer Note 16) 0.98 1.36
F Cash and cash equivalents - closing balance (Refer Note 16) 1.29 0.98
Notes:1. The above cash fl ow statement has been prepared under the ‘Indirect Method’ as set out in the Accounting Standard – 3 on Cash Flow Statements, as specifi ed in the Companies (Accounting Standards) Rules, 2006.2. Previous year fi gures have been regrouped where necessary.
CASH FLOW STATEMENT Year Ended March 31,
As per our attached report of even date
For Price Waterhouse For and on behalf of the Board of DirectorsChartered Accountants Firm Registration Number: 301112E HARSH MARIWALA Chairman and Managing Director RAJEN MARIWALA DirectorUday ShahPartner Deepali Heroor Company SecretaryMembership No. : F-46061 Place : Mumbai Date : May 3, 2012

63
K A Y A L I M I T E D
1. GENERAL INFORMATION
Kaya Limited (‘Kaya’ or the ‘Company’), headquartered in Mumbai, India a wholly owned subsidiary of Marico Limited, carries on skin care business through Kaya Skin Clinics. The clinics offer skin care solutions using scientifi c dermatological procedures and products.
2. SUMMARY OF SIGNIFICANT ACCOUNTING POLICIES
a. Basis of preparation of fi nancial statements
The fi nancial statements are prepared in accordance with Indian Generally Accepted Accounting Principles (“GAAP”) under the historical cost convention on an accrual basis and are in conformity with mandatory accounting standards, as specifi ed in the Companies (Accounting Standards) Rules, 2006 and the other relevant provisions of the Companies Act, 1956.
All assets and liabilities have been classifi ed as current or non-current as per the Company’s normal operating cycle and other criteria set out in the Schedule VI to the Companies Act, 1956.
b. Use of Estimates
The preparation of the fi nancial statements in conformity with GAAP requires management to make estimates and assumptions that affect the reported balances of assets and liabilities and disclosures relating to contingent assets and liabilities as at the date of the fi nancial statements and reported amounts of income and expenses during the year. Examples of such estimates include provision for doubtful debts, future obligations under employee retirement benefi t plans, income taxes, the useful lives and provision for impairment of fi xed assets and intangible assets.
Management believes that the estimates used in the preparation of fi nancial statements are prudent and reasonable. Future results could differ from these estimates.
c. Tangible assets, intangible assets and capital work-in-progress
Tangible assets and intangible assets are stated at cost of acquisition, less accumulated depreciation/amortisation and impairments, if any. Cost includes taxes, duties, freight and other incidental expenses related to acquisition and installation. Pre-operative expenses incidental and related to setting up of new clinics have been included under capital work-in-progress. Such expenditure are capitalised to fi xed asset upon start of operations of the clinic.
Capital work-in-progress comprises cost of fi xed assets that are not yet ready for their intended use at the year end.
d. Depreciation / amortisation
1) Tangible assets
(i) Depreciation is provided on Straight line basis at higher of the rates based on useful lives of the assets as estimated by the management or those stipulated in Schedule XIV to the Companies Act, 1956. The depreciation rates considered for the following items are higher than the rates stipulated in Schedule XIV to the Companies Act, 1956:”
Assets Rates (p.a.)
Computer hardware, related peripherals etc. 33.33% 3 years
Technologically advanced machineries 14.29% to 50%
Other plant and equipment 11.11% to 50%
Furniture and fi xtures (Including lease hold improvements) 11.11%
NOTES TO FINANCIAL STATEMENTS

64
K A Y A L I M I T E D
(ii) The useful life of leasehold improvements are estimated taking into consideration lease period including the renewal option. Leasehold improvements includes provision for site restoration costs which are recognised based on the estimates made by management for probable liability towards restoration of these premises at the end of lease period.”
(iii) Assets individually costing Rs. 5,000 or less are depreciated fully in the year of acquisition.
(iv) Depreciation on additions during the year is charged from the month in which the assets are capitalized and for deletions up to the month prior to the month in which the asset is disposed off.
2) Intangible assets
Intangible assets are amortised over their respective individual estimated useful lives on a straight line basis, but not exceeding the period given here under:
Assets Rates (p.a.)
Computer softwares 33.33%
Trade marks / copyrights 10.00%
e. Impairment
Assessment is done at each Balance Sheet date as to whether there is any indication that an asset (tangible and intangible) may be impaired. For the purpose of assessing impairment, the smallest identifi able group of assets that generates cash infl ows from continuing use that are largely independent of the cash infl ows from other assets or groups of assets, is considered as a cash generating unit. If any such indication exists, an estimate of the recoverable amount of the asset/cash generating unit is made. Assets whose carrying value exceeds their recoverable amount are written down to the recoverable amount. Recoverable amount is higher of an asset’s or cash generating unit’s net selling price and its value in use. Value in use is the present value of estimated future cash fl ows expected to arise from the continuing use of an asset and from its disposal at the end of its useful life. Assessment is also done at each Balance Sheet date as to whether there is any indication that an impairment loss recognised for an asset in prior accounting periods may no longer exist or may have decreased.
f. Investments
Long-term investments are valued at cost. Provision for diminution, if any, in the value of investments is made to recognize a decline, other than temporary. Current investments are valued at lower of cost and fair value, computed individually for each investment. In case of investments in mutual funds which are unquoted, net asset value is taken as fair value.
g. Inventories
1) Raw materials, packing materials, stores, spares and consumables are valued at lower of cost and net realizable value. However, these items are considered to be realizable at cost if the fi nished products in which they will be used are expected to be sold at or above cost.
2) Finished goods, stock-in-trade and work-in-progress are valued at lower of cost and net realizable value.
3) Cost is ascertained on weighted average method and in case of fi nished products and work-in-progress, it includes appropriate production overheads and duties.
h. Research and development
Capital expenditure on research and development is capitalized and depreciated. Revenue expenditure is charged off in the year in which it is incurred.
NOTES TO FINANCIAL STATEMENTS

65
K A Y A L I M I T E D
i. Revenue recognition
1) Income from services is recognized on rendering of services and are recorded net of discounts and service tax.”
2) Income from package sale is recognized based on the utilisation of sessions by the customers.
3) Sale of products is recognized on delivery, which is when risks and rewards of ownership passed to the customers, and are recorded net of trade discounts, service tax, sales tax and value added tax.
j. Retirement benefi ts
1) Long-term employee benefi ts
(i) Defi ned contribution plans
“ The Company has defi ned contribution plan for post employment benefi ts in the form of provident fund. The Company’s contributions to defi ned contribution plans are charged to the Statement of Profi t and Loss as incurred.”
(ii) Defi ned benefi t plans
“The Company has defi ned benefi t plans for post employment benefi ts in the form of gratuity and leave encashment. Liability for defi ned benefi t plans is provided on the basis of valuations, as at the Balance Sheet date, carried out by an independent actuary. The actuarial valuation method used for measuring the liability is the projected unit credit method.”
2) Actuarial gains and losses due to changes in actuarial assumptions are recognised immediately in the Statement of Profi t and Loss as income or expense. “
k. Foreign currency transactions
1) Transactions in foreign currencies are recognised at the prevailing exchange rates on the transaction dates. Realised gains and losses on settlement of foreign currency transactions are recognised in the Statement of Profi t and Loss. “
2) Foreign currency monetary assets and liabilities at the year end are translated at the year end exchange rates, and the resultant exchange difference is recognised in the Statement of Profi t and Loss.”
l. Accounting for taxes on income
(i) Provision for current tax is made, based on the tax payable under the Income Tax Act, 1961.
(ii) Deferred tax on timing differences between taxable income and accounting income is accounted for, using the tax rates and the tax laws enacted or substantively enacted as on the Balance Sheet date. Deferred tax assets on unabsorbed tax losses and unabsorbed tax depreciation are recognized only when there is a virtual certainty of realization and other items are recognized when there is a reasonable certainty of realization.”
m. Assets taken on lease:
“(i) The assets taken on fi nance lease are capitalized at the inception of the lease at the lower of the fair value of the leased asset and present value of the minimum lease payments. The corresponding amount is shown as lease liabilities. The principal component in the lease rental is adjusted against the lease liability and the interest component is charged to the Statement of Profi t and Loss.”
“(ii) Operating lease payments are recognized as expenditure in the Statement of Profi t and Loss account as per the terms of the lease arrangements. Initial direct cost incurred by the company for operating lease arrangements are amortised over a non cancellable period of lease agreement.”
NOTES TO FINANCIAL STATEMENTS
66
K A Y A L I M I T E D
n. Accounting for provision, contingent liabilities and contingent assets:
Provisions are recognised in terms of Accounting Standard 29 – ‘Provisions, Contingent Liabilities and Contingent Assets’ (AS-29), notifi ed by the Companies (Accounting Standards) Rules, 2006, when there is a present legal or statutory obligation as a result of past events, where it is probable that there will be outfl ow of resources to settle the obligation and when a reliable estimate of the amount of the obligation can be made. Contingent Liabilities are disclosed only when there is a possible obligation arising from past events due to occurrence or non-occurrence of one or more uncertain future events, not wholly within the control of the Company, or where any present obligation cannot be measured in terms of future outfl ow of resources or where a reliable estimate of the obligation cannot be made. Obligations are assessed on an ongoing basis and only those having a largely probable outfl ow of resources are provided for. Contingent Assets are not recognised in the fi nancial statements.
o. Cash and Cash Equivalents
In the cash fl ow statement, cash and cash equivalents includes cash in hand, demand deposits with banks, other short-term highly liquid investments with original maturities of three months or less.
p. Earnings Per Share
“Basic earnings per share is calculated by dividing the net profi t or loss for the year attributable to equity shareholders by the weighted average number of equity shares outstanding during the year. Earnings considered in ascertaining the Company’s earnings per share is the net profi t for the year after deducting preference dividends and any attributable tax thereto for the period. The weighted average number of equity shares outstanding during the period and for all periods presented is adjusted for events, such asbonus shares, other than the conversion of potential equity shares, that have changed the number of equity shares outstanding, without a corresponding change in resources. For the purpose of calculating diluted earnings per share, the net profi t or loss for the period attributable to equity shareholders and the weighted average number of shares outstanding during the period is adjusted for the effects of all dilutive potential equity shares.”
NOTES TO FINANCIAL STATEMENTS
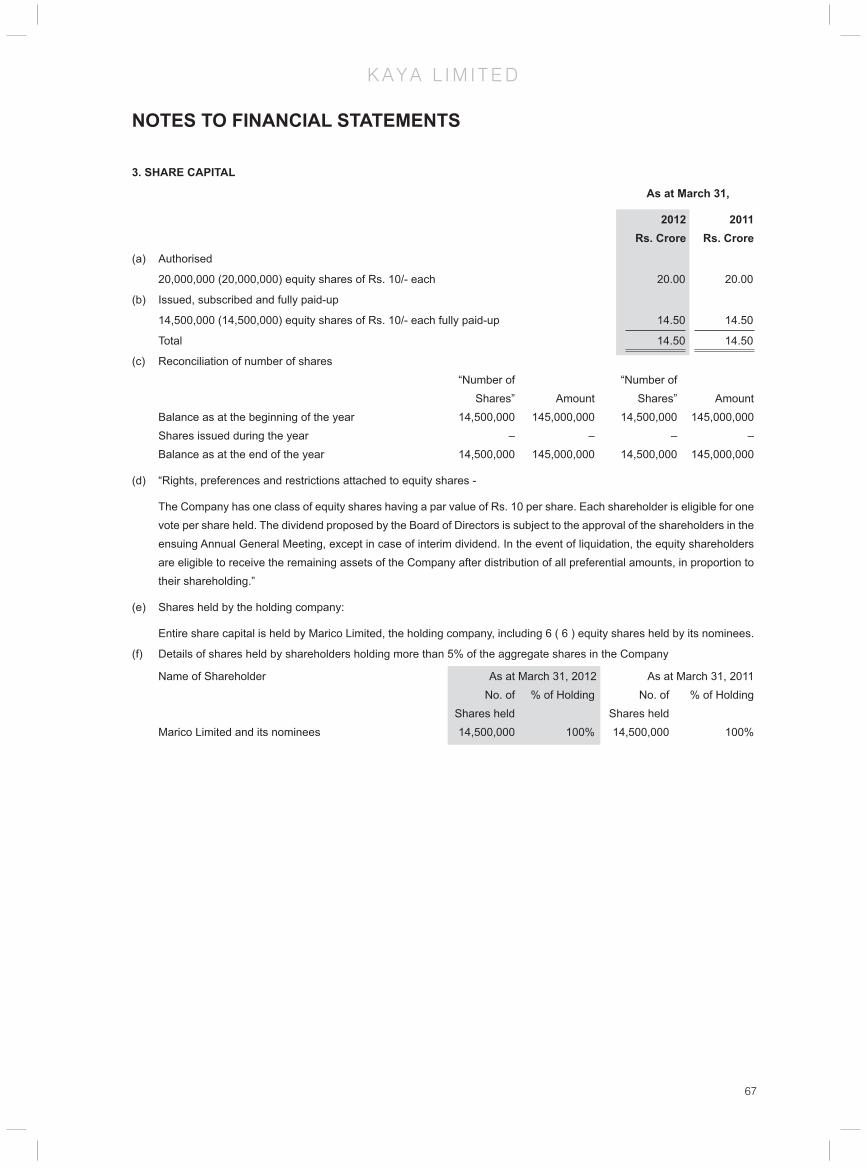
67
K A Y A L I M I T E D
NOTES TO FINANCIAL STATEMENTS
3. SHARE CAPITAL
As at March 31,
2012 2011 Rs. Crore Rs. Crore
(a) Authorised
20,000,000 (20,000,000) equity shares of Rs. 10/- each 20.00 20.00
(b) Issued, subscribed and fully paid-up
14,500,000 (14,500,000) equity shares of Rs. 10/- each fully paid-up 14.50 14.50
Total 14.50 14.50
(c) Reconciliation of number of shares “Number of “Number of Shares” Amount Shares” Amount Balance as at the beginning of the year 14,500,000 145,000,000 14,500,000 145,000,000 Shares issued during the year – – – – Balance as at the end of the year 14,500,000 145,000,000 14,500,000 145,000,000
(d) “Rights, preferences and restrictions attached to equity shares -
The Company has one class of equity shares having a par value of Rs. 10 per share. Each shareholder is eligible for one vote per share held. The dividend proposed by the Board of Directors is subject to the approval of the shareholders in the ensuing Annual General Meeting, except in case of interim dividend. In the event of liquidation, the equity shareholders are eligible to receive the remaining assets of the Company after distribution of all preferential amounts, in proportion to their shareholding.”
(e) Shares held by the holding company:
Entire share capital is held by Marico Limited, the holding company, including 6 ( 6 ) equity shares held by its nominees.
(f) Details of shares held by shareholders holding more than 5% of the aggregate shares in the Company
Name of Shareholder As at March 31, 2012 As at March 31, 2011 No. of % of Holding No. of % of Holding Shares held Shares held Marico Limited and its nominees 14,500,000 100% 14,500,000 100%

68
K A Y A L I M I T E D
4. RESERVES AND SURPLUS Securities premium reserve (Refer note 10 (3)) 15.91 15.91
Surplus / (Defi cit) in Statement of profi t and loss
Balance as at the beginning of the year (72.06) (30.79)
Loss for the year (2.94) (41.26)
Balance as at the end of the year (75.00) (72.06)
Total (59.09) (56.14)
5. LONG-TERM BORROWINGS
Unsecured:
Loan from the holding company - Interest free 102.15 108.02
Total 102.15 108.02
The above loan is given by the holding company to provide long-term funding support to the Company. There are no specifi c terms of repayment of the loan (Refer note 34).
6. LONG-TERM PROVISIONS
Provision for Employee Benefi ts:
- Provision for gratuity (Refer note 35) 0.42 0.52
0.42 0.52
Other provisions:
- Provision for equalisation of rent expenses 2.03 1.44
- Provision for site restoration cost 1.19 1.38
3.22 2.82
Total 3.64 3.34
a) Provision for equalisation of rent expenses represents provision made towards additionalliability created to recognise rent expenses on straight line basis over the lease period.
b) Provision for site restoration cost
Balance as at the beginning of the year 1.39 1.39
Additions 0.03 –
Balance as at the end of the year 1.43 1.39
Classifi ed as Non-current: 1.19 1.38
Classifi ed as current: 0.24 0.02
Total 1.43 1.39
The Company uses various leased premises for its clinics. A provision for site restoration cost is recognised for the estimates made for probable liability towards the restoration of these premises at the end of lease period.
As at March 31,
2012 2011 Rs. Crore Rs. Crore
NOTES TO FINANCIAL STATEMENTS

69
K A Y A L I M I T E D
7. TRADE PAYABLES
As at March 31,
2012 2011 Rs. Crore Rs. Crore
Trade payables 10.39 9.07
Total 10.39 9.07
a) The Company has certain dues to suppliers registered under Micro, Small and Medium Enterprises
Development Act, 2006 (‘MSMED Act’). The disclosures pursuant to the said MSMED Act are as follows:
As at March 31, 2012
As at March 31, 2011
Principal amount due to suppliers registered under the MSMED Act and remaining unpaid as at year end.
0.01 –
Interest due to suppliers registered under the MSMED Act and remaining unpaid as at year end.
– –
Principal amounts paid to suppliers registered under the MSMED Act, beyond the appointed day during the year.
– –
Interest paid other than under Section 16 of MSMED Act to suppliers registered under the MSMED Act, beyond the appointed day during the year.
– –
Interest paid under Section 16 of MSMED Act to suppliers registered under the MSMED Act beyond the appointed day during the year.
– –
Interest due and payable towards suppliers registered under MSMED Act for payments already made.
– –
Further interest remaining due and payable for earlier years. – –
b) Trade payables includes due to subsidiary Rs. 20,667,247 (Previous year: Rs. 5,796,520)
8. OTHER CURRENT LIABILITIES
As at March 31,
2012 2011 Rs. Crore Rs. Crore
Advances from customers 34.21 23.50
Book overdraft 1.18 0.61
Due to the holding company 0.85 4.90
Statutory dues including provident fund and tax deducted at source 1.57 1.15
Creditors for capital goods 0.02 0.22
Employee benefi ts payable 1.83 1.26
Others 0.67 0.32
Total 40.33 31.96
NOTES TO FINANCIAL STATEMENTS

70
K A Y A L I M I T E D
9. SHORT-TERM PROVISIONS
As at March 31,
2012 2011 Rs. Crore Rs. Crore
Provision for employee benefi ts:
Provision for gratuity 0.19 0.06
Provision for compensated absences 0.54 0.62
0.73 0.68
Other provisions:
Provision for lease termination cost 0.13 0.22
Provision for equalisation of rent expenses (Refer note 6(a)) 0.50 0.16
Provision for site restoration cost 0.24 0.02
0.86 0.40
Total 1.59 1.08
Provision for lease termination cost
Balance as at the beginning of the year 0.22 0.22
Amounts used 0.09 –
Balance as at the end of the year 0.13 0.22
Provision for lease termination cost are towards lock in period rent in respect of certain clinics closed in an earlier year, which are recognized to the extent it is more than probable that outfl ow of resources will be required to settle the transactions.
NOTES TO FINANCIAL STATEMENTS

71
K A Y A L I M I T E D
10.
FIXE
D A
SSET
S (A
mou
nt in
Rs.
Cro
re)
PART
ICUL
ARS
GROS
S BL
OCK
DEPR
ECIA
TION
/ AMO
RTIS
ATIO
NNE
T BL
O K
As at
Ap
ril 1,
20
11
Addi
tions
Dedu
ctio
ns /
Adju
stm
ents
As
at /
Marc
h 31
, 20
12
As at
/ Ap
ril 1,
20
11
For t
he ye
ar
(Ref
er N
ote 2
be
low)
Dedu
ctio
ns /
Adju
stm
ents
As at
/ Ma
rch
31,
2012
Pro
visio
n fo
r Im
pairm
ent
as at
Apr
il 1,
2011
Char
ge / (
Reve
rsal)
fo
r the
year
(Ref
er n
ote d
,e be
low
and
note
28)
Pro
visio
n fo
r Im
pairm
ent a
s at
Mar
ch 31
, 20
12
As at
/ Ma
rch
31,
2012
As at
/ Ma
rch
31,
2011
Tang
ible
asse
tsBu
ilding
s 1
6.87
–
–
1
6.87
0
.96
0.2
7 –
1
.24
–
–
–
15.
63
15.
91
"Plan
t and
equ
ipmen
t(R
efer
not
e c b
elow)
" 6
9.39
3
.80
1.0
3 7
2.17
4
3.26
6
.61
0.9
3 4
8.94
4
.61
1.11
5
.71
17.
51
21.
52
–
–
–
–
–
–
Offi c
e eq
uipm
ent
4.5
3 0
.18
0.0
1 4
.70
1.8
7 0
.65
0.0
1 2
.51
0.3
6 0
.12
0.4
8 1
.71
2.3
0
Furn
iture
and
fi xtu
res
(Ref
er n
otes
a a
nd c
below
) 1
9.04
0
.33
0.2
1 1
9.16
7
.57
1.8
8 0
.10
9.3
5 2
.74
(0.9
2) 1
.82
7.9
9 8
.74
–
–
–
–
–
–
Leas
ehold
impr
ovem
ents
–
0.4
4 –
0
.44
–
0.0
4 –
0
.04
–
0.1
2 0
.12
0.2
9 –
Tota
l - A
109.8
4 4.
75
1.25
11
3.34
53.66
9.
45
1.04
62
.08
7.71
0.
42
8.12
43
.14
48.46
In
tang
ible
asse
ts
Com
pute
r sof
twar
es 1
.96
0.0
3 0
.00
1.9
9 1
.76
0.11
0
.00
1.8
7 0
.03
0.0
4 0
.07
0.0
4 0
.16
– –
– –
– –
Trad
emar
ks /
copy
right
s –
0
.02
–
0.0
2 –
0
.00
–
0.0
0 –
–
–
0
.01
–
Tota
l - B
1.96
0.
05
0.00
2.
00
1.76
0.
11
0.00
1.
87
0.03
0.
04
0.07
0.
05
0.16
Tota
l - A
+ B
111.7
9 4.
80
1.25
11
5.34
55.43
9.
57
1.04
63
.95
7.74
0.
46
8.20
43
.19
48.63
As at
Mar
ch 31
, 201
1 11
0.48
6.18
4.
87
111.7
9 41
.00
16.25
1.
82
55.43
2.
34
5.41
7.
74
48.63
–
Not
es:
a)
Furn
iture
and
fi xt
ures
als
o in
clud
es le
aseh
old
impr
ovem
ents
, the
am
ount
s fo
r whi
ch is
not
sep
arat
ely
iden
tifi a
ble.
b)
Dep
reci
atio
n fo
r the
yea
r inc
lude
s ac
cele
rate
d de
prec
iatio
n of
Rs.
Nil
(Pre
viou
s ye
ar R
s. 3
0,94
6,15
8) d
ue to
revi
sion
of u
sefu
l life
of c
erta
in fi
xed
asse
ts a
nd c
harg
e of
Rs.
Nil
(Pre
viou
s ye
ar R
s. 1
2,42
7,95
0) o
n ac
coun
t of
pre
-ope
rativ
e ex
pens
es in
curr
ed o
n se
tting
up
of th
e cl
inic
s, w
hich
wer
e ca
pita
lised
in th
e ea
rlier
yea
rs.
c)
Dur
ing
the
year
end
ed M
arch
31,
200
7, th
e C
ompa
ny h
ad c
arrie
d ou
t fi n
anci
al re
stru
ctur
ing
sche
me
(‘Sch
eme’
) und
er th
e re
leva
nt p
rovi
sion
s of
the
Com
pani
es A
ct, 1
956.
The
Sch
eme
was
app
rove
d by
the
Sha
reho
lder
s on
Feb
ruar
y 7,
200
7 an
d su
bseq
uent
ly b
y H
on’b
le H
igh
Cou
rt vi
de it
s or
der d
ated
Apr
il 16
, 200
7. In
term
s of
the
Sch
eme,
the
carry
ing
amou
nt o
f cer
tain
item
s of
pla
nt a
nd e
quip
men
ts to
the
exte
nt o
f Rs.
70,
825,
406
and
furn
iture
and
fi xt
ures
to th
e ex
tent
of R
s. 1
15,6
90,0
88 a
nd re
late
d de
ferr
ed ta
x lia
bilit
y of
Rs.
1,8
11,0
39 a
nd lo
ss o
f Rs.
240
,000
,000
wer
e ad
just
ed a
gain
st th
e ba
lanc
e in
Sec
uriti
es P
rem
ium
Res
erve
.d)
Im
pairm
ent c
harg
e of
Rs.
4,5
66,1
61 (P
revi
ous
year
Rs.
77,
421,
259)
is re
fl ect
ed a
s “E
xcep
tiona
l ite
ms”
in th
e S
tate
men
t of P
rofi t
and
Los
s.e)
Im
pairm
ent c
harg
e fo
r the
pre
viou
s ye
ar w
as n
et o
f rev
ersa
l of i
mpa
irmen
t pro
visi
on o
f Rs.
23,
363,
575
upon
sal
e or
dis
card
ing
of a
sset
s.
NOTES TO FINANCIAL STATEMENTS

72
K A Y A L I M I T E D
NOTES TO FINANCIAL STATEMENTS
11. NON-CURRENT INVESTMENTS
Long-term
Non-trade investments (Valued at cost unless otherwise stated)
Investments in equity instruments
Investment in Subsidiary - Unquoted
Derma – Rx International Aesthetics Pte Limited ( wholly owned ) 22.98 22.98
7,000,000 (Previous year 7,000,000) equity shares of 1 SGD each, fully paid *
* These shares have been pledged as a security for loans taken by the said subsidiary
Total 22.98 22.98
Aggregate amount of unquoted investments ( At cost ) 22.98 22.98
12. LONG-TERM LOANS AND ADVANCES
(Unsecured and considered good, unless otherwise stated)
Capital advances 0.93 0.18
Security deposits 12.50 14.24
Balance with Government Authorities (Refer note 19) 0.22 0.03
Prepaid expenses 0.64 0.87
Income tax payments (net of provision for income tax Rs. Nil (Previous year Rs. Nil)* 3.10 0.24
Total 17.38 15.56
* Income tax payments includes Rs. 30,926,510 (Previous year Rs. Nil) towards disputed tax matters pending before appellate authorities. (Refer note 19)
13. OTHER NON-CURRENT ASSETS
(Unsecured and considered good, unless otherwise stated)
Term deposits with banks with maturity period more than 12 months @ 0.15 0.15
Interest accrued on long-term deposits with banks 0.06 0.05
Fringe benefi t tax (net) 0.07 0.08
Total 0.27 0.27
@ Term deposits with bank includes Rs. 71,613 (Previous year Rs. 50,000) deposited with sales tax authorities and Rs. 1,392,419 (Previous year Rs. 1,441,059) held as lien by bank against guarantees issued on behalf of the Company.
14. INVENTORIES
(Refer note 2(g) for basis of valuation)
Stores, spares and consumables 7.77 7.71
Raw materials 3.58 1.72
Packing materials 1.73 1.84
Work-in-progress # 0.39 0.09
Finished goods # [Includes goods in transit Rs. Nil (Previous year Rs. 1,069,664)] 1.83 1.82
Stock-in-trade # 0.32 0.77
Total 15.63 13.95
# Skin care products
As at March 31,
2012 2011 Rs. Crore Rs. Crore

73
K A Y A L I M I T E D
NOTES TO FINANCIAL STATEMENTS
15. TRADED RECEIVABLES
Unsecured, considered good :
Outstanding for a period exceeding 6 months from the date they are due for payment 0.01 –
Others 0.25 0.27
0.25 0.27
Unsecured, considered doubtful :
Outstanding for a period exceeding 6 months from the date they are due for payment 0.01 0.00
Others – 0.01
0.01 0.01
Less : Provision for doubtful debts 0.01 0.01
Total 0.25 0.27
16. CASH AND BANK BALANCE
Cash and cash equivalents:
Cash on hand 0.86 0.62
Bank balances:
In current accounts 0.43 0.36
Total 1.29 0.98
17. SHORT-TERM LOANS AND ADVANCES
(Unsecured and considered good, unless otherwise stated) Loans and advances to related parties (Refer Note 37) 1.08 2.75
Other loans and advances
Advances to suppliers 3.44 2.50
Balances with Government Authorities 0.78 0.93
Security deposits 2.90 0.91
Prepaid expenses 1.10 0.97
Loans and advances to employees 0.10 0.13
Total 9.40 8.20
18. OTHER CURRENT ASSETS
(Unsecured and considered good, unless otherwise stated)
Insurance claims receivable 0.13 0.19
Others:
Unsecured, considered good 0.83 0.52
Unsecured, considered doubtful 0.06 0.06
0.89 0.58
Less: Provision for doubtful advances 0.06 0.06
0.83 0.52
Total 0.96 0.71
As at March 31,
2012 2011 Rs. Crore Rs. Crore

74
K A Y A L I M I T E D
19. CONTINGENT LIABILITIES
Claims against the Company not acknowledge as debts
- Income tax matters (Refer note 12) 6.19 –
- Sales tax matters 0.37 0.37
- Services tax matters 0.37 0.37
- Lease termination cost – 0.11
- Claims by the customers 1.11 1.11
Total 8.04 1.97
(a) Guarantees issued by bank on behalf of the Company is Rs. 1,456,059 (Previous year Rs. 1,506,059)
(b) The Company has been sanctioned cash credit and letter of credit facilities of Rs. 8.00 Crore (Rs. 8.00 Crore) by banks. These facilities are guaranteed by the holding company. Amount outstanding towards these facilities on account of letter of credit is Rs.Nil (Previous year Rs. 0.09 Crore).
20. CAPITAL AND OTHER COMMITMENTS
(a) Capital Commitments
Estimated value of contracts in capital account remaining to be executed (net of capital advances) 0.31 0.58
(b) Other Commitments
Lease termination cost - representing lock-in-period rental under rental agreements 22.57 27.46
As at March 31,
2012 2011 Rs. Crore Rs. Crore
NOTES TO FINANCIAL STATEMENTS

75
K A Y A L I M I T E D
NOTES TO FINANCIAL STATEMENTS
Year ended March 31,
2012 2011 Rs. Crore Rs. Crore
21. REVENUE
Revenue from operations:
Sale of products 30.65 23.73
Sale of services 98.98 81.39
129.63 105.12
Other operating revenues 0.00 0.00
Total 129.63 105.12
22. OTHER INCOME
Interest income 0.01 1.56
Dividend income on long-term investments:
- From subsidiaries 11.96 -
Net gain on foreign currency transactions and translations 0.06 1.30
Profi t on sale / discarding of assets (net) 0.07 -
Liabilities written back to the extent no longer required - 0.03
Other non operating income 0.00 -
Total 12.11 2.89
23. COST OF MATERIALS CONSUMED (Refer note 32)
Raw materials consumed 4.63 2.58
Packing materials consumed 3.06 2.92
Total 7.70 5.49
24. CHANGES IN INVENTORY OF FINISHED GOODS, WORK IN PROGRESS AND STOCK-IN-TRADE
(Increase) / Decrease in stocks
Stock at the end of the year
- Work-in-process 0.39 0.09
- Finished goods 1.83 1.82
- Stock-in-trade 0.32 0.77
Total A 2.54 2.68
Less: Stock at the beginning of the year:
- Work-in-process 0.09 0.22
- Finished goods 1.82 1.28
- Stock-in-trade 0.77 0.45
Total B 2.68 1.95
(Increase) / decrease in stocks (B - A) 0.14 (0.73)

76
K A Y A L I M I T E D
25. EMPLOYEE BENEFITS EXPENSES
Salaries, wages and bonus 19.63 19.83
Contribution to provident and other funds 1.08 1.15
Gratuity 0.09 0.32
Staff welfare expenses 2.76 2.68
Seconded employees cost 6.92 7.20
Total 30.48 31.19
26. FINANCE COSTS
Interest expense 0.00 0.00
Bank charges and commission 2.02 1.71
Total 2.02 1.71
27. OTHER EXPENSES
“Consumption of consumables and stores and spare parts (Refer note 32)” 20.41 16.92
Contract manufacturing expenses 1.09 0.87
Payments to consultants 13.90 14.31
Power and fuel 3.27 3.08
Rent (Refer note 38) 22.11 20.86
Repairs and maintenance:
-Plant and machinery 0.27 0.59
-Building 5.47 5.49
-Others 1.50 1.73
7.24 7.80
Insurance 0.21 0.16
Rates and taxes 0.69 0.70
Travelling, conveyance and vehicle expenses 2.55 2.02
Auditors’ remuneration
- Statutory audit fees 0.14 0.09
- Tax audit fees 0.02 0.02
- Out of pocket expenses 0.01 0.01
0.17 0.11
Legal and professional charges 3.49 1.79
Printing, stationery and communication expenses 3.46 2.86
Advertisement and sales promotion 11.12 13.21
Freight forwarding and distribution expenses 0.23 0.18
Commission to selling agents 0.02 –
Provision for doubtful debts – 0.00
Year ended March 31,
2012 2011 Rs. Crore Rs. Crore
NOTES TO FINANCIAL STATEMENTS

77
K A Y A L I M I T E D
Irrecoverable balances written off 0.42 0.03
Loss on sale / discarding of assets (net) – 2.47
Provision for impairment of fi xed assets written back – (2.34)
– 0.13
Miscellaneous expenses @ 2.47 0.76
Total 92.83 85.79
@ Miscellaneous expenses includes Rs. 7,367,952 (Previous year Rs. Nil) on account of service tax charged by vendor which is not available for input credit.
28. EXCEPTIONAL ITEMS
Provision for impairment 0.46 7.74
Total 0.46 7.74
The Company has, as in the previous year, carried out impairment testing at the clinic level, which the management considers as the relevant cash generating unit. While the overall future potential of the business as a whole is promising, for some of the clinics likely future performance is not adequate to justify and cover the value in use. This resulted in an net impairment provision of Rs. 4,566,161 (Previous year Rs. 77,421,259). The Company has considered a pre tax discount rate of 19% (Previous year 17.68%) for determining value in use.
29. CIF VALUE OF IMPORTS
Raw materials 4.60 0.60
Packing materials 2.05 2.21
Consumables 3.33 3.02
Capital goods 3.69 4.24
Finished goods 1.27 1.41
Total 14.94 11.47
30. EXPENDITURE IN FOREIGN CURRENCY
Travelling 0.10 0.09
Professional fees – 1.18
Total 0.10 1.27
31. EARNINGS IN FOREIGN CURRENCY
Revenue from exports on FOB Basis 0.76 0.85
Services rendered 0.11 0.54
Dividend from subsidiary 11.96 –
Interest income – 1.55
Others 0.17 0.37
Total 13.01 3.31
Year ended March 31,
2012 2011 Rs. Crore Rs. Crore
NOTES TO FINANCIAL STATEMENTS
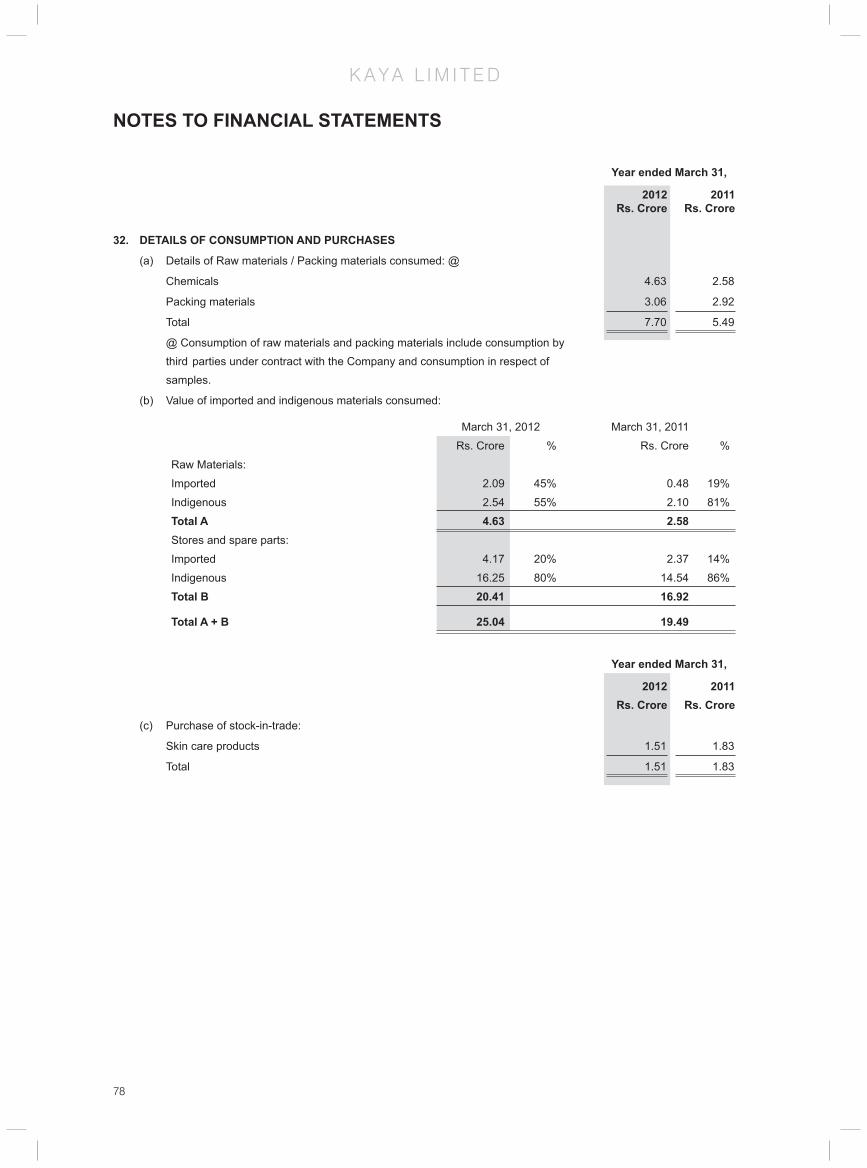
78
K A Y A L I M I T E D
32. DETAILS OF CONSUMPTION AND PURCHASES
(a) Details of Raw materials / Packing materials consumed: @
Chemicals 4.63 2.58
Packing materials 3.06 2.92
Total 7.70 5.49
@ Consumption of raw materials and packing materials include consumption by third parties under contract with the Company and consumption in respect of samples.
(b) Value of imported and indigenous materials consumed:
March 31, 2012 March 31, 2011
Rs. Crore % Rs. Crore %
Raw Materials:
Imported 2.09 45% 0.48 19%
Indigenous 2.54 55% 2.10 81%
Total A 4.63 2.58 Stores and spare parts:
Imported 4.17 20% 2.37 14%
Indigenous 16.25 80% 14.54 86%
Total B 20.41 16.92
Total A + B 25.04 19.49
Year ended March 31,
2012 2011 Rs. Crore Rs. Crore
(c) Purchase of stock-in-trade:
Skin care products 1.51 1.83
Total 1.51 1.83
NOTES TO FINANCIAL STATEMENTS
Year ended March 31,
2012 2011 Rs. Crore Rs. Crore

79
K A Y A L I M I T E D
NOTES TO FINANCIAL STATEMENTS
33. DISCONTINUING OPERATIONS
During the year ended March 31, 2010, the Company had discontinued operations of Kaya life clinics and had made provision for resultant cost / obligations. The discontinued operations were substantially completed in previous year ended March 31, 2011 and residual cost of Rs. 0.40 Crore was charged to the Statement of Profi t and Loss.
34. GOING CONCERN:
The Company had been incurring losses since inception and is currently having negative net worth. The management believes that these losses are not refl ective of future trends and operations of the Company. The management believes that the Kaya business model continues to be robust and offers signifi cant long term growth opportunities. Further, the operations of Kaya are expected to improve signifi cantly due to positive changes in the economic environment, maturity of new clinics, renewed focus on reducing the time to scale up revenues in new clinics, improve capacity utilizations of clinics, expansion of Kaya’s range of services and product offerings, rationalization of costs and other restructuring measures under consideration, including leveraging the synergies from the acquisition of Derma Rx business in Singapore (by its wholly owned subsidiary) and by increasing the share of product sales in the total business. Having regard to the above factors, based on the fundamentals of Kaya, improved performance in the current year, its future business plans and continuing support from the holding company for meeting its funding requirements, these fi nancial statements of the Company have been prepared by the management on going concern basis.
35. DISCLOSURE PURSUANT TO ACCOUNTING STANDARD 15 (REVISED) – EMPLOYEE BENEFITS
The disclosures as required as per the revised AS 15 are as under:
a) Brief descriptions of the plans:
The Company has various schemes for long-term benefi ts such as provident fund, leave encashment and gratuity. The Company’s defi ned contribution plans is provident fund since the Company has no further obligation beyond making the contributions. The Company’s defi ned benefi t plans include gratuity. The employees of the Company are also entitled to leave encashment as per the Company’s policy. The defi ned benefi t plans are not funded.
b) Defi ned contribution plan (Provident fund):
The Company has recognised following amount as expenses and included in Employees’ remuneration (Refer note 25)
For the year ended March 31, 2012
(Rs. Cr.)
For the year ended March 31, 2011
(Rs. Cr.)
Contribution to provident fund 0.80 0.83
Contribution to employee state insurance contribution 0.28 0.32
1.08 1.15
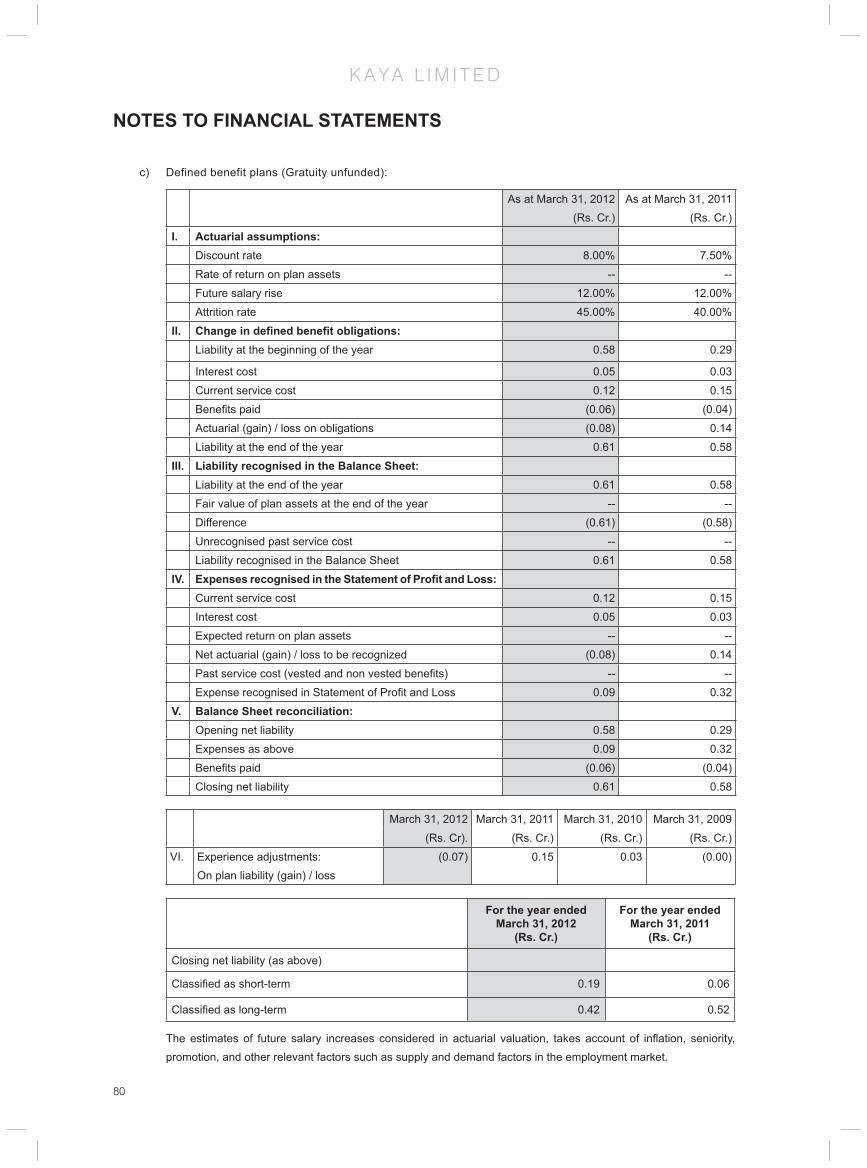
80
K A Y A L I M I T E D
c) Defined benefit plans (Gratuity unfunded):
As at March 31, 2012(Rs. Cr.)
As at March 31, 2011(Rs. Cr.)
I. Actuarial assumptions: Discount rate 8.00% 7.50%
Rate of return on plan assets -- --
Future salary rise 12.00% 12.00%
Attrition rate 45.00% 40.00%
II. Change in defi ned benefi t obligations:Liability at the beginning of the year 0.58 0.29
Interest cost 0.05 0.03
Current service cost 0.12 0.15
Benefi ts paid (0.06) (0.04)
Actuarial (gain) / loss on obligations (0.08) 0.14
Liability at the end of the year 0.61 0.58
III. Liability recognised in the Balance Sheet:Liability at the end of the year 0.61 0.58
Fair value of plan assets at the end of the year -- --
Difference (0.61) (0.58)
Unrecognised past service cost -- --
Liability recognised in the Balance Sheet 0.61 0.58
IV. Expenses recognised in the Statement of Profi t and Loss:Current service cost 0.12 0.15
Interest cost 0.05 0.03
Expected return on plan assets -- --
Net actuarial (gain) / loss to be recognized (0.08) 0.14
Past service cost (vested and non vested benefi ts) -- --
Expense recognised in Statement of Profi t and Loss 0.09 0.32
V. Balance Sheet reconciliation:Opening net liability 0.58 0.29
Expenses as above 0.09 0.32
Benefi ts paid (0.06) (0.04)
Closing net liability 0.61 0.58
March 31, 2012 March 31, 2011 March 31, 2010 March 31, 2009
(Rs. Cr). (Rs. Cr.) (Rs. Cr.) (Rs. Cr.)
VI. Experience adjustments:On plan liability (gain) / loss
(0.07) 0.15 0.03 (0.00)
For the year ended March 31, 2012
(Rs. Cr.)
For the year ended March 31, 2011
(Rs. Cr.)
Closing net liability (as above)
Classifi ed as short-term 0.19 0.06
Classifi ed as long-term 0.42 0.52
The estimates of future salary increases considered in actuarial valuation, takes account of infl ation, seniority, promotion, and other relevant factors such as supply and demand factors in the employment market.
NOTES TO FINANCIAL STATEMENTS
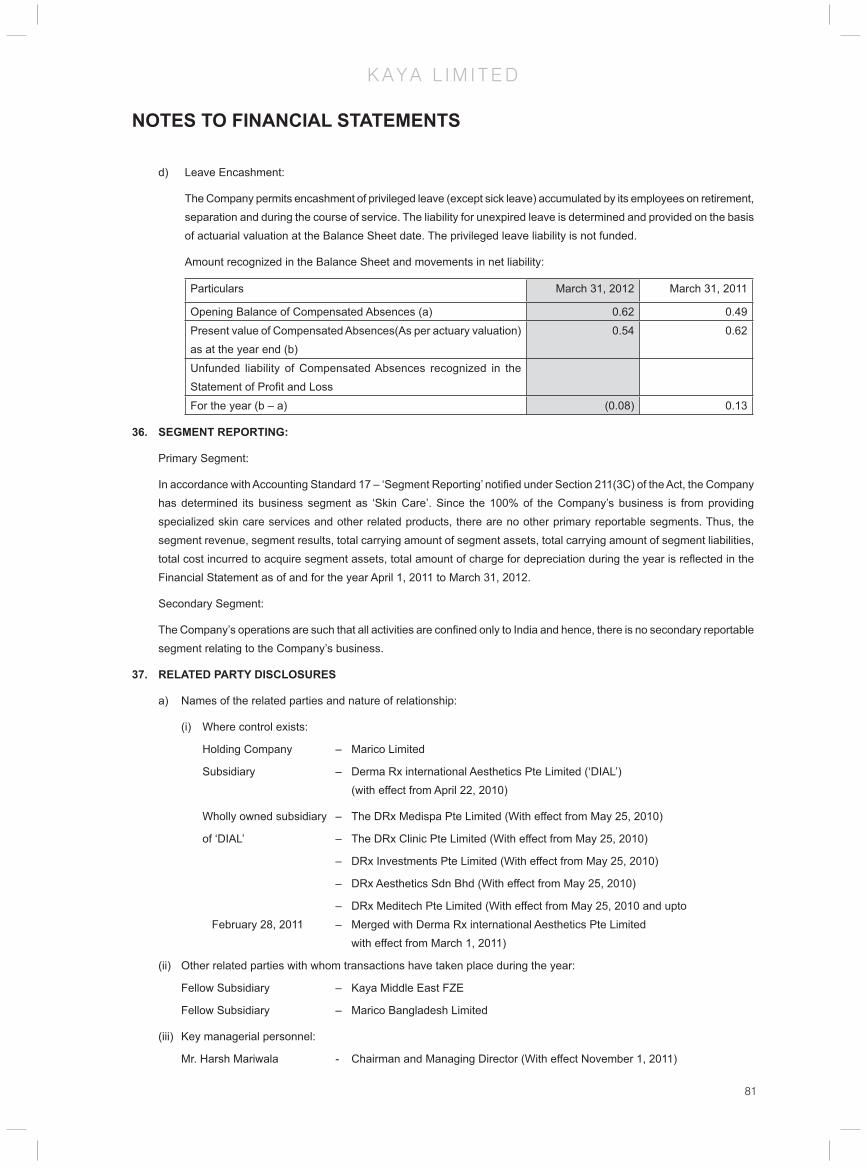
81
K A Y A L I M I T E D
NOTES TO FINANCIAL STATEMENTS
d) Leave Encashment:
The Company permits encashment of privileged leave (except sick leave) accumulated by its employees on retirement, separation and during the course of service. The liability for unexpired leave is determined and provided on the basis of actuarial valuation at the Balance Sheet date. The privileged leave liability is not funded.
Amount recognized in the Balance Sheet and movements in net liability:
Particulars March 31, 2012 March 31, 2011
Opening Balance of Compensated Absences (a) 0.62 0.49
Present value of Compensated Absences(As per actuary valuation) as at the year end (b)
0.54 0.62
Unfunded liability of Compensated Absences recognized in the Statement of Profi t and Loss
For the year (b – a) (0.08) 0.13
36. SEGMENT REPORTING:
Primary Segment:
In accordance with Accounting Standard 17 – ‘Segment Reporting’ notifi ed under Section 211(3C) of the Act, the Company has determined its business segment as ‘Skin Care’. Since the 100% of the Company’s business is from providing specialized skin care services and other related products, there are no other primary reportable segments. Thus, the segment revenue, segment results, total carrying amount of segment assets, total carrying amount of segment liabilities, total cost incurred to acquire segment assets, total amount of charge for depreciation during the year is refl ected in the Financial Statement as of and for the year April 1, 2011 to March 31, 2012.
Secondary Segment:
The Company’s operations are such that all activities are confi ned only to India and hence, there is no secondary reportable segment relating to the Company’s business.
37. RELATED PARTY DISCLOSURES
a) Names of the related parties and nature of relationship:
(i) Where control exists:
Holding Company – Marico Limited
Subsidiary – Derma Rx international Aesthetics Pte Limited (‘DIAL’) (with effect from April 22, 2010)
Wholly owned subsidiary – The DRx Medispa Pte Limited (With effect from May 25, 2010)
of ‘DIAL’ – The DRx Clinic Pte Limited (With effect from May 25, 2010)
– DRx Investments Pte Limited (With effect from May 25, 2010)
– DRx Aesthetics Sdn Bhd (With effect from May 25, 2010)
– DRx Meditech Pte Limited (With effect from May 25, 2010 and upto February 28, 2011 – Merged with Derma Rx international Aesthetics Pte Limited with effect from March 1, 2011)
(ii) Other related parties with whom transactions have taken place during the year:
Fellow Subsidiary – Kaya Middle East FZE
Fellow Subsidiary – Marico Bangladesh Limited
(iii) Key managerial personnel:
Mr. Harsh Mariwala - Chairman and Managing Director (With effect November 1, 2011)
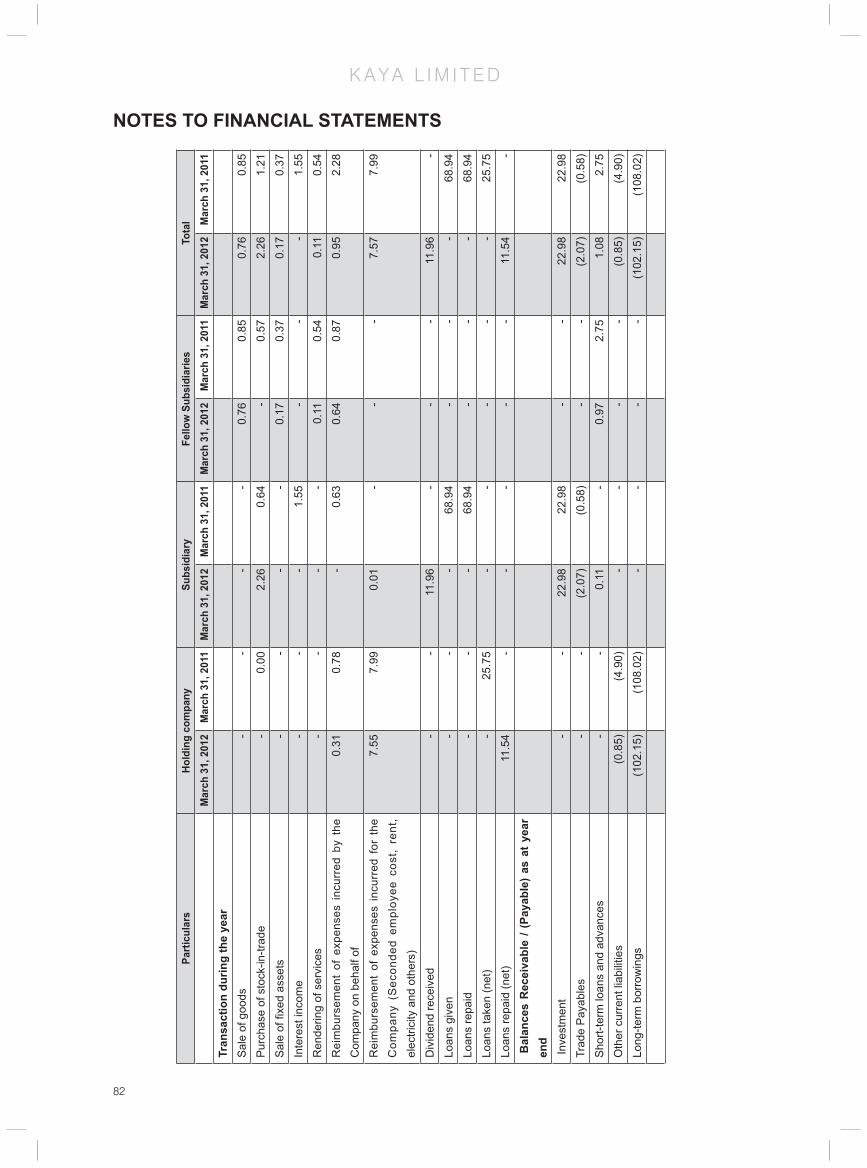
82
K A Y A L I M I T E D
Parti
cula
rsHo
ldin
g co
mpa
nySu
bsid
iary
Fello
w S
ubsi
diar
ies
Tota
lM
arch
31,
201
2M
arch
31,
201
1M
arch
31,
201
2M
arch
31,
201
1M
arch
31,
201
2M
arch
31,
201
1M
arch
31,
201
2M
arch
31,
201
1
Tran
sact
ion
durin
g th
e ye
arS
ale
of g
oods
--
--
0.76
0.85
0.76
0.85
Pur
chas
e of
sto
ck-in
-trad
e-
0.00
2.26
0.64
-0.
572.
261.
21
Sal
e of
fi xe
d as
sets
--
--
0.17
0.37
0.17
0.37
Inte
rest
inco
me
--
-1.
55-
--
1.55
Ren
derin
g of
ser
vice
s-
--
-0.
110.
540.
110.
54
Rei
mbu
rsem
ent
of e
xpen
ses
incu
rred
by
the
Com
pany
on
beha
lf of
0.31
0.78
-0.
630.
640.
870.
952.
28
Rei
mbu
rsem
ent
of e
xpen
ses
incu
rred
for
the
C
ompa
ny (
Sec
onde
d em
ploy
ee c
ost,
rent
, el
ectri
city
and
oth
ers)
7.55
7.99
0.01
--
-7.
577.
99
Div
iden
d re
ceiv
ed-
-11
.96
--
-11
.96
-
Loan
s gi
ven
--
-68
.94
--
-68
.94
Loan
s re
paid
--
-68
.94
--
-68
.94
Loan
s ta
ken
(net
)-
25.7
5-
--
--
25.7
5
Loan
s re
paid
(net
)11
.54
--
--
-11
.54
-
Bal
ance
s R
ecei
vabl
e / (
Paya
ble)
as
at y
ear
end
Inve
stm
ent
--
22.9
822
.98
--
22.9
822
.98
Trad
e P
ayab
les
--
(2.0
7)(0
.58)
--
(2.0
7)(0
.58)
Sho
rt-te
rm lo
ans
and
adva
nces
--
0.11
-0.
972.
751.
082.
75
Oth
er c
urre
nt li
abili
ties
(0.8
5)(4
.90)
--
--
(0.8
5)(4
.90)
Long
-term
bor
row
ings
(102
.15)
(108
.02)
--
--
(102
.15)
(108
.02)
NOTES TO FINANCIAL STATEMENTS

83
K A Y A L I M I T E D
Disclosure in respect of transactions which are more than 10% of the total transactions of the same type with related parties
Sr No.
Particular Transactions(Rs. Cr.)
Balances Receivable / (Payable) (Rs. Cr.)
March 31, 2012 March 31, 2011 March 31, 2012 March 31, 2011
i Sale of goodsFellow Subsidiary : Kaya Middle East FZE, Dubai
0.38 0.39 – –
Fellow Subsidiary : Marico Bangladesh limited, MBL
0.39 0.46 – –
ii Purchase of stock–in–tradeSubsidiary : Derma Rx International Aesthetics Pte Ltd
2.26 0.64 (2.07) (0.58)
Fellow Subsidiary : DRx Meditech Pte Ltd. – 0.57 – –
iii Sale of fi xed assetsFellow Subsidiary : Kaya Middle East FZE, Dubai
0.14 0.37 – –
iv Rendering of servicesFellow Subsidiary : Kaya Middle East FZE, Dubai
0.11 0.54 – –
V Interest incomeSubsidiary : Derma Rx International Aesthetics Pte Ltd
– 1.55 – –
vi Reimbursement of expenses incurred by the company on behalf ofHolding company : Marico Ltd 0.31 0.78 – –
Subsidiary : Derma Rx International Aesthetics Pte Ltd
– 0.63 0.11 –
Fellow Subsidiary : Kaya Middle East FZE, Dubai
0.64 0.87 0.97 2.75
vii Reimbursement of expenses incurred for the Company (Seconded employee cost, rent, electricity and others)Holding company : Marico Ltd 7.55 7.99 (0.85) (4.90)
viii Loans givenSubsidiary : Derma Rx International Aesthetics Pte Ltd
– 68.94 – –
ix Loans repaidSubsidiary : Derma Rx International Aesthetics Pte Ltd
– 68.94 – –
x Loans takenHolding company : Marico Ltd – 25.75 – –
xi Loans repaidHolding company : Marico Ltd 11.54 – (102.15) (108.01)
xii Dividend receivedSubsidiary : Derma Rx International Aesthetics Pte Ltd
11.96 – – –
NOTES TO FINANCIAL STATEMENTS

84
K A Y A L I M I T E D
38. OPERATING LEASES:
The Company has entered into several operating lease arrangements for its Offi ce premises and Skin clinics for a period ranging from 3 to 9 years and, is renewable on a periodic basis at the option of the lessor and lessee. Under these arrangements, generally refundable interest free deposits have been given.
Disclosure in respect of assets taken on non cancellable operating lease:
For the year ended March 31, 2012
(Rs. Cr.)
For the year ended March 31, 2011
(Rs. Cr.)
Lease payments recognized in the statement of Profi t and Loss during the year *
22.11 20.86
Future minimum lease rentals payments payable:
- not later than one year 20.79 16.18
- later than one year but not later than fi ve years 39.02 42.45
- later than fi ve years 2.05 1.70
61.86 60.33
39. EARNINGS PER SHARE:
For the year ended March 31, 2012
(Rs. Cr.)
For the year ended March 31, 2011
(Rs. Cr.)
Profi t / (Loss) after tax (Rs. Crore) (2,94) (41.26)
Equity shares outstanding as at the year end 145,000,000 145,000,000
Weighted average number of equity shares used as denominator for calculating basic and diluted earnings per share
145,000,000 145,000,000
Nominal value per equity share (Rs.) 10 10
Basic and diluted earnings per equity share (Rs.) (2.03) (28.46)
40. PROVISION FOR TAX EXPENSES:
a) Provision for income tax is not made in view of assessable loss for the year.
b) There are no deferred tax liabilities as at the year end. Deferred tax assets has not been recognised on c a r r i e d forward depreciation, business loss and other item of deferred tax assets, as there is no virtual certainty of its realization on account of the losses incurred by the Company.
41. DERIVATIVE TRANSACTIONS:
NOTES TO FINANCIAL STATEMENTS

85
K A Y A L I M I T E D
NOTES TO FINANCIAL STATEMENTS
The Company has not entered into any derivative transactions during the year and there were no derivative transactions outstanding as on March 31, 2012. Net foreign currency exposure not hedged as at the year end were as under:-
Currency As at March 31, 2012
As at March 31, 2011
As at March 31,2012
As at March 31, 2011
Trade payables
EURO 6,270 -- 425,633 --
SGD 510,865 185,154 20,663,972 6,548,533
AED -- 96 -- 1,164
USD 111,653 27,185 5,680,444 1,226,755
Short-term advances USD 253,072 545,964 12,875,311 24,471,014
AUD 2,400 -- 118,018 --
EURO 249 -- 16,921 --
Trade receivables USD -- -- -- --
42. Research and Development expenses aggregating Rs. 0.39 Crore (Previous year Rs. 0.28 Crore) have been included under the relevant heads in the Statement of Profi t and Loss.
43. The fi nancial statements for the year ended March 31, 2011 had been prepared as per the then applicable, pre-revised Schedule VI to the Companies Act, 1956. Consequent to the notifi cation of Revised Schedule VI under the Companies Act, 1956, the fi nancial statements for the year ended March 31, 2012 are prepared as per Revised Schedule VI. Accordingly, the previous year fi gures have also been reclassifi ed to conform to this year’s classifi cation. The adoption of Revised Schedule VI for previous year fi gures does not impact recognition and measurement principles followed for preparation of fi nancial statements.
Signature to Note 1 to 43
As per our attached report of even date
For Price Waterhouse For and on behalf of the Board of DirectorsChartered Accountants Firm Registration Number: 301112E HARSH MARIWALA Chairman RAJEN MARIWALA DirectorUday ShahPartner Deepali Heroor Company SecretaryMembership No. : F-46061 Place : Mumbai Date : May 3, 2012

86
DERMA-RX INTERNATIONAL AESTHETICS PTE. LTD
86
Board of Directors Ajay Kumar Pahwa
Naveen Duggal
Registered Offi ce 213 Henderson Road, # 01-08 Henderson Industrial Park, Singapore - 159553
Auditors PricewaterhouseCoopers
Bankers Citi Bank UOB Bank

87
DERMA-RX INTERNATIONAL AESTHETICS PTE. LTD
87
The directors present their report to the members together with the audited fi nancial statements for the fi nancial year ended 31 March 2012.
1) Directors
The directors in offi ce at the date of this report are as follows:
Ajay Kumar Pahwa
Naveen Duggal
2) Arrangements to enable directors to acquire shares and debentures
Neither at the end of nor at any time during the fi nancial year was the Company a party to any arrangement whose object was to enable the directors of the Company to acquire benefi ts by means of the acquisition of shares in, or debentures of, the Company or any other body corporate.
3) Directors’ interests in shares or debentures
According to the register of directors’ shareholdings, none of the directors holding offi ce at the end of the fi nancial year had any interest in the shares or debentures of the Company or its related corporations.
4) Directors’ contractual benefi ts
Since the end of the previous fi nancial year, no director has received or become entitled to receive a benefi t by reason of a contract made by the Company or a related corporation with the director or with a fi rm of which he is a member or with a company in which he has a substantial fi nancial interest, except as disclosed in the accompanying fi nancial statements and in this report, and except that certain directors receive remuneration as a result of their employment with related corporations.
5) Share options
No options were granted during the fi nancial year to subscribe for unissued shares of the Company.
No shares were issued during the fi nancial year by virtue of the exercise of options to take up unissued shares of the Company.
There were no unissued shares of the Company under option at the end of the fi nancial year.
6) Independent auditor
The independent auditor, PricewaterhouseCoopers LLP, has expressed its willingness to accept re-appointment.
On behalf of the directors
Ajay Kumar Pahwa Naveen DuggalDirector Director
3 July 2012
DIRECTORS’ REPORT
88
DERMA-RX INTERNATIONAL AESTHETICS PTE. LTD
88
In the opinion of the directors,
(a) the fi nancial statements are drawn up so as to give a true and fair view of the state of affairs of the Company as at 31 March 2012 and of the results of the business, changes in equity and cash fl ows of the Company for the fi nancial year then ended; and
(b) at the date of this statement, there are reasonable grounds to believe that, with the continuing fi nancial support from its immediate holding corporation, the Company will be able to pay its debts as and when they fall due.
On behalf of the directors
Ajay Kumar Pahwa Naveen DuggalDirector Director
3 July 2012
STATEMENT BY DIRECTORS’

89
DERMA-RX INTERNATIONAL AESTHETICS PTE. LTD
89
INDEPENDENT AUDITOR’S REPORTReport on the Financial Statements
We have audited the accompanying fi nancial statements of Derma-Rx International Aesthetics Pte Ltd set out on pages 5 to 33, which comprise the balance sheet as at 31 March 2012, the statement of comprehensive income, the statement of changes in equity and the statement of cash fl ows for the year then ended, and a summary of signifi cant accounting policies and other explanatory information.
Management’s Responsibility for the Financial Statements
Management is responsible for the preparation of fi nancial statements that give a true and fair view in accordance with the provisions of the Singapore Companies Act (the “Act”) and Singapore Financial Reporting Standards, and for devising and maintaining a system of internal accounting controls suffi cient to provide a reasonable assurance that assets are safeguarded against loss from unauthorised use or disposition; and transactions are properly authorised and that they are recorded as necessary to permit the preparation of true and fair profi t and loss accounts and balance sheets and to maintain accountability of assets.
Auditor’s Responsibility
Our responsibility is to express an opinion on these fi nancial statements based on our audit. We conducted our audit in accordance with Singapore Standards on Auditing. Those standards require that we comply with ethical requirements and plan and perform the audit to obtain reasonable assurance about whether the fi nancial statements are free from material misstatement.
An audit involves performing procedures to obtain audit evidence about the amounts and disclosures in the fi nancial statements. The procedures selected depend on the auditor’s judgement, including the assessment of the risks of material misstatement of the fi nancial statements, whether due to fraud or error. In making those risk assessments, the auditor considers internal control relevant to the entity’s preparation of fi nancial statements that give a true and fair view in order to design audit procedures that are appropriate in the circumstances, but not for the purpose of expressing an opinion on the effectiveness of the entity’s internal control. An audit also includes evaluating the appropriateness of accounting policies used and the reasonableness of accounting estimates made by management, as well as evaluating the overall presentation of the fi nancial statements.
We believe that the audit evidence we have obtained is suffi cient and appropriate to provide a basis for our audit opinion.
Opinion
In our opinion, the fi nancial statements of the Company are properly drawn up in accordance with the provisions of the Act and Singapore Financial Reporting Standards so as to give a true and fair view of the state of affairs of the Company as at 31 March 2012, and the results, changes in equity and cash fl ows of the Company for the fi nancial year ended on that date.
Report on Other Legal and Regulatory Requirements
In our opinion, the accounting and other records required by the Act to be kept by the Company have been properly kept in accordance with the provisions of the Act.
Price water house Coopers LLP Public Accountants and Certifi ed Public Accountants
Singapore, 3 July 2012

90
DERMA-RX INTERNATIONAL AESTHETICS PTE. LTD
90
STATEMENT OF COMPREHENSIVE INCOMEfor the period from 22 April 2011 to 31 March 2012
31 March 31 MarchNote 2012 2011 2012 2011
$ $ Rs.Crore Rs.Crore
Revenue 4 5,446,000 1,697,000 22.24 6.00
Cost of sales 7 (1,520,000) (192,000) (6.21) (0.68)
Gross profi t 3,926,000 1,505,000 16.03 5.32
Other income 5 3,197,000 18,000 13.05 0.06
Other (losses)/gains - net 6 (1,000) 69,000 – 0.24
Expenses
Distribution and marketing 7 (112,000) (2,000) (0.46) (0.01)
Administrative 7 (1,971,000) (884,000) (8.05) (3.13)
Finance 9 (599,000) (665,000) (2.45) (2.35)
Profi t before income tax 4,440,000 41,000 18.13 0.14
Income tax expense 10 (1,016,000) (1,000) (4.15) –
Profi t after tax representing total comprehensive income 3,424,000 40,000 13.98 0.14
Note: The exchange rate used to convert SGD to Rs. <40.829> / <SGD> (Rs. <35.357> / <SGD>)
“The columns in INR are not part of the audited fi nancial statements and the audit opinion does not apply to them.”

91
DERMA-RX INTERNATIONAL AESTHETICS PTE. LTD
91
BALANCE SHEET AS AT 31 MARCH 2012
Note: The exchange rate used to convert SGD to Rs. <40.829> / <SGD> (Rs. <35.357> / <SGD>)
“The columns in INR are not part of the audited fi nancial statements and the audit opinion does not apply to them.”
Note 2012 2011 2012 2011
$ $ Rs.Crore Rs.Crore
ASSETS
Current assets
Cash and cash equivalents 11 278,000 1,420,000 1.14 5.02
Trade and other receivables 12 1,075,000 447,000 4.39 1.58
Inventories 13 447,000 457,000 1.83 1.62
1,800,000 2,324,000 7.35 8.22
Non-current assets
Intangible assets 15 14,930,000 14,930,000 60.96 52.79
Goodwill 16 10,067,000 10,067,000 41.10 35.59
Investment in subsidiaries 14 14,861,000 14,861,000 60.68 52.54
Plant and equipment 17 17,000 8,000 0.07 0.03
39,875,000 39,866,000 162.81 140.95
Total assets 41,675,000 42,190,000 170.15 149.17
LIABILITIES
Current liabilities
Trade and other payables 18 3,225,000 2,752,000 13.17 9.73
Borrowings 19 6,305,000 719,000 25.74 2.54
Current income tax liabilities 10 14,000 178,000 0.06 0.63
9,544,000 3,649,000 38.97 12.90
Non-current liabilities
Other payables 18 7,500,000 10,500,000 30.62 37.12
Borrowings 19 16,150,000 21,000,000 65.94 74.25
Deferred income tax liabilities 20 1,017,000 1,000 4.15 –
24,667,000 31,501,000 100.71 111.38
Total liabilities 34,211,000 35,150,000 139.68 124.28
NET ASSETS 7,464,000 7,040,000 30.47 24.89
EQUITY
Share capital 21 7,000,000 7,000,000 28.58 24.75
Retained profi ts 464,000 40,000 1.89 0.14
Total equity 7,464,000 7,040,000 30.47 24.89

92
DERMA-RX INTERNATIONAL AESTHETICS PTE. LTD
92
STATEMENT OF CHANGES IN EQUITYfor the period from 22 April 2011 to 31 March 2012
Note: The exchange rate used to convert SGD to Rs. <40.829> / <SGD> (Rs. <35.357> / <SGD>)
“The columns in INR are not part of the audited fi nancial statements and the audit opinion does not apply to them.”
Note Share capital
Retained profi ts
Total equity
Share capital
Retained profi ts
Total equity
$ $ $ Rs.crore Rs.crore Rs.crore
2012
Beginning of fi nancial year 7,000,000 40,000 7,040,000 24.75 0.14 24.89
Total comprehensive income – 3,424,000 3,424,000 – 13.98 13.98
Dividends paid 22 – (3,000,000) (3,000,000) – (12.25) (12.25)
End of fi nancial year 7,000,000 464,000 7,464,000 28.6 2 30
2011
Balance as at 22 April 2010
(date of incorporation) – – – – – –
Increase in share capital 21 7,000,000 – 7,000,000 24.75 – 24.75
Total comprehensive income – 40,000 40,000 – 0.14 0.14
End of fi nancial year 7,000,000 40,000 7,040,000 24.75 0.14 24.89
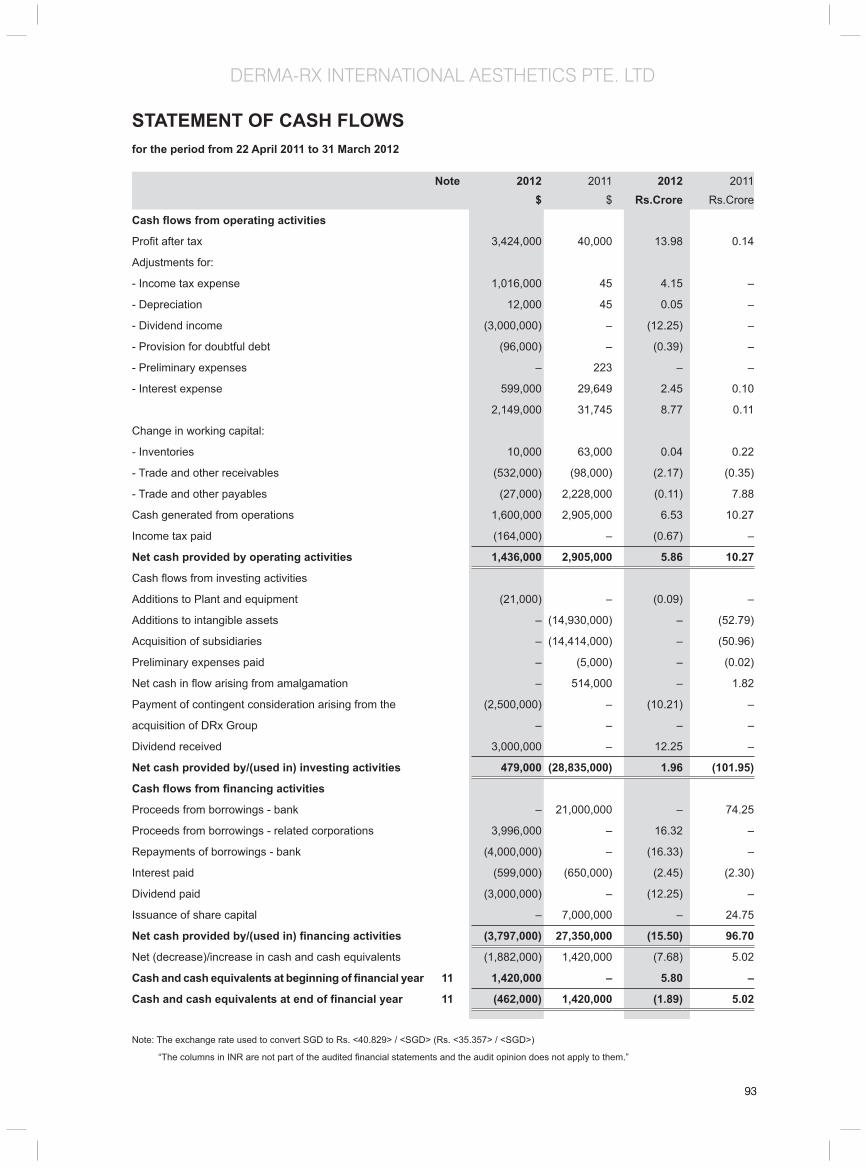
93
DERMA-RX INTERNATIONAL AESTHETICS PTE. LTD
93
STATEMENT OF CASH FLOWSfor the period from 22 April 2011 to 31 March 2012
Note: The exchange rate used to convert SGD to Rs. <40.829> / <SGD> (Rs. <35.357> / <SGD>)
“The columns in INR are not part of the audited fi nancial statements and the audit opinion does not apply to them.”
Note 2012 2011 2012 2011
$ $ Rs.Crore Rs.Crore
Cash fl ows from operating activities
Profi t after tax 3,424,000 40,000 13.98 0.14
Adjustments for:
- Income tax expense 1,016,000 45 4.15 –
- Depreciation 12,000 45 0.05 –
- Dividend income (3,000,000) – (12.25) –
- Provision for doubtful debt (96,000) – (0.39) –
- Preliminary expenses – 223 – –
- Interest expense 599,000 29,649 2.45 0.10
2,149,000 31,745 8.77 0.11
Change in working capital:
- Inventories 10,000 63,000 0.04 0.22
- Trade and other receivables (532,000) (98,000) (2.17) (0.35)
- Trade and other payables (27,000) 2,228,000 (0.11) 7.88
Cash generated from operations 1,600,000 2,905,000 6.53 10.27
Income tax paid (164,000) – (0.67) –
Net cash provided by operating activities 1,436,000 2,905,000 5.86 10.27
Cash fl ows from investing activities
Additions to Plant and equipment (21,000) – (0.09) –
Additions to intangible assets – (14,930,000) – (52.79)
Acquisition of subsidiaries – (14,414,000) – (50.96)
Preliminary expenses paid – (5,000) – (0.02)
Net cash in fl ow arising from amalgamation – 514,000 – 1.82
Payment of contingent consideration arising from the (2,500,000) – (10.21) –
acquisition of DRx Group – – – –
Dividend received 3,000,000 – 12.25 –
Net cash provided by/(used in) investing activities 479,000 (28,835,000) 1.96 (101.95)
Cash fl ows from fi nancing activities
Proceeds from borrowings - bank – 21,000,000 – 74.25
Proceeds from borrowings - related corporations 3,996,000 – 16.32 –
Repayments of borrowings - bank (4,000,000) – (16.33) –
Interest paid (599,000) (650,000) (2.45) (2.30)
Dividend paid (3,000,000) – (12.25) –
Issuance of share capital – 7,000,000 – 24.75
Net cash provided by/(used in) fi nancing activities (3,797,000) 27,350,000 (15.50) 96.70
Net (decrease)/increase in cash and cash equivalents (1,882,000) 1,420,000 (7.68) 5.02
Cash and cash equivalents at beginning of fi nancial year 11 1,420,000 – 5.80 –
Cash and cash equivalents at end of fi nancial year 11 (462,000) 1,420,000 (1.89) 5.02

94
DERMA-RX INTERNATIONAL AESTHETICS PTE. LTD
94
These notes form an integral part of and should be read in conjunction with the accompanying fi nancial statements.
1. General information
The Company is incorporated and domiciled in Singapore. The address of its registered offi ce is 213 Henderson Road, #01-08 Henderson Industrial Park, Singapore 159553.
The principal activities of the Company are those of consultancy in skincare, trading in cosmetics and investment holding.
As at 31 March 2012, the Company is in net current liability position. The fi nancial statements have been prepared on a going concern basis due to the fi nancial support from its immediate holding corporation.
2. Signifi cant accounting policies
2.1 Basis of preparation
The fi nancial statements have been prepared in accordance with Singapore Financial Reporting Standards (“FRS”). The fi nancial statements have been prepared under the historical cost convention, except as disclosed in the accounting policies below.
These fi nancial statements are separate fi nancial statements under FRS 27 Consolidated and Separate Financial Statements. As provided under FRS 27 the Company has elected not to prepare consolidated fi nancial statements as it is wholly-owned subsidiary of Marico Limited, which produces consolidated fi nancial statements for public use. The registered offi ce of Marico Limited is located at Rang Sharda Krishmachandra Marg, Bandra Reclamation, Branda (West), Mumbai 400050 India.
The preparation of these fi nancial statements in conformity with FRS requires management to exercise its judgement in the process of applying the Company’s accounting policies. It also requires the use of certain critical accounting estimates and assumptions. The areas involving a higher degree of judgement or complexity, or areas where estimates and assumptions are signifi cant to the fi nancial statements are disclosed in Note 3.
The Company was incorporated on 22 April 2010. Accordingly in these fi nancial statements, prior period comparatives are presented for the fi nancial period from 22 April 2010 to 31 March 2011 and consequently the comparative amounts in the fi nancial statements are not entirely comparable.
Interpretations and amendments to published standards effective in 2012
On 1 April 2011, the Company adopted the new or amended FRS and Interpretations to FRS (“INT FRS”) that are mandatory for application from that date. Changes to the Company’s accounting policies have been made as required, in accordance with the transitional provisions in the respective FRS and INT FRS.
The adoption of these new or amended FRS and INT FRS did not result in substantial changes to the Company’s accounting policies and had no material effect on the amounts reported for the current or prior fi nancial years.
2.2 Revenue recognition
(a) Sale of goods
Sale of goods comprises the fair value of the consideration received or receivable for the sale of goods in the ordinary course of the Company’s activities.
Sales are recognised when the Company has delivered the products to the customers, the customers have accepted the products and the collectability of the related receivables is reasonably assured. Sales are presented, net of goods and services tax, rebates and discounts.
(b) Royalties income
Royalties are recognised on an accrual basis in accordance with the substance of the relevant agreement.
NOTES TO THE FINANCIAL STATEMENTSFor the period ended 31 March 2012
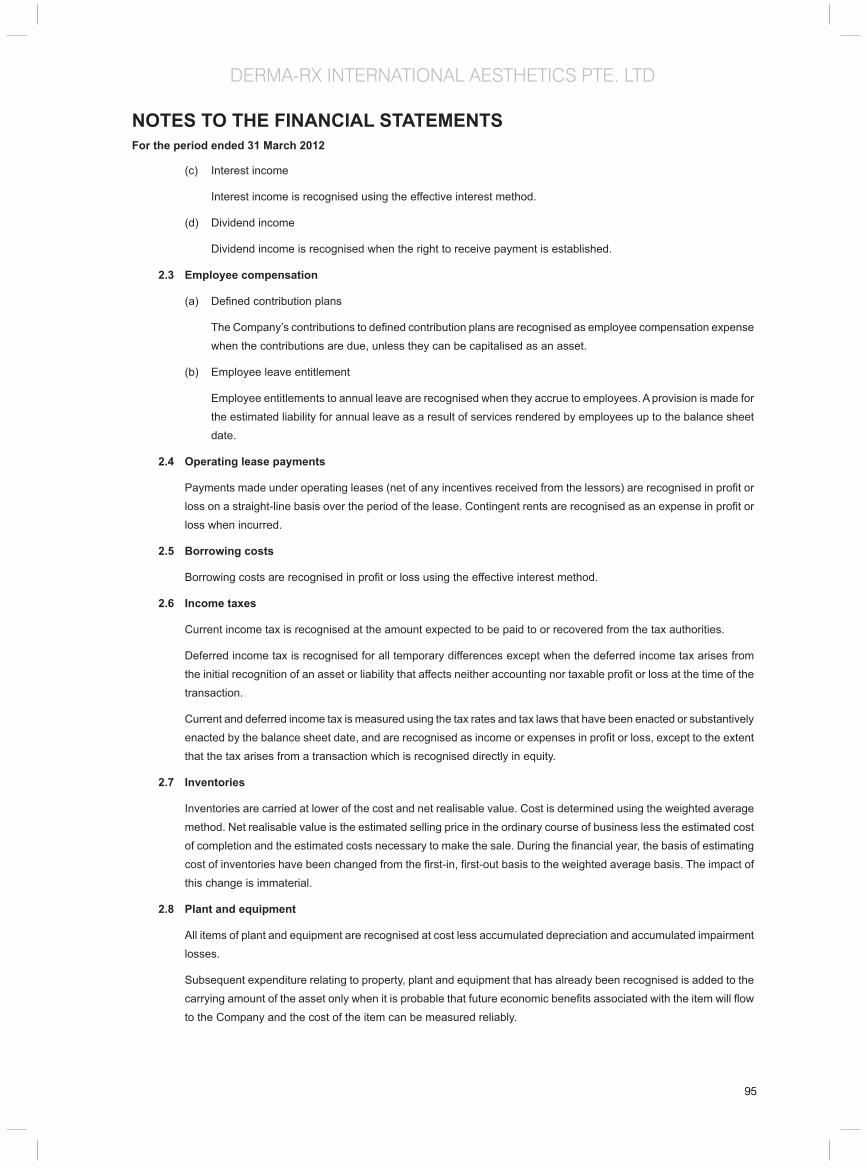
95
DERMA-RX INTERNATIONAL AESTHETICS PTE. LTD
95
NOTES TO THE FINANCIAL STATEMENTSFor the period ended 31 March 2012
(c) Interest income
Interest income is recognised using the effective interest method.
(d) Dividend income
Dividend income is recognised when the right to receive payment is established.
2.3 Employee compensation
(a) Defi ned contribution plans
The Company’s contributions to defi ned contribution plans are recognised as employee compensation expense when the contributions are due, unless they can be capitalised as an asset.
(b) Employee leave entitlement
Employee entitlements to annual leave are recognised when they accrue to employees. A provision is made for the estimated liability for annual leave as a result of services rendered by employees up to the balance sheet date.
2.4 Operating lease payments
Payments made under operating leases (net of any incentives received from the lessors) are recognised in profi t or loss on a straight-line basis over the period of the lease. Contingent rents are recognised as an expense in profi t or loss when incurred.
2.5 Borrowing costs
Borrowing costs are recognised in profi t or loss using the effective interest method.
2.6 Income taxes
Current income tax is recognised at the amount expected to be paid to or recovered from the tax authorities.
Deferred income tax is recognised for all temporary differences except when the deferred income tax arises from the initial recognition of an asset or liability that affects neither accounting nor taxable profi t or loss at the time of the transaction.
Current and deferred income tax is measured using the tax rates and tax laws that have been enacted or substantively enacted by the balance sheet date, and are recognised as income or expenses in profi t or loss, except to the extent that the tax arises from a transaction which is recognised directly in equity.
2.7 Inventories
Inventories are carried at lower of the cost and net realisable value. Cost is determined using the weighted average method. Net realisable value is the estimated selling price in the ordinary course of business less the estimated cost of completion and the estimated costs necessary to make the sale. During the fi nancial year, the basis of estimating cost of inventories have been changed from the fi rst-in, fi rst-out basis to the weighted average basis. The impact of this change is immaterial.
2.8 Plant and equipment
All items of plant and equipment are recognised at cost less accumulated depreciation and accumulated impairment losses.
Subsequent expenditure relating to property, plant and equipment that has already been recognised is added to the carrying amount of the asset only when it is probable that future economic benefi ts associated with the item will fl ow to the Company and the cost of the item can be measured reliably.

96
DERMA-RX INTERNATIONAL AESTHETICS PTE. LTD
96
NOTES TO THE FINANCIAL STATEMENTSFor the period ended 31 March 2011
Depreciation is calculated using the straight-line method to allocate depreciable amounts over their estimated useful lives. The estimated useful lives are as follows:
Useful lives
Computers 3 years
Furniture and fi ttings 3 years
Offi ce equipment 3 years
Renovations 3 years
Machinery 3 years
The residual values, estimated useful lives and depreciation method of property, plant and equipment are reviewed, and adjusted as appropriate, at each balance sheet date. The effects of any revision are recognised in profi t or loss when the changes arise.
2.9 Intangible assets
(a) Goodwill
Goodwill on acquisition is identifi ed as being the excess of the sum of the fair value of the consideration transferred in the business combination, the amount of non-controlling interests in the acquiree, over the net fair value of the acquiree's identifi able assets and liabilities. In instances where the latter amount exceeds the former, the excess is recognised as a gain in profi t or loss on the acquisition date.
Positive goodwill is carried at cost less any accumulated impairment loss. Goodwill is subjected to an impairment test annually or more frequently if events or changes in circumstances indicate that the carrying value might be impaired. Impairment loss on goodwill is not reversed in a subsequent period.
For the purpose of impairment testing, positive goodwill on acquisition from the acquisition date is allocated to the cash-generating units ("CGU") expected to benefi t from the acquisition synergies. An impairment loss is recognised in the profi t or loss when the carrying amount of the CGU, including the goodwill, exceeds the recoverable amount of the CGU. The recoverable amount is the higher of the CGU's fair value less costs to sell and its value in use.
The total impairment loss is allocated fi rst to reduce the carrying amount of goodwill allocated to the CGU and then to the other assets of the CGU pro-rated on the basis of the carrying amount of each asset in the CGU.
Impairment loss on goodwill is not reversed in a subsequent period.
(b) Acquired trademark and licences
Trademarks, which have an indefi nite useful life, are initially recognised at cost and are subsequently carried at cost less any impairment loss. At each balance sheet date, the company assesses whether there is any indication of impairment. If such indication exists, the recoverable amount is estimated.
2.10 Investments in subsidiaries
Investments in subsidiaries are carried in the Company’s balance sheet at cost less accumulated impairment losses. On disposal of investments in subsidiaries, the difference between disposal proceeds and the carrying amounts of the investments are recognised in profi t and loss.
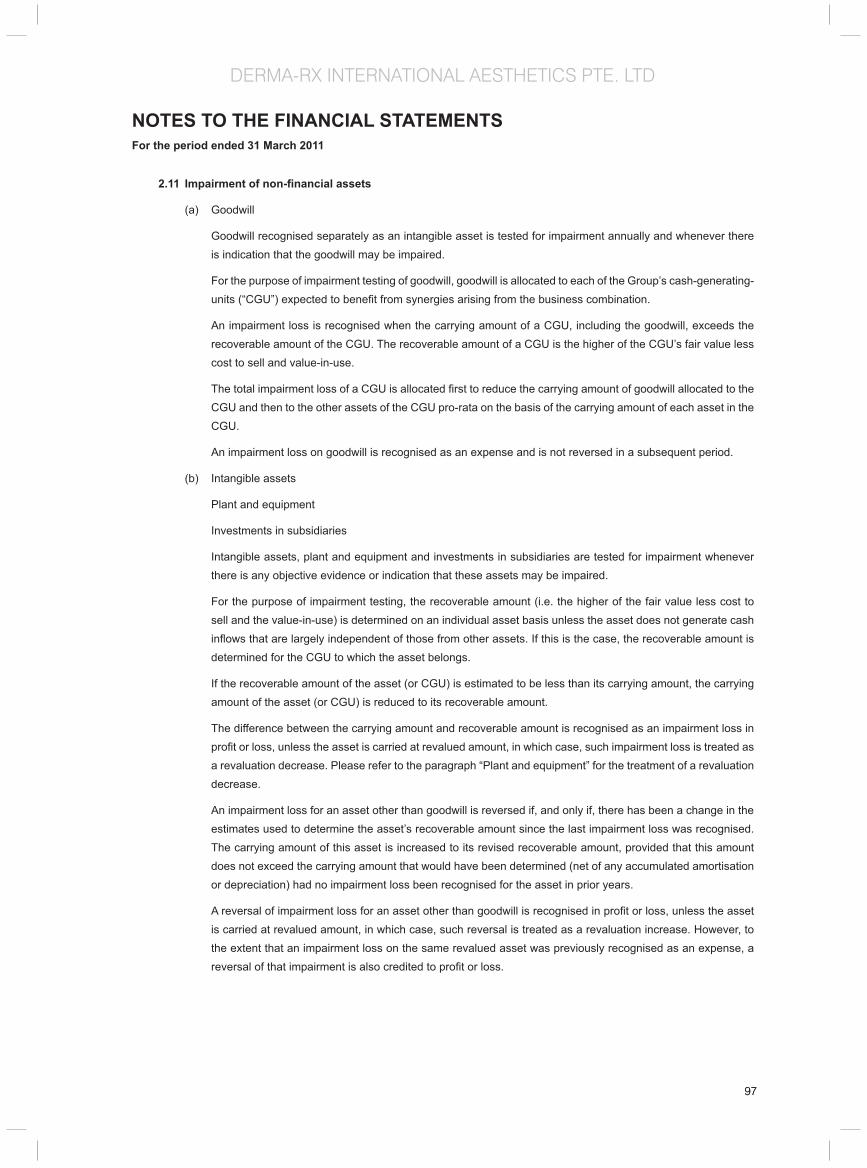
97
DERMA-RX INTERNATIONAL AESTHETICS PTE. LTD
97
NOTES TO THE FINANCIAL STATEMENTSFor the period ended 31 March 2011
2.11 Impairment of non-fi nancial assets
(a) Goodwill
Goodwill recognised separately as an intangible asset is tested for impairment annually and whenever there is indication that the goodwill may be impaired.
For the purpose of impairment testing of goodwill, goodwill is allocated to each of the Group’s cash-generating-units (“CGU”) expected to benefi t from synergies arising from the business combination.
An impairment loss is recognised when the carrying amount of a CGU, including the goodwill, exceeds the recoverable amount of the CGU. The recoverable amount of a CGU is the higher of the CGU’s fair value less cost to sell and value-in-use.
The total impairment loss of a CGU is allocated fi rst to reduce the carrying amount of goodwill allocated to the CGU and then to the other assets of the CGU pro-rata on the basis of the carrying amount of each asset in the CGU.
An impairment loss on goodwill is recognised as an expense and is not reversed in a subsequent period.
(b) Intangible assets
Plant and equipment
Investments in subsidiaries
Intangible assets, plant and equipment and investments in subsidiaries are tested for impairment whenever there is any objective evidence or indication that these assets may be impaired.
For the purpose of impairment testing, the recoverable amount (i.e. the higher of the fair value less cost to sell and the value-in-use) is determined on an individual asset basis unless the asset does not generate cash infl ows that are largely independent of those from other assets. If this is the case, the recoverable amount is determined for the CGU to which the asset belongs.
If the recoverable amount of the asset (or CGU) is estimated to be less than its carrying amount, the carrying amount of the asset (or CGU) is reduced to its recoverable amount.
The difference between the carrying amount and recoverable amount is recognised as an impairment loss in profi t or loss, unless the asset is carried at revalued amount, in which case, such impairment loss is treated as a revaluation decrease. Please refer to the paragraph “Plant and equipment” for the treatment of a revaluation decrease.
An impairment loss for an asset other than goodwill is reversed if, and only if, there has been a change in the estimates used to determine the asset’s recoverable amount since the last impairment loss was recognised. The carrying amount of this asset is increased to its revised recoverable amount, provided that this amount does not exceed the carrying amount that would have been determined (net of any accumulated amortisation or depreciation) had no impairment loss been recognised for the asset in prior years.
A reversal of impairment loss for an asset other than goodwill is recognised in profi t or loss, unless the asset is carried at revalued amount, in which case, such reversal is treated as a revaluation increase. However, to the extent that an impairment loss on the same revalued asset was previously recognised as an expense, a reversal of that impairment is also credited to profi t or loss.
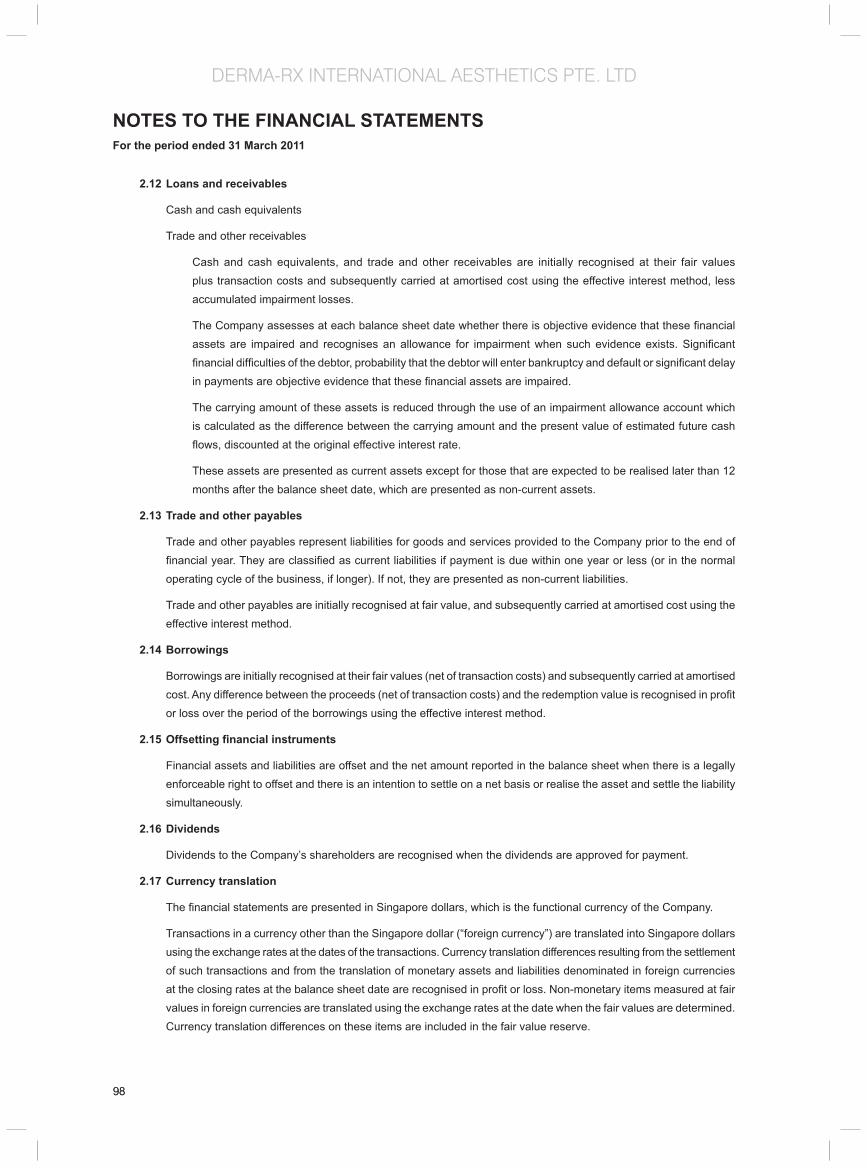
98
DERMA-RX INTERNATIONAL AESTHETICS PTE. LTD
98
NOTES TO THE FINANCIAL STATEMENTSFor the period ended 31 March 2011
2.12 Loans and receivables
Cash and cash equivalents
Trade and other receivables
Cash and cash equivalents, and trade and other receivables are initially recognised at their fair values plus transaction costs and subsequently carried at amortised cost using the effective interest method, less accumulated impairment losses.
The Company assesses at each balance sheet date whether there is objective evidence that these fi nancial assets are impaired and recognises an allowance for impairment when such evidence exists. Signifi cant fi nancial diffi culties of the debtor, probability that the debtor will enter bankruptcy and default or signifi cant delay in payments are objective evidence that these fi nancial assets are impaired.
The carrying amount of these assets is reduced through the use of an impairment allowance account which is calculated as the difference between the carrying amount and the present value of estimated future cash fl ows, discounted at the original effective interest rate.
These assets are presented as current assets except for those that are expected to be realised later than 12 months after the balance sheet date, which are presented as non-current assets.
2.13 Trade and other payables
Trade and other payables represent liabilities for goods and services provided to the Company prior to the end of fi nancial year. They are classifi ed as current liabilities if payment is due within one year or less (or in the normal operating cycle of the business, if longer). If not, they are presented as non-current liabilities.
Trade and other payables are initially recognised at fair value, and subsequently carried at amortised cost using the effective interest method.
2.14 Borrowings
Borrowings are initially recognised at their fair values (net of transaction costs) and subsequently carried at amortised cost. Any difference between the proceeds (net of transaction costs) and the redemption value is recognised in profi t or loss over the period of the borrowings using the effective interest method.
2.15 Offsetting fi nancial instruments
Financial assets and liabilities are offset and the net amount reported in the balance sheet when there is a legally enforceable right to offset and there is an intention to settle on a net basis or realise the asset and settle the liability simultaneously.
2.16 Dividends
Dividends to the Company’s shareholders are recognised when the dividends are approved for payment.
2.17 Currency translation
The fi nancial statements are presented in Singapore dollars, which is the functional currency of the Company.
Transactions in a currency other than the Singapore dollar (“foreign currency”) are translated into Singapore dollars using the exchange rates at the dates of the transactions. Currency translation differences resulting from the settlement of such transactions and from the translation of monetary assets and liabilities denominated in foreign currencies at the closing rates at the balance sheet date are recognised in profi t or loss. Non-monetary items measured at fair values in foreign currencies are translated using the exchange rates at the date when the fair values are determined. Currency translation differences on these items are included in the fair value reserve.

99
DERMA-RX INTERNATIONAL AESTHETICS PTE. LTD
99
NOTES TO THE FINANCIAL STATEMENTSFor the period ended 31 March 2011
Foreign exchange gains and losses that relate to borrowings are presented within ‘fi nance cost’. All other foreign exchange gains and losses impacting profi t or loss are presented within ‘other losses - net’.
3. Critical accounting estimates, assumptions and judgements
Estimates, assumptions and judgements are continually evaluated and are based on historical experience and other factors, including expectations of future events that are believed to be reasonable under the circumstances.
(a) Estimation of fair value of contingent consideration- The balance of the consideration payable to vendors towards acquisition of the Derma-Rx entities is dependent on achievement of certain milestones as envisaged in the Sales & Purchase Agreement. Probabilities have been assigned to the likely achievement of those milestones and these probabilities are tested every quarter on the basis of actual business performance. As on the date of fi nancial year end the actual achievement is in line with assigned probabilities on the date of acquisition.
(b) Estimated impairment of non fi nancial assets-Goodwill is tested for impairment annually and whenever there is indication that the goodwill may be impaired. Intangible assets, plant and equipment and investments in subsidiaries are tested for impairment whenever there is any objective evidence or indication that these assets may be impaired.
The recoverable amounts of these assets and where applicable, cash-generating units, have been determined based on value-in-use calculations. These calculations require the use of estimates with regard to future growth in revenue and costs. Based on the estimates the management believes that there is no need for creating an impairment charge for the total of the carrying value of assets in the company.
4 Revenue
2012 2011 2012 2011$ $ Rs.Crore Rs.Crore
Trading sales 3,753,000 295,000 15.32 1.04
Royalty income from subsidiaries 1,693,000 1,402,000 6.91 4.96
5,446,000 1,697,000 22.24 6.00
5 Other Income
2012 2011 2012 2011$ $ Rs.Crore Rs.Crore
Management fee 96,000 8,000 0.39 0.03
Miscellaneous income 5,000 – 0.02 –
Reversal of allowance for doubtful debts 96,000 10,000 0.39 0.04
Dividend income 3,000,000 – 12.25 –
3,197,000 18,000 13.05 0.06
6 Other gain/(losses) - net
2012 2011 2012 2011$ $ Rs.Crore Rs.Crore
Net currency translation (losses)/gains (1,000) 69,000 – 0.24
(1,000) 69,000 – 0.24
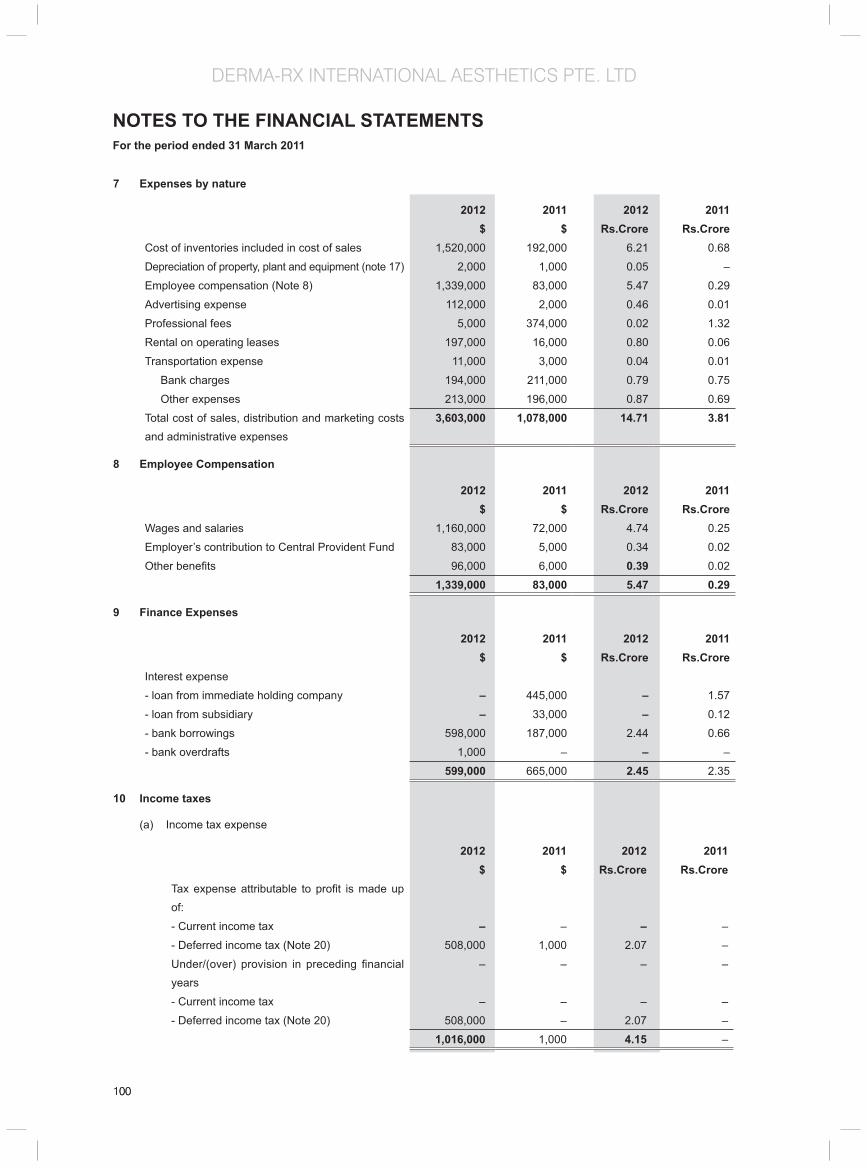
100
DERMA-RX INTERNATIONAL AESTHETICS PTE. LTD
100
NOTES TO THE FINANCIAL STATEMENTSFor the period ended 31 March 2011
7 Expenses by nature
2012 2011 2012 2011$ $ Rs.Crore Rs.Crore
Cost of inventories included in cost of sales 1,520,000 192,000 6.21 0.68
Depreciation of property, plant and equipment (note 17) 2,000 1,000 0.05 –
Employee compensation (Note 8) 1,339,000 83,000 5.47 0.29
Advertising expense 112,000 2,000 0.46 0.01
Professional fees 5,000 374,000 0.02 1.32
Rental on operating leases 197,000 16,000 0.80 0.06
Transportation expense 11,000 3,000 0.04 0.01
Bank charges 194,000 211,000 0.79 0.75
Other expenses 213,000 196,000 0.87 0.69
Total cost of sales, distribution and marketing costs and administrative expenses
3,603,000 1,078,000 14.71 3.81
8 Employee Compensation
2012 2011 2012 2011$ $ Rs.Crore Rs.Crore
Wages and salaries 1,160,000 72,000 4.74 0.25
Employer’s contribution to Central Provident Fund 83,000 5,000 0.34 0.02
Other benefi ts 96,000 6,000 0.39 0.02
1,339,000 83,000 5.47 0.29
9 Finance Expenses
2012 2011 2012 2011$ $ Rs.Crore Rs.Crore
Interest expense
- loan from immediate holding company – 445,000 – 1.57
- loan from subsidiary – 33,000 – 0.12
- bank borrowings 598,000 187,000 2.44 0.66
- bank overdrafts 1,000 – – –
599,000 665,000 2.45 2.35
10 Income taxes
(a) Income tax expense
2012 2011 2012 2011$ $ Rs.Crore Rs.Crore
Tax expense attributable to profi t is made up of:
- Current income tax – – – –
- Deferred income tax (Note 20) 508,000 1,000 2.07 –
Under/(over) provision in preceding fi nancial years
– – – –
- Current income tax – – – –
- Deferred income tax (Note 20) 508,000 – 2.07 –
1,016,000 1,000 4.15 –

101
DERMA-RX INTERNATIONAL AESTHETICS PTE. LTD
101
NOTES TO THE FINANCIAL STATEMENTSFor the period ended 31 March 2011
2012 2011 2012 2011$ $ Rs.Crore Rs.Crore
Profi t before tax 4,440,000 41,000 18.13 0.14
Tax calculated at tax rate of 17% (2011: 17%) 755,000 7,000 3.08 0.02
Effects of:
- statutory stepped income exemption – (57,000) – (0.20)
- capital allowances for IPR (397,000) – (1.62) –
- expenses not deductible for tax purposes 152,000 52,000 0.62 0.18
- income not subject to tax (510,000) (2,000) (2.08) (0.01)
Tax charge – – – –
(b) Movements in current income tax liability
2012 2011 2012 2011$ $ Rs.Crore Rs.Crore
Beginning of fi nancial year 178,000 – 0.73 –
Income tax paid (164,000) – (0.67) –
Tax payable on profi t for current fi nancial year – 178,000 – 0.63
Underprovision in preceding fi nancial years – – – –
End of fi nancial year 14,000 178,000 0.06 0.63
11 Cash And Cash Equivalents
2012 2011 2012 2011$ $ Rs.Crore Rs.Crore
Cash at bank and on hand 278,000 1,420,000 1.14 5.02
Cash and bank deposits (as above) 278,000 1,420,000 1.14 5.02
Less: Bank overdrafts (Note 19) (740,000) – (3.02) –
Cash and cash equivalents per statement of cash fl ows
(462,000) 1,420,000 (1.89) 5.02
12 Trade And other receivables
2012 2011 2012 2011$ $ Rs.Crore Rs.Crore
Trade receivables from:
- Non-related parties 29,000 44,000 0.12 0.16
- Immediate holding corporation 511,000 159,000 2.09 0.56
- Subsidiaries 543,000 212,000 2.22 0.75
- Other related party 2,000 6,000 0.01 0.02
Less: Allowance for impairment of receivables (86,000) (193,000) (0.35) (0.68)
Trade receivables - net 999,000 228,000 4.08 0.81
Deposits 40,000 57,000 0.16 0.20
Prepayments 36,000 12,000 0.15 0.04
Advance payment to creditors – 150,000 – 0.53
1,075,000 447,000 4.39 1.58
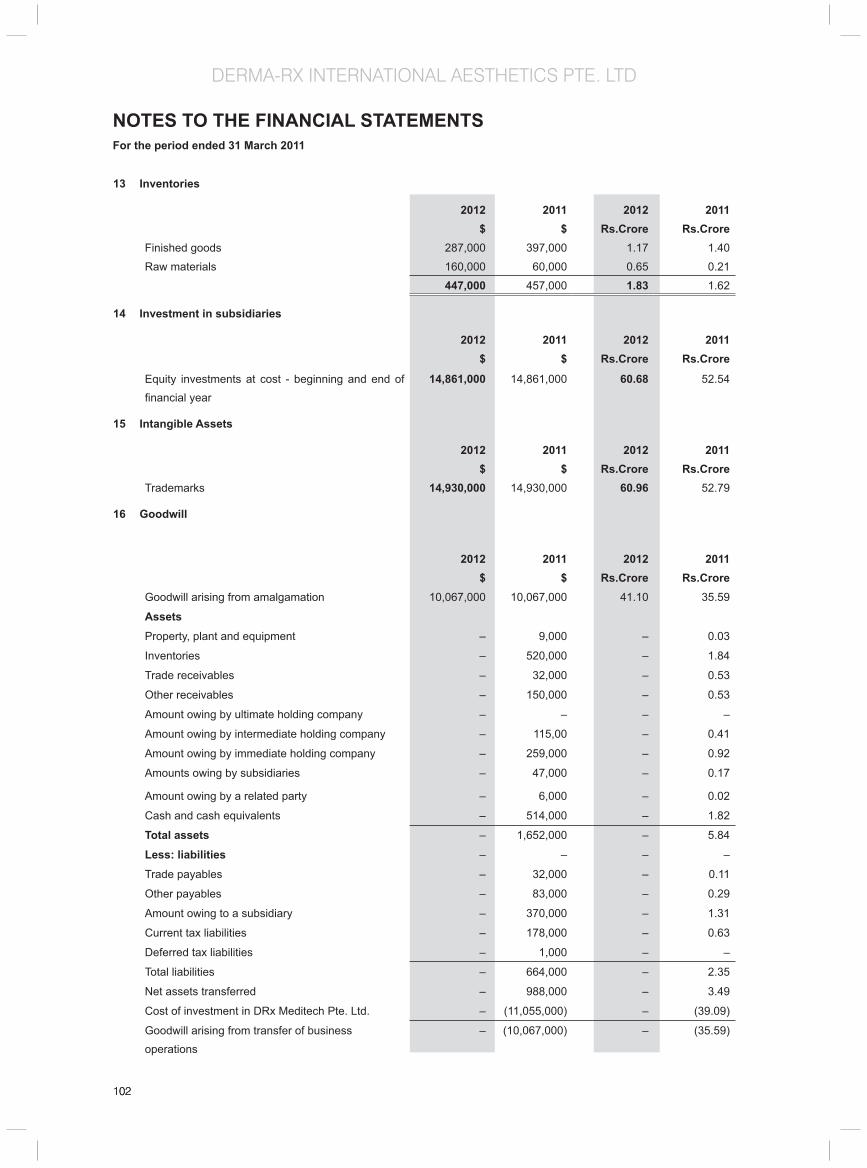
102
DERMA-RX INTERNATIONAL AESTHETICS PTE. LTD
102
NOTES TO THE FINANCIAL STATEMENTSFor the period ended 31 March 2011
13 Inventories
2012 2011 2012 2011$ $ Rs.Crore Rs.Crore
Finished goods 287,000 397,000 1.17 1.40
Raw materials 160,000 60,000 0.65 0.21
447,000 457,000 1.83 1.62
14 Investment in subsidiaries
2012 2011 2012 2011$ $ Rs.Crore Rs.Crore
Equity investments at cost - beginning and end of fi nancial year
14,861,000 14,861,000 60.68 52.54
15 Intangible Assets
2012 2011 2012 2011$ $ Rs.Crore Rs.Crore
Trademarks 14,930,000 14,930,000 60.96 52.79
16 Goodwill
2012 2011 2012 2011$ $ Rs.Crore Rs.Crore
Goodwill arising from amalgamation 10,067,000 10,067,000 41.10 35.59
AssetsProperty, plant and equipment – 9,000 – 0.03
Inventories – 520,000 – 1.84
Trade receivables – 32,000 – 0.53
Other receivables – 150,000 – 0.53
Amount owing by ultimate holding company – – – –
Amount owing by intermediate holding company – 115,00 – 0.41
Amount owing by immediate holding company – 259,000 – 0.92
Amounts owing by subsidiaries – 47,000 – 0.17
Amount owing by a related party – 6,000 – 0.02
Cash and cash equivalents – 514,000 – 1.82
Total assets – 1,652,000 – 5.84
Less: liabilities – – – –
Trade payables – 32,000 – 0.11
Other payables – 83,000 – 0.29
Amount owing to a subsidiary – 370,000 – 1.31
Current tax liabilities – 178,000 – 0.63
Deferred tax liabilities – 1,000 – –
Total liabilities – 664,000 – 2.35
Net assets transferred – 988,000 – 3.49
Cost of investment in DRx Meditech Pte. Ltd. – (11,055,000) – (39.09)
Goodwill arising from transfer of business operations
– (10,067,000) – (35.59)

103
DERMA-RX INTERNATIONAL AESTHETICS PTE. LTD
103
NOTES TO THE FINANCIAL STATEMENTSFor the period ended 31 March 2011
17 Plant and equipment
Computers Furniture and Renovations Offi ce Machinery Total fi ttings equipment $’000 $’000 $’000 $’000 $’000 $’000
2012
Cost
Beginning of fi nancial year 87,000 11,000 3,000 2,000 5,000 108,000
Additions 5,000 1,000 – 15,000 – 21,000
Disposals – – – – – –
End of fi nancial year 92,000 12,000 3,000 17,000 5,000 129,000
Accumulated depreciation
Beginning of fi nancial year 80,000 11,000 3,000 1,000 5,000 100,000
Depreciation charge (Note 7) 8,000 – – 4,000 – 12,000
Disposals – – – – – –
End of fi nancial year 88,000 11,000 3,000 5,000 5,000 112,000
Net book value
End of fi nancial year 4,000 1,000 – 12,000 – 17,000
2011
Cost
At 22 April 2010 – – – – – –
Transferred from subsidiary
upon amalgamation 87,000 11,000 3,000 2,000 5,000 108,000
Additions – – – – – –
End of fi nancial year 87,000 11,000 3,000 2,000 5,000 108,000
Accumulated depreciation
At 22 April 2010 – – – – – –
Transferred from subsidiary
upon amalgamation 79,000 11,000 3,000 1,000 5,000 99,000
Depreciation charge (Note 7) 1,000 – – – – 1,000
End of fi nancial year 80,000 11,000 3,000 1,000 5,000 100,000
Net book value
End of fi nancial year 7,000 – – 1,000 – 8,000

104
DERMA-RX INTERNATIONAL AESTHETICS PTE. LTD
104
NOTES TO THE FINANCIAL STATEMENTSFor the period ended 31 March 2011
17 Plant and equipment
Computers Furniture and Renovations Offi ce Machinery Total fi ttings equipment Rs. Crore Rs. Crore Rs. Crore Rs. Crore Rs. Crore Rs. Crore
2012
Cost
Beginning of fi nancial year 0.31 0.04 0.01 0.01 0.02 0.38
Additions 0.02 – – 0.06 – 0.09
Disposals – – – – – –
End of fi nancial year 0.38 0.05 0.01 0.07 0.02 0.53
Accumulated depreciation
Beginning of fi nancial year 0.28 0.04 0.01 – 0.02 0.35
Depreciation charge (Note 7) 0.03 – – 0.02 – 0.05
Disposals – – – – – –
End of fi nancial year 0.36 0.04 0.01 0.02 0.02 0.46
Net book value
End of fi nancial year 0.02 – – 0.05 – 0.07
2011
Cost
At 22 April 2010 – – – – – – Transferred from subsidiary
upon amalgamation 0.31 0.04 0.01 0.01 0.02 0.38
Additions – – – – – –
End of fi nancial year 0.31 0.04 0.01 0.01 0.02 0.38
Accumulated depreciation
At 22 April 2010 – – – – – – Transferred from subsidiary
upon amalgamation 0.28 0.04 0.01 - 0.02 0.35
Depreciation charge (Note 7)
End of fi nancial year 0.28 0.04 0.01 - 0.02 0.35
Net book value
End of fi nancial year 0.02 – – – – 0.03

105
DERMA-RX INTERNATIONAL AESTHETICS PTE. LTD
105
NOTES TO THE FINANCIAL STATEMENTSFor the period ended 31 March 2011
18 Trade and other payables
2012 2011 2012 2011 $ $ Rs.Crore Rs.Crore
Current
Trade payables to:
- Non-related parties 3,000 75,000 0.01 0.27
- Related parties 28,000 40,000 0.11 0.14
31,000 115,000 0.13 0.41
Accruals for operating expenses 157,000 76,000 0.64 0.27
Other payables 37,000 61,000 0.15 0.22
Contingent consideration payable 3,000,000 2,500,000 12.25 8.84
3,225,000 2,752,000 13.17 9.73
Non-current
Contingent consideration payable 7,500,000 10,500,000 30.62 37.12
Total trade and other payables 10,725,000 13,252,000 43.79 46.86
19 Borrowings
2012 2011 2012 2011
$ $ Rs.Crore Rs.Crore
Current
Bank overdrafts (Note 11) 740,000 – 3.02 –
Bank borrowing - Term Loan 850,000 – 3.47 –
Borrowings from ultimate holding company and
subsidiaries 4,715,000 719,000 19.25 2.54
6,305,000 719,000 25.74 2.54
Non-current
Bank borrowing - Term Loan 16,150,000 21,000,000 65.94 74.25
Total borrowings 22,455,000 21,719,000 91.68 76.79
20 Deferred income taxes
2012 2011 2012 2011
$ $ Rs.Crore Rs.Crore
Beginning of fi nancial year 1,000 – – –
Tax (credited)/charged to:
- profi t or loss (Note 10(a)) 1,016,000 1,000 4.15 –
End of fi nancial year 1,017,000 1,000 4.15 – To be settled within one year – – – –
To be settled after one year 1,017,000 1,000 4.15 –
1,017,000 1,000 4.15 –
21 Share capital
The Company’s share capital comprises fully paid-up 7,000,000 (2011: 7,000,000) ordinary shares with no par value, amounting to a total of $7,000,000 (2011: $7,000,000).

106
DERMA-RX INTERNATIONAL AESTHETICS PTE. LTD
106
NOTES TO THE FINANCIAL STATEMENTSFor the period ended 31 March 2011
22 Dividends
2012 2011 2012 2011
$ $ Rs.Crore Rs.Crore
Ordinary dividends paid and proposed
Final dividend paid in respect for 2012 of
S$0.21 (2011: Nil) per share 1,500,000 – 6.12 – Interim dividend paid in respect for 2012
of S$0.07 (2011: Nil) per share 500,000 – 2.04 – Interim dividend paid in respect for 2012
of S$0.14 (2011: Nil) per share 1,000,000 – 4.08 – 3,000,000 – 12.25 –
23 Commitments
Operating lease commitments - where the Company is a lessee
As at balance sheet date, the company has the following commitments under non-cancellable operating leases where the company is the lessee:
2012 2011 2012 2011
$ $ Rs.Crore Rs.Crore
Not later than one year 170,000 197,000 0.69 0.70
Between one and fi ve years 27,000 197,000 0.11 0.70
Later than fi ve years – – – – 197,000 394,000 0.80 1.39
24 Financial risk management
Financial risk factors
The Company’s activities expose it to a variety of fi nancial risks: market risk (including currency risk, interest rate risk and price risk), credit risk and liquidity risk.
(a) Market risk
(i) Currency risk
The Company’s business is mainly exposed to the United States Dollar (“USD”) as certain sales are denominated in USD. The company reviews periodically monetary assets and liabilities held in USD to ensure that net exposure is kept at an acceptable level.
The Company’s currency exposure to the USD is as follows:
2012 2011 2012 2011
$ $ Rs.Crore Rs.Crore
(a) Financial assets
Cash and bank deposits 14,000 72,000 0.06 0.25
Other receivables 11,000 15,000 0.04 0.05
25,000 87,000 0.10 0.31
At 31 Mar 2012, if the USD had strengthened/weakened by 10% (2011: 10%) against the SGD with all other variables including tax rate being held constant, the Company’s profi t after tax for the fi nancial year would have been $2,075 (2011: $7,221) higher/lower as a result of currency translation gains/losses on the remaining USD-denominated fi nancial instruments.

107
DERMA-RX INTERNATIONAL AESTHETICS PTE. LTD
107
NOTES TO THE FINANCIAL STATEMENTSFor the period ended 31 March 2011
(ii) Interest rate risk
The Company is exposed to signifi cant interest rate risk on its borrowings.
The Company’s borrowings at variable rates are denominated mainly in SGD. At 31 March 2012, if the SGD interest rates had increased/decreased by 1% (2011: 100bp) with all other variables including tax rate being held constant, the profi t after tax for the year would have been lower/higher by $170,000 (2011: $210,000) as a result of higher/lower interest expense on these borrowings.
(b) Credit risk
The Company adopts the policy of dealing only with customers of appropriate credit history, and obtaining suffi cient security where appropriate to mitigate credit risk. For other fi nancial assets, the Company adopts the policy of dealing with fi nancial institutions and other counterparties with high credit ratings. During the fi nancial period, the company derived approximately 89% of its revenue from its related parties.
The maximum exposure to credit risk for each class of fi nancial assets is the carrying amount of that class of fi nancial instruments presented on the balance sheet. The Company’s major classes of fi nancial assets are bank deposits and trade and other receivables.
(i) Financial assets that are neither past due nor impaired
Bank deposits that are neither past due nor impaired are mainly deposits with banks which have high credit-ratings. Trade and other receivables that are neither past due nor impaired are substantially companies with good collection track records with the Company.
(ii) Financial assets that are past due and/or impaired
There is no other class of fi nancial assets that is past due and/or impaired except for trade receivables.
During the year no allowance for impairment was made. The carrying amount of trade receivables individually determined to be impaired and the movement in the related allowance for impairment are as follows:
2012 2011 2012 2011
$ $ Rs.Crore Rs.Crore
Gross amount – 178,000 – 0.63 Less: Allowance for impairment – (168,000) – (0.59)
– 10,000 – 0.01
Other receivable - gross amount – 25,000 – 0.01
Less: Allowance for impairment – (25,000) – (0.01)
– – – –
The impaired trade receivables arise mainly from sales to a customer which has suffered signifi cant losses in its operations.

108
DERMA-RX INTERNATIONAL AESTHETICS PTE. LTD
108
NOTES TO THE FINANCIAL STATEMENTSFor the period ended 31 March 2011
(c) Liquidity risk
The table below analyses the Company’s non-derivative fi nancial liabilities into relevant maturity groupings based on the remaining period from the balance sheet date to the contractual maturity date. The amounts disclosed in the table are the contractual undiscounted cash fl ows.
Between Between Between Between Less than 1 and 2 2 and 5 Less than 1 and 2 2 and 5 1 year years years 1 year years years $ $ $ Rs.Crore Rs.Crore Rs.Crore
At 31 March 2012
Trade and other payables 3,225,000 7,500,000 – 13.17 30.62 –
Borrowings 1,590,000 3,400,000 12,750,000 6.49 13.88 52.06
At 31 March 2011
Trade and other payables 2,752,000 3,000,000 7,500,000 9.73 10.61 26.52
Borrowings 719,000 1,050,000 19,950,000 2.54 3.71 70.54
(d) Capital risk
The Company’s objectives when managing capital are to ensure that the Company is adequately capitalised and to maintain an optimal capital structure by issuing or redeeming additional equity and debt instruments when necessary.
The Board of Director’s monitors its capital based on net debt and total capital. Net debt is calculated as borrowings plus trade and other payables less cash and bank deposits. Total capital is calculated as equity plus net debt.
The Company’s objectives when managing capital are to ensure that the Company is adequately capitalised and to maintain an optimal capital structure by issuing or redeeming additional equity and debt instruments when necessary.
2012 2011 2012 2011
$ $ Rs.Crore Rs.Crore
Net debt 32,902,000 33,550,000 134.34 118.62
Total equity 7,464,000 7,040,000 30.47 24.89
Total capital 40,366,000 40,590,000 164.81 143.51
The Company is not subject to any externally imposed capital requirements.
25 Immediate and ultimate holding corporation
The Company’s immediate holding corporation is Kaya Limited, incorporated in India. The ultimate holding corporation is Marico Limited, incorporated in the India.
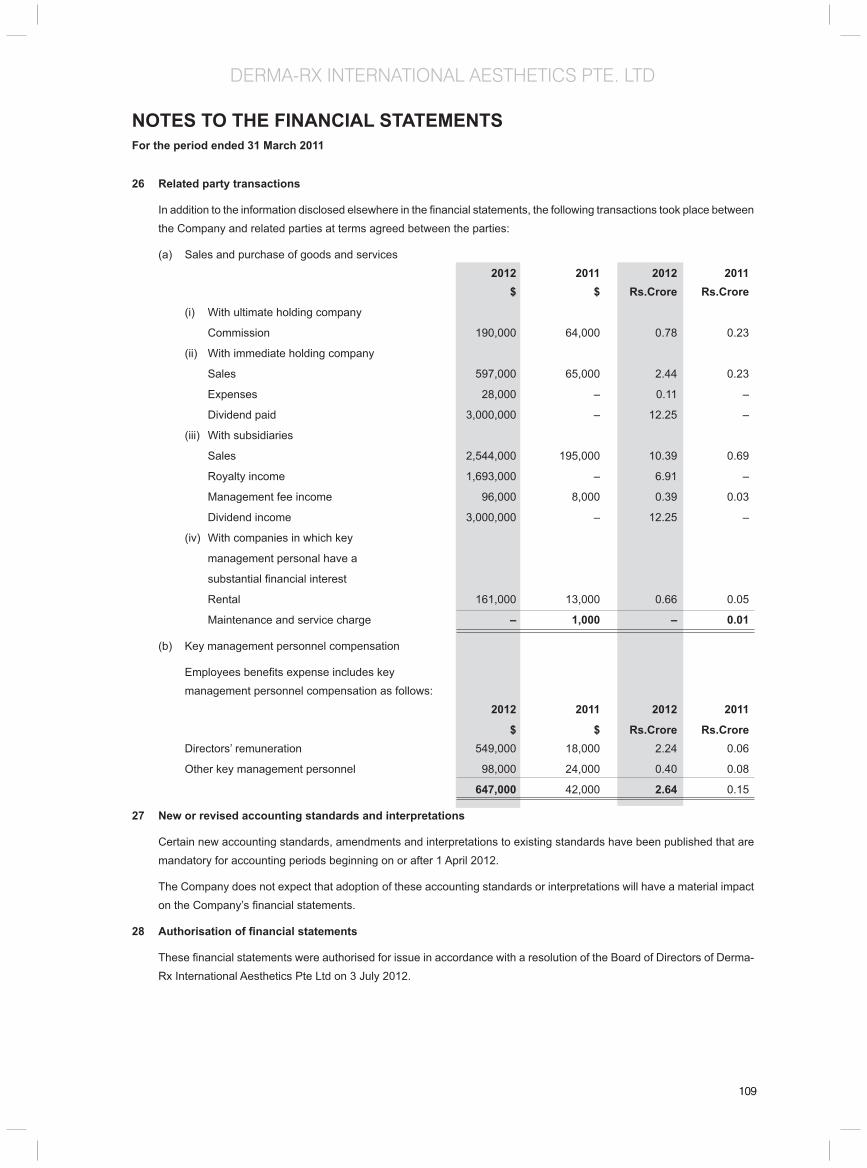
109
DERMA-RX INTERNATIONAL AESTHETICS PTE. LTD
109
NOTES TO THE FINANCIAL STATEMENTSFor the period ended 31 March 2011
26 Related party transactions
In addition to the information disclosed elsewhere in the fi nancial statements, the following transactions took place between the Company and related parties at terms agreed between the parties:
(a) Sales and purchase of goods and services 2012 2011 2012 2011 $ $ Rs.Crore Rs.Crore
(i) With ultimate holding company
Commission 190,000 64,000 0.78 0.23
(ii) With immediate holding company
Sales 597,000 65,000 2.44 0.23
Expenses 28,000 – 0.11 –
Dividend paid 3,000,000 – 12.25 –
(iii) With subsidiaries
Sales 2,544,000 195,000 10.39 0.69
Royalty income 1,693,000 – 6.91 –
Management fee income 96,000 8,000 0.39 0.03
Dividend income 3,000,000 – 12.25 –
(iv) With companies in which key
management personal have a
substantial fi nancial interest
Rental 161,000 13,000 0.66 0.05
Maintenance and service charge – 1,000 – 0.01
(b) Key management personnel compensation
Employees benefi ts expense includes key management personnel compensation as follows:
2012 2011 2012 2011
$ $ Rs.Crore Rs.Crore Directors’ remuneration 549,000 18,000 2.24 0.06
Other key management personnel 98,000 24,000 0.40 0.08
647,000 42,000 2.64 0.15
27 New or revised accounting standards and interpretations
Certain new accounting standards, amendments and interpretations to existing standards have been published that are mandatory for accounting periods beginning on or after 1 April 2012.
The Company does not expect that adoption of these accounting standards or interpretations will have a material impact on the Company’s fi nancial statements.
28 Authorisation of fi nancial statements
These fi nancial statements were authorised for issue in accordance with a resolution of the Board of Directors of Derma-Rx International Aesthetics Pte Ltd on 3 July 2012.

110
THE DRX CLINIC PTE. LTD.
Board of Directors Ajay Kumar Pahwa
Naveen Duggal
Dr. Tan Siak Khim
Janifer Yeo – Tan
Registered Offi ce 213 Henderson Road, #01–08 Henderson Industrial Park, Singapore – 159553
Factory (Outlet) 302, Orchard Road, #16–01 Tong Building , Singapore
Auditors PricewaterhouseCoopers
Bankers UOB Bank

111
THE DRX CLINIC PTE. LTD.
REPORT OF THE DIRECTORS’ The directors present their report together with the audited fi nancial statements of the company for the period from 1 January 2010 to 31 March 2012.
The company changes its fi nancial year end from 31 December to 31 March.
Directors
The directors in offi ce at the date of this report are as follows:
Dr. Tan Siak Khim
Janifer Yeo – Tan
Ajay Kumar Pahwa
Naveen Duggal
Arrangements to enable directors to acquire shares and debentures
Neither at the end of nor at any time during the fi nancial year was the Company a party to any arrangement whose object was to enable the directors of the Company to acquire benefi ts by means of the acquisition of shares in, or debentures of, the Company or any other body corporate.
Directors’ interests in shares or debentures
According to the register of directors’ shareholdings, none of the directors holding offi ce at the end of the fi nancial year had any interest in the shares or debentures of the Company or its related corporations.
Directors’ contractual benefi ts
Since the end of the previous fi nancial year, no director has received or become entitled to receive a benefi t by reason of a contract made by the Company or a related corporation with the director or with a fi rm of which he is a member or with a company in which he has a substantial fi nancial interest, except as disclosed in the accompanying fi nancial statements and in this report, and except that certain directors receive remuneration as a result of their employment with related corporations.
Share options
No options were granted during the fi nancial year to subscribe for unissued shares of the Company.
No shares were issued during the fi nancial year by virtue of the exercise of options to take up unissued shares of the Company.
There were no unissued shares of the Company under option at the end of the fi nancial year.
Independent auditor
The independent auditor, PricewaterhouseCoopers LLP, has expressed its willingness to accept re appointment.
On behalf of the board,
NAVEEN DUGGALDirector
JANIFER YEO – TANDirector
Singapore, 3 July 2012

112
THE DRX CLINIC PTE. LTD.
STATEMENT BY DIRECTORS
In the opinion of the directors,
(a) the fi nancial statements are drawn up so as to give a true and fair view of the state of affairs of the Company as at 31
March 2012 and of the results of the business, changes in equity and cash fl ows of the Company for the fi nancial year
then ended; and
(b) at the date of this statement, there are reasonable grounds to believe that the Company will be able to pay its debts as
and when they fall due.
On behalf of the board,
NAVEEN DUGGALDirector
JANIFER YEO – TANDirector
Singapore, 3 July 2012

113
THE DRX CLINIC PTE. LTD.
INDEPENDENT AUDITORS’ REPORTTO THE MEMBERS OF THE DRx CLINIC PTE. LTD.
Report on the Financial Statements
We have audited the accompanying fi nancial statements of The DRx Clinic Pte Ltd (the “Company”) set out on pages 5 to 25, which comprise the balance sheet as at 31 March 2012, the statement of comprehensive income, the statement of changes in equity and the statement of cash fl ows for the fi nancial year then ended, and a summary of signifi cant accounting policies and other explanatory information.
Management’s Responsibility for the Financial Statements
Management is responsible for the preparation of fi nancial statements that give a true and fair view in accordance with the provisions of the Singapore Companies Act (the “Act”) and Singapore Financial Reporting Standards, and for devising and maintaining a system of internal accounting controls suffi cient to provide a reasonable assurance that assets are safeguarded against loss from unauthorised use or disposition; and transactions are properly authorised and that they are recorded as necessary to permit the preparation of true and fair profi t and loss accounts and balance sheets and to maintain accountability of assets.
Auditor’s Responsibility
Our responsibility is to express an opinion on these fi nancial statements based on our audit. We conducted our audit in accordance with Singapore Standards on Auditing. Those standards require that we comply with ethical requirements and plan and perform the audit to obtain reasonable assurance about whether the fi nancial statements are free from material misstatement.
An audit involves performing procedures to obtain audit evidence about the amounts and disclosures in the fi nancial statements. The procedures selected depend on the auditor’s judgement, including the assessment of the risks of material misstatement of the fi nancial statements, whether due to fraud or error. In making those risk assessments, the auditor considers internal control relevant to the entity’s preparation of fi nancial statements that give a true and fair view in order to design audit procedures that are appropriate in the circumstances, but not for the purpose of expressing an opinion on the effectiveness of the entity’s internal control. An audit also includes evaluating the appropriateness of accounting policies used and the reasonableness of accounting estimates made by management, as well as evaluating the overall presentation of the fi nancial statements.
We believe that the audit evidence we have obtained is suffi cient and appropriate to provide a basis for our audit opinion.
Opinion
In our opinion, the fi nancial statements of the Company are properly drawn up in accordance with the provisions of the Act and Singapore Financial Reporting Standards so as to give a true and fair view of the state of affairs of the Company as at 31 March 2012, and the results, changes in equity and cash fl ows of the Company for the fi nancial year ended on that date.
Report on Other Legal and Regulatory Requirements
In our opinion, the accounting and other records required by the Act to be kept by the Company have been properly kept in accordance with the provisions of the Act.
PricewaterhouseCoopers Llp
Public Account And
Certifi ed Public Countants
Singapore, 3 July 2012

114
THE DRX CLINIC PTE. LTD.
BALANCE SHEET AS AT 31 MARCH 2012 Note 2012 2011 2012 2011 $ $ Rs.crore Rs.crore
ASSETS
Current assets
Cash and cash equivalents 8 366,000 1,819,000 1.49 6.43
Trade and other receivables 9 263,000 244,000 1.07 0.86
Loan to immediate holding corporation 11 2,039,000 666,000 8.33 2.35
Inventories 10 494,000 342,000 2.02 1.21
3,162,000 3,071,000 12.91 10.86
Non–current assets
Property, plant and equipment 12 176,000 379,000 0.72 1.34
Total assets 3,338,000 3,450,000 13.63 12.20
LIABILITIES
Current liabilities
Trade and other payables 13 285,000 385,000 1.16 1.36
Deferred revenue 587,000 617,000 2.40 2.18
Current income tax liabilities 7 (13,000) 753,000 (0.05) 2.66
Borrowings – 1,000 – –
859,000 1,756,000 3.51 6.21
Non–current liabilities
Deferred income tax liabilities 14 44,000 44,000 0.18 0.16
Total liabilities 903,000 1,800,000 3.69 6.36
NET ASSETS 2,435,000 1,650,000 9.94 5.83
EQUITY
Share capital 15 100,000 100,000 0.41 0.35
Retained profi ts 2,335,000 1,550,000 9.53 5.48
Total equity 2,435,000 1,650,000 9.94 5.83
The accompanying notes form an integral part of these fi nancial statements.
Notes: The exchange rate used to convert SGD to Rs. <40.829> / <SGD> (Rs. <35.357> / <SGD>)
“The columns in INR are not part of the audited fi nancial statements and the audit opinion does not apply to them.”

115
THE DRX CLINIC PTE. LTD.
STATEMENT OF COMPREHENSIVE INCOMEfor the period from 1 January 2010 to 31 March 2012 Note 2012 2011 2012 2011 $ $ Rs.crore Rs.crore
Revenue 3 9,788,000 11,179,000 39.96 39.53
Cost of sales 5 (2,685,000) (3,198,000) (10.96) (11.31)
Gross profi t 7,103,000 7,981,000 29.00 28.22
Other income 4 464,000 615,000 1.89 2.17
Expenses
- Distribution and marketing 5 (4,000) (9,000) (0.02) (0.03)
- Administrative 5 (4,775,000) (5,340,000) (19.50) (18.88)
Profi t before income tax 2,788,000 3,247,000 11.38 11.48
Income tax expense 7 247,000 (478,000) 1.01 (1.69)
Profi t after tax representing total comprehensive income 3,035,000 2,769,000 12.39 9.79
Notes: The exchange rate used to convert SGD to Rs. <40.829> / <SGD> (Rs. <35.357> / <SGD>)
“The columns in INR are not part of the audited fi nancial statements and the audit opinion does not apply to them.”

116
THE DRX CLINIC PTE. LTD.
STATEMENT OF CHANGES IN EQUITYFOR THE PERIOD FROM 1 JANUARY 2010 TO 31 MARCH 2012
Note Share Retained Total capital profi ts equity $ $ $
2012
Beginning of fi nancial year 100,000 1,550,000 1,650,000
Total comprehensive income – 3,035,000 3,035,000
Dividends paid 16 – (2,250,000) (2,250,000)
End of fi nancial year 100,000 2,335,000 2,435,000
2011
Beginning of fi nancial period 100,000 2,281,000 2,381,000
Total comprehensive income – 2,769,000 2,769,000
Dividends paid 16 – (3,500,000) (3,500,000)
End of fi nancial period 100,000 1,550,000 1,650,000
Note Share Retained Total
capital profi ts equity
Rs.crore Rs.crore Rs.crore
2012
Beginning of fi nancial year 0.35 5.48 5.83
Total comprehensive income – 12.39 12.39
Dividends paid 16 – (9.19) (9.19)
End of fi nancial year 0.41 9.53 9.94
2011
Beginning of fi nancial period 0.33 7.57 7.91
Total comprehensive income – 9.79 9.79
Dividends paid 16 – (12.37) (12.37)
End of fi nancial period 0.35 5.48 5.83
Notes: The exchange rate used to convert SGD to Rs. <40.829> / <SGD> (Rs. <35.357> / <SGD>)
“The columns in INR are not part of the audited fi nancial statements and the audit opinion does not apply to them.”
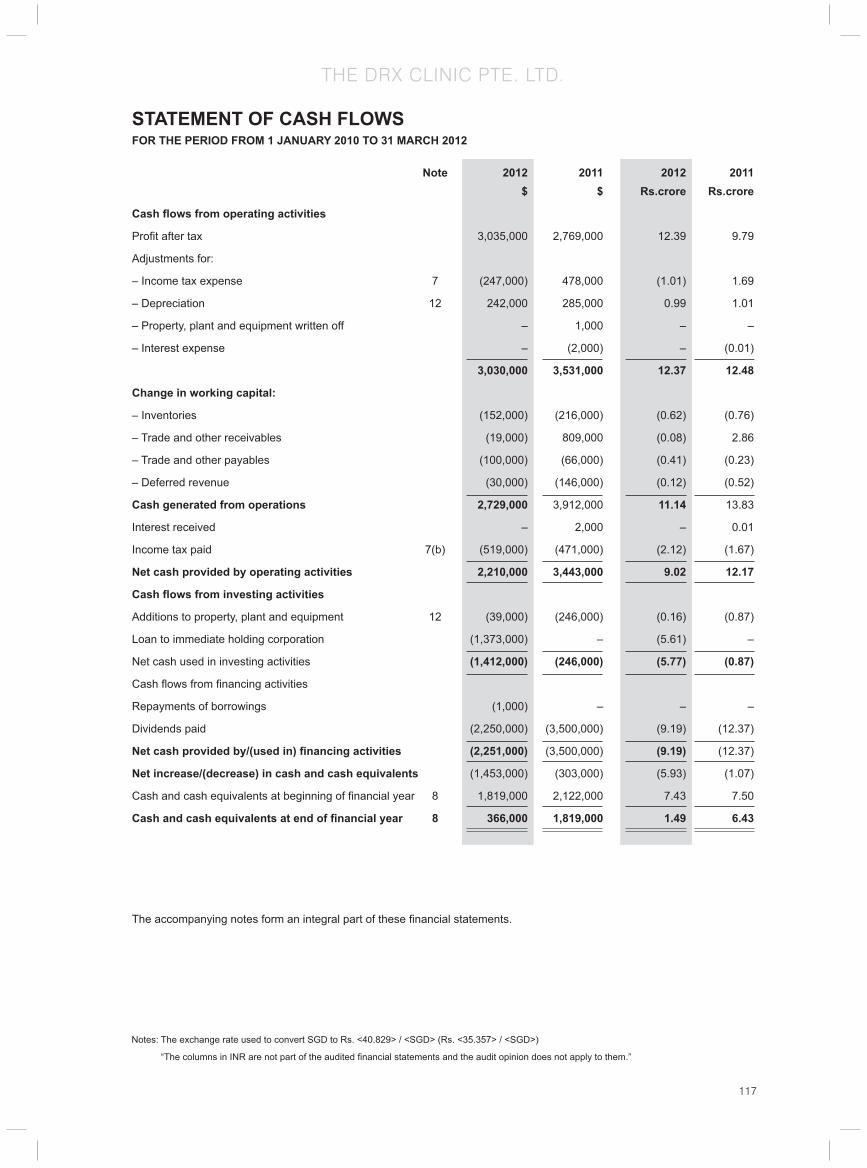
117
THE DRX CLINIC PTE. LTD.
STATEMENT OF CASH FLOWSFOR THE PERIOD FROM 1 JANUARY 2010 TO 31 MARCH 2012
Note 2012 2011 2012 2011 $ $ Rs.crore Rs.crore
Cash fl ows from operating activities
Profi t after tax 3,035,000 2,769,000 12.39 9.79
Adjustments for:
– Income tax expense 7 (247,000) 478,000 (1.01) 1.69
– Depreciation 12 242,000 285,000 0.99 1.01
– Property, plant and equipment written off – 1,000 – –
– Interest expense – (2,000) – (0.01)
3,030,000 3,531,000 12.37 12.48
Change in working capital:
– Inventories (152,000) (216,000) (0.62) (0.76)
– Trade and other receivables (19,000) 809,000 (0.08) 2.86
– Trade and other payables (100,000) (66,000) (0.41) (0.23)
– Deferred revenue (30,000) (146,000) (0.12) (0.52)
Cash generated from operations 2,729,000 3,912,000 11.14 13.83
Interest received – 2,000 – 0.01
Income tax paid 7(b) (519,000) (471,000) (2.12) (1.67)
Net cash provided by operating activities 2,210,000 3,443,000 9.02 12.17
Cash fl ows from investing activities
Additions to property, plant and equipment 12 (39,000) (246,000) (0.16) (0.87)
Loan to immediate holding corporation (1,373,000) – (5.61) –
Net cash used in investing activities (1,412,000) (246,000) (5.77) (0.87)
Cash fl ows from fi nancing activities
Repayments of borrowings (1,000) – – –
Dividends paid (2,250,000) (3,500,000) (9.19) (12.37)
Net cash provided by/(used in) fi nancing activities (2,251,000) (3,500,000) (9.19) (12.37)
Net increase/(decrease) in cash and cash equivalents (1,453,000) (303,000) (5.93) (1.07)
Cash and cash equivalents at beginning of fi nancial year 8 1,819,000 2,122,000 7.43 7.50
Cash and cash equivalents at end of fi nancial year 8 366,000 1,819,000 1.49 6.43
The accompanying notes form an integral part of these fi nancial statements.
Notes: The exchange rate used to convert SGD to Rs. <40.829> / <SGD> (Rs. <35.357> / <SGD>)
“The columns in INR are not part of the audited fi nancial statements and the audit opinion does not apply to them.”

118
THE DRX CLINIC PTE. LTD.
NOTES TO THE FINANCIAL STATEMENTS For the year ended 31 March, 2012
These notes form an integral part and should be read in conjunction with the accompanying fi nancial statements.
1. GENERAL INFORMATION
The Company is incorporated and domiciled in Singapore. The address of its registered offi ce is 213 Henderson Road, #01–08 Henderson Industrial Park, Singapore 159553.
The principal activities of the Company are those of clinical services and other general western medical services.
The Company’s principal place of business is located at 302 Orchard Road, #16–02, Tong Building, Singapore 238862
2. SIGNIFICANT ACCOUNTING POLICIES
2.1 Basis of preparation
The fi nancial statements have been prepared in accordance with Singapore Financial Reporting Standards (“FRS”). The fi nancial statements have been prepared under the historical cost convention, except as disclosed in the accounting policies below.
The preparation of these fi nancial statements in conformity with FRS requires management to exercise its judgement in the process of applying the Company’s accounting policies. It also requires the use of certain critical accounting estimates and assumptions. There are no areas the fi nancial statements which involve the application of signifi cant estimates or judgement.
In 2010 the directors of the Company decided to change the fi nancial year end of the Company to 31 March. Accordingly, in these fi nancial statements, prior period comparatives are presented for the 15 months period ended 31 March 2011 and consequently the comparative amounts in the fi nancial statements are not entirely comparable.
Interpretations and amendments to published standards effective in 2011
On 1 April 2011, the Company adopted the new or amended FRS and Interpretations to FRS (“INT FRS”) that are mandatory for application from that date. Changes to the Company’s accounting policies have been made as required, in accordance with the transitional provisions in the respective FRS and INT FRS.
The adoption of these new or amended FRS and INT FRS did not result in substantial changes to the Company’s accounting policies and had no material effect on the amounts reported for the current or prior fi nancial years.
2.2 Revenue recognition
(a) Sale of goods
Sale of goods comprises the fair value of the consideration received or receivable for the sale of goods in the ordinary course of the Company’s activities.
Sales are recognised when the Company has delivered the products to the customers, the customers have accepted the products and the collectability of the related receivables is reasonably assured. Sales are presented, net of goods and services tax, rebates and discounts.
(b) Rendering of services
Services income is recognised when services are rendered and accepted by customers.
Collections from service packages are deferred and recognised as revenue as and when the services due provided to customers. Unused service packages are included in the balance sheet as deferred income.
(c) Interest income
Interest income is recognised using the effective interest method.

119
THE DRX CLINIC PTE. LTD.
2.3 Employee compensation
(a) Defi ned contribution plans
The Company’s contributions to defi ned contribution plans are recognised as employee compensation expense when the contributions are due, unless they can be capitalised as an asset.
(b) Employee leave entitlement
Employee entitlements to annual leave are recognised when they accrue to employees. A provision is made for the estimated liability for annual leave as a result of services rendered by employees up to the balance sheet date.
2.4 Operating lease payments
Payments made under operating leases (net of any incentives received from the lessors) are recognised in profi t or loss on a straight–line basis over the period of the lease.
Contingent rents are recognised as an expense in profi t or loss when incurred.
2.5 Income taxes
Current income tax is recognised at the amount expected to be paid to or recovered from the tax authorities.
Deferred income tax is recognised for all temporary differences except when the deferred income tax arises from the initial recognition of an asset or liability that affects neither accounting nor taxable profi t or loss at the time of the transaction.
Current and deferred income tax is measured using the tax rates and tax laws that have been enacted or substantively enacted by the balance sheet date, and are recognised as income or expenses in profi t or loss, except to the extent that the tax arises from a transaction which is recognised directly in equity.
2.6 Inventories
Inventories are carried at the lower of cost and net realisable value. Cost is determined using weighted average method. Net realisable value is the estimated selling price in the ordinary course of business, less the estimated costs necessary to make the sale. During the fi nancial year, the basis of measuring cost of inventories have been changed from fi rst–in fi rst–out basis to weighted average loans. The impact of this change is immaterial.
2.7 Plant and equipment
Plant and equipment are recognised at cost less accumulated depreciation and accumulated impairment losses.
Subsequent expenditure relating to plant and equipment that has already been recognised is added to the carrying amount of the asset only when it is probable that future economic benefi ts associated with the item will fl ow to the Company and the cost of the item can be measured reliably.
Depreciation is calculated using the straight–line method to allocate depreciable amounts over their estimated useful lives. The estimated useful lives are as follows:
Useful lives
Computers 3 years
Furniture and fi ttings 3 years
Offi ce equipment 3 years
Renovations 3 years
Medical equipment 3 years
NOTES TO THE FINANCIAL STATEMENTS For the year ended 31 March, 2012

120
THE DRX CLINIC PTE. LTD.
The residual values, estimated useful lives and depreciation method of property, plant and equipment are reviewed, and adjusted as appropriate, at each balance sheet date. The effects of any revision are recognised in profi t or loss when the changes arise.
2.8 Impairment of non–fi nancial assets
Plant and equipment are reviewed for impairment whenever there is any indication that these assets may be impaired.
If the recoverable amount of the asset is estimated to be less than its carrying amount, the carrying amount of the asset is reduced to its recoverable amount. The difference between the carrying amount and recoverable amount is recognised as an impairment loss in profi t or loss.
An impairment loss for an asset is reversed if, and only if, there has been a change in the estimates used to determine the asset’s recoverable amount since the last impairment loss was recognised. The carrying amount of this asset is increased to its revised recoverable amount, provided that this amount does not exceed the carrying amount that would have been determined (net of accumulated depreciation) had no impairment loss been recognised for the asset in prior years. A reversal of impairment loss for an asset is recognised in profi t or loss.
2.9 Loans and receivables
Cash and cash equivalent
Trade and other receivables
Loan to immediate holding corporation
Cash and cash equivalent, trade and other receivables and loan to immediate holding corporation are initially recognised at their fair values plus transaction costs and subsequently carried at amortised cost using the effective interest method, less accumulated impairment losses.
The Company assesses at each balance sheet date whether there is objective evidence that these fi nancial assets are impaired and recognises an allowance for impairment when such evidence exists. Signifi cant fi nancial diffi culties of the debtor, probability that the debtor will enter bankruptcy and default or signifi cant delay in payments are objective evidence that these fi nancial assets are impaired.
The carrying amount of these assets is reduced through the use of an impairment allowance account which is calculated as the difference between the carrying amount and the present value of estimated future cash fl ows, discounted at the original effective interest rate.
These assets are presented as current assets except for those that are expected to be realised later than 12 months after the balance sheet date, which are presented as non–current assets.
2.10 Trade and other payables
Trade and other payables represent unpaid liabilities for goods and services provided to the Company prior to the end of fi nancial year. They are classifi ed as current liabilities if payment is due within one year or less (or in the normal operating cycle of the business, if longer). If not, they are presented as non–current liabilities.
Trade and other payables are initially recognised at fair value, and subsequently carried at amortised cost using the effective interest method.
2.11 Borrowings
Borrowings are initially recognised at their fair values (net of transaction costs) and subsequently carried at amortised cost. Any difference between the proceeds (net of transaction costs) and the redemption value is recognised in profi t or loss over the period of the borrowings using the effective interest method.
NOTES TO THE FINANCIAL STATEMENTS For the year ended 31 March, 2012
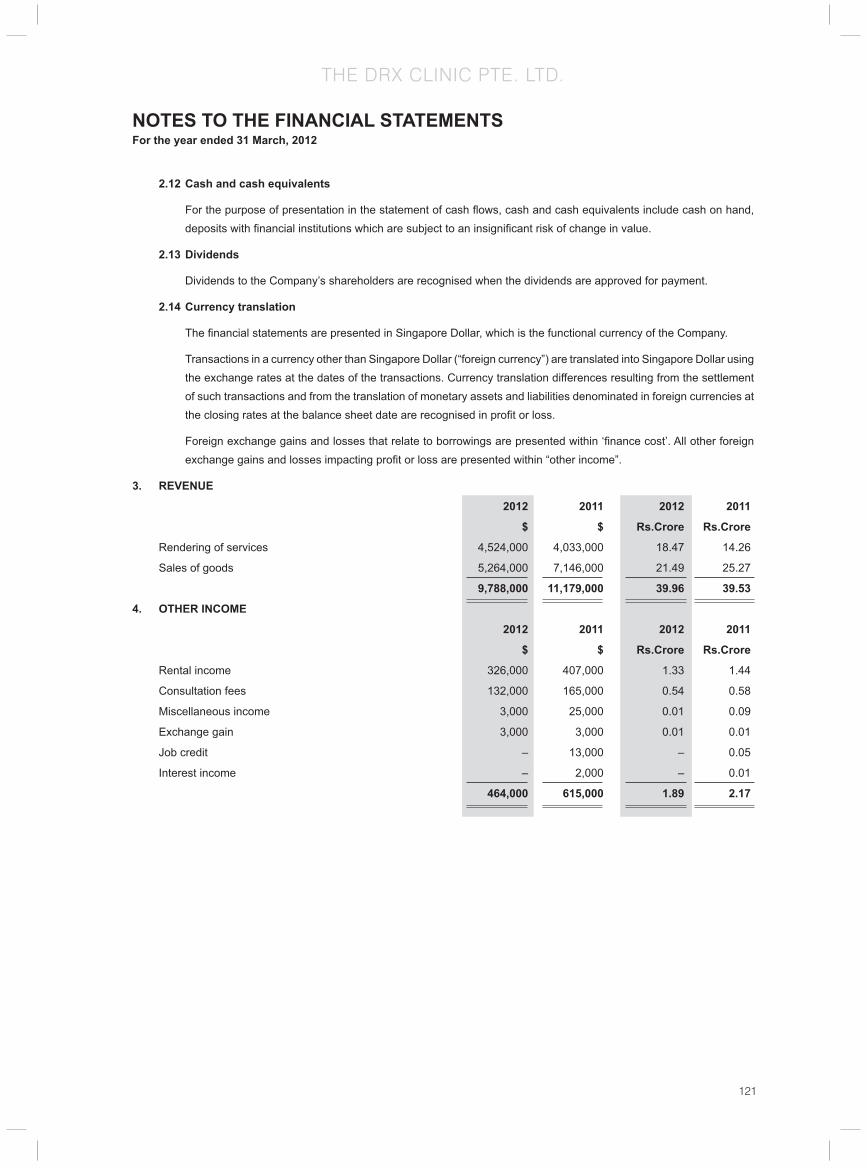
121
THE DRX CLINIC PTE. LTD.
2.12 Cash and cash equivalents
For the purpose of presentation in the statement of cash fl ows, cash and cash equivalents include cash on hand, deposits with fi nancial institutions which are subject to an insignifi cant risk of change in value.
2.13 Dividends
Dividends to the Company’s shareholders are recognised when the dividends are approved for payment.
2.14 Currency translation
The fi nancial statements are presented in Singapore Dollar, which is the functional currency of the Company.
Transactions in a currency other than Singapore Dollar (“foreign currency”) are translated into Singapore Dollar using the exchange rates at the dates of the transactions. Currency translation differences resulting from the settlement of such transactions and from the translation of monetary assets and liabilities denominated in foreign currencies at the closing rates at the balance sheet date are recognised in profi t or loss.
Foreign exchange gains and losses that relate to borrowings are presented within ‘fi nance cost’. All other foreign exchange gains and losses impacting profi t or loss are presented within “other income”.
3. REVENUE
2012 2011 2012 2011
$ $ Rs.Crore Rs.Crore
Rendering of services 4,524,000 4,033,000 18.47 14.26
Sales of goods 5,264,000 7,146,000 21.49 25.27
9,788,000 11,179,000 39.96 39.53
4. OTHER INCOME
2012 2011 2012 2011
$ $ Rs.Crore Rs.Crore
Rental income 326,000 407,000 1.33 1.44
Consultation fees 132,000 165,000 0.54 0.58
Miscellaneous income 3,000 25,000 0.01 0.09
Exchange gain 3,000 3,000 0.01 0.01
Job credit – 13,000 – 0.05
Interest income – 2,000 – 0.01
464,000 615,000 1.89 2.17
NOTES TO THE FINANCIAL STATEMENTS For the year ended 31 March, 2012

122
THE DRX CLINIC PTE. LTD.
5. EXPENSES BY NATURE
2012 2011 2012 2011
$ $ Rs.Crore Rs.Crore
Purchases of inventories 2,685,000 3,198,000 10.96 11.31
Depreciation of property, plant and equipment 242,000 285,000 0.99 1.01
(Note 12) – – – –
Employee compensation (Note 6) 2,225,000 2,836,000 9.08 10.03
Advertising expense 4,000 9,000 0.02 0.03
Professional fee 11,000 10,000 0.04 0.04
Rental on operating leases 627,000 795,000 2.56 2.81
Transportation expense 16,000 6,000 0.07 0.02
Royalty 1,350,000 1,099,000 5.51 3.89
Bank charge 171,000 159,000 0.70 0.56
Other expenses 133,000 150,000 0.54 0.53
Total cost of sales, distribution and marketing costs and administrative expenses 7,464,000 8,547,000 30.47 30.22
6. EMPLOYEE COMPENSATION
2012 2011 2012 2011
$ $ Rs.Crore Rs.Crore
Wages and salaries 2,038,000 2,635,000 8.32 9.32
Employer’s contribution to Central Provident Fund 152,000 173,000 0.62 0.61
Other benefi ts 35,000 28,000 0.14 0.10
2,225,000 2,836,000 9.08 10.03
7. INCOME TAX
(a) Income tax expense
2012 2011 2012 2011
$ $ Rs.Crore Rs.Crore
Tax expense attributable to profi t is made up of:
– Current income tax 84,000 461,000 0.34 1.63
– Deferred income tax (Note 14) – 17,000 – 0.06
84,000 478,000 0.34 1.69
Under/(over) provision in preceding fi nancial years – –
– Current income tax (331,000) – (1.35) –
(247,000) 478,000 (1.01) 1.69
The tax on profi t before tax differs from the theoretical amount that would arise using the Singapore standard rate of income tax as follows:
NOTES TO THE FINANCIAL STATEMENTS For the year ended 31 March, 2012

123
THE DRX CLINIC PTE. LTD.
2012 2011 2012 2011
$ $ Rs.Crore Rs.Crore
Profi t before tax 2,788,000 3,247,000 11.38 11.48
Tax calculated at tax rate of 17% (2011: 17%) 474,000 552,000 1.94 1.95
Effects of:
- Statutory stepped income exemption (26,000) (26,000) (0.11) (0.09)
- Expenses not deductible for tax purposes 43,000 14,000 0.18 0.05
- Utilisation of group losses (394,000) (78,000) (1.61) (0.28)
- Deferred tax liabilities previously not recognised – 49,000 – 0.17
- Income not subject to tax (13,000) (33,000) (0.05) (0.12)
Tax charge 84,000 478,000 0.34 1.69
(b) Movements in current income tax liabilities
2012 2011 2012 2011
$ $ Rs.Crore Rs.Crore
Beginning of fi nancial year 753,000 764,000 3.07 2.70
Income tax paid (519,000) (471,000) (2.12) (1.67)
Tax payable on profi t for current fi nancial year 84,000 460,000 0.34 1.63
Overprovision in preceding fi nancial years (331,000) – (1.35) –
End of fi nancial year (13,000) 753,000 (0.05) 2.66
8 Cash and cash equivalents
2012 2011 2012 2011
$ $ Rs.Crore Rs.Crore
Cash at bank and on hand 366,000 1,819,000 1.49 6.43
2012 2011 2012 2011
$ $ Rs.Crore Rs.Crore
Cash and bank deposits (as above) 366,000 1,819,000 1.49 6.43
Cash and cash equivalents per statement of cash fl ows 366,000 1,819,000 1.49 6.43
9 Trade and other Receivables
2012 2011 2012 2011
$ $ Rs.Crore Rs.Crore
Trade receivables 82,000 68,000 0.33 0.24
Less: Allowance for impairment of receivables – (6,000) – (0.02)
Trade receivables - net 82,000 62,000 0.33 0.22
Other receivables 181,000 182,000 0.74 0.64
263,000 244,000 1.07 0.86
NOTES TO THE FINANCIAL STATEMENTS For the year ended 31 March, 2012
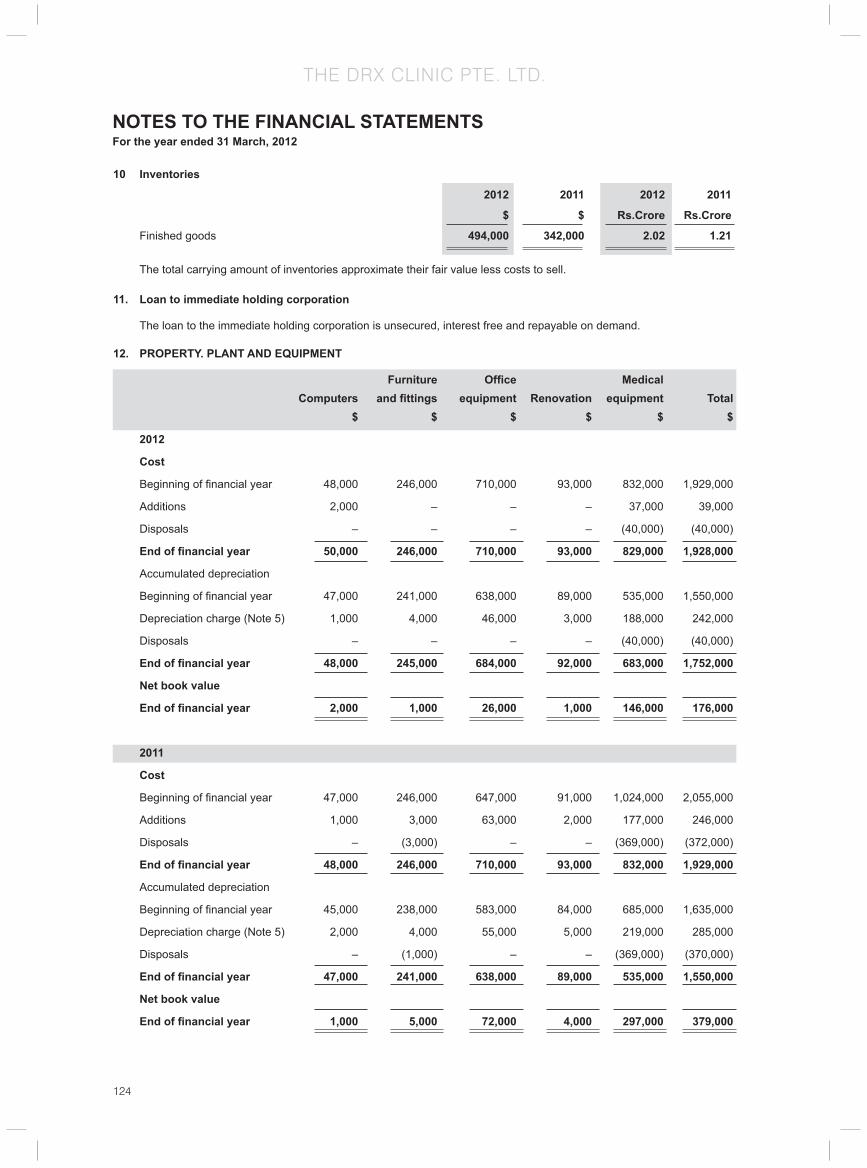
124
THE DRX CLINIC PTE. LTD.
10 Inventories
2012 2011 2012 2011
$ $ Rs.Crore Rs.Crore
Finished goods 494,000 342,000 2.02 1.21
The total carrying amount of inventories approximate their fair value less costs to sell.
11. Loan to immediate holding corporation
The loan to the immediate holding corporation is unsecured, interest free and repayable on demand.
12. PROPERTY. PLANT AND EQUIPMENT
Furniture Offi ce Medical Computers and fi ttings equipment Renovation equipment Total $ $ $ $ $ $
2012
Cost
Beginning of fi nancial year 48,000 246,000 710,000 93,000 832,000 1,929,000
Additions 2,000 – – – 37,000 39,000
Disposals – – – – (40,000) (40,000)
End of fi nancial year 50,000 246,000 710,000 93,000 829,000 1,928,000
Accumulated depreciation
Beginning of fi nancial year 47,000 241,000 638,000 89,000 535,000 1,550,000
Depreciation charge (Note 5) 1,000 4,000 46,000 3,000 188,000 242,000
Disposals – – – – (40,000) (40,000)
End of fi nancial year 48,000 245,000 684,000 92,000 683,000 1,752,000
Net book value
End of fi nancial year 2,000 1,000 26,000 1,000 146,000 176,000
2011
Cost
Beginning of fi nancial year 47,000 246,000 647,000 91,000 1,024,000 2,055,000
Additions 1,000 3,000 63,000 2,000 177,000 246,000
Disposals – (3,000) – – (369,000) (372,000)
End of fi nancial year 48,000 246,000 710,000 93,000 832,000 1,929,000
Accumulated depreciation
Beginning of fi nancial year 45,000 238,000 583,000 84,000 685,000 1,635,000
Depreciation charge (Note 5) 2,000 4,000 55,000 5,000 219,000 285,000
Disposals – (1,000) – – (369,000) (370,000)
End of fi nancial year 47,000 241,000 638,000 89,000 535,000 1,550,000
Net book value
End of fi nancial year 1,000 5,000 72,000 4,000 297,000 379,000
NOTES TO THE FINANCIAL STATEMENTS For the year ended 31 March, 2012

125
THE DRX CLINIC PTE. LTD.
Furniture Offi ce Medical Computers and fi ttings equipment Renovation equipment Total Rs.Crore Rs.Crore Rs.Crore Rs.Crore Rs.Crore Rs.Crore
2012 Cost
Beginning of fi nancial year 0.17 0.87 2.51 0.33 2.94 6.82
Additions 0.01 – – – 0.15 0.16
Disposals – – – – (0.16) (0.16)
End of fi nancial year 0.20 1.00 2.90 0.38 3.38 7.87
Accumulated depreciation
Beginning of fi nancial year 0.17 0.85 2.26 0.31 1.89 5.48
Depreciation charge (Note 5) – 0.02 0.19 0.01 0.77 0.99
Disposals – – – – (0.16) (0.16)
End of fi nancial year 0.20 1.00 2.79 0.38 2.79 7.15
Net book value
End of fi nancial year 0.01 – 0.11 – 0.60 0.72
2011 Cost Beginning of fi nancial year 0.16 0.82 2.15 0.30 3.40 6.82 Additions – 0.01 0.22 0.01 0.63 0.87 Disposals – (0.01) – – (1.30) (1.32) End of fi nancial year 0.17 0.87 2.51 0.33 2.94 6.82 Accumulated depreciation Beginning of fi nancial year 0.15 0.79 1.94 0.28 2.27 5.43 Depreciation charge (Note 5) 0.01 0.01 0.19 0.02 0.77 1.01 Disposals – – – – (1.30) (1.31) End of fi nancial year 0.17 0.85 2.26 0.31 1.89 5.48 Net book value End of fi nancial year – 0.02 0.25 0.01 1.05 1.34
NOTES TO THE FINANCIAL STATEMENTS For the year ended 31 March, 2012

126
THE DRX CLINIC PTE. LTD.
13 Trade and other payables
2012 2011 2012 2011
$ $ Rs.Crore Rs.Crore
Trade payables to:
- Non-related parties – 12,000 – 0.04
Other accruals for operating expenses 285,000 373,000 1.16 1.32
285,000 385,000 1.16 1.36
14 Deferred income taxes 2012 2011 2012 2011
$ $ Rs.Crore Rs.Crore
Beginning and end of fi nancial year 44,000 27,000 0.18 0.10 Tax (credited)/charged to: - Profi t or loss (Note 7(a)) – 17,000 – 0.06 End of fi nancial year 44,000 44,000 0.18 0.16
15. Share capital
The Company’s share capital comprise fully paid-up 100,000 (2011: 100,000) ordinary shares with no par value, amounting to a total of $100,000 (2011: $100,000).
16 Dividends
2012 2011 2012 2011
$ $ Rs.Crore Rs.Crore
Ordinary dividends paid or proposed First interim dividend paid in respect of current fi nancial year of S$12.50 (2011: S$7) per share 1,250,000 700,000 5.10 2.47 Second interim dividend paid in respect of current fi nancial year of S$5 (2011 S$8) per share 500,000 800,000 2.04 2.83 Third interim dividend paid in respect of current fi nancial year of S$5 (2011: S$20) per share 500,000 2,000,000 2.04 7.07 2,250,000 3,500,000 9.19 12.37
17. Commitments
(a) Operating lease commitments - where the Company is a lessee
The Company leases business premises under non–cancellable operating lease agreements. The leases have varying terms, escalation clauses and renewal rights.
The future minimum lease payables under non–cancellable operating leases contracted for at the balance sheet date but not recognised as liabilities, are as follows:
2012 2011 2012 2011
$ $ Rs.Crore Rs.Crore
Not later than one year 627,000 380,000 2.56 1.34 Between one and fi ve years 1,046,000 – 4.27 – 1,673,000 380,000 6.83 1.34
(b) Operating lease commitments – where the Company is a lessor
The Company sublets business premises to associated companies under non–cancellable operating lease agreements. The leases have varying terms, escalation clauses and renewal rights.
NOTES TO THE FINANCIAL STATEMENTS For the year ended 31 March, 2012

127
THE DRX CLINIC PTE. LTD.
The future minimum lease payables under non–cancellable operating leases contracted for at the balance sheet date but not recognised as assets, are as follows:
2012 2011 2012 2011
$ $ Rs.Crore Rs.Crore
Not later than one year 326,000 190,000 1.33 0.67
Between one and fi ve years 543,000 – 2.22 –
869,000 190,000 3.55 0.67
18. Financial risk management
Financial risk factors
The company is exposed to fi nancial risks arising from its operations and the use of fi nancial instruments. The key fi nancial risks are credit risk, foreign exchange risk, interest rate risk and liquidity risk. The management reviews and agrees on policies for managing each of these risks and they are summarised below:
(a) Credit risk
Credit risk is the potential risk of fi nancial loss resulting from the failure of customers or other counterparties to settle their fi nancial and contractual obligations to the company as and when they fall due.
The company’s exposure to credit risk arises primarily from trade and other receivables (including amounts owing by related parties). For other fi nancial assets (including cash and cash equivalents), the company minimises credit risk by dealing with high credit rating counterparties.
Management regularly monitors credit risk exposure to customers.
Management believes that concentration of credit risk is limited due to ongoing credit evaluations on all customers and, where necessary, maintaining an allowance for doubtful receivables which will adequately provide for potential credit risks.
Financial assets that are past due but not impaired
The company has trade receivables that are past due but not impaired. These trade receivables are unsecured and the analysis of their aging at balance sheet date is as follows:
Trade receivables past due:
2012 2011 2012 2011
$ $ Rs.Crore Rs.Crore
1 to 30 days 82,000 62,000 0.33 0.22
During the year the company has not impaired any trade receivables.
(b) Market risk
(i) Currency risk
The company does not have signifi cant foreign currency transactions, thus the net exposure is not expected to be signifi cant.
(ii) Interest rate risk
Interest rate risk is the risk that the fair value or future cash fl ows of the company’s fi nancial instruments will fl uctuate because of changes in market interest rates.
NOTES TO THE FINANCIAL STATEMENTS For the year ended 31 March, 2012

128
THE DRX CLINIC PTE. LTD.
The company does not have any interest–bearing fi nancial liabilities. Its only exposure to changes in interest rates relates to interest–earning bank deposits. The company monitors movements in interest rates to ensure deposits are placed with fi nancial institutions offering optimal rates of return.
(c) Liquidity risk
Liquidity risk is the risk that the company will encounter diffi culty in meeting fi nancial obligations due to shortage of funds.
The company monitors its liquidity risk by maintaining a level of cash and cash equivalents deemed adequate to fi nance the company’s operations and to mitigate the effects of fl uctuations in cash fl ows.
All fi nancial liabilities of the company are repayable on demand or mature within one year.
(d) Capital risk
The Company’s objectives when managing capital are to ensure that the Company is adequately capitalised and to maintain an optimal capital structure by issuing or redeeming additional equity and debt instruments when necessary.
The Company is not subject to any externally imposed capital requirements.
There were no changes to the Company’s approach to capital management during the year.
(e) Fair value of fi nancial assets and liabilities
The carrying amounts of cash and cash equivalents, receivables and payables approximate their fair values due to their short term nature.
19. Immediate and ultimate holding corporation
The Company’s immediate holding corporation is Derma–Rx International Aesthetics Pte Ltd, incorporated in Singapore. The ultimate and intermediate holding corporation are Marico Limited and Kaya Limited respectively, both incorporated in India.
20. Related party transactions
In addition to the information disclosed elsewhere in the fi nancial statements, the following transactions took place between the Company and related parties at terms agreed between the parties:
(a) Sales and purchase of goods and services
2012 2011 2012 2011
$ $ Rs.Crore Rs.Crore
(i) With immediate holding company
Purchases 1,992,000 152,000 8.13 0.54
Royalty fees 1,350,000 1,099,000 5.51 3.89
Dividend paid 2,250,000 3,500,000 9.19 12.37
(ii) With fellow subsidiaries
Sales 870,000 570,000 3.55 2.02
Rental Income 326,000 407,000 1.33 1.44
Consultation fee income 132,000 165,000 0.54 0.58
Misc Income 2,000 – 0.01 –
Purchases 35,000 2,482,000 0.14 8.78
Purchase of property, plant and equipment – 2,000 – 0.01
Rental expenses – 11,000 – 0.04
Balances with related parties at the balance sheet date are unsecured and receivable/payable on demand.
NOTES TO THE FINANCIAL STATEMENTS For the year ended 31 March, 2012

129
THE DRX CLINIC PTE. LTD.
(b) Key management personnel compensation
Employees benefi ts expense includes key management personnel compensation is as follows:
2012 2011 2012 2011
$ $ Rs.Crore Rs.Crore
Short-term employee benefi ts
- Directors’ remuneration 616,000 703,000 2.52 2.49
- Other key management personnel 34,000 50,000 0.14 0.18
650,000 753,000 2.65 2.66
21. New or revised accounting standards and interpretations
Certain new accounting standards, amendments and interpretations to existing standards have been published, that are mandatory for accounting periods beginning on or after 1 April 2012.
The Company does not expect that adoption of these accounting standards on interpretations will have a material impact on the Company’s fi nancial statements.
22. Authorisation of fi nancial statements
These fi nancial statements were authorised for issue in accordance with a resolution of the Board of Directors of The DRx Clinic Pte Ltd on 3 July 2012.
NOTES TO THE FINANCIAL STATEMENTS For the year ended 31 March, 2012

130
THE DRX MEDISPA PTE. LTD
Board of Directors Ajay Kumar Pahwa
Naveen Duggal
Dr. Tan Siak Khim
Janifer Yeo - Tan
Registered Offi ce 213 Henderson Road,
# 01-08 Henderson Industrial Park,
Singapore - 159553
Factory 302 Orchard Road,
# 16-01 Tong Building
Auditors PricewaterhouseCoopers
Bankers UOB Bank

131
THE DRX MEDISPA PTE. LTD
REPORT OF THE DIRECTORS’ For the fi nancial year ended 31 March 2012
The directors present their report to the members together with the audited fi nancial statements for the fi nancial year ended 31 March 2012.
Directors
The directors in offi ce at the date of this report are as follows:
Dr. Tan Siak Khim
Janifer Yeo – Tan
Ajay Kumar Pahwa
Naveen Duggal
Arrangements to enable directors to acquire shares and debentures
Neither at the end of nor at any time during the fi nancial year was the Company a party to any arrangement whose object was to enable the directors of the Company to acquire benefi ts by means of the acquisition of shares in, or debentures of, the Company or any other body corporate.
Directors’ interests in shares or debentures
According to the register of directors’ shareholdings, none of the directors holding offi ce at the end of the fi nancial year had any interest in the shares or debentures of the Company or its related corporations.
Directors’ contractual benefi ts
Since the end of the previous fi nancial year, no director has received or become entitled to receive a benefi t by reason of a contract made by the Company or a related corporation with the director or with a fi rm of which he is a member or with a company in which he has a substantial fi nancial interest, except as disclosed in the accompanying fi nancial statements and in this report, and except that certain directors receive remuneration as a result of their employment with related corporations.
Share options
No options were granted during the fi nancial year to subscribe for unissued shares of the Company.
No shares were issued during the fi nancial year by virtue of the exercise of options to take up unissued shares of the Company.
There were no unissued shares of the Company under option at the end of the fi nancial year.
Independent auditor
The independent auditor, PricewaterhouseCoopers LLP, has expressed its willingness to accept re appointment.
On behalf of the board,
Naveen Duggal Director
Singapore, 3 July 2012 Janifer Yeo-Tan Director

132
THE DRX MEDISPA PTE. LTD
STATEMENT BY DIRECTORSFor the fi nancial year ended 31 March 2012
In the opinion of the directors,
(a) the fi nancial statements are drawn up so as to give a true and fair view of the state of affairs of the Company as at 31 March 2012 and of the results of the business, changes in equity and cash fl ows of the Company for the fi nancial year then ended; and
(b) at the date of this statement, there are reasonable grounds to believe that, with the continuing fi nancial support from its intermediate holding corporation, the Company will be able to pay its debts as and when they fall due.
On behalf of the board,
Naveen Duggal Director
Singapore, 3 July 2012 Janifer Yeo-Tan Director

133
THE DRX MEDISPA PTE. LTD
INDEPENDENT AUDITOR’S REPORTTO THE MEMBERS OF THE DRx MEDISPA PTE. LTD.
Report on the Financial Statements
We have audited the accompanying fi nancial statements of The DRx Medispa Pte Ltd set out on pages 5 to 25, which comprise the balance sheet as at 31 March 2012, the statement of comprehensive income, the statement of changes in equity and the statement of cash fl ows for the year then ended, and a summary of signifi cant accounting policies and other explanatory information.
Management’s Responsibility for the Financial Statements
Management is responsible for the preparation of fi nancial statements that give a true and fair view in accordance with the provisions of the Singapore Companies Act (the “Act”) and Singapore Financial Reporting Standards, and for devising and maintaining a system of internal accounting controls suffi cient to provide a reasonable assurance that assets are safeguarded against loss from unauthorised use or disposition; and transactions are properly authorised and that they are recorded as necessary to permit the preparation of true and fair profi t and loss accounts and balance sheets and to maintain accountability of assets.
Auditor’s Responsibility
Our responsibility is to express an opinion on these fi nancial statements based on our audit. We conducted our audit in accordance with Singapore Standards on Auditing. Those standards require that we comply with ethical requirements and plan and perform the audit to obtain reasonable assurance about whether the fi nancial statements are free from material misstatement.
An audit involves performing procedures to obtain audit evidence about the amounts and disclosures in the fi nancial statements. The procedures selected depend on the auditor’s judgement, including the assessment of the risks of material misstatement of the fi nancial statements, whether due to fraud or error. In making those risk assessments, the auditor considers internal control relevant to the entity’s preparation of fi nancial statements that give a true and fair view in order to design audit procedures that are appropriate in the circumstances, but not for the purpose of expressing an opinion on the effectiveness of the entity’s internal control. An audit also includes evaluating the appropriateness of accounting policies used and the reasonableness of accounting estimates made by management, as well as evaluating the overall presentation of the fi nancial statements.
We believe that the audit evidence we have obtained is suffi cient and appropriate to provide a basis for our audit opinion.
Opinion
In our opinion, the fi nancial statements of the Company are properly drawn up in accordance with the provisions of the Act and Singapore Financial Reporting Standards so as to give a true and fair view of the state of affairs of the Company as at 31 March 2012, and the results, changes in equity and cash fl ows of the Company for the fi nancial year ended on that date.
Report on Other Legal and Regulatory Requirements
In our opinion, the accounting and other records required by the Act to be kept by the Company have been properly kept in accordance with the provisions of the Act.
PricewaterhouseCoopers LLP
Public Accountants and Singapore, 3 July 2012 Certifi ed Public Accountants
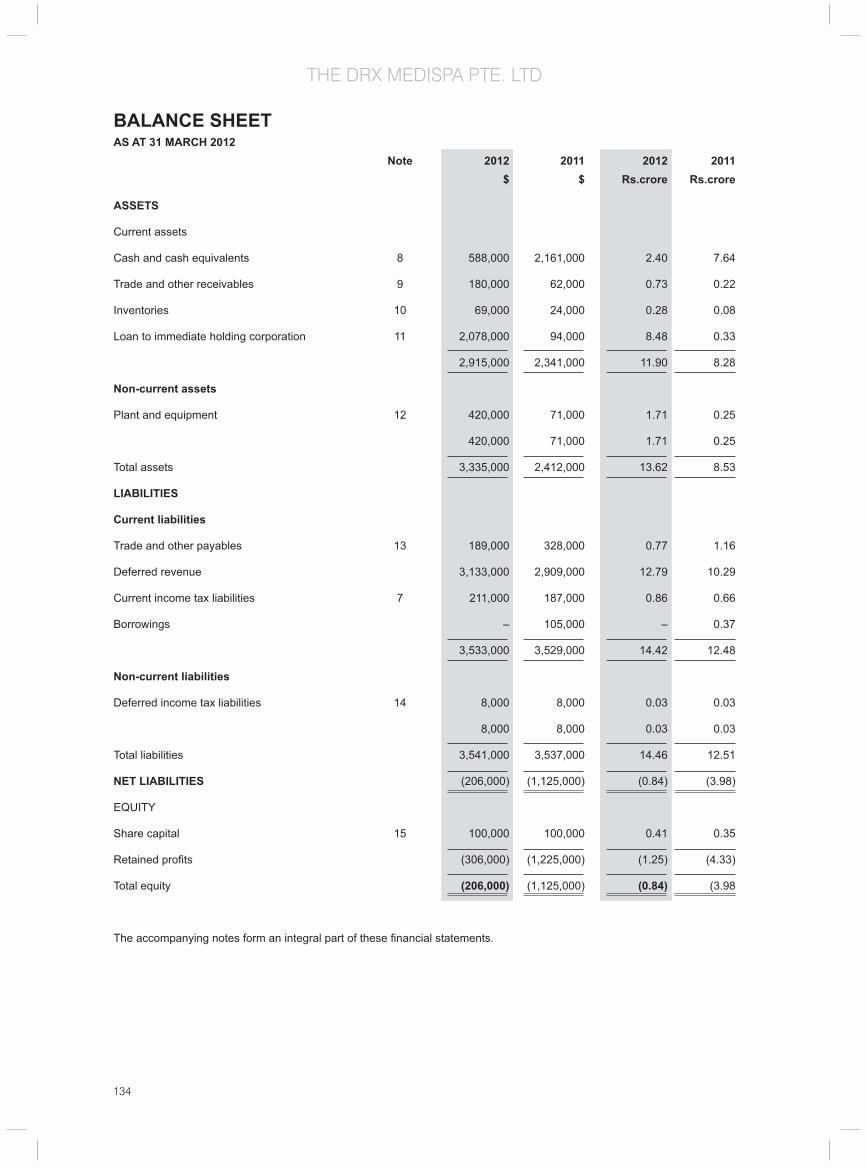
134
THE DRX MEDISPA PTE. LTD
BALANCE SHEET AS AT 31 MARCH 2012 Note 2012 2011 2012 2011 $ $ Rs.crore Rs.crore
ASSETS
Current assets
Cash and cash equivalents 8 588,000 2,161,000 2.40 7.64
Trade and other receivables 9 180,000 62,000 0.73 0.22
Inventories 10 69,000 24,000 0.28 0.08
Loan to immediate holding corporation 11 2,078,000 94,000 8.48 0.33
2,915,000 2,341,000 11.90 8.28
Non-current assets
Plant and equipment 12 420,000 71,000 1.71 0.25
420,000 71,000 1.71 0.25
Total assets 3,335,000 2,412,000 13.62 8.53
LIABILITIES
Current liabilities
Trade and other payables 13 189,000 328,000 0.77 1.16
Deferred revenue 3,133,000 2,909,000 12.79 10.29
Current income tax liabilities 7 211,000 187,000 0.86 0.66
Borrowings – 105,000 – 0.37
3,533,000 3,529,000 14.42 12.48
Non-current liabilities
Deferred income tax liabilities 14 8,000 8,000 0.03 0.03
8,000 8,000 0.03 0.03
Total liabilities 3,541,000 3,537,000 14.46 12.51
NET LIABILITIES (206,000) (1,125,000) (0.84) (3.98)
EQUITY
Share capital 15 100,000 100,000 0.41 0.35
Retained profi ts (306,000) (1,225,000) (1.25) (4.33)
Total equity (206,000) (1,125,000) (0.84) (3.98
The accompanying notes form an integral part of these fi nancial statements.
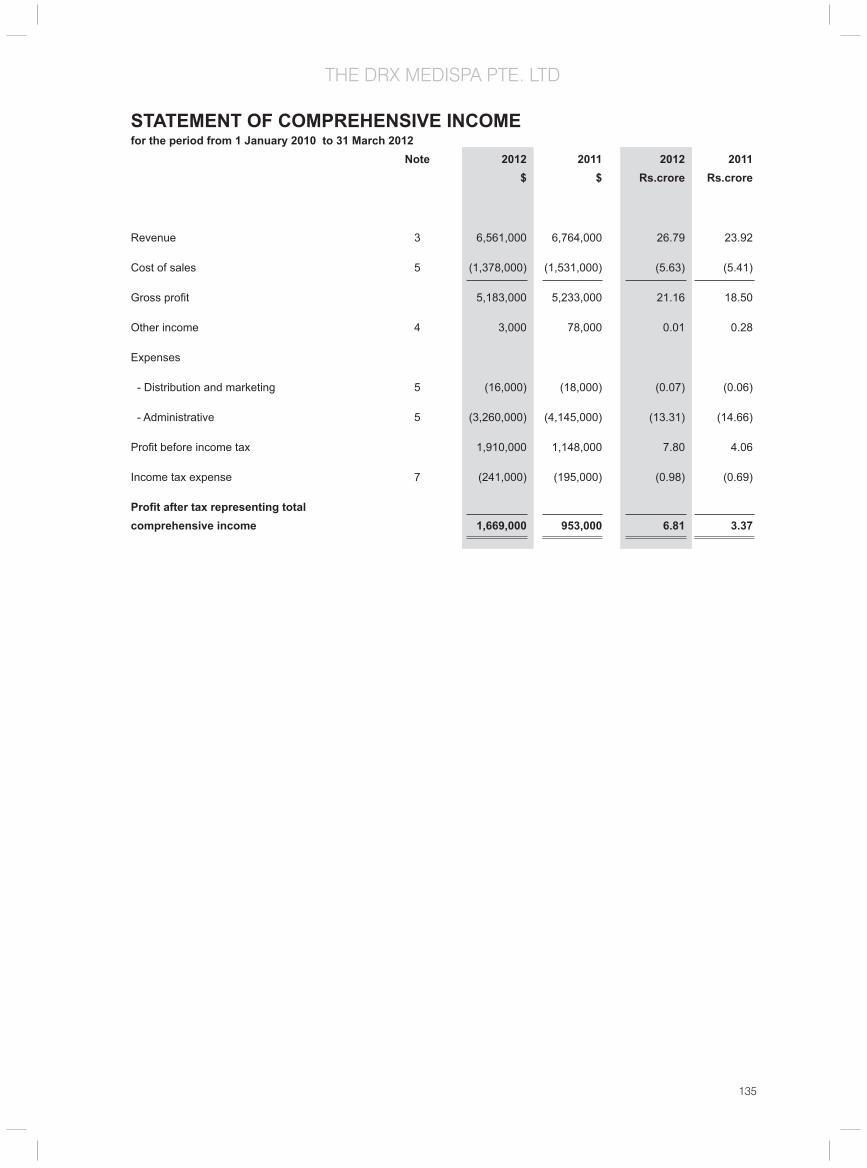
135
THE DRX MEDISPA PTE. LTD
STATEMENT OF COMPREHENSIVE INCOMEfor the period from 1 January 2010 to 31 March 2012 Note 2012 2011 2012 2011 $ $ Rs.crore Rs.crore
Revenue 3 6,561,000 6,764,000 26.79 23.92
Cost of sales 5 (1,378,000) (1,531,000) (5.63) (5.41)
Gross profi t 5,183,000 5,233,000 21.16 18.50
Other income 4 3,000 78,000 0.01 0.28
Expenses
- Distribution and marketing 5 (16,000) (18,000) (0.07) (0.06)
- Administrative 5 (3,260,000) (4,145,000) (13.31) (14.66)
Profi t before income tax 1,910,000 1,148,000 7.80 4.06
Income tax expense 7 (241,000) (195,000) (0.98) (0.69)
Profi t after tax representing total comprehensive income 1,669,000 953,000 6.81 3.37

136
THE DRX MEDISPA PTE. LTD
STATEMENT OF CHANGES IN EQUITYFOR THE PERIOD FROM 1 JANUARY 2010 TO 31 MARCH 2012
Note Share Retained Total capital profi ts equity $ $ $
2012
Beginning of fi nancial year 100,000 (1,225,000) (1,125,000)
Total comprehensive income – 1,669,000 1,669,000
Dividends paid 16 – (750,000) (750,000)
End of fi nancial year 100,000 (306,000) (206,000)
2011
Beginning of fi nancial period 100,000 (2,028,000) (1,928,000)
Total comprehensive income – 953,000 953,000
Dividends paid – ( (150,000) (150,000)
End of fi nancial period 100,000 (1,225,000) (1,125,000)
Note Share Retained Total
capital profi ts equity
Rs.crore Rs.crore Rs.crore
2012
Beginning of fi nancial year 0.35 (4.33) (3.98)
Total comprehensive income – 6.81 6.81
Dividends paid 16 – (3.06) (3.06)
End of fi nancial year 0.41 (1.25) (0.84)
2011
Beginning of fi nancial period 0.33 (6.73) (6.40)
Total comprehensive income – 3.37 3.37
Dividends paid 16 – (0.53) (0.53)
End of fi nancial period 0.02 (4.33) (3.98)
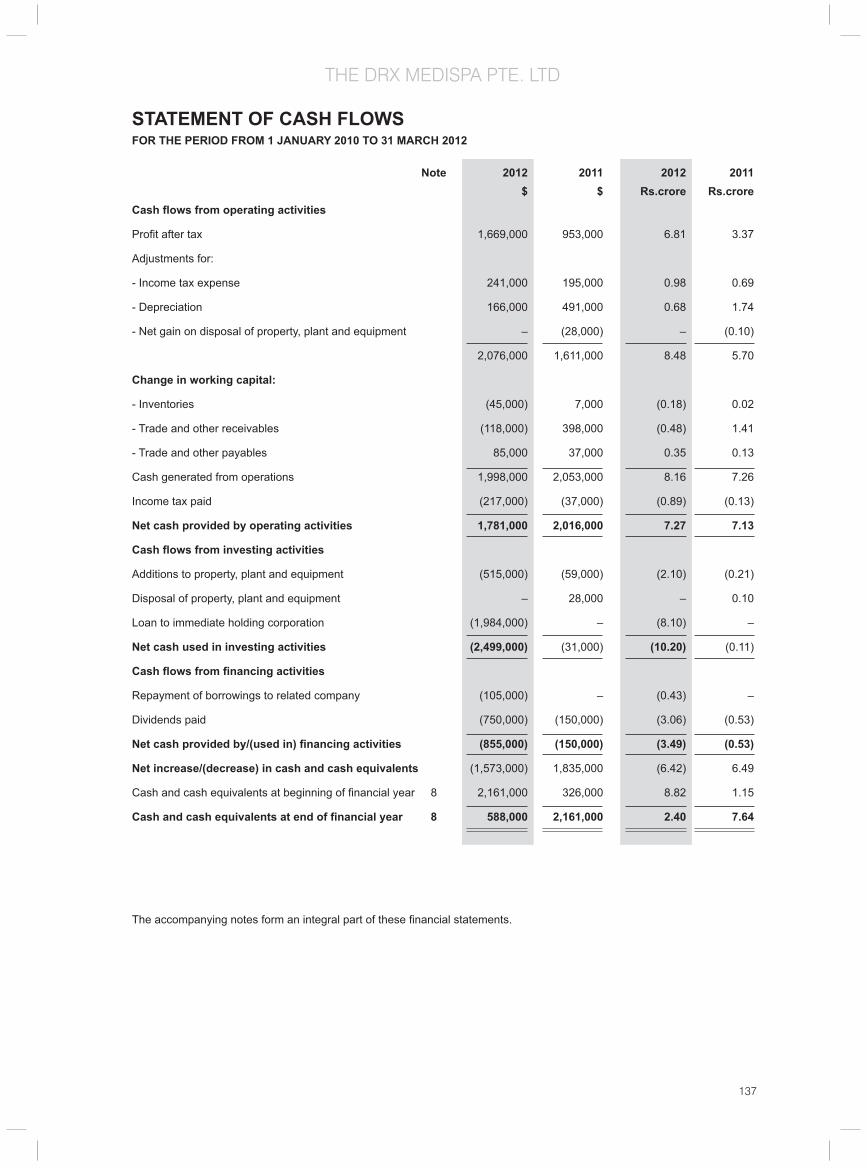
137
THE DRX MEDISPA PTE. LTD
STATEMENT OF CASH FLOWSFOR THE PERIOD FROM 1 JANUARY 2010 TO 31 MARCH 2012
Note 2012 2011 2012 2011 $ $ Rs.crore Rs.croreCash fl ows from operating activities
Profi t after tax 1,669,000 953,000 6.81 3.37
Adjustments for:
- Income tax expense 241,000 195,000 0.98 0.69
- Depreciation 166,000 491,000 0.68 1.74
- Net gain on disposal of property, plant and equipment – (28,000) – (0.10)
2,076,000 1,611,000 8.48 5.70
Change in working capital:
- Inventories (45,000) 7,000 (0.18) 0.02
- Trade and other receivables (118,000) 398,000 (0.48) 1.41
- Trade and other payables 85,000 37,000 0.35 0.13
Cash generated from operations 1,998,000 2,053,000 8.16 7.26
Income tax paid (217,000) (37,000) (0.89) (0.13)
Net cash provided by operating activities 1,781,000 2,016,000 7.27 7.13
Cash fl ows from investing activities
Additions to property, plant and equipment (515,000) (59,000) (2.10) (0.21)
Disposal of property, plant and equipment – 28,000 – 0.10
Loan to immediate holding corporation (1,984,000) – (8.10) –
Net cash used in investing activities (2,499,000) (31,000) (10.20) (0.11)
Cash fl ows from fi nancing activities
Repayment of borrowings to related company (105,000) – (0.43) –
Dividends paid (750,000) (150,000) (3.06) (0.53)
Net cash provided by/(used in) fi nancing activities (855,000) (150,000) (3.49) (0.53)
Net increase/(decrease) in cash and cash equivalents (1,573,000) 1,835,000 (6.42) 6.49
Cash and cash equivalents at beginning of fi nancial year 8 2,161,000 326,000 8.82 1.15
Cash and cash equivalents at end of fi nancial year 8 588,000 2,161,000 2.40 7.64
The accompanying notes form an integral part of these fi nancial statements.

138
THE DRX MEDISPA PTE. LTD
NOTES TO THE FINANCIAL STATEMENTS For the year ended 31 March, 2012
These notes form an integral part of and should be read in conjunction with the accompanying fi nancial statements.
1. GENERAL INFORMATION
The Company is incorporated and domiciled in Singapore. The address of its registered offi ce is 213 Henderson Road, #01-08 Henderson Industrial Park, Singapore 159553.
The principal activities of the Company are to provide therapeutic skin beauty treatments and import and distribute of health and beauty products. The Company’s principal place of business is located at 302 Orchard Road, #14-02/03 & #16-02, Tong Building, Singapore 238862.
As at 31 March 2012, the Company is in capital defi cit. The fi nancial statements have been prepared on a going concern basis due to the fi nancial support from its intermediate holding corporation.
2. SIGNIFICANT ACCOUNTING POLICIES
2.1 Basis of preparation
The fi nancial statements have been prepared in accordance with Singapore Financial Reporting Standards (“FRS”). The fi nancial statements have been prepared under the historical cost convention, except as disclosed in the accounting policies below.
The preparation of these fi nancial statements in conformity with FRS requires management to exercise its judgement in the process of applying the Company’s accounting policies. It also requires the use of certain accounting estimates and assumptions. There are no areas of the fi nancial statements which involve the application of signifi cant estimates or judgement.
In 2010, the directors of the Company decided to change the fi nancial year end of the Company to 31 March. Accordingly, in the fi nancial statements, prior period comparatives are presented for the 15 months period ended 31 March 2011 and consequently the comparative amounts in the fi nancial statements are not entirely comparable.
Interpretations and amendments to published standards effective in 2011
On 1 April 2011, the Company adopted the new or amended FRS and Interpretations to FRS (“INT FRS”) that are mandatory for application from that date. Changes to the Company’s accounting policies have been made as required, in accordance with the transitional provisions in the respective FRS and INT FRS.
The adoption of these new or amended FRS and INT FRS did not result in substantial changes to the Company’s accounting policies and had no material effect on the amounts reported for the current or prior fi nancial years.
2.2 Revenue recognition
(a) Sale of goods
Sale of goods comprises the fair value of the consideration received or receivable for the sale of health and beauty products in the ordinary course of the Company’s activities.
Sales are recognised when the Company has delivered the products to the customers, the customers have accepted the products and the collectability of the related receivables is reasonably assured. Sales are presented, net of goods and services tax, rebates and discounts.
(b) Rendering of services
Service income is recognised when services are rendered and accepted by customers.
Collections from service packages are deferred and recognised as revenue as and when the services due are provided to customers. Unused service packages are included in the balance sheet as deferred income.

139
THE DRX MEDISPA PTE. LTD
(c) Interest income
Interest income is recognised using the effective interest method.
2.3 Employee compensation
(a) Defi ned contribution plans
The Company’s contributions to defi ned contribution plans are recognised as employee compensation expense when the contributions are due, unless they can be capitalised as an asset.
(b) Employee leave entitlement
Employee entitlements to annual leave are recognised when they accrue to employees. A provision is made for the estimated liability for annual leave as a result of services rendered by employees up to the balance sheet date.
2.4 Operating lease payments
Payments made under operating leases (net of any incentives received from the lessors) are recognised in profi t or loss on a straight–line basis over the period of the lease.
Contingent rents are recognised as an expense in profi t or loss when incurred.
2.5 Borrowing costs
Borrowing costs are recognised in profi t or loss using the effective interest method.
2.6 Income taxes
Current income tax is recognised at the amount expected to be paid to or recovered from the tax authorities.
Deferred income tax is recognised for all temporary differences except when the deferred income tax arises from the initial recognition of an asset or liability that affects neither accounting nor taxable profi t or loss at the time of the transaction.
Current and deferred income tax is measured using the tax rates and tax laws that have been enacted or substantively enacted by the balance sheet date, and are recognised as income or expenses in profi t or loss, except to the extent that the tax arises from a transaction which is recognised directly in equity.
2.7 Inventories
Inventories are carried at lower of the cost and net realisable value. Cost is determined using the weighted average method. Net realisable value is the estimated selling price in the ordinary course of business less the estimated cost of completion and the estimated the costs necessary to make the sale. During the fi nancial year, the basis of estimating the cost of inventories was changed from the fi rst-in, fi rst-out basis to the weighted average basis. The impact of this change is immaterial.
2.8 Plant and equipment
All items of plant and equipment are recognised at cost less accumulated depreciation and accumulated impairment losses.
Subsequent expenditure relating to plant and equipment that has already been recognised is added to the carrying amount of the asset only when it is probable that future economic benefi ts associated with the item will fl ow to the Company and the cost of the item can be measured reliably.
Depreciation is calculated using the straight-line method to allocate depreciable amounts over their estimated useful lives. The estimated useful lives are as follows:
NOTES TO THE FINANCIAL STATEMENTS For the year ended 31 March, 2012

140
THE DRX MEDISPA PTE. LTD
Useful lives
Computers 3 years
Furniture and fi ttings 3 years
Offi ce equipment 3 years
Renovations 3 years
Medical equipment 3 years
The residual values, estimated useful lives and depreciation method of property, plant and equipment are reviewed, and adjusted as appropriate, at each balance sheet date. The effects of any revision are recognised in profi t or loss when the changes arise.
2.9 Impairment of non–fi nancial assets
Plant and equipment
Plant and equipment are reviewed for impairment whenever there is any indication that these assets may be impaired.
For the purpose of impairment testing, the recoverable amount (i.e. the higher of the fair value less cost to sell and the value-in-use) is determined on an individual asset basis unless the asset does not generate cash infl ows that are largely independent of those from other assets. If this is the case, the recoverable amount is determined for the CGU to which the asset belongs.
If the recoverable amount of the asset (or CGU) is estimated to be less than its carrying amount, the carrying amount of the asset (or CGU) is reduced to its recoverable amount.
The difference between the carrying amount and recoverable amount is recognised as an impairment loss in profi t or loss.
An impairment loss for an asset is reversed if, and only if, there has been a change in the estimates used to determine the asset’s recoverable amount since the last impairment loss was recognised. The carrying amount of this asset is increased to its revised recoverable amount, provided that this amount does not exceed the carrying amount that would have been determined (net of any accumulated amortisation or depreciation) had no impairment loss been recognised for the asset in prior years. A reversal of impairment loss for an asset is recognised in profi t or loss.en recognised for the asset in prior years. A reversal of impairment loss for an asset is recognised in profi t or loss.
2.10 Loans and receivables
Cash and cash equivalent
Trade and other receivables
Loan to immediate holding corporation
Cash and cash equivalents, trade and other receivables and the loan to the immediate holding corporation are initially recognised at their fair values plus transaction costs and subsequently carried at amortised cost using the effective interest method, less accumulated impairment losses.
The Company assesses at each balance sheet date whether there is objective evidence that these fi nancial assets are impaired and recognises an allowance for impairment when such evidence exists. Signifi cant fi nancial diffi culties of the debtor, probability that the debtor will enter bankruptcy and default or signifi cant delay in payments are objective evidence that these fi nancial assets are impaired.
The carrying amount of these assets is reduced through the use of an impairment allowance account which is calculated as the difference between the carrying amount and the present value of estimated future cash fl ows, discounted at the original effective interest rate.
NOTES TO THE FINANCIAL STATEMENTS For the year ended 31 March, 2012

141
THE DRX MEDISPA PTE. LTD
These assets are presented as current assets except for those that are expected to be realised later than 12 months after the balance sheet date, which are presented as non-current assets.
2.11 Trade and other payables
Trade and other payables represent unpaid liabilities for goods and services provided to the Company prior to the end of fi nancial year. They are classifi ed as current liabilities if payment is due within one year or less (or in the normal operating cycle of the business, if longer). If not, they are presented as non–current liabilities.
Trade and other payables are initially recognised at fair value, and subsequently carried at amortised cost using the effective interest method.
2.12 Borrowings
Borrowings are initially recognised at their fair values (net of transaction costs) and subsequently carried at amortised cost. Any difference between the proceeds (net of transaction costs) and the redemption value is recognised in profi t or loss over the period of the borrowings using the effective interest method.
2.13 Offsetting fi nancial instruments
Financial assets and liabilities are offset and the net amount reported in the balance sheet when there is a legally enforceable right to offset and there is an intention to settle on a net basis or realise the asset and settle the liability simultaneously.
2.14 Cash and cash equivalents
For the purpose of presentation in the statement of cash fl ows, cash and cash equivalents include cash on hand and deposits with fi nancial institutions which are subject to an insignifi cant risk of change in value.
2.15 Dividends
Dividends to the Company’s shareholders are recognised when the dividends are approved for payment.
2.16 Currency translation
The fi nancial statements are presented in Singapore dollars, which is the functional currency of the Company.
Transactions in a currency other than the Singapore dollars (“foreign currency”) are translated into Singapore dollars using the exchange rates at the dates of the transactions. Currency translation differences resulting from the settlement of such transactions and from the translation of monetary assets and liabilities denominated in foreign currencies at the closing rates at the balance sheet date are recognised in profi t or loss.
Foreign exchange gains and losses that relate to borrowings are presented within ‘fi nance cost’. All other foreign exchange gains and losses impacting profi t or loss are presented within ‘other income’.
3. REVENUE
2012 2011 2012 2011
$ $ Rs.Crore Rs.Crore
Rendering of services 5,280,000 5,222,000 21.56 21.32
Sales of goods 1,281,000 1,542,000 5.23 6.30
6,561,000 6,764,000 26.79 27.62
NOTES TO THE FINANCIAL STATEMENTS For the year ended 31 March, 2012

142
THE DRX MEDISPA PTE. LTD
NOTES TO THE FINANCIAL STATEMENTS For the year ended 31 March, 2012
4. OTHER INCOME
2012 2011 2012 2011
$ $ Rs.Crore Rs.Crore
- Misc income 2,000 28,000 0.01 0.10
- Gain on disposal of fi xed asset 1,000 28,000 0.01 0.10
- Jobs credit – 11,000 – 0.04
- Rental income – 11,000 – 0.04
3,000 78,000 0.01 0.28
5. EXPENSES BY NATURE
2012 2011 2012 2011
$ $ Rs.Crore Rs.Crore
Cost of inventories included in cost of sales 1,378,000 1,293,000 5.63 4.57
Depreciation of property, plant and equipment (Note 12) 166,000 491,000 0.68 1.74
Employee compensation (Note 6) 1,788,000 2,154,000 7.30 7.62
Advertising expense 16,000 18,000 0.07 0.06
Rental on operating leases 575,000 1,071,000 2.35 3.79
Audit fees 23,000 10,000 0.09 0.04
Royalty 328,000 238,000 1.34 0.84
Bank charges 160,000 164,000 0.65 0.58
Other expenses 220,000 255,000 0.90 0.90
Total cost of sales, distribution and marketing costs and administrative expenses 4,654,000 5,694,000 19.00 20.13
6. EMPLOYEE COMPENSATION
2012 2011 2012 2011
$ $ Rs.Crore Rs.Crore
Wages and salaries 1,592,000 1,966,000 6.50 6.95
Employer’s contribution to Central Provident Fund 146,000 135,000 0.60 0.48
Other benefi ts 50,000 53,000 0.20 0.19
1,788,000 2,154,000 7.30 7.62

143
THE DRX MEDISPA PTE. LTD
7. INCOME TAX
(a) Income tax expense
2012 2011 2012 2011
$ $ Rs.Crore Rs.Crore
Tax expense attributable to profi t is made up of:
- Current income tax 307,000 187,000 1.25 0.66
- Deferred income tax (Note 14) – 8,000 – 0.03
307,000 195,000 1.25 0.69
Under/(over) provision in preceding fi nancial years
- Current income tax (66,000) – (0.27) –
- Deferred income tax (Note 14) – – – –
241,000 195,000 0.98 0.69
The tax on profi t before tax differs from the theoretical amount that would arise using the Singapore standard rate of income tax as follows:
2012 2011 2012 2011
$ $ Rs.Crore Rs.Crore
Profi t before tax 1,910,000 1,148,000 7.80 4.06
Tax calculated at tax rate of 17% (2011: 17%) 325,000 195,000 1.33 0.69
Effects of:
- statutory stepped income exemption (26,000) (26,000) (0.11) (0.09)
- expenses not deductible for tax purposes 28,000 6,000 0.11 0.02
- income not subject to tax (20,000) (40,000) (0.08) (0.14)
- Utilisation of group losses – (24,000) – (0.08)
- deferred tax previously not recognised – 84,000 – 0.30
Tax charge 307,000 195,000 1.25 0.69
(b) Movements in current income tax liabilities
2012 2011 2012 2011
$ $ Rs.Crore Rs.Crore
Beginning of fi nancial year 187,000 37,000 0.76 0.13
Income tax paid (217,000) (37,000) (0.89) (0.13)
Tax payable on profi t for current fi nancial year 307,000 187,000 1.25 0.66
Overprovision in preceding fi nancial years (66,000) – (0.27) –
End of fi nancial year 211,000 187,000 0.86 0.66
NOTES TO THE FINANCIAL STATEMENTS For the year ended 31 March, 2012
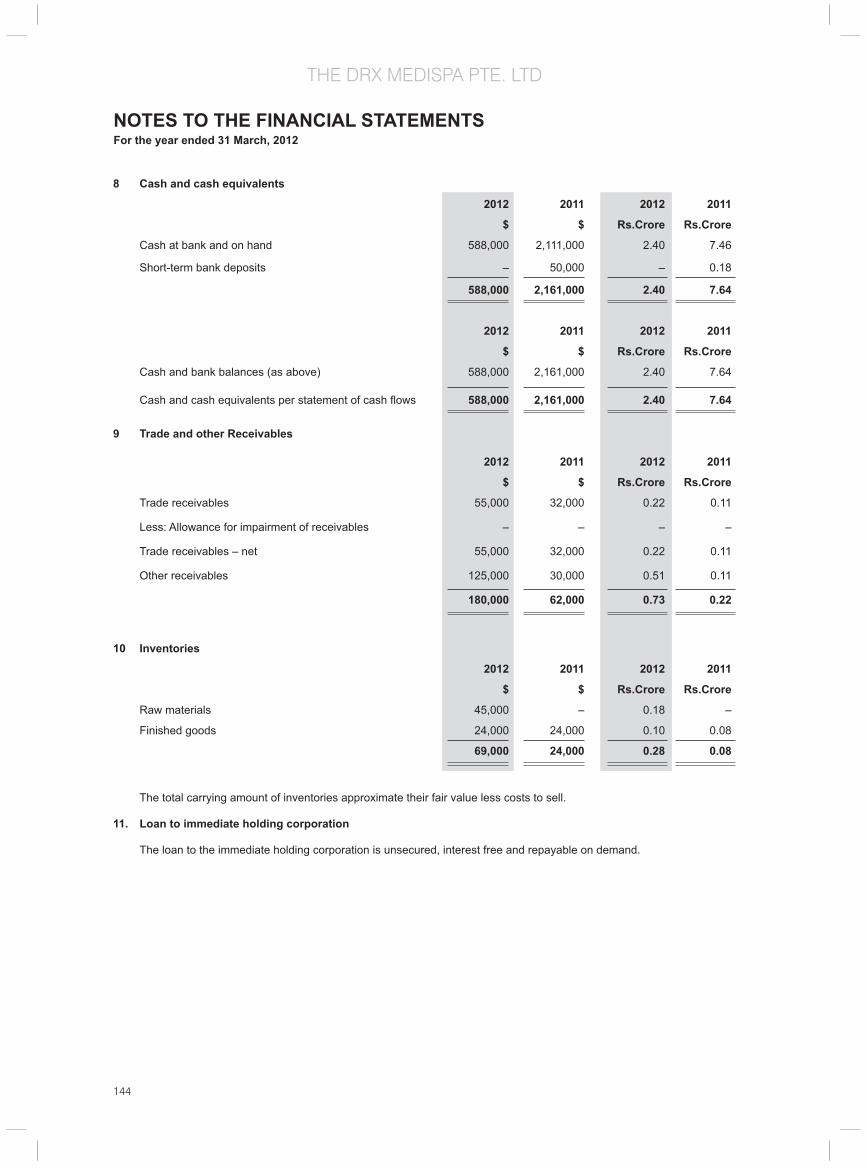
144
THE DRX MEDISPA PTE. LTD
NOTES TO THE FINANCIAL STATEMENTS For the year ended 31 March, 2012
8 Cash and cash equivalents
2012 2011 2012 2011
$ $ Rs.Crore Rs.Crore
Cash at bank and on hand 588,000 2,111,000 2.40 7.46
Short-term bank deposits – 50,000 – 0.18
588,000 2,161,000 2.40 7.64
2012 2011 2012 2011
$ $ Rs.Crore Rs.Crore
Cash and bank balances (as above) 588,000 2,161,000 2.40 7.64
Cash and cash equivalents per statement of cash fl ows 588,000 2,161,000 2.40 7.64
9 Trade and other Receivables
2012 2011 2012 2011
$ $ Rs.Crore Rs.Crore
Trade receivables 55,000 32,000 0.22 0.11
Less: Allowance for impairment of receivables – – – –
Trade receivables – net 55,000 32,000 0.22 0.11
Other receivables 125,000 30,000 0.51 0.11
180,000 62,000 0.73 0.22
10 Inventories
2012 2011 2012 2011
$ $ Rs.Crore Rs.Crore
Raw materials 45,000 – 0.18 –
Finished goods 24,000 24,000 0.10 0.08
69,000 24,000 0.28 0.08
The total carrying amount of inventories approximate their fair value less costs to sell.
11. Loan to immediate holding corporation
The loan to the immediate holding corporation is unsecured, interest free and repayable on demand.

145
THE DRX MEDISPA PTE. LTD
NOTES TO THE FINANCIAL STATEMENTS For the year ended 31 March, 2012
12. PLANT AND EQUIPMENT
Furniture Offi ce Medical Computers and fi ttings equipment Renovation equipment Total $ $ $ $ $ $
2012
Cost
Beginning of fi nancial year 19,000 55,000 299,000 80,000 926,000 1,379,000
Additions – 5,000 407,000 5,000 98,000 515,000
Disposals – – – (17,000) – (17,000)
End of fi nancial year 19,000 60,000 706,000 68,000 1,024,000 1,877,000
Accumulated depreciation
Beginning of fi nancial year 19,000 55,000 288,000 80,000 866,000 1,308,000
Depreciation charge (Note 5) – 1,000 102,000 2,000 61,000 166,000
Disposals – – – (17,000) – (17,000)
End of fi nancial year 19,000 56,000 390,000 65,000 927,000 1,457,000
Net book value
End of fi nancial year – 4,000,000 316,000 3,000 97,000 420,000
Furniture Offi ce Medical Computers and fi ttings equipment Renovation equipment Total
$ $ $ $ $ $ 2011
Cost
Beginning of fi nancial year 22,000 87,000 745,000 92,000 980,000 1,926,000
Additions – – 31,000 – 28,000 59,000
Disposals (3,000) (32,000) (477,000) (12,000) (82,000) (606,000)
End of fi nancial year 19,000 55,000 299,000 80,000 926,000 1,379,000
Accumulated depreciation
Beginning of fi nancial year 19,000 79,000 579,000 81,000 664,000 1,422,000
Depreciation charge (Note 5) 3,000 8,000 186,000 11,000 283,000 491,000
Disposals (3,000) (32,000) (477,000) (12,000) (81,000) (605,000)
End of fi nancial year 19,000 55,000 288,000 80,000 866,000 1,308,000
Net book value
End of fi nancial year – – 11,000 – 60,000 71,000
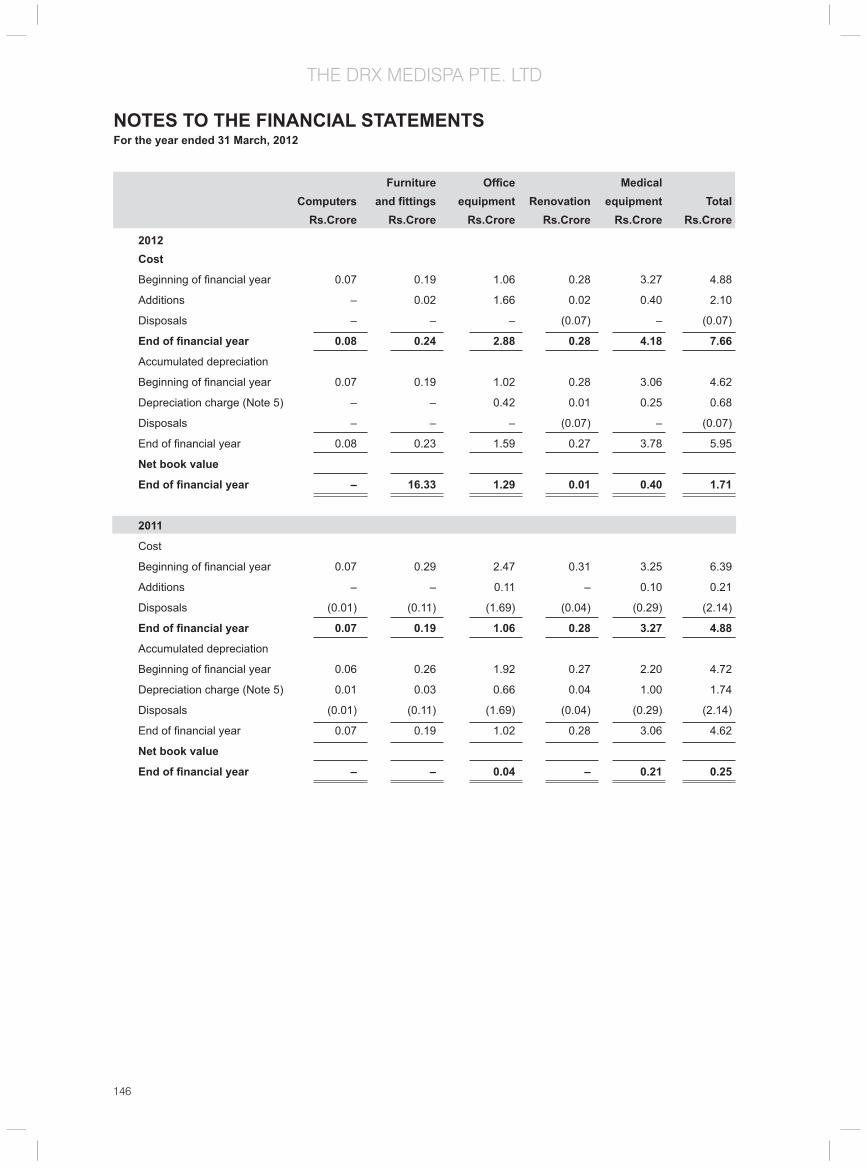
146
THE DRX MEDISPA PTE. LTD
NOTES TO THE FINANCIAL STATEMENTS For the year ended 31 March, 2012
Furniture Offi ce Medical Computers and fi ttings equipment Renovation equipment Total Rs.Crore Rs.Crore Rs.Crore Rs.Crore Rs.Crore Rs.Crore
2012 Cost
Beginning of fi nancial year 0.07 0.19 1.06 0.28 3.27 4.88
Additions – 0.02 1.66 0.02 0.40 2.10
Disposals – – – (0.07) – (0.07)
End of fi nancial year 0.08 0.24 2.88 0.28 4.18 7.66
Accumulated depreciation
Beginning of fi nancial year 0.07 0.19 1.02 0.28 3.06 4.62
Depreciation charge (Note 5) – – 0.42 0.01 0.25 0.68
Disposals – – – (0.07) – (0.07)
End of fi nancial year 0.08 0.23 1.59 0.27 3.78 5.95
Net book value
End of fi nancial year – 16.33 1.29 0.01 0.40 1.71
2011
Cost
Beginning of fi nancial year 0.07 0.29 2.47 0.31 3.25 6.39
Additions – – 0.11 – 0.10 0.21
Disposals (0.01) (0.11) (1.69) (0.04) (0.29) (2.14)
End of fi nancial year 0.07 0.19 1.06 0.28 3.27 4.88
Accumulated depreciation
Beginning of fi nancial year 0.06 0.26 1.92 0.27 2.20 4.72
Depreciation charge (Note 5) 0.01 0.03 0.66 0.04 1.00 1.74
Disposals (0.01) (0.11) (1.69) (0.04) (0.29) (2.14)
End of fi nancial year 0.07 0.19 1.02 0.28 3.06 4.62
Net book value
End of fi nancial year – – 0.04 – 0.21 0.25

147
THE DRX MEDISPA PTE. LTD
NOTES TO THE FINANCIAL STATEMENTS For the year ended 31 March, 2012
13 Trade and other payables
2012 2011 2012 2011
$ $ Rs.Crore Rs.Crore
Trade payables to:
– Non–related parties – 2,000 – 0.01
– 2,000 – 0.01
Other accruals for operating expenses 189,000 32,6000 0.77 1.15 189,000 328,000 0.07 1.16
14 Deferred income taxes
2012 2011 2012 2011
$ $ Rs.Crore Rs.Crore
Beginning of fi nancial year 8,000 – 0.01 –
Tax (credited)/charged to:
– profi t or loss (Note 7(a)) – 8,000 – 0.01
End of fi nancial year 8,000 8,000 0.01 0.01
2012 2011 2012 2011
$ $ Rs.Crore Rs.Crore
To be settled within one year – – – –
To be settled after one year 8,000 8,000 0.01 0.01
8,000 8,000 0.01 0.01
15. Share capital
The Company’s share capital comprises fully paid–up 100,000 (2011: 100,000) ordinary shares with no par value, amounting to a total of $100,000 (2011: $100,000).
16 Dividends
2012 2011 2012 2011
$ $ Rs.Crore Rs.Crore
Ordinary dividends paid or proposed
First interim dividend paid in respect of current fi nancial year of S$2.50 (2011: S$1.50) per share 250,000 150,000 1.02 0.53
Second interim dividend paid in respect of current fi nancial year of S$5.00 per share 500,000 – 2.04 –
750,000 150,000 3.06 0.53
17. Commitments
Operating lease commitments – where the Company is a lessee
As at balance sheet date, the Company has the following commitments under non–cancellable operating leases where the Company is the lessee:

148
THE DRX MEDISPA PTE. LTD
NOTES TO THE FINANCIAL STATEMENTS For the year ended 31 March, 2012
2012 2011 2012 2011
$ $ Rs.Crore Rs.Crore
Not later than one year 591,000 269,000 2.41 0.95
Between one and fi ve years 918,000 – 3.75 –
Later than fi ve years – – – –
1,509,000 269,000 6.16 0.95
18. Financial risk management
The Company is exposed to fi nancial risks arising from its operations and the use of fi nancial instruments. The key fi nancial risks are credit risk, foreign exchange risk, interest rate risk and liquidity risk. The management reviews and agrees on policies for managing each of these risks and they are summarised below:
(i) Credit risk
Credit risk is the potential risk of fi nancial loss resulting from the failure of customers or other counterparties to settle their fi nancial and contractual obligations to the company as and when they fall due.
The company’s exposure to credit risk arises primarily from trade and other receivables (including amounts owing by related parties). For other fi nancial assets (including cash and cash equivalents), the Company minimises credit risk by dealing with high credit rating counterparties.
Management regularly monitors credit risk exposure to customers.
Credit evaluations are performed on all customers requiring credit over a certain amount.
Management believes that concentration of credit risk is limited due to ongoing credit evaluations on all customers and, where necessary, maintaining an allowance for doubtful receivables which will adequately provide for potential credit risks.
Financial assets that are neither past due nor impaired
Trade and other receivables that are neither past due nor impaired are creditworthy debtors with a good payment record with the Company. Cash and cash equivalents that are neither past due nor impaired are mainly deposits placed with reputable fi nancial institutions with high credit–ratings.
There are no fi nancial assets that are past due or impaired as at the balance sheet date.
(ii) Foreiqn exchange risk
The Company does not have signifi cant foreign currency transactions, thus, the net exposure is not expected to be signifi cant.
(iii) Interest rate risk
Interest rate risk is the risk that the fair value or future cash fl ows of the Company’s fi nancial instruments will fl uctuate because of changes in market interest rates.
The Company does not have any interest–bearing fi nancial liabilities. Its only exposure to changes in interest rates relates to interest–earning bank deposits. The Company monitors movements in interest rates to ensure deposits are placed with fi nancial institutions offering optimal rates of return.
(iv) Liquidity risk
Liquidity risk is the risk that the Company will encounter diffi culty in meeting fi nancial obligations due to shortage of funds.

149
THE DRX MEDISPA PTE. LTD
NOTES TO THE FINANCIAL STATEMENTS For the year ended 31 March, 2012
The Company monitors its liquidity risk by maintaining a level of cash and cash equivalents deemed adequate to fi nance the Company’s operations and to mitigate the effects of fl uctuations in cash fl ows.
All fi nancial liabilities of the Company are repayable on demand or mature within one year.
(v) Capital risk
The Company’s objectives when managing capital are to ensure that the Company is adequately capitalised and to maintain an optimal capital structure by issuing or redeeming additional equity and debt instruments when necessary.
The Company is not subject to externally imposed capital requirements.
There were no changes to the Company’s approach to capital management during the period.
19. Immediate and ultimate holding corporation
The Company’s immediate holding corporation is Derma–Rx International Aesthetics Pte Ltd, incorporated in Singapore. The ultimate and intermediate holding corporation are Marico Limited and Kaya Limited respectively, both incorporated in India.
20. Related party transactions
In addition to the information disclosed elsewhere in the fi nancial statements, the following transactions took place between the Company and related parties at terms agreed between the parties:
(a) Sales and purchase of goods and services
2012 2011 2012 2011
$ $ Rs.Crore Rs.Crore
(i) With immediate holding company
Royalty paid 328,000 238,000 1.34 0.84
Purchases 456,000 33,000 1.86 0.12
Dividend paid 750,000 150,000 3.06 0.53
Management fee 96,000 – 0.39 –
(ii) With fellow subsidiaries
Sales 35,000 – 0.14 –
Purchases 882,000 1,099,000 3.60 3.89
Rental expenses 314,000 407,000 1.28 1.44
Rental income – 11,000 – 0.04
Consultation fee 132,000 165,000 0.54 0.58
Utilities 12,000 – 0.01 –
Balances with related parties at the balance sheet date are unsecured and receivable/payable on demand.
(b) Key management personnel compensation
Employees benefi ts expense includes key management personnel compensation is as follows:
2012 2011 2012 2011
$ $ Rs.Crore Rs.Crore
Short tem employee benefi ts
- Director’s remuneration 36,000 45,000 0.15 0.16
- Other key management personnel 136,000 171,000 0.56 0.60
172,000 216,000 0.70 0.76

150
THE DRX MEDISPA PTE. LTD
NOTES TO THE FINANCIAL STATEMENTS For the year ended 31 March, 2012
21. New or revised accounting standards and interpretations
Certain new accounting standards, amendments and interpretations to existing standards have been published, that are mandatory for accounting periods beginning on or after 1 January 2012.
The Company does not expect that adoption of these accounting standards on interpretations will have a material impact on the Company’s fi nancial statements.
22. Authorisation of fi nancial statements
These fi nancial statements were authorised for issue in accordance with a resolution of the Board of Directors of The DRx Medispa Pte Ltd on 3 July 2012

151
DRX INVESTMENT PTE. LTD(INCORPORATED IN THE REPUBLIC OF SINGAPORE)
Board of Directors Ajay Kumar Pahwa
Naveen Duggal
Dr. Tan Siak Khim
Janifer Yeo - Tan
Registered Offi ce 213 Henderson Road,
# 01-08 Henderson Industrial Park,
Singapore - 159553
Auditors PricewaterhouseCoopers
Bankers UOB Bank

152
DRX INVESTMENT PTE. LTD(INCORPORATED IN THE REPUBLIC OF SINGAPORE)
REPORT OF THE DIRECTORS’ For the fi nancial year ended 31 March 2012
The directors present their report to the members together with the audited fi nancial statements for the fi nancial year ended 31 March 2012.
Directors
The directors in offi ce at the date of this report are as follows:
Dr. Tan Siak Khim
Janifer Yeo – Tan
Ajay Kumar Pahwa
Naveen Duggal
Arrangements to enable directors to acquire shares and debentures
Neither at the end of nor at any time during the fi nancial year was the Company a party to any arrangement whose object was to enable the directors of the Company to acquire benefi ts by means of the acquisition of shares in, or debentures of, the Company or any other body corporate.
Directors’ interests in shares or debentures
According to the register of directors’ shareholdings, none of the directors holding offi ce at the end of the fi nancial year had any interest in the shares or debentures of the Company or its related corporations.
Directors’ contractual benefi ts
Since the end of the previous fi nancial year, no director has received or become entitled to receive a benefi t by reason of a contract made by the Company or a related corporation with the director or with a fi rm of which he is a member or with a company in which he has a substantial fi nancial interest, except as disclosed in the accompanying fi nancial statements and in this report, and except that certain directors receive remuneration as a result of their employment with related corporations.
Share options
No options were granted during the fi nancial year to subscribe for unissued shares of the Company.
No shares were issued during the fi nancial year by virtue of the exercise of options to take up unissued shares of the Company.
There were no unissued shares of the Company under option at the end of the fi nancial year.
Independent auditor
The independent auditor, PricewaterhouseCoopers LLP, has expressed its willingness to accept re-appointment
On behalf of the board,
Naveen Duggal Director
Singapore, 3 July 2012 Janifer Yeo-Tan Director
153
DRX INVESTMENT PTE. LTD(INCORPORATED IN THE REPUBLIC OF SINGAPORE)
STATEMENT BY DIRECTORSFor the fi nancial year ended 31 March 2012
In the opinion of the directors,
(a) the fi nancial statements are drawn up so as to give a true and fair view of the state of affairs of the Company as at 31 March 2012 and of the results of the business, changes in equity and cash fl ows of the Company for the fi nancial year then ended; and
(b) at the date of this statement, with the continuing fi nancial support from its intermediate holding corporation, there are reasonable grounds to believe that the Company will be able to pay its debts as and when they fall due.
On behalf of the board,
Naveen Duggal Director
Singapore, 3 July 2012 Janifer Yeo-Tan Director
154
DRX INVESTMENT PTE. LTD(INCORPORATED IN THE REPUBLIC OF SINGAPORE)
INDEPENDENT AUDITOR’S REPORTTO THE MEMBERS OF DRX INVESTMENT PTE. LTD.
Report on the Financial Statements
We have audited the accompanying fi nancial statements of DRx Investments Pte Ltd set out on pages 5 to 16, which comprise the balance sheet as at 31 March 2012, the statement of comprehensive income, the statement of changes in equity and the statement of cash fl ows for the year then ended, and a summary of signifi cant accounting policies and other explanatory information.
Management’s Responsibility for the Financial Statements
Management is responsible for the preparation of fi nancial statements that give a true and fair view in accordance with the provisions of the Singapore Companies Act (the “Act”) and Singapore Financial Reporting Standards, and for devising and maintaining a system of internal accounting controls suffi cient to provide a reasonable assurance that assets are safeguarded against loss from unauthorised use or disposition; and transactions are properly authorised and that they are recorded as necessary to permit the preparation of true and fair profi t and loss accounts and balance sheets and to maintain accountability of assets.
Auditor’s Responsibility
Our responsibility is to express an opinion on these fi nancial statements based on our audit. We conducted our audit in accordance with Singapore Standards on Auditing. Those standards require that we comply with ethical requirements and plan and perform the audit to obtain reasonable assurance about whether the fi nancial statements are free from material misstatement.
An audit involves performing procedures to obtain audit evidence about the amounts and disclosures in the fi nancial statements. The procedures selected depend on the auditor’s judgement, including the assessment of the risks of material misstatement of the fi nancial statements, whether due to fraud or error. In making those risk assessments, the auditor considers internal control relevant to the entity’s preparation of fi nancial statements that give a true and fair view in order to design audit procedures that are appropriate in the circumstances, but not for the purpose of expressing an opinion on the effectiveness of the entity’s internal control. An audit also includes evaluating the appropriateness of accounting policies used and the reasonableness of accounting estimates made by management, as well as evaluating the overall presentation of the fi nancial statements.
We believe that the audit evidence we have obtained is suffi cient and appropriate to provide a basis for our audit opinion.
Opinion
In our opinion, the fi nancial statements of the Company are properly drawn up in accordance with the provisions of the Act and Singapore Financial Reporting Standards so as to give a true and fair view of the state of affairs of the Company as at 31 March 2012, and the results, changes in equity and cash fl ows of the Company for the fi nancial year ended on that date.
Report on Other Legal and Regulatory Requirements
In our opinion, the accounting and other records required by the Act to be kept by the Company have been properly kept in accordance with the provisions of the Act.
PricewaterhouseCoopers LLP
Public Accountants and Singapore, 3 July 2012 Certifi ed Public Accountants

155
DRX INVESTMENT PTE. LTD(INCORPORATED IN THE REPUBLIC OF SINGAPORE)
BALANCE SHEET AS AT 31 MARCH 2012 Note 2012 2011 2012 2011 $ $ Rs.crore Rs.crore
ASSETS
Current assets
Cash and cash equivalents 5 17,000 10,000 0.07 0.04
Amount owing by a subsidiary 7 – – – –
Non current assets
Investment in subsidiary 6 – – – –
Total assets 17,000 10,000 0.07 0.04
LIABILITIES
Current liabilities
Other payables 8 10,000 3,000 0.04 0.01
Borrowings from a fellow subsidiary 8 18,000 3,000 0.07 0.01
28,000 6,000 0.11 0.02
Total liabilities 28,000 6,000 0.11 0.02
NET LIABILITIES (11,000) 4,000 (0.04) 0.01
EQUITY
Share capital 9 748,000 748,000 3.05 2.64
Retained profi ts (759,000) (744,000) (3.10) (2.63)
Total equity (11,000) 4,000 (0.04) 0.01
The accompanying notes form an integral part of these fi nancial statements.
Notes: The exchange rate used to convert SGD to Rs. <40.829> / <SGD> (Rs. <35.357> / <SGD>)
“The columns in INR are not part of the audited fi nancial statements and the audit opinion does not apply to them.”

156
DRX INVESTMENT PTE. LTD(INCORPORATED IN THE REPUBLIC OF SINGAPORE)
STATEMENT OF COMPREHENSIVE INCOMEfor the year ended 31 March 2012 Note 2012 2011 2012 2011 $ $ Rs.crore Rs.crore
Expenses
- Administrative 3 (15,000) (6,000) (0.06) (0.02)
Loss before income tax (15,000) (6,000) (0.06) (0.02)
Income tax expense 4 – – – –
Loss after tax and total comprehensive loss (15,000) (6,000) (0.06) (0.02)
Notes: The exchange rate used to convert SGD to Rs. <40.829> / <SGD> (Rs. <35.357> / <SGD>)
“The columns in INR are not part of the audited fi nancial statements and the audit opinion does not apply to them.”

157
DRX INVESTMENT PTE. LTD(INCORPORATED IN THE REPUBLIC OF SINGAPORE)
STATEMENT OF CHANGES IN EQUITYFOR THE PERIOD FROM 1 JANUARY 2010 TO 31 MARCH 2012
Note Share Retained Total capital profi ts equity $ $ $
2012
Beginning of fi nancial year 748,000 (744,000) 4,000
Loss for the year, representing total comprehensive loss – (15,000) (15,000)
End of fi nancial year 748,000 (759,000) (11,000)
2011
Beginning of fi nancial year 15,000 (738,000) (723,000)
Loss for the year, representing total comprehensive loss – (6,000) (6,000)
Increase in share capital 7,331,000 – 733,000
End of fi nancial year 748,000 (744,000) 4,000
Note Share Retained Total
capital profi ts equity
Rs.crore Rs.crore Rs.crore
2012
Beginning of fi nancial year 2.64 (2.63) 0.01
Loss for the year, representing total comprehensive loss – (0.06) (0.06)
End of fi nancial year 3.05 (3.10) (0.04)
2011
Beginning of fi nancial year 0.05 (2.45) (2.40)
Loss for the year, representing total comprehensive loss – (0.02) (0.02)
Increase in share capital 25.92 – 2.59
End of fi nancial year 2.64 (2.63) 0.01
Notes: The exchange rate used to convert SGD to Rs. <40.829> / <SGD> (Rs. <35.357> / <SGD>)
“The columns in INR are not part of the audited fi nancial statements and the audit opinion does not apply to them.”
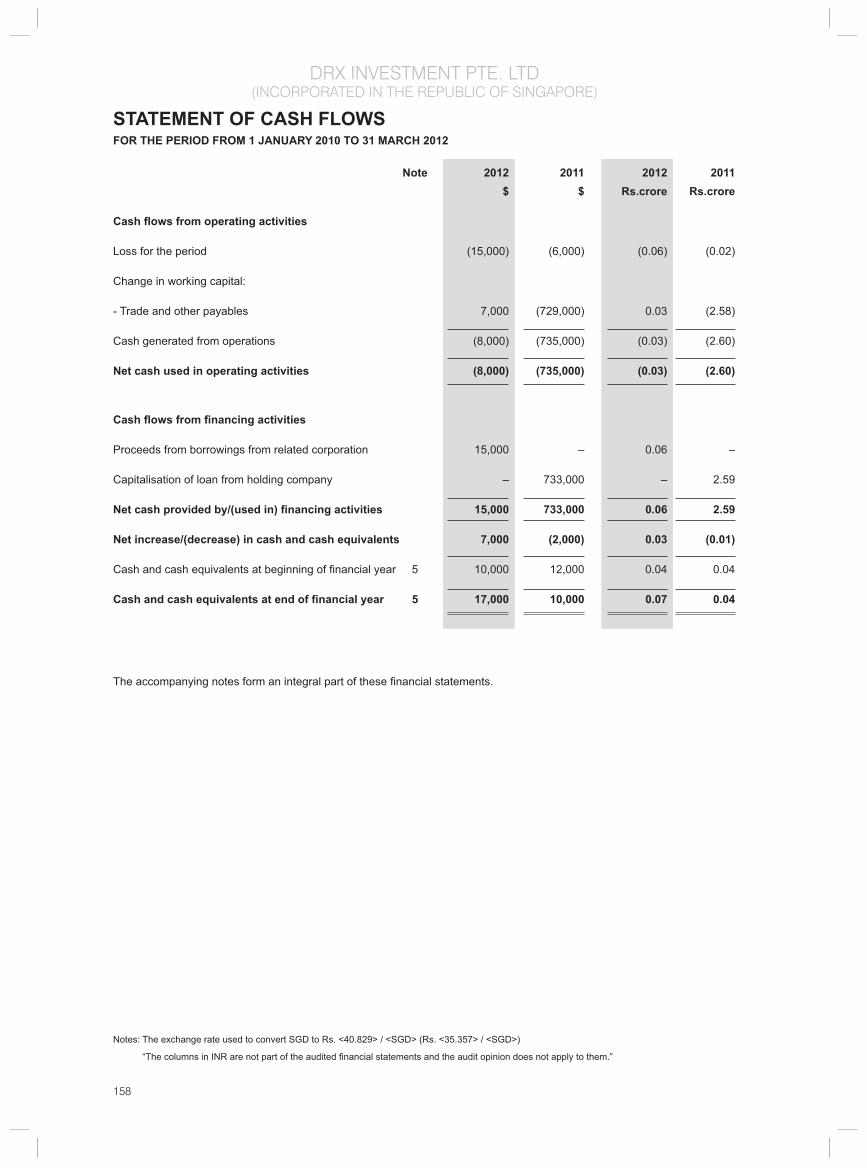
158
DRX INVESTMENT PTE. LTD(INCORPORATED IN THE REPUBLIC OF SINGAPORE)
STATEMENT OF CASH FLOWSFOR THE PERIOD FROM 1 JANUARY 2010 TO 31 MARCH 2012
Note 2012 2011 2012 2011 $ $ Rs.crore Rs.crore
Cash fl ows from operating activities
Loss for the period (15,000) (6,000) (0.06) (0.02)
Change in working capital:
- Trade and other payables 7,000 (729,000) 0.03 (2.58)
Cash generated from operations (8,000) (735,000) (0.03) (2.60)
Net cash used in operating activities (8,000) (735,000) (0.03) (2.60)
Cash fl ows from fi nancing activities
Proceeds from borrowings from related corporation 15,000 – 0.06 –
Capitalisation of loan from holding company – 733,000 – 2.59
Net cash provided by/(used in) fi nancing activities 15,000 733,000 0.06 2.59
Net increase/(decrease) in cash and cash equivalents 7,000 (2,000) 0.03 (0.01)
Cash and cash equivalents at beginning of fi nancial year 5 10,000 12,000 0.04 0.04
Cash and cash equivalents at end of fi nancial year 5 17,000 10,000 0.07 0.04
The accompanying notes form an integral part of these fi nancial statements.
Notes: The exchange rate used to convert SGD to Rs. <40.829> / <SGD> (Rs. <35.357> / <SGD>)
“The columns in INR are not part of the audited fi nancial statements and the audit opinion does not apply to them.”
159
DRX INVESTMENT PTE. LTD(INCORPORATED IN THE REPUBLIC OF SINGAPORE)
NOTES TO THE FINANCIAL STATEMENTS For the year ended 31 March, 2012
These notes form an integral part of and should be read in conjunction with the accompanying fi nancial statements.
1. General information
The Company is incorporated and domiciled in Singapore. The address of its registered offi ce is 213 Henderson Road, #01-08 Henderson Industrial Park, Singapore 159553.
The Company is a Investment Holding Company of DRx Aesthetics Sdn. Bhd. incorporated in Malaysia .
As at 31 March 2012, the Company is in capital defi cit. The fi nancial statements have been prepared on a going concern basis due to the fi nancial support from its intermediate holding corporation.
2. Signifi cant accounting policies
2.1 Basis of preparation
The fi nancial statements have been prepared in accordance with Singapore Financial Reporting Standards (“FRS”). The fi nancial statements have been prepared under the historical cost convention, except as disclosed in the accounting policies below.
These fi nancial statements are separate fi nancial statements under FRS 27 Consolidated and Separate Financial Statements. As provided under FRS 27 the Company has elected not to prepare consolidated fi nancial statements as it is wholly-owned subsidiary of Marico Limited, which produces consolidated fi nancial statements for public use. The registered offi ce of Marico Limited is located at Rang Sharda Krishnachandra Marg, Bandra Reclamation, Branda (West), Mumbai 400050 India.
The preparation of these fi nancial statements in conformity with FRS requires management to exercise its judgement in the process of applying the Company’s accounting policies. It also requires the use of certain accounting estimates and assumptions. There are no areas of the fi nancial statements which involve the application of signifi cant estimates or judgement.
In 2010, the directors of the Company decided to change the fi nancial year end of the Company to 31 March. Accordingly, in these fi nancial statements, prior period comparatives are presented for the 15 months period ended 31 March 2011 and consequently the comparative amounts in the fi nancial statements are not entirely comparable.
Interpretations and amendments to published standards effective in 2011
On 1 April 2011, the Company adopted the new or amended FRS and Interpretations to FRS (“INT FRS”) that are mandatory for application from that date. Changes to the Company’s accounting policies have been made as required, in accordance with the transitional provisions in the respective FRS and INT FRS.
The adoption of these new or amended FRS and INT FRS did not result in substantial changes to the Company’s accounting policies and had no material effect on the amounts reported for the current or prior fi nancial years.
2.2 Income taxes
Current income tax is recognised at the amount expected to be paid to or recovered from the tax authorities.
Deferred income tax is recognised for all temporary differences except when the deferred income tax arises from the initial recognition of an asset or liability that affects neither accounting nor taxable profi t or loss at the time of the transaction.
Current and deferred income tax is measured using the tax rates and tax laws that have been enacted or substantively enacted by the balance sheet date, and are recognised as income or expenses in profi t or loss, except to the extent that the tax arises from a transaction which is recognised directly in equity.

160
DRX INVESTMENT PTE. LTD(INCORPORATED IN THE REPUBLIC OF SINGAPORE)
2.3 Loans and receivables
Cash and cash equivalents
Amount owing by a subsidiary
Cash and cash equivalents, and amount owing by a subsidiary are initially recognised at their fair values plus transaction costs and subsequently carried at amortised cost using the effective interest method, less accumulated impairment losses.
The Company assesses at each balance sheet date whether there is objective evidence that these fi nancial assets are impaired and recognises an allowance for impairment when such evidence exists. Signifi cant fi nancial diffi culties of the debtor, probability that the debtor will enter bankruptcy and default or signifi cant delay in payments are objective evidence that these fi nancial assets are impaired.
The carrying amount of these assets is reduced through the use of an impairment allowance account which is calculated as the difference between the carrying amount and the present value of estimated future cash fl ows, discounted at the original effective interest rate.
These assets are presented as current assets except for those that are expected to be realised later than 12 months after the balance sheet date, which are presented as non-current assets.
2.4 Investment in a subsidiary
Investments in subsidiaries are stated at cost less accumulated impairment losses in the balance sheet. On disposal of investments in subsidiaries, the difference between net disposal proceeds and the carrying amount of the investment are recognised in profi t or loss.
2.5 Impairment of non-fi nancial assts
Investment in a subsidiary is reviewed for impairment whenever there is any indication that this asset may be impaired.
If the recoverable amount of the asset is estimated to be less than its carrying amount, the carrying amount of the asset is reduced to its recoverable amount. The difference between the carrying amount and recoverable amount is recognised as an impairment loss in profi t or loss.
An impairment loss for an asset is reversed if, and only if, there has been a change in the estimates used to determine the asset’s recoverable amount since the last impairment loss was recognised. The carrying amount of this asset is increased to its revised recoverable amount, provided that this amount does not exceed the carrying amount that would have been determined (net of accumulated depreciation) had no impairment loss been recognised for the asset in prior years. A reversal of impairment loss for an asset is recognised in profi t or loss.
2.6 Other payables
Trade and other payables represent unpaid liabilities for goods and services provided to the Company prior to the end of fi nancial year. They are classifi ed as current liabilities if payment is due within one year or less (or in the normal operating cycle of the business, if longer). If not, they are presented as non-current liabilities.
Trade and other payables are initially recognised at fair value, and subsequently carried at amortised cost using the effective interest method.
2.7 Offsetting fi nancial instruments
Financial assets and liabilities are offset and the net amount reported in the balance sheet when there is a legally enforceable right to offset and there is an intention to settle on a net basis or realise the asset and settle the liability simultaneously.
NOTES TO THE FINANCIAL STATEMENTS For the year ended 31 March, 2012
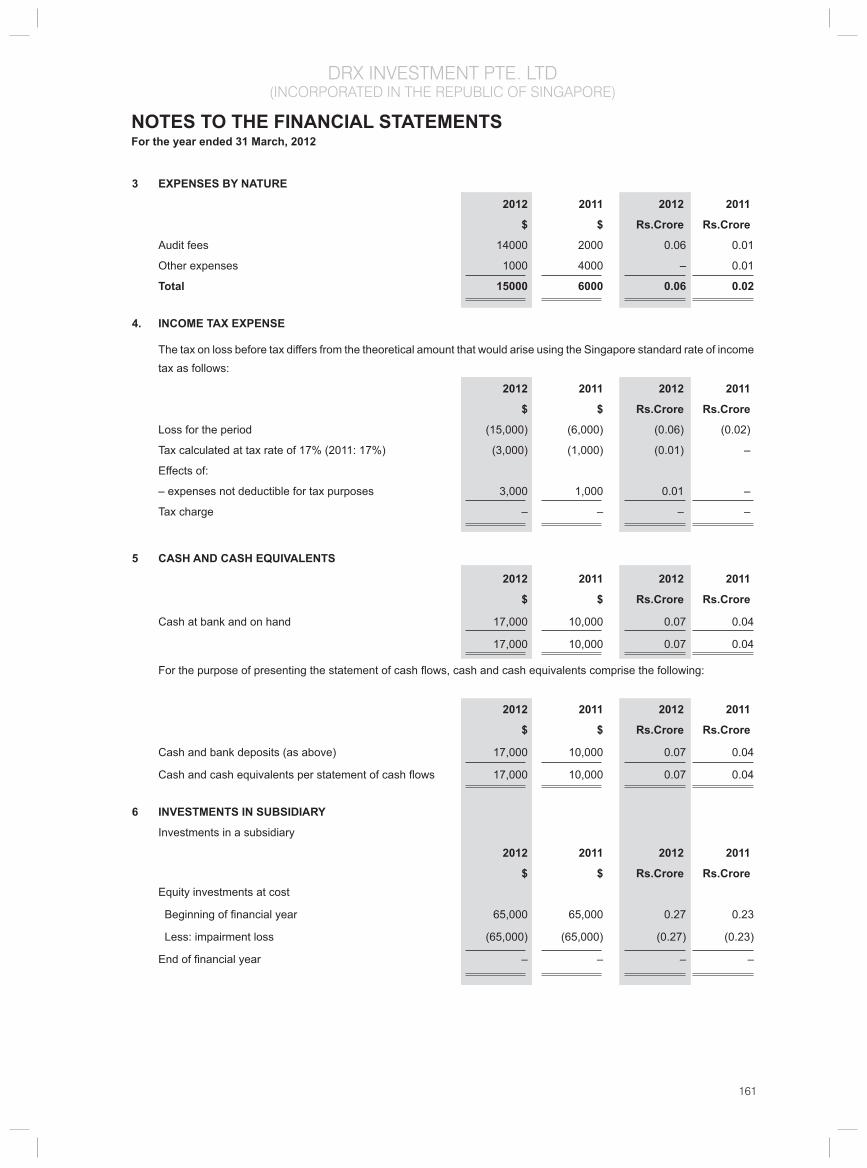
161
DRX INVESTMENT PTE. LTD(INCORPORATED IN THE REPUBLIC OF SINGAPORE)
NOTES TO THE FINANCIAL STATEMENTS For the year ended 31 March, 2012
3 EXPENSES BY NATURE
2012 2011 2012 2011
$ $ Rs.Crore Rs.Crore
Audit fees 14000 2000 0.06 0.01
Other expenses 1000 4000 – 0.01
Total 15000 6000 0.06 0.02
4. INCOME TAX EXPENSE
The tax on loss before tax differs from the theoretical amount that would arise using the Singapore standard rate of income tax as follows:
2012 2011 2012 2011
$ $ Rs.Crore Rs.Crore
Loss for the period (15,000) (6,000) (0.06) (0.02)
Tax calculated at tax rate of 17% (2011: 17%) (3,000) (1,000) (0.01) –
Effects of:
– expenses not deductible for tax purposes 3,000 1,000 0.01 –
Tax charge – – – –
5 CASH AND CASH EQUIVALENTS
2012 2011 2012 2011
$ $ Rs.Crore Rs.Crore
Cash at bank and on hand 17,000 10,000 0.07 0.04
17,000 10,000 0.07 0.04
For the purpose of presenting the statement of cash fl ows, cash and cash equivalents comprise the following:
2012 2011 2012 2011
$ $ Rs.Crore Rs.Crore
Cash and bank deposits (as above) 17,000 10,000 0.07 0.04
Cash and cash equivalents per statement of cash fl ows 17,000 10,000 0.07 0.04 6 INVESTMENTS IN SUBSIDIARY
Investments in a subsidiary
2012 2011 2012 2011
$ $ Rs.Crore Rs.Crore Equity investments at cost
Beginning of fi nancial year 65,000 65,000 0.27 0.23
Less: impairment loss (65,000) (65,000) (0.27) (0.23)
End of fi nancial year – – – –

162
DRX INVESTMENT PTE. LTD(INCORPORATED IN THE REPUBLIC OF SINGAPORE)
At the balance sheet date, the details of the subsidiary are as follows:
Country of business/ Equity holding
Name of companies Principal activities Incorporation 2012 2011
% %
DRx Aesthetics Sdn Bhd Maintain privatemedical practiceand medical laboratoryservice and consultation
Malaysia 100 100
7 AMOUNT OWING BY A SUBSIDIARY
2012 2011 2012 2011
$ $ Rs.Crore Rs.Crore
Amount owing by a subsidiary – non–trade 634,000 634,000 2.59 2.24
Less: Allowance for doubtful debts (634,000) (634,000) (2.59) (2.24)
– – – –
The amount owing by subsidiary is unsecured, interest-free and is repayable on demand.
8 OTHER PAYABLES
2012 2011 2012 2011
$ $ Rs.Crore Rs.Crore
Borrowings from fellow subsidiary 18,000 3,000 0.07 0.01
Other accruals for operating expenses 10,000 3,000 0.04 0.01
28,000 6,000 0.11 0.02
Amounts owing to a fellow subsidiary is unsecured, interest-free and repayable on demand.
9. SHARE CAPITAL
The Company’s share capital comprises fully paid-up 748,343 (2011: 748,343) ordinary shares with no par value, amounting to a total of $748,343 (2011: $748,343).
10. FINANCIAL RISK MANAGEMENT
Financial risk factors
The Company’s activities expose it to a variety of fi nancial risks: market risk (including currency risk, interest rate risk and price risk), credit risk and liquidity risk.
Liquidity risk
Liquidity risk is the risk that the company will encounter diffi culty in meeting fi nancial obligations due to shortage of funds.
The company monitors its liquidity risk and maintains a level of cash and cash equivalents deemed adequate to fi nance the company’s operations and to mitigate the effects of fl uctuations in cash fl ows.
All fi nancial liabilities of the company will mature within one year or are repayable on demand.
NOTES TO THE FINANCIAL STATEMENTS For the year ended 31 March, 2012
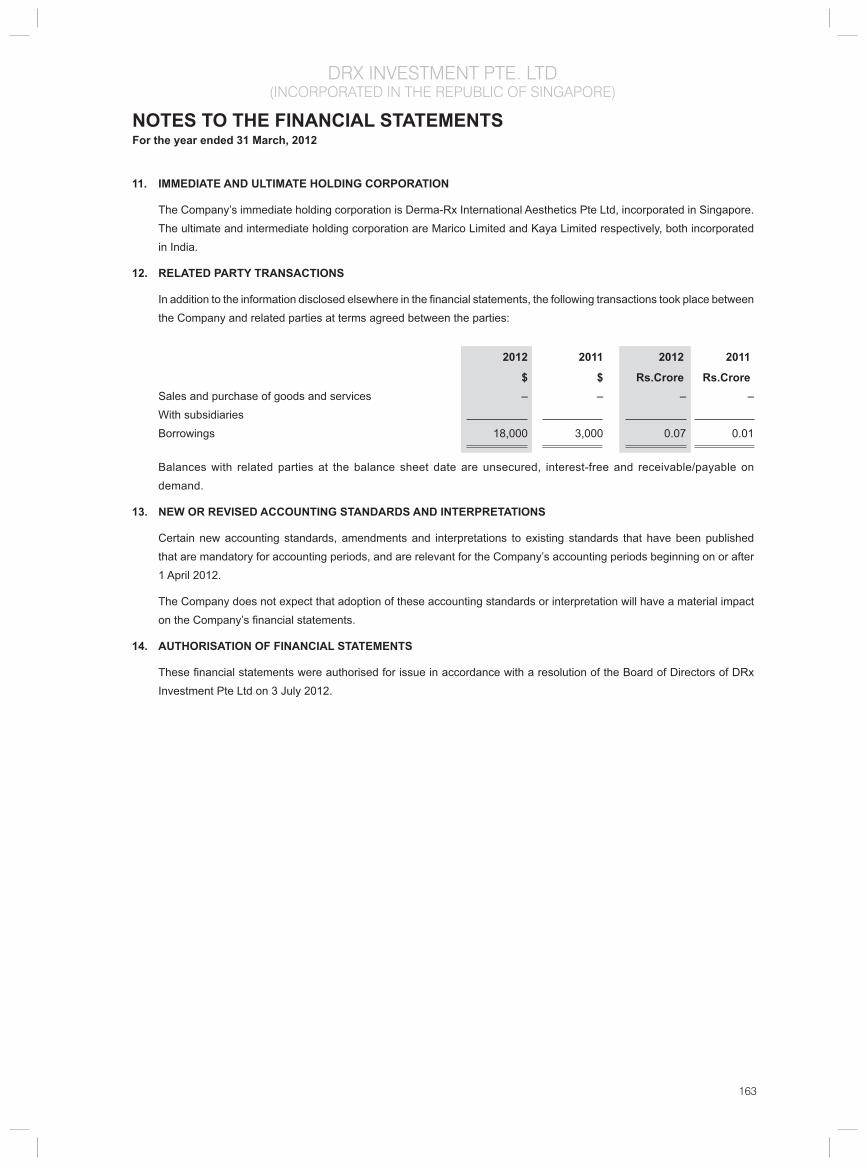
163
DRX INVESTMENT PTE. LTD(INCORPORATED IN THE REPUBLIC OF SINGAPORE)
NOTES TO THE FINANCIAL STATEMENTS For the year ended 31 March, 2012
11. IMMEDIATE AND ULTIMATE HOLDING CORPORATION
The Company’s immediate holding corporation is Derma-Rx International Aesthetics Pte Ltd, incorporated in Singapore. The ultimate and intermediate holding corporation are Marico Limited and Kaya Limited respectively, both incorporated in India.
12. RELATED PARTY TRANSACTIONS
In addition to the information disclosed elsewhere in the fi nancial statements, the following transactions took place between the Company and related parties at terms agreed between the parties:
2012 2011 2012 2011
$ $ Rs.Crore Rs.Crore Sales and purchase of goods and services – – – – With subsidiaries Borrowings 18,000 3,000 0.07 0.01
Balances with related parties at the balance sheet date are unsecured, interest-free and receivable/payable on demand.
13. NEW OR REVISED ACCOUNTING STANDARDS AND INTERPRETATIONS
Certain new accounting standards, amendments and interpretations to existing standards that have been published that are mandatory for accounting periods, and are relevant for the Company’s accounting periods beginning on or after1 April 2012.
The Company does not expect that adoption of these accounting standards or interpretation will have a material impact on the Company’s fi nancial statements.
14. AUTHORISATION OF FINANCIAL STATEMENTS
These fi nancial statements were authorised for issue in accordance with a resolution of the Board of Directors of DRx Investment Pte Ltd on 3 July 2012.

164
DRX AESTHETICS SDN. BHD
Board of Directors Ajay Kumar Pahwa
Naveen Duggal
Dr. Tan Siak Khim
Janifer Yeo-Tan
Chin Chee Kee
Poh Shiow Mei
Registered Offi ce 339 Mezzanine Floor, Jalan Tuanka Abdul Rehman, 50100 Kuala Lumpur, Malaysia
Factory (Outlet) N-1 -1 Plaza Damas, 60 Jalan Sri Hartamas 1, Sri Hartamas, 50480 Kuala Lumpur Malaysia
Auditors Sundar & Associates Chartered Accountants
Bankers Public Bank Berhad

165
DRX AESTHETICS SDN. BHD
The directors have pleasure in submitting their report and the audited fi nancial statements for the fi nancial year ended 31 March 2012.
Principal activity
The principal activity of the Company is managing private medical practice and medical laboratory service and consultation as well as dealing in all kinds of medical and its related products. There has been no signifi cant change in the nature of these activities during the year.
Financial results
RM
Profi t after taxation 112,044
Reserves and provisions
There were no material transfers to or from reserves or provisions during the fi nancial year.
Issue of shares and debentures
The Company has not issued any shares or debentures during the fi nancial year.
Directorate
The directors in offi ce since the date of last report are:-
DR. TAN SIAK KHIM
JANIFER YEO-TAN(Formerly JANIFER YEO @ YEO CHENG HOON)
CHIN CHEE KEE
POH SHIOW MEI
AJAY PAHWA
NAVEEN DUGGAL
Particulars of interest in shares of the Company by the directors who held offi ce at the end of the fi nancial year are as follows:
Ordinary shares of RM1/- each
As at As at 01/04/2011 Bought Sold 31/03/2012
DR. TAN SIAK KHIM _ _ _ _
JANIFER YEO -TAN _ _ _ _
POH SHIOW MEI _ _ _ _
AJAY PAHWA _ _ _ _
NAVEEN DUGGAL _ _ _ _
CHIN CHEE KEE _ _ _ _
Directors’ benefi ts
Neither at the end of the fi nancial year, nor at any time during this year, did there subsist any arrangement to which the Company
DIRECTORS’ REPORT
166
DRX AESTHETICS SDN. BHD
or any of its related corporations was a party, whereby the directors might acquire benefi ts by means of the acquisition of shares in, or debentures of, the Company or any other body corporate.
Since the end of the previous fi nancial year, no director has received or become entitled to receive a benefi t (other than a benefi t included in the aggregate amount of emoluments received or due and receivable by the directors as shown in the fi nancial statements) by reason of a contract made by the Company or a related corporation with the director or with a fi rm of which he is a member, or with a Company in which he has a substantial fi nancial interest.
Other statutory information
(a) Before the income statement and balance sheet were made out, the directors took reasonable steps :-
(i) to ascertain that action had been taken in relation to the writing off of bad debts and the making of provision for doubtful debts and satisfi ed themselves that all known bad debts have been written off and that adequate provision has been made for doubtful debts.
(ii) to ensure that any current assets which were unlikely to be realised in the ordinary course of business including their value as shown in the accounting records of the Company have been written down to an amount which they might be expected so to realise.
(b) At the date of this report, the directors are not aware of any circumstances :
(i) which would render the amount written off or provided for bad and doubtful debts of the Company inadequate to any substantial extent.
(ii) which would render the values attributed to current assets in the fi nancial statements of the Company misleading, or
(iii) which have arisen which render adherence to the existing method of valuation of assets or liabilities of the Company misleading or inappropriate.
(c) At the date of this report, there does not exist:
(i) any charge on the assets of the Company which has arisen since the end of the fi nancial year which secures the liabilities of any other person.
(ii) any contingent liability of the Company which has arisen since the end of the fi nancial period.
(d) No contingent or other liability has become enforceable or is likely to become enforceable within the period of twelve months after the end of the fi nancial year which, in the opinion of the directors, will or may substantially affect the ability of the Company to meet its obligations as and when they fall due.
(e) At the date of this report, the directors are not aware of any circumstances not otherwise dealt with in this report or the fi nancial statements which would render any amount stated in the fi nancial statements misleading.
(f) In the opinion of the directors,
(i) the results of the Company’s operations during the fi nancial year were not substantially affected by any item, transaction or event of a material and unusual nature;
(ii) there has not arisen in the interval between the end of the fi nancial year and the date of this report any item, transaction or event of a material and unusual nature likely to affect substantially the results of the operations of the Company for the current fi nancial period.
DIRECTORS’ REPORT (contd.)

167
DRX AESTHETICS SDN. BHD
Ultimate holding company
The directors regard Marico Limited, a company incorporated in India as the ultimate holding company of the Company.
Auditors
Messrs. Sundar & Associates have expressed their willingness to continue in offi ce.
Signed on behalf of the Board of Directors in accordance
with a resolution of the Directors dated 13 April 2012
NAVEEN DUGGAL Director
JANIFER YEO - TAN Director
DIRECTORS’ REPORT (contd.)

168
DRX AESTHETICS SDN. BHD
STATEMENT BY DIRECTORS Pursuant to Section 169 (15) of the Companies Act, 1965
We, Janifer Yeo – Tan and Naveen Duggal, being two of the directors of DRX AESTHETICS SDN. BHD., do hereby state that, in the opinion of the directors, the accompanying balance sheet and statements of income, cash fl ows and changes in equity are drawn up in accordance with MASB approved accounting standards for private entities and the provisions of the Companies Act, 1965 so as to give a true and fair view of the state of affairs of the Company as at 31 March 2012 and of the results and the cash fl ows of the Company for the year then ended.
Signed on behalf of the Board of Directors in accordance
with a resolution of the Directors dated 13 April 2012
NAVEEN DUGGAL Director
JANIFER YEO - TAN Director

169
DRX AESTHETICS SDN. BHD
STATUTORY DECLARATION I, Janifer Yeo - Tan, being the director primarily responsible for the accounting records and fi nancial management of
DRX AESTHETICS SDN. BHD., do solemnly and sincerely declare that the accompanying balance sheet and statements
of income, cash fl ows and changes in equity are to the best of my knowledge and belief correct and I make this solemn
declaration conscientiously believing the same to be true, and by virtue of the provisions of the Statutory Declarations
Act, 1960.
Subscribed and solemnly declared by
the abovenamed at Petaling Jaya in
the Selangor Darul Ehsan this 13 April 2012
JANIFER YEO - TAN
Before me,

170
DRX AESTHETICS SDN. BHD
INDEPENDENT AUDITORS’ REPORT TO THE MEMBERS OF
DRX AESTHETICS SDN. BHD (689072-T)
Report on the Financial Statements
We have audited the fi nancial statements of DRX AESTHETICS SDN. BHD., which comprise the balance sheet as at 31
March 2012, and the income statement, statement of changes in equity and cash fl ow statement for the year then ended,
and a summary of signifi cant accounting policies and other explanatory information.
Directors’ Responsibility for the Financial Statements
The directors of the Company are responsible for the preparation of fi nancial statements that give a true and fair view
in accordance with Private Entities Reporting Standard and the Companies Act 1965 in Malaysia, and for such internal
controls as the directors determine are necessary to enable the preparation of fi nancial statements that are free from
material misstatement, whether due to fraud or error.
Auditors’ Responsibility
Our responsibility is to express an opinion on these fi nancial statements based on our audit. We conducted our audit
in accordance with approved standards on auditing in Malaysia. Those standards require that we comply with ethical
requirements and plan and perform the audit to obtain reasonable assurance whether the fi nancial statements are free
from material misstatement.
An audit involves performing procedures to obtain audit evidence about the amounts and disclosures in the fi nancial
statements. The procedures selected depend on our judgement, including the assessment of risks of material misstatement
of the fi nancial statements, whether due to fraud or error. In making those risk assessments, we consider internal control
relevant to the Company’s preparation and fair presentation of the fi nancial statements in order to design audit procedures
that are appropriate in the circumstances, but not for the purpose of expressing an opinion on the effectiveness of the
Company’s internal control. An audit also includes evaluating the appropriateness of accounting policies used and the
reasonableness of accounting estimates made by the directors, as well as evaluating the overall presentation of the
fi nancial statements.
We believe that the audit evidence we have obtained is suffi cient and appropriate to provide a basis for our audit opinion.
Opinion
In our opinion, the fi nancial statements have been properly drawn up in accordance with Private Entities Reporting Standards
and the Companies Act 1965 in Malaysia so as to give a true and fair view of the fi nancial position of the Company as of
31 March 2012 and of its fi nancial performance and cash fl ows for the year then ended.
Emphasis of matter
Without qualifying our opinion, we draw attention to Note 3(i) in the fi nancial statements which discloses the premise upon
which the Company has prepared its fi nancial statements by applying the going concern assumption, notwithstanding as of
that date, the Company’s current liabilities exceeded its current assets by RM1,565,103/-, thereby indicating the existence
of a material uncertainty which may cast signifi cant doubt about the Company’s ability to continue as a going concern.

171
DRX AESTHETICS SDN. BHD
Report on Other Legal and Regulatory Requirements
In accordance with the requirements of the Companies Act 1965 in Malaysia, we also report that in our opinion the
accounting and other records and the registers required by the Act to be kept by the Company have been properly kept
in accordance with the provisions of the Act.
Other Matters
This report is made solely to the members of the Company, as a body, in accordance with Section 174 of the Companies
Act 1965 in Malaysia and for no other purpose. We do not assume responsibility to any other person for the content of
this report.
SUNDARASAN A/L ARUMUGAM SUNDAR & ASSOCIATES 1876/02/12(J/PH) AF No: 1127
Chartered Accountant (M) Chartered Accountants (M)
Petalng Jaya
Date :
INDEPENDENT AUDITORS’ REPORT

172
DRX AESTHETICS SDN. BHD
INCOME STATEMENTfor the period ended 31 March 2012(with comparatives for the period from 01/01/2010 to 31/03/2011)
Note 2012 2011 2012 2011 RM RM Rs.crore Rs.crore
Turnover 3 (ii) 746,150 1,236,438 1.24 2.05
Cost of sales (234,329) (419,261) (0.39) (0.70)
Gross profi t 511,821 817,177 0.85 1.36
Other income 3,960 35,436 0.01 0.06
Staff costs 5 (63,664) (80,526) (0.11) (0.13)
Depreciation (5,992) (91,795) (0.01) (0.15)
Other operating expenses (337,598) (327,015) (0.56) (0.54)
Operating profi t 108,527 353,277 0.18 0.59
Finance costs – (7,290) – (0.01)
Profi t before taxation 6 108,527 345,987 0.18 0.57
Taxation 7 3,517 (4,079) 0.01 (0.01)
Profi t after taxation 112,044 341,908 0.19 0.57
Note: The exchange rate used to convert MYR to Rs. <16.617> / <MYR> (Rs. <14.747> / <MYR>) “The columns in INR are not part of the audited fi nancial statements and the audit opinion does not apply to them.”

173
DRX AESTHETICS SDN. BHD
BALANCE SHEET AS AT 31 MARCH 2012 Note 2012 2011 2012 2011 RM RM Rs.Crore Rs.crore
Non-current asset
Plant and equipment 8 46,479 3,156 0.08 0.01
Current assets
Inventories 3(iv) / 9 33,098 31,096 0.05 0.05
Trade receivables 9,751 3,110 0.02 0.01
Other receivables , deposits and prepayment 10 92,014 81,059 0.15 0.12
Tax recoverable 38,385 – 0.06 –
Cash and bank balances 143,429 295,736 0.24 0.44
316,677 411,001 0.53 0.61
Current liabilities
Trade payables 287,084 444,763 0.48 0.66
Other payables and accrued liabilities 11 60,899 66,186 0.10 0.10
Amount owing to the holding company 12 1,533,797 1,533,797 2.55 2.26
Taxation – 79 – –
1,881,780 2,044,825 3.13 3.02
Net current liabilities (1,565,103) (1,633,824) (2.60) (2.41)
(1,518,624) (1,630,668) (2.52) (2.40)
Financed by :
Share capital 13 990,000 990,000 1.65 1.46
Accumulated loss (2,508,624) (2,620,668) (4.17) (3.86)
(1,518,624) (1,630,668) (2.52) (2.40)
The annexed notes form an integral part of these fi nancial statements.
Note: The exchange rate used to convert MYR to Rs. <16.617> / <MYR> (Rs. <14.747> / <MYR>) “The columns in INR are not part of the audited fi nancial statements and the audit opinion does not apply to them.”
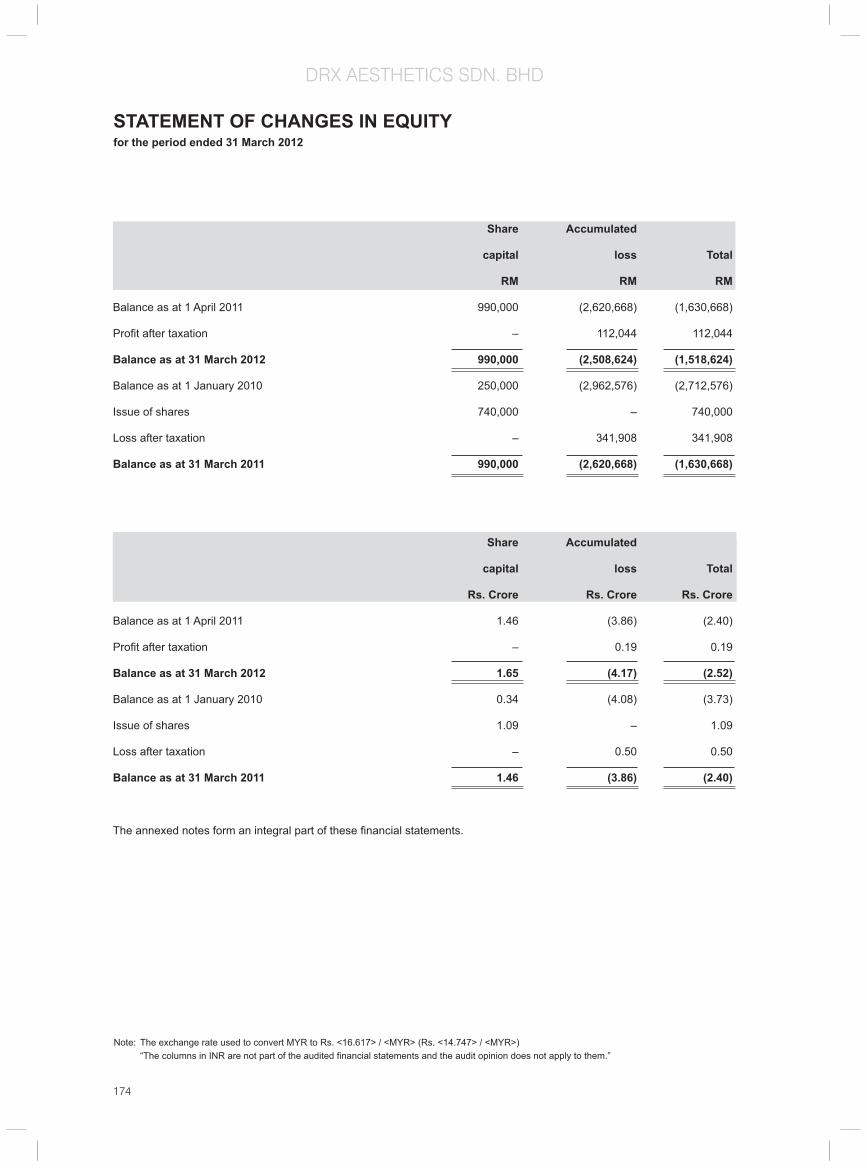
174
DRX AESTHETICS SDN. BHD
Share Accumulated
capital loss Total
RM RM RM
Balance as at 1 April 2011 990,000 (2,620,668) (1,630,668)
Profi t after taxation – 112,044 112,044
Balance as at 31 March 2012 990,000 (2,508,624) (1,518,624)
Balance as at 1 January 2010 250,000 (2,962,576) (2,712,576)
Issue of shares 740,000 – 740,000
Loss after taxation – 341,908 341,908
Balance as at 31 March 2011 990,000 (2,620,668) (1,630,668)
Share Accumulated
capital loss Total
Rs. Crore Rs. Crore Rs. Crore
Balance as at 1 April 2011 1.46 (3.86) (2.40)
Profi t after taxation – 0.19 0.19
Balance as at 31 March 2012 1.65 (4.17) (2.52)
Balance as at 1 January 2010 0.34 (4.08) (3.73)
Issue of shares 1.09 – 1.09
Loss after taxation – 0.50 0.50
Balance as at 31 March 2011 1.46 (3.86) (2.40)
The annexed notes form an integral part of these fi nancial statements.
STATEMENT OF CHANGES IN EQUITYfor the period ended 31 March 2012
Note: The exchange rate used to convert MYR to Rs. <16.617> / <MYR> (Rs. <14.747> / <MYR>) “The columns in INR are not part of the audited fi nancial statements and the audit opinion does not apply to them.”

175
DRX AESTHETICS SDN. BHD
STATEMENT OF CASH FLOWSFOR THE PERIOD FROM 1 JANUARY 2010 TO 31 MARCH 2012
2012 2011 2012 2011 RM RM Rs. Crore Rs. Crore
Cash fl ows from operating activities
Profi t before taxation 108,527 345,987 0.18 0.51
Adjustments for :
Depreciation on plant and equipment 5,992 91,795 0.01 0.14
Loss on foreign exchange – unrealised 3,297 – 0.01 –
Bad debts written off 39 – – –
Fixed deposit interest – (2,248) – –
Gain on foreign exchange – unrealised – (3,610) – (0.01)
Gain on disposal plant and equipment – (900) – –
Operating profi t before working capital changes 117,855 431,024 0.20 0.64
Changes in working capital :
Inventories (2,002) (20,495) – (0.03)
Trade receivables (6,680) 540 (0.01) –
Other receivables, deposits and prepayment (10,955) (10,684) (0.02) (0.02)
Trade payables (160,976) (93,717) (0.27) (0.14)
Other payables and accrued liabilities (5,287) 52,776 (0.01) 0.08
Cash (absorbed by) / generated from operations (68,045) 359,444 (0.11) 0.53
Fixed deposit interest – 2,248 – –
Tax paid (34,947) (3,630) (0.06) (0.01)
Net cash fl ow from operating activities (102,992) 358,062 (0.17) 0.53
Cash fl ows from investing activities
Purchase of plant and equipment (49,315) (2,400) (0.08) –
Proceeds from disposal of plant and equipment – 900 – –
Decrease in deposits pledged to a bank – 327,648 – 0.48
Net cash fl ow from investing activities (49,315) 326,148 (0.08) 0.48
Net (decrease) / increase in cash and cash equivalents (152,307) 684,210 (0.25) 1.01
Cash and cash equivalents brought forward 295,736 (388,474) 0.49 (0.57)
Cash and cash equivalent carried forward 143,429 295,736 0.24 0.44
Breakdown of cash and cash equivalents carried forward
Cash and bank balances 143,429 295,736 0.24 0.44
The accompanying notes form an integral part of these fi nancial statements.
Note: The exchange rate used to convert MYR to Rs. <16.617> / <MYR> (Rs. <14.747> / <MYR>) “The columns in INR are not part of the audited fi nancial statements and the audit opinion does not apply to them.”
176
DRX AESTHETICS SDN. BHD
1. Corporate information
The Company is a private limited liability company, incorporated and domiciled in Malaysia.
The registered offi ce of the company is located at 339,Mezzanine Floor, Jalan Tuanku Abdul Rahman, 50100 Kuala Lumpur and the principal place of business is located at N-1-1, Plaza Damas, No 60, Jalan Sri Hartamas 1, 50480 Kuala Lumpur.
2. Date of authorisation of issue
The fi nancial statements were authorised for issue by the Board of Directors on
3. Signifi cant accounting policies
(i) Basis of preparation
The fi nancial statements comply with applicable approved accounting standards for private entities issued by the Malaysian Accounting Standards Board and the provisions of the Companies Act, 1965.
The fi nancial statements have been prepared under the historical cost convention.
As at 31 March 2012, the Company’s current liabilities exceeded its total assets by RM1,565,103/-. However, the fi nancial statements have been prepared on the basis of accounting principle applicable to a going concern. This going concern basis presumes that the Company will be able to operate profi tably in the foreseeable future and continue to receive fi nancial support from the shareholders and consequently, the realisation of assets and the settlement of liabilities will occur in the ordinary course of business. In this connection, the directors are satisfi ed that the Company will be able to meet its fi nancial obligation as and when they fall due for the foreseeable future.
(ii) Revenue
Revenue is recognised when it is probable that the economic benefi ts associated with the transaction will fl ow to the enterprise and the amount of the revenue can be measured reliably.
Sale of goods
Revenue is recognised upon delivery of goods and customers’ acceptance and where applicable, net of returns and trade discounts.
Services rendered
Revenue is recognised upon rendering of services and when the outcome of the transactions can be estimated reliably. In the event the outcome of the transactions could not be estimated reliably, revenue is recognised to the extent of the expenses incurred that are recoverable.
(iii) Plant and equipment
Plant and equipment is stated at cost less accumulated depreciation.
Depreciation on plant and equipment is calculated on a straight-line method based on the estimated useful lives of the assets. The principal annual rates of depreciation used are as follows:
The principal annual rates of depreciation used are as follows:-
Computer and equipment 20%
Furniture and fi ttings 20%
Air-conditioners 20%
Medical and surgical equipment 20%
Renovations 20%
NOTES TO THE FINANCIAL STATEMENTS for the period ended 31 March 2012

177
DRX AESTHETICS SDN. BHD
NOTES TO THE FINANCIAL STATEMENTS for the period ended 31 March 2012
Plant and equipment is written down to recoverable amount if, the recoverable amount is less than their carrying value. Recoverable amount is the higher of an asset’s net selling price and its value in use.
(iv) Inventories
Inventories, encompassing fi nished goods purchased and held for resale, are stated at the lower of cost and net realisable value. Cost is determined on fi rst-in fi rst-out method and includes transport and handling costs.
(v) Receivables
Trade and other receivables are carried at anticipated realisable value. Bad debts are written off in the period in which they are identifi ed. An estimate is made for doubtful debts based on a review of all outstanding amounts at the balance sheet date.
(vi) Cash and cash equivalents
Cash represent cash and bank balances. Cash equivalents comprises of investments maturing within three months from the date of acquisition and which are readily convertible to known amount of cash which are subject to an insignifi cant risk of change in value.
(vii) Payables
Payables are stated at cost which is the consideration to be paid in the future for products and services received.
(viii) Income tax
Income tax on the profi t or loss for the year comprises current and deferred tax. Current tax is the expected amount of income taxes payable in respect of the taxable profi t for the year and is measured using the tax rates that have been enacted at balance sheet date.
Deferred tax is provided for, using the liability method, on temporary differences at the balance sheet date between the tax bases of assets and liabilities and their carrying amounts in the fi nancial statements. In principle, deferred tax liabilities are recognised for all taxable temporary differences and deferred tax assets are recognised for all deductible temporary differences, unused tax losses and unused tax credits to the extent that it is probable that taxable profi t will be available against which the deductible temporary differences, unused tax losses and unused tax credits can be utilised.
Deferred tax is measured at the tax rates that are expected to apply in the period when the asset is realised or the liability is settled, based on the tax rates that have been enacted or substantively enacted at the balance sheet date.
Deferred tax is recognised in the income statement, except when it arises from a transaction which is recognised directly in equity.
(ix) Provisions
Provisions are recognised when the Company has a present legal and constructive obligation as a result of a past event, when it is probable that an outfl ow of resources embodying economic benefi ts will be required to settle the obligation, and when a reliable estimate can be made of the amount of the obligation.
(x) Employment benefi t
a. Short term benefi ts
Wages, salaries, bonuses and social security contributions are recognised as an expense in the fi nancial year in which the associated services are rendered by employees of the Company. Short term accumulating compensated absences such as paid annual leave are recognised when services are rendered by employees that increase their entitlement to future compensated absences, and short term non-accumulating compensated absences such as sick leave are recognised when the absences occur.
178
DRX AESTHETICS SDN. BHD
b. Defi ned contribution plan
As required by law, companies in Malaysia make contributions to the Employee Provident Fund (EPF). Such contributions are recognised as an expense in the income statement as incurred.
(xi) Impairment of assets
The carrying values of assets excluding inventories, deferred tax assets, assets arising from employee benefi ts and fi nancial assets are reviewed for impairment when there is an indication that the assets might be impaired. Impairment is measured by comparing the carrying values of the assets with their recoverable amounts. The recoverable amount is the higher of an asset’s net selling price and its value in use, which is measured by reference to discounted future cash fl ows. Recoverable amounts are estimated for individual assets, or if it not possible, for the cash-generating unit.
An impairment loss is charged to the income statement immediately, unless the asset is carried at revalued amount. Any impairment loss of a revalued asset is treated as a revaluation decrease to the extent of previously recognised revaluation surplus for the same asset.
Subsequent increase in the recoverable amount of an asset is treated as reversal of the previous impairment loss and is recognised to the extent of the carrying amount of the asset that would have been determined (net of amortisation and depreciation) had no impairment loss been recognised. The reversal is recognised in the income statement immediately, unless the asset is carried at revalued amount. A reversal of an impairment loss on a revalued asset is credited directly to revaluation surplus. However, to the extent that an impairment loss on the same revalued asset was previously recognized as an expense in the income statement, a reversal of that impairment loss is recognised as income in the income statement.
(xii) Currency conversion
Transactions in foreign currencies are translated to Malaysian Ringgit at rates of exchange ruling at the date of transaction. Monetary assets and liabilities denominated in foreign currencies are translated at the rates of exchange ruling at the balance sheet date. Foreign exchange differences arising on translation are recognised in the income statement.
The principal closing rates used in translation of foreign currency amount are as follows:
2012 2011 RM RM
Singapore Dollar 2,4405 2,4004
4. Principal activity
The principal activity of the Company is managing private medical practice and medical laboratory service and consultation as well as dealing in all kinds of medical and its related products.
NOTES TO THE FINANCIAL STATEMENTS for the period ended 31 March 2012
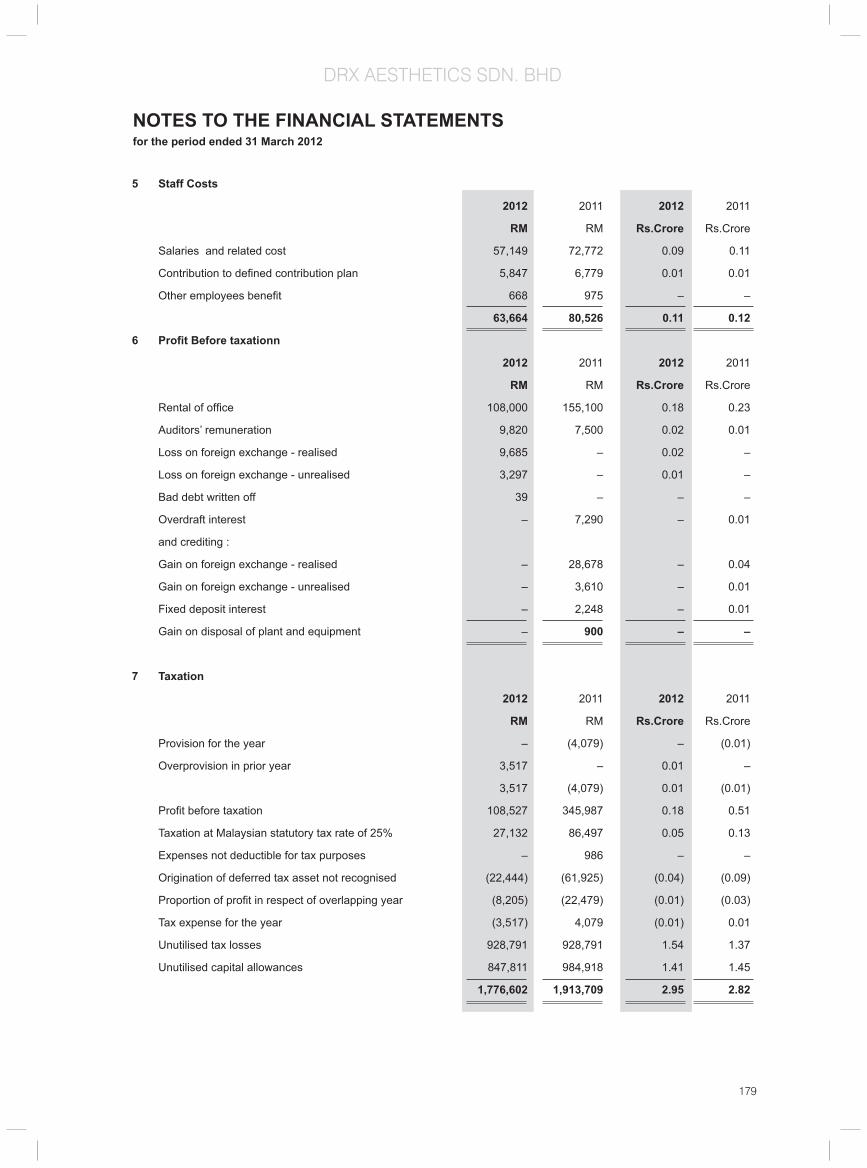
179
DRX AESTHETICS SDN. BHD
5 Staff Costs
2012 2011 2012 2011
RM RM Rs.Crore Rs.Crore
Salaries and related cost 57,149 72,772 0.09 0.11
Contribution to defi ned contribution plan 5,847 6,779 0.01 0.01
Other employees benefi t 668 975 – –
63,664 80,526 0.11 0.12
6 Profi t Before taxationn
2012 2011 2012 2011
RM RM Rs.Crore Rs.Crore
Rental of offi ce 108,000 155,100 0.18 0.23
Auditors’ remuneration 9,820 7,500 0.02 0.01
Loss on foreign exchange - realised 9,685 – 0.02 –
Loss on foreign exchange - unrealised 3,297 – 0.01 –
Bad debt written off 39 – – –
Overdraft interest – 7,290 – 0.01
and crediting :
Gain on foreign exchange - realised – 28,678 – 0.04
Gain on foreign exchange - unrealised – 3,610 – 0.01
Fixed deposit interest – 2,248 – 0.01
Gain on disposal of plant and equipment – 900 – –
7 Taxation
2012 2011 2012 2011
RM RM Rs.Crore Rs.Crore
Provision for the year – (4,079) – (0.01)
Overprovision in prior year 3,517 – 0.01 –
3,517 (4,079) 0.01 (0.01)
Profi t before taxation 108,527 345,987 0.18 0.51
Taxation at Malaysian statutory tax rate of 25% 27,132 86,497 0.05 0.13
Expenses not deductible for tax purposes – 986 – –
Origination of deferred tax asset not recognised (22,444) (61,925) (0.04) (0.09)
Proportion of profi t in respect of overlapping year (8,205) (22,479) (0.01) (0.03)
Tax expense for the year (3,517) 4,079 (0.01) 0.01
Unutilised tax losses 928,791 928,791 1.54 1.37
Unutilised capital allowances 847,811 984,918 1.41 1.45
1,776,602 1,913,709 2.95 2.82
NOTES TO THE FINANCIAL STATEMENTS for the period ended 31 March 2012
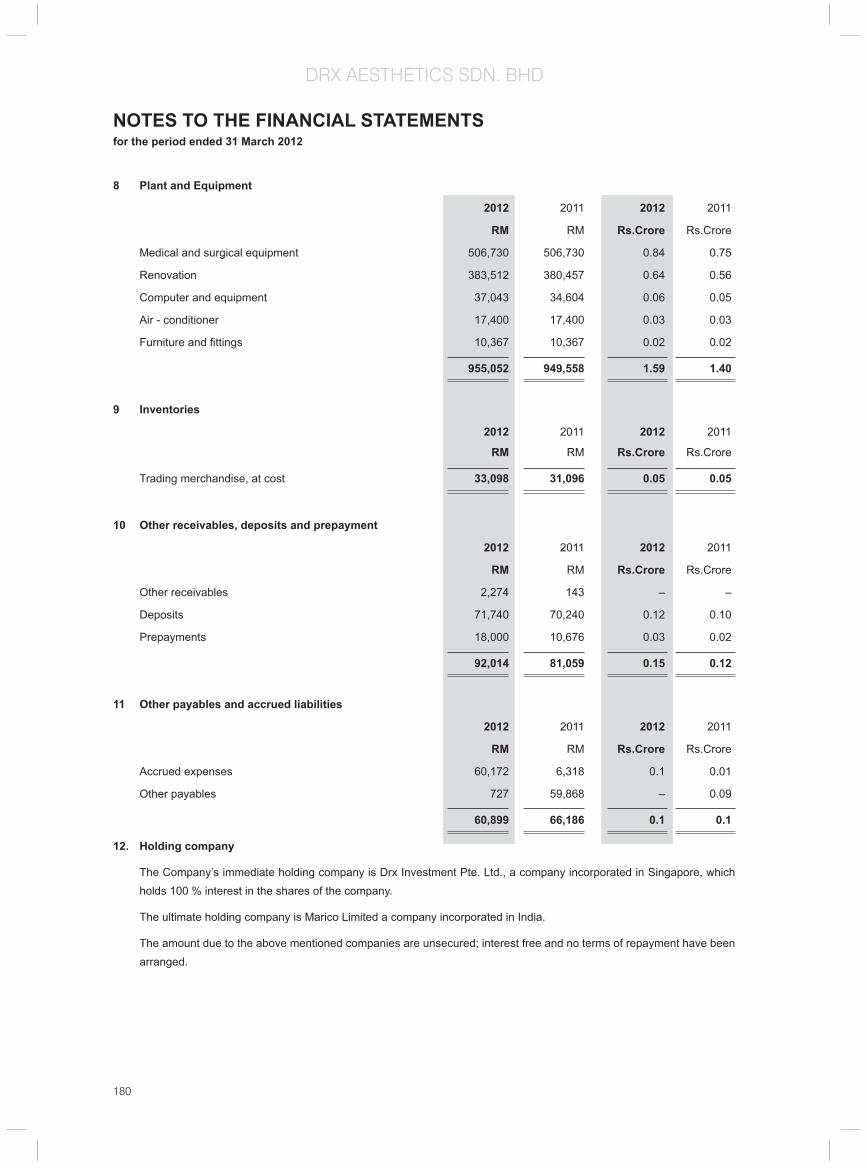
180
DRX AESTHETICS SDN. BHD
8 Plant and Equipment
2012 2011 2012 2011
RM RM Rs.Crore Rs.Crore
Medical and surgical equipment 506,730 506,730 0.84 0.75
Renovation 383,512 380,457 0.64 0.56
Computer and equipment 37,043 34,604 0.06 0.05
Air - conditioner 17,400 17,400 0.03 0.03
Furniture and fi ttings 10,367 10,367 0.02 0.02
955,052 949,558 1.59 1.40
9 Inventories
2012 2011 2012 2011
RM RM Rs.Crore Rs.Crore
Trading merchandise, at cost 33,098 31,096 0.05 0.05
10 Other receivables, deposits and prepayment
2012 2011 2012 2011
RM RM Rs.Crore Rs.Crore
Other receivables 2,274 143 – –
Deposits 71,740 70,240 0.12 0.10
Prepayments 18,000 10,676 0.03 0.02
92,014 81,059 0.15 0.12
11 Other payables and accrued liabilities
2012 2011 2012 2011
RM RM Rs.Crore Rs.Crore
Accrued expenses 60,172 6,318 0.1 0.01
Other payables 727 59,868 – 0.09
60,899 66,186 0.1 0.1
12. Holding company
The Company’s immediate holding company is Drx Investment Pte. Ltd., a company incorporated in Singapore, which holds 100 % interest in the shares of the company.
The ultimate holding company is Marico Limited a company incorporated in India.
The amount due to the above mentioned companies are unsecured; interest free and no terms of repayment have been arranged.
NOTES TO THE FINANCIAL STATEMENTS for the period ended 31 March 2012

181
DRX AESTHETICS SDN. BHD
NOTES TO THE FINANCIAL STATEMENTS for the period ended 31 March 2012
13 Share Capital
Number of shares 2012 2011 2012 2011
RM RM Rs.Crore Rs.Crore
Authorised :
Ordinary shares of RM 1/– each 1,000,000 1,000,000 1,000,000 1,000,000 1.66 1.47
Issued and fully paid:
Ordinary shares of RM1/– each
Balance brought forward 990,000 250,000 990,000 250,000 1.65 0.37
Issued during the year – 740,000 – 740,000 – 1.09
Balance carried forward 990,000 990,000 990,000 990,000 1.65 1.46
14 Deferred Taxation
2012 2011 2012 2011
RM RM Rs.Crore Rs.Crore
Tax effect of:
Unabsorbed capital allowances 906,171 1,137,202 1.51 1.68
Unutilised tax losses 928,791 928,791 1.54 1.37
1,834,962 2,065,993 3.05 3.05

182
DRX AESTHETICS SDN. BHD
Pla
nt a
nd e
quip
men
t Cos
tC
ompu
ter a
nd e
quip
men
t R
MFu
rnitu
re a
nd fi
tting
sR
MM
edic
al a
nd s
urgi
cal q
uipm
ent
RM
Ren
ovat
ion
RM
Airc
ondi
tione
r R
MS
ignb
oard
R
MTo
tal
RM
Bal
ance
bro
ught
forw
ard
37,
043
12,
866
506
,730
3
83,5
12
17,
400
2,4
00
959
,951
Add
ition
–
–
7,1
60
42,
155
–
–
49,
315
Dis
posa
l –
–
–
–
–
–
–
Bal
ance
car
ried
forw
ard
37,
043
12,
866
513
,890
4
25,6
67
17,
400
2,4
00
1,0
09,2
66
Acc
umul
ated
dep
reci
atio
nC
ompu
ter a
nd e
quip
men
t R
MFu
rnitu
re a
nd fi
tting
sR
MM
edic
al a
nd s
urgi
cal q
uipm
ent
RM
Ren
ovat
ion
RM
Airc
ondi
tione
r R
MS
ignb
oard
R
MTo
tal
RM
Bal
ance
bro
ught
forw
ard
36,
722
11,
991
506
,730
3
83,5
12
17,
400
440
9
56,7
95
Add
ition
320
5
00
477
4
,215
–
4
80
5,9
92
Dis
posa
l –
–
–
–
–
–
–
Bal
ance
car
ried
forw
ard
37,
042
12,
491
507
,207
3
87,7
27
17,
400
920
9
62,7
87
Net
boo
k va
lue
Com
pute
r and
equ
ipm
ent
RM
Furn
iture
and
fi tti
ngs
RM
Med
ical
and
sur
gica
l qui
pmen
t R
MR
enov
atio
n R
MA
ircon
ditio
ner
RM
Sig
nboa
rd
RM
Tota
lR
M
2012
1
375
6
,683
3
7,94
0 –
1
,480
4
6,47
9
2011
321
8
75
–
–
–
1,9
60
3,1
56
Pla
nt a
nd e
quip
men
t Cos
tC
ompu
ter a
nd e
quip
men
t R
s.C
rore
Furn
iture
and
fi tti
ngs
Rs.
Cro
reM
edic
al a
nd s
urgi
cal q
uipm
ent
Rs.
Cro
reR
enov
atio
n R
s.C
rore
Airc
ondi
tione
r R
s.C
rore
Sig
nboa
rd
Rs.
Cro
reTo
tal
Rs.
Cro
re
Bal
ance
bro
ught
forw
ard
0.0
5 0
.02
0.7
5 0
.57
0.0
3 -
1.4
2
Add
ition
–
–
0.0
1 0
.07
–
–
0.0
8
Dis
posa
l –
–
–
–
–
–
–
Bal
ance
car
ried
forw
ard
0.0
6 0
.02
0.8
5 0
.71
0.0
3 –
1
.68
Acc
umul
ated
dep
reci
atio
nC
ompu
ter a
nd e
quip
men
t R
s.C
rore
Furn
iture
and
fi tti
ngs
Rs.
Cro
reM
edic
al a
nd s
urgi
cal q
uipm
ent
Rs.
Cro
reR
enov
atio
n R
s.C
rore
Airc
ondi
tione
r R
s.C
rore
Sig
nboa
rd
Rs.
Cro
reTo
tal
Rs.
Cro
re
Bal
ance
bro
ught
forw
ard
0.0
5 0
.02
0.7
5 0
.57
0.0
3 –
1
.41
Add
ition
–
–
–
0.0
1 –
–
0
.01
Dis
posa
l –
–
–
–
–
–
–
Bal
ance
car
ried
forw
ard
0.0
6 0
.02
0.8
4 0
.64
0.0
3 –
1
.60
Net
boo
k va
lue
Com
pute
r and
equ
ipm
ent
Rs.
Cro
reFu
rnitu
re a
nd fi
tting
sR
s.C
rore
Med
ical
and
sur
gica
l qui
pmen
t R
s.C
rore
Ren
ovat
ion
Rs.
Cro
reA
ircon
ditio
ner
Rs.
Cro
reS
ignb
oard
R
s.C
rore
Tota
lR
s.C
rore
2012
–
–
0.0
1 0
.06
–
–
0.0
8
2011
–
–
–
–
–
–
–
8.
Plan
t and
equ
ipm
ent
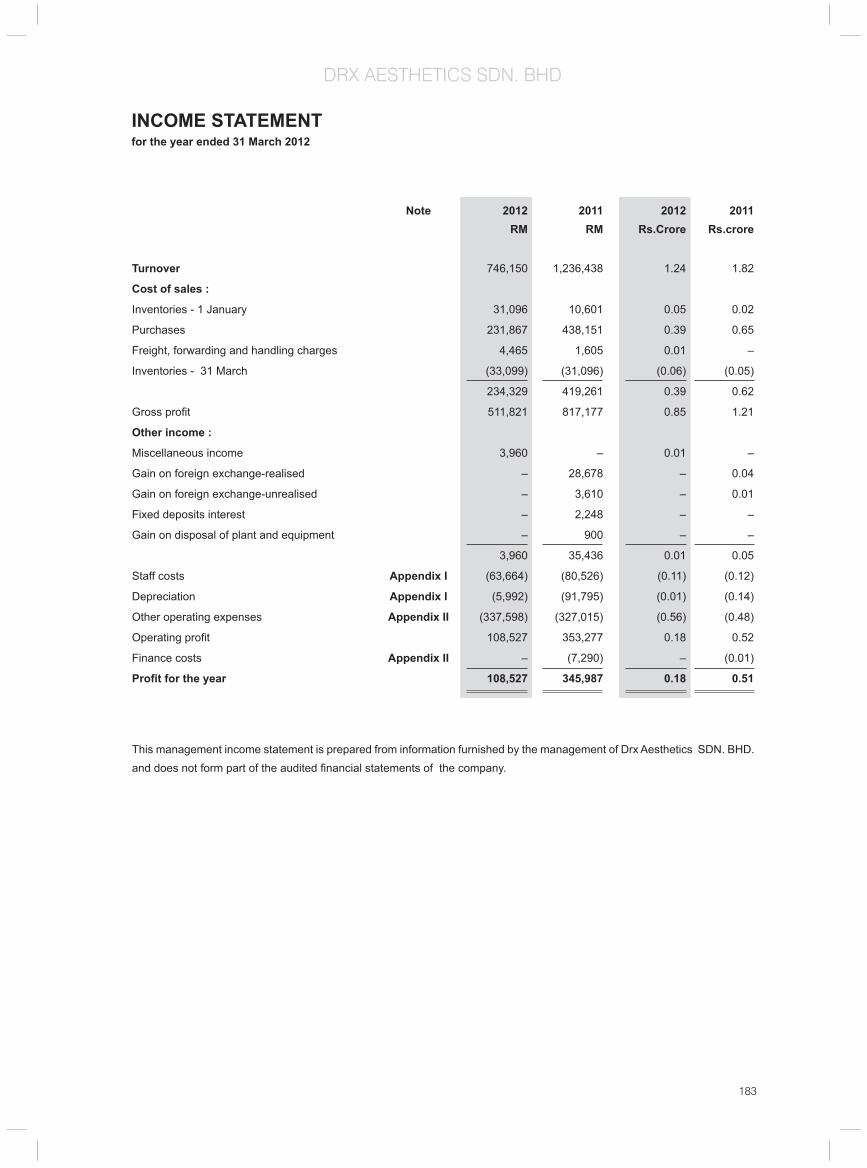
183
DRX AESTHETICS SDN. BHD
Note 2012 2011 2012 2011 RM RM Rs.Crore Rs.crore
Turnover 746,150 1,236,438 1.24 1.82
Cost of sales :
Inventories - 1 January 31,096 10,601 0.05 0.02
Purchases 231,867 438,151 0.39 0.65
Freight, forwarding and handling charges 4,465 1,605 0.01 –
Inventories - 31 March (33,099) (31,096) (0.06) (0.05)
234,329 419,261 0.39 0.62
Gross profi t 511,821 817,177 0.85 1.21
Other income :
Miscellaneous income 3,960 – 0.01 –
Gain on foreign exchange-realised – 28,678 – 0.04
Gain on foreign exchange-unrealised – 3,610 – 0.01
Fixed deposits interest – 2,248 – –
Gain on disposal of plant and equipment – 900 – –
3,960 35,436 0.01 0.05
Staff costs Appendix I (63,664) (80,526) (0.11) (0.12)
Depreciation Appendix I (5,992) (91,795) (0.01) (0.14)
Other operating expenses Appendix II (337,598) (327,015) (0.56) (0.48)
Operating profi t 108,527 353,277 0.18 0.52
Finance costs Appendix II – (7,290) – (0.01)
Profi t for the year 108,527 345,987 0.18 0.51
This management income statement is prepared from information furnished by the management of Drx Aesthetics SDN. BHD. and does not form part of the audited fi nancial statements of the company.
INCOME STATEMENTfor the year ended 31 March 2012

184
DRX AESTHETICS SDN. BHD
SCHEDULE OF EXPENSESfor the year ended 31 March 2012
2012 2011 2012 2011 RM RM Rs.Crore Rs.crore
Staff costs
Salaries 35,161 56,242 0.06 0.08
Allowances 21,988 16,530 0.04 0.02
EPF 5,847 6,779 0.01 0.01
Socso 668 975 – –
63,664 80,526 0.11 0.12
Depreciation
Renovation 4,215 611 0.01 –
Furniture and fi ttings 500 625 – –
Signboard 480 440 – –
Medical and surgical equipment 477 89,525 – 0.13
Computer and equipment 320 594 – –
5,992 91,795 0.01 0.14
Other operating expenses
Rental of offi ce 108,000 155,100 0.18 0.23
Recruitment fee 72,513 1,890 0.12 –
Royalties 34,559 42,220 0.06 0.06
Travelling 19,783 17,632 0.03 0.03
Credit card commission 10,163 16,704 0.02 0.02
Auditors’ remuneration 9,820 7,500 0.02 0.01
Loss on foreign exchange – realised 9,685 – 0.02 –
Marketing fee 8,480 – 0.01 –
Offi ce cleaning 7,343 9,031 0.01 0.01
Electricity and water 6,684 9,507 0.01 0.01
Telephone charges 6,635 7,662 0.01 0.01
General expenses 6,432 3,652 0.01 0.01
Accounting fee 6,000 6,648 0.01 0.01
Professional fee 5,269 22,827 0.01 0.03
Staff accomodation 4,244 10,447 0.01 0.02
Registration fee 3,983 780 0.01 –
Tax fee 2,606 500 0.01 –
Offi ce maintenance 2,589 2,457 0.01 0.01
Loss on foreign exchange – unrealised 3,297 – 0.01 –
Repair and renewal 2,367 278 – –
Printing and stationery 2,233 2,963 – –
Insurance 1,675 1,963 – –
Balance carried forward 334,360 319,761 0.56 0.47
This management schedule of expenses is prepared from information furnished by the management of Drx AestheticsSDN. BHD. and does not form part of the audited fi nancial statements of the company.

185
DRX AESTHETICS SDN. BHD
SCHEDULE OF EXPENSESfor the year ended 31 March 2012 2012 2011 2012 2011 RM RM Rs.Crore Rs.crore
Other operating expenses (cont’d)
Balance brought forward 334,360 319,761 0.56 0.47
Penalty 1,464 435 – –
Secretarial fees 743 2,246 – –
Postage and courier 550 786 – –
Bank charges 228 724 – –
Staff welfare 160 – – –
Newspaper and periodicals 54 459 – –
Bad debts written off 39 – – –
Service tax – 1,020 – –
Food and beverage – 428 – –
Subcription fee – 395 – –
Packing material – 342 – –
Filing fees – 150 – –
Upkeep of offi ce equipment – 133 – –
Laundry charges – 76 – –
Attestion fee – 60 – –
337,598 327,015 0.56 0.48
Finance costs
Overdraft interest – 7,290 – 0.01
– 7,290 – 0.01
This management schedule of expenses is prepared from information furnished by the management of Drx Aesthetics Sdn. Bhd. and does not form part of the audited fi nancial statements of the company.

186
M A R I C O M I D D L E E A S T F Z E
Board of Directors Vijay Subramaniam
Sudhir Rehgarh
Pawan Agrawal
Debashish Neogi
Aditya Shome
Secretary, Manager, Negotiator Sudhir Rehgarh
Registered Office Office No. LB 15326, Jebel Ali, Dubai, UAE
Auditors M/s. Pannell Kerr Forster
Chartered Accountants
Bankers Standard Chartered Bank
Legal Advisors M/s. Pannell Kerr Forster
Chartered Accountants

187
M A R I C O M I D D L E E A S T F Z E
Report on the financial statements
We have audited the accompanying financial statements of MARICO MIDDLE EAST FZE, which comprise the statement of
financial position as at 31 March 2012, and the statement of comprehensive income, statement of changes in equity and
statement of cash flows for the year then ended, and a summary of significant accounting policies and other explanatory
information set out on pages 3 to 22.
Management’s responsibility for the financial statements
Management is responsible for the preparation of financial statements that give a true and fair view in accordance with
International Financial Reporting Standards and for such internal control as management determines is necessary to enable
the preparation of financial statements that are free from material misstatement, whether due to fraud or error.
Auditor’s responsibility
Our responsibility is to express an opinion on these financial statements based on our audit. We conducted our audit in
accordance with International Standards on Auditing. Those standards require that we comply with ethical requirements and
plan and perform the audit to obtain reasonable assurance about whether the financial statements are free from material
misstatement.
An audit involves performing procedures to obtain audit evidence about the amounts and disclosures in the financial statements.
The procedures selected depend on the auditor’s judgment, including the assessment of the risks of material misstatement
of the financial statements, whether due to fraud or error. In making those risk assessments, the auditor considers internal
control relevant to the entity’s preparation of financial statements that give true and fair view in order to design audit procedures
that are appropriate in the circumstances, but not for the purpose of expressing an opinion on the effectiveness of the entity’s
internal control. An audit also includes evaluating the appropriateness of accounting policies used and the reasonableness
of accounting estimates made by management, as well as evaluating the overall presentation of the financial statements.
We believe that the audit evidence we have obtained is sufficient and appropriate to provide a basis for our audit opinion.
Opinion
In our opinion, the financial statements give a true and fair view of the financial position of MARICO MIDDLE EAST FZE as
at 31 March 2012, and of its financial performance and its cash flows for the year then ended in accordance with International
Financial Reporting Standards.
Emphasis of matter
Without qualifying our audit opinion, we draw attention to Note 1 (d) to the financial statements which states that the financial
statements of the subsidiary companies are not consolidated in these financial statements as they will be consolidated in the
financial statements of the ultimate parent company.
Report on other legal and regulatory requirements
We further confirm that, except for non-presentation of consolidated financial statements as stated above, the financial
statements comply with Implementing Regulation No. 1/92 issued by the Jebel Ali Free Zone Authority pursuant to Law No.
9 of 1992. Also, in our opinion, proper books of account and other records have been maintained in accordance with the said
regulation.
PKF
Dubai
United Arab Emirates
18 April 2012
INDEPENDENT AUDITOR’S REPORT TO THE SHAREHOLDER OFMARICO MIDDLE EAST FZE

188
M A R I C O M I D D L E E A S T F Z E
Notes 2012 2011 2012 2011
AED AED Rs,crore Rs,Crore
NON–CURRENT ASSETS
Property, plant and equipment 6 525,276 701,198 0.73 0.85
Investments in subsidiaries 7 32,001,823 32,001,823 44.33 38.85
Non–current financial assets 8 59,376,267 65,795,642 82.24 79.87
91,903,366 98,498,663 127.30 119.57
CURRENT ASSETS
Trade and other receivables 9 46,272,336 30,798,072 64.09 37.39
Cash and cash equivalents 11 604,474 1,398,555 0.84 1.70
46,876,810 32,196,627 64.93 39.08
TOTAL ASSETS 1,38,780,176 1,30,695,290 192.22 158.65
CURRENT LIABILITIES
Bank borrowings 12 82,505,075 78,570,806 114.28 95.38
Trade and other payables 13 32,403,053 28,239,616 44.88 34.28
1,14,908,128 1,06,810,422 159.16 129.66
NON–CURRENT LIABILITIES
Provision for staff end–of–service gratuity 14 379,394 436,734 0.53 0.53
SHAREHOLDE’S FUNDS
Share capital 15 22,000,000 22,000,000 30.47 26.71
Accumulated losses (1,733,589) (1,024,511) (2.40) (1.24)
Equity funds 20,266,411 20,975,489 28.07 25.46
Loan from parent company 16 3,226,243 2,472,645 4.47 3.00
23,492,654 23,448,134 32.54 28.46
TOTAL EQUITY AND LIABILITIES 1,38,780,176 1,30,695,290 192.22 158.65
The accompanying notes form an integral part of these financial statements.
The report of the independent auditor is set forth on pages 1 and 2.
We confirm that we are responsible for these financial statements, including selecting the accounting policies and making
the judgments underlying them, We confirm that we have made available all relevant accounting records and information for
their compilation Authorised for issue by the directors on 15 April 2012.
STATEMENT OF FINANCIAL POSITION31 MARCH 2012
FOR MARICO MIDDLE EAST FZE
DIRECTORS
Note - The exchange rate used to convert AED to Rs. <13.851> / <AED> (Rs. <12.139> / <AED>)“The columns in INR are not part of the audited financial statements and the audit opinion does not apply to them.”

189
M A R I C O M I D D L E E A S T F Z E
Notes 2012 2011 2012 2011
AED AED Rs,crore Rs,Crore
REVENUE 1,51,012,513 99,808,788 209.17 121.16
Purchases of inventory (95,185,675) (61,092,772) (131.84) (74.16)
GROSS PROFIT 55,826,838 38,716,016 77.33 47.00
Other operating income 128,533 58,901 0.18 0.07
Staff costs 18 (9,421,294) (7,130,255) (13.05) (8.66)
Depreciation (128,728) (121,759) (0.18) (0.15)
Other operating expenses 19 (46,531,484) (43,338,562) (64.45) (52.61)
LOSS FROM OPERATING ACTIVITIES (126,135) (11,815,659) (0.17) (14.34)
Interest income 20 1,403,851 1,648,192 1.94 2.00
Finance costs 21 (1,986,794) (1,820,643) (2.75) (2.21)
LOSS FOR THE YEAR (709,078) (11,988,110) (0.98) (14.55)
Other comprehensive income – – – –
TOTAL COMPREHENSIVE INCOME FOR THE YEAR (709,078) (11,988,110) (0.98) (14.55)
The accompanying notes form an integral part of these financial statements.
The report of the independent auditor is set forth on pages 1 and 2.
STATEMENT OF COMPREHENSIVE INCOMEYEAR ENDED 31 MARCH 2012
FOR MARICO MIDDLE EAST FZE
DIRECTORS
Note - The exchange rate used to convert AED to Rs. <13.851> / <AED> (Rs. <12.139> / <AED>)“The columns in INR are not part of the audited financial statements and the audit opinion does not apply to them.”
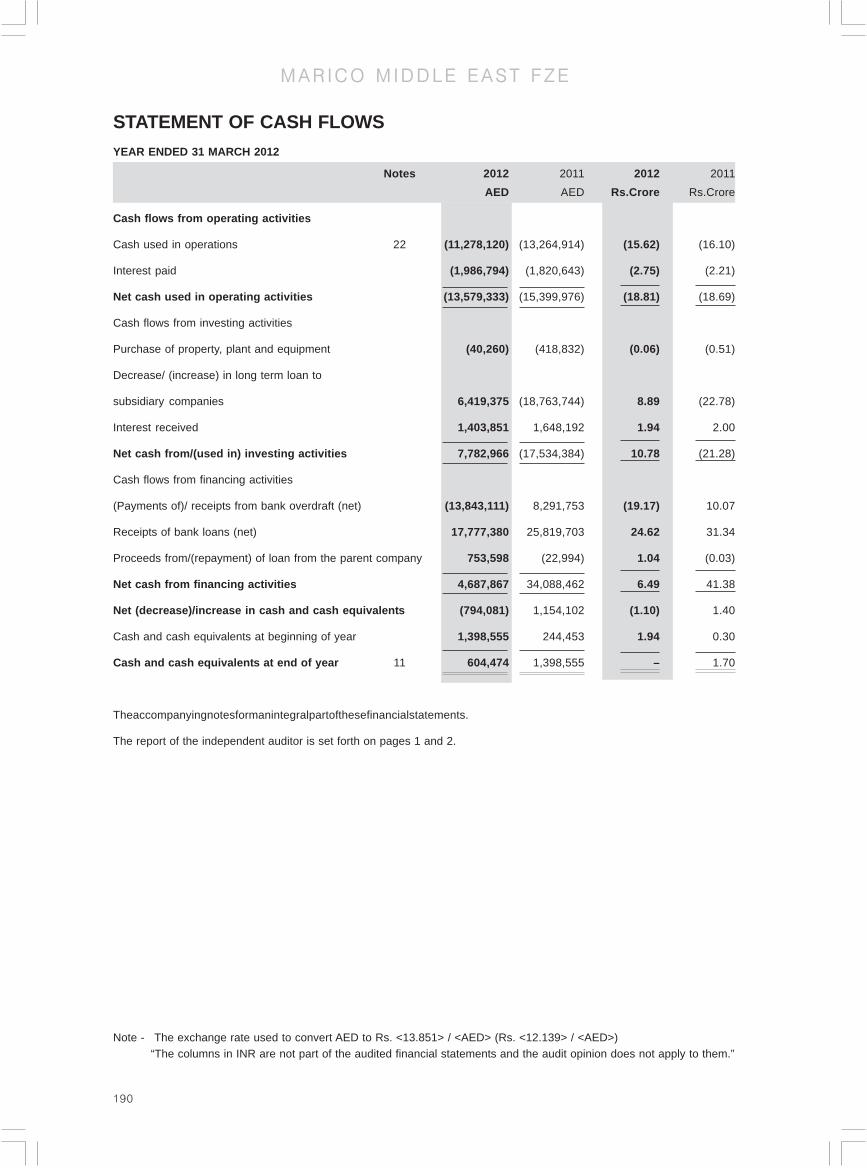
190
M A R I C O M I D D L E E A S T F Z E
Notes 2012 2011 2012 2011
AED AED Rs.Crore Rs.Crore
Cash flows from operating activities
Cash used in operations 22 (11,278,120) (13,264,914) (15.62) (16.10)
Interest paid (1,986,794) (1,820,643) (2.75) (2.21)
Net cash used in operating activities (13,579,333) (15,399,976) (18.81) (18.69)
Cash flows from investing activities
Purchase of property, plant and equipment (40,260) (418,832) (0.06) (0.51)
Decrease/ (increase) in long term loan to
subsidiary companies 6,419,375 (18,763,744) 8.89 (22.78)
Interest received 1,403,851 1,648,192 1.94 2.00
Net cash from/(used in) investing activities 7,782,966 (17,534,384) 10.78 (21.28)
Cash flows from financing activities
(Payments of)/ receipts from bank overdraft (net) (13,843,111) 8,291,753 (19.17) 10.07
Receipts of bank loans (net) 17,777,380 25,819,703 24.62 31.34
Proceeds from/(repayment) of loan from the parent company 753,598 (22,994) 1.04 (0.03)
Net cash from financing activities 4,687,867 34,088,462 6.49 41.38
Net (decrease)/increase in cash and cash equivalents (794,081) 1,154,102 (1.10) 1.40
Cash and cash equivalents at beginning of year 1,398,555 244,453 1.94 0.30
Cash and cash equivalents at end of year 11 604,474 1,398,555 – 1.70
Theaccompanyingnotesformanintegralpartofthesefinancialstatements.
The report of the independent auditor is set forth on pages 1 and 2.
STATEMENT OF CASH FLOWSYEAR ENDED 31 MARCH 2012
Note - The exchange rate used to convert AED to Rs. <13.851> / <AED> (Rs. <12.139> / <AED>)“The columns in INR are not part of the audited financial statements and the audit opinion does not apply to them.”

191
M A R I C O M I D D L E E A S T F Z E
1. LEGAL STATUS AND BUSINESS ACTIVITY
a) MARICO MIDDLE EAST FZE is a Free Zone Establishment with limited liability registered in the Jebel Ali Free
Zone pursuant to Law No.9 of 1992 of late H. H. Sheikh Maktoum Bin Rashid AI Maktoum, former Ruler of Dubai.
The registered office is P.O. Box 50394, Dubai, UAE. The establishment was registered on 8 November 2005 and
commenced operations on 15 November 2005.
b) The establishment trades in personal care, food and health care products and equipments.
c) The parent company is “Marico Limited”, a company registered in India, which is the ultimate parent company.
d) These are separate financial statements of Marico Middle East FZE. The financial statements of the subsidiary
companies are not consolidated in these financial statements as they will be consolidated in the financial statements
of the ultimate parent company.
2. SIGNIFICANT ACCOUNTING POLICIES
The significant accounting policies adopted, and which have been consistently applied, are as follows:
a) Basis of preparation
The financial statements are presented in UAE Dirhams and prepared using historical cost, and in accordance
with International Financial Reporting Standards issued or adopted by the International Accounting Standards
Board (IASB) and which are effective for accounting periods beginning on or after 1 April 2011, and the laws of the
Jebel Ali Free Zone.
As at the reporting date the establishment has accumulated losses of AED 1,733,589 and its current liabilities
exceed its current assets by AED 68,031,318. However the shareholder has agreed to provide continuing financial
support to enable the establishment to discharge its liabilities as and when they fall due. Accordingly, there financial
statements has been prepared on a going concern basis.
b) Property, plant and equipment
Property, plant and equipment are stated at cost less accumulated depreciation and impairment losses. The cost
less estimated residual value, where material, is depreciated from the date the asset is available for use until it is
derecognised, using the straight-line method over the estimated useful lives of the assets as follows:
Furniture, fixtures and office equipment 3 to 15 years
Motor vehicles 10 years
Capital work-in-progress is not depreciated. This will be depreciated from the date the relevant assets are ready
for use.
An assessment of depreciation method, useful lives and residual values are undertaken at each reporting date
and, where material, if there is a change in estimate, an appropriate adjustment is made to the depreciation
charge.
c) Investment in subsidiary
Subsidiaries are those enterprises which are controlled by the establishment. Control exists when the establishment
holds more than 50% of the share capital of the investee company or controls the investee company’s financial
and operating policies of the entity under a statute or an agreement or controls more than half of the voting rights
by virtue of an agreement with other investors. The investments in subsidiaries are stated at cost and provisions
are made for impairment losses, if any.
NOTES TO THE FINANCIAL STATEMENTSYEAR ENDED 31 MARCH 2012

192
M A R I C O M I D D L E E A S T F Z E
d) Inventories
Inventories are stated at the lower of cost and net realizable value. Cost is arrived at using the First-In, First-Out
(FIFO) method and comprises invoice value plus applicable landing charges less discounts. Net realizable value
is based on estimated selling price less any estimated cost of completion and disposal.
e) Staff end-of-service gratuity
Provision is made for end-of-service gratuity payable to the staff at the reporting date in accordance with the local
labour laws.
f) Revenue
Revenue represents the net amout invoiced for goods delivered during the year. The revenue also includes sales
on trans-shipment basis i.e. the supplier ships goods directly to the customer. Revenue is recognized when
significat risks and rewards relating to the ownership of goods are transferred to the customer, and is based on
amount invoiced to customers, net of discounts and returns, for trans-shipments made during the year.
g) Leases
Leases under which substantially all the risks and rewards of ownership of the related asset remain with the lessor
are classified as operating leases and the lease payments are charged to profit or loss on a straight-line basis
over the period of the lease.
h) Foreign currency transactions
Transactions in foreign currencies are translated into UAE Dirhams at the rate of exchange ruling on the date of
the transactions.
Monetary assets and liabilities expressed in foreign currencies are translated into UAE Dirhams at the rate of
exchange ruling at the reporting date.
Gains or losses resulting from foreign currency transactions are taken to the profit or loss.
i) Cash and cash equivalents
Cash and cash equivalents comprise cash, bank current accounts, bank deposits free of encumbrance with a
maturity date of three months or less from the date of deposit and highly liquid investments with a maturity date of
three months or less from the date of investment.
j) Financial instruments
Financial assets and financial liabilities are recognised when, and only when, the establishment becomes a party
to the contractual provisions of the instrument.
Financial assets are de-recognised when, and only when, the contractual rights to receive cash flows expire or
when substantially all the risks and rewards of ownership have been transferred.
Financial liabilities are de-recognised when, and only when, they are extinguished, cancelled or expired.
Current and non-current financial assets that have fixed or determinable payments and for which there is no active
market, which comprise long term loan to wholly owned subsidiaries and trade and other receivable are classified
as loans and receivables and stated at cost or, if the impact is material, at amortised cost using the effective
interest method, less any write down for impairment losses plus reversals of impairment losses. Impairment losses
and reversals thereof are recognised in profit or loss.
Current and non-current financial liabilities, which comprise current and non-current bank borrowings, trade and
other payables and long term loan from parent company, are measured at cost or, if the impact is material, at
amortised cost using the effective interest method.
NOTES TO THE FINANCIAL STATEMENTSYEAR ENDED 31 MARCH 2012

193
M A R I C O M I D D L E E A S T F Z E
3. SIGNIFICANT JUDGMENTS EMPLOYED IN APPLYING ACCOUNTING POLICIES
The significant judgments made in applying accounting policies that have the most significant effect on the amounts
recognised in the financial statements are as follows:
Impairment
At each reporting date, management conducts an assessment of property, plant, equipment and all financial assets to
determine whether there are any indications that they may be impaired. In the absence of such indications, no further
action is taken. If such indications do exist, an analysis of each asset is undertaken to determine its net recoverable
amount and, if this is below its carrying amount, a provision is made. In the case of loans and receivables, if an amount
is deemed irrecoverable, it is written off to profit or loss account or, if previously a provision was made, it is written off
against the provision. Reversals of provisions against loans and receivables are made to the extent of the related
amounts being recovered.
4. KEY SOURCES OF ESTIMATION UNCERTAINTY
Key assumptions made concerning the future and other key sources of estimation uncertainty at the reporting date that
have a significant risk of causing a material adjustment to the carrying amounts of assets and liabilities within the next
financial year, are as follows:
Carrying values of property, plant and equipment
Residual values are assumed to be zero unless a reliable estimate of the current value can be obtained for similar
assets of ages and conditions that are reasonably expected to exist at the end of the assets’ estimated useful lives.
Doubtful debt provisions
Management regularly undertakes a review of the amounts of loans and receivables owed to the establishment either
from third parties, (refer Note 9) or from related parties (refer Note 10) and assesses the likelihood of non-recovery.
Such assessment is based upon the age of the debts, historic recovery rates and assessed creditworthiness of the
debtor. Based on the assessment assumptions are made as to the level of provisioning required.
Impairment
Assessments of net recoverable amounts of property, plant, equipment and all financial assets other than loans and
receivables (refer above) are based on assumptions regarding future cash flows expected to be received from the
related assets.
Staff end-of-service gratuity
The establishment computes the provision for the liability to staff end-of-service gratuity stated at AED 379,394 (previous
year AED 436,734), assuming that all employees were to leave as of the reporting date, The management is of the
opinion that no significant difference would have arisen had the liability been calculated on an actuarial basis as salary
inflation and discount rates are likely to have approximately equal and opposite effects.
5. ADOPTION OF NEW INTERNATIONAL FINANCIAL REPORTING STANDARDS
The following International Financial Reporting Standards, amendments thereto and Interpretations that became effective
for the current reporting period and which are applicable to the establishment are as follows. Their adoption has
resulted in presentation and disclosure changes only:
� IAS24: Related Party Disclosures
� Improvements to IFRS
• IFRS 7: Financial Instruments: Disclosures
• IAS 1: Presentation of Financial Statements
NOTES TO THE FINANCIAL STATEMENTSYEAR ENDED 31 MARCH 2012

194
M A R I C O M I D D L E E A S T F Z E
The following International Financial Reporting Standards, amendments thereto and Interpretations that are assessed
by management as likely to have an impact on the financial statements have been issued by the IASB prior to the date
the financial statements were authorised for issue but have not been applied in these financial statements as their
effective dates of adoption are for future accounting periods. It is anticipated that their adoption in the relevant accounting
periods will have an impact only on presentation and disclosures within the financial statements:
• IFRS 9: Financial Instruments (1 January 2013)
• Presentation of Items in Other Comprehensive Income: Amendments to IAS1 (1 July 2012)
• IAS19: Employee Benefits (1 January 2013)
• IAS27: Separate Financial Statements (1 January 2013)
• IFRS13: Fair Value Measurement (1 January 2013)
6. PROPERTY, PLANT AND EQUIPMENT
Furniture, Furniture,
Capital fixtures and Motor Total Capital fixtures and Motor Total
work in office vehicles work in office vehicles
progress equipment progress equipment
AED AED AED AED Rs. Rs. Rs. Rs.
Crore Crore Crore Crore
Cost
As at 1 April 2010 200,000 216,955 47,545 464,500 0.24 0.27 0.06 0.57
Additions – 418,832 – 418,832 – 0.51 – 0.51
Disposals (200,000) 200,000 – – (0.24) 0.24 – –
As at 31 March 2011 – 835,787 47,545 883,332 – 1.01 0.06 1.07
Additions – 40,260 – 40,260 – 0.06 – 0.06
Write offs – (153,044) – (153,044) – (0.21) – (0.21)
As at 31 March 2012 – 723,003 47,545 770,548 – 1.00 0.07 1.07
Accumulated depreciation and impairment losses
As at 31 March 2010 – 47,201 13,174 60,375 – 0.06 0.02 0.07
Depreciation – 117,242 4,517 121,759 – 0.14 0.01 0.15
As at 31 March 2011 – 164,443 17,691 182,134 – 0.20 0.02 0.22
Depreciation – 124,210 4,518 128,728 – 0.17 0.01 0.18
Adjustment relating to write offs – (65,590) – (65,590) – (0.09) – (0.09)
As at 31 March 2012 – 22,306 22,209 245,272 – 0.31 0.03 0.34
Net book values
As at 1 April 2010 200,000 169,754 34,371 404,125 0.24 0.21 0.04 0.49
As at 31 March 2011 – 671,344 29,854 701,198 – 0.81 0.04 0.85
As at 31 March 2012 – 499,940 25,336 525,276 – 0.69 0.04 0.07
Notes
• Capital work–in–progress relates to furniture, fixtures and office equipment.
NOTES TO THE FINANCIAL STATEMENTSYEAR ENDED 31 MARCH 2012
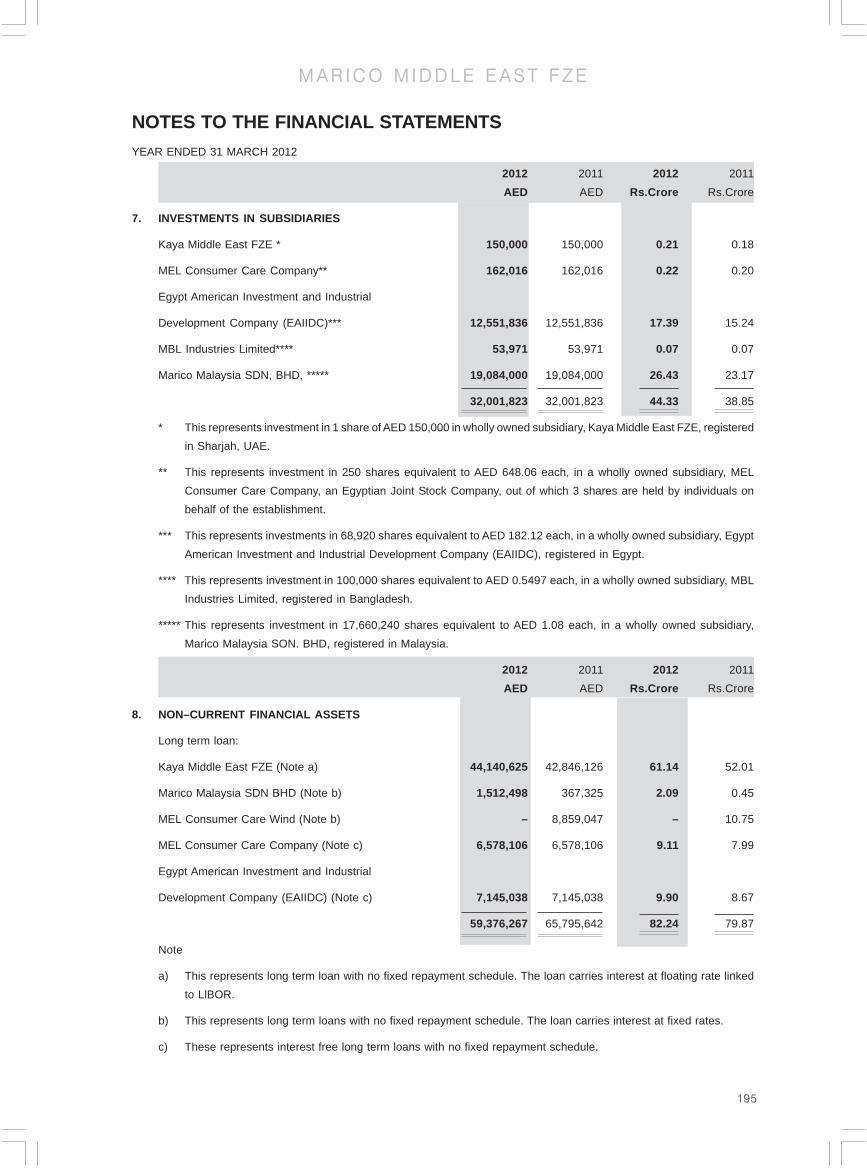
195
M A R I C O M I D D L E E A S T F Z E
2012 2011 2012 2011
AED AED Rs.Crore Rs.Crore
7. INVESTMENTS IN SUBSIDIARIES
Kaya Middle East FZE * 150,000 150,000 0.21 0.18
MEL Consumer Care Company** 162,016 162,016 0.22 0.20
Egypt American Investment and Industrial
Development Company (EAIIDC)*** 12,551,836 12,551,836 17.39 15.24
MBL Industries Limited**** 53,971 53,971 0.07 0.07
Marico Malaysia SDN, BHD, ***** 19,084,000 19,084,000 26.43 23.17
32,001,823 32,001,823 44.33 38.85
* This represents investment in 1 share of AED 150,000 in wholly owned subsidiary, Kaya Middle East FZE, registered
in Sharjah, UAE.
** This represents investment in 250 shares equivalent to AED 648.06 each, in a wholly owned subsidiary, MEL
Consumer Care Company, an Egyptian Joint Stock Company, out of which 3 shares are held by individuals on
behalf of the establishment.
*** This represents investments in 68,920 shares equivalent to AED 182.12 each, in a wholly owned subsidiary, Egypt
American Investment and Industrial Development Company (EAIIDC), registered in Egypt.
**** This represents investment in 100,000 shares equivalent to AED 0.5497 each, in a wholly owned subsidiary, MBL
Industries Limited, registered in Bangladesh.
***** This represents investment in 17,660,240 shares equivalent to AED 1.08 each, in a wholly owned subsidiary,
Marico Malaysia SON. BHD, registered in Malaysia.
2012 2011 2012 2011
AED AED Rs.Crore Rs.Crore
8. NON–CURRENT FINANCIAL ASSETS
Long term loan:
Kaya Middle East FZE (Note a) 44,140,625 42,846,126 61.14 52.01
Marico Malaysia SDN BHD (Note b) 1,512,498 367,325 2.09 0.45
MEL Consumer Care Wind (Note b) – 8,859,047 – 10.75
MEL Consumer Care Company (Note c) 6,578,106 6,578,106 9.11 7.99
Egypt American Investment and Industrial
Development Company (EAIIDC) (Note c) 7,145,038 7,145,038 9.90 8.67
59,376,267 65,795,642 82.24 79.87
Note
a) This represents long term loan with no fixed repayment schedule. The loan carries interest at floating rate linked
to LlBOR.
b) This represents long term loans with no fixed repayment schedule. The loan carries interest at fixed rates.
c) These represents interest free long term loans with no fixed repayment schedule.
NOTES TO THE FINANCIAL STATEMENTSYEAR ENDED 31 MARCH 2012
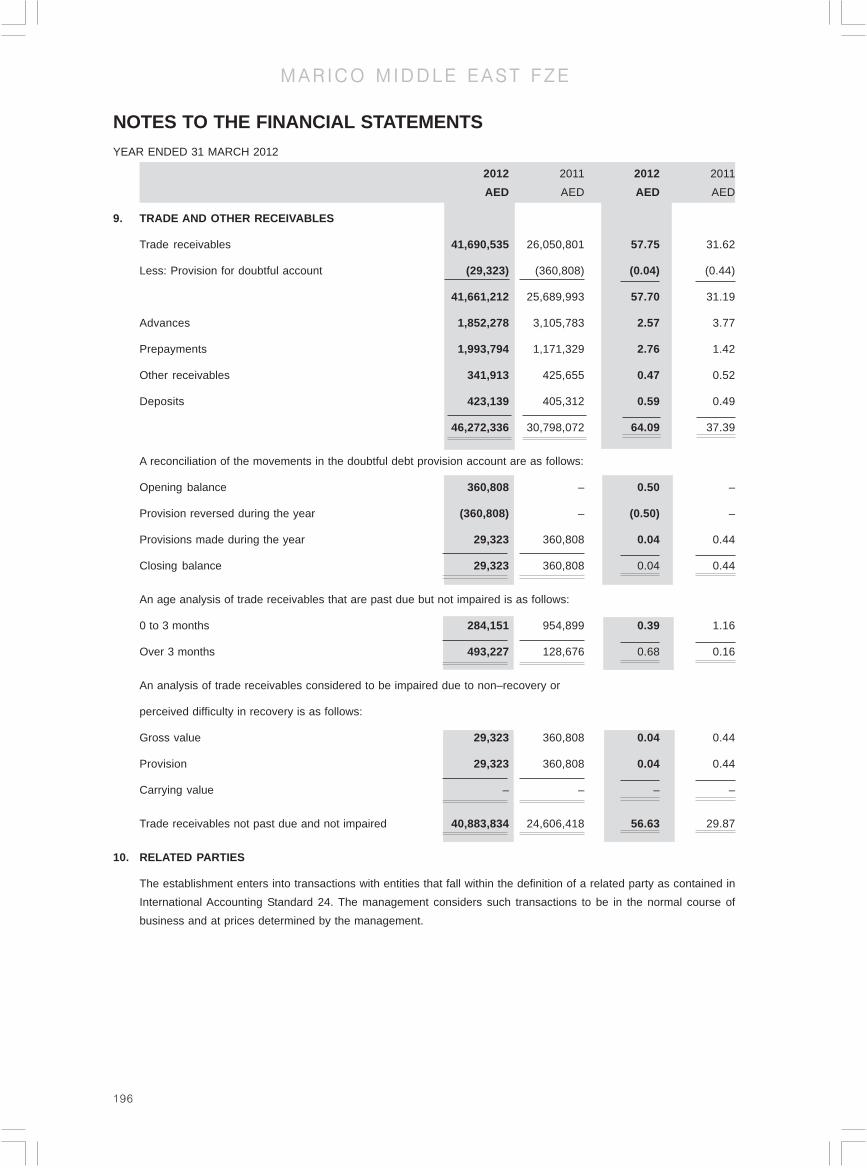
196
M A R I C O M I D D L E E A S T F Z E
2012 2011 2012 2011
AED AED AED AED
9. TRADE AND OTHER RECEIVABLES
Trade receivables 41,690,535 26,050,801 57.75 31.62
Less: Provision for doubtful account (29,323) (360,808) (0.04) (0.44)
41,661,212 25,689,993 57.70 31.19
Advances 1,852,278 3,105,783 2.57 3.77
Prepayments 1,993,794 1,171,329 2.76 1.42
Other receivables 341,913 425,655 0.47 0.52
Deposits 423,139 405,312 0.59 0.49
46,272,336 30,798,072 64.09 37.39
A reconciliation of the movements in the doubtful debt provision account are as follows:
Opening balance 360,808 – 0.50 –
Provision reversed during the year (360,808) – (0.50) –
Provisions made during the year 29,323 360,808 0.04 0.44
Closing balance 29,323 360,808 0.04 0.44
An age analysis of trade receivables that are past due but not impaired is as follows:
0 to 3 months 284,151 954,899 0.39 1.16
Over 3 months 493,227 128,676 0.68 0.16
An analysis of trade receivables considered to be impaired due to non–recovery or
perceived difficulty in recovery is as follows:
Gross value 29,323 360,808 0.04 0.44
Provision 29,323 360,808 0.04 0.44
Carrying value – – – –
Trade receivables not past due and not impaired 40,883,834 24,606,418 56.63 29.87
10. RELATED PARTIES
The establishment enters into transactions with entities that fall within the definition of a related party as contained in
International Accounting Standard 24. The management considers such transactions to be in the normal course of
business and at prices determined by the management.
NOTES TO THE FINANCIAL STATEMENTSYEAR ENDED 31 MARCH 2012
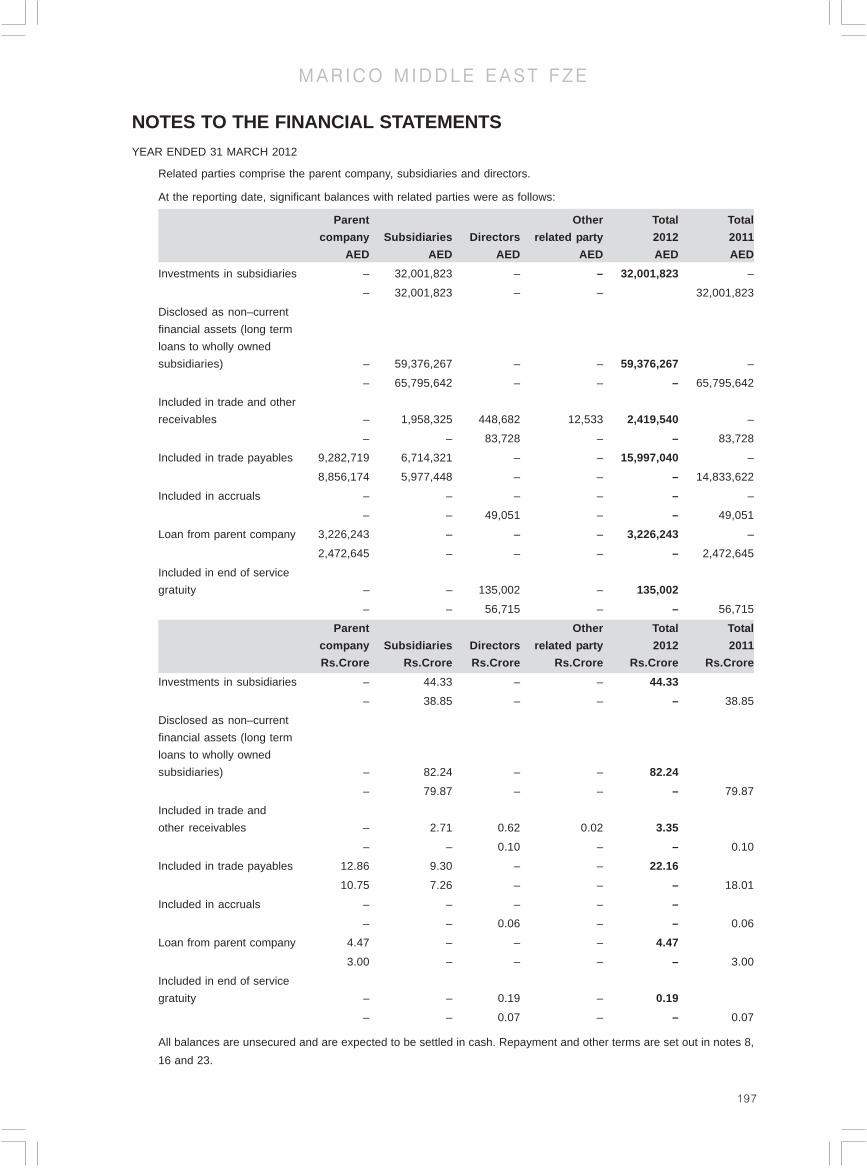
197
M A R I C O M I D D L E E A S T F Z E
Related parties comprise the parent company, subsidiaries and directors.
At the reporting date, significant balances with related parties were as follows:
Parent Other Total Total
company Subsidiaries Directors related party 2012 2011
AED AED AED AED AED AED
Investments in subsidiaries – 32,001,823 – – 32,001,823 –
– 32,001,823 – – 32,001,823
Disclosed as non–current
financial assets (long term
loans to wholly owned
subsidiaries) – 59,376,267 – – 59,376,267 –
– 65,795,642 – – – 65,795,642
Included in trade and other
receivables – 1,958,325 448,682 12,533 2,419,540 –
– – 83,728 – – 83,728
Included in trade payables 9,282,719 6,714,321 – – 15,997,040 –
8,856,174 5,977,448 – – – 14,833,622
Included in accruals – – – – – –
– – 49,051 – – 49,051
Loan from parent company 3,226,243 – – – 3,226,243 –
2,472,645 – – – – 2,472,645
Included in end of service
gratuity – – 135,002 – 135,002
– – 56,715 – – 56,715
Parent Other Total Total
company Subsidiaries Directors related party 2012 2011
Rs.Crore Rs.Crore Rs.Crore Rs.Crore Rs.Crore Rs.Crore
Investments in subsidiaries – 44.33 – – 44.33
– 38.85 – – – 38.85
Disclosed as non–current
financial assets (long term
loans to wholly owned
subsidiaries) – 82.24 – – 82.24
– 79.87 – – – 79.87
Included in trade and
other receivables – 2.71 0.62 0.02 3.35
– – 0.10 – – 0.10
Included in trade payables 12.86 9.30 – – 22.16
10.75 7.26 – – – 18.01
Included in accruals – – – – –
– – 0.06 – – 0.06
Loan from parent company 4.47 – – – 4.47
3.00 – – – – 3.00
Included in end of service
gratuity – – 0.19 – 0.19
– – 0.07 – – 0.07
All balances are unsecured and are expected to be settled in cash. Repayment and other terms are set out in notes 8,
16 and 23.
NOTES TO THE FINANCIAL STATEMENTSYEAR ENDED 31 MARCH 2012

198
M A R I C O M I D D L E E A S T F Z E
Significant transactions with related parties during the year were as follows:
Parent Subsidiaries Directors Total Total
company 2012 2011
AED AED AED AED AED
Sales – 39,632,063 – 39,632,063 –
– 8,192,117 – – 8,192,117
Purchases 30,551,815 29,494,946 – 60,046,761 –
22,042,775 32,201,384 – – 54,244,159
Royalty expenses 2,784,511 – – 2,290,417 –
27,84,511 – – 22,90,417 –
Salaries and benefits – – 1,417,275 1,417,275 –
– – 629,240 – 629,240
End–of–service gratuity – – 30,707 30,707
– – 18,905 – 18,905
Interest expenses – – – – –
206,562 – – 206,562
Bank guarantee charges 1,065,170 – – 1,065,170
473,127 – – – 473,127
Operating lease expenses charged – 409,329 – 409,329 –
– 471,935 – 471,935
Recharge of expenses 205,891 – – 205,891 –
231,428 – – – 231,428
Interest income – 1,403,851 – 1,403,851 –
– 1,648,192 – – 1,648,192
The establishment also provides fund to/receives fund from related parties as working capital facilities at floating rates
of interest.
Parent Subsidiaries Directors Total Total
company 2012 2011
Rs.Crore Rs.Crore Rs.Crore Rs.Crore Rs.Crore
Sales – 54.89 – 54.89 –
– 9.94 – – 9.94
Purchases 42.32 40.85 – 83.17 –
26.76 39.09 – – 65.85
Royalty expenses 3.86 – – 3.17 –
3.38 – – 2.78 –
Salaries and benefits – – 1.96 1.96 –
– – 0.76 – 0.76
End–of–service gratuity – – 0.04 0.04 –
– – 0.02 – 0.02
Interest expenses – – – – –
0.25 – – – 0.25
Bank guarantee charges 1.48 – – 1.48 –
0.57 – – – 0.57
Operating lease expenses charged – 0.57 – 0.57 –
– 0.57 – – 0.57
Recharge of expenses 0.29 – – 0.29 –
0.28 – – – 0.28
Interest income – 1.94 – 1.94 –
– 2.00 – – 2.00
NOTES TO THE FINANCIAL STATEMENTSYEAR ENDED 31 MARCH 2012

199
M A R I C O M I D D L E E A S T F Z E
2012 2011 2012 2011
AED AED Rs.Crore Rs.Crore
11. CASH AND CASH EQUIVALENTS
Cash and cheques on hand 65,040 98,680 0.09 0.12
Bank balances in current account 539,434 1,299,875 0.75 1.58
604,474 1,398,555 0.84 1.70
12. BANK BORROWINGS
Term loan 80,520,783 62,743,403 111.53 76.16
Overdraft 198,429 15,827,403 – 19.21
82,505,075 78,570,806 114.28 95.38
An analysis by bank of amounts outstanding is as follows:
2012 2011 2,012 2,011
AED AED Rs.Crore Rs.Crore
Barclays Bank – 37,032,553 – 44.95
JP Morgan 36,749,152 – 50.90 –
HSBC 25,715,754 25,710,850 35.62 31.21
Standard Chartered Bank 20,040,169 15,827,403 27.76 19.21
82,505,075 78,570,806 114.28 95.38
Bank borrowings are secured against:
a) Term loans are secured by corporate guarantee of the parent company and are payable within one year from the
date of loan.
b) Bank guarantee and/or stand–by letter of credit for US$ 5,000,000 from Standard Chartered Bank in India.
c) Bank overdraft from Standard Chartered Bank is secured against promissory note for US$ 4,800,000
13. TRADE AND OTHER PAYABLES
2012 2011 2012 2011
AED AED Rs.Crore Rs.Crore
Trade payables 17,351,730 17,678,402 24.03 21.46
Accrual 15,051,323 10,561,214 20.85 12.82
32,403,053 28,239,616 44.88 34.28
14. PROVISION FOR STAFF END–OF–SERVICE GRATUITY
2012 2011 2012 2011
AED AED Rs.Crore Rs.Crore
Opening balance 436,734 292,729 0.60 0.36
Provision for the year 217,769 200,904 0.30 0.24
Paid during the year (275) (56,899) – (0.07)
Closing balance 379,394 436,734 0.53 0.53
NOTES TO THE FINANCIAL STATEMENTSYEAR ENDED 31 MARCH 2012

200
M A R I C O M I D D L E E A S T F Z E
15. SHARE CAPITAL
Issued and Paid up:
22 shares of AED 1,000,000 each
(previous year 22 share of AED 1,000,000 each) 22,000,000 22,000,000 30.47 26.71
16. LOAN FROM PARENT COMPANY
This represents interest bearing long term loan received from parent company with no fixed repayment schedule.
17. MANAGEMENT OF CAPITAL
The establishment’s objectives when managing capital are to ensure that the establishment continues as a going
concern and to provide the shareholder with a rate of return on its investment commensurate with the level of risk
assumed.
Capital, which is unchanged from the previous year, comprises equity funds as presented in the statement of financial
position together with shareholder loan and amounts due to/from related parties. Debt comprises total amounts owing
to third parties, net of cash and cash equivalents.
The establishment is subject to externally imposed capital requirements as per provisions of the Implementing Regulations
No. 1/92 issued by the Jebel Ali Free Zone Authority and the facility agreements with banks. The establishment has
complied with all the capital requirements to which it is subject.
Funds generated from internal accruals together with funds received from related parties net of funds provided to
related parties are retained in the business to limit bank borrowings within covenants and according to the business
requirements and maintain capital at desired levels. The nature of such covenants is set out in Note 12.
2012 2011 2012 2011
AED AED Rs.Crore Rs.Crore
18. STAFF COSTS
Staff salaries and benefits 9,203,525 6,929,351 12.75 8.41
Staff end–of–service gratuity 217,769 200,904 0.30 0.24
9,421,294 7,130,255 13.05 8.66
19. OTHER OPERATING EXPENSES
Operating lease expenses 438,619 619,829 0.61 0.75
Loss on sale of property, plant and equipment 87,454 – 0.12 –
Provision for doubtful debts 29,323 – 0.04 –
Selling expenses 37,124,528 35,814,170 51.42 43.47
Other expenses 8.851,560 6,904,563 12.26 8.38
46,531,484 43,338,562 64.45 52.61
20. INTEREST INCOME
On long term loans to subsidiaries 1,403,851 1,648,192 1.94 2.00
1,403,851 1,648,192 1.94 2.00
NOTES TO THE FINANCIAL STATEMENTSYEAR ENDED 31 MARCH 2012

201
M A R I C O M I D D L E E A S T F Z E
21. FINANCE COSTS
On bank loans and overdrafts 1,986,794 1,614,081 2.75 1.96
On loan from parent company – 206,562 – 0.25
1,986,794 1,820,643 2.75 2.21
22. CASH USED IN OPERATIONS
2012 2011 2012 2011
AED AED Rs.Crore Rs.Crore
Loss for the year (709,078) (11,988,110) (0.98) (14.55)
Adjustments for:
Depreciation of property, plant and equipment 128,728 121,759 0.18 0.15
Loss on sale of property, plant and equipment 87,454 – 0.12 –
Finance costs 1,986,794 1,820,643 2.75 2.21
Interest income (1,403,851) (1,648,192) (1.94) (2.00)
Operating loss before changes
in operating assets and liabilities 90,047 (11,693,900) 0.12 (14.20)
Increase in trade and other receivables (15,474,264) (5,684,360) (21.43) (6.90)
Increase in trade and other payables 4,163,437 3,654,922 5.77 4.44
(Decrease)/Increase in staff gratuity provision (57,340) 144,005 (0.08) 0.17
(11,278,120) (13,579,333) (15.62) (16.48)
23. FINANCIAL INSTRUMENTS
The net carrying amounts as at the reporting date of financial assets and financial liabilities are as follows:
Loans and receivables At amortised cost
2012 2011 2012 2011
AED AED AED AED
Non–current related party receivables 59,376,267 65,795,642 – –
Trade and other receivables 43,466,440 27,347,942 – –
Cash and cash equivalents 604,474 1,398,555 – –
Bank borrowings – – 82,505,075 52,859,956
Trade and other payables – – 30,588,899 28,239,616
Loan from parent company – – 3,226,243 2,472,645
1,03,447,181 94,542,139 1,16,320,217 83,572,217
NOTES TO THE FINANCIAL STATEMENTSYEAR ENDED 31 MARCH 2012
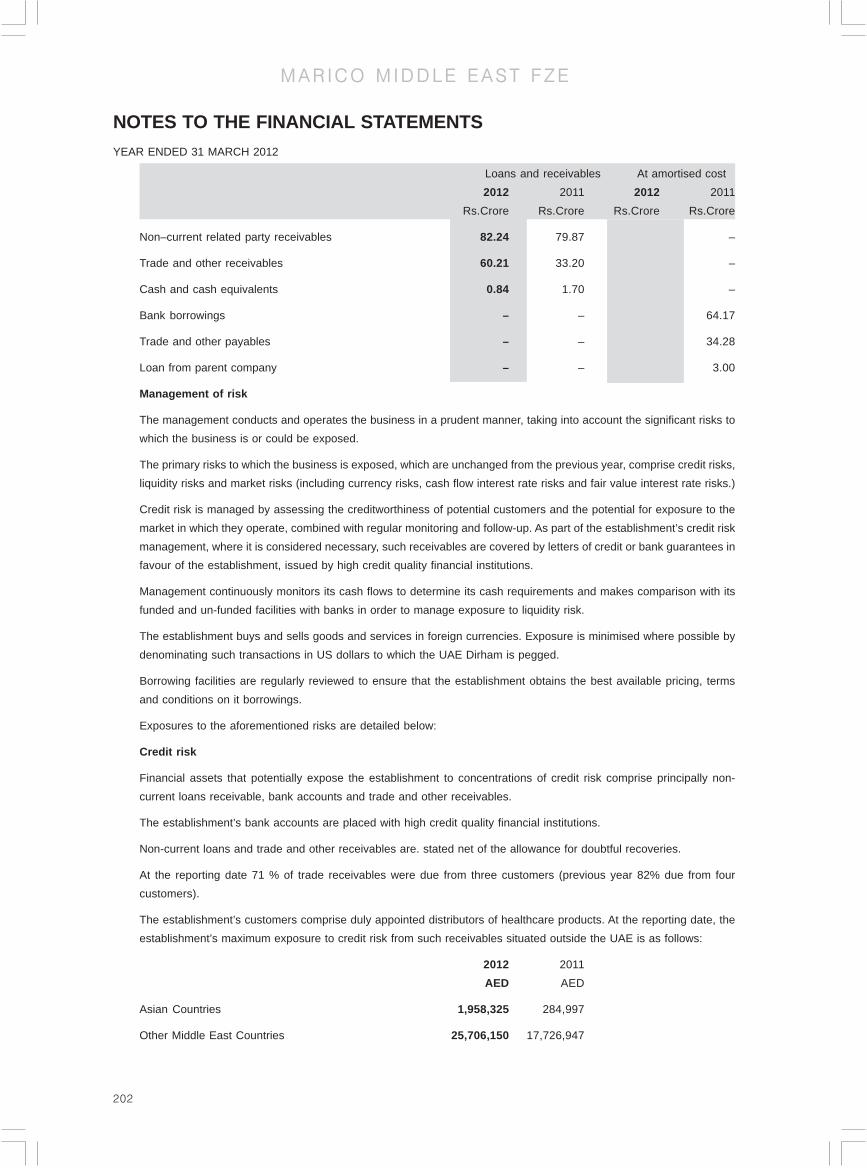
202
M A R I C O M I D D L E E A S T F Z E
Loans and receivables At amortised cost
2012 2011 2012 2011
Rs.Crore Rs.Crore Rs.Crore Rs.Crore
Non–current related party receivables 82.24 79.87 – –
Trade and other receivables 60.21 33.20 – –
Cash and cash equivalents 0.84 1.70 – –
Bank borrowings – – 114.28 64.17
Trade and other payables – – 42.37 34.28
Loan from parent company – – 4.47 3.00
Management of risk
The management conducts and operates the business in a prudent manner, taking into account the significant risks to
which the business is or could be exposed.
The primary risks to which the business is exposed, which are unchanged from the previous year, comprise credit risks,
liquidity risks and market risks (including currency risks, cash flow interest rate risks and fair value interest rate risks.)
Credit risk is managed by assessing the creditworthiness of potential customers and the potential for exposure to the
market in which they operate, combined with regular monitoring and follow-up. As part of the establishment’s credit risk
management, where it is considered necessary, such receivables are covered by letters of credit or bank guarantees in
favour of the establishment, issued by high credit quality financial institutions.
Management continuously monitors its cash flows to determine its cash requirements and makes comparison with its
funded and un-funded facilities with banks in order to manage exposure to liquidity risk.
The establishment buys and sells goods and services in foreign currencies. Exposure is minimised where possible by
denominating such transactions in US dollars to which the UAE Dirham is pegged.
Borrowing facilities are regularly reviewed to ensure that the establishment obtains the best available pricing, terms
and conditions on it borrowings.
Exposures to the aforementioned risks are detailed below:
Credit risk
Financial assets that potentially expose the establishment to concentrations of credit risk comprise principally non-
current loans receivable, bank accounts and trade and other receivables.
The establishment’s bank accounts are placed with high credit quality financial institutions.
Non-current loans and trade and other receivables are. stated net of the allowance for doubtful recoveries.
At the reporting date 71 % of trade receivables were due from three customers (previous year 82% due from four
customers).
The establishment’s customers comprise duly appointed distributors of healthcare products. At the reporting date, the
establishment’s maximum exposure to credit risk from such receivables situated outside the UAE is as follows:
2012 2011
AED AED
Asian Countries 1,958,325 284,997
Other Middle East Countries 25,706,150 17,726,947
NOTES TO THE FINANCIAL STATEMENTSYEAR ENDED 31 MARCH 2012

203
M A R I C O M I D D L E E A S T F Z E
Currency risk
There are no significant exchange rate risks as substantially all financial assets and financial liabilities are denominated
in UAE Dirhams or US Dollars to which the Dirham is fixed.
Interest rate risk
Loan from a parent company and long term loans to subsidiary companies (namely, MEL Consumer Care- Wind and
Marico Malaysia SDN BHD) are subject to fixed interest rates at levels generally obtained in UAE and are therefore
exposed to fair value interest rate risk. Long term loan to subsidiary company (namely, Kaya Middle East FZE) and
bank borrowings are subject to floating interest rates at levels generally obtained in the UAE or are linked to LBOR and
are therefore exposed to cash flow interest rate risk.
At the reporting date, if interest rates had been 1 % higher or lower interest expense on variable rate debt would have
been AED 962,555 (previous year AED 782,174) higher or lower and interest income on variable rate loans and advances
would have been AED 456,531 (previous year AED 520,725) higher or lower resulting in equity being higher or lower by
AED 506,023 (previous year AED 261,449).
Fair values
The fair value of a financial instrument is the amount for which an asset could be exchanged, or a liability settled,
between knowledgeable, willing parties in an arm’s length transaction. The fair values of the establishment’s financial
assets and financial liabilities which are required to be stated at cost or at amortised cost approximate to their carrying
values, except for long term loans to wholly owned subsidiaries and loan from parent company which due to their terms,
has fair value lower than the carrying value.
24. OPERATING LEASE COMMITMENTS
The establishment has entered into non-cancellable operating leases for five years. The total of the future lease payments
is as follows:
2012 2011 2012 2011
AED AED Rs. Crore Rs. Crore
Not later than one year 137,063 180,188 0.19 0.22
Between one and five years 505,800 758,700 0.7 0.92
642,863 938,888 0.89 1.1
25. OTHER CONTRACTED COMMITMENTS
2012 2011 2012 2011
AED AED Rs. Crore Rs. Crore
For advertisement services to be availed 231,210 – 0.32 _
For MARICO MIDDLE EAST FZE
DIRECTORS
NOTES TO THE FINANCIAL STATEMENTSYEAR ENDED 31 MARCH 2012

204
K A Y A M I D D L E E A S T F Z E
Board of Directors Ajay Pahwa
Rajdeep Singh Narag (w.e.f. September 29, 2011)
Arvind Khanduri (w.e.f. September 29, 2011)
Kaustubh Roplekar (w.e.f. September 29, 2011)
Secretary, Manager, Negotiator Arvind Khanduri (w.e.f. September 29, 2011)
Registered Offi ce Offi ce Bldg. 2, F-30, & 13 G - 04, P.O. Box 41756,
Hamriyah Free Zone, Sharjah, UAE
Auditors M/s Pannell Kerr Forster Chartered Accountants
Bankers Standard Chartered Bank Mashreq Bank
Legal Advisors M/s Pannell Kerr Forster Chartered Accountants

205
K A Y A M I D D L E E A S T F Z E
INDEPENDENT AUDITORS’ REPORTTO
THE SHAREHOLDER OF KAYA MIDDLE EAST FZE
Report on the fi nancial statements
We have audited the accompanying fi nancial statements of KAYA MIDDLE EAST FZE, which comprise the statement of fi nancial position as at 31 March 2012, and the statement of comprehensive income, statement of changes in equity and statement of cash fl ows for the year then ended, and a summary of signifi cant accounting policies and other explanatory information set out on pages 3 to 20.
Management's responsibility for the fi nancial statements
Management is responsible for the preparation of fi nancial statements that give a true and fair view in accordance with International Financial Reporting Standards, and for such internal control as management determines is necessary to enable the preparation of fi nancial statements that are free from material misstatement, whether due to fraud or error.
Auditor's responsibility
Our responsibility is to express an opinion on these fi nancial statements based on our audit. We conducted our audit in accordance with International Standards on Auditing. Those standards require that we comply with ethical requirements and plan and perform the audit to obtain reasonable assurance about whether the fi nancial statements are free from material misstatement.
An audit involves performing procedures to obtain audit evidence about the amounts and disclosures in the fi nancial statements. The procedures selected depend on the auditor's judgment, including the assessment of the risks of material misstatement of the fi nancial statements, whether due to fraud or error. In making those risk assessments, the auditor considers internal control relevant to the entity's preparation of fi nancial statements that give true and fair view in order to design audit procedures that are appropriate in the circumstances, but not for the purpose of expressing an opinion on the effectiveness of the entity's internal control. An audit also includes evaluating the appropriateness of accounting policies used and the reasonableness of accounting estimates made by management, as well as evaluating the overall presentation of the fi nancial statements.
We believe that the audit evidence we have obtained is suffi cient and appropriate to provide a basis for our audit opinion.
Opinion
In our opinion, the fi nancial statements give a true and fair view of the fi nancial position of KAYA MIDDLE EAST FZE as at 31 March 2012, and of its fi nancial performance and its cash fl ows for the year then ended in accordance with International Financial Reporting Standards.
Emphasis of matter
Without qualifying our opinion, we draw attention to Note 3 (a) to the fi nancial statements, which states that as at reporting date, the establishment has accumulated losses of AED 44,957,524 and net defi cit of AED 44,807,524 in equity funds. However, the ultimate parent company has agreed to continue with the operation of the establishment and the ultimate parent company is taking appropriate measures to ensure profi table operations of the establishment. Also, the ultimate parent company has agreed to provide continuing fi nancial support to the establishment to enable it to discharge its liabilities as and when they fall due for payment. Accordingly, these fi nancial statements have been prepared on a going concern basis.
Report on other legal and regulatory requirements
As the net assets of the establishment are below 75% of its share capital, the directors are required to take steps to intimate the Hamriya Free Zone Authority and remedy the situation in accordance with the Implementation procedures issued by the Hamriya Free Zone Authority pursuant to Sharjah Emiree Decree No. 6 of 1995. We have been informed that the directors will intimate the Free Zone Authorities and take steps to remedy the situation.
We further confi rm that, except for the matter stated above, the fi nancial statements comply with the Implementing Rules and Regulations issued by the Hamriya Free Zone Authority pursuant to Sharjah Emiree Decree No. 6 of 1995.
PANNELL KERR FORSTER
Sharjah, United Arab Emirates Auditor18th April 2012
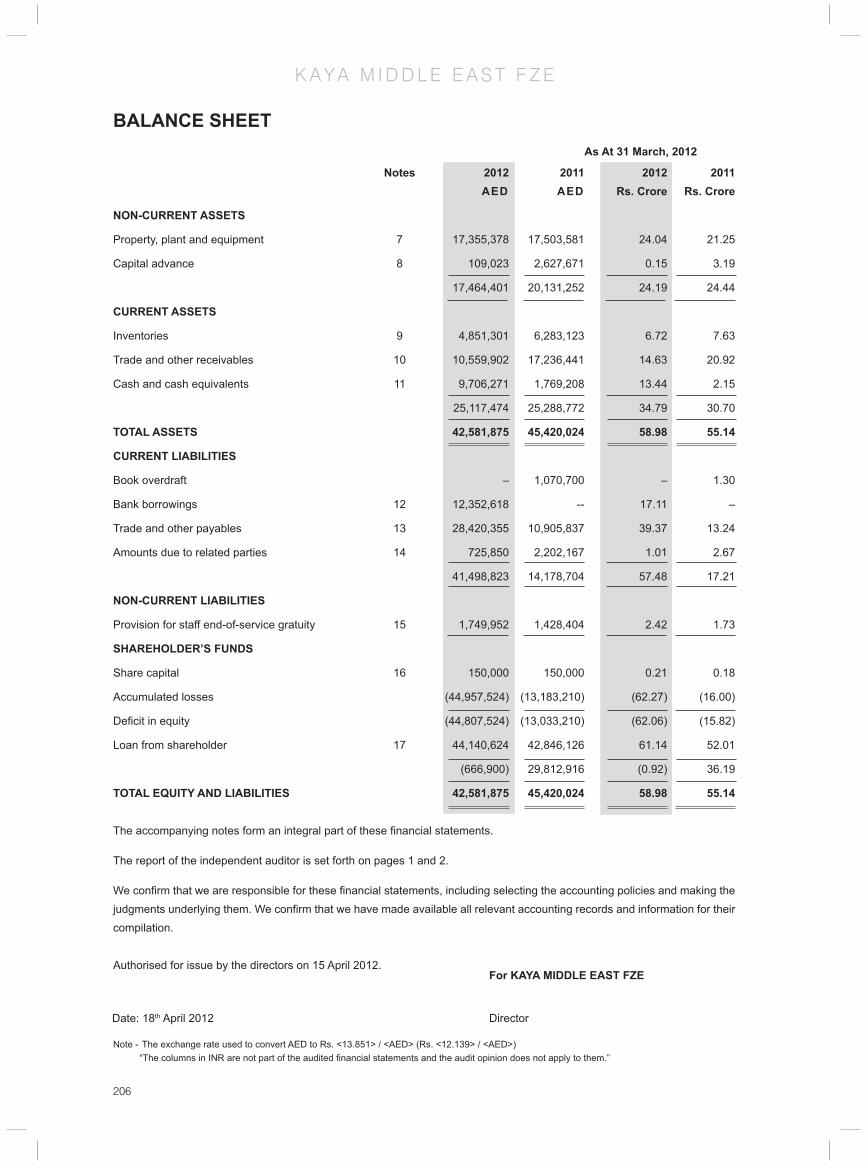
206
K A Y A M I D D L E E A S T F Z E
BALANCE SHEET As At 31 March, 2012
Notes 2012 2011 2012 2011 AED AED Rs. Crore Rs. Crore
NON-CURRENT ASSETS
Property, plant and equipment 7 17,355,378 17,503,581 24.04 21.25
Capital advance 8 109,023 2,627,671 0.15 3.19
17,464,401 20,131,252 24.19 24.44
CURRENT ASSETS
Inventories 9 4,851,301 6,283,123 6.72 7.63
Trade and other receivables 10 10,559,902 17,236,441 14.63 20.92
Cash and cash equivalents 11 9,706,271 1,769,208 13.44 2.15
25,117,474 25,288,772 34.79 30.70
TOTAL ASSETS 42,581,875 45,420,024 58.98 55.14
CURRENT LIABILITIES
Book overdraft – 1,070,700 – 1.30
Bank borrowings 12 12,352,618 -- 17.11 –
Trade and other payables 13 28,420,355 10,905,837 39.37 13.24
Amounts due to related parties 14 725,850 2,202,167 1.01 2.67
41,498,823 14,178,704 57.48 17.21
NON-CURRENT LIABILITIES
Provision for staff end-of-service gratuity 15 1,749,952 1,428,404 2.42 1.73
SHAREHOLDER’S FUNDS
Share capital 16 150,000 150,000 0.21 0.18
Accumulated losses (44,957,524) (13,183,210) (62.27) (16.00)
Defi cit in equity (44,807,524) (13,033,210) (62.06) (15.82)
Loan from shareholder 17 44,140,624 42,846,126 61.14 52.01
(666,900) 29,812,916 (0.92) 36.19
TOTAL EQUITY AND LIABILITIES 42,581,875 45,420,024 58.98 55.14
The accompanying notes form an integral part of these fi nancial statements.
The report of the independent auditor is set forth on pages 1 and 2.
We confi rm that we are responsible for these fi nancial statements, including selecting the accounting policies and making the judgments underlying them. We confi rm that we have made available all relevant accounting records and information for their compilation.
Authorised for issue by the directors on 15 April 2012.
29 / AED (Rs. 13.811 / AED)
For KAYA MIDDLE EAST FZE
S. Mohan Samir Srivastav Date: 18th April 2012 Director
Note - The exchange rate used to convert AED to Rs. <13.851> / <AED> (Rs. <12.139> / <AED>) “The columns in INR are not part of the audited fi nancial statements and the audit opinion does not apply to them.”

207
K A Y A M I D D L E E A S T F Z E
Year ended 31st March 2012
Notes 2012 2011 2012 2011 AED AED Rs. Crore Rs. Crore
REVENUE 65,141,789 46,518,954 90.23 56.47
Direct costs 19 (54,645,198) (34,468,413) (75.69) (41.84)
GROSS PROFIT 10,496,591 12,050,541 14.54 14.63
Other operating income 20 1,712,051 77,820 2.37 0.09
Selling and marketing expenses (9,572,455) (5,183,810) (13.26) (6.29)
Administrative and general expenses 21 (32,966,953) (14,221,989) (45.66) (17.26)
LOSS FROM OPERATING ACTIVITIES (30,330,766) (7,277,438) (42.01) (8.83)
Finance costs 22 (1,443,548) (960,123) (2.00) (1.17)
LOSS FOR THE YEAR (31,774,314) (8,237,561) (44.01) (10.00)
Other comprehensive income – – – –
TOTAL COMPREHENSIVE INCOME FOR THE YEAR (31,774,314) (8,237,561) (44.01) (10.00)
The accompanying notes form an integral part of these fi nancial statements. The report of the independent auditor is set forth on pages 1 and 2.
STATEMENT OF COMPREHENSIVE INCOME
For KAYA MIDDLE EAST FZE
S. Mohan Samir Srivastav Date: 18th April 2012 Director
Note - The exchange rate used to convert AED to Rs. <13.851> / <AED> (Rs. <12.139> / <AED>) “The columns in INR are not part of the audited fi nancial statements and the audit opinion does not apply to them.”

208
K A Y A M I D D L E E A S T F Z E
STATEMENT OF CHANGES IN EQUITY
Share Accumulated Share Accumulated capital losses Total capital losses Total AED AED AED In Rs. In Rs. In Rs. Crore Crore Crore
As at 31.3.2010 150,000 (4,945,649) (4,795,649) 0.21 (6.85) (6.64)
Total comprehensive income for the year – (8,237,561) (8,237,561) – (11.41) (11.41)
As at 31.3.2011 150,000 (13,183,210) (13,033,210) 0.21 (18.26) (18.05)
Total comprehensive income for the year – (31,774,314) (31,774,314) – (44.01) (44.01)
As at 31.3.2012 150,000 (44,957,524) (44,807,524) 0.21 (62.27) (62.06)
The accompanying notes form an integral part of these fi nancial statements.
The report of the independent auditor is set forth on pages 1 and 2.
For KAYA MIDDLE EAST FZE
S. Mohan Samir Srivastav Date: 18th April 2012 Director
Note - The exchange rate used to convert AED to Rs. <13.851> / <AED> (Rs. <12.139> / <AED>) “The columns in INR are not part of the audited fi nancial statements and the audit opinion does not apply to them.”

209
K A Y A M I D D L E E A S T F Z E
Year ended 31st March 2012
Notes 2012 2011 2012 2011 AED AED Rs. Crore Rs. Crore
Cash fl ows from operating activities
Cash generated from/(used in) operations 24 348,594 (8,365,863) 0.48 (10.16)
Finance costs (1,443,548) (1,443,548) (960,123) (2.00) –
Net cash used in operating activities (1,094,954) (9,325,986) (1.52) (11.32)
Cash fl ows from investing activities
Purchase of property, plant and equipment (4,586,730) (10,247,869) (6.35) (12.44)
Decrease/(increase) in advance for purchase of property, plant and equipment 2,518,648 (-1,637,590) 3.49 (1.99)
Net cash used in investing activities (-2,068,082) (-11,885,459) (2.86) (14.43)
Cash fl ows from fi nancing activities
(Decrease)/increase in amounts due to related parties. (-1,476,317) 1,546,059 (2.04) 1.88
Proceeds from bank overdraft (net) 12,352,618 – 17.11
Receipt of loan from shareholder (net) 1,294,498 19,022,008 1.79 23.09
Net cash from fi nancing activities 12,170,799 20,568,067 16.86 24.97
Net increase/(decrease) in cash and cash equivalent 9,007,763 (643,378) 12.48 (0.78)
Cash and cash equivalents at beginning of year 698,508 1,341,886 0.97 1.63
Cash and cash equivalents at end of year 25 9,706,271 698,508 13.44 0.85
The accompanying notes form an integral part of these fi nancial statements.
The report of the independent auditor is set forth on pages 1 and 2.
CASH FLOW STATEMENT
For KAYA MIDDLE EAST FZE
S. Mohan Samir Srivastav Date: 18th April 2012 Director
Note - The exchange rate used to convert AED to Rs. <13.851> / <AED> (Rs. <12.139> / <AED>) “The columns in INR are not part of the audited fi nancial statements and the audit opinion does not apply to them.”
210
K A Y A M I D D L E E A S T F Z E
NOTES TO THE FINANCIAL STATEMENTS For the year ended 31 March 2012
1 LEGAL STATUS AND BUSINESS ACTIVITY
a) KAYA MIDDLE EAST FZE was incorporated in Sharjah Hamriyah Free Zone on 25 December 2005 as a Free Zone Establishment with limited liability in pursuant to Emirate Decree No 6 of 1995 of H. H. Sheikh Dr. Sultan Bin Mohammed Al-Qassimi, Ruler of Sharjah. The principal place of business is P.O.Box 41756, Sharjah, UAE. The establishment commenced operations on 25 December 2005.
b) The establishment is engaged in the business of providing products and services in the area of skin care treatment and aesthetics and import, export, trading in skin care machinery, consumables and products and providing related services.
c) These fi nancial statements include the assets, liabilities and the result of operations of skin care clinics operating in the United Arab Emirates, Sultanate of Oman and Kingdom of Saudi Arabia under the local sponsorships.
d) The parent company is "Marico Middle East FZE" a company registered in the Jebel Ali Free Zone, UAE. The ultimate parent company is "Marico Limited", a company registered in India.
2 FREE ZONE AUTHORITY REGULATIONS
As the net assets of the establishment are below 75% of its share capital, the directors are required to take steps to intimate the Hamriya Free Zone Authority and remedy the situation in accordance with the Implementation procedures issued by the Hamriya Free Zone Authority pursuant to Sharjah Emiree Decree No. 6 of 1995 of H.H. Sheikh Dr. Sultan Bin Mohammed Al Qassimi, Ruler of Sharjah. We have been informed that the directors will intimate the Free Zone Authorities and take steps to remedy the situation.
3 SIGNIFICANT ACCOUNTING POLICIES
The signifi cant accounting policies adopted, and which have been consistently applied, are as follows:
a) Basis of preparation
The fi nancial statements are presented in UAE Dirhams and prepared using the historical cost convention, and in accordance with International Financial Reporting Standards issued or adopted by the International Accounting Standards Board (IASB) and which are effective for accounting periods beginning on or after 1 April 2011, and the requirements of the Implementing Rules and Regulations issued by the Hamriya Free Zone Authority.
As at reporting date, the establishment has accumulated losses of AED 44,957,524 and net defi cit of AED 44,807,524 in equity funds. However, the ultimate parent company has agreed to continue with the operations of the establishment and the ultimate parent company is taking appropriate measures to ensure profi table operations of the establishment. Also, the ultimate parent company has agreed to provide continuing fi nancial support to the company to enable it to discharge its liabilities as and when they fall due for payment. Accordingly, these fi nancial statements have been prepared on a going concern basis.
b) Property, plant and equipment
Property, plant and equipment are stated at cost less accumulated depreciation and impairment losses. The cost less estimated residual value, where material, is depreciated from the date the asset is available for use until it is derecognised, using the straight line method over the estimated useful lives of the assets as follows:
Clinic interior decoration 3 to 7 years Machinery and clinic equipments 1 to 7 years Offi ce furniture, fi xtures and equipment 2 to 4 years
Motor vehicles 5 years
Capital work-in-progress is not depreciated. This will be depreciated from the date the relevant assets are ready for use.
An assessment of depreciation method, useful lives and residual values are undertaken at each reporting date and,
where material, if there is a change in estimate, an appropriate adjustment is made to the depreciation charge.

211
K A Y A M I D D L E E A S T F Z E
NOTES TO THE FINANCIAL STATEMENTS For the year ended 31 March 2012
c) Inventories
Inventories are stated at the lower of cost and net realizable value. Cost is arrived at using the Weighted Average Cost (WAC) method and comprises invoice value plus applicable landing charges less discounts. Net realizable value is based on estimated selling price less any estimated cost of completion and disposal.
d) Staff end-of-service gratuity
Provision is made for end-of-service gratuity payable to the staff at the reporting date in accordance with the local labour laws.
e) Revenue
Revenue represents the amount invoiced, net of discounts and returns, for goods delivered and services rendered during the year. Revenue is recognised when signifi cant risks and rewards relating to the ownership of goods concerned are transferred to the customer.
f) Leases
Leases under which substantially all the risks and rewards of ownership of the related asset remain with the lessor are classifi ed as operating leases and the lease payments are charged to profi t or loss on a straight-line basis over the period of the lease.
g) Foreign currency transactions
Transactions in foreign currencies are translated into UAE Dirhams at the rate of exchange ruling on the date of the transactions.
Monetary assets and liabilities expressed in foreign currencies are translated into UAE Dirhams at the rate of exchange ruling at the reporting date.
Gains or losses resulting from foreign currency transactions are taken to profi t or loss.
h) Cash and cash equivalents
Cash and cash equivalents comprise cash, bank current accounts, bank deposits free of encumbrance with a maturity date of three months or less from the date of deposit and highly liquid investments with a maturity date of three months or less from the date of investment net of temporary book overdrafts.
i) Financial instruments
Financial assets and fi nancial liabilities are recognised when, and only when, the establishment becomes a party to the contractual provisions of the instrument.
Financial assets are de-recognised when, and only when, the contractual rights to receive cash fl ows expire or when substantially all the risks and rewards of ownership have been transferred.
Financial liabilities are de-recognised when, and only when, they are extinguished, cancelled or expired.
Current fi nancial assets that have fi xed or determinable payments and for which there is no active market, which comprise trade and other receivables are classifi ed as loans and receivables and stated at cost or, if the impact is material, at amortised cost using the effective interest method, less any write down for impairment losses plus reversals of impairment losses. Impairment losses and accruals thereof are recognised in profi t or loss.
Current and non-current fi nancial liabilities, which comprise book and bank overdraft, trade and other payables, related party payables and shareholder's loan account are measured at cost or, if the impact is material, at amortised cost using the effective interest method.

212
K A Y A M I D D L E E A S T F Z E
NOTES TO THE FINANCIAL STATEMENTS For the year ended 31 March 2012
4 SIGNIFICANT JUDGMENTS EMPLOYED IN APPLYING ACCOUNTING POLICIES
The signifi cant judgments made in applying accounting policies that have the most signifi cant effect on the amounts recognised in the fi nancial statements are as follows:
Impairment
At each reporting date, management conducts an assessment of property, plant, equipment and all fi nancial assets to determine whether there are any indications that they may be impaired. In the absence of such indications, no further action is taken. If such indications do exist, an analysis of each asset is undertaken to determine its net recoverable amount and, if this is below it carrying amount, a provision is made. In the case of loans and receivables, if an amount is deemed irrecoverable, it is written off to profi t or loss or, if previously a provision was made, it is written off against the provision.
Reversals of provisions against loans and receivables are made to the extent of the related amounts being recovered.
5 KEY SOURCES OF ESTIMATION UNCERTAINTY
Key assumptions made concerning the future and other key sources of estimation uncertainty at the reporting date that have a signifi cant risk of causing a material adjustment to the carrying amounts of assets and liabilities within the next fi nancial year, are as follows:
Carrying values of property, plant and equipment
Residual values are assumed to be zero unless a reliable estimate of the current value can be obtained for similar assets
of ages and conditions that are reasonably expected to exist at the end of the assets' estimated useful lives. Inventory provisions
Management regularly undertakes a review of the establishment's inventory, stated at AED 5,327,301 (previous year AED 6,282,123) in order to assess the likely realisation proceeds, taking into account purchase and replacement prices, age, likely obsolescence, the rate at which goods are being sold and the physical damage. Based on the assessment assumptions are made as to the level of provisioning required.
Doubtful debt provisions
Management regularly undertakes a review of the amounts of loans and receivable owed to the establishment from third parties, (see Note 10) and assesses the likelihood of non-recovery. Such assessment is based upon the age of the debts, historic recovery rates and assessed creditworthiness of the debtor. Based on the assessment assumptions are made as to the level of provisioning required.
Impairment
Assessments of net recoverable amounts of property, plant, equipment and all fi nancial assets other than loans and receivables (see above) are based on assumptions regarding future cash fl ows expected to be received from the related assets.
Staff end-of-service gratuity
The establishment computes the provision for the liability to staff end-of-service gratuity stated at AED 1,749,952 (previous year AED 1,428,404), assuming that all employees were to leave as of the reporting date. The management is of the opinion that no signifi cant difference would have arisen had the liability been calculated on an actuarial basis as salary
infl ation and discount rates are likely to have approximately equal and opposite affects. 6 ADOPTION OF NEW INTERNATIONAL FINANCIAL REPORTING STANDARDS
The following International Financial Reporting Standards, amendments thereto and Interpretations that became effective for the current reporting period and which are applicable to the company are as follows. Their adoption has resulted in
presentation and disclosure changes only:

213
K A Y A M I D D L E E A S T F Z E
NOTES TO THE FINANCIAL STATEMENTS For the year ended 31 March 2012
* IAS24: Related Party Disclosures
Improvements to IFRS
* IFRS 7: Financial Instruments ; Disclosures
* IAS1: Presentation of Financial Statements
The following International Financial Reporting Standards, amendments thereto and Interpretations that are assessed by management as likely to have an impact on the fi nancial statements have been issued by the IASB prior to the date the fi nancial statements were authorised for issue but have not been applied in these fi nancial statements as their effective dates of adoption are for future accounting periods. It is anticipated that their adoption in the relevant accounting periods will have an impact only on presentation and disclosures within the fi nancial statements:
* IFRS 9: Financial Instruments (1 January 2013)
Presentation of items in Other Comprehensive Income: Amendment to IAS 1 (1 July 2012)
* IAS 19: Employee Benefi ts ( 1 Januar2013)"
IFRS 13: Fair Value Measurement (15 January 2013)

214
K A Y A M I D D L E E A S T F Z E
NOTES TO THE FINANCIAL STATEMENTS For the year ended 31 March 2012
7 PROPERTY, PLANT AND EQUIPMENT
Capital Clinic Machinery Offi ce Motor Total work in interior and clinic furniture vehicles progess decoration equipments fi xtures equipments AED AED AED AED AED AED
Cost
As at 1 April 2010 943,818 7,930,982 8,801,647 227,970 156,000 18,060,417
Additions 3,428,332 1,297,375 2,894,747 2,548,985 78,430 10,247,869
Transfer (894,058) 10,000 208,742 675,316 – –
Write offs – (354,091) (645,748) – – (999,839)
As at 31 March 2011 3,478,092 8,884,266 11,259,388 3,452,271 234,430 27,308,447
Additions 2,774 1,567,933 2,706,356 309,667 – 4,586,730
Transfer (2,723,289) 1,582,802 1,021,426 119,061 – –
Write offs (315,829) – (10,339) – – (326,168)
As at 31 March 2012 441,748 12,035,001 14,976,831 3,880,999 234,430 31,569,009
Accumulated depreciation and impairment losses
As at 1 April 2010 – 3,804,283 3,658,045 71,238 21,996 7,555,562
Depreciation – 1,342,910 1,569,265 243,152 30,068 3,185,395
Adjustment relating write off – (250,611) (685,480) – – (936,091)
As at 31 March 2011 – 4,896,582 4,541,830 314,390 52,064 9,804,866
Depreciation – 1,257,148 1,713,196 579,949 36,734 3,587,027
Adjustment relating write off – – (8,262) – – (8,262)
Impairment losses – 608,862 176,030 45,108 – 830,000
As at 31 March 2011 – 6,762,592 6,422,794 939,447 88,798 14,213,631
Net book values
As at 1 April 2010 943,818 4,126,699 5,143,602 156,732 134,004 10,504,855
As at 31 March 2011 3,478,092 3,987,684 6,717,558 3,137,881 182,366 17,503,581
As at 31 March 2012 441,748 5,272,409 8,554,037 2,941,552 145,632 17,355,378

215
K A Y A M I D D L E E A S T F Z E
NOTES TO THE FINANCIAL STATEMENTS For the year ended 31 March 2012
7 PROPERTY, PLANT AND EQUIPMENT
Capital Clinic Machinery Offi ce Motor Total work in interior and clinic furniture vehicle progess decoration equipments fi xtures
equipments Rs. Crore Rs. Crore Rs. Crore Rs. Crore Rs. Crore Rs. Crore
Cost
As at 1 April 2010 1.15 9.63 10.68 0.28 0.19 21.92
Additions 4.16 1.57 3.51 3.09 0.10 12.44
Transfer (1.09) 0.01 0.25 0.82 – –
Write offs – (0.43) (0.78) – – (1.21)
As at 31 March 2011 4.22 10.78 13.67 4.19 0.28 33.15
Additions 0.00 2.17 3.75 0.43 0.00 6.35
Transfer (3.77) 2.19 1.41 0.16 – –
Write offs (0.44) – (0.01) – – (0.43)
As at 31 March 2012 0.61 16.67 20.74 5.38 0.32 43.73
Accumulated depreciation and impairment losses
As at 1 April 2010 – 4.62 4.44 0.09 0.03 9.17
Depreciation – 1.63 1.90 0.30 0.04 3.87
Adjustment relating write off – (0.30) (0.83) – – (1.14)
As at 31 March 2011 – 5.94 5.51 0.38 0.06 11.90
Depreciation – 1.74 2.37 0.80 0.05 4.97
Adjustment relating write off – – (0.01) – – (0.01)
Impairment losses – 0.84 0.24 0.06 – 1.15
As at 31 March 2011 – 9.37 8.90 1.30 0.12 19.69
Net book values
As at 1 April 2010 1.15 5.01 6.24 0.19 0.16 12.75
As at 31 March 2011 4.22 4.84 8.15 3.81 0.22 21.25
As at 31 March 2012 0.58 6.88 11.16 3.84 0.19 22.63
Notes
• Capital work-in-progress relates to interior decoration of clinics amounting to AED Nil (Previous year AED 1,849,090), machinery and clinic equipment amounting to AED 291,211 (Previous year AED 656,195) and offi ce furniture, fi xtures and equipment amounting to AED 150,537 (Previous year AED 972,807)
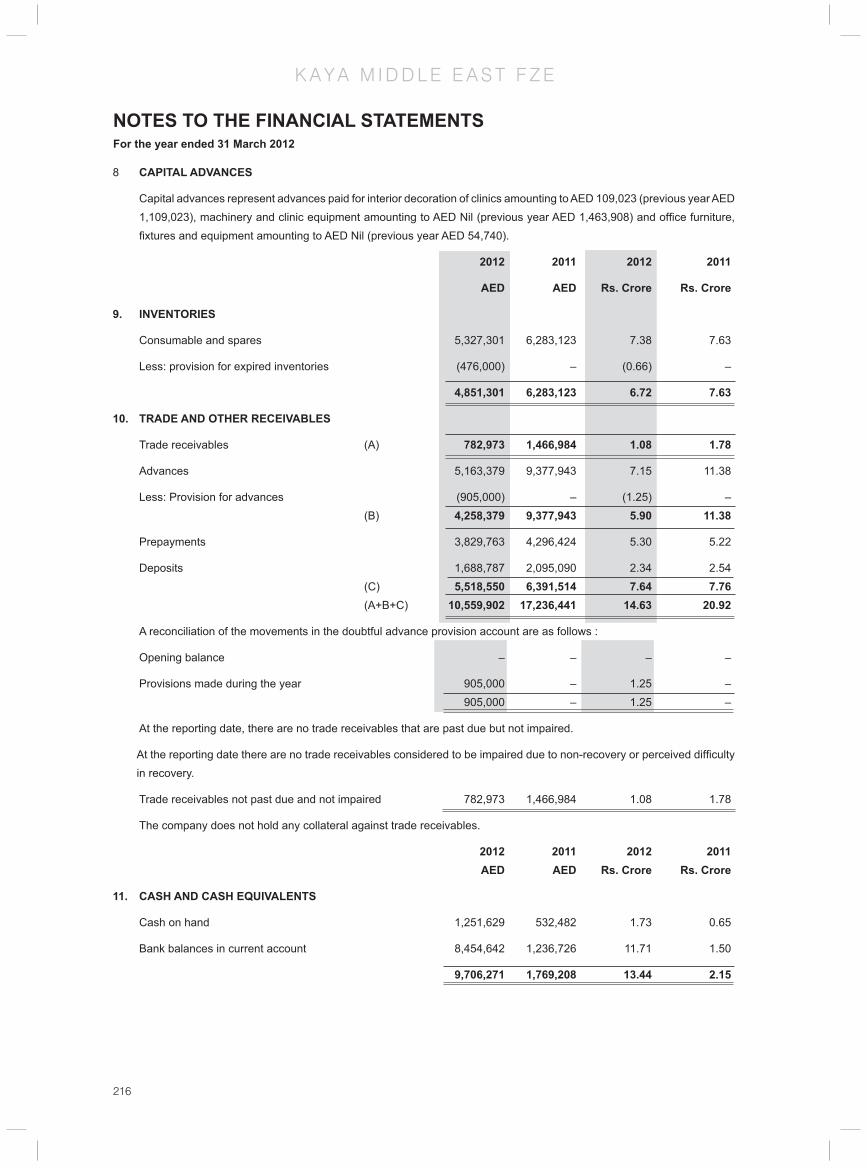
216
K A Y A M I D D L E E A S T F Z E
NOTES TO THE FINANCIAL STATEMENTS For the year ended 31 March 2012
8 CAPITAL ADVANCES
Capital advances represent advances paid for interior decoration of clinics amounting to AED 109,023 (previous year AED 1,109,023), machinery and clinic equipment amounting to AED Nil (previous year AED 1,463,908) and offi ce furniture, fi xtures and equipment amounting to AED Nil (previous year AED 54,740).
2012 2011 2012 2011
AED AED Rs. Crore Rs. Crore
9. INVENTORIES
Consumable and spares 5,327,301 6,283,123 7.38 7.63
Less: provision for expired inventories (476,000) – (0.66) –
4,851,301 6,283,123 6.72 7.63
10. TRADE AND OTHER RECEIVABLES
Trade receivables (A) 782,973 1,466,984 1.08 1.78
Advances 5,163,379 9,377,943 7.15 11.38
Less: Provision for advances (905,000) – (1.25) – (B) 4,258,379 9,377,943 5.90 11.38
Prepayments 3,829,763 4,296,424 5.30 5.22
Deposits 1,688,787 2,095,090 2.34 2.54 (C) 5,518,550 6,391,514 7.64 7.76 (A+B+C) 10,559,902 17,236,441 14.63 20.92
A reconciliation of the movements in the doubtful advance provision account are as follows :
Opening balance – – – –
Provisions made during the year 905,000 – 1.25 – 905,000 – 1.25 –
At the reporting date, there are no trade receivables that are past due but not impaired.
At the reporting date there are no trade receivables considered to be impaired due to non-recovery or perceived diffi culty in recovery.
Trade receivables not past due and not impaired 782,973 1,466,984 1.08 1.78
The company does not hold any collateral against trade receivables.
2012 2011 2012 2011 AED AED Rs. Crore Rs. Crore
11. CASH AND CASH EQUIVALENTS
Cash on hand 1,251,629 532,482 1.73 0.65
Bank balances in current account 8,454,642 1,236,726 11.71 1.50
9,706,271 1,769,208 13.44 2.15

217
K A Y A M I D D L E E A S T F Z E
NOTES TO THE FINANCIAL STATEMENTS For the year ended 31 March 2012
12. BANK BORROWINGS
Overdrafts 12,352,618 – 17.11 –
An analysis of banks of amount outstanding is as follows :
Standard Chartered Bank 12,352,618 – 17.11 –
Bank overdraft is secured against promissory note for US$ 5,000,000, stand-by letter of credit and/or bank guarantee for US$ 5,000,000.
13. TRADE AND OTHER PAYABLES
Trade payables 2,296,766 – 3.18 –
Accruals 9,298,246 1,137,589 12.18 1.38
Advances received from customers 16,825,343 9,768,248 22.30 11.86
28,420,355 10,905,837 39.37 13.24
The entire trade and other payables are due for payment in one year.
14. RELATED PARTIES
The establishment enters into transactions with entities that fall within the defi nition of a related party as contained in International Accounting Standard 24. The management considers such transactions to be in the normal course of business and at prices determined by the management.
Related parties comprise the parent company, the ultimate parent company, companies under common ownership and/or common management control, fellow subsidiaries and directors.
At the reporting date signifi cant balances with related parties were as follows:
Parent Companies Directors Total Total company under 2012 2011 comman ownership/ management control AED AED AED AED AED
Included in trade and other receivables – – 132,500 132,500 –
– – 254,870 – 254,870
Disclosed as due to a related party – 725,850 – 725,850 –
– 2,202,167 – 2,202,167
Loan from shareholder 44,140,624 – – 44,140,624
42,846,126 - - - 42,846,126
All balances are unsecured and are expected to be settled in cash. Repayment and other terms are set out in Notes 17 and 26.

218
K A Y A M I D D L E E A S T F Z E
NOTES TO THE FINANCIAL STATEMENTS For the year ended 31 March 2012
Parent Companies Directors Total Total company under 2012 2011 comman ownership/ management control Rs. Crore Rs. Crore Rs. Crore Rs. Crore Rs. Crore Included in trade and other receivables – – 0.18 0.18 –
– – 0.31 – 0.13
Disclosed as due to a related party – 1.01 – 1.01 –
– 2.67 – – –
Loan from shareholder 61.14 – – 61.14 –
52.01 - - - 52.01 Signifi cant transactions with related parties during the period were as follows:
Parent Companies Directors Total Total company under 2012 2011 comman ownership/ management control
AED AED AED AED AED
Purchases – 379,058 – 379,058 –
– 617,981 – – 617,981
Directors salaries & benefi ts – – 1,466,360 1,466,360 –
– – 1,292,764 1,292,764 –
End-of-service gratuity –- – 7,140 7,140 – 40,580 – 40,580 – –
Finance costs 1,330,642 – – 1,330,642 –
960,123 – – 997,123 –
Recharge of expenses 559,474 – 559,474 – –
287,883 1,276,521 – 1,564,404 –
Operating lease expenses 409,329 – – 409,329 –
471,935 – – – 471,935

219
K A Y A M I D D L E E A S T F Z E
NOTES TO THE FINANCIAL STATEMENTS For the year ended 31 March 2012
Parent Companies Directors Total Total company under 2012 2011 comman ownership/ management control Rs. Crore Rs. Crore Rs. Crore Rs. Crore Rs. Crore
Purchases – 0.53 – 0.55 – – 0.75 – – – Directors salaries & benefi ts – – 2.03 2.03 -
– – 1.57 0.00 1.57 End-of-service gratuity – – 0.01 0.01 – – 0.05 0.00 0.05 – Finance costs 1.84 – – 1.84 –
1.17 – – 0.00 1.21 Recharge of expenses – 0.77 – 0.77 – 0.35 1.55 – – 1.90
Operating lease expenses 0.57 – – 0.57 –
0.57 – – – 0.57
The establishment also provides funds to/receives funds from related parties as working capital facilities, at fl oating rate of interest.
15 PROVISION FOR STAFF END-OF-SERVICE GRATUITY
2012 2011 2012 2011 AED AED Rs. Crore Rs. Crore
Opening balance 1,428,404 1,230,367 1.98 1.49
Provision for the year 712,371 398,436 0.99 0.48
Paid during the year (390,823) (200,399) (0.54) (0.24)
Closing balance 1,749,952 1,428,404 2.42 1.73
16 SHARE CAPITAL
Issued and paid up:
1 share of AED 150,000 150,000 150,000 0.21 0.18
17 LOAN FROM SHAREHOLDER
This represents long-term loan given by the shareholder bearing fl oating interest rate but with no fi xed repayment schedule. It is not the intention of the shareholder to withdraw the loan in the foreseeable future.
18 MANAGEMENT OF CAPITAL
The establishment’s objectives when managing capital are to ensure that the establishment continues as a going concern and to provide the shareholder with a rate of return on its investment commensurate with the level of risk assumed.
Capital comprises equity funds as presented in the statement of fi nancial position together with shareholder’s loan and amounts due to related parties. Debt comprises total amounts owing to third parties, net of cash and cash equivalents.
The company is subject to externally imposed capital requirements, as per provisions of the Implementing Rules and Regulations issued by the Hamriya Free Zone Authority pursuant to Sharjah Emiree Decree no. 6 of 1995. However, the establishment has not complied with the externally imposed capital requirement of net assets not falling below 75% of

220
K A Y A M I D D L E E A S T F Z E
NOTES TO THE FINANCIAL STATEMENTS For the year ended 31 March 2012
the share capital.
Funds generated from internal accruals together with funds received from related parties are retained in the business, according to the business requirements and to maintain capital at desired levels.
19 DIRECT COSTS
2012 2011 2012 2011 AED AED Rs. Crore Rs. Crore
Consumables and stores consumed 17,829,065 8,083,346 24.70 9.81
Salaries and benefi ts 26,565,147 18,265,565 36.80 22.17
End-of service gratuity 567,634 317,483 0.79 0.39
Operating lease expenses 6,275,003 4,744,298 8.69 5.76
Depreciation (Note 23) 3,408,349 3,057,721 4.72 3.71
54,645,198 34,468,413 75.69 41.84
20 OTHER OPERATING INCOME
Credit balances written back 1,700,844 – 2.36 –
Miscellaneous income 11,207 77,820 0.02 0.09
1,712,051 77,820 2.37 0.09
21 ADMINISTRATIVE EXPENSES
Directors salaries and benefi ts 1,466,360 1,292,764 2.03 1.57
End of service gratuity 7,140 40,580 0.01 0.05
Staff salaries and benefi ts 7,813,979 3,295,986 10.82 4.00
Staff end-of-service gratuity 137,596 40,373 0.19 0.05
Operating lease expenses 523,842 437,192 0.73 0.53
Travelling expenses 4,447,142 3,018,783 6.16 3.66
Inventory provision 476,000 – 0.66 –
Provision for advances 905,000 – 1.25 –
Other administration and general expenses 16,181,216 5,904,889 22.41 7.17
Loss on sale of property, plant and equipment (net) – 63,748 – 0.08
Depreciation (Note 23) 178,678 127,674 0.25 0.15
Impairment of property, plant and equipment (Note 7) 830,000 – 1.15 –
32,966,953 14,221,989 45.66 17.26
22 FINANCE COST
On overdraft 112,906 – 0.16 – On shareholder’s loan 1,330,642 960,123 1.84 1.17
1,443,548 960,123 2.00 1.17
23 DEPRECIATION
Allocated to direct costs (Note 19) 3,408,349 3,057,721 4.72 3.71
Allocated to administrative expenses (Note 21) 178,678 127,674 0.25 0.15
3,587,027 3,185,395 4.97 3.87

221
K A Y A M I D D L E E A S T F Z E
NOTES TO THE FINANCIAL STATEMENTS For the year ended 31 March 2012
24 CASH GENERATED FROM / (USED IN) OPERATIONS
Loss for the year (31,774,314) (8,237,561) (41.44) (10.00)
Adjustments for: 0.00 0.00 – –
Depreciation of property, plant and equipment 3,587,027 3,185,395 4.97 3.87
Write off of property, plant and equipment (net) 317,906 – 0.44 –
Loss on sale of property, plant and equipment (net) – 63,748 – 0.08
Impairment of property, plant and equipments 830,000 – 1.15 –
Finance costs 1,443,548 960,123 2.00 1.17
Operating loss before changes in operating (25,595,833) (4,028,295) (35.45) (4.89) assets and liabilities
Decrease/(increase) in Inventories 1,431,822 (3,888,154) 1.98 (4.72)
Decrease/(increase) in trade and other receivables 6,676,539 (10,562,931) 9.25 (12.82)
Increase in trade and other payables 17,514,518 9,915,479 24.26 12.04
Increase in staff gratuity provision 321,548 198,038 0.45 0.24
348,594 (8,365,863) 0.48 (10.16)
25 RECONCILIATION OF CASH AND CASH EQUIVALENTS
Cash and cash equivalents as disclosed in the statement of fi nancial position 9,706,271 1,769,208 13.44 2.15
Less: Book overdraft – (1,070,700) – (1.30)
Cash and cash equivalents as disclosed in the cash fl ow statements 9,706,271 698,508 13.44 0.85
26 FINANCIAL INSTRUMENTS
The net carrying amounts as at the reporting date of fi nancial assets and fi nancial liabilities are as follows :
Loans and receivables At amortised cost
2012 2011 2012 2011 AED AED AED AED
Trade and other receivables 3,717,768 6,350,712 – –
Cash and cash equivalents 9,706,271 1,769,208 – –
Book overdraft – – – 1,070,700
Bank borrowings – – 12,352,618 –
Trade and other payable – – 9,052,743 10,814,568
Amounts due to related parties – – 725,850 2,202,167
Loan from shareholder – – 44,140,624 42,846,126
13,424,039 8,119,920 66,271,835 56,933,561
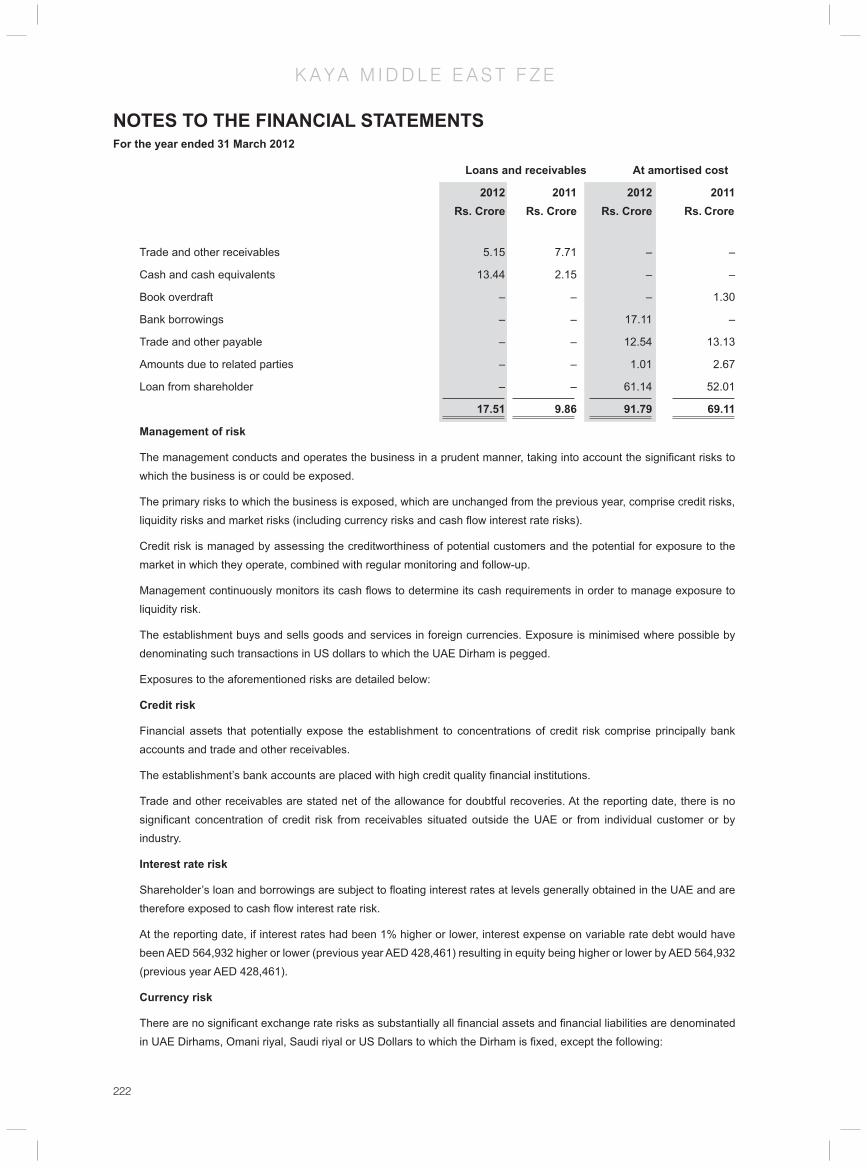
222
K A Y A M I D D L E E A S T F Z E
NOTES TO THE FINANCIAL STATEMENTS For the year ended 31 March 2012
Loans and receivables At amortised cost
2012 2011 2012 2011 Rs. Crore Rs. Crore Rs. Crore Rs. Crore
Trade and other receivables 5.15 7.71 – –
Cash and cash equivalents 13.44 2.15 – –
Book overdraft – – – 1.30
Bank borrowings – – 17.11 –
Trade and other payable – – 12.54 13.13
Amounts due to related parties – – 1.01 2.67
Loan from shareholder – – 61.14 52.01
17.51 9.86 91.79 69.11
Management of risk
The management conducts and operates the business in a prudent manner, taking into account the signifi cant risks to which the business is or could be exposed.
The primary risks to which the business is exposed, which are unchanged from the previous year, comprise credit risks, liquidity risks and market risks (including currency risks and cash fl ow interest rate risks).
Credit risk is managed by assessing the creditworthiness of potential customers and the potential for exposure to the market in which they operate, combined with regular monitoring and follow-up.
Management continuously monitors its cash fl ows to determine its cash requirements in order to manage exposure to liquidity risk.
The establishment buys and sells goods and services in foreign currencies. Exposure is minimised where possible by denominating such transactions in US dollars to which the UAE Dirham is pegged.
Exposures to the aforementioned risks are detailed below:
Credit risk
Financial assets that potentially expose the establishment to concentrations of credit risk comprise principally bank accounts and trade and other receivables.
The establishment’s bank accounts are placed with high credit quality fi nancial institutions.
Trade and other receivables are stated net of the allowance for doubtful recoveries. At the reporting date, there is no signifi cant concentration of credit risk from receivables situated outside the UAE or from individual customer or by industry.
Interest rate risk
Shareholder’s loan and borrowings are subject to fl oating interest rates at levels generally obtained in the UAE and are therefore exposed to cash fl ow interest rate risk.
At the reporting date, if interest rates had been 1% higher or lower, interest expense on variable rate debt would have been AED 564,932 higher or lower (previous year AED 428,461) resulting in equity being higher or lower by AED 564,932 (previous year AED 428,461).
Currency risk
There are no signifi cant exchange rate risks as substantially all fi nancial assets and fi nancial liabilities are denominated in UAE Dirhams, Omani riyal, Saudi riyal or US Dollars to which the Dirham is fi xed, except the following:

223
K A Y A M I D D L E E A S T F Z E
NOTES TO THE FINANCIAL STATEMENTS For the year ended 31 March 2012
Singapore Dollar Indian Rupees
2012 2011 2012 2011 AED AED AED AED
Amount due to a related party 5,222 4,303 720,628 2,197,864 5,222 4,303 720,628 2,197,864
2012 2011 2012 2011 Rs. Crore Rs. Crore Rs. Crore Rs. Crore
Amount due to a related party 0.01 0.01 1.00 2.67 0.01 0.01 1.00 2.67
Resonably possible changes to exchange rates at the reporting date are unlikely to have had a signifi cant impact on profi t or equity
Fair values
The fair value of a fi nancial instrument is the amount for which an asset could be exchanged, or a liability settled, between knowledgeable, willing parties in an arm’s length transaction. The fair value of fi nancial assets and liabilities which are required to be carried at cost or at amortised cost approximate to their fair value except for loan from shareholder which due to its terms, has a fair value lower than carrying value.
27 OPERATING LEASE COMMITMENTS
The establishment has entered into non-cancellable operating leases for rentals. The total of the future lease payments is as follows:
2012 2011 2012 2011
AED AED Rs. Crore Rs. Crore
Not later than one year 5,803,332 5,326,668 8.04 6.47
Between one and fi ve years 10,552,815 18,817,492 14.62 22.84
Later than fi ve years – 569,580 – 0.69
For KAYA MIDDLE EAST FZE S. Mohan Samir Srivastav Director DirectorDate: 18th April 2012

224
M E L C O N S U M E R C A R E SAE
Board of Directors Debashish Neogi
Milind Sarwate
Padmanabh Maydeo
Saumitra Bhat
Marico Middle East represented by Vijay Subramaniam
Registered Offi ce 5th Floor, 53, Lebanon Street, Mohandseen, Giza, Egypt
Auditors Moore Stephens
Bankers HSBC Limited
Legal Advisors Yasser Maharem Offi ce for Accounting & Auditing, Nassef Law fi rm

225
M E L C O N S U M E R C A R E SAE
INDEPENDENT AUDITORS’ REPORTTo: The shareholders of MEL Consumer Care Company SAE
Report on the fi nancial statements
We have audited the accompanying unconsolidated Financial statements of MEL Consumer Care company SAE which comprise the unconsolidated balance sheet as at March 31, 2012 and the unconsolidated statements of income, of changes in shareholders’ equity and of cash fl ows for the year then ended and a summary of signifi cant accounting policies and other explanatory notes.
Management’s responsibility for the fi nancial statements
These unconsolidated fi nancial statements are the responsibility of the company’s management. The management is responsible for the preparation and fair presentation of these fi nancial statements in accordance with Egyptian Accounting Standards and in light of the prevailing Egyptian laws this responsibility includes designing, implementing and maintaining internal control relevant to the preparation and fair presentation of fi nancial statements that are free from material misstatement, whether due to fraud or error selecting and applying appropriate accounting policies and making accounting estimates that are reasonable in the circumstances.
Auditor’s responsibility
Our responsibility is to express an opinion on these unconsolidated fi nancial statements based on our audit. We conducted our audit in accordance with the Egyptian Auditing Standards and the relevant laws and regulations. Those standards require that we comply with ethical requirements to obtain reasonable assurance about whether the fi nancial statements are free from material misstatements.
An audit involves performing procedures to obtain audit evidence about the amounts and disclosures in the fi nancial statements. The procedures selected depend on the auditor’s judgment, including the assessment of the risks of material misstatement of the fi nancial statements, whether due to fraud or error. In making those risk assessment, the auditor considers internal control relevant to the entity’s preparation and fair presentation of the fi nancial statements in order to design audit procedures that are appropriate in the circumstances, but not for the purpose of expressing an opinion on the effectiveness of the entity’s internal control . An audit also includes evaluating the appropriateness of
accounting policies used and the reasonableness of accounting estimates made by management, as well as evaluating the overall presentation of the fi nancial statements.
We believe that the audit evidence we have obtained is suffi cient and appropriate to provide a basis for our audit opinion.
Opinion
In our opinion, the unconsolidated fi nancial statements present fairly in all material respects, the fi nancial position of MEL Consumer Care Company SAE as of March 31, 2012 and of its unconsolidated fi nancial performance and its cash fl ows for the fi nancial year then ended in accordance with the Egyptian Accounting Standards and the relevant laws and regulations relating to the preparation of these unconsolidated fi nancial statements.
Emphasis of matter
Without considering that as a qualifi cation, the retained losses reached on 31/3/2012
EGP 9 316 651 including current year losses which exceeds the issued and paid capital, that requires an extra-ordinary general assembly according to article no. (69) of law no. 159 for year 1981 to decide on the continuity or not of the company according to article no. (60) of the article of association.
Kindly be informed that current liabilities exceed current assets of EGP 11 978 734 as of March 31, 2012.
Report on other legal and regulatory requirements
The company keeps proper accounting records, include all that is required by law to be recorded therein and the accompanying fi nancial statements are agreement therewith.
The fi nancial information included in the board of directors’ report in compliance with companies law No. 159 year 1981 and its executive regulation and its agreement with the accounting record of the company to the extent that such information is recorded therein.
Cairo 15/04/2012Sherin NoureldinR.A.A 6809Moore Stephens Egypt
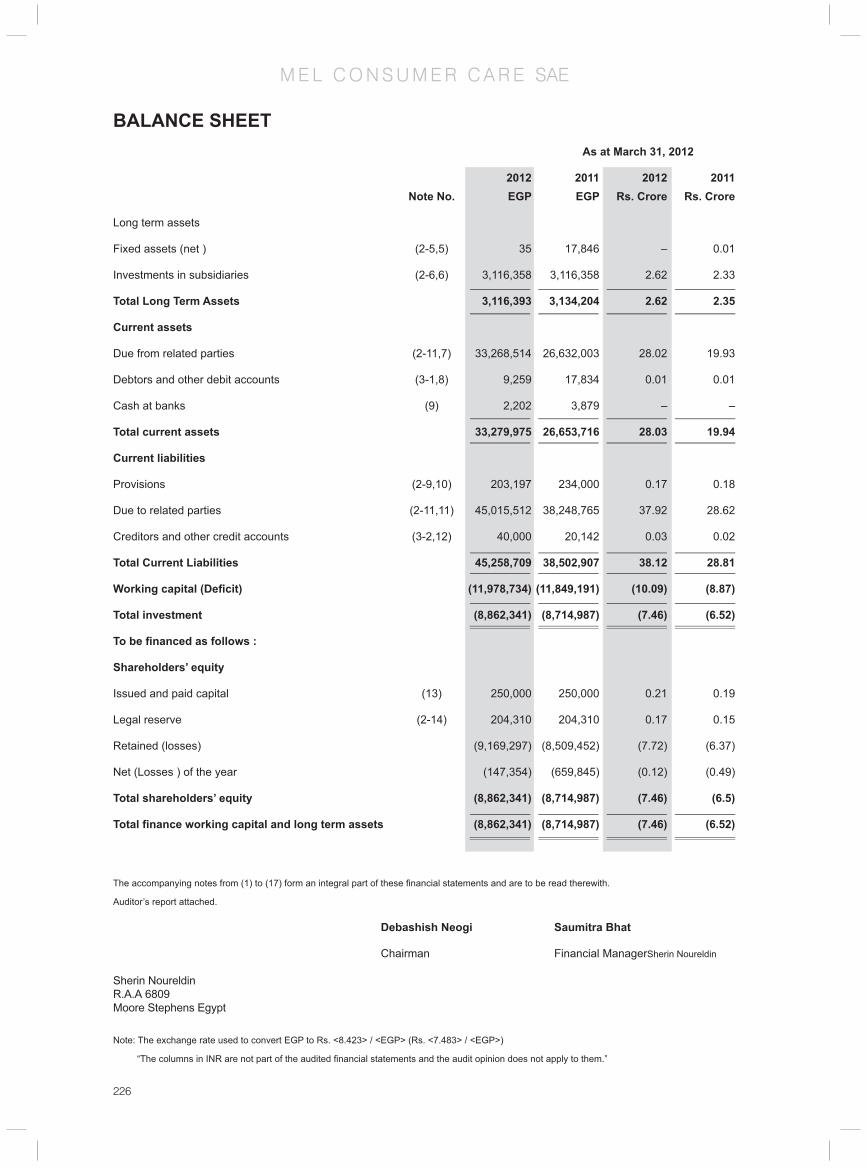
226
M E L C O N S U M E R C A R E SAE
BALANCE SHEET
The accompanying notes from (1) to (17) form an integral part of these fi nancial statements and are to be read therewith.
Auditor’s report attached.
Debashish Neogi Saumitra Bhat
Chairman Financial ManagerSherin Noureldin
Sherin NoureldinR.A.A 6809Moore Stephens Egypt
Note: The exchange rate used to convert EGP to Rs. <8.423> / <EGP> (Rs. <7.483> / <EGP>)
“The columns in INR are not part of the audited fi nancial statements and the audit opinion does not apply to them.”
onv
are n
As at March 31, 2012
2012 2011 2012 2011 Note No. EGP EGP Rs. Crore Rs. Crore
Long term assets
Fixed assets (net ) (2-5,5) 35 17,846 – 0.01
Investments in subsidiaries (2-6,6) 3,116,358 3,116,358 2.62 2.33
Total Long Term Assets 3,116,393 3,134,204 2.62 2.35
Current assets
Due from related parties (2-11,7) 33,268,514 26,632,003 28.02 19.93
Debtors and other debit accounts (3-1,8) 9,259 17,834 0.01 0.01
Cash at banks (9) 2,202 3,879 – –
Total current assets 33,279,975 26,653,716 28.03 19.94
Current liabilities
Provisions (2-9,10) 203,197 234,000 0.17 0.18
Due to related parties (2-11,11) 45,015,512 38,248,765 37.92 28.62
Creditors and other credit accounts (3-2,12) 40,000 20,142 0.03 0.02
Total Current Liabilities 45,258,709 38,502,907 38.12 28.81
Working capital (Defi cit) (11,978,734) (11,849,191) (10.09) (8.87)
Total investment (8,862,341) (8,714,987) (7.46) (6.52)
To be fi nanced as follows :
Shareholders’ equity
Issued and paid capital (13) 250,000 250,000 0.21 0.19
Legal reserve (2-14) 204,310 204,310 0.17 0.15
Retained (losses) (9,169,297) (8,509,452) (7.72) (6.37)
Net (Losses ) of the year (147,354) (659,845) (0.12) (0.49)
Total shareholders’ equity (8,862,341) (8,714,987) (7.46) (6.5)
Total fi nance working capital and long term assets (8,862,341) (8,714,987) (7.46) (6.52)

227
M E L C O N S U M E R C A R E SAE
INCOME STATEMENTUnconsolidated income statement For the fi nancial year ended March 31, 2012 For the year ended 31 March 2012
31/3/2012 31/3/2011 31/3/2012 31/3/2011 Note No. EGP EGP Rs. Crore Rs. Crore
Expenses
General and administrative expenses (2-13) 103,279 97,222 0.09 0.07
Depreciation of fi xed assets (2-5) 17,811 50,000 0.02 0.04
Bank charges 1,645 2,421 – –
Provision of claims (2-9,10) 341 – – –
Add / (less)
Exchange rate different (2-4) 132,618 815,023 0.11 0.61
Capital gains (108,340) – (0.09) –
Provision no longer required – (293,421) – (0.22)
Other income – (11,400) – (0.01)
Net (Losses ) of the year (147,354) (659,845) (0.12) (0.49)
Per share of (losses) (2-17,14) (58.942) (2639.38) – –
Debashish Neogi Saumitra Bhat
Chairman Financial Manager
Note: The exchange rate used to convert EGP to Rs. <8.423> / <EGP> (Rs. <7.483> / <EGP>)
“The columns in INR are not part of the audited fi nancial statements and the audit opinion does not apply to them.”

228
M E L C O N S U M E R C A R E SAE
Unconsolidated changes in shareholders’s equity for the fi nancial year ended March 31, 2012STATEMENT OF CHANGES IN EQUITY
Debashish Neogi Saumitra Bhat
Chairman Financial Manager
Description Issued & paid capital
EGP
Legal reserveEGP
Retained (losses)
EGP
(Losses)of the year
EGP
TotalEGP
Balance as at 1/4/2010 250,000 204,310 – – (8,055,142)
Retained losses – – (8,509,452) – –
Losses of the year – -- – (659 845) (659,845)
Balance as at 31/3/2011 250,000 204,310 (8,509,452) (659,845) (8,714,987)Transferred to retained losses – – (659,845) 659,845 –
Losses of the year – – – (147,354) (147,354)
Balance as at 31/3/2012 250,000 204,310 (9,169,297) (147,354) (8,862,341)
Description Issued & paid capital
EGP
Legal reserveEGP
Retained (losses)
EGP
(Losses)of the year
EGP
TotalEGP
Balance as at 1/4/2010 0.20 0.16 – – (6.49)
Retained losses – – (6.86) – –
Losses of the year – – – (0.53) (0.53)
Balance as at 31/3/2011 0.19 0.15 (6.37) (0.49) (6.52)
Transferred to retained losses – – (0.56) 0.56 –
Losses of the year – – – (0.12) (0.12)
Balance as at 31/3/2012 0.21 0.17 (7.72) (0.12) (7.46)
The accompanying notes from (1) to (17) form an integral part of these fi nancial statements and are to be read therewith.
Note: The exchange rate used to convert EGP to Rs. <8.423> / <EGP> (Rs. <7.483> / <EGP>)
“The columns in INR are not part of the audited fi nancial statements and the audit opinion does not apply to them.”
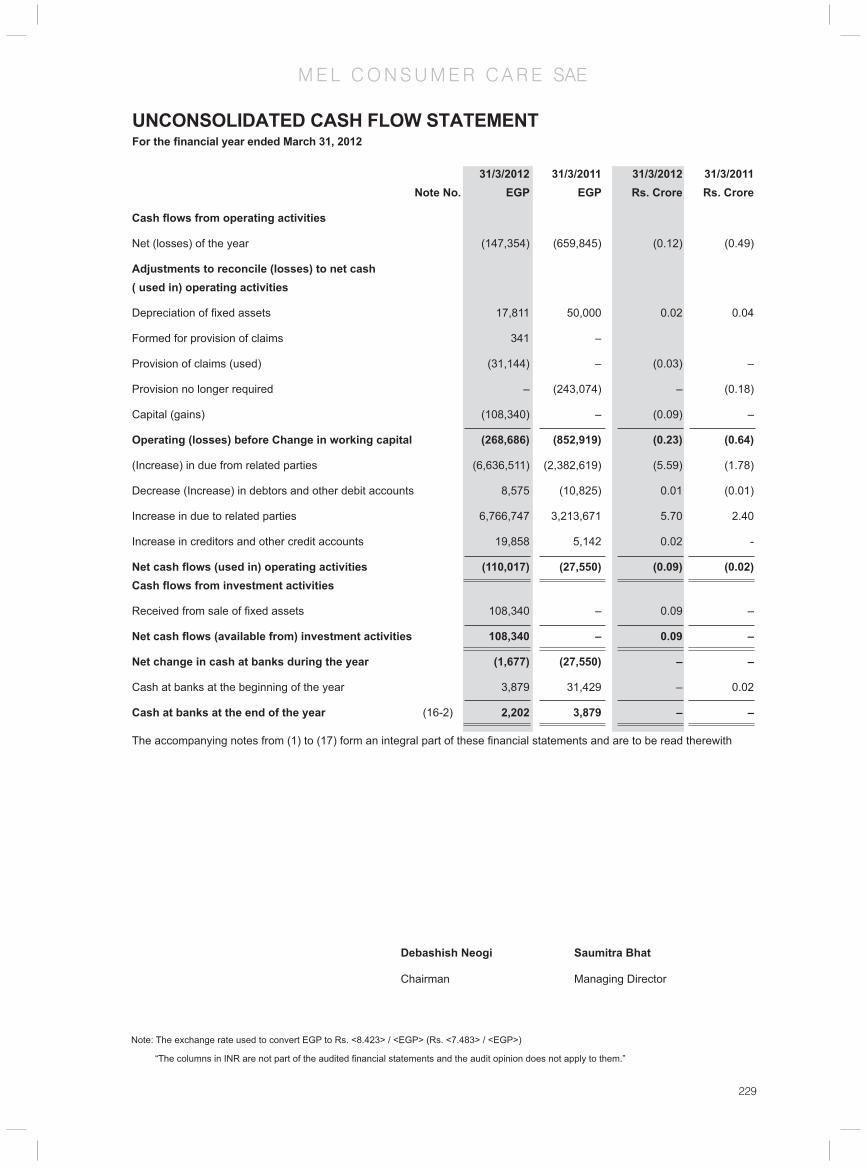
229
M E L C O N S U M E R C A R E SAE
31/3/2012 31/3/2011 31/3/2012 31/3/2011 Note No. EGP EGP Rs. Crore Rs. Crore
Cash fl ows from operating activities
Net (losses) of the year (147,354) (659,845) (0.12) (0.49)
Adjustments to reconcile (losses) to net cash ( used in) operating activities
Depreciation of fi xed assets 17,811 50,000 0.02 0.04
Formed for provision of claims 341 –
Provision of claims (used) (31,144) – (0.03) –
Provision no longer required – (243,074) – (0.18)
Capital (gains) (108,340) – (0.09) –
Operating (losses) before Change in working capital (268,686) (852,919) (0.23) (0.64)
(Increase) in due from related parties (6,636,511) (2,382,619) (5.59) (1.78)
Decrease (Increase) in debtors and other debit accounts 8,575 (10,825) 0.01 (0.01)
Increase in due to related parties 6,766,747 3,213,671 5.70 2.40
Increase in creditors and other credit accounts 19,858 5,142 0.02 -
Net cash fl ows (used in) operating activities (110,017) (27,550) (0.09) (0.02)Cash fl ows from investment activities
Received from sale of fi xed assets 108,340 – 0.09 –
Net cash fl ows (available from) investment activities 108,340 – 0.09 –
Net change in cash at banks during the year (1,677) (27,550) – –
Cash at banks at the beginning of the year 3,879 31,429 – 0.02
Cash at banks at the end of the year (16-2) 2,202 3,879 – –
The accompanying notes from (1) to (17) form an integral part of these fi nancial statements and are to be read therewith
UNCONSOLIDATED CASH FLOW STATEMENT For the fi nancial year ended March 31, 2012
Debashish Neogi Saumitra Bhat
Chairman Managing Director
Note: The exchange rate used to convert EGP to Rs. <8.423> / <EGP> (Rs. <7.483> / <EGP>)
“The columns in INR are not part of the audited fi nancial statements and the audit opinion does not apply to them.”

230
M E L C O N S U M E R C A R E SAE
NOTES TO THE UNCONSOLIDATED FINANCIAL STATEMENTFor the fi nancial year ended March 31, 2012
(1) The company’s background and its activities
- MEL Consumer Care Company - An Egyptian Joint Stock Company – was established under the provisions of law No. 159 of 1981 and its executive regulation. The company was registered in the commercial register under No.20683 dated October 1st 2006.
- The company manufactured its products during the period from October 1st, 2006 till March 31st, 2007 through the Egyptian American Co. for Investment and Industrial Development factories, the company provides the manufacturer with all raw & packing materials , the manufacturing charge is 1.75% of the consumer price for the produced quantities during the period according to manufacturing agreement dated September 13th , 2006 and its amendments dated March 31st 2007 , during the period from April 1st ,2007, the company leased Egyptian American Co. for Investment and Industrial Development factory and produced through it according to the lease agreement dated April 1st ,2007 according to this agreement the company is charged by all the manufacturing expenses related to the production .The company stopped production from July 1st ,2007 .
- Egyptian American Co. for Investment and Industrial Development distributes all the company’s products against distribution charge and managerial charge of 1.75 % & 1.3125% respectively of the consumer price for total sales during the period from October 1st, 2006 till March 31st, 2007, Egyptian American Co. for Investment and Industrial Development guarantees the collection from customers according to distributorship agreements dated September 13th, 2006 and its amendments dated March 31st, 2007.
The objective of the company
The company’s main objective is to produce products related to consumer care and skin care at third party’s factories, selling and distributing these products.
The company may have an interest or participate in any manner with the companies and others who practice similar activities or may cooperate with the company to achieve its objectives in Egypt or abroad. The company may also merge into the aforementioned Entities, purchasing them or make them affi liated there to according to the provision of law and its executive regulations.
(2) Signifi cant accounting policies
2-1- Upholding accounting standards and legal principles
The accompanying fi nancial statements have been prepared in accordance with Egyptian accounting standards and the related Egyptian laws and regulation in the light of the international fi nancial reporting standards to process cases weren’t stated in the Egyptian standards.
2-2- Basis of preparation of the unconsolidated fi nancial statements
- The fi nancial statements have been prepared at Egyptian pound.
- The fi nancial statements have been prepared according to historical cost and continuity presumption.
2-3- Change in accounting principles
The accounting principles comply with those adopted in the previous year.
2-4- Foreign currency transaction
The company maintains its books in Egyptian pound. All transactions denominated in foreign currencies were translated into Egyptian pound at the rate determined on the transaction date, on the balance sheet, the monetary current assets and liabilities are evaluated accordance the rates announced on that date and the differences are charged to income statement.

231
M E L C O N S U M E R C A R E SAE
NOTES TO THE UNCONSOLIDATED FINANCIAL STATEMENTFor the fi nancial year ended March 31, 2012
2-5- Fixed assets and depreciated
Recognition and preliminary measurement
Buildings, constructions, infrastructures, machines and equipments are booked at historical cost less the accumulated depreciation and any impairment.
The cost include all direct cost for acquisition the assets also cost of getting of it and re-arranging the site where assets were present.
The Depreciation
Fixed assets are shown in the balance sheet at historical cost and according to estimated useful life of each asset in accordance with the following rates:
Useful life Year
Furniture & offi ce equipment 4
Computers 2
Vehicles 4
2-6- Investment in subsidiary companies
Subsidiary and affi liated companies are companies that are under the control of the Company. Such control is achieved when the company is in control of the fi nancial and operation policies of that company for the purpose of obtaining the benefi t reaped from its activities. When ascertaining the amount of future voting power and its affect on the control and domination, the company studies all the circumstances and facts that affect the future voting power.
The investment in subsidiary and affi liated companies is recorded as per the acquisition cost. In case that there is a reduction in the fair value below the book value, the book value is amended to refl ect the reduced value and it is refl ected in the income statement under depletion in the value of investments in subsidiary and affi liated companies. In case that there is an appreciation in the fair value, it will be added to the same item to the extent that it has been charged in the income statement for previous periods for each investment separately.
The accounting for investments in subsidiary and affi liated companies is according to the cost method and the revenues generated from such investment is booked according to the amount collected by the company from profi t share of the company invested in which has been achieved after its acquisition.
This is starting from the date of the resolution of the general assembly of the company invested in and that has approved such distribution.
2-7- Impairment in the value of non-fi nancial assets
The book value of the Company’s non-fi nancial assets, other than inventory and deferred tax assets is reviewed at the date of each fi nancial position to ascertain the amount of impairment. The Company carries out a regular review to ascertain if there has been impairment in the value of an asset and in case that there is an indication of such impairment; the resale value is compared to the book value. If the book value is above the resale value, then there is impairment in the value of the asset and the resale value is reduced and the loss is charged in the income statement.
The amount of impairment may be returned in case that there is a change in the resale value to the extent that the amount was reduced in the past.
2-8- Impairment in the value of fi nancial assets
On the anniversary of each balance sheet, an objective estimate is carried out to ascertain if there is true indication

232
M E L C O N S U M E R C A R E SAE
NOTES TO THE UNCONSOLIDATED FINANCIAL STATEMENTFor the fi nancial year ended March 31, 2012
that any of the assets have been impaired. Once there is a impairment in the value of an asset the loss is recorded only if there are objective proofs that the impairment of the value was due to an incident or more after the initial realization of the asset and that such incident or incidents had an effect that can be evaluated in a reliable manner for the expected future cash fl ow from the asset. In the case of fi nancial assets that are recorded according to their amortized cost impairment, the loss due to impairment of its value between the book value of such asset and the present value of the future cash fl ow that has been discounted by the original actual interest rate relating to this asset.
The book value of the fi nancial asset is reduced directly except in case of clients’ accounts that is reduced using provisions. Any amount that is not to be collected is to be written off from the provision and the amount of the realized loss will be reimbursed either directly or by settling the provisions account. It should be ensured that such reversal will not generate a book value for the asset which is higher than the amortized cost at the date of the writing off of the amount of impairment if such impairment has not been recognized. The amount of write off will be refl ected in the income statement.
2-9- Provisions
A provision is recognized once the company has a current legal or actual obligation due to a previous incident which is likely to require the use of economic sources to settle such obligation while preparing a valuation of the value of the obligation. The provisions are to be reviewed on the anniversary of the balance sheet and amended to refl ect the most accurate present valuation and in case that the present value of cash is of essence, then the amount recognized as provision is the present value of the expected expenses to settle the obligation.
2-10-Employees’ benefi ts
• Social insurance & pension scheme
The company contributes to the government social insurance system on behalf of the employees according to the social insurance law No. 79 year 1975 and its amendments.
The employees and the company contribute according to this law with a fi xed percentage of their salary and the company’s obligation is limited to its contribution. The company’s contribution is refl ected in the income statement according to the accrual principle.
• Employee profi t share
According to its constitution, the company distributes part of the profi ts dividends to the employees as per the recommendations stipulated by the Board of Directors and approved by the General Assembly. The employee share of profi t will be recognized as distribution of profi t in shareholders’ equity statement and as an obligation for the period that the company’s shareholders approved such distribution.
2-11- Related parties’ transactions
All transactions with related parties are booked by the company in the same manner as any other normal transaction with other parties.
2-12- Accounting estimates
According to Egyptian accounting standards the preparation of the fi nancial statement requires the management to make some approximations and predictions that affect the value of assets, obligations, income and expenses during the fi nancial year. The actual amounts could be quite different from these predictions.
2-13-Expenses
All expense, including administrative and general expenses, are to be refl ected in the income statement for the fi nancial period that such expenses were incurred according to accrual bases.
233
M E L C O N S U M E R C A R E SAE
NOTES TO THE UNCONSOLIDATED FINANCIAL STATEMENTFor the fi nancial year ended March 31, 2012
2-14- Legal reserve
According to law No. 159 year 1981, its executive directives and the constitution of the company, there should be legal reserve of no less 5% of the profi t of the company and such reserve should not be increased once this reserve amount reaches 50% of the company’s issued capital.
2-15-Cash fl ows statement
The cash fl ow statement will be prepared according to the indirect method.
2-16-Cash at banks
For the purpose of the cash fl ows statement, cash at banks are to be considered cash at banks, short term fi xed deposits, checks under collection and letters of guarantee cover, if any.
2-17-Losses per share
Losses per share are calculated by the weighted average method according to the number of shares during the year.
(3) Financial Instruments
Financial instruments are made up of any contractual agreement that gives the right to fi nancial assets of the company and creates a fi nancial or shareholding obligation to the other side of the contact.
3-1- Debtors
Debtors are recognized initially at actual value and subsequently measured at amortized cost using the effective interest method, less provision for impairment. A provision for impairment of debtors is established when there is objective evidence that the Company will not be able to collect all amounts due according to the original terms of the receivables. Signifi cant fi nancial diffi culties of the debtor, probability that the debtor will enter bankruptcy or fi nancial reorganization, and default or delinquency in payments (more than granted credit limits) are considered indicators that the receivable is impaired. The amount of the provision is the difference between the asset’s carrying amount and the present value of the estimated future cash fl ows, discounted at the original effective interest rate used to determine the amortized cost. The carrying amount of the asset is reduced through the use of an allowance account, and the amount of the loss is recognized in the income statement. When a Debtor is uncollectible, it is written off
against the allowance account for receivables.
3-2- Creditors
Creditors’ balances are record as per their actual value.
(4) Fair value of fi nancial instruments
The fi nancial instruments are represented in monetary assets ( cash at banks and on hand, clients & notes receivables and debtors & other debit balances ) , monetary liabilities (due to related parties , suppliers and notes payables , creditors and other credit balances) the present values of these fi nancial instruments represent a reasonable estimate to their fair values . The notes to the fi nancial statements include the signifi cant polices used in recording and measuring signifi cant fi nancial instruments and the related revenues and expenses.

234
M E L C O N S U M E R C A R E SAE
NOTES TO THE UNCONSOLIDATED FINANCIAL STATEMENTFor the fi nancial year ended March 31, 2012
Description Furniture & Vehicles Computers Total Offi ce equipment EGP EGP EGP EGP
Cost as of 1/4/2011 390,388 200,000 445,338 1,035,726
Disposal during the year – 200,000 10,275 210,275
Cost as of 31/3/2012 390,388 – 435,063 825,451
Acc. depreciation at 1/4/2011 390,384 182,189 445,307 1,017,880
Depreciation of the year – 17,811 – 17,811
Acc. depreciation for disposals – (200,000) (10,275) (210,275)
Acc. depreciation at 31/3/2012 390,384 – 435,032 825,416
Net fi xed assets as of 31/3/2012 4 – 31 35
Net fi xed assets as of 31/3/2011 4 17,811 31 17,846
Description Furniture & Vehicles Computers Total Offi ce equipment Rs. Crore Rs. Crore Rs. Crore Rs. Crore
Cost as of 1/4/2011 0.31 0.16 0.36 0.83
Disposal during the year – 0.15 0.01 0.16
Cost as of 31/3/2012 0.29 – 0.33 0.62
Acc. depreciation at 1/4/2011 0.31 0.15 0.36 0.82
Depreciation of the year – 0.01 – 0.01
Acc. depreciation for disposals – (0.15) (0.01) (0.16)
Acc. depreciation at 31/3/2012 0.29 – 0.33 0.62
Net fi xed assets as of 31/3/2012 – - – –
Net fi xed assets as of 31/3/2011 – 0.01 – 0.01
6) Investments in subsidiaries
The balance of investments in subsidiaries as of March 31, 2012 amounted to EGP 3, 116, 358 represents as follows: 31/3/2012 31/3/2012 31/3/2012 31/3/2012 EGP EGP Rs. Crore Rs. Crore
Marico Egypt Industries Company (MEI) 1,506,718 1,506,718 1.27 1.13
MEL Consumer Care & Partner Company (Wind) 1,609,640 1,609,640 1.36 1.2
3,116,358 3,116,358 2.62 2.33
- The contribution percentage in Marico Egypt Industries Company (MEI) is 99%.
- Marico Egypt Industries Company (MEI) is the new name for Pyramids Modern Industries.
- The contribution percentage in MEL Consumer Care & Partner Company (Wind) is 99%.
5) Fixed assets (net)
Net fi xed assets as of March 31, 2012 amounted to EGP 35 represents as follows:-

235
M E L C O N S U M E R C A R E SAE
NOTES TO THE UNCONSOLIDATED FINANCIAL STATEMENTFor the fi nancial year ended March 31, 2012
7) Due from related parties The balance of due from related parties as of March 31, 2012 amounted to EGP 33 268 514 represents as follows:
31/3/2012 31/3/2011 31/3/2012 31/3/2011 EGP EGP Rs. Crore Rs. Crore
MEL Consumer Care & Partner Company (Wind) 30,683,736 19,910,421 25.84 14.90 Egyptian American Co. for investment and Industrial Development (EAIIDC) 2,584,778 6,721,582 2.18 5.03 33,268,514 26,632,003 28.02 19.93
8) Debtors and other debit account
The balance of debtors and other debit accounts as of March 31, 2012 amounted to EGP 9 259 represents as follows:
31/3/2012 31/3/2011 31/3/2012 31/3/2011 EGP EGP Rs. Crore Rs. Crore Sundry debtors 6,259 6,259 0.01 - Prepaid expenses 3,000 11,575 - 0.01 9,259 17,834 0.01 0.019) Cash at banks
This item is made up as follows :– 331/3/2012 31/3/2011 31/3/2012 31/3/2011 EGP EGP Rs. Crore Rs. Crore
HSBC Banks — current accounts - EGP 2,090 1,852 – –
HSBC Banks — current accounts - USD 112 2,027 – – 2,202 3,879 – –
10) Provisions
This item is made up as follows: Balance Formed Used Balance as of during during as of 01/04/2011 the year the year 31/3/2012
EGP EGP EGP EGP
234,000 5,164 35,967 203,197
Balance Formed Used Balance as of during during as of 01/04/2011 the year the year 31/3/2012
Rs.Crore Rs.Crore Rs.Crore Rs.Crore
0.19 – 0.03 0.17
11) Due from related parties
The balance of due to related parties as of March 31, 2012 amounted to EGP 45 015 512 represents as follows:
31/3/2012 31/3/2011 31/3/2012 31/3/2011
EGP EGP Rs. Crore Rs. Crore
Marico Middle East Company (MME) Holding Company 10,858,225 10,725,633 9.15 8.03
Marico Egypt for Industries Company (MEI) 34,157,287 27,523,132 28.77 20.60
45,015,512 38, 248,765 37.92 28.62
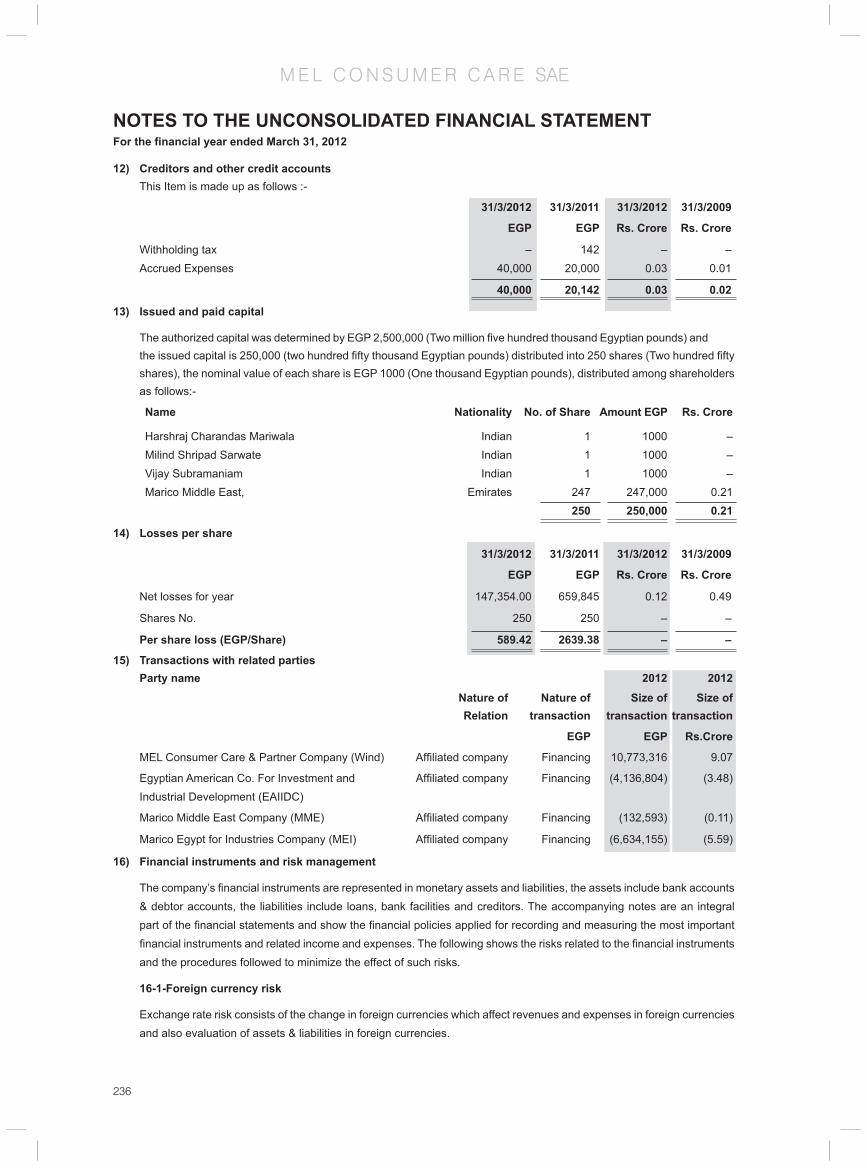
236
M E L C O N S U M E R C A R E SAE
12) Creditors and other credit accounts This Item is made up as follows :-
31/3/2012 31/3/2011 31/3/2012 31/3/2009
EGP EGP Rs. Crore Rs. Crore
Withholding tax – 142 – – Accrued Expenses 40,000 20,000 0.03 0.01
40,000 20,142 0.03 0.02
13) Issued and paid capital
The authorized capital was determined by EGP 2,500,000 (Two million fi ve hundred thousand Egyptian pounds) and the issued capital is 250,000 (two hundred fi fty thousand Egyptian pounds) distributed into 250 shares (Two hundred fi fty shares), the nominal value of each share is EGP 1000 (One thousand Egyptian pounds), distributed among shareholders as follows:-
Name Nationality No. of Share Amount EGP Rs. Crore
Harshraj Charandas Mariwala Indian 1 1000 – Milind Shripad Sarwate Indian 1 1000 – Vijay Subramaniam Indian 1 1000 – Marico Middle East, Emirates 247 247,000 0.21 250 250,000 0.21
14) Losses per share
31/3/2012 31/3/2011 31/3/2012 31/3/2009
EGP EGP Rs. Crore Rs. Crore
Net losses for year 147,354.00 659,845 0.12 0.49
Shares No. 250 250 – –
Per share loss (EGP/Share) 589.42 2639.38 – –
15) Transactions with related parties Party name 2012 2012
Nature of Nature of Size of Size of Relation transaction transaction transaction
EGP EGP Rs.Crore
MEL Consumer Care & Partner Company (Wind) Affi liated company Financing 10,773,316 9.07
Egyptian American Co. For Investment and Affi liated company Financing (4,136,804) (3.48) Industrial Development (EAIIDC)
Marico Middle East Company (MME) Affi liated company Financing (132,593) (0.11)
Marico Egypt for Industries Company (MEI) Affi liated company Financing (6,634,155) (5.59)
16) Financial instruments and risk management
The company’s fi nancial instruments are represented in monetary assets and liabilities, the assets include bank accounts & debtor accounts, the liabilities include loans, bank facilities and creditors. The accompanying notes are an integral part of the fi nancial statements and show the fi nancial policies applied for recording and measuring the most important fi nancial instruments and related income and expenses. The following shows the risks related to the fi nancial instruments and the procedures followed to minimize the effect of such risks.
16-1-Foreign currency risk
Exchange rate risk consists of the change in foreign currencies which affect revenues and expenses in foreign currencies and also evaluation of assets & liabilities in foreign currencies.
NOTES TO THE UNCONSOLIDATED FINANCIAL STATEMENTFor the fi nancial year ended March 31, 2012
237
M E L C O N S U M E R C A R E SAE
Foreign currency (Defi cit) (Defi cit)
Foreign Currency EGP
U.S Dollar (1,791,768) (10,858,113)
As stated in notes no. (2-4) foreign currency translation, assets and liabilities were reevaluated at year end at the exchange rate declared as of the date of balance sheet.
16-2 -Liquidity risk
This liquidity risk is represented in factors that impact the repayment of part or all the company’s liability. Suitable procedures are taken to reduce that risk to the minimum according to the company policy.
16-3 -Interest risk
Interest risk represents the change in currency rate which affect the results of business and this risk does not exist because the company does not depend on bank credit facilities to fi nance working capital and long term assets.
16-4 -Fair value of fi nancial instruments
The fair value is the amount for which an asset could be exchanged or a liability settled between knowledgeable willing parties on an arm’s length basis and the book value is too close to the fair value.
(17) Tax status
First: Corporate tax
- The company didn’t scrutinize till now.
- The company submits its tax return on legal date.
Second: Salaries & Wages tax
- The company was scrutinized from beginning of activity till 31/3/2008.
- The company pays salaries & wages tax regularly.
Third: Stamp duty
- The company didn’t scrutinize till now.
- The company pays stamp duty according to taxes system.
Fourth: Withholding tax
- The company pays withholding tax regularly.
- The company didn’t scrutinize till now.
Fifth: Sales tax
- The company was scrutinized from beginning of activity till 31/3/2011.
- The company submits the sales tax reports regularly.
Debashish Neogi Saumitra Bhat
Chairman Financial Manager
NOTES TO THE UNCONSOLIDATED FINANCIAL STATEMENTFor the fi nancial year ended March 31, 2012

238
EGYPTIAN AMERICAN FOR INVESTMENT AND INDUSTRIAL DEVELOPMENT COMPANY S.A.E
238
Board of Directors Debashish Neogi
Padmanabh Maydeo
Saumitra Bhat
Marico Middle East represented by Vijay Subramaniam
Registered Offi ce 11B Hegaz Sq., Mohandesen, Giza, Egypt
Auditors Moore Stephens
Bankers HSBC Limited NSGB Limited
Legal Advisors Yasser Maharem Offi ce for Accounting and Auditing Nassef Law Firm

239
EGYPTIAN AMERICAN FOR INVESTMENT AND INDUSTRIAL DEVELOPMENT COMPANY S.A.E
239
To
The shareholders of Egyptian American Co. For Investment and Industrial Development S.A.E
Report on the Financial Statements
We have audited the accompanying balance sheet of Egyptian American Co. For Investment and Industrial Development SAE as of December 31, 2011 and the related statements of income, cash fl ows and changes in shareholders’ equity for the year then ended and a summary of signifi cant accounting policies and other explanatory notes.
Management’s Responsibility for the Financial Statements
These fi nancial statements are the responsibility of the Company’s management. The management is responsible for the preparation and fair presentation of these fi nancial statements in accordance with Egyptian Accounting Standards and in light of the Egyptian laws this responsibility includes designing, implementing and maintaining internal control relevant to the preparation and fair presentation of fi nancial statements that are free from material misstatement, whether due to fraud or error selecting and applying appropriate accounting policies and making accounting estimates that are reasonable in the circumstances.
Auditor’s responsibility
Our responsibility is to express an opinion on these fi nancial statements based on our audit. We conducted our audit in accordance with the Egyptian Auditing Standards and the relevant laws and regulations. Those standards require that we comply with ethical requirements to obtain reasonable assurance about whether the fi nancial statements are free from material misstatements.
An audit involves performing procedures to obtain audit evidence about the amounts and disclosures in the fi nancial statements. The procedures selected depend on the auditor’s judgment, including the assessment of the risks of material misstatement of the fi nancial statements, whether due to fraud or error. In making those risk assessment, the auditor consider internal control relevant to the entity’s preparation and fair presentation of the fi nancial statements in order to design audit procedures that are appropriate in the circumstances, but not for the purpose of expressing an opinion on the effectiveness of the entity’s internal control . An audit also includes evaluating the appropriateness of accounting policies used and the reasonableness of accounting estimates made by management, as well as evaluating the overall presentation of the fi nancial statements.
We believe that the audit evidence we have obtained is suffi cient and appropriate to provide a basis for our audit opinion.
Opinion
In our opinion, the fi nancial statements present fairly in all material respects, the fi nancial position of Egyptian American Co. For Investment and Industrial Development SAE as of December 31, 2011 and of its fi nancial performance and its cash fl ows for the fi nancial year then ended in accordance with the Egyptian Accounting Standards and the relevant laws and regulations.
Emphasis of matter
Considering that not a qualifi cation the forward losses amount including the current fi scal year reached EGP 18, 571, 038 on 31/12/2011 and has exceeded the issued and paid capital which requires extraordinary general assembly according to article No. (69) of law No. 159 of 1981 to consider the continuity of the company or not.
Report on other legal and regulatory requirements
The company keeps proper accounting records, include all that is required by law to be recorded therein and the accompanying fi nancial statements are agreement therewith, the company applies a suffi cient costing system. Inventory count and valuation was made by the company’s management and in accordance with the proper process.
The fi nancial information included in the Board of Directors’ report in compliance with companies law No. 159 year 1981 and its executive regulation and its agreement with the accounting record of the company to the extent that such information is recorded therein.
Cairo 26/1/2012
Sherin NoureldinR.A.A 6809Moore Stephens Egypt
INDEPENDENT AUDITORS’ REPORT

240
EGYPTIAN AMERICAN FOR INVESTMENT AND INDUSTRIAL DEVELOPMENT COMPANY S.A.E
240
BALANCE SHEET
The accompanying notes on pages from (1) to (21) form integral part of these fi nancial statements and are to be read
therewith.
Auditor’s report attached
Chairman Financial Manager
Sherin Noureldin R.A.A 6809 Moore Stephens Egypt
Note: The exchange rate used to convert EGP to Rs. is Rs. 8.799/ EGP (Rs. 7.700/ EGP)
“The columns in INR are not part of the audited fi nancial statements and the audit opinion does not apply to them.”
As at December 31, 2011 Note 31/12/2011 31/12/2010 31/12/2011 31/12/2010 No. EGP EGP Rs. Crore Rs. CroreAssetsLong - Term assetsFixed assets(net) (2/5,4) 2,023,410 2,103,941 1.78 1.62Project in progress (2/7,5) 33,701 213,338 0.03 0.16Total Long - Term assets 2,057,111 2,317,279 1.81 1.78Current assetsInventory (2/6,6) 3,440,584 2,162,570 3.03 1.67Receivables (3/1,7) 5,710,261 8,470,194 5.02 6.52Debtors and debit balance (3/1,8) 171,412 733,524 0.15 0.56Cash at banks and equivalents (9) 1,872,276 1,838,191 1.65 1.42Total current assets 11,194,533 13,204,479 9.85 10.17Current liabilitiesBanks overdraft 659,261 331,318 0.58 0.26Due to related parties (10) 15,482,328 17,379,812 13.62 13.38Payables and notes payables (3/2,11) 6,555,361 3,016,403 5.77 2.32Creditors and other credit balances (3/2,12) 1,773,778 1,596,085 1.56 1.23Total current liabilities 24,470,728 22,323,618 21.53 17.19Increase in current liabilities from Currrent assets (13,276,195) (9,119,139) (11.68) (7.02)Total Investments (11,219,084) (6,801,860) (9.87) (5.24)To be fi nanced as followsShareholders’ EquityIssued and paid capital (13/B) 6,892,000 6,892,000 6.06 5.31Legal reserve (2/16) 374,360 374,360 0.33 0.29Other reserves 493 493 – –Forward losses (14,153,814) (10,847,488) (12.45) (8.35)Net losses for the year (4,417,224) (3,306,326) (3.89) (2.55)Total Shareholders’ Equity (11,304,185) (6,886,961) (9.95) (5.30)Long - Term liabilitiesDeferred tax liabilities (2/20,14) 85,101 85,101 0.07 0.07Total Shareholders’ Equity and Long Term liabilities (11,219,084) (6,801,860) (9.87) (5.24)Total fi nancing working capital and long - term assets (11,219,084) (6,801,860) (9.87) (5.24)Contingent liabilities for L/G – 36,000 – 0.03
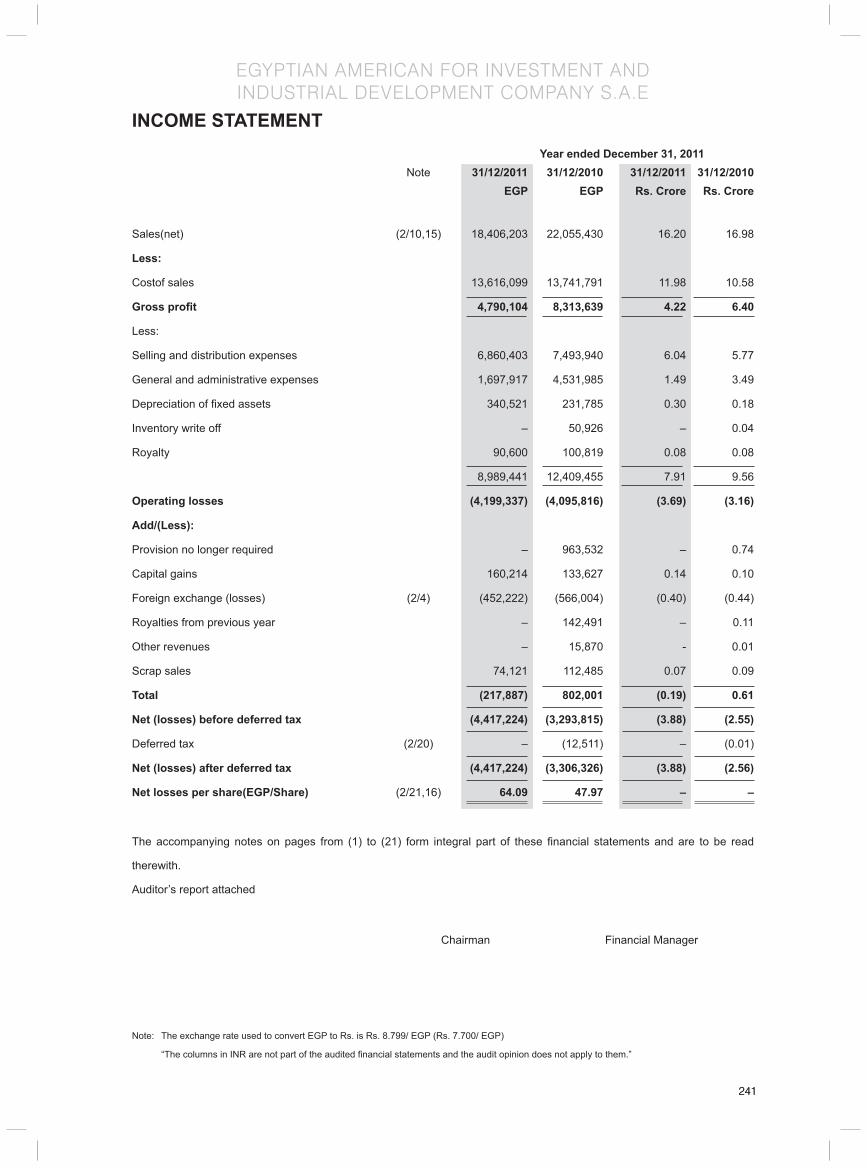
241
EGYPTIAN AMERICAN FOR INVESTMENT AND INDUSTRIAL DEVELOPMENT COMPANY S.A.E
241
Year ended December 31, 2011 Note 31/12/2011 31/12/2010 31/12/2011 31/12/2010 EGP EGP Rs. Crore Rs. Crore
Sales(net) (2/10,15) 18,406,203 22,055,430 16.20 16.98
Less:
Costof sales 13,616,099 13,741,791 11.98 10.58
Gross profi t 4,790,104 8,313,639 4.22 6.40
Less:
Selling and distribution expenses 6,860,403 7,493,940 6.04 5.77
General and administrative expenses 1,697,917 4,531,985 1.49 3.49
Depreciation of fi xed assets 340,521 231,785 0.30 0.18
Inventory write off – 50,926 – 0.04
Royalty 90,600 100,819 0.08 0.08
8,989,441 12,409,455 7.91 9.56
Operating losses (4,199,337) (4,095,816) (3.69) (3.16)
Add/(Less):
Provision no longer required – 963,532 – 0.74
Capital gains 160,214 133,627 0.14 0.10
Foreign exchange (losses) (2/4) (452,222) (566,004) (0.40) (0.44)
Royalties from previous year – 142,491 – 0.11
Other revenues – 15,870 - 0.01
Scrap sales 74,121 112,485 0.07 0.09
Total (217,887) 802,001 (0.19) 0.61
Net (losses) before deferred tax (4,417,224) (3,293,815) (3.88) (2.55)
Deferred tax (2/20) – (12,511) – (0.01)
Net (losses) after deferred tax (4,417,224) (3,306,326) (3.88) (2.56)
Net losses per share(EGP/Share) (2/21,16) 64.09 47.97 – –
INCOME STATEMENT
The accompanying notes on pages from (1) to (21) form integral part of these fi nancial statements and are to be read
therewith.
Auditor’s report attached
Chairman Financial Manager
Note: The exchange rate used to convert EGP to Rs. is Rs. 8.799/ EGP (Rs. 7.700/ EGP)
“The columns in INR are not part of the audited fi nancial statements and the audit opinion does not apply to them.”

242
EGYPTIAN AMERICAN FOR INVESTMENT AND INDUSTRIAL DEVELOPMENT COMPANY S.A.E
242
STATEMENT OF CHANGES IN EQUITY Year ended as of December 31, 2011 Description Issued and Legal Other Forwared Net (loss) Total Paid Reserve Reserve Profi ts for the capital losses year EGP EGP EGP EGP EGP EGP
Balance as of 31-12-2009 6,892,000 374,360 493 1,513,450 (12,360,938) (3,580,635)
Closed forward losses – – – (12,360,938) 12,360,938 –
Net (losses) for the year – – – – (3,306,326) (3,306,326)
Balance as of 31-12-2009 6,892,000 374,360 493 (10,847,488) (3,306,326) (6,886,961)
Transfer to fowared losses – – – (3,306,326) 3,306,326 –
Net (losses) for the year – – – – (4,417,224) (4,417,224)
Balance as of 31-12-2009 6,892,000 374,360 493 (14,153,814) (4,417,224) (11,304,185)
Description Issued and Legal Other Forwared Net (loss) Total Paid Reserve Reserve Profi ts for the capital losses year Rs. Crore Rs. Crore Rs. Crore Rs. Crore Rs. Crore Rs. Crore
Balance as of 31-12-2009 5.85 0.32 - 1.28 (10.49) (3.04)
Closed forward losses - - - (9.52) 9.52 -
Net (losses) for the year - - - - (2.55) (2.55)
Balance as of 31-12-2009 5.31 0.29 - (8.35) (2.55) (5.30)
Transfer to fowared losses - - - (2.91) 2.91 -
Net (losses) for the year – – – – 3.89 3.89
Balance as of 31-12-2009 6.06 0.33 - (12.45) (3.89) (9.95)
The accompanying notes on pages from (1) to (21) form integral part of these fi nancial statements and are to be read
therewith.
Auditor’s report attached
Chairman Financial Manager
Note: The exchange rate used to convert EGP to Rs. is Rs. 8.799/ EGP (Rs. 7.700/ EGP)
“The columns in INR are not part of the audited fi nancial statements and the audit opinion does not apply to them.”
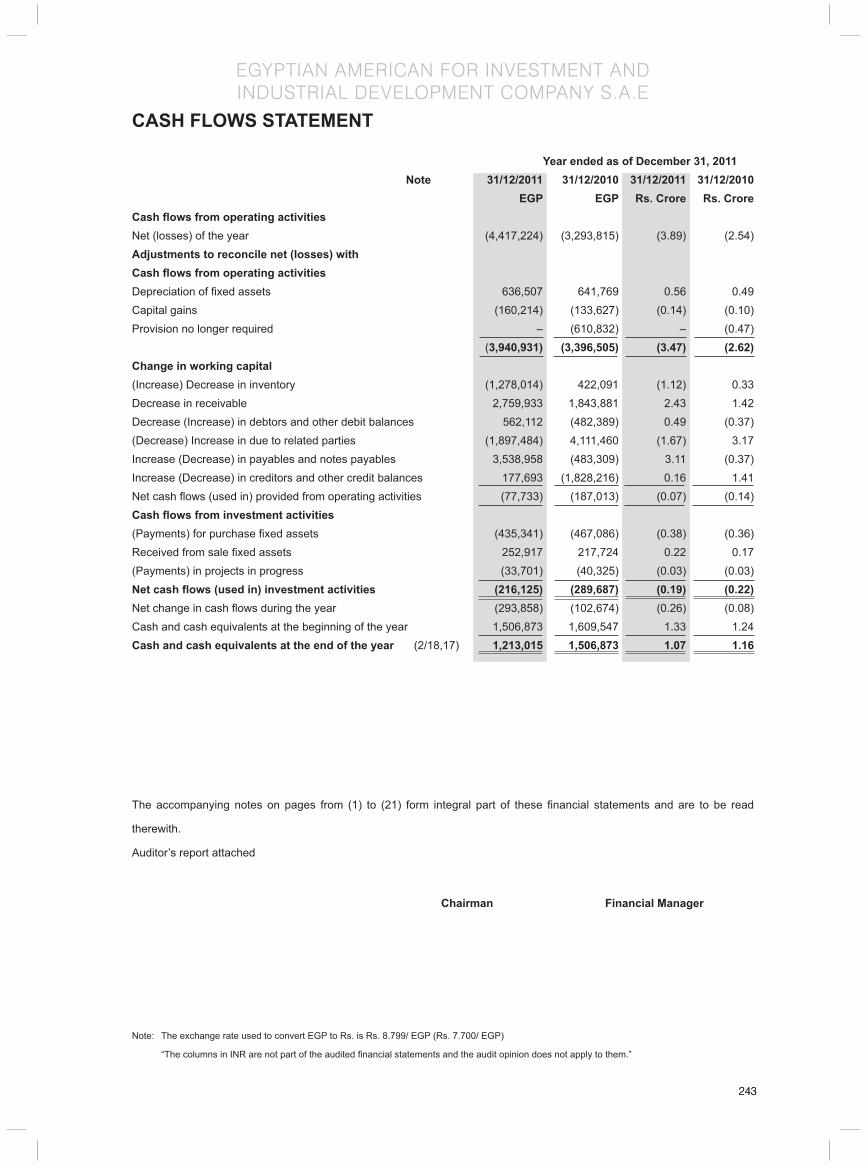
243
EGYPTIAN AMERICAN FOR INVESTMENT AND INDUSTRIAL DEVELOPMENT COMPANY S.A.E
243
Year ended as of December 31, 2011 Note 31/12/2011 31/12/2010 31/12/2011 31/12/2010 EGP EGP Rs. Crore Rs. CroreCash fl ows from operating activitiesNet (losses) of the year (4,417,224) (3,293,815) (3.89) (2.54)Adjustments to reconcile net (losses) with Cash fl ows from operating activitiesDepreciation of fi xed assets 636,507 641,769 0.56 0.49Capital gains (160,214) (133,627) (0.14) (0.10)Provision no longer required – (610,832) – (0.47) (3,940,931) (3,396,505) (3.47) (2.62)Change in working capital(Increase) Decrease in inventory (1,278,014) 422,091 (1.12) 0.33Decrease in receivable 2,759,933 1,843,881 2.43 1.42Decrease (Increase) in debtors and other debit balances 562,112 (482,389) 0.49 (0.37)(Decrease) Increase in due to related parties (1,897,484) 4,111,460 (1.67) 3.17Increase (Decrease) in payables and notes payables 3,538,958 (483,309) 3.11 (0.37)Increase (Decrease) in creditors and other credit balances 177,693 (1,828,216) 0.16 1.41Net cash fl ows (used in) provided from operating activities (77,733) (187,013) (0.07) (0.14)Cash fl ows from investment activities(Payments) for purchase fi xed assets (435,341) (467,086) (0.38) (0.36)Received from sale fi xed assets 252,917 217,724 0.22 0.17(Payments) in projects in progress (33,701) (40,325) (0.03) (0.03)Net cash fl ows (used in) investment activities (216,125) (289,687) (0.19) (0.22)Net change in cash fl ows during the year (293,858) (102,674) (0.26) (0.08)Cash and cash equivalents at the beginning of the year 1,506,873 1,609,547 1.33 1.24Cash and cash equivalents at the end of the year (2/18,17) 1,213,015 1,506,873 1.07 1.16
CASH FLOWS STATEMENT
The accompanying notes on pages from (1) to (21) form integral part of these fi nancial statements and are to be read
therewith.
Auditor’s report attached
Chairman Financial Manager
Note: The exchange rate used to convert EGP to Rs. is Rs. 8.799/ EGP (Rs. 7.700/ EGP)
“The columns in INR are not part of the audited fi nancial statements and the audit opinion does not apply to them.”

244
EGYPTIAN AMERICAN FOR INVESTMENT AND INDUSTRIAL DEVELOPMENT COMPANY S.A.E
244
NOTES TO THE FINANCIAL STATEMENTSFor the fi nancial year ended as of December 31, 2011
1 The Company’s Background and its Activities
Egyptian American Co. for Investment and Industrial Development” Redico-An Egyptian Joint Stock Company – was established under the provisions of law No. 159 of 1981 and its executive regulation. The company was registered in the commercial register under no.117830, dated 14/12/1997.
According to decision of the Extraordinary General Assembly Meeting held on 16/12/2006 and the resolution issued by Chairman of General Authority For Investments & Free Zone (GAFI) No.235/2 for the year 2007 concerning the division licensing of the Egyptian American Co. for Investment and Industrial Development –Redico- in order to be divided into two companies (split company and split off company) and according to what will be mentioned below , the recent name of the company is, the Egyptian American Co. for Investment and Industrial Development.
The aforementioned amendment concerning the name of the company was registered in the commercial register on 15/3/2007.
The company period is 25 years starting from 14th Dec1997 till 13th Dec 2022.
The company located in fi rst & second fl oor lands No. 1130,the second industrial zone, sixth of October.
The objective of the company
1 Manufacturing cosmetics, perfumes and essential oils – Reedy Rose – Five Flowers -Top Girl and the new lines of production that can develop in the fi eld of manufacturing cosmetics.
2 Importing equipment, machines, tools and raw materials required in order to execute the objectives of the company.
3 Import, export and commercial agencies.
All the above mentioned objectives are carried out in conformity with the provisions, regulations and the applicable decrees provided that all licenses required practicing such activities are issued.
The company may have an interest or participate in any manner with the companies and others who proactive similar activities or may cooperate with the company to achieve its objectives in Egypt or abroad. The company may also merge into the aforementioned entities, purchasing them or to make them affi liated there to according to the provision of law and its regulations.
According to General Authority For Investment & Free Zone (GAFI) chairman’s decision No.235/2 for the year 2007 regarding the license to divide Egyptian American Co. for Investment and Industrial Development (Redico), referred there to as the split company ,into two joint stock
companies according to the below – mentioned data, and based upon the decision of the Extraordinary General Assembly Meeting , held on 16/12/2006.It was approved to amend the objective of the company to be as follows :
4 Manufacturing cosmetics, perfumes and essential oils.
5 Importing equipment, machines, tools and raw materials required to execute the objectives of the company.
6 Import, export and commercial agencies.
2 Signifi cant accounting policies
2-1- Upholding accounting standards and legal principles
The accompanying fi nancial statements have been prepared in accordance with Egyptian accounting standards and the related Egyptian laws and regulation in the light of the international fi nancial reporting standards to process cases weren’t stated in the Egyptian standards.

245
EGYPTIAN AMERICAN FOR INVESTMENT AND INDUSTRIAL DEVELOPMENT COMPANY S.A.E
245
NOTES TO THE FINANCIAL STATEMENTSFor the fi nancial year ended as of December 31, 2011
2-2- Basis preparation of the fi nancial statements
The fi nancial statements have been prepared at Egyptian pound.
The fi nancial statements have been prepared according to historical cost and continuity presumption.
2-3- Change in accounting principles
The accounting principles comply with those adopted in the previous year.
2-4-Foreign currencies translation
The company maintains its books in Egyptian pound. All transactions denominated in foreign currencies were translated into Egyptian pound at the rate determined on the transaction date, on the balance sheet, the monetary current assets and liabilities are evaluated accordance the rates announced on that date and the differences are charged to income statement.
2-5- Fixed assets (net)
Recognition and preliminary measurement:
Buildings, constructions, infrastructures, machines and equipments are booked at historical cost less the accumulated depreciation and impairment.
The cost includes all direct cost for acquisition the asset also cost of getting of it and re-arranging the site where assets were present.
The Depreciation
Fixed assets are shown in the balance sheet at historical cost, are depreciated using straight line method and according to estimated useful life of each asset in accordance with the following rates:
Estimated useful life / year
Buildings 8.33% 12
Machinery 25% 4
Lab equipments 25% 4
Computers and programs 50% 2
Furniture & offi ce equipments 25% 4
Vehicles 25% 4
2-6- Inventory (net)
Inventories are stated at the lower of cost and net realisable value. Cost is determined using the weighted average method. The cost of fi nished goods and work in progress comprises raw materials, direct labour and other direct costs. Net realisable value is the estimated selling price in the ordinary course of business, less applicable variable selling expenses. Provision is made for impairment.
2-7- Projects in progress
Projects under progress are refl ected according to cost and include all direct expenses required to prepare the asset to be in a state of operation and for the purpose for which it was acquired. Projects under progress are recorded as fi xed assets once it is fi nished and it is available for the purpose it was acquired for. Projects under progress are valued at the date of the balance sheet according to its cost and deducting the impairment in its value if any.
246
EGYPTIAN AMERICAN FOR INVESTMENT AND INDUSTRIAL DEVELOPMENT COMPANY S.A.E
246
NOTES TO THE FINANCIAL STATEMENTSFor the fi nancial year ended as of December 31, 2011
2-8- Impairment in the value of non-fi nancial assets
The book value of the Company’s non-fi nancial assets, other than inventory and deferred tax assets is reviewed at the date of each fi nancial position to ascertain the amount of impairment. The Company carries out a regular review to ascertain if there has been impairment in the value of an asset and in case that there is an indication of such impairment, the resale value is compared to the book value. If the book value is above the resale value, then there is impairment in the value of the asset and the resale value is reduced and the loss is charged in the income statement. The amount of impairment may be returned in case that there is a change in the resale value to the extent that the amount was reduced in the past.
2-9- Impairment in the value of fi nancial assets
On the anniversary of each balance sheet, an objective estimate is carried out to ascertain if there is true indication that any of the assets have been impaired. Once there is a impairment in the value of an asset the loss is recorded only if there are objective proofs that the impairment of the value was due to an incident or more after the initial realization of the asset and that such incident or incidents had an affect that can be evaluated in a reliable manner for
the expected future cash fl ow from the asset. In the case of fi nancial assets that are recorded according to their amortized cost impairment, the loss due to impairment of its value between the book value of such asset and the present value of the future cash fl ow that has been discounted by the original actual interest rate relating to this asset.
The book value of the fi nancial asset is reduced directly except in case of clients accounts that is reduced using provisions. Any amount that is not to be collected is to be written off from the provision and the amount of the realized loss will be reimbursed either directly or by settling the provisions account. It should be ensured that such reversal will not generate a book value for the asset which is higher than the amortized cost at the date of the writing off of the amount of impairment if such impairment has not been recognized. The amount of write off will be refl ected in the income statement.
2-10- Revenue recognition
Revenue is recognized once the service has been carried out and invoice has been issued according to the accrual principle.
Regarding the revenues from dividends due on fi nancial notes and investments in subsidiary companies, this income is recognized once the general assembly has approved the distribution to its investors.
2-11- Provisions
A provision is recognized once the company has a current legal or actual obligation due to a previous incident which is likely to require the use of economic sources to settle such obligation while preparing a valuation of the value of the obligation. The provisions are to be reviewed on the anniversary of the balance sheet and amended to refl ect the most accurate present valuation and in case that the present value of cash is of essence, then the amount recognized as provision is the present value of the expected expenses to settle the obligation.
2-12- Employees’ benefi ts
1. Social insurance & pension scheme
The company contributes to the government social insurance system on behalf of the employees according to the social insurance law No. 79 year 1975 and its amendments. The employees and the company contribute according to this law with a fi xed percentage of their salary and the company’s obligation is limited to its contribution. The company’s contribution is refl ected in the income statement according to the accrual principle.
247
EGYPTIAN AMERICAN FOR INVESTMENT AND INDUSTRIAL DEVELOPMENT COMPANY S.A.E
247
NOTES TO THE FINANCIAL STATEMENTSFor the fi nancial year ended as of December 31, 2011
2. Employee profi t share
According to its constitution, the company distributes part of the profi ts dividends to the employees as per the recommendations stipulated by the Board of Directors and approved by the General Assembly. The employee share of profi t will be recognized as distribution of profi t in shareholders’ equity statement and as an obligation for the period that the company’s shareholders approved such distribution.
2-13- Related parties transactions
All transactions with related parties are booked by the company in the same manner as any other normal transaction with other parties.
2-14- Accounting estimates
According to Egyptian accounting standards the preparation of the fi nancial statement requires the management to make some approximations and predictions that affect the value of assets, obligations, income and expenses during the fi nancial year. The actual amounts could be quite different from these predictions.
2-15- Expenses
All expense, including administrative and general expenses, are to be refl ected in the income statement for the fi nancial period that such expenses were incurred according to accrual bases.
2-16- Legal reserve
According to law No. 159 year 1981, its executive directives and the constitution of the company , there should be legal reserve of no less 5% of the profi t of the company and such reserve should not be increased once this reserve amount reaches 50% of the company’s issued capital .
2-17- Cash fl ows statement
The cash fl ow statement will be prepared according to the indirect method.
2-18- Cash and cash equivalents
For the purpose of the cash fl ows statement, cash and cash equivalents are to be considered cash on hand and at banks, short term fi xed deposits, cheques under collection and letters of guarantee cover, if any.
2-19- Comparative Figures
Comparative fi gures are reclassifi ed whenever it is necessary to amend the presentation used during the current period
2-20- Deferred tax
Deferred tax is recognized using liability method on the temporary amount as an asset or liabilities for tax purposes and includes in the fi nancial statements using the know tax rate .
2-21- Profi t per share
Profi t per share is calculated by the weighted average method according to the number of common shares during the year after deducting the employees share and the board of directors’ allowance from the profi ts.
3 Financial Instruments
Financial instruments are made up of any contractual agreement that gives the right to fi nancial assets of the company and creates a fi nancial or shareholding obligation to the other side of the contact.
3-1- Receivables (net)
Receivables are recognized initially at fair value and subsequently measured at amortized cost using the effective interest method, less provision for impairment. A provision for impairment of receivables is established when there
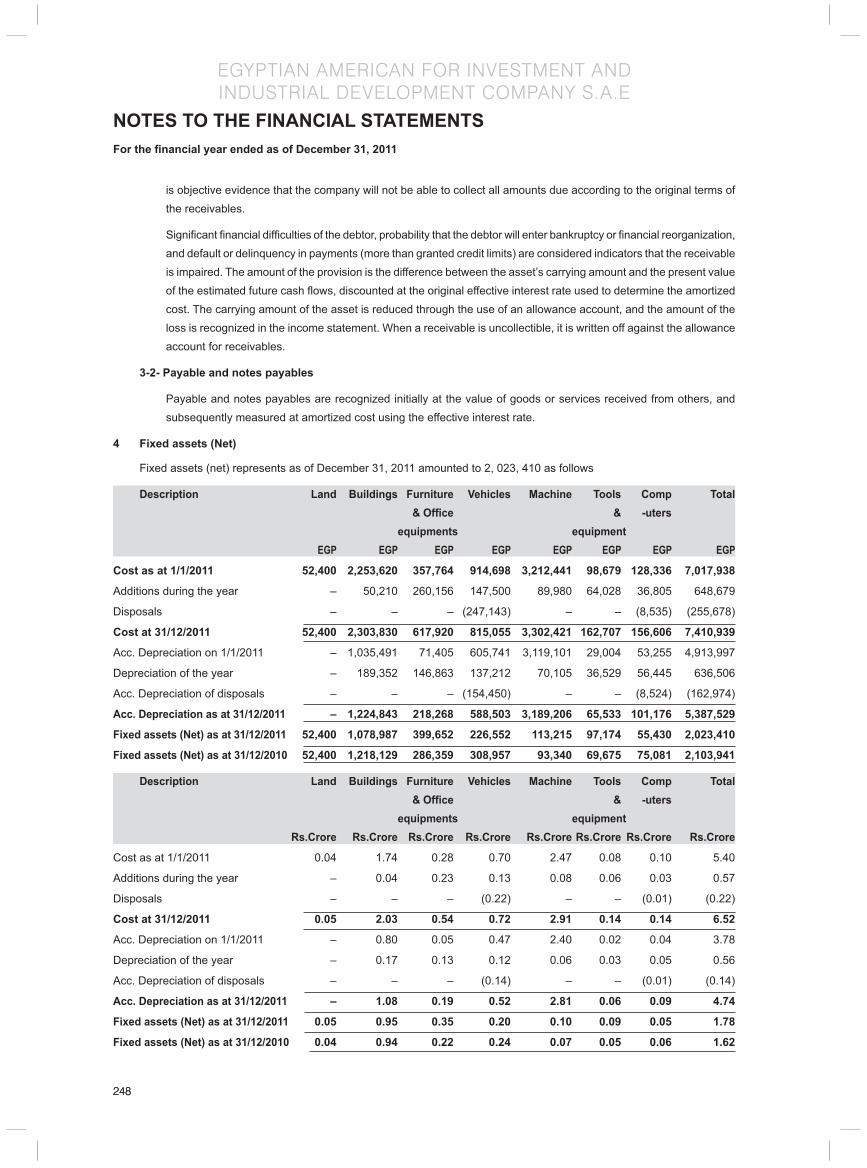
248
EGYPTIAN AMERICAN FOR INVESTMENT AND INDUSTRIAL DEVELOPMENT COMPANY S.A.E
248
NOTES TO THE FINANCIAL STATEMENTSFor the fi nancial year ended as of December 31, 2011
is objective evidence that the company will not be able to collect all amounts due according to the original terms of the receivables.
Signifi cant fi nancial diffi culties of the debtor, probability that the debtor will enter bankruptcy or fi nancial reorganization, and default or delinquency in payments (more than granted credit limits) are considered indicators that the receivable is impaired. The amount of the provision is the difference between the asset’s carrying amount and the present value of the estimated future cash fl ows, discounted at the original effective interest rate used to determine the amortized cost. The carrying amount of the asset is reduced through the use of an allowance account, and the amount of the loss is recognized in the income statement. When a receivable is uncollectible, it is written off against the allowance account for receivables.
3-2- Payable and notes payables
Payable and notes payables are recognized initially at the value of goods or services received from others, and subsequently measured at amortized cost using the effective interest rate.
4 Fixed assets (Net)
Fixed assets (net) represents as of December 31, 2011 amounted to 2, 023, 410 as follows
Description Land Buildings Furniture Vehicles Machine Tools Comp Total & Offi ce & -uters equipments equipment EGP EGP EGP EGP EGP EGP EGP EGP
Cost as at 1/1/2011 52,400 2,253,620 357,764 914,698 3,212,441 98,679 128,336 7,017,938
Additions during the year – 50,210 260,156 147,500 89,980 64,028 36,805 648,679
Disposals – – – (247,143) – – (8,535) (255,678)
Cost at 31/12/2011 52,400 2,303,830 617,920 815,055 3,302,421 162,707 156,606 7,410,939
Acc. Depreciation on 1/1/2011 – 1,035,491 71,405 605,741 3,119,101 29,004 53,255 4,913,997
Depreciation of the year – 189,352 146,863 137,212 70,105 36,529 56,445 636,506
Acc. Depreciation of disposals – – – (154,450) – – (8,524) (162,974)
Acc. Depreciation as at 31/12/2011 – 1,224,843 218,268 588,503 3,189,206 65,533 101,176 5,387,529
Fixed assets (Net) as at 31/12/2011 52,400 1,078,987 399,652 226,552 113,215 97,174 55,430 2,023,410
Fixed assets (Net) as at 31/12/2010 52,400 1,218,129 286,359 308,957 93,340 69,675 75,081 2,103,941
Description Land Buildings Furniture Vehicles Machine Tools Comp Total & Offi ce & -uters
equipments equipment Rs.Crore Rs.Crore Rs.Crore Rs.Crore Rs.Crore Rs.Crore Rs.Crore Rs.Crore
Cost as at 1/1/2011 0.04 1.74 0.28 0.70 2.47 0.08 0.10 5.40
Additions during the year – 0.04 0.23 0.13 0.08 0.06 0.03 0.57
Disposals – – – (0.22) – – (0.01) (0.22)
Cost at 31/12/2011 0.05 2.03 0.54 0.72 2.91 0.14 0.14 6.52
Acc. Depreciation on 1/1/2011 – 0.80 0.05 0.47 2.40 0.02 0.04 3.78
Depreciation of the year – 0.17 0.13 0.12 0.06 0.03 0.05 0.56
Acc. Depreciation of disposals – – – (0.14) – – (0.01) (0.14)
Acc. Depreciation as at 31/12/2011 – 1.08 0.19 0.52 2.81 0.06 0.09 4.74
Fixed assets (Net) as at 31/12/2011 0.05 0.95 0.35 0.20 0.10 0.09 0.05 1.78
Fixed assets (Net) as at 31/12/2010 0.04 0.94 0.22 0.24 0.07 0.05 0.06 1.62
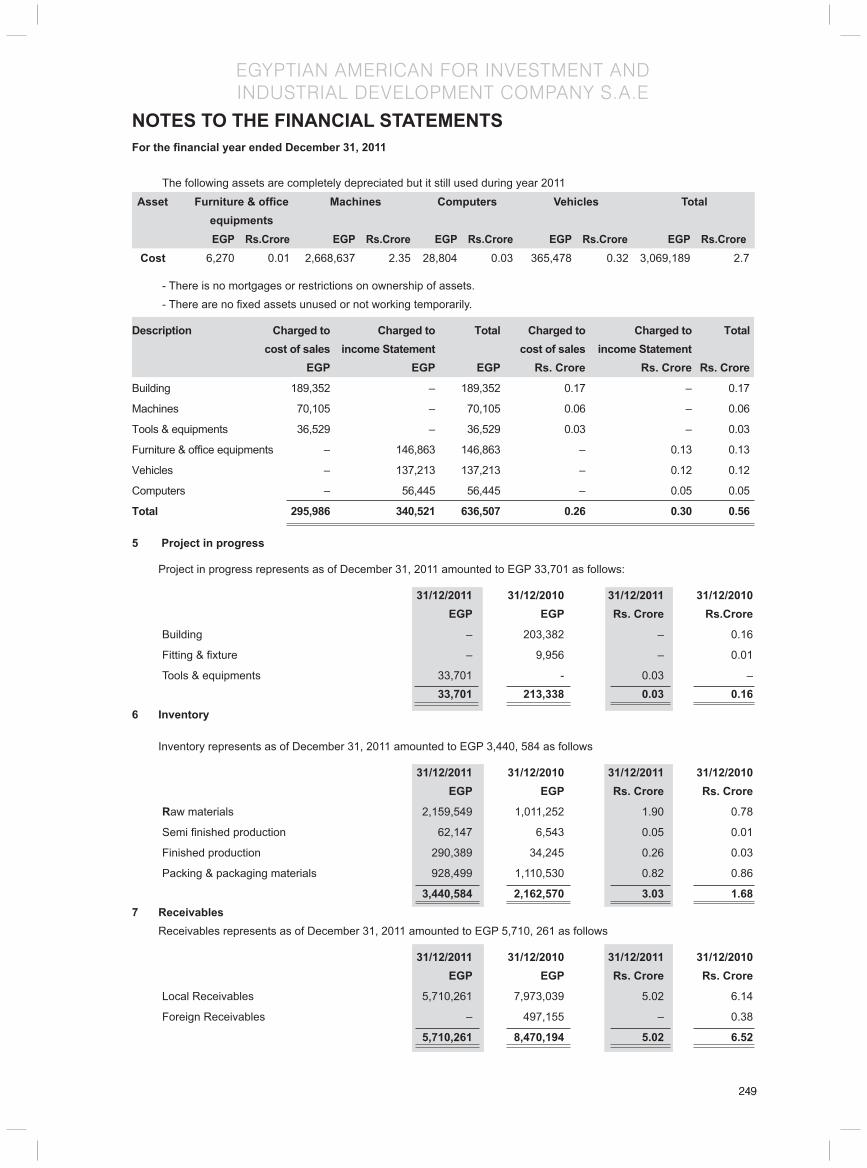
249
EGYPTIAN AMERICAN FOR INVESTMENT AND INDUSTRIAL DEVELOPMENT COMPANY S.A.E
249
NOTES TO THE FINANCIAL STATEMENTSFor the fi nancial year ended December 31, 2011
The following assets are completely depreciated but it still used during year 2011
Asset Furniture & offi ceequipments
Machines Computers Vehicles Total
EGP Rs.Crore EGP Rs.Crore EGP Rs.Crore EGP Rs.Crore EGP Rs.Crore Cost 6,270 0.01 2,668,637 2.35 28,804 0.03 365,478 0.32 3,069,189 2.7
- There is no mortgages or restrictions on ownership of assets. - There are no fi xed assets unused or not working temporarily.
Description Charged to Charged to Total Charged to Charged to Total cost of sales income Statement cost of sales income Statement EGP EGP EGP Rs. Crore Rs. Crore Rs. Crore
Building 189,352 – 189,352 0.17 – 0.17
Machines 70,105 – 70,105 0.06 – 0.06
Tools & equipments 36,529 – 36,529 0.03 – 0.03
Furniture & offi ce equipments – 146,863 146,863 – 0.13 0.13
Vehicles – 137,213 137,213 – 0.12 0.12
Computers – 56,445 56,445 – 0.05 0.05
Total 295,986 340,521 636,507 0.26 0.30 0.56
5 Project in progress
Project in progress represents as of December 31, 2011 amounted to EGP 33,701 as follows:
31/12/2011 31/12/2010 31/12/2011 31/12/2010 EGP EGP Rs. Crore Rs.Crore
Building – 203,382 – 0.16
Fitting & fi xture – 9,956 – 0.01
Tools & equipments 33,701 - 0.03 – 33,701 213,338 0.03 0.16
6 Inventory
Inventory represents as of December 31, 2011 amounted to EGP 3,440, 584 as follows
31/12/2011 31/12/2010 31/12/2011 31/12/2010 EGP EGP Rs. Crore Rs. Crore
Raw materials 2,159,549 1,011,252 1.90 0.78
Semi fi nished production 62,147 6,543 0.05 0.01
Finished production 290,389 34,245 0.26 0.03
Packing & packaging materials 928,499 1,110,530 0.82 0.86
3,440,584 2,162,570 3.03 1.687 Receivables Receivables represents as of December 31, 2011 amounted to EGP 5,710, 261 as follows
31/12/2011 31/12/2010 31/12/2011 31/12/2010 EGP EGP Rs. Crore Rs. Crore
Local Receivables 5,710,261 7,973,039 5.02 6.14
Foreign Receivables – 497,155 – 0.38
5,710,261 8,470,194 5.02 6.52

250
EGYPTIAN AMERICAN FOR INVESTMENT AND INDUSTRIAL DEVELOPMENT COMPANY S.A.E
250
NOTES TO THE FINANCIAL STATEMENTSFor the year ended 31 December 2011
8 Debtors and other debit accounts Debtors and other debit balances represents as of December 31, 2011 amounted to EGP 171, 412 as follows:
31/12/2011 31/12/2010 31/12/2011 31/12/2010 EGP EGP Rs. Crore Rs. Crore
Suppliers –advanced payments 135,887 604,741 0.12 0.47
Prepaid expenses 18,846 51,275 0.02 0.04
Deposits with others 8,639 34,065 0.01 0.03
Employees loans 1,597 – 0.01 – advanced payments to purchase fi xed assets – 37,000 – 0.03
Other debit accounts 6,443 6,443 0.01 – 171,412 733,524 0.16 0.579 Cash at bank and equivalents Cash at banks and equivalent represents as of December 31, 2011 amounted to EGP 1, 872, 276 as follows:
31/12/2011 31/12/2010 31/12/2011 31/12/2010 EGP EGP Rs. Crore Rs. Crore
Banks – local currency 41,613 74,733 0.04 0.06
Banks – foreign currency 186,670 41,747 0.16 0.03
Cheques under collection 1,643,993 1,712,711 1.45 1.32
L/G Margin – 9,000 0 0.01
1,872,276 1,838,191 1.65 1.4210 Due to related parties
Due to related parties represents as of December 31, 2011 amounted to EGP 15, 482, 328 as follows
31/12/2011 31/12/2010 31/12/2011 31/12/2010 EGP EGP Rs. Crore Rs. Crore
MEL Consumer Care Company 3,647,465 6,020,141 3.21 4.64
Marico Middle East Company 11,778,467 11,329,500 10.36 8.72
Marico limited Company - India 56,396 30,171 0.05 0.02
15,482,328 17,379,812 13.62 13.38 11 Payables and Notes Payables Payables and notes payable represents as of December 31, 2011 amounted to EGP 6, 555, 361 as follows:
31/12/2011 31/12/2010 31/12/2011 31/12/2010 EGP Rs. Crore EGP Rs. Crore
Payables 3,202,514 623,370 2.82 0.48
Notes payable 3,352,847 2,393,033 2.95 1.84
6,555,361 3,016,403 5.77 2.32

251
EGYPTIAN AMERICAN FOR INVESTMENT AND INDUSTRIAL DEVELOPMENT COMPANY S.A.E
251
NOTES TO THE FINANCIAL STATEMENTSFor the year ended 31 December 2011
12 Creditors and other credit balance
Creditors and other credit balances represents as of December 31, 2011 amounted to EGP 1, 773, 778 as follows
31/12/2011 31/12/2010 31/12/2011 31/12/2010 EGP EGP Rs. Crore Rs. Crore
Accrued expenses 676,498 662,036 0.60 0.51
Sales tax 612,207 548,802 0.54 0.42
Clients advanced payments 286,673 - 0.25 -
Stamp duty 122,685 705 0.11 -
Withholding tax 20,990 19,389 0.02 0.01
Salaries & wages tax 15,860 28,773 0.01 0.02
Social insurance authority 13,296 18,985 0.01 0.01
Creditors for fi xed assets purchases - 41,449 - 0.03
Other credit balances 25,569 275,946 0.02 0.21
1,773,778 1,596,085 1.56 1.21
13 Capital
A Authorized capital
The company’s authorized capital amounted to EGP 25 million (twenty fi ve million Egyptian pound) distributed over 250,000 share the nominal value of each share is EGP 100 (one hundred Egyptian pound).
B Issued and paid capital
The issued capital was determined by EGP 68,92,000 (six million and eight hundred ninety two thousand Egyptian pound ) distributed over 68,920 share ( sixty eight thousand and nine hundred twenty share) , the per value of each share is EGP 100 ( one hundred Egyptian pound ) and all of which are nominal cash shares which is fully paid, according to general authority for investment and free zones decision No. 235/2 for year 2007 the company issued capital is determined by EGP 68,92,000 after excluding an amount of EGP 493 and being carried forward to the reserves.
The shareholder Mr/ Brajesh Bajpai sold all its shares which represented in 50 shares of per value of share EGP 100 to Mr/ Aditya Kumar Shome and this is in accordance the certifi cate which issued by the Egyptian stock exchange session on January 4, 2010.
The Issued and paid capital is distributed as follows
Name Nationality Value of No. of Amount each share share EGP EGP
Mr. Harsharij Charandas Mariwala Indian 100 320 32,000
Mr. Milined Shripad Sarwate Indian 100 320 32,000
Mr. Aditya Kumar Indian 100 50 5,000
Marico Middle East Emirates 100 68,230 6,823,000
68,920 6,892,000

252
EGYPTIAN AMERICAN FOR INVESTMENT AND INDUSTRIAL DEVELOPMENT COMPANY S.A.E
252
NOTES TO THE FINANCIAL STATEMENTSFor the year ended 31 December 2011
Name Nationality Value of No. of Amount each share share Rs.Crore Rs.Crore
Mr. Harsharij Charandas Mariwala Indian 0.01 320 0.03
Mr. Milined Shripad Sarwate Indian 0.01 320 0.03
Mr. Aditya Kumar Indian 0.01 50 – Marico Middle East Emirates 0.01 68,230 6.00
68,920 6.06
14 Deferred tax liabilities
This item is made up as follows Liabilities Liabilities Liabilities Liabilities 31/12/2011 31/12/2010 31/12/2011 31/12/2010 EGP EGP Rs.Crore Rs.Crore
Fixed assets 85,101 85,101 0.07 0.07 85,101 85,101 0.07 0.07
15 Activity revenues
This item is made up as follows 31/12/2011 31/12/2010 31/12/2011 31/12/2010 EGP EGP Rs.Crore Rs.Crore
Activity revenues 32,974,090 37,529,509 29.01 28.90
Less :
Trade discount (14,567,887) (14,786,138) (12.82) (11.39)
Cash discount – (687,941) – (0.53)
18,406,203 22,055,430 16.19 16.98
16 Losses per share
Losses per share are determined as follows 31/12/2011 31/12/2010 31/12/2011 31/12/2010 EGP EGP Rs.Crore Rs.Crore
Net (losses) of the year (4,417,224) (3,306,326) (3.89) (2.55)
Number of share 68,920 68,920 0.06 0.05
Losses per share (EGP / share) 64.09 47.97 0.01 0.01
17 Cash & its equivalent (for the purpose of preparing statement of cash fl ows)
This item is made up as follows 31/12/2011 31/12/2010 31/12/2011 31/12/2010 EGP EGP Rs. Crore Rs.Crore
Cash at banks & its equivalent 1,872,276 1,838,191 1.65 1.42
Less:
Banks (over darft) 659,261 331,318 0.58 0.26
1,213,015 1,506,873 1.07 1.16
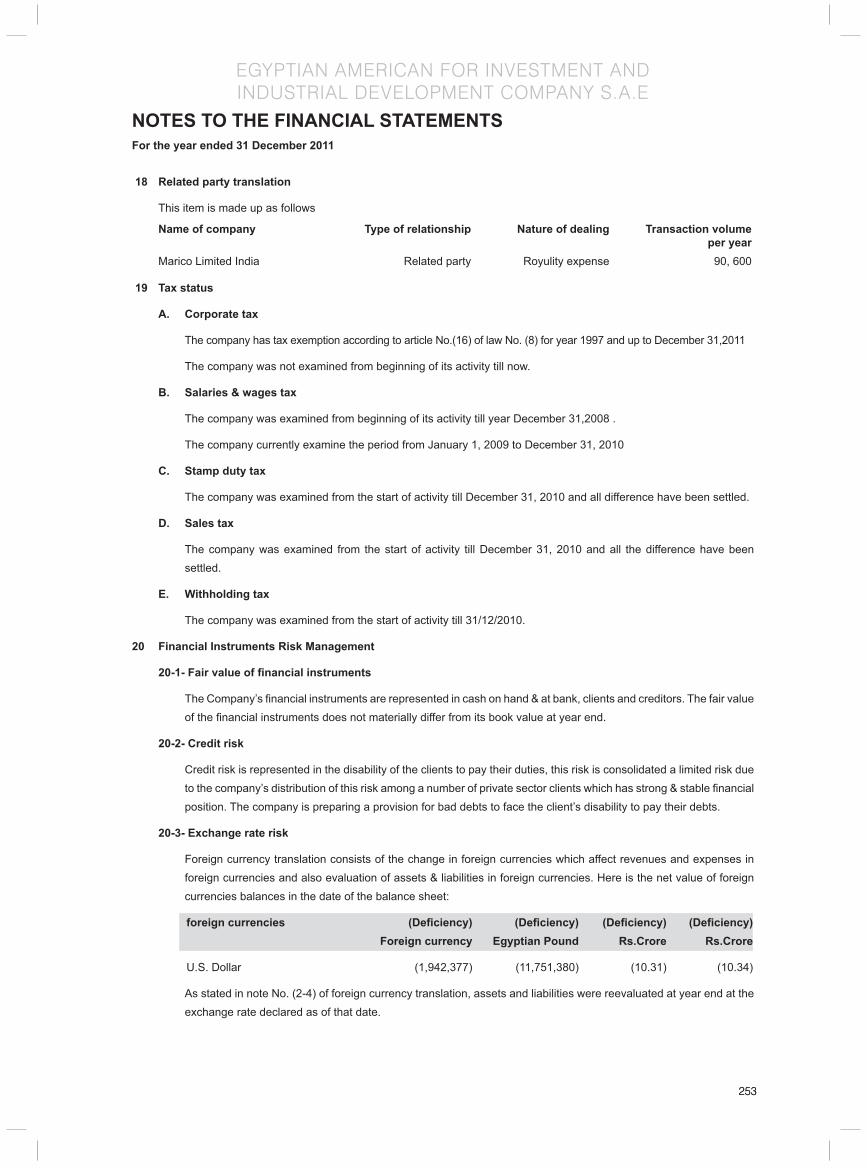
253
EGYPTIAN AMERICAN FOR INVESTMENT AND INDUSTRIAL DEVELOPMENT COMPANY S.A.E
253
NOTES TO THE FINANCIAL STATEMENTSFor the year ended 31 December 2011
18 Related party translation
This item is made up as follows
Name of company Type of relationship Nature of dealing Transaction volume per year Marico Limited India Related party Royulity expense 90, 600
19 Tax status
A. Corporate tax
The company has tax exemption according to article No.(16) of law No. (8) for year 1997 and up to December 31,2011
The company was not examined from beginning of its activity till now.
B. Salaries & wages tax
The company was examined from beginning of its activity till year December 31,2008 .
The company currently examine the period from January 1, 2009 to December 31, 2010
C. Stamp duty tax
The company was examined from the start of activity till December 31, 2010 and all difference have been settled.
D. Sales tax
The company was examined from the start of activity till December 31, 2010 and all the difference have been settled.
E. Withholding tax
The company was examined from the start of activity till 31/12/2010.
20 Financial Instruments Risk Management
20-1- Fair value of fi nancial instruments
The Company’s fi nancial instruments are represented in cash on hand & at bank, clients and creditors. The fair value of the fi nancial instruments does not materially differ from its book value at year end.
20-2- Credit risk
Credit risk is represented in the disability of the clients to pay their duties, this risk is consolidated a limited risk due to the company’s distribution of this risk among a number of private sector clients which has strong & stable fi nancial position. The company is preparing a provision for bad debts to face the client’s disability to pay their debts.
20-3- Exchange rate risk
Foreign currency translation consists of the change in foreign currencies which affect revenues and expenses in foreign currencies and also evaluation of assets & liabilities in foreign currencies. Here is the net value of foreign currencies balances in the date of the balance sheet:
foreign currencies (Defi ciency) (Defi ciency) (Defi ciency) (Defi ciency) Foreign currency Egyptian Pound Rs.Crore Rs.Crore
U.S. Dollar (1,942,377) (11,751,380) (10.31) (10.34)
As stated in note No. (2-4) of foreign currency translation, assets and liabilities were reevaluated at year end at the exchange rate declared as of that date.

254
EGYPTIAN AMERICAN FOR INVESTMENT AND INDUSTRIAL DEVELOPMENT COMPANY S.A.E
254
NOTES TO THE FINANCIAL STATEMENTSFor the year ended 31 December 2011
20-4- Interest risk
Interest risk represents the change in currency rate which affect the results of business and this risk does not exist because the company does not depend on bank credit facilities to fi nance working capital and long term assets.
21 Comparison fi gures have been reclassifi ed to confi rm with current year classifi cation.
Chairman Financial Manager

255
MARICO EGYPT FOR INDUSTRIES (SAE)
Board of Directors Debashish Neogi
Padmanabh Maydeo
Saumitra Bhat
MELCC, represented by Mohamed El-Araby
Registered Offi ce 11B Hegaz Sq., Mohandesen, Giza, Egypt
Auditors Moore Stephens
Bankers HSBC Limited
NSGB Limited
Legal Advisors Yasser Maharem Offi ce for Accounting & Auditing, Nassef Law fi rm

256
MARICO EGYPT FOR INDUSTRIES (SAE)
To: The shareholders of Marico Egypt For Industries (SAE)
Report on the fi nancial statement
We have audited the accompanying balance sheet of Marico Egypt for industries SAE as of December 31, 2011 and the related statements of income, cash fl ows and changes in shareholder’s equity for the year then ended and a summary of signifi cant accounting policies and other explanatory notes.
Management’s responsibility for the fi nancial statements
These fi nancial statements are the responsibility of the company’s management.The management is responsible for the preparation and fair presentation of these fi nancial statements in accordance with Egyptian Accounting Standards and in light of the Egyptian laws this responsibility includes designing , implementing and maintaining internal control relevant to the preparation and fair presentation of fi nancial statements that are free from material misstatement , whether due to fraud or error selecting and applying appropriate accounting policies and making accounting estimates that are reasonable in the circumstances.
Auditors responsibility
Our responsibility is to express an opinion on these fi nancial statements based on our audit.
We conducted our audit in accordance with the Egyptian Auditing Standards and the relevant laws and regulations. Those standards require that we comply with ethical requirements to obtain reasonable assurance about whether the fi nancial statements are free from material misstatements.
An audit involves performing procedures to obtain audit evidence about the amounts and disclosures in the fi nancial statements. The procedures selected depend on the auditor’s judgment, including the assessment of the risks of material misstatement of the fi nancial statements. Whether due to fraud or error. In making those risk assessment, the auditor considers internal control relevant to the entity’s preparation and fair presentation of the fi nancial statements in order to design audit procedures that are appropriate in the circumstances,but not for the purpose of expressing an opinion on the effectiveness of the entity’s internal control . An audit also includes evaluating the appropriateness of accounting policies used and the reasonableness of accounting estimates made by management, as well as evaluating the overall presentation of the fi nancial statements.
We believe that the audit evidence we have obtained is suffi cient and appropriate to provide a basis for our audit opinion.
Opinion
In our opinion the financial statement present fairly in all material respects, the financial position of Marico Egypt for industries SAE as of December 31,2011 and of its fi nancial performance and its cash fl ows for the fi nancial year then ended, in accordance with the Egyptian Accounting Standards and the relevant laws and regulations.
Report on the other legal and regulatory requirements
The company keeps proper accounting records, include all that is required by law to be recorded therein and the accompanying fi nancial statements are agreement therewith,the company applies a suffi cient costing system. Inventory count and valuation was made by the company’s management and in accordance with the proper process.
The fi nancial information included in the board of directors’ report in compliance with companies law no. 159 year 1981 and its executive regulation and its agreement with the accounting record of the company to the extent that such information is recorded therein.
Cairo 26/01/2012
Sherin Noureldin
R.A.A. 6809
Moore Stephens Egypt
INDEPENDENT AUDITORS’ REPORT

257
MARICO EGYPT FOR INDUSTRIES (SAE)
BALANCE SHEETAs at December 31, 2011 Notes 31/12/2011 31/12/2010 31/12/2011 31/12/2010
No. EG.P EG.P Rs. Crore Rs. Crore
Long Term Assets
Fixed assets ( Net ) (2/5,4) 13,049,729 4,096,209 11.48 3.15
Intangible assets (Net) (2/6,5) 7,821 15,643 0.01 0.01
Projects in progress (2/7,6) 57,200 1,030,165 0.05 0.79
Total long term assets 13,114,750 5,142,017 11.54 3.95
Current assets
Inventory (Net) (2/8,7) 6,991,702 6,333,752 6.15 4.88
Receivables and notes receivables (Net) (3/1,8) 16,682,043 20,010,324 14.68 15.41
Suppliers advanced payments (3/1) 1,371,191 402,655 1.21 0.31
Debtors and other debit balances (3/1,9) 484,318 4,504,999 0.43 3.47
Due from related parties (2/14,10) 36,859,037 26,088,019 32.43 20.09
Cash and cash equivalent (11) 14,788,785 13,815,455 13.01 10.64
Total current assets 77,177,076 71,155,204 67.91 54.80
Current liabilities
Provisions (2/12,12) 102,769 1,922,061 0.09 1.48
Banks overdraft (13) 3,122,889 1,645,667 2.75 1.27
Due to related parties (2/14,14) 359,141 246,311 0.32 0.19
Payables and notes payable (3/2,15) 11,567,500 8,554,998 10.18 6.59
Creditors and other credit balances (3/2,16) 10,060,504 8,375,396 8.85 6.45
Total current liabilities 25,212,803 20,744,433 22.19 15.98
Working Capital 51,964,273 50,410,771 45.72 38.82
Total investment 65,079,023 55,552,788 57.26 42.77
Shareholder’s Equity
Authorized capital (17) 20,000,000 20,000,000 17.60 15.40
Issued & fully Paid capital (17) 12,287,690 12,287,690 10.81 9.46
Legal reserve (2/17,18) 2,163,255 1,447,026 1.90 1.11
Retained earnings 41,101,843 27,493,476 36.17 21.17
Net profi t for the year 9,526,235 14,324,596 8.38 11.03
Total fi nance working capital and long – term assets 65,079,023 55,552,788 57.26 42.77
Contingent liabilities (19) 4,148,948 4,148,919 3.65 3.19
-The accompanying notes from(1) to (25) form an integral part of these fi nancial statements.
- Auditor’s report attached. Mukesh Kriplani Aditya Shome Chairman Financial Manager
Sherin Noureldin R.A.A. 6809
Moore Stephens Egypt
Note - The exchange rate used to convert EGP to Rs. <8.799> / <EGP> (Rs. <7.700> / <EGP>) “The columns in INR are not part of the audited fi nancial statements and the audit opinion does not apply to them.”
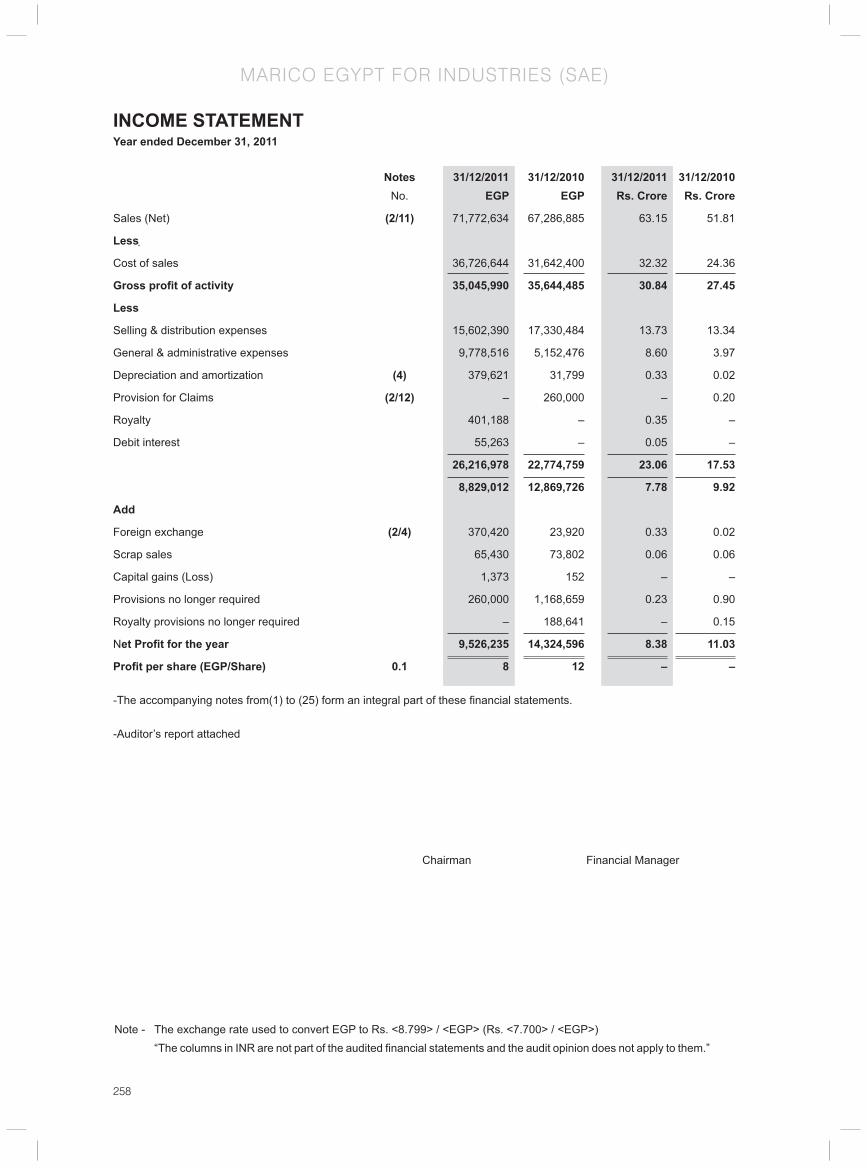
258
MARICO EGYPT FOR INDUSTRIES (SAE)
Notes 31/12/2011 31/12/2010 31/12/2011 31/12/2010 No. EGP EGP Rs. Crore Rs. Crore
Sales (Net) (2/11) 71,772,634 67,286,885 63.15 51.81
Less
Cost of sales 36,726,644 31,642,400 32.32 24.36
Gross profi t of activity 35,045,990 35,644,485 30.84 27.45
Less
Selling & distribution expenses 15,602,390 17,330,484 13.73 13.34
General & administrative expenses 9,778,516 5,152,476 8.60 3.97
Depreciation and amortization (4) 379,621 31,799 0.33 0.02
Provision for Claims (2/12) – 260,000 – 0.20
Royalty 401,188 – 0.35 –
Debit interest 55,263 – 0.05 –
26,216,978 22,774,759 23.06 17.53
8,829,012 12,869,726 7.78 9.92
Add
Foreign exchange (2/4) 370,420 23,920 0.33 0.02
Scrap sales 65,430 73,802 0.06 0.06
Capital gains (Loss) 1,373 152 – –
Provisions no longer required 260,000 1,168,659 0.23 0.90
Royalty provisions no longer required – 188,641 – 0.15
Net Profi t for the year 9,526,235 14,324,596 8.38 11.03
Profi t per share (EGP/Share) 0.1 8 12 – –
-The accompanying notes from(1) to (25) form an integral part of these fi nancial statements.
-Auditor’s report attached
INCOME STATEMENTYear ended December 31, 2011
Chairman Financial Manager
Note - The exchange rate used to convert EGP to Rs. <8.799> / <EGP> (Rs. <7.700> / <EGP>) “The columns in INR are not part of the audited fi nancial statements and the audit opinion does not apply to them.”
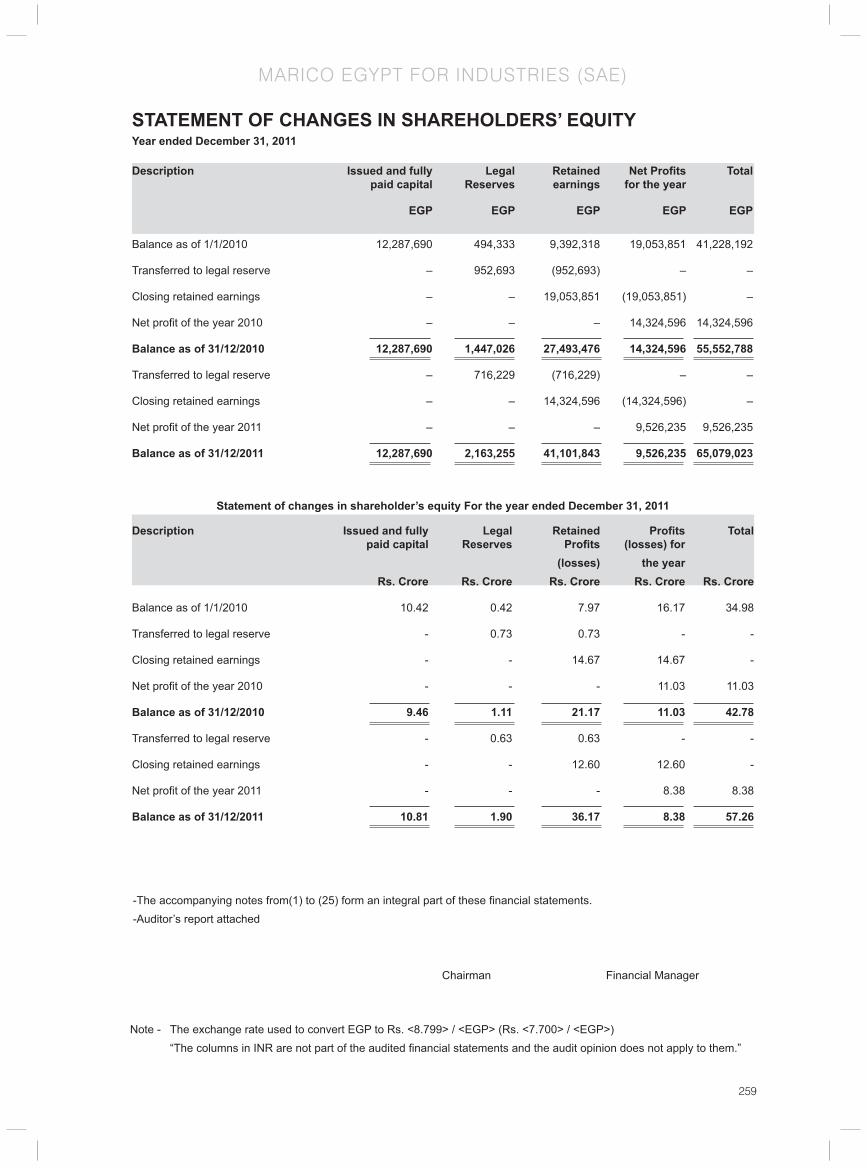
259
MARICO EGYPT FOR INDUSTRIES (SAE)
STATEMENT OF CHANGES IN SHAREHOLDERS’ EQUITYYear ended December 31, 2011
Description Issued and fully Legal Retained Net Profi ts Total paid capital Reserves earnings for the year
EGP EGP EGP EGP EGP
Balance as of 1/1/2010 12,287,690 494,333 9,392,318 19,053,851 41,228,192
Transferred to legal reserve – 952,693 (952,693) – –
Closing retained earnings – – 19,053,851 (19,053,851) –
Net profi t of the year 2010 – – – 14,324,596 14,324,596
Balance as of 31/12/2010 12,287,690 1,447,026 27,493,476 14,324,596 55,552,788
Transferred to legal reserve – 716,229 (716,229) – –
Closing retained earnings – – 14,324,596 (14,324,596) –
Net profi t of the year 2011 – – – 9,526,235 9,526,235
Balance as of 31/12/2011 12,287,690 2,163,255 41,101,843 9,526,235 65,079,023
Statement of changes in shareholder’s equity For the year ended December 31, 2011
Description Issued and fully Legal Retained Profi ts Total paid capital Reserves Profi ts (losses) for (losses) the year Rs. Crore Rs. Crore Rs. Crore Rs. Crore Rs. Crore
Balance as of 1/1/2010 10.42 0.42 7.97 16.17 34.98
Transferred to legal reserve - 0.73 0.73 - -
Closing retained earnings - - 14.67 14.67 -
Net profi t of the year 2010 - - - 11.03 11.03
Balance as of 31/12/2010 9.46 1.11 21.17 11.03 42.78
Transferred to legal reserve - 0.63 0.63 - -
Closing retained earnings - - 12.60 12.60 -
Net profi t of the year 2011 - - - 8.38 8.38
Balance as of 31/12/2011 10.81 1.90 36.17 8.38 57.26
Mukesh Kriplani Aditya Shome-The accompanying notes from(1) to (25) form an integral part of these fi nancial statements.-Auditor’s report attached
Chairman Financial Manager
Note - The exchange rate used to convert EGP to Rs. <8.799> / <EGP> (Rs. <7.700> / <EGP>) “The columns in INR are not part of the audited fi nancial statements and the audit opinion does not apply to them.”

260
MARICO EGYPT FOR INDUSTRIES (SAE)
Notes 31/12/2011 31/21/2010 31/12/2011 31/12/2010 No. EGP EGP Rs. Crore Rs. Crore
Cash fl ows from operating activities
Net profi t from income statement 9,526,235 14,324,596 8.38 11.03
Adjustments to reconcile net profi t withnone monetary items in income statement
Depreciation and amortization 1,260,900 485,008 1.11 0.37
Capital (gains) losses 1,373 152 – –
Created from inventory provision 750,000 – 0.66 –
Created from Provision for claims – 260,000 – 0.20
Provisions no longer required 1,660,000 687,801 1.46 0.53
used of provision for claims 159,292 – 0.14 –
Net profi t before change in working capital 9,716,470 14,381,955 8.55 11.07
(Increase) in inventory (Net) 1,407,950 1,204,296 1.24 0.93
Decrease (Increase) in receivables and notes receivables (Net) 3,328,281 5,860,004 2.93 4.51
(Increase) Decrease in suppliers advanced payments 968,536 831,575 0.85 0.64
Decrease (Increase) in debtors and other debit balances 4,020,681 3,760,760 3.54 2.90
(Increase) in due from related parties 10,771,018 6,335,545 9.48 4.88
Increase (Decrease) in due to related parties 112,830 806,756 0.10 0.62
Increase in payables & notes payable 3,012,502 2,651,759 2.65 2.04
Increase in creditors and other credit balances 1,685,108 3,184,178 1.48 2.45
Net cash provided from operating activities 8,728,368 3,082,106 7.68 2.37
Cash fl ows from investment activities
Received from Sale of Fixed assets 3,600 842 – –
(Payments) for Purchase of fi xed assets 9,178,660 1,227,356 8.08 0.95
(Payments) for projects in progress 57,200 1,030,165 0.05 0.79
Net cash (used in) investment activities 9,232,260 2,256,679 8.12 1.74
Net Cash resulting during the year 503,892 825,427 0.44 0.64
Cash and cash equivalent at the beginning of the year 12,169,788 11,344,361 10.71 8.74
Cash and cash equivalent at the end of the year (2/19,21) 11,665,896 12,169,788 11.15 9.38
-The accompanying notes from (1) to (25) form an integral part of these fi nancial statements.
-Auditor’s report attached
CASH FLOW STATEMENTYear ended December 31, 2011
Mukesh Kriplani Aditya Shome Chairman Financial Manager
Note - The exchange rate used to convert EGP to Rs. <8.799> / <EGP> (Rs. <7.700> / <EGP>) “The columns in INR are not part of the audited fi nancial statements and the audit opinion does not apply to them.”

261
MARICO EGYPT FOR INDUSTRIES (SAE)
(1) The Company :
The Company was incorporated as “Simple partnership” according to the law No 8 year 1997 of investment guarantees and it’s implementing regulations and was registered in the commercial register under No 79585 dated 26/2/1998 and issued tax card No 253/54/5 under the name Pyramids for Industries Company.
The articles was amended according to the decree of chairman of the general authority for investment and free zones No 161/P year 2006 approving the amendment of article No (5) according to the decision of the partners meeting which was held on 13/12/2006 and the adoption of the draft amendment dated 28/12/2006 which was ratifi ed in public notary offi ce on 9/1/2007 under ratifi cation No 15 year 2007 to change the name of the company to.Mel Co. for Consumer Care products & partners “Pyramids modern Industries (PMI) “General Partnership Co.”
According to the decision of chairman of general authority for investment and free zones No. 2/532 year 2011 and the contract to change the company from general partnership Co to joint – stock company according to the law No 8 year 1997 and change the name of the company to Marico Egypt For Industries SAE.
Purpose of the company
Manufacture all cosmetics and hair and skin care products also soap, toothpaste, hair shampoo and oil processed and hair dyes and the production of various cleaning materials, pesticides, disinfectants and varnish, all sorts of adhesives and packing the products mentioned.
(2) Signifi cant Accounting Policies
2-1- Upholding accounting standards and legal principles
The accompanying fi nancial statements have been prepared in accordance with Egyptian accounting standards and the related Egyptian laws and regulation in the light of the international fi nancial reporting standards to process cases weren’t stated in the Egyptian standards.
2-2- Basis preparation of the fi nancial statements
- The fi nancial statements have been prepared in Egyptian pounds.
- The fi nancial statements have been prepared according to historical cost and continuity presumption.
2-3- Change in accounting principles
The accounting principles comply with those adopted in the previous year.
2-4- Foreign currency transactions
The company maintains its books in Egyptian pounds. All transactions denominated in foreign currencies were translated into Egyptian pounds at the rate determined on the transaction date, on the balance sheet. The monetary current assets and liabilities are evaluated accordance the rates announced on that date and the differences are charged to income statement.
2-5- Fixed assets (Net)
Recognition and preliminary measurement
Buildings, constructions,infrastructures, machines and equipments are booked at historical cost less the accumulated depreciation and any impairment.
The cost include all direct cost for acquisition the assets also cost of getting of it and rearranging the site where assets were present.
NOTES TO THE FINANCIAL STATEMENTSNotes to the fi nancial Statements as of 31 December, 2011

262
MARICO EGYPT FOR INDUSTRIES (SAE)
NOTES TO THE FINANCIAL STATEMENTSFor the year ended 31 December, 2011
The Deprecation
Fixed assets are shown in the balance sheet at historical cost and according to estimated useful life of each asset in accordance with the following rates.
- Building 5% Straight line method
- Machinery 12.5% Declining method
- Equipments& Lab (S.O.E) 25% Declining method
- Computers& programs 50% Declining method
- Furniture and offi ces Equipments 25% Declining method
_ Vehicles 25% Declining method
2-6- Intangible assets
Recognition
Assets that have non-monetary nature which can be identifi ed and have no physical presence and acquired for the activity that expected future benefi ts as tangible assets. Intangible assets represent in the use of computer programs.
Preliminary measurement
Intangible assets are measured at the cost which is represented in monetary price at the date of acquisition, and it is included net after deduction of accumulated amortization and impairment losses in the value of assets.
Amortization
The value of Amortization charged to income statement in accordance with the straight line method over the estimated useful lives of intangible assets, if its useful lives are not defi nite. The impairment in the value of intangible assets is calculated at the date of balance sheet and amortized from the date available for use according to the following rates:
Description Estimated life Year
Computer programs (2)
2-7- Projects under Progress
Projects under progress are refl ected according to cost and include all direct expenses required to prepare the asset to be in a state of operation and for the purpose for which it was acquired. Projects under progress are recorded as fi xed assets once it is fi nished and it is available for the purpose it was acquired for. Projects under progress are valued at the date of the balance sheet according to its cost and deducting the impairment in its value if any.
2-8- Inventory (net)
Inventories are stated at the lower of cost and net realizable value. Cost is determined using the weighted average method. The cost of fi nished goods and work in progress comprises raw materials, direct labor and other direct costs. Net realizable value is the estimated selling price in the ordinary course of business, less applicable variable selling expenses. Provision is made for impairment.
2-9- Impairment in the Value of Non-Financial Assets
The book value of the Company’s non-fi nancial assets, other than inventory and deferred tax assets is reviewed at the date of each fi nancial position to ascertain the amount of impairment. The Company carries out a regular review to ascertain if there has been impairment in the value of an asset and in case that there is an indication of such impairment; the resale value is compared to the book value. If the book value is above the resale value, then
263
MARICO EGYPT FOR INDUSTRIES (SAE)
there is impairment in the value of the asset and the resale value is reduced and the loss is charged in the income statement. The amount of impairment may be returned in case that there is a change in the resale value to the extent that the amount was reduced in the past.
2-10- Impairment in the Value of Financial Assets
On the anniversary of each balance sheet, an objective estimate is carried out to ascertain if there is true indication that any of the assets have been impaired. Once there is a impairment in the value of an asset the loss is recorded only if there are objective proofs that the impairment of the value was due to an incident or more after the initial realization of the asset and that such incident or incidents had an affect that can be evaluated in a reliable manner for the expected future cash fl ow from the asset. In the case of fi nancial assets that are recorded according to their amortized cost impairment, the loss due to impairment of its value between the book value of such asset and the present value of the future cash fl ow that has been discounted by the original actual interest rate relating to this asset.
The book value of the fi nancial asset is reduced directly except in case of clients accounts that is reduced using provisions. Any amount that is not to be collected is to be written off from the provision and the amount of the realized loss will be reimbursed either directly or by settling the provisions account. It should be ensured that such reversal will not generate a book value for the asset which is higher than the amortized cost at the date of the writing off of the amount of impairment if such impairment has not been recognized. The amount of write off will be refl ected in the income statement.
2-11-Revenue Recognition
Revenue is recognized once the service has been carried out and invoice has been issued according to the accrual principle.
Regarding the revenues from dividends due on fi nancial notes and investments in subsidiary companies, this income is recognized once the general assembly has approved the distribution to its investors.
2-12-Provisions
A provision is recognized once the Company has a current legal or actual obligation due to a previous incident which is likely to require the use of economic sources to settle such obligation while preparing a valuation of the value of the obligation. The provisions are to be reviewed on the anniversary of the balance sheet and amended to refl ect the most accurate present valuation and in case that the present value of cash is of essence, then the amount recognized as provision is the present value of the expected expenses to settle the obligation.
2-13-Employees Benefi ts
- Social insurance & Pension Scheme
The Company contributes to the government social insurance system on behalf of the employees according to the social insurance law No. 79 year1975 and its amendments. The employees and the Company contribute according to this law with a fi xed percentage of their salary and the Company’s obligation is limited to its contribution. The Company’s contribution is refl ected in the income statement according to the accrual principle.
- Employee profi t share
According to its constitution, the Company distributes part of the profi ts dividends to the employees as per the recommendations stipulated by the Board of Directors and approved by the General Assembly. The employee share of profi t will be recognized as distribution of profi t in shareholder’s equity statement and as an obligation for the period that the Company’s shareholders approved such distribution.
2-14-Related parties transaction
All transactions with related parties are booked by the Company in the same manner as any other normal transaction with other parties.
NOTES TO THE FINANCIAL STATEMENTSFor the year ended 31 December, 2011

264
MARICO EGYPT FOR INDUSTRIES (SAE)
2-15-Accounting Estimates
According to Egyptian accounting standards the preparation of the fi nancial statement requires the management to make some approximations and predictions that affect the value of assets, obligations, in come and expenses during the fi nancial year. The actual amounts could be quite different from these predictions.
2-16-Expense
All expense, including administrative and general expenses, are to be refl ected in the income statement for the fi nancial period that such expenses were incurred according to accrual bases.
2-17-Legal Reserve
According to Law No. 159 year1981, its executive directives and the constitution of the Company, there should be a legal reserve of no less than 5% of the profi t of the Company and such reserve should not be increased once this reserve amount reaches 50% of the Company’s issued share capital.
2-18-Cash Flows Statement
The cash fl ow statement will be prepared according to the indirect method.
2-19-Cash and cash equivalent
For the purpose of the cash fl ows statement, cash and cash equivalents are to be considered cash on hand and at banks, short term fi xed deposits, cheques under collection and letters of guarantee cover, if any.
2-20-Profi t per share
Profi t per share is calculated by the weighted average method according to the number of common shares during the year after deducting the employees share and the board of directors’ allowance from the profi ts.
2-21-Income Tax
Income tax is calculated by using balance sheet liability method, on temporary differences arising between the tax bases of assets and liabilities and their carrying amounts in the fi nancial (accounting basis) by using the tax rate. Deferred income tax assets are recognized only to the extent that it is probable that future taxable profi t will be available against which the temporary differences can be utilized.
Deferred tax are charged as revenue or expenses to income statement with the exception of tax that results from the transaction in the same period or other period directly charged to equity.
2-22-Comparative fi gures
Comparative fi gures are reclassifi ed whenever it is necessary to amend the presentation used during the current period.
(3) Financial Instruments
Financial instruments are made up of any contractual agreement that gives the right to fi nancial assets of the company and creates a fi nancial or shareholding obligation to the other side of the contact.
3-1- Receivables (net)
Receivables are recognized initially at fair value and subsequently measured at amortized cost using the effective interest method, less provision for impairment. A provision for impairment of receivables is established when there is objective evidence that the Company will not be able to collect all amounts due according to the original terms of the receivables. Signifi cant fi nancial diffi culties of the debtor, probability that the debtor will enter bankruptcy or fi nancial reorganization, and default or delinquency in payments (more than granted credit limits) are considered indicators that the receivable is impaired. The amount of the provision is the difference between the asset’s carrying amount and the present value of the estimated future cash fl ows, discounted at the original effective interest rate used to determine the amortized cost. The carrying amount of the asset is reduced through the use of an allowance
NOTES TO THE FINANCIAL STATEMENTSFor the year ended 31 December, 2011
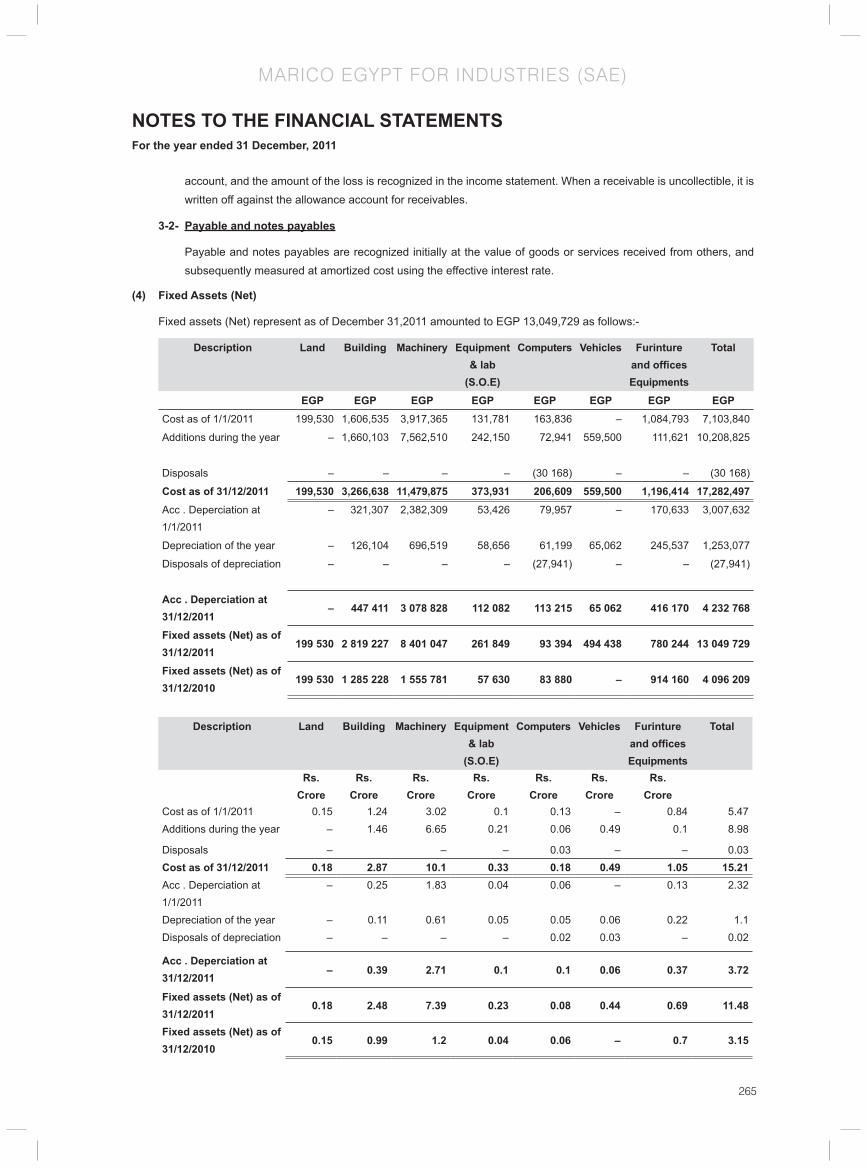
265
MARICO EGYPT FOR INDUSTRIES (SAE)
account, and the amount of the loss is recognized in the income statement. When a receivable is uncollectible, it is written off against the allowance account for receivables.
3-2- Payable and notes payables
Payable and notes payables are recognized initially at the value of goods or services received from others, and subsequently measured at amortized cost using the effective interest rate.
(4) Fixed Assets (Net)
Fixed assets (Net) represent as of December 31,2011 amounted to EGP 13,049,729 as follows:-
Description Land Building Machinery Equipment & lab
(S.O.E)
Computers Vehicles Furinture and offi ces Equipments
Total
EGP EGP EGP EGP EGP EGP EGP EGPCost as of 1/1/2011 199,530 1,606,535 3,917,365 131,781 163,836 – 1,084,793 7,103,840
Additions during the year – 1,660,103 7,562,510 242,150 72,941 559,500 111,621 10,208,825
Disposals – – – – (30 168) – – (30 168)
Cost as of 31/12/2011 199,530 3,266,638 11,479,875 373,931 206,609 559,500 1,196,414 17,282,497Acc . Deperciation at 1/1/2011
– 321,307 2,382,309 53,426 79,957 – 170,633 3,007,632
Depreciation of the year – 126,104 696,519 58,656 61,199 65,062 245,537 1,253,077
Disposals of depreciation – – – – (27,941) – – (27,941)
Acc . Deperciation at 31/12/2011
– 447 411 3 078 828 112 082 113 215 65 062 416 170 4 232 768
Fixed assets (Net) as of 31/12/2011
199 530 2 819 227 8 401 047 261 849 93 394 494 438 780 244 13 049 729
Fixed assets (Net) as of 31/12/2010
199 530 1 285 228 1 555 781 57 630 83 880 – 914 160 4 096 209
Description Land Building Machinery Equipment & lab
(S.O.E)
Computers Vehicles Furinture and offi ces Equipments
Total
Rs. Crore
Rs. Crore
Rs. Crore
Rs. Crore
Rs. Crore
Rs. Crore
Rs. Crore
Cost as of 1/1/2011 0.15 1.24 3.02 0.1 0.13 – 0.84 5.47Additions during the year – 1.46 6.65 0.21 0.06 0.49 0.1 8.98
Disposals – – – 0.03 – – 0.03Cost as of 31/12/2011 0.18 2.87 10.1 0.33 0.18 0.49 1.05 15.21Acc . Deperciation at 1/1/2011
– 0.25 1.83 0.04 0.06 – 0.13 2.32
Depreciation of the year – 0.11 0.61 0.05 0.05 0.06 0.22 1.1Disposals of depreciation – – – – 0.02 0.03 – 0.02
Acc . Deperciation at 31/12/2011
– 0.39 2.71 0.1 0.1 0.06 0.37 3.72
Fixed assets (Net) as of 31/12/2011
0.18 2.48 7.39 0.23 0.08 0.44 0.69 11.48
Fixed assets (Net) as of 31/12/2010
0.15 0.99 1.2 0.04 0.06 – 0.7 3.15
NOTES TO THE FINANCIAL STATEMENTSFor the year ended 31 December, 2011
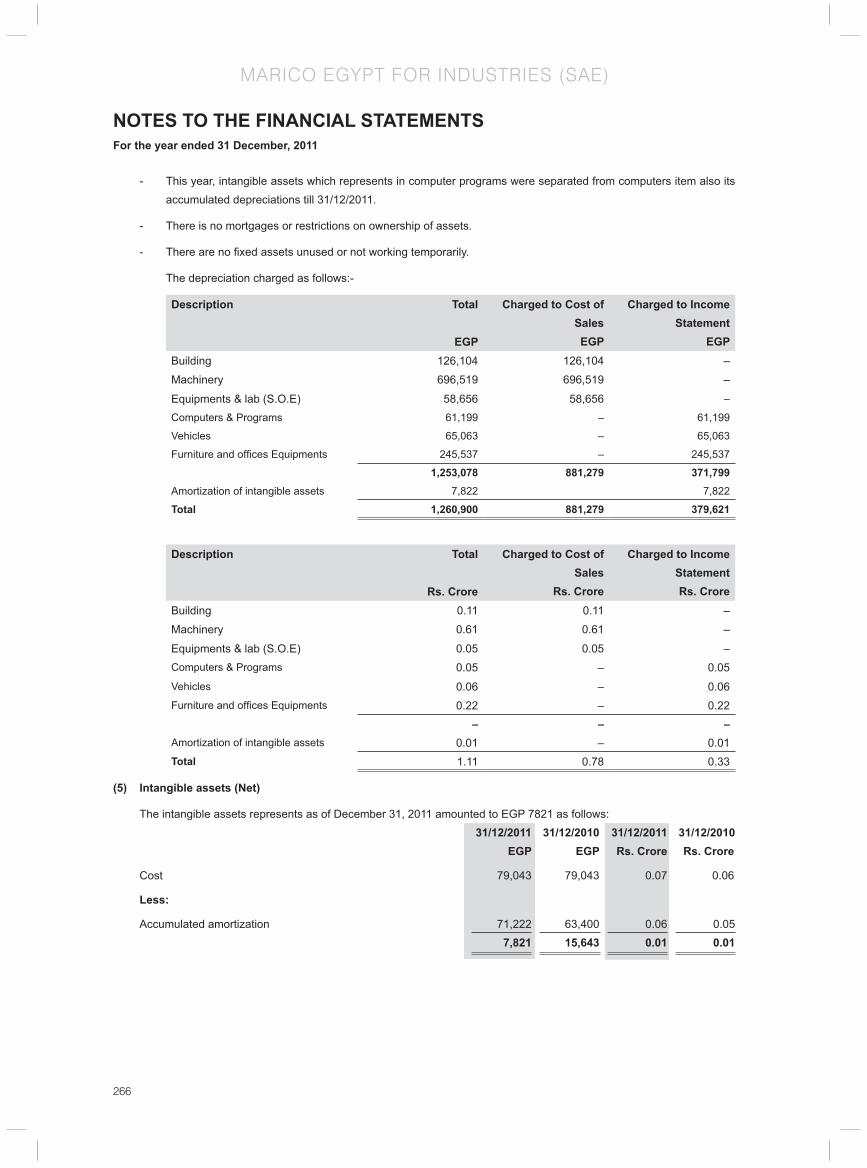
266
MARICO EGYPT FOR INDUSTRIES (SAE)
NOTES TO THE FINANCIAL STATEMENTSFor the year ended 31 December, 2011
- This year, intangible assets which represents in computer programs were separated from computers item also its accumulated depreciations till 31/12/2011.
- There is no mortgages or restrictions on ownership of assets.
- There are no fi xed assets unused or not working temporarily.
The depreciation charged as follows:-
Description Total
EGP
Charged to Cost of SalesEGP
Charged to Income Statement
EGPBuilding 126,104 126,104 –
Machinery 696,519 696,519 –
Equipments & lab (S.O.E) 58,656 58,656 –
Computers & Programs 61,199 – 61,199
Vehicles 65,063 – 65,063
Furniture and offi ces Equipments 245,537 – 245,537
1,253,078 881,279 371,799Amortization of intangible assets 7,822 7,822
Total 1,260,900 881,279 379,621
Description Total
Rs. Crore
Charged to Cost of Sales
Rs. Crore
Charged to Income StatementRs. Crore
Building 0.11 0.11 –
Machinery 0.61 0.61 –
Equipments & lab (S.O.E) 0.05 0.05 – Computers & Programs 0.05 – 0.05 Vehicles 0.06 – 0.06 Furniture and offi ces Equipments 0.22 – 0.22
– – –Amortization of intangible assets 0.01 – 0.01 Total 1.11 0.78 0.33
(5) Intangible assets (Net)
The intangible assets represents as of December 31, 2011 amounted to EGP 7821 as follows: 31/12/2011 31/12/2010 31/12/2011 31/12/2010 EGP EGP Rs. Crore Rs. Crore
Cost 79,043 79,043 0.07 0.06
Less:
Accumulated amortization 71,222 63,400 0.06 0.05 7,821 15,643 0.01 0.01

267
MARICO EGYPT FOR INDUSTRIES (SAE)
(6) Projects in progress
Projects in progress represents as of December 31, 2011 amounted to EGP 57200 as follows:
31/12/2011 31/12/2010 31/12/2011 31/12/2010 EGP EGP Rs. Crore Rs. Crore
Building – 1,023,665 – 0.7
Machinery – 6,500 – 0.01
Equipments & lab (S.O.E) 57,200 – 0.05 –
* This balance represents in pumps of sea desalination for the Factory at Al Salhiya (New City) and has not been completed yet.
(7) Inventory The inventory represents as of December 31, 2011 amounted to EGP 6,991,702 as follows:
31/12/2011 31/12/2010 31/12/2011 31/12/2010 EGP EGP Rs. Crore Rs. Crore
Raw materials 3,500,241 3,275,519 3.08 2.52
Production under operating 46,190 62,433 0.04 0.05
Packing & Packaging materials 3,561,407 2,061,759 3.13 1.59
Finished production 449,783 934,041 0.40 0.72
7,557,621 6,333,752 6.65 4.88
Letter of credit (7/1) 184,081 – 0.16 –
7,741,702 6,333,752 6.81 4.88
Provision for damaged inventory 750,000 – 0.66 –
6,991,702 6,333,752 6.15 4.88
(7/1) This year was formed provision to face expiry date of inventory items.
(8) Receivables and Notes receivable (Net)
Receivables and notes receivable represents as of December 31, 2011 amounted to EGP 16,682,043 as follows:
31/12/2011 31/12/2010 31/12/2011 31/12/2010 EGP EGP Rs. Crore Rs. Crore
Local Receivables 15,502,947 19,234,628 13.64 14.81
Less:
Bad debit provision 9,703 9,703 0.01 0.01
15,493,244 19,224,925 13.63 14.80
Export Receivables 181,860 785,399 0.16 0.60
15,675,104 20,010,324 13.79 15.40
Notes Receivable (8/1) 1,006,939 – 0.89 16,682,043 20,010,324 14.68 15.40
NOTES TO THE FINANCIAL STATEMENTSFor the year ended 31 December, 2011

268
MARICO EGYPT FOR INDUSTRIES (SAE)
NOTES TO THE FINANCIAL STATEMENTSFor the year ended 31 December, 2011
(8/1) Notes receivable deposited in bank for collection, but has been shown under this item to confi rm with (IAS) No. (4) Paragraph (6, 5) because its not considered from cash equivalents.
(9) Debtors and other debit balances
Debtors and other debit balances represents as of December 31, 2011 amounted to EGP 484,318 as follows:
31/12/2011 31/12/2010 31/12/2011 31/12/2010
EGP EGP Rs. Crore Rs. Crore
Prepaid expenses 220,935 168,549 0.19 0.13
Employees loans 132,670 – 0.12 –
Deposits with others 129,029 116,490 0.11 0.09
Debtors purchase of fi xed assets – 1,905,903 – 1.47
L/C Cover – 1,674,084 – 1.29
Sales tax authority – 618,220 – 0.48
Employee’s custody – 16,807 – 0.01
Worker’s emergency box – 3,000 – – Other debit balances 1,684 1,946 – –
484,318 4,504,999 0.42 3.47
(10) Related Parties
Related parties represents as of December 31, 2011 amounted to EGP 36,859,037 as follows:
31/12/2011 31/12/2010 31/12/2011 31/12/2010 EGP EGP Rs. Crore Rs. Crore
MEL company for consumer care 36,854,146 26,048,708 32.43 20.06
Marico Middle East 4,891 39,311 – 0.03
36,859,037 26,088,019 32.43 20.09
(11) Cash and cash at Banks
Cash and cash equivalent represents as of December 31, 2011 amounted to EGP 14,788,785 as follows:
31/12/2011 31/12/2010 31/12/2011 31/12/2010
EGP EGP Rs. Crore Rs. Crore
Cash on hand – 143 – –
Banks current accounts – local currency 195,580 526,791 0.17 0.41
Banks current accounts – foreign currency 181,995 17,649 0.16 0.01
Deposits 1,762,424 – 1.55 –
Cheques under collection 12,648,786 13,270,872 11.13 10.22
14,788,785 13,815,455 13.01 10.64

269
MARICO EGYPT FOR INDUSTRIES (SAE)
(12) Provisions Provision represents as of December 31, 2011 amounted to EGP 102,769 as follows:
31/12/2011 31/12/2010 31/12/2011 31/12/2010 EGP EGP Rs. Crore Rs. Crore Balance as of 1/1/2011 1,922,061 2,349,862 1.69 1.81
Less:
Provision no longer required 1,660,000 687,801 1.46 0.53
Uesd of provision during the year 159,292 – 0.14 –
102,769 1,662,061 0.09 1.28
Add: Formed during year – 260,000 – 0.20
Balance as of 31/12/2011 102,769 1,922,061 0.09 1.48
This item is made up as follows:-
Claims provision – 1,819,292 – 1.40
Tax provision 102,769 102,769 0.09 0.08
102,769 1,922,061 0.09 1.48
(13) Banks overdraft Bank overdraft represents as of December 31, 2011 amounted to EGP 3122889 as follows:
31/12/2011 31/12/2010 31/12/2011 31/12/2010 EGP EGP Rs. Crore Rs. Crore
NSGB bank 3,122,889 1,645,667 2.75 1.27
3,122,889 1,645,667 2.75 1.27
(14) Related Parties Related parties represents as of December 31, 2011 amounted to EGP 359,141 as follows:
31/12/2011 31/12/2010 31/12/2011 31/12/2010 EGP EGP Rs. Crore Rs. Crore
Marico India company 359,141 246,311 0.32 0.19
359,141 246,311 0.32 0.19
(15) Payables and notes payable Payables and notes payable represents as of December 31, 2011 amounted to EGP 11 567 500 as follows: 31/12/2011 31/12/2010 31/12/2011 31/12/2010 EGP EGP Rs. Crore Rs. Crore
Payables 6,125,391 5,623,170 5.39 4.33
Notes payable 5,442,109 2,931,828 4.79 2.26
11,567,500 8,554,998 10.18 6.59
NOTES TO THE FINANCIAL STATEMENTSFor the year ended 31 December, 2011

270
MARICO EGYPT FOR INDUSTRIES (SAE)
(16) Creditors and other credit balances
Creditors and other credit balances represents as of December 31, 2011 amounted to EGP 10 060 504 as follows:
31/12/2011 31/12/2010 31/12/2011 31/12/2010 EGP EGP Rs. Crore Rs. Crore
Creditors of Advertising campaigns 5,092,000 – 4.48 –
Accrued expenses 1,427,366 3,468,535 1.26 2.67
Sales tax authority 2,501,958 3,282,858 2.2 2.53
Salaries & bonuses of foreign 508,042 768,960 0.45 0.59
Stamp duty tax 375,434 386,907 0.33 0.3
Withholding tax 52,520 278,974 0.05 0.21
Salaries & wages tax 80,505 172,522 0.07 0.13
Social insurance 22,679 13,662 0.02 0.01
Other credit balances – 2,978 – –
10,060,504 8,375,396 8.86 6.44
(17) Capital
The company’s authorized capital is EG.P 20 000 000 (Twenty million Egyptian pounds) and the issued capital is EG.P 12287690 (Twelve million two hundred eighty seven thousand and six hundred ninety Egyptian pounds) distributed into 1228769 shares, the per value of each share is EGP 10 distributed among the shareholders as follows:-
Name Nationality Amount of Share
Share EGP Rs. Crore
Rs.Crore
MEL CO. for Consumer Care Products SAE (according to law No159/1981) represented by Mr/ Ravinmody
SAE 1,216,481 12,164,810 1.07 10.70
Mr. Aditya Kumar Indian 6,144 61,440 0.01 0.05
Mr. Ravin Mody Indian 6,144 61,440 0.01 0.05
Total 1,228,769 12,287,690 1.08 0.81
(18) Legal reserves :-
We calculate 5% from retained profi ts which amounted EGP 14,324,596 and this according to article No (41) from law No 159 year 1981 and it’s amendments and also according to article No (55) from Company articles and it’s amounted EGP 716,229.
(19) Contingent Liabilities
This item is made up as follows :– L/C L/C L/C L/C L/C L/C Value Cover Non Cover Value Cover Non Cover EGP EGP EGP Rs. Crore Rs. Crore Rs. Crore
L/C - Raw material 4,333,029 184,081 4,148,948 3.81 0.16 3.65
4,333,029 184,081 4,148,948 3.81 0.16 3.65
NOTES TO THE FINANCIAL STATEMENTSFor the year ended 31 December, 2011

271
MARICO EGYPT FOR INDUSTRIES (SAE)
(20) Profi t per share
Profi t per share is determined as follows:- 31/12/2011 31/12/2010 31/12/2011 31/12/2010 EGP EGP Rs. Crore Rs. Crore
Net profi t for the year 9,526,235 14,324,596 8.38 11.03
Amount of Share 1,228,769 1,228,769 1.08 0.95
Profi t Per Share 7.75 11.66 – –
(21) Cash and Cash equivalent (for the purpose of preparing Statement of cash fl ows)
Notes No. 31/12/2011 31/12/2010 31/12/2011 31/12/2010 EGP EGP Rs. Crore Rs. Crore
Cash and Cash Equivalent (11) 14,788,785 13,815,455 13.01 10.64 Less:
Bank Overdraft (13) 3,122,889 1,645,667 2.75 1.27 11,665,896 12,169,788 10.26 9.37
(22) Transactions with related parties
This item is made up as follows:--
Name of Related Party Description of Relationship
Nature of Transaction Amount
Marico Middle East Affi liated companies Financing 627,730
Marico Limited India Affi liated companies Sales 207,752
Marico Limited India Affi liated companies Royalty 401,188
(23) Taxation:
First: Corporate tax
- The company is exempted from 1/1/2007 till 31/12/2016 according to the company tax card.
- The company is not scrutinized the company books from the activity opening till now.
Second: Sales tax
The company’s books were examined till December 31, 2010, there was tax difference was fully paid.
Third: Salary and wages tax
The company’s books were examined till December 31, 2010 and tax was fully paid.
Fourth: Stamp tax
The company is not scrutinized the company books from the activity opening till now.
Fifth: Withholding tax
The company is examined even the period ending 31/12/2009 and these values are all paid.
(24) Financial Instruments Risk Management
24-1- Fair value fi nancial instruments:
The company’s fi nancial instruments are represented in cash on hand & at bank, clients and creditors. The fair value of the fi nancial instruments does not materially differ from its book value at year end.
NOTES TO THE FINANCIAL STATEMENTSFor the year ended 31 December, 2011
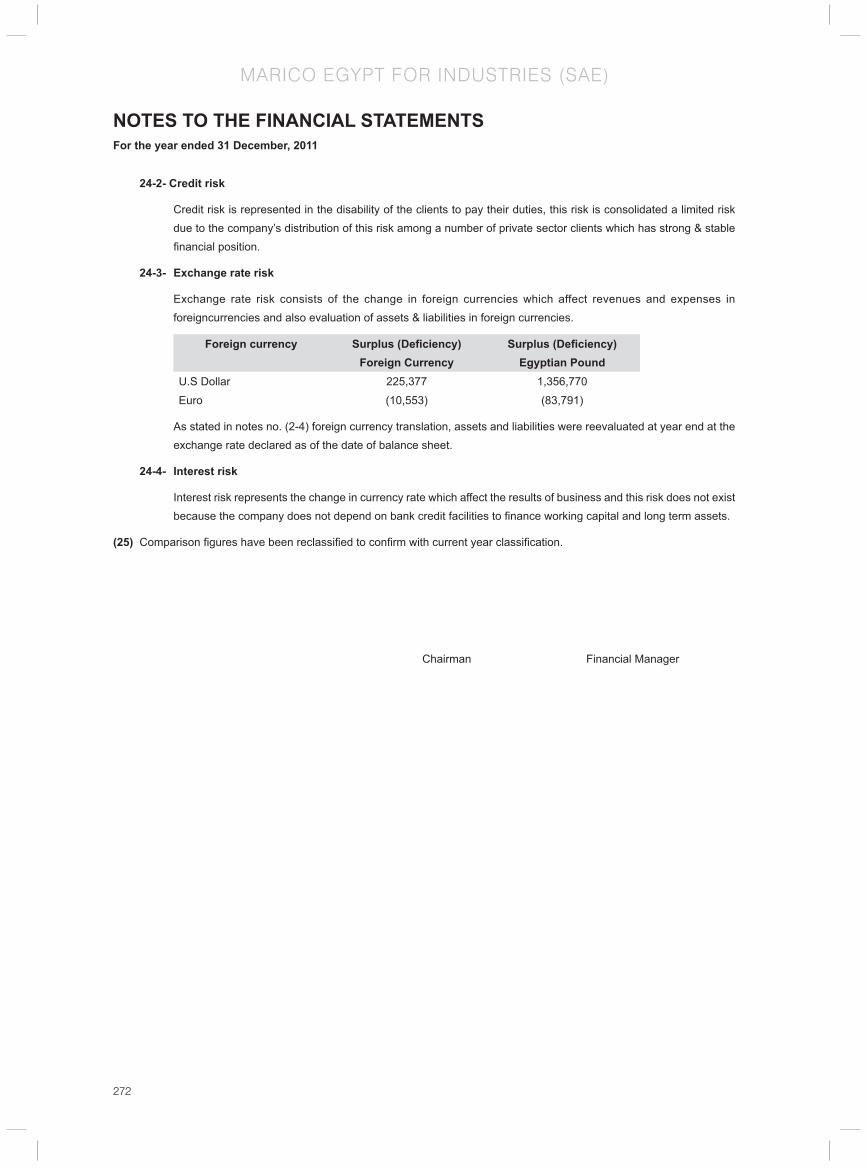
272
MARICO EGYPT FOR INDUSTRIES (SAE)
24-2- Credit risk
Credit risk is represented in the disability of the clients to pay their duties, this risk is consolidated a limited risk due to the company’s distribution of this risk among a number of private sector clients which has strong & stable fi nancial position.
24-3- Exchange rate risk
Exchange rate risk consists of the change in foreign currencies which affect revenues and expenses in foreigncurrencies and also evaluation of assets & liabilities in foreign currencies.
Foreign currency Surplus (Defi ciency) Foreign Currency
Surplus (Defi ciency) Egyptian Pound
U.S Dollar 225,377 1,356,770
Euro (10,553) (83,791)
As stated in notes no. (2-4) foreign currency translation, assets and liabilities were reevaluated at year end at the exchange rate declared as of the date of balance sheet.
24-4- Interest risk
Interest risk represents the change in currency rate which affect the results of business and this risk does not exist because the company does not depend on bank credit facilities to fi nance working capital and long term assets.
(25) Comparison fi gures have been reclassifi ed to confi rm with current year classifi cation.
Mukesh Kriplani Aditya Shome Chairman Financial Manager
NOTES TO THE FINANCIAL STATEMENTSFor the year ended 31 December, 2011

273
MARICO SOUTH AFRICA CONSUMER CARE
(PROPRIETARY) L IMITED
Board of Directors Harsh Mariwala
Milind Sarwate
Vijay Subramaniam
Padmanabh Maydeo
John Richard Mason
Registered Office 1474 South Coast Road, Modeni 4052
Factory 1474 South Coast Road, Modeni 4052
Auditors Price Waterhouse Cooper
Bankers Standard Bank of South Africa Limited
Legal Advisors Adams & Adams - Patent and Trademark Attomeys
Deneyz Reltz - Commercial Attomey
Shepstone & Wylie - Litigation Attomeys
KPMG - Seceretarial Services

274
MARICO SOUTH AFRICA CONSUMER CARE
(PROPRIETARY) L IMITED
STATEMENT OF DIRECTORS’ RESPONSIBILITYfor the year ended 31 March 2012
The directors are responsible for the preparation, integrity and fair presentation of the financial statements of Marico South Africa
Consumer Care Proprietary Limited. The financial statements have been prepared in accordance with the International Financial
Reporting Standards (I FRS) and in a manner required by the Companies Act of South Africa, and include amounts based on
judgements and estimates made by management.
The directors consider that in preparing the financial statements they have used the most appropriate accounting policies,
consistently applied and supported by reasonable and prudent judgements and estimates, and that all statements of IFRS that they
consider to be applicable have been followed. The directors are satisfied that the information contained in the financial statements
fairly presents the results of operations for the year and the financial position of the group at year end.
The directors have the responsibility of ensuring that accounting records are kept. The accounting records should disclose with
reasonable accuracy the financial position of the group to enable the directors to ensure that the financial statements comply with
the relevant legislation.
Marico South Africa Consumer Care Proprietary Limited operated in an established control environment, which is documented and
reviewed. This incorporates risk management and internal control procedures, which are designed to provide reasonable, but not
absolute, assurance that assets are safeguarded and the risks facing the business are being controlled.
The going concern basis has been adopted in preparing the financial statements. The directors have no reason to believe that the
company will not be a going concern in the foreseeable future. The company’s external auditors, PricewaterhouseCoopers Inc,
audited the financial statements and their report is presented hereinafter.
The financial statements were approved by the board of directors and are signed on their behalf.
John Richard Mason Vijay Subramaniam
Director Director
8 June 2012
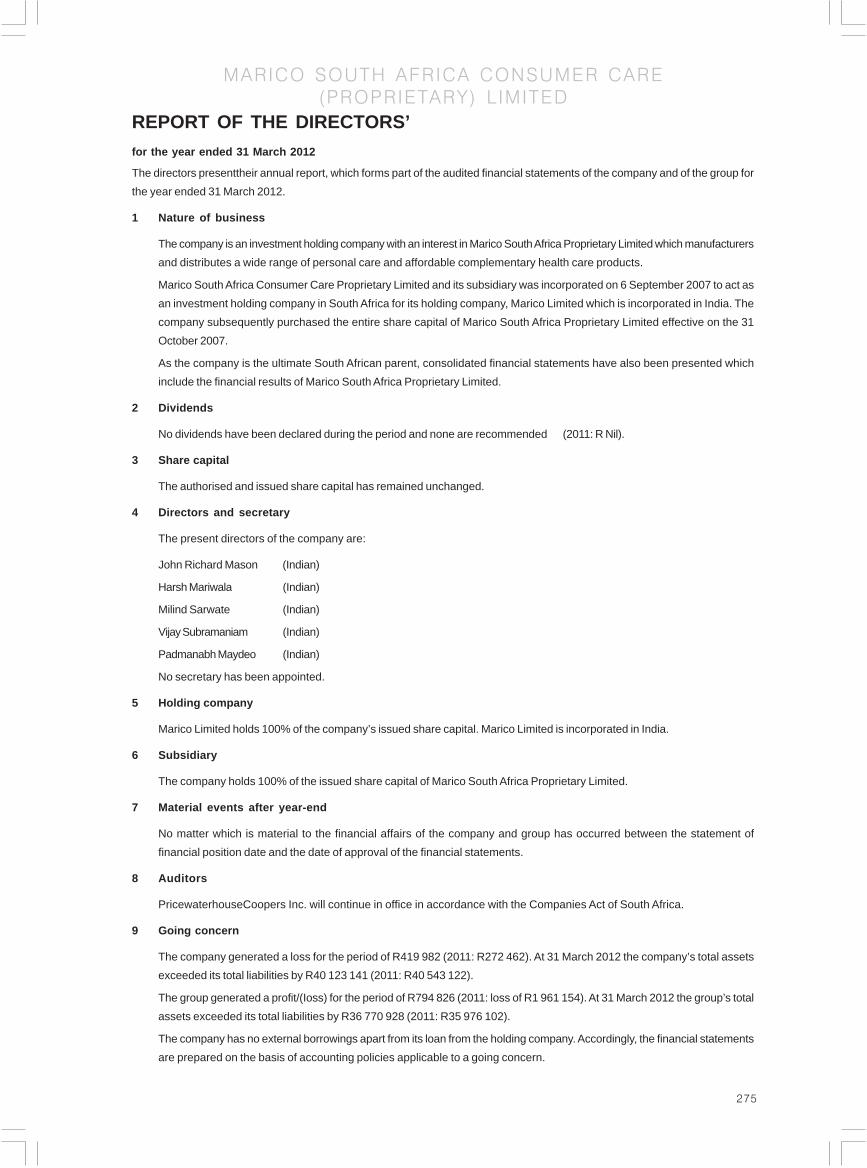
275
MARICO SOUTH AFRICA CONSUMER CARE
(PROPRIETARY) L IMITED
The directors presenttheir annual report, which forms part of the audited financial statements of the company and of the group for
the year ended 31 March 2012.
1 Nature of business
The company is an investment holding company with an interest in Marico South Africa Proprietary Limited which manufacturers
and distributes a wide range of personal care and affordable complementary health care products.
Marico South Africa Consumer Care Proprietary Limited and its subsidiary was incorporated on 6 September 2007 to act as
an investment holding company in South Africa for its holding company, Marico Limited which is incorporated in India. The
company subsequently purchased the entire share capital of Marico South Africa Proprietary Limited effective on the 31
October 2007.
As the company is the ultimate South African parent, consolidated financial statements have also been presented which
include the financial results of Marico South Africa Proprietary Limited.
2 Dividends
No dividends have been declared during the period and none are recommended (2011: R Nil).
3 Share capital
The authorised and issued share capital has remained unchanged.
4 Directors and secretary
The present directors of the company are:
John Richard Mason (Indian)
Harsh Mariwala (Indian)
Milind Sarwate (Indian)
Vijay Subramaniam (Indian)
Padmanabh Maydeo (Indian)
No secretary has been appointed.
5 Holding company
Marico Limited holds 100% of the company’s issued share capital. Marico Limited is incorporated in India.
6 Subsidiary
The company holds 100% of the issued share capital of Marico South Africa Proprietary Limited.
7 Material events after year-end
No matter which is material to the financial affairs of the company and group has occurred between the statement of
financial position date and the date of approval of the financial statements.
8 Auditors
PricewaterhouseCoopers Inc. will continue in office in accordance with the Companies Act of South Africa.
9 Going concern
The company generated a loss for the period of R419 982 (2011: R272 462). At 31 March 2012 the company’s total assets
exceeded its total liabilities by R40 123 141 (2011: R40 543 122).
The group generated a profit/(Ioss) for the period of R794 826 (2011: loss of R1 961 154). At 31 March 2012 the group’s total
assets exceeded its total liabilities by R36 770 928 (2011: R35 976 102).
The company has no external borrowings apart from its loan from the holding company. Accordingly, the financial statements
are prepared on the basis of accounting policies applicable to a going concern.
REPORT OF THE DIRECTORS’for the year ended 31 March 2012
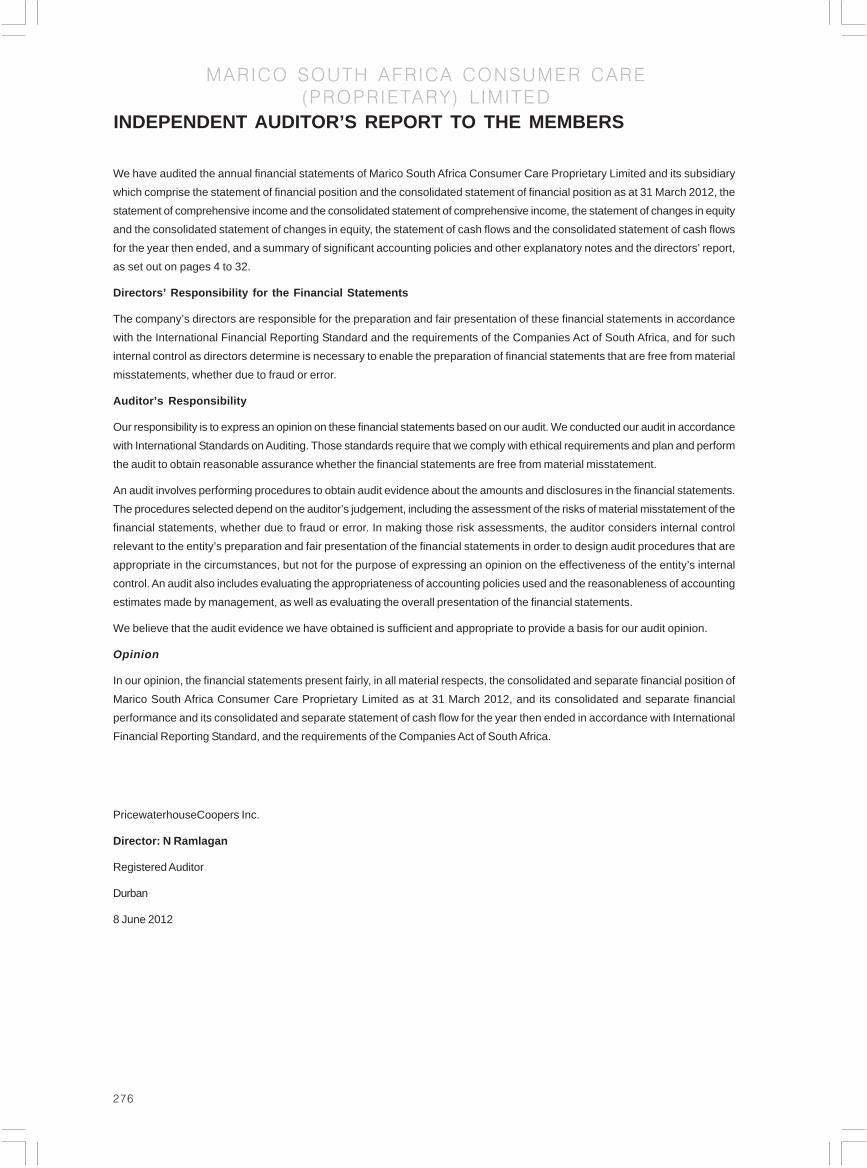
276
MARICO SOUTH AFRICA CONSUMER CARE
(PROPRIETARY) L IMITED
INDEPENDENT AUDITOR’S REPORT TO THE MEMBERS
We have audited the annual financial statements of Marico South Africa Consumer Care Proprietary Limited and its subsidiary
which comprise the statement of financial position and the consolidated statement of financial position as at 31 March 2012, the
statement of comprehensive income and the consolidated statement of comprehensive income, the statement of changes in equity
and the consolidated statement of changes in equity, the statement of cash flows and the consolidated statement of cash flows
for the year then ended, and a summary of significant accounting policies and other explanatory notes and the directors’ report,
as set out on pages 4 to 32.
Directors’ Responsibility for the Financial Statements
The company’s directors are responsible for the preparation and fair presentation of these financial statements in accordance
with the International Financial Reporting Standard and the requirements of the Companies Act of South Africa, and for such
internal control as directors determine is necessary to enable the preparation of financial statements that are free from material
misstatements, whether due to fraud or error.
Auditor’s Responsibility
Our responsibility is to express an opinion on these financial statements based on our audit. We conducted our audit in accordance
with International Standards on Auditing. Those standards require that we comply with ethical requirements and plan and perform
the audit to obtain reasonable assurance whether the financial statements are free from material misstatement.
An audit involves performing procedures to obtain audit evidence about the amounts and disclosures in the financial statements.
The procedures selected depend on the auditor’s judgement, including the assessment of the risks of material misstatement of the
financial statements, whether due to fraud or error. In making those risk assessments, the auditor considers internal control
relevant to the entity’s preparation and fair presentation of the financial statements in order to design audit procedures that are
appropriate in the circumstances, but not for the purpose of expressing an opinion on the effectiveness of the entity’s internal
control. An audit also includes evaluating the appropriateness of accounting policies used and the reasonableness of accounting
estimates made by management, as well as evaluating the overall presentation of the financial statements.
We believe that the audit evidence we have obtained is sufficient and appropriate to provide a basis for our audit opinion.
Opinion
In our opinion, the financial statements present fairly, in all material respects, the consolidated and separate financial position of
Marico South Africa Consumer Care Proprietary Limited as at 31 March 2012, and its consolidated and separate financial
performance and its consolidated and separate statement of cash flow for the year then ended in accordance with International
Financial Reporting Standard, and the requirements of the Companies Act of South Africa.
PricewaterhouseCoopers Inc.
Director: N Ramlagan
Registered Auditor
Durban
8 June 2012

277
MARICO SOUTH AFRICA CONSUMER CARE
(PROPRIETARY) L IMITED
Group Company Group Company
2012 2011 2012 2011 2012 2011 2012 2011
Notes R R R R Rs.in Rs. in Rs. in Rs. in
Crore Crore Crore Crore
ASSETS
Non-current assets
Property, plant and equipment 6 3,746,295 4,146,333 – – 2.49 2.73 – –
Intangible assets 7 48,062,924 49,330,489 – – 31.88 32.47 – –
Investment in subsidiary 8 – – 45,485,555 45,485,555 – – 30.18 29.94
Deferred income tax assets 13 7,077,135 7,692,781 – – 4.69 5.06 – –
Goodwill 14 37,686,823 37,686,823 – – 25.00 24.81 – –
Amount due from related party 17 – – 55,688,008 55,746,678 – – 36.94 36.69
96,573,177 98,856,426 101,173,563 101,232,233 64.07 65.07 67.12 66.63
Current assets
Trade and other receivables 10 23,109,432 24,739,259 – – 15.33 16.28 – –
Inventories 9 17,591,204 18,103,578 – – 11.67 11.92 – –
Cash and cash equivalents 11 4,961,765 3,959,328 195,577 287,715 3.29 2.61 0.13 0.19
Amounts due from related party 17 – (22,492,444) 20,355,507 – – 14.92 13.40 –
45,662,401 46,802,165 22,688,021 20,643,222 30.29 30.81 15.05 13.59
Total assets 142,235,578 145,658,591 123,861,584 121,875,455 94.36 95.87 82.17 80.22
EQUITY
Capital and reserves attributable to equity
holders of the company
Share capital 12 800 800 800 800 – – – –
Share premium 43,799,900 43,799,900 43,799,900 43,799,900 29.06 28.83 29.06 28.83
Accumulated loss (7,029,772) (7,824,598) (3,677,559) (3,257,578) (4.66) (5.15) (2.44) (2.14)
Total equity 36,770,928 35,976,102 40,123,141 40,543,122 24.39 23.68 26.62 26.69
LIABILITIES
Non-current liabilities
Borrowings 16 61,225,999 60,956,826 61,225,999 60,956,826 40.62 40.12 40.62 40.12
Current liabilities
Trade and other payables 15 21,746,207 28,370,156 20,000 20,000 14.43 18.67 0.01 0.01
Borrowings 16 22,492,444 20,355,507 22,492,444 20,355,507 14.92 13.40 14.92 13.40
44,238,651 48,725,663 22,512,444 20,375,507 29.35 32.07 14.93 13.41
Total liabilities 105,464,650 109,682,489 83,738,443 81,332,333 69.97 72.19 55.55 53.53
Total equity and liabilities 142,235,578 145,658,591 123,861,584 121,875,455 94.36 95.87 82.17 80.22
STATEMENT OF FINANCIAL POSITION AS AT 31 MARCH 2012
Note- The exchange rate used to convert ZAR to Rs. <6.634> / <ZAR> (Rs. <6.582> / <ZAR>)
“The columns in INR are not part of the audited financial statements and the audit opinion does not apply to them.”

278
MARICO SOUTH AFRICA CONSUMER CARE
(PROPRIETARY) L IMITED
STATEMENT OF COMPREHENSIVE INCOMEfor the year ended 31 March 2012
Group Company Group Company
2012 2011 2012 2011 2012 2011 2012 2011
Notes R R R R Rs.in Rs. in Rs. in Rs. in
Crore Crore Crore Crore
Revenue 157,263,448 137,813,935 – – 104.33 90.71 – –
Cost of sales (88,938,105) (70,652,366) – – (59.00) (46.50) – –
Gross profit 68,325,343 67,161,569 – – 45.33 44.21 – –
Operating expenses (60,883,528) (63,401,194) (3,945) (4,959) (40.39) (41.73) – –
Other income 146,321.00 308,454 – – 0.10 0.20 – –
Operating profit/(Ioss) 7,588,136 4,068,829 3,945 4,959 5.03 2.68 – –
Finance income 4 83,900 182,085 5,845,527 5,659,548 0.06 0.12 3.88 3.73
Finance costs 4 (6,261,564) (5,927,051) (6,261,564) (5,927,051) (4.15) (3.90) (4.15) (3.90)
Profit/(Ioss) before income tax 1,410,472 (1,676,137) (419,982) (272,462) 0.94 (1.10) (0.28) (0.18)
Income tax expense 5 (615,646) (285,017) – – (0.41) (0.19) – –
Total comprehensive profit/(Ioss)for the year 794,826 (1,961,154) (419,982) (272,462) 0.53 (1.29) (0.28) (0.18)
Note- The exchange rate used to convert ZAR to Rs. <6.634> / <ZAR> (Rs. <6.582> / <ZAR>)
“The columns in INR are not part of the audited financial statements and the audit opinion does not apply to them.”

279
MARICO SOUTH AFRICA CONSUMER CARE
(PROPRIETARY) L IMITED
STATEMENT OF CHANGES IN EQUITYfor the year ended 31 March 2012
Share Share Accumulated Total Share Share Accumulated Total
capital premium loss capital premium loss
R R R R Rs.in Rs.in Rs.in Rs.in
Crore Crore Crore Crore
Group
Year ended 31 March 2012
Balance at 1 April 2011 800 43,799,900 (7,824,598) 35,976,102 – 29.06 (5.19) 23.87
Total comprehensive profit for the year _ – 794,826 794,826 – – 0.53 0.53
Balance at 31 March 2012 800 43,799,900 (7,029,772) 36,770,928 – 29.06 (4.66) 24.39
Year ended 31 March 2011
Balance at 1 April 2010 800 43,799,900 (5,863,444) 37,937,256 – 29.06 (3.89) 25.17
Total comprehensive loss for the year _ – (1,961,154) 1,961,154 – – (1.30) 1.30
Balance at 31 March 2011 800 43,799,900 (7,824,598) 35,976,102 – 29.06 (5.19) 23.87
Company
Year ended 31 March 2012
Balance at 1 April 2011 800 43,799,900 (3,257,578) 40,543,122 – 29.06 (2.16) 26.90
Total comprehensive loss for the year _ – (419,982) (419,982) – – (0.28) (0.28)
Balance at 31 March 2012 800 43,799,900 (3,677,559) 40,123,141 – 29.06 (2.44) 26.62
Year ended 31 March 2011
Balance at 1 April 2010 800 43,799,900 (2,985,116) 40,815,584 – 29.06 (1.98) 27.08
Total comprehensive loss for the year _ – (272,461) (272,461) – – (0.18) (0.18)
Balance at 31 March 2011 800 43,799,900 (3,257,578) 40,543,122 – 29.06 (2.16) 26.90
Note- The exchange rate used to convert ZAR to Rs. <6.634> / <ZAR> (Rs. <6.582> / <ZAR>)
“The columns in INR are not part of the audited financial statements and the audit opinion does not apply to them.”

280
MARICO SOUTH AFRICA CONSUMER CARE
(PROPRIETARY) L IMITED
STATEMENT OF CASH FLOWSfor the year ended 31 March 2012
Group Company Group Company
2012 2011 2012 2011 2012 2011 2012 2011
Notes R R R R Rs.in Rs. in Rs. in Rs. in
Crore Crore Crore Crore
Cash flow from operating activities
Cash flow from operations 19 4,509,077 1,889,917 (3,945) (4,959) 2.99 1.24 – –
Finance costs 4 (6,261,564) (5,927,051) (6,261,564) (5,927,051) (4.15) (3.90) (4.15) (3.90)
Finance income 4 83,900 182,085 5,845,527 5,659,548 0.06 0.12 3.88 3.73
Net cash used in operating activities (1,668,587) (3,855,049) (419,982) (272,462) (1.11) (2.54) (0.28) (0.18)
Cash flow from investing activities
Increase in loans to related party – – (2,078,266) (20,249,764) – – (1.38) (13.33)
Additions to property, plant and equipment (737,585) (189,620) – – (0.49) (0.12) – –
Purchase of intangible assets – (16,000,000) – – – (10.53) – –
Proceeds on disposal of
property, plant and equipment 1,002,499 270,000 – – 0.67 0.18 – –
Net cash from/(used in)
investing activities 264,914 (15,919,620) (2,078,266) (20,249,764) 0.18 (10.48) (1.38) (13.33)
Cash flow from financing activities
Increase in borrowings 2,406,110 20,129,080 2,406,110 20,129,080 1.60 13.25 1.60 13.25
Net cash generated from
financing activities 2,406,110 20,129,080 2,406,110 20,129,080 1.60 13.25 1.60 13.25
Net increase/(decrease) in
cash and cash equivalents 1,002,437 354,411 (92,138) (393,146) 0.67 0.23 (0.06) (0.26)
Cash and cash equivalents at
beginning of year 11 3,959,328 3,604,917 287,715 680,861 2.63 2.37 0.19 0.45
Cash and cash equivalents at
end of year 11 4,961,765 3,959,328 195,577 287,715 3.29 2.61 0.13 0.19
Note- The exchange rate used to convert ZAR to Rs. <6.634> / <ZAR> (Rs. <6.582> / <ZAR>)
“The columns in INR are not part of the audited financial statements and the audit opinion does not apply to them.”

281
MARICO SOUTH AFRICA CONSUMER CARE
(PROPRIETARY) L IMITED
1 Summary of significant accounting policies
The principle accounting policies applied in the preparation of these consolidated financial statements are set out below.
These policies have been consistently applied to all the years presented, unless otherwise stated.
1.1 Basis of preparation
The financial statements have been prepared in accordance with the International Financial Reporting Standards (IFRS). The
financial statements have been prepared under the historical cost convention.
The preparation of the financial statements in conformity with IFRS requires the use of estimates and assumptions that affect
the reported amounts of assets and liabilities and disclosure of contingent assets and liabilities at the date of the financial
statements and the reported amounts of revenues and expenses during the reporting period based on management’s best
knowledge of current events and actions. Actual results may ultimately differ from these estimates. During the current
period, areas involving a higher degree of judgment or complexity, or areas where assumptions and estimates are significant
to the financial statements, have been disclosed in note 1.22.
1.2 Consolidation
Subsidiaries are all entities (including special purpose entities) over which the group has the power to govern the financial
and operating policies generally accompanying a shareholding of more than one half of the voting rights. The existence and
effect of potential voting rights that are currently exercisable or convertible are considered when assessing whether the
group controls another entity. Subsidiaries are fully consolidated from the date on which control is transferred to the group.
They are de-consolidated from the date that control ceases.
The purchase method of accounting is used to account for the acquisition of subsidiaries by the group. The cost of an
acquisition is measured as the fair value of the assets given, equity instruments issued and liabilities incurred or assumed at
the date of exchange, plus costs directly attributable to the acquisition. Identifiable assets acquired and liabilities and
contingent liabilities assumed in a business combination are measured initially at their fair values at the acquisition date,
irrespective of the extent of any minority interest. The excess of the cost of acquisition over the fair value of the group’s
share of the identifiable net assets acquired is recorded as goodwill. If the cost of acquisition is less than the fair value of
the net assets of the subsidiary acquired, the difference is recognised directly in the statement of comprehensive income.
Inter-company transactions, balances and unrealised gains on transactions between group companies are eliminated.
Unrealised losses are also eliminated but considered an impairment indicator of the asset transferred. Accounting policies of
subsidiaries have been changed where necessary to ensure consistency with the policies adopted by the group.
Investments in subsidiaries are accounted for at cost less accumulated impairment losses in the stand-alone financial
statements of the company.
1.3 Property, plant and equipment
All property, plant and equipment are stated at historical cost less accumulated depreciation and impairment losses.
Historical cost includes expenditure that is directly attributable to the acquisition of the items.
Subsequent costs are included in the asset’s carrying amount or recognised as a separate asset, as appropriate, only when
it is probable that future economic benefits associated with the item will flow to the company and the cost of the item can be
measured reliably. All other repairs and maintenance are charged to the statement of comprehensive income during the
financial period in which they are incurred.
Depreciation is calculated using the straight-line basis so as to write off the cost of the assets to their residual values over
their expected useful lives. The expected useful lives are as follows:
NOTES TO THE FINANCIAL STATEMENTSfor the year ended 31 March 2012
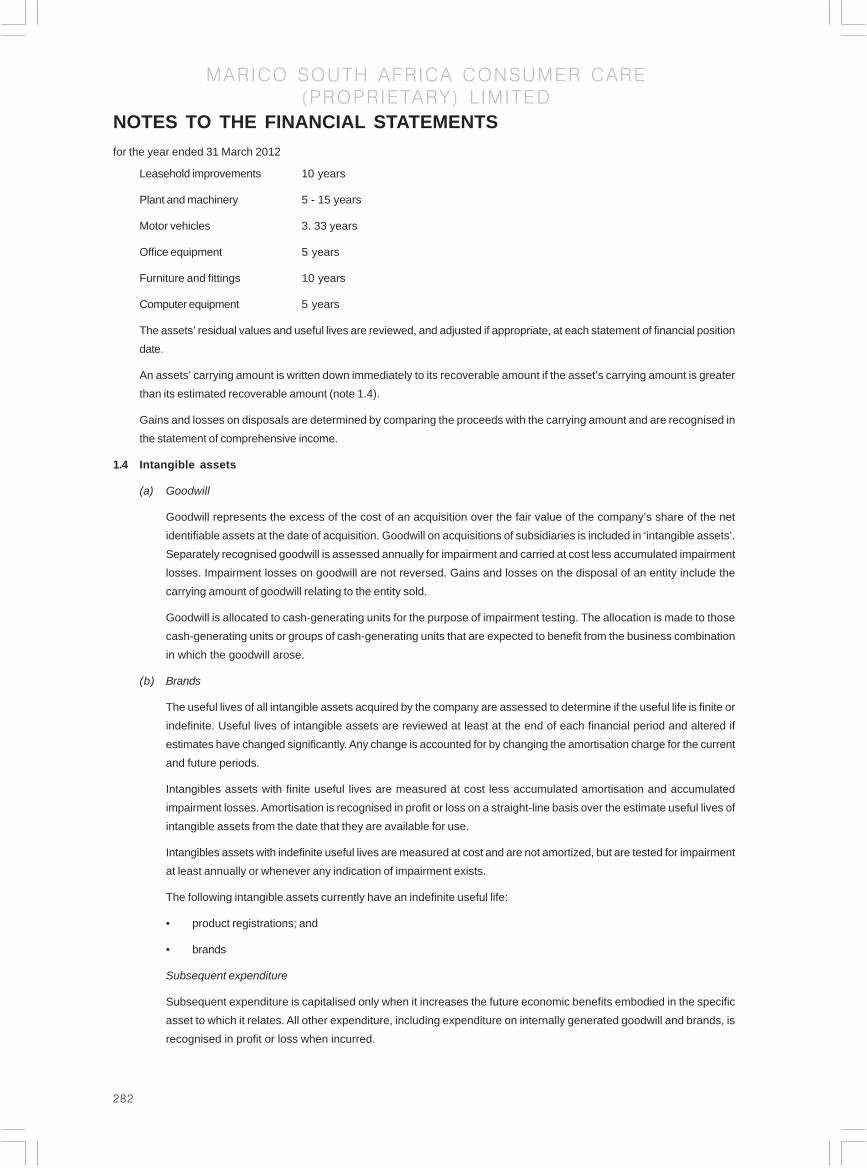
282
MARICO SOUTH AFRICA CONSUMER CARE
(PROPRIETARY) L IMITED
Leasehold improvements 10 years
Plant and machinery 5 - 15 years
Motor vehicles 3. 33 years
Office equipment 5 years
Furniture and fittings 10 years
Computer equipment 5 years
The assets’ residual values and useful lives are reviewed, and adjusted if appropriate, at each statement of financial position
date.
An assets’ carrying amount is written down immediately to its recoverable amount if the asset’s carrying amount is greater
than its estimated recoverable amount (note 1.4).
Gains and losses on disposals are determined by comparing the proceeds with the carrying amount and are recognised in
the statement of comprehensive income.
1.4 Intangible assets
(a) Goodwill
Goodwill represents the excess of the cost of an acquisition over the fair value of the company’s share of the net
identifiable assets at the date of acquisition. Goodwill on acquisitions of subsidiaries is included in ‘intangible assets’.
Separately recognised goodwill is assessed annually for impairment and carried at cost less accumulated impairment
losses. Impairment losses on goodwill are not reversed. Gains and losses on the disposal of an entity include the
carrying amount of goodwill relating to the entity sold.
Goodwill is allocated to cash-generating units for the purpose of impairment testing. The allocation is made to those
cash-generating units or groups of cash-generating units that are expected to benefit from the business combination
in which the goodwill arose.
(b) Brands
The useful lives of all intangible assets acquired by the company are assessed to determine if the useful life is finite or
indefinite. Useful lives of intangible assets are reviewed at least at the end of each financial period and altered if
estimates have changed significantly. Any change is accounted for by changing the amortisation charge for the current
and future periods.
Intangibles assets with finite useful lives are measured at cost less accumulated amortisation and accumulated
impairment losses. Amortisation is recognised in profit or loss on a straight-line basis over the estimate useful lives of
intangible assets from the date that they are available for use.
Intangibles assets with indefinite useful lives are measured at cost and are not amortized, but are tested for impairment
at least annually or whenever any indication of impairment exists.
The following intangible assets currently have an indefinite useful life:
• product registrations; and
• brands
Subsequent expenditure
Subsequent expenditure is capitalised only when it increases the future economic benefits embodied in the specific
asset to which it relates. All other expenditure, including expenditure on internally generated goodwill and brands, is
recognised in profit or loss when incurred.
NOTES TO THE FINANCIAL STATEMENTSfor the year ended 31 March 2012
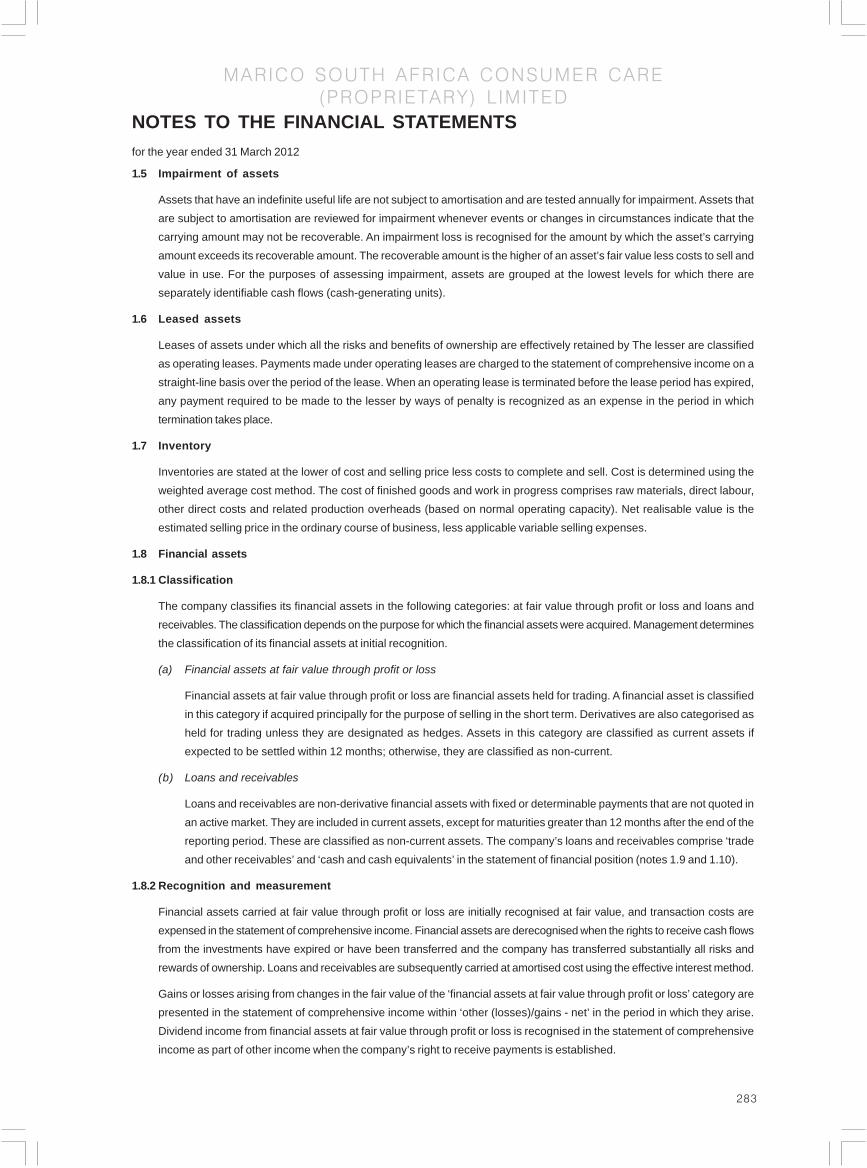
283
MARICO SOUTH AFRICA CONSUMER CARE
(PROPRIETARY) L IMITED
1.5 Impairment of assets
Assets that have an indefinite useful life are not subject to amortisation and are tested annually for impairment. Assets that
are subject to amortisation are reviewed for impairment whenever events or changes in circumstances indicate that the
carrying amount may not be recoverable. An impairment loss is recognised for the amount by which the asset’s carrying
amount exceeds its recoverable amount. The recoverable amount is the higher of an asset’s fair value less costs to sell and
value in use. For the purposes of assessing impairment, assets are grouped at the lowest levels for which there are
separately identifiable cash flows (cash-generating units).
1.6 Leased assets
Leases of assets under which all the risks and benefits of ownership are effectively retained by The lesser are classified
as operating leases. Payments made under operating leases are charged to the statement of comprehensive income on a
straight-line basis over the period of the lease. When an operating lease is terminated before the lease period has expired,
any payment required to be made to the lesser by ways of penalty is recognized as an expense in the period in which
termination takes place.
1.7 Inventory
Inventories are stated at the lower of cost and selling price less costs to complete and sell. Cost is determined using the
weighted average cost method. The cost of finished goods and work in progress comprises raw materials, direct labour,
other direct costs and related production overheads (based on normal operating capacity). Net realisable value is the
estimated selling price in the ordinary course of business, less applicable variable selling expenses.
1.8 Financial assets
1.8.1 Classification
The company classifies its financial assets in the following categories: at fair value through profit or loss and loans and
receivables. The classification depends on the purpose for which the financial assets were acquired. Management determines
the classification of its financial assets at initial recognition.
(a) Financial assets at fair value through profit or loss
Financial assets at fair value through profit or loss are financial assets held for trading. A financial asset is classified
in this category if acquired principally for the purpose of selling in the short term. Derivatives are also categorised as
held for trading unless they are designated as hedges. Assets in this category are classified as current assets if
expected to be settled within 12 months; otherwise, they are classified as non-current.
(b) Loans and receivables
Loans and receivables are non-derivative financial assets with fixed or determinable payments that are not quoted in
an active market. They are included in current assets, except for maturities greater than 12 months after the end of the
reporting period. These are classified as non-current assets. The company’s loans and receivables comprise ‘trade
and other receivables’ and ‘cash and cash equivalents’ in the statement of financial position (notes 1.9 and 1.10).
1.8.2 Recognition and measurement
Financial assets carried at fair value through profit or loss are initially recognised at fair value, and transaction costs are
expensed in the statement of comprehensive income. Financial assets are derecognised when the rights to receive cash flows
from the investments have expired or have been transferred and the company has transferred substantially all risks and
rewards of ownership. Loans and receivables are subsequently carried at amortised cost using the effective interest method.
Gains or losses arising from changes in the fair value of the ‘financial assets at fair value through profit or loss’ category are
presented in the statement of comprehensive income within ‘other (losses)/gains - net’ in the period in which they arise.
Dividend income from financial assets at fair value through profit or loss is recognised in the statement of comprehensive
income as part of other income when the company’s right to receive payments is established.
NOTES TO THE FINANCIAL STATEMENTSfor the year ended 31 March 2012

284
MARICO SOUTH AFRICA CONSUMER CARE
(PROPRIETARY) L IMITED
1.9 Trade receivables
Trade receivables are measured at amortised cost using the effective interest rate method, less provision for impairment. A
provision for impairment of trade receivables is established when there is objective evidence that the group will not be able
to collect all amounts due according to the original terms of the receivables. The amount of the provision is the difference
between the asset’s carrying amount and the present value of estimated future cash flows, discounted at the original
effective interest rate. The carrying amount of the asset is reduced through the use of an allowance account, and the
amount of the loss is recognised in the statement of comprehensive income within ‘selling and marketing costs’. When a trade
receivable is uncollectible, it is written off against the allowance account for trade receivables. Subsequent recoveries of
amounts previously written off are credited in the statement of comprehensive income .
1.10 Cash and cash equivalents
Cash and cash equivalents includes cash in hand, deposits held at call with banks, other short-term highly liquid investments
with original maturities of three months or less, and bank overdrafts. Bank overdrafts are shown within borrowings in
current liabilities on the statement of financial position.
1.11 Current and deferred income tax
The tax expense for the period comprises current and deferred tax. Tax is recognised in the statement of comprehensive
income, except to the extent that it relates to items recognised in other comprehensive income or directly in equity. In this
case, the tax is also recognised in other comprehensive income or directly in equity, respectively.
The current income tax charge is calculated on the basis of the tax laws enacted or substantively enacted at the statement
of financial position date in the countries where the company and its subsidiaries operate and generate taxable income.
Management periodically evaluates positions taken in tax returns with respect to situations in which applicable tax regulation
is subject to interpretation. It establishes provisions where appropriate on the basis of amounts expected to be paid to the
tax authorities.
Deferred income tax is recognised, using the liability method, on temporary differences arising between the tax bases of
assets and liabilities and their carrying amounts in the financial statements. However, deferred tax liabilities are not recognised
if they arise from the initial recognition of goodwill; deferred income tax is not accounted for if it arises from initial recognition
of an asset or liability in a transaction other than a business combination that at the time of the transaction affects neither
accounting nor taxable profit or loss. Deferred income tax is determined using tax rates (and laws) that have been enacted
or substantially enacted by the statement of financial position date and are expected to apply when the related deferred
income tax asset is realised or the deferred income tax liability is settled.
Deferred income tax assets are recognised only to the extent that it is probable that future taxable profit will be available
against which the temporary differences can be utilised.
Deferred income tax assets and liabilities are offset when there is a legally enforceable right to offset current tax assets
against current tax liabilities and when the deferred income taxes assets and liabilities relate to income taxes levied by the
same taxation authority on either the same taxable entity or different taxable entities where there is an intention to settle the
balances on a net basis.
1.12 Trade payables
Trade payables are carried initially at the fair value of the consideration to be paid in future for goods or services that have
been received or supplied and invoiced or formally agreed with the supplier, and subsequently measured at amortised cost
using the effective interest rate method.
Employee entitlements to annual leave are recognised when they accrue to employees. An accrual is made for the estimated
liability for annual leave as a result of services rendered by employees up to the statement of financial position.
NOTES TO THE FINANCIAL STATEMENTSfor the year ended 31 March 2012

285
MARICO SOUTH AFRICA CONSUMER CARE
(PROPRIETARY) L IMITED
1.13 Provisions
Provisions are recognised when the company has a present legal or constructive obligation as a result of past events; it is
more likely than not that an outflow of resources will be required to settle the obligation; and the amount has been reliably
estimated. Provisions are not recognised for future operating losses. Where there are a number of similar obligations, the
likelihood that an outflow will be required in settlement is determined by considering the class of obligations as a whole. A
provision is recognised even if the likelihood of an outflow with respect to anyone item included in the same class of
obligations may be small.
Provisions are measured at the present value of the expenditures expected to be required to settle the obligation using a pre-
tax rate that reflects current market assessments of the time value of money and the risks specific to the obligation. The
increase in the provision due to passage of time is recognised as interest expense.
1.14 Financial risk management
(1) Financial risk factors
The group’s activities expose it to a variety of financial risks, including the effects of changes in interest rates and foreign
currency exchange rates. The group’s overall risk management programme focuses on the unpredictability of financial
markets and seeks to minimise potential adverse effects on the financial performance of the group. The group does not use
derivative financial instruments, such as interest rate swaps and forward exchange contracts, to hedge certain exposures.
(a) Foreign exchange risk
The group is occasionally exposed to foreign exchange risk arising from currency exposures, primarily with respect
to the US Dollar. The company and group does not use forward contracts to hedge their exposure to foreign currency
risk in connection with the measurement currency.
(b) Interest rate risk
The group’s investments in fixed-rate debt securities and its fixed-rate borrowings are exposed to a risk of change in
their fair value due to changes in interest rates. The group’s investments in variable-rate debt securities and its
variable-rate borrowings are exposed to a risk of change in cash flows due to changes in interest rates. Investments
in equity securities and short-term receivables and payables are not exposed to interest rate risk.
The group adopts a policy of regularly reviewing interest rate exposure, and maintains floating rate borrowings.
Interest rate sensitivity
The sensitivity analysis below has been determined based on the exposure to interest rates at the statement of
financial position date and the stipulated change taking place at the beginning of the financial period and held constant
in the case of variable rate borrowings. A 50 basis point increase or decrease has been used, as this represents
management’s assessment of the possible change in interest rates.
If interest rates has been 50 basis points higher/lower and all other variables held constant, the group’s/company’s
profit before tax would decrease by:
Group Company Group Company
2012 2011 2012 2011 2012 2011 2012 2011
Notes R R R R Rs.in Rs. in Rs. in Rs. in
Crore Crore Crore Crore
Effect on profit before tax – – 384,196 338,750 – – 0.25 0.22
(c) Credit risk
Management has a credit risk policy in place and the exposure to credit risk is monitored on an ongoing basis. Credit
evaluations are performed on all customers requiring credit over a certain amount. Trade receivables comprise a wide.
customer base.
NOTES TO THE FINANCIAL STATEMENTSfor the year ended 31 March 2012

286
MARICO SOUTH AFRICA CONSUMER CARE
(PROPRIETARY) L IMITED
At period end there were no significant concentrations of credit risk. The maximum exposure to credit risk is represented
by the carrying amount of each financial asset in the statement of financial position, grossed up for any allowances for
losses.
(d) Liquidity risk
Prudent liquidity risk management implies maintaining sufficient cash resources and ensuring the availability of funding
through an adequate amount of credit facilities. The group aims to maintain flexibility by monitoring cash flow forecast,
good working capital management and ensuring adequate borrowing facilities are maintained.
The following table details the group and company’s remaining contractual maturity of its non-derivative financial
liabilities.
Average Within 1 Greater than Total Within 1 Greater than Total
interest rate period 2 periods period 2 periods
R R R Rs.in Crore Rs.in Crore Rs.in Crore
Group 2012
Trade and other payables 19,239,256 – 19,239,256 12.76 – 12.76
Interest bearing shareholders
loan from Marico Limited
– Non–current portion 7,61% – 61,225,999 61,225,999 – 40.62 40.62
– Current potion 9% 22,492,444 – 22,492,444 14.92 – 14.92
41,731,700 61,225,999 102,957,699 27.68 40.62 68.30
Group 2011
Trade and other payables 26,781,642 – 26,781,642 17.77 – 17.77
Interest bearing shareholders
loan from Marico Limited
Non–current portion 7,61% – 60,956,826 60,956,826 – 40.44 40.44
Current potion 10.50% 47,137,149 60,956,826 108,093,975 31.27 40.44 71.71
Company 2012
Trade and other payables 20,000 – 20,000 0.01 – 0.01
Interest bearing shareholders
loan from Marico Limited
– Non–current portion 7,61% – 61,225,999 61,225,999 – 40.62 40.62
– Current potion 9% 22,492,444 – 22,492,444 14.92 – 14.92
22,512,444 61,225,999 83,738,443 14.93 40.62 55.55
Company 2011
Trade and other payables 20,000 – 20,000 0.01 – 0.01
Interest bearing shareholders
loan from Marico Limited
Non–current portion 7,61% – 60,956,826 60,956,826 – 40.44 40.44
Current potion 10.50% 20,355,507 – 20,355,507 13.50 – 13.50
20,375,507 60,956,826 81,332,333 13.52 40.44 53.96
NOTES TO THE FINANCIAL STATEMENTSfor the year ended 31 March 2012

287
MARICO SOUTH AFRICA CONSUMER CARE
(PROPRIETARY) L IMITED
NOTES TO THE FINANCIAL STATEMENTSfor the year ended 31 March 2012
Capital risk management
The group’s objectives when managing capital are to safeguard the group’s ability to continue as a going concern in
order to provide returns for shareholders, benefits for other stakeholders and to maintain an optimal capital structure
to reduce the cost of capital.
In order to maintain or adjust the capital structure, the group may adjust the amount of dividends paid to shareholders,
return capital to shareholders, issue new shares or sell assets to reduce debt.
1.15 Share capital
Ordinary shares are classified as equity.
Incremental costs directly attributable to the issue of new shares or options are shown in equity as a deduction, net of tax,
from the proceeds.
The difference between the proceeds received and the par value of ordinary shares issued are shown within equity as
share premium.
1.16 Revenue recognition
Revenue comprises the fair value of the consideration received or receivable for the sale of goods and services in the
ordinary course of the company’s activities. Revenue is shown net of value-added tax, estimated returns, rebates and
discounts. Revenue is recognised as follows:
(a) Sales of goods
Sales of goods are recognised when the company has delivered products to the customer, the customer has accepted
the products and collectability of the related receivables is reasonably assured. It is the company’s policy to sell its
products to the end customer with a right of return. Accumulated experience is used to estimate and provide for such
returns at the time of sale.
(b) Interest income
Interest income is recognised on a time-proportion basis using the effective interest rate method.
1.17 Research and development costs
Research and development costs are recognised as an expense to the extent that such expenditure are not expected to
have future benefits.
1.18 Employee benefits
The group operates two retirement benefit schemes. These are both defined contribution funds. A defined contribution fund
is a retirement benefit plan under which the group pays fixed contributions into a separate entity. The group has no legal or
constructive obligations to pay further contributions if the fund does not hold sufficient assets to pay all employees the
benefits relating to employee service in the current and prior periods.
The group pays contributions on a contractual basis and contributions are recognised as an expense when they are due.
1.19 Borrowings
Borrowings are recognised initially at fair value, net of transaction costs incurred. Borrowings are subsequently stated at
amortised cost. Any difference between the proceeds (net of transaction costs) and the redemption value is recognised in
the statement of comprehensive income over the period of the borrowings using the effective interest rate method.
Borrowings are classified as current liabilities unless the group has an unconditional right to defer settlement of the liability
for at least 12 months after the statement of financial position date.
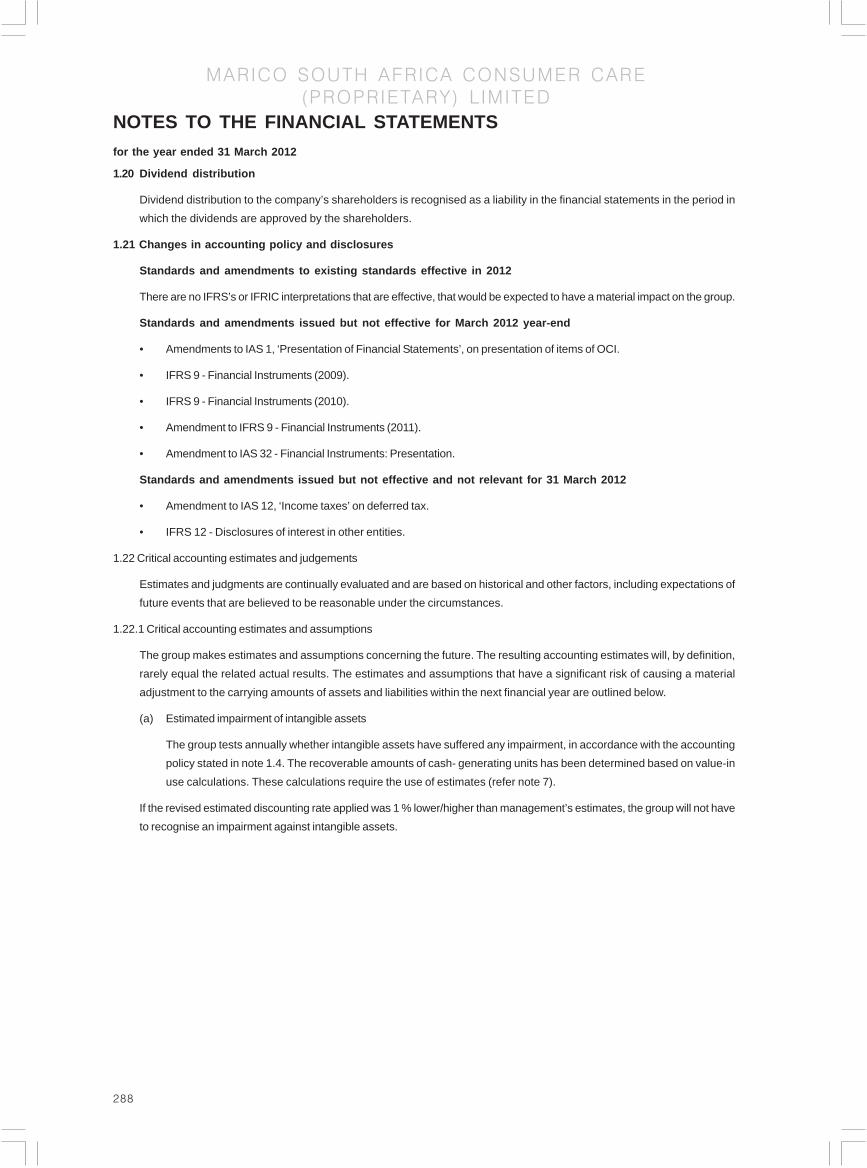
288
MARICO SOUTH AFRICA CONSUMER CARE
(PROPRIETARY) L IMITED
1.20 Dividend distribution
Dividend distribution to the company’s shareholders is recognised as a liability in the financial statements in the period in
which the dividends are approved by the shareholders.
1.21 Changes in accounting policy and disclosures
Standards and amendments to existing standards effective in 2012
There are no IFRS’s or IFRIC interpretations that are effective, that would be expected to have a material impact on the group.
Standards and amendments issued but not effective for March 2012 year-end
• Amendments to IAS 1, ‘Presentation of Financial Statements’, on presentation of items of OCI.
• IFRS 9 - Financial Instruments (2009).
• IFRS 9 - Financial Instruments (2010).
• Amendment to IFRS 9 - Financial Instruments (2011).
• Amendment to IAS 32 - Financial Instruments: Presentation.
Standards and amendments issued but not effective and not relevant for 31 March 2012
• Amendment to IAS 12, ‘Income taxes’ on deferred tax.
• IFRS 12 - Disclosures of interest in other entities.
1.22 Critical accounting estimates and judgements
Estimates and judgments are continually evaluated and are based on historical and other factors, including expectations of
future events that are believed to be reasonable under the circumstances.
1.22.1 Critical accounting estimates and assumptions
The group makes estimates and assumptions concerning the future. The resulting accounting estimates will, by definition,
rarely equal the related actual results. The estimates and assumptions that have a significant risk of causing a material
adjustment to the carrying amounts of assets and liabilities within the next financial year are outlined below.
(a) Estimated impairment of intangible assets
The group tests annually whether intangible assets have suffered any impairment, in accordance with the accounting
policy stated in note 1.4. The recoverable amounts of cash- generating units has been determined based on value-in
use calculations. These calculations require the use of estimates (refer note 7).
If the revised estimated discounting rate applied was 1 % lower/higher than management’s estimates, the group will not have
to recognise an impairment against intangible assets.
NOTES TO THE FINANCIAL STATEMENTSfor the year ended 31 March 2012

289
MARICO SOUTH AFRICA CONSUMER CARE
(PROPRIETARY) L IMITED
2 Operating profit/(Ioss)
Group Company Group Company
2012 2011 2012 2011 2012 2011 2012 2011
R R R R Rs.in Rs. in Rs. in Rs. in
Crore Crore Crore Crore
2.1 The following items have been charged/
(credited) in arriving at operating profit/(Ioss):
Depreciation on property, plant and
equipment 1,114,763 1,236,521 – – 0.74 0.81 – –
(A detailed breakdown of the depreciation
expense is presented in note 6)
Profit on disposal of property, plant
and equipment (79,640) (113,740) – – (0.05) (0.07) – –
Loss on disposal of intangible asset 367,565 – – – 0.24 – – –
Auditor’s remuneration:
Audit fees
– current year provision 360,000 487,004 20,000 20,000 0.24 0.32 0.01 0.01
– prior year under/(over)
provision 293,541 25,160 20,000 20,000 0.19 0.02 0.01 0.01
653,541 512,164 – – 0.43 0.34 – –
Lease rentals
– Buildings 3,411,440 3,418,472 – – 2.26 2.25 – –
– Computers 355,943 214,414 – – 0.24 0.14 – –
3,767,383 3,632,886 – – 2.50 2.39 – –
Directors’ emoluments
Salaries 1,462,689 3,275,169 – – 0.97 2.16 – –
Other 1,126,635 1,755,616 – – 0.75 1.16 – –
2,589,324 5,030,785 – – 1.72 3.31 – –
Staff costs (see note 3) 18,799,707 14,120,360 – – 12.47 9.29 – –
2.2 Expenses by nature
Depreciation 1,114,763 1,236,521 – – 0.74 0.81 – –
Directors’ emoluments 2,589,324 5,030,785 – – 1.72 3.31 – –
Operating lease rentals 3,767,383 3,632,886 – – 2.50 2.39 – –
Staff costs 18,799,707 14,120,360 – – 12.47 9.29 – –
Cost of sales 88,938,105 71,258,719 – – 59.00 46.90 – –
Commission 4,855,264 4,075,254 – – 3.22 2.68 – –
Advertising 11,474,149 14,495,953 – – 7.61 9.54 – –
Freight 9,066,861 7,625,948 – – 6.01 5.02 – –
Other 9,216,077 12,577,134 3,945 4,959 6.11 8.28 – –
Total cost of sales and operating
expenses 149,821,633 134,053,560 3,945 4,959 99.39 88.23 – –
NOTES TO THE FINANCIAL STATEMENTSfor the year ended 31 March 2012
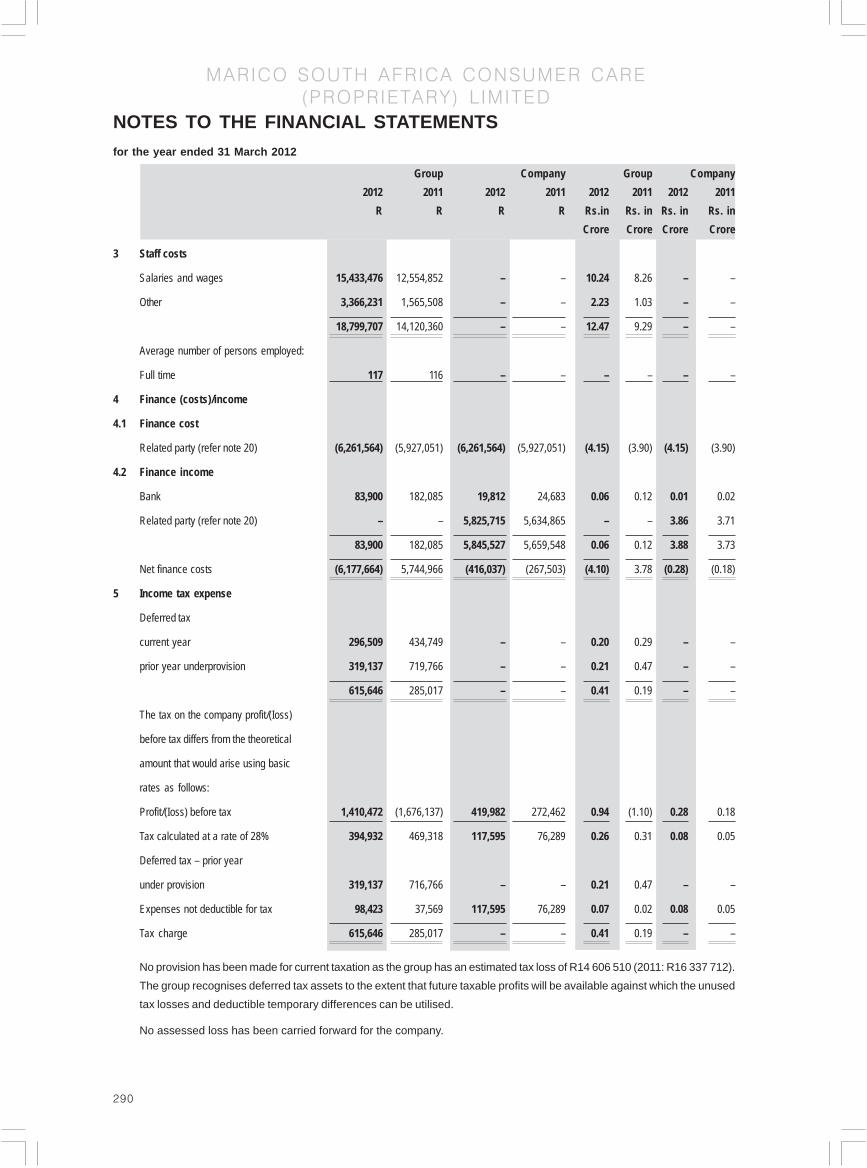
290
MARICO SOUTH AFRICA CONSUMER CARE
(PROPRIETARY) L IMITED
Group Company Group Company
2012 2011 2012 2011 2012 2011 2012 2011
R R R R Rs.in Rs. in Rs. in Rs. in
Crore Crore Crore Crore
3 Staff costs
Salaries and wages 15,433,476 12,554,852 – – 10.24 8.26 – –
Other 3,366,231 1,565,508 – – 2.23 1.03 – –
18,799,707 14,120,360 – – 12.47 9.29 – –
Average number of persons employed:
Full time 117 116 – – – – – –
4 Finance (costs)/income
4.1 Finance cost
Related party (refer note 20) (6,261,564) (5,927,051) (6,261,564) (5,927,051) (4.15) (3.90) (4.15) (3.90)
4.2 Finance income
Bank 83,900 182,085 19,812 24,683 0.06 0.12 0.01 0.02
Related party (refer note 20) – – 5,825,715 5,634,865 – – 3.86 3.71
83,900 182,085 5,845,527 5,659,548 0.06 0.12 3.88 3.73
Net finance costs (6,177,664) 5,744,966 (416,037) (267,503) (4.10) 3.78 (0.28) (0.18)
5 Income tax expense
Deferred tax
current year 296,509 434,749 – – 0.20 0.29 – –
prior year underprovision 319,137 719,766 – – 0.21 0.47 – –
615,646 285,017 – – 0.41 0.19 – –
The tax on the company profit/(Ioss)
before tax differs from the theoretical
amount that would arise using basic
rates as follows:
Profit/(Ioss) before tax 1,410,472 (1,676,137) 419,982 272,462 0.94 (1.10) 0.28 0.18
Tax calculated at a rate of 28% 394,932 469,318 117,595 76,289 0.26 0.31 0.08 0.05
Deferred tax – prior year
under provision 319,137 716,766 – – 0.21 0.47 – –
Expenses not deductible for tax 98,423 37,569 117,595 76,289 0.07 0.02 0.08 0.05
Tax charge 615,646 285,017 – – 0.41 0.19 – –
No provision has been made for current taxation as the group has an estimated tax loss of R14 606 510 (2011: R16 337 712).
The group recognises deferred tax assets to the extent that future taxable profits will be available against which the unused
tax losses and deductible temporary differences can be utilised.
No assessed loss has been carried forward for the company.
NOTES TO THE FINANCIAL STATEMENTSfor the year ended 31 March 2012

291
MARICO SOUTH AFRICA CONSUMER CARE
(PROPRIETARY) L IMITED
NOTES TO THE FINANCIAL STATEMENTSfor the year ended 31 March 2012
6 Property, plant and equipment
Offi
ceO
ffice
furn
iture
and
Cap
ital
furn
iture
and
Cap
ital
Leas
ehol
dPl
ant
and
Mot
orco
mpu
ter
wor
k–in
–Le
aseh
old
Plan
t an
dM
otor
com
pute
rw
ork–
in–
impr
ovem
ents
mac
hine
ryve
hicl
eseq
uipm
ent
prog
ress
Tota
lim
prov
emen
tsm
achi
nery
vehi
cles
equi
pmen
tpr
ogre
ssTo
tal
Gro
upR
RR
RR
RR
s.in
Rs.
inR
s.in
Rs.
inR
s.in
Rs.
in
Cro
reC
rore
Cro
reC
rore
Cro
reC
rore
Year
end
ed 3
1 M
arch
201
2
Ope
ning
net
car
ryin
g am
ount
1,66
4,80
41,
818,
430
25,2
3263
7,86
7–
4,14
6,33
31.
101.
210.
020.
42–
2.75
Addi
tions
–36
9,47
610
8,33
319
3,32
666
,450
737,
585
–0.
250.
070.
130.
040.
49
Dep
recia
tion
(285
,163
)(4
64,3
12)
(46,
130)
(319
,158
)(1,
114,
763)
__
(0.1
9)(0
.31)
(0.0
3)(0
.21)
(0.7
4)
Dis
posa
ls–
––
22,8
60–
(22,
860)
––
–0.
02–
(0.0
2)
Clo
sing
net
car
ryin
g am
ount
1,37
9,64
11,
723,
594
87,4
3548
9,17
566
,450
3,74
6,29
50.
921.
140.
060.
320.
042.
49
Cos
t2,
851,
041
5,33
4,70
432
5,38
21,
781,
763
66,4
5010
,359
,340
1.89
3.54
0.22
1.18
0.04
6.87
Accu
mul
ated
dep
reci
atio
n an
d im
pairm
ent
(1,4
71,4
00)
(3,6
11,1
10)
(237
,947
)(1
,292
,588
)–
(6,6
13,0
44)
(0.9
8)(2
.40)
(0.1
6)(0
.86)
–(4
.39)
Clo
sing
net
car
ryin
g am
ount
1,37
9,64
11,
723,
594
87,4
3548
9,17
566
,450
3,74
6,29
50.
921.
140.
060.
320.
042.
49
Dep
reci
atio
n ch
arge
of R
1 11
4763
(201
1: R
1 23
6521
) has
bee
n ch
arge
d to
ope
ratin
g ex
pens
es. O
ffice
Offi
ce
furn
iture
and
Cap
ital
furn
iture
and
Cap
ital
Leas
ehol
dPl
ant
and
Mot
orco
mpu
ter
wor
k–in
–Le
aseh
old
Plan
t an
dM
otor
com
pute
rw
ork–
in–
impr
ovem
ents
mac
hine
ryve
hicl
eseq
uipm
ent
prog
ress
Tota
lim
prov
emen
tsm
achi
nery
vehi
cles
equi
pmen
tpr
ogre
ssT o
tal
Gro
upR
RR
RR
RR
s.in
Rs.
inR
s.in
Rs.
inR
s.in
Rs.
in
Cro
reC
rore
Cro
reC
rore
Cro
reC
rore
Year
end
ed 3
1 M
arch
201
1
Ope
ning
net
car
ryin
g am
ount
1,94
9,96
92,
456,
815
126,
551
418,
752
423,
421
5,37
5,50
81.
281.
620.
080.
280.
283.
54
Addi
tions
–4,
200
–18
5,42
0–
189,
620
––
–0.
12–
0.12
Tran
sfer
––
–39
7,40
7(3
97,4
07)
––
––
0.26
(0.2
6)–
Dis
posa
ls–
(142
,201
)(4
,414
)(9
,645
)(2
6,01
4)(1
82,2
74)
–(0
.09)
–(0
.01)
(0.0
2)(0
.12)
Dep
recia
tion
(285
,165
)(5
00,3
84)
(96,
905)
(354
,067
)–
(1,2
36,5
21)
(0.1
9)(0
.33)
(0.0
6)(0
.23)
–(0
.81)
Clo
sing
net
car
ryin
g am
ount
1,66
4,80
41,
818,
430
25,2
3263
7,86
7–
4,14
6,33
31.
11.
20.
020.
42–
2.73
Cos
t2,
851,
041
5,01
4,02
935
7,04
92,
093,
169
–10
,315
,288
1.88
3.3
0.24
1.38
–6.
79
Accu
mul
ated
dep
reci
atio
n an
d im
pairm
ent
(1,1
86,2
37)
(3,1
95,5
99)
(331
,817
)(1
,455
,302
)–
(6,1
68,9
55)
(0.7
8)(2
.1)
(0.2
2)(0
.96)
–(4
.06)
Clo
sing
net
car
ryin
g am
ount
1,66
4,80
41,
818,
430
25,2
3263
7,86
7–
4,14
6,33
31.
11.
20.
020.
42–
2.73
Com
pany
:
No
item
s of
pro
perty
, pla
nt a
nd e
quip
men
t are
hel
d at
com
pany
leve
l.

292
MARICO SOUTH AFRICA CONSUMER CARE
(PROPRIETARY) L IMITED
7 Intangible assets
Brands Total Brands Total
Group R R Rs. Crore Rs. Crore
Year ended 31 March 2012
Opening carrying amount 49,330,489 49,330,489 32.73 32.73
Disposals (1,267,565) (1,267,565) (0.84) (0.84)
Closing carrying amount 48,062,924 48,062,924 31.88 31.88
Cost 50,062,924 50,062,924 33.21 33.21
Accumulated amortisation (2,000,000) (2,000,000) (1.33) (1.33)
Closing carrying amount 48,062,924 48,062,924 31.88 31.88
Year ended 31 March 2011
Opening carrying amount 33,330,489 33,330,489 21.94 21.94
Additions 16,000,000 16,000,000 10.53 10.53
Closing carrying amount 49,330,489 49,330,489 32.47 32.47
Cost 51,330,489 51,330,489 33.79 33.79
Accumulated amortisation (2,000,000) (2,000,000) (1.32) (1.32)
Closing carrying amount 49,330,489 49,330,489 32.47 32.47
The group has classified its intangible assets as having indefinite useful lives. This conclusion is supported by the fact that
the group is expected to be able to use the brands for the foreseeable future and that the typical product life cycles for the
brands, acquired from public information on estimates of useful lives, indicate that the intangible asset has an indefinite
period of foreseeable usage. This is further supported by the stability of the pharmaceutical and complimentary medicine
industry and the strong demand in markets within which these products are marketed and sold.
Detailed impairment testing is performed for the indefinite–life intangible assets annually. The impairment review process is
as follows:
Each period and whenever impairment indicators are present, management calculate the fair value of the asset and record
an impairment loss for the excess of the carrying value over the fair value, if any.
The fair value is generally measured as the net present value of projected cash flows. In addition, a revaluation of the
remaining useful life of the asset is performed to determine whether continuing to characterise the asset as having an
indefinite life is appropriate.
The recoverable amounts have been determined based on a value–in–use calculation. The calculation uses a free cash flow
model that discounts the free cash flow available from profit after tax generated by the intangible asset. If the resulting net
present value exceeds the carrying value of the intangible asset, the intangible asset is not impaired. However, if the
resulting net present value is less than the carrying value an impairment charge is raised.
The key assumptions used for the value–in–use calculations are as follows:
Growth rate *1 5.70%
Discount rate *2 8%
*1 Weighted average growth rate used to extrapolate cash flows beyond the budget period.
*2 Post–tax discount rate applied to the cash flow projections.
NOTES TO THE FINANCIAL STATEMENTSfor the year ended 31 March 2012

293
MARICO SOUTH AFRICA CONSUMER CARE
(PROPRIETARY) L IMITED
Group Company Group Company
2012 2011 2012 2011 2012 2011 2012 2011
R R R R Rs.in Rs. in Rs. in Rs. in
Crore Crore Crore Crore
8 Investment in subsidiary
Marico South Africa Proprietary Limited
Investment in shares at cost – – 45,485,555 45,485,555 – – 30.18 29.94
The group’s share of the results of its subsidiary, which is unlisted, are as follows:
Name Country of Profit’(Loss) Rs. Crore
incorporation after tax
2012
Marico South Africa (Pty) Ltd South Africa R1, 214,807 0.81
2011
Marico South Africa (Pty) Ltd South Africa (R1, 688,692) (1.11)
The following information relates to the company’s financial interest in its subsidiary:
Name Number of Proportion Nature of business
shares held held
Subsidiary
Marico South Africa 5000 100% Manufacturing and istributing of wide
(Proprietary) Limited range of personal care and affordable
complementary health care products
9 Inventories
Group Company Group Company
2012 2011 2012 2011 2012 2011 2012 2011
R R R R Rs.in Rs. in Rs. in Rs. in
Crore Crore Crore Crore
Raw materials 7,895,389 10,614,091 – – 5.24 6.99 – –
VVork in progress 503,445 431,138 – – 0.33 0.28 – –
Finished goods 10,452,428 8 ,186,241 – – 6.93 5.39 – –
18851,262 19,231,470 – – 12.51 12.66 – –
Provision for obsolescence (1,260,058) (1,127,892) – – (0.84) (0.74) – –
17,591,204 18,103,578 – – 11.67 11.92 – –
The cost of inventories recognised as an expense
and included in cost of sales amounted to R88 938 105
(2011: R70 652 366).
10 Trade and other receivables
Trade receivables 29,051,766 29,036,995 – – 19.27 19.11 – –
Provision for doubtful debts (14,967) (119,713) – – (0.01) (0.08) – –
Provision for rebates (5,618,532) (5,455, 819) – – (3.73) (3.59) – –
Other receivables 419,748 2,112,203 – – 0.28 1.39 – –
Provision for credit notes (728,583) (834,407) – – (0.48) (0.55) – –
23,109,432 24,739,259 – – 15.33 16.28 – –
NOTES TO THE FINANCIAL STATEMENTSfor the year ended 31 March 2012
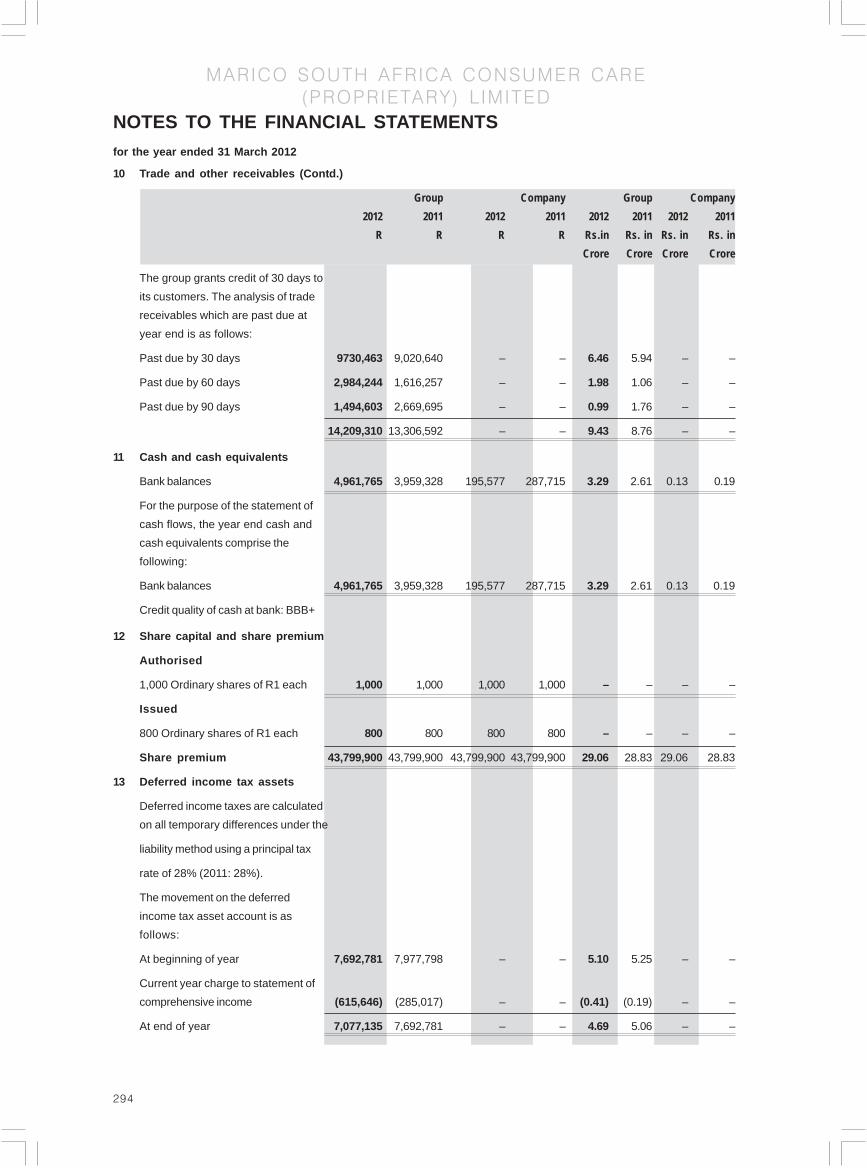
294
MARICO SOUTH AFRICA CONSUMER CARE
(PROPRIETARY) L IMITED
10 Trade and other receivables (Contd.)
Group Company Group Company
2012 2011 2012 2011 2012 2011 2012 2011
R R R R Rs.in Rs. in Rs. in Rs. in
Crore Crore Crore Crore
The group grants credit of 30 days to
its customers. The analysis of trade
receivables which are past due at
year end is as follows:
Past due by 30 days 9730,463 9,020,640 – – 6.46 5.94 – –
Past due by 60 days 2,984,244 1,616,257 – – 1.98 1.06 – –
Past due by 90 days 1,494,603 2,669,695 – – 0.99 1.76 – –
14,209,310 13,306,592 – – 9.43 8.76 – –
11 Cash and cash equivalents
Bank balances 4,961,765 3,959,328 195,577 287,715 3.29 2.61 0.13 0.19
For the purpose of the statement of
cash flows, the year end cash and
cash equivalents comprise the
following:
Bank balances 4,961,765 3,959,328 195,577 287,715 3.29 2.61 0.13 0.19
Credit quality of cash at bank: BBB+
12 Share capital and share premium
Authorised
1,000 Ordinary shares of R1 each 1,000 1,000 1,000 1,000 – – – –
Issued
800 Ordinary shares of R1 each 800 800 800 800 – – – –
Share premium 43,799,900 43,799,900 43,799,900 43,799,900 29.06 28.83 29.06 28.83
13 Deferred income tax assets
Deferred income taxes are calculated
on all temporary differences under the
liability method using a principal tax
rate of 28% (2011: 28%).
The movement on the deferred
income tax asset account is as
follows:
At beginning of year 7,692,781 7,977,798 – – 5.10 5.25 – –
Current year charge to statement of
comprehensive income (615,646) (285,017) – – (0.41) (0.19) – –
At end of year 7,077,135 7,692,781 – – 4.69 5.06 – –
NOTES TO THE FINANCIAL STATEMENTSfor the year ended 31 March 2012
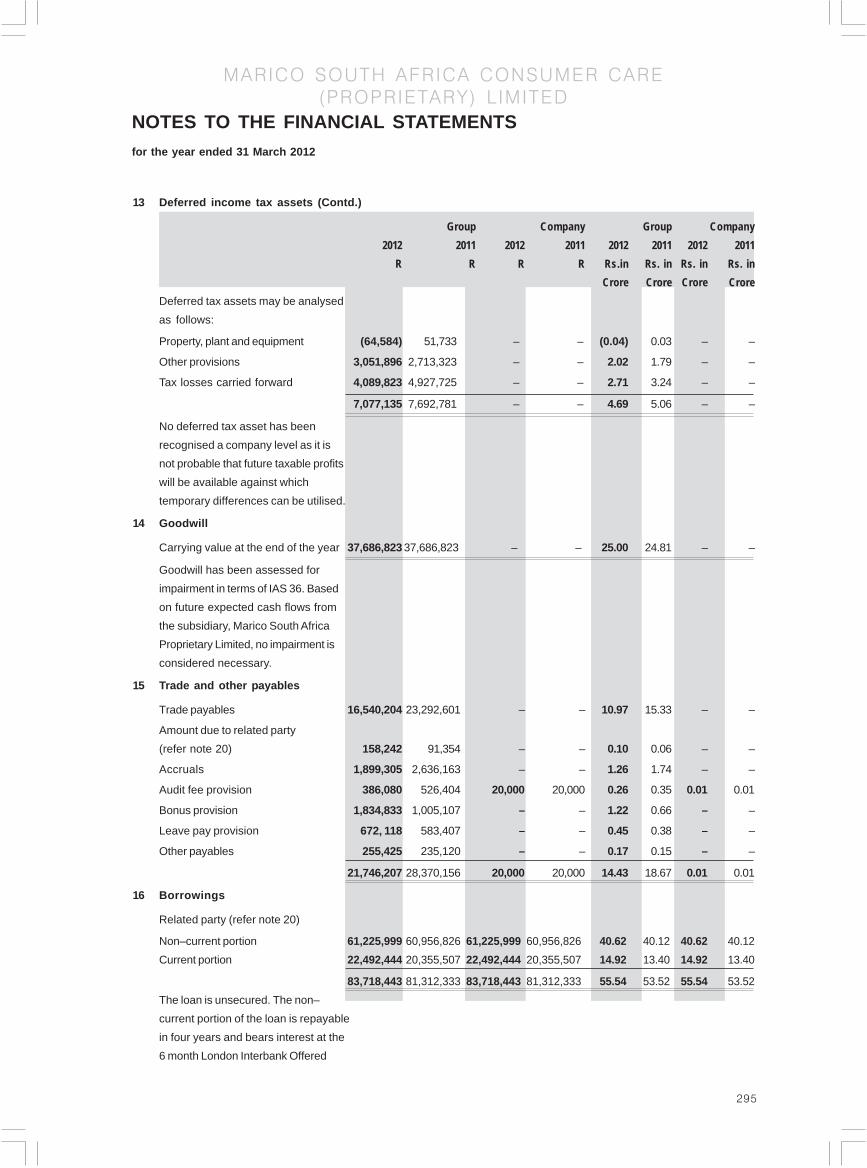
295
MARICO SOUTH AFRICA CONSUMER CARE
(PROPRIETARY) L IMITED
13 Deferred income tax assets (Contd.)
Group Company Group Company
2012 2011 2012 2011 2012 2011 2012 2011
R R R R Rs.in Rs. in Rs. in Rs. in
Crore Crore Crore Crore
Deferred tax assets may be analysed
as follows:
Property, plant and equipment (64,584) 51,733 – – (0.04) 0.03 – –
Other provisions 3,051,896 2,713,323 – – 2.02 1.79 – –
Tax losses carried forward 4,089,823 4,927,725 – – 2.71 3.24 – –
7,077,135 7,692,781 – – 4.69 5.06 – –
No deferred tax asset has been
recognised a company level as it is
not probable that future taxable profits
will be available against which
temporary differences can be utilised.
14 Goodwill
Carrying value at the end of the year 37,686,823 37,686,823 – – 25.00 24.81 – –
Goodwill has been assessed for
impairment in terms of IAS 36. Based
on future expected cash flows from
the subsidiary, Marico South Africa
Proprietary Limited, no impairment is
considered necessary.
15 Trade and other payables
Trade payables 16,540,204 23,292,601 – – 10.97 15.33 – –
Amount due to related party
(refer note 20) 158,242 91,354 – – 0.10 0.06 – –
Accruals 1,899,305 2,636,163 – – 1.26 1.74 – –
Audit fee provision 386,080 526,404 20,000 20,000 0.26 0.35 0.01 0.01
Bonus provision 1,834,833 1,005,107 – – 1.22 0.66 – –
Leave pay provision 672, 118 583,407 – – 0.45 0.38 – –
Other payables 255,425 235,120 – – 0.17 0.15 – –
21,746,207 28,370,156 20,000 20,000 14.43 18.67 0.01 0.01
16 Borrowings
Related party (refer note 20)
Non–current portion 61,225,999 60,956,826 61,225,999 60,956,826 40.62 40.12 40.62 40.12
Current portion 22,492,444 20,355,507 22,492,444 20,355,507 14.92 13.40 14.92 13.40
83,718,443 81,312,333 83,718,443 81,312,333 55.54 53.52 55.54 53.52
The loan is unsecured. The non–
current portion of the loan is repayable
in four years and bears interest at the
6 month London Interbank Offered
NOTES TO THE FINANCIAL STATEMENTSfor the year ended 31 March 2012
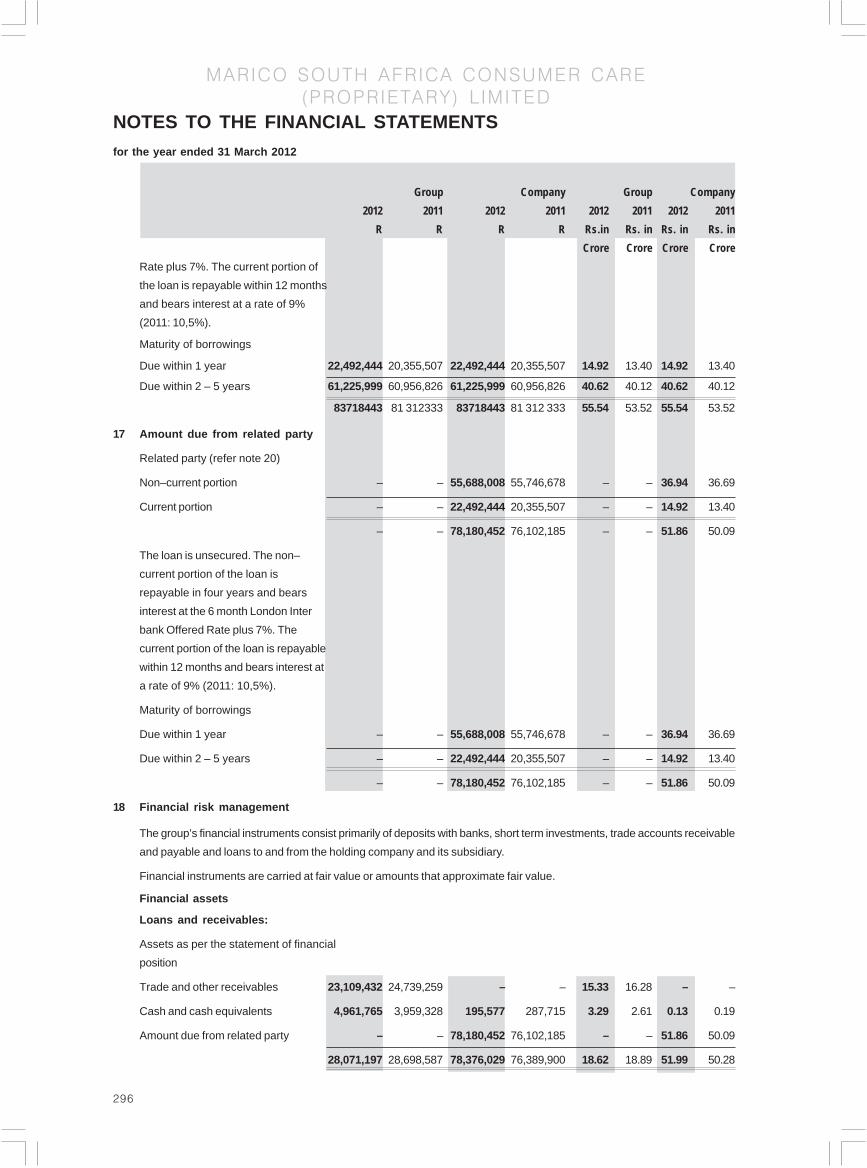
296
MARICO SOUTH AFRICA CONSUMER CARE
(PROPRIETARY) L IMITED
Group Company Group Company
2012 2011 2012 2011 2012 2011 2012 2011
R R R R Rs.in Rs. in Rs. in Rs. in
Crore Crore Crore Crore
Rate plus 7%. The current portion of
the loan is repayable within 12 months
and bears interest at a rate of 9%
(2011: 10,5%).
Maturity of borrowings
Due within 1 year 22,492,444 20,355,507 22,492,444 20,355,507 14.92 13.40 14.92 13.40
Due within 2 – 5 years 61,225,999 60,956,826 61,225,999 60,956,826 40.62 40.12 40.62 40.12
83718443 81 312333 83718443 81 312 333 55.54 53.52 55.54 53.52
17 Amount due from related party
Related party (refer note 20)
Non–current portion – – 55,688,008 55,746,678 – – 36.94 36.69
Current portion – – 22,492,444 20,355,507 – – 14.92 13.40
– – 78,180,452 76,102,185 – – 51.86 50.09
The loan is unsecured. The non–
current portion of the loan is
repayable in four years and bears
interest at the 6 month London Inter
bank Offered Rate plus 7%. The
current portion of the loan is repayable
within 12 months and bears interest at
a rate of 9% (2011: 10,5%).
Maturity of borrowings
Due within 1 year – – 55,688,008 55,746,678 – – 36.94 36.69
Due within 2 – 5 years – – 22,492,444 20,355,507 – – 14.92 13.40
– – 78,180,452 76,102,185 – – 51.86 50.09
18 Financial risk management
The group’s financial instruments consist primarily of deposits with banks, short term investments, trade accounts receivable
and payable and loans to and from the holding company and its subsidiary.
Financial instruments are carried at fair value or amounts that approximate fair value.
Financial assets
Loans and receivables:
Assets as per the statement of financial
position
Trade and other receivables 23,109,432 24,739,259 – – 15.33 16.28 – –
Cash and cash equivalents 4,961,765 3,959,328 195,577 287,715 3.29 2.61 0.13 0.19
Amount due from related party – – 78,180,452 76,102,185 – – 51.86 50.09
28,071,197 28,698,587 78,376,029 76,389,900 18.62 18.89 51.99 50.28
NOTES TO THE FINANCIAL STATEMENTSfor the year ended 31 March 2012

297
MARICO SOUTH AFRICA CONSUMER CARE
(PROPRIETARY) L IMITED
Group Company Group Company
2012 2011 2012 2011 2012 2011 2012 2011
R R R R Rs.in Rs. in Rs. in Rs. in
Crore Crore Crore Crore
Financial liabilities
Financial liabilities at
amortised cost:
Liabilities as per the statement of
financial position
Interest bearing liabilities 83,718,443 81,312,333 83,718,443 81,312,333 55.54 53.52 55.54 53.52
Trade and other payables 19,239,256 26,781,642 20,000 20,000 12.76 17.63 0.01 0.01
102,957,699 108,093,975 83,738,443 81,332,333 68.30 71.15 55.55 53.53
19 Cash flow from operating activities
Operating profit/(Ioss) 7,588,136 4,068,829 (3,945) (4,959) 5.03 2.68 (0.01) (0.01)
Adjusted for:
Non-cash items
Depreciation 1,114,763 1,236,521 – – 0.08 0.81 – _
Asset write off – 26,014 – – – 0.02 – _
Profit on sale of assets (79,640) (113,740) – – (0.05) (0.07) – –
Loss on disposal of intangible
asset 367,565 – – – 0.24 – – –
Operating profit before working
capital changes:
Decrease/(increase) in trade
and other receivables 1,629,827 (6,542,252) – – 1.08 (4.31) – –
Decrease/(increase) in
inventories 512,375 (5,828,542) – – 0.34 (3.84) – –
(Increase)/decrease in trade
and other payables (6,623,949) 9,043,087 – – (4.39) 5.95 –
4,509,077 1,889,917 (3,945) (4,959) 2.99 1.24 (0.01) (0.01)
20 Related party transactions
At 31 March 2012, the holding company of
Marico South Africa Consumer Care Proprietary
Limited and its subsidiary is a listed company
incorporated in India, which holds 100% of the
company’s issued share capital. Marico South
Africa Consumer Care Proprietary Limited and
its subsidiary holds 100% of the issued share
capital of Marico South Africa Proprietary
Limited. The directors are listed in the director’s
report.
NOTES TO THE FINANCIAL STATEMENTSfor the year ended 31 March 2012
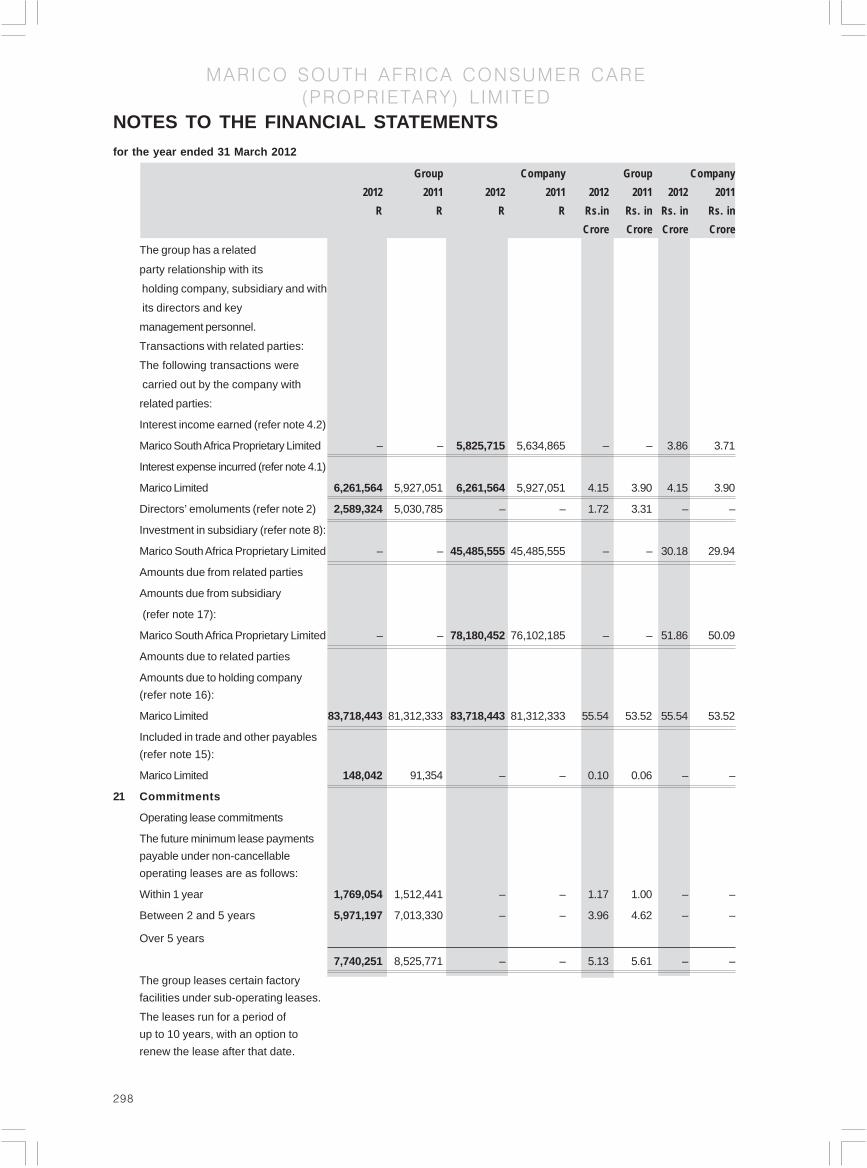
298
MARICO SOUTH AFRICA CONSUMER CARE
(PROPRIETARY) L IMITED
Group Company Group Company
2012 2011 2012 2011 2012 2011 2012 2011
R R R R Rs.in Rs. in Rs. in Rs. in
Crore Crore Crore Crore
The group has a related
party relationship with its
holding company, subsidiary and with
its directors and key
management personnel.
Transactions with related parties:
The following transactions were
carried out by the company with
related parties:
Interest income earned (refer note 4.2)
Marico South Africa Proprietary Limited – – 5,825,715 5,634,865 – – 3.86 3.71
Interest expense incurred (refer note 4.1)
Marico Limited 6,261,564 5,927,051 6,261,564 5,927,051 4.15 3.90 4.15 3.90
Directors’ emoluments (refer note 2) 2,589,324 5,030,785 – – 1.72 3.31 – –
Investment in subsidiary (refer note 8):
Marico South Africa Proprietary Limited – – 45,485,555 45,485,555 – – 30.18 29.94
Amounts due from related parties
Amounts due from subsidiary
(refer note 17):
Marico South Africa Proprietary Limited – – 78,180,452 76,102,185 – – 51.86 50.09
Amounts due to related parties
Amounts due to holding company
(refer note 16):
Marico Limited 83,718,443 81,312,333 83,718,443 81,312,333 55.54 53.52 55.54 53.52
Included in trade and other payables
(refer note 15):
Marico Limited 148,042 91,354 – – 0.10 0.06 – –
21 Commitments
Operating lease commitments
The future minimum lease payments
payable under non-cancellable
operating leases are as follows:
Within 1 year 1,769,054 1,512,441 – – 1.17 1.00 – –
Between 2 and 5 years 5,971,197 7,013,330 – – 3.96 4.62 – –
Over 5 years
7,740,251 8,525,771 – – 5.13 5.61 – –
The group leases certain factory
facilities under sub-operating leases.
The leases run for a period of
up to 10 years, with an option to
renew the lease after that date.
NOTES TO THE FINANCIAL STATEMENTSfor the year ended 31 March 2012

299
MARICO SOUTH AFRICA (PROPRIETARY) LIMITED
Board of Directors Harsh Mariwala
Milind Sarwate
Vijay Subramaniam
Padmanabh Maydeo
John Richard Mason
Registered Office 1474 South Coast Road, Modeni 4052
Factory 1474 South Coast Road, Modeni 4052
Auditors PriceWaterhouseCooper
Bankers Standard Bank of South Africa Limited
Legal Advisors Adams & Adams - Patent and Trademark Attomeys
Deneyz Reltz - Commercial Attomey
Shepstone & Wylie - Litigation Attomeys
KPMG - Seceretarial Services

300
MARICO SOUTH AFRICA (PROPRIETARY) LIMITED
STATEMENT OF DIRECTORS’ RESPONSIBILITYfor the year ended 31 March 2012
The directors are responsible for the preparation, integrity and fair presentation of the financial statements of Marico South Africa
Proprietary Limited. The financial statements have been prepared in accordance with the International Financial Reporting Standards
(IFRS) and in a manner required by the Companies Act of South Africa, and include amounts based on judgements and estimates
made by management.
The directors consider that in preparing the financial statements they have used the most appropriate accounting policies,
consistently applied and supported by reasonable and prudent judgements and estimates, and that all statements of IFRS that they
consider to be applicable have been followed. The directors are satisfied that the information contained in the financial statements
fairly presents the results of operations for the year and the financial positions of the company at year end.
The directors have the responsibility of ensuring that accounting records are kept. The accounting records should disclose with
reasonable accuracy the financial positions of the company to enable the directors to ensure that the financial statements comply
with the relevant legislation.
Marico South Africa Proprietary Limited operated in an established control environment, which is documented and reviewed. This
incorporates risk management and internal control procedures, which are designed to provide reasonable, but not absolute,
assurance that assets are safeguarded and the risks facing the business are being controlled.
The going concern basis has been adopted in preparing the financial statements. The directors have no reason to believe that the
company will not be a going concern in the foreseeable future. The company’s external auditors, PricewaterhouseCoopers Inc,
audited the financial statements and their report is presented hereinafter.
The financial statements were approved by the board of directors and are signed on their behalf.
Director
8 June 2012
301
MARICO SOUTH AFRICA (PROPRIETARY) LIMITED
INDEPENDENT AUDITOR’S REPORT TO THE MEMBERS OFMARICO SOUTH AFRICA PROPRIETARY LIMITEDWe have audited the annual financial statements of Marico South Africa Proprietary Limited, which comprise the statement of
financial position as at 31 March 2012, and the statements of comprehensive income, changes in equity and cash flows for the
year then ended, and a summary of significant accounting policies and other explanatory notes, and the directors’ report, as set
out on pages 4 to 26.
Directors’ Responsibility for the Financial Statements
The company’s directors are responsible for the preparation and fair presentation of these financial statements in accordance
with the International Financial Reporting Standard and in the manner required by the Companies Act of South Africa, and for such
internal control as directors determine is necessary to enable the preparation of financial statements that are free from material
misstatements, whether due to fraud or error.
Auditor’s Responsibility
Our responsibility is to express an opinion on these financial statements based on our audit. We conducted our audit in accordance
with International Standards on Auditing. Those standards require that we comply with ethical requirements and plan and perform
the audit to obtain reasonable assurance whether the financial statements are free from material misstatement.
An audit involves performing procedures to obtain audit evidence about the amounts and disclosures in the financial statements.
The procedures selected depend on the auditor’s judgement, including the assessment of the risks of material misstatement of the
financial statements, whether due to fraud or error. In making those risk assessments, the auditor considers internal control
relevant to the entity’s preparation and fair presentation of the financial statements in order to design audit procedures that are.
appropriate in the circumstances, but not for the purpose of expressing an opinion on the effectiveness of the entity’s internal
control. An audit also includes evaluating the appropriateness of accounting policies used and the reasonableness of accounting
estimates made by management, as well as evaluating the overall presentation of the financial statements.
We believe that the audit evidence we have obtained is sufficient and appropriate to provide a basis for our audit opinion.
Opinion
In our opinion, the financial statements present fairly, in all material respects, the financial position of Marico South Africa
Proprietary Limited at 31 March 2012, and its financial performance and cash flows for the year then ended in accordance with
the International Financial Reporting Standard, and in the manner required by the Companies Act of South Africa.
PricewaterhouseCoopers Inc.
Director: N Ramlagan
Registered Auditor
Durban
8 June 2012

302
MARICO SOUTH AFRICA (PROPRIETARY) LIMITED
REPORT OF THE DIRECTORS’for the year ended 31 March 2012
The directors present their annual report, which forms part of the audited financial statements of the company for the year ended
31 March 2012.
1 Nature of business
The company manufactures and distributes a wide range of personal care and affordable complementary health care
products.
2 Dividends
No dividends have been declared during the period and none are recommended (2011: R Nil).
3 Share capital
The authorised and issued share capital has remained unchanged.
4 Directors and secretary
The present directors of the company are:
JR Mason
H Mariwala (Indian)
M Sarwate (Indian)
V Subramanian (Indian)
P Maydeo (Indian)
No secretary has been appointed.
Holding company
Marico South Africa Consumer Care Proprietary Limited holds 100% of the company’s issued share capital. The ultimate
holding company is Marico Limited, a listed company incorporated in India.
6 Material events after year-end
No matter which is material to the financial affairs of the company and group has occurred between the statement of
financial position date and the date of approval of the financial statements.
7 Auditors
PricewaterhouseCoopers Inc. will continue in office in accordance with the Companies Act of South Africa.
8 Going concern
The company generated a net profit for the period of R1 214807 (2011: loss of R1 688692). At 31 March 2012 the company’s
total assets exceeded its total liabilities by R4 446 519 (2011: R3 231 712).
The company has no external debt apart from its loan from the holding company. Accordingly, the annual financial statements
are prepared on the basis of accounting policies applicable to a going concern.

303
MARICO SOUTH AFRICA (PROPRIETARY) LIMITED
2012 2011 2012 2011
Notes R R Rs.Crore Rs.crore
ASSETS
Non-current assets
Property, plant and equipment 6 3,746,295 4,146,333 2.49 2.73
Intangible assets 7 48,062,924 49,330,489 31.88 32.47
Deferred income tax asset 12 7,077,135 7,692,781 4.69 5.06
58,886,354 61,169,603 39.07 40.26
Current assets
Trade and other receivables 9 23,109,432 24,739,259 15.33 16.28
Inventories 8 17,591,204 18,103,578 11.67 11.92
Cash and cash equivalents 10 4,766,188 3,671,613 3.16 2.42
45,466,824 46,514,450 30.16 30.62
Total assets 104,353,178 107,684,053 69.23 70.88
EQUITY
Capital and reserves attributable to equity holders of
the company
Share capital 11 5,000 5,000 – –
Share premium 11 22,863,735 22,863,735 15.17 15.05
Accumulated loss (18,422,216) (19,637,023) (12.22) (12.93)
Total equity 4,446,519 3,231,712 2.95 2.13
LIABILITIES
Non-current liabilities
Borrowings 14 55,688,008 55,746,678 36.94 36.69
Current liabilities
Trade and other payables 13 21,726,207 28,350,156 14.41 18.66
Borrowings 14 22,492,444 20,355,507 14.92 13.40
44,218,651 48,705,663 29.33 32.06
Total liabilities 99,906,659 104,452,341 66.28 68.75
Total equity and liabilities 104,353,178 107,684,053 69.23 70.88
STATEMENT OF FINANCIAL POSITION AS AT 31 MARCH 2012
Note- The exchange rate used to convert ZAR to Rs. <6.634> / <ZAR> (Rs. <6.582> / <ZAR>)
“The columns in INR are not part of the audited financial statements and the audit opinion does not apply to them.”

304
MARICO SOUTH AFRICA (PROPRIETARY) LIMITED
STATEMENT OF COMPREHENSIVE INCOMEfor the year ended 31 March 2012
2012 2011 2012 2011
Notes R R Rs.Crore Rs.Crore
Revenue 157,263,448 137,813,935 104.33 90.71
Cost of sales (88,938,105) (70,652,366) (59.00) (46.50)
Gross profit 68,325,343 67,161,569 45.33 44.21
Operating expenses (60,879,584) (63,396,235) (40.39) (41.73)
Other income 146,321 308,454 0.10 0.20
Operating profit 2 7,592,080 4,073,788 5.04 2.68
Finance income 4 64,088 157,402 0.04 0.10
Finance costs 4 (5,825,715) (5,634,865) (3.86) (3.71)
Profit/(Ioss) before income tax 1,830,453 (1,403,675) 1.21 (0.92)
Income tax expense 5 (615,646) (285,017) (0.41) (0.19)
Total comprehensive profit/(Ioss) for the year 1,214,807 (1,688,692) 0.81 (1.11)
Note- The exchange rate used to convert ZAR to Rs. <6.634> / <ZAR> (Rs. <6.582> / <ZAR>)
“The columns in INR are not part of the audited financial statements and the audit opinion does not apply to them.”

305
MARICO SOUTH AFRICA (PROPRIETARY) LIMITED
STATEMENT OF CHANGES IN EQUITYfor the year ended 31 March 2012
Share Share Accumulated Total Share Share Accumulated Total
capital premium loss capital premium loss
R R R R Rs.in Rs.in Rs.in Rs.in
Crore Crore Crore Crore
Year ended 31 March 2012
Balance at 1 April 2011 5,000 22,863,735 (19,637,023) 3,231,712 – 15.05 (12.93) 2.13
Total comprehensive profit for the year – – 1,214,807 1,214,807 – 0 0.81 0.81
Balance at 31 March 2012 5,000 22,863,735 (18,422,216) 4,446,519 – 15.17 (12.22) 2.95
Year ended 31 March 2011
Balance at 1 April 2010 5,000 22,863,735 (17,948,331) 4,920,404 – 14.1 (11.07) 3.03
Total comprehensive loss for the year – – (1,688,692) (1,688,692) – – (1.11) (1.11)
Balance at 31 March 2011 5,000 22,863,735 (19,637,023) 3,231,712 – 15.05 (12.93) 2.13
Note- The exchange rate used to convert ZAR to Rs. <6.634> / <ZAR> (Rs. <6.582> / <ZAR>)
“The columns in INR are not part of the audited financial statements and the audit opinion does not apply to them.”

306
MARICO SOUTH AFRICA (PROPRIETARY) LIMITED
STATEMENT OF CASH FLOWSfor the year ended 31 March 2012
2012 2011 2012 2011
Notes R R Rs.Crore Rs.Crore
Cash flow from operating activities
Cash flow from operations 15 4,513,021 1,894,876 2.99 1.25
Finance costs 4 (5,825,715) (5,634,865) (3.86) (3.71)
Finance income 4 64,088 157,402 0.04 0.1
Net cash used in operating activities (1,248,606) (3,582,587) (0.83) (2.36)
Cash flow from investing activities
Additions to property, plant and equipment (737,585) (189,620) (0.49) (0.12)
Additions to intangible assets _ (16,000,000) – (10.53)
Proceeds on disposal of property, plant and equipment 1,002,499 270,000 0.67 0.18
Net cash used in investing activities 264,914 (15,919,620) 0.18 (10.48)
Cash flow from financing activities
Increase in borrowings 2,078,267 20,249,764 1.38 13.33
Net cash generated from financing activities 2,078,267 20,249,764 1.38 13.33
Net increase in cash and cash equivalents 1,094,575 747,557 0.73 0.49
Cash and cash equivalents at beginning of year 3,671,613 2,924,056 2.44 1.92
Cash and cash equivalents at end of year 10 4,766,188 3,671,613 3.16 2.42
Note- The exchange rate used to convert ZAR to Rs. <6.634> / <ZAR> (Rs. <6.582> / <ZAR>)
“The columns in INR are not part of the audited financial statements and the audit opinion does not apply to them.”

307
MARICO SOUTH AFRICA (PROPRIETARY) LIMITED
NOTES TO THE FINANCIAL STATEMENTSfor the year ended 31 March 2012
1 Summary of significant accounting policies
The principle accounting policies applied in the preparation of these financial statements are set out below. These policies
have been consistently applied to all the years presented, unless otherwise stated.
1.1 Basis of preparation
The financial statements have been prepared in accordance with the International Financial Reporting Standards (I FRS). The
financial statements have been prepared under the historical cost convention.
The preparation of the financial statements in conformity with IFRS requires the use of estimates and assumptions that affect
the reported amounts of assets and liabilities and disclosure of contingent assets and liabilities at the date of the financial
statements and the reported amounts of revenues and expenses during the reporting period based on management’s best
knowledge of current events and actions. Actual results may ultimately differ from these estimates. The areas involving a
higher degree of judgment or complexity, or areas where assumptions and estimates are significant to the financial statements,
are disclosed in note 1.21.
1.2 Property, plant and equipment
All property, plant and equipment are stated at historical cost less accumulated depreciation and impairment losses.
Historical cost includes expenditure that is directly attributable to the acquisition of the items.
Subsequent costs are included in the asset’s carrying amount or recognised as a separate asset, as appropriate, only when
it is probable that future economic benefits associated with the item will flow to the company and the cost of the item can be
measured reliably. All other repairs and maintenance are charged to the statement of comprehensive income during the
financial period in which they are incurred.
Depreciation is calculated using the straight-line basis so as to write off the cost of the assets to their residual values over
their expected useful lives. The expected useful lives are as follows:
Leasehold improvements 10 years
Plant and machinery 5 - 15 years
Motor vehicles 3,33 years
Office equipment 5 years
Furniture and fittings 10 years
Computer equipment 5 years
The assets’ residual values and useful lives are reviewed, and adjusted if appropriate, at each statement of financial position
date.
An assets’ carrying amount is written down immediately to its recoverable amount if the asset’s carrying amount is greater
than its estimated recoverable amount (note 1.4).
Gains and losses on disposals are determined by comparing the proceeds with the carrying amount and are recognised in
the statement of comprehensive income.
1.3 Intangible assets
Brands
The useful lives of all intangible assets acquired by the company are assessed to determine if the useful life is finite or
indefinite. Useful lives of intangible assets are reviewed at least at the end of each financial period and altered if estimates
have changed significantly. Any change is accounted for by changing the amortisation charge for the current and future
periods.

308
MARICO SOUTH AFRICA (PROPRIETARY) LIMITED
NOTES TO THE FINANCIAL STATEMENTSfor the year ended 31 March 2012
Intangibles assets with finite useful lives are measured at cost less accumulated amortization and accumulated impairment
losses. Amortisation is recognised in profit or loss on a straight-line basis over the estimate useful lives of intangible assets
from the date that they are available for use.
Intangibles assets with indefinite useful lives are measured at cost and are not amortised, but are tested for impairment at
least annually or whenever any indication of impairment exists.
The following intangible assets currently have an indefinite useful life:
• product registrations; and
• brands
Subsequent expenditure
Subsequent expenditure is capitalised only when it increases the future economic benefits embodied in the specific asset
to which it relates. All other expenditure, including expenditure on internally generated goodwill and brands, is recognised in
profit or loss when incurred.
1.4 Impairment of non-financial assets
Assets that have an indefinite useful life are not subject to amortisation and are tested annually for impairment. Assets that
are subject to amortisation are reviewed for impairment whenever events or changes in circumstances indicate that the
carrying amount may not be recoverable.
An impairment loss is recognised for the amount bywhich the asset’s carrying amount exceeds its recoverable amount. The
recoverable amount is the higher of an asset’s fair value less costs to sell and value in use. For the purposes of assessing
impairment, assets are grouped at the lowest levels for which there are separately identifiable cash flows (cash-generating
units).
1.5 Leased assets
Leases of assets under which all the risks and benefits of ownership are effectively retained by the lessor are classified
as operating leases. Payments made under operating leases are charged to the statement of comprehensive income on a
straight-line basis over the period of the lease. When an operating lease is terminated before the lease period has expired,
any payment required to be made to the lessor by ways of penalty is recognised as an expense in the period in which
termination takes place.
1.6 Inventory
Inventories are stated at the lower of cost and selling price less costs to complete and sell. Cost is determined using the
weighted average cost method. The cost of finished goods and work in progress comprises raw materials, direct labour,
other direct costs and related production overheads (based on normal operating capacity). Net realisable value is the
estimated selling price in the ordinary course of business, less applicable variable selling expenses.
1.7 Financial assets
1.7.1 Classification
The company classifies its financial assets in the following categories: at fair value through profit or loss and loans and
receivables. The classification depends on the purpose for which the financial assets were acquired. Management determines
the classification of its financial assets at initial recognition.
(a) Financial assets at fair value through profit or loss
Financial assets at fair value through profit or loss are financial assets held for trading. A financial asset is classified
in this category if acquired principally for the purpose of selling in the short term. Derivatives are also categorised as
held for trading unless they are designated as hedges. Assets in this category are classified as current assets if
expected to be settled within 12 months; otherwise, they are classified as non-current.

309
MARICO SOUTH AFRICA (PROPRIETARY) LIMITED
NOTES TO THE FINANCIAL STATEMENTSfor the year ended 31 March 2012
(b) Loans and receivables
Loans and receivables are non-derivative financial assets with fixed or determinable payments that are not quoted in
an active market. They are included in current assets, except for maturities greater than 12 months after the end of the
reporting period. These are classified as non-current assets. The company’s loans and receivables comprise ‘trade
and other receivables’ and ‘cash and cash equivalents’ in the statement of financial position (notes 1.9 and 1.10).
1.7.2 Recognition and measurement
Financial assets carried at fair value through profit or loss are initially recognised at fair value, and transaction costs are
expensed in the statement of comprehensive income. Financial assets are derecognised when the rights to receive cash
flows from the investments have expired or have been transferred and the company has transferred substantially all risks
and rewards of ownership. Loans and receivables are subsequently carried at amortised cost using the effective interest
method.
Gains or losses arising from changes in the fair value of the ‘financial assets at fair value through profit or loss’ category are
presented in the statement of comprehensive income within ‘other (losses)/gains - net’ in the period in which they arise.
Dividend income from financial assets at fair value through profit or loss is recognised in the statement of comprehensive
income as part of other income when the company’s right to receive payments is established.
1.8 Impairment of financial assets
(a) Assets carried at amortised cost
The company assesses at the end of each reporting period whether there is objective evidence that a financial asset
or group of financial assets is impaired. A financial asset or a group of financial assets is impaired and impairment
losses are incurred only if there is objective evidence of impairment as a result of one or more events that occurred
after the initial recognition of the asset (a ‘loss event’) and that loss event (or events) has an impact on the estimated
future cash flows of the financial asset or company of financial assets that can be reliably estimated.
Evidence of impairment may include indications that the debtors or a group of debtors is experiencing significant
financial difficulty, default or delinquency in interest or principal payments, the probability that they will enter bankruptcy
or other financial reorganisation, and where observable data indicate that there is a measurable decrease in the
estimated future cash flows, such as changes in arrears or economic conditions that correlate with defaults.
For loans and receivables category, the amount of the loss is measured as the difference between the asset’s carrying
amount and the present value of estimated future cash flows (excluding future credit losses that have not been
incurred) discounted at the financial asset’s original effective interest rate. The carrying amount of the asset is reduced
and the amount of the loss is recognised in the statement of comprehensive income. If a loan has a variable interest
rate, the discount rate for measuring any impairment loss is the current effective interest rate determined under the
contract.
If, in a subsequent period, the amount of the impairment loss decreases and the decrease can be related objectively to
an event occurring after the impairment was recognised, the reversal of the previously recognised impairment loss is
recognised in the statement of comprehensive income.
1.9 Trade receivables
Trade receivables are measured at amortised cost using the effective interest rate method, less provision for impairment. A
provision for impairment of trade receivables is established when there is objective evidence that the group will not be able
to collect all amounts due according to the original terms of the receivables. The amount of the provision is the difference
between the asset’s carrying amount and the present value of estimated future cash flows, discounted at the original
effective interest rate. The carrying amount of the asset is reduced through the use of an allowance account, and the
amount of the loss is recognised in the statement of comprehensive income within ‘selling and marketing costs’. When a trade
receivable is uncollectible, it is written off against the allowance account for trade receivables. Subsequent recoveries of
amounts previously written off are credited in the statement of comprehensive income.
310
MARICO SOUTH AFRICA (PROPRIETARY) LIMITED
NOTES TO THE FINANCIAL STATEMENTSfor the year ended 31 March 2012
1.10 Cash and cash equivalents
Cash and cash equivalents includes cash in hand, deposits held at call with banks, other short-term highly liquid investments
with original maturities of three months or less, and bank overdrafts. Bank overdrafts are shown within borrowings in
current liabilities on the statement of financial position.
1.11 Current and deferred income tax
The tax expense for the period comprises current and deferred tax. Tax is recognised in the statement of comprehensive
income, except to the extent that it relates to items recognised in other comprehensive income or directly in equity. In this
case, the tax is also recognised in other comprehensive income or directly in equity, respectively.
The current income tax charge is calculated on the basis of the tax laws enacted or substantively enacted at the statement
of financial position date in the countries where the company and its subsidiaries operate and generate taxable income.
Management periodically evaluates positions taken in tax returns with respect to situations in which applicable tax regulation
is subject to interpretation. It establishes provisions where appropriate on the basis of amounts expected to be paid to the
tax authorities.
Deferred income tax is recognised, using the liability method, on temporary differences arising between the tax bases of
assets and liabilities and their carrying amounts in the financial statements. However, deferred tax liabilities are not recognised
if they arise from the initial recognition of goodwill; deferred income tax is not accounted for if it arises from initial recognition
of an asset or liability in a transaction other than a business combination that at the time of the transaction affects neither
accounting nor taxable profit or loss. Deferred income tax is determined using tax rates (and laws) that have been enacted
or substantially enacted by the statement of financial position date and are expected to apply when the related deferred
income tax asset is realised or the deferred income tax liability is settled.
Deferred income tax assets are recognised only to the extent that it is probable that future taxable profit will be available
against which the temporary differences can be utilised.
Deferred income tax assets and liabilities are offset when there is a legally enforceable right to offset current tax assets
against current tax liabilities and when the deferred income taxes assets and liabilities relate to income taxes levied by the
same taxation authority on either the same taxable entity or different taxable entities where there is an intention to settle the
balances on a net basis.
1.12 Trade payables
Trade payables are carried initially at the fair value of the consideration to be paid in future for goods or services that have
been received or supplied and invoiced or formally agreed with the supplier, and subsequently measured at amortised cost
using the effective interest rate method.
Employee entitlements to annual leave are recognised when they accrue to employees. An accrual is made for the estimated
liability for annual leave as a result of services rendered by employees up to the statement of financial position.
1.13 Provisions
Provisions are recognised when the company has a present legal or constructive obligation as a result of past events; it is
more likely than not that an outflow of resources will be required to settle the obligation; and the amount has been reliably
estimated. Provisions are not recognised for future operating losses. Where there are a number of similar obligations, the
likelihood that an outflow will be required in settlement is determined by considering the class of obligations as a whole. A
provision is recognised even if the likelihood of an outflow with respect to any one item included in the same class of
obligations may be small.
Provisions are measured at the present value of the expenditures expected to be required to settle the obligation using a
pre-tax rate that reflects current market assessments of the time value of money and the risks specific to the obligation. The
increase in the provision due to passage of time is recognised as interest expense.
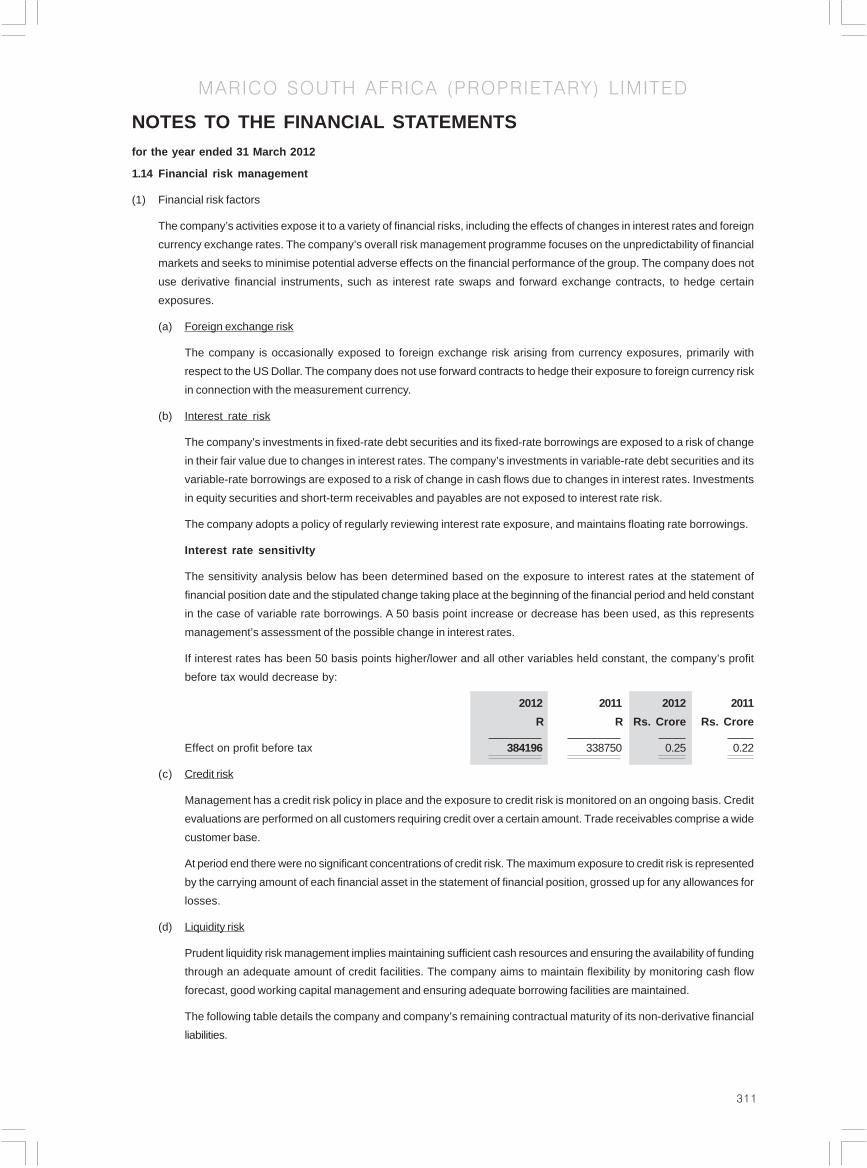
311
MARICO SOUTH AFRICA (PROPRIETARY) LIMITED
NOTES TO THE FINANCIAL STATEMENTSfor the year ended 31 March 2012
1.14 Financial risk management
(1) Financial risk factors
The company’s activities expose it to a variety of financial risks, including the effects of changes in interest rates and foreign
currency exchange rates. The company’s overall risk management programme focuses on the unpredictability of financial
markets and seeks to minimise potential adverse effects on the financial performance of the group. The company does not
use derivative financial instruments, such as interest rate swaps and forward exchange contracts, to hedge certain
exposures.
(a) Foreign exchange risk
The company is occasionally exposed to foreign exchange risk arising from currency exposures, primarily with
respect to the US Dollar. The company does not use forward contracts to hedge their exposure to foreign currency risk
in connection with the measurement currency.
(b) Interest rate risk
The company’s investments in fixed-rate debt securities and its fixed-rate borrowings are exposed to a risk of change
in their fair value due to changes in interest rates. The company’s investments in variable-rate debt securities and its
variable-rate borrowings are exposed to a risk of change in cash flows due to changes in interest rates. Investments
in equity securities and short-term receivables and payables are not exposed to interest rate risk.
The company adopts a policy of regularly reviewing interest rate exposure, and maintains floating rate borrowings.
Interest rate sensitivIty
The sensitivity analysis below has been determined based on the exposure to interest rates at the statement of
financial position date and the stipulated change taking place at the beginning of the financial period and held constant
in the case of variable rate borrowings. A 50 basis point increase or decrease has been used, as this represents
management’s assessment of the possible change in interest rates.
If interest rates has been 50 basis points higher/lower and all other variables held constant, the company’s profit
before tax would decrease by:
2012 2011 2012 2011
R R Rs. Crore Rs. Crore
Effect on profit before tax 384196 338750 0.25 0.22
(c) Credit risk
Management has a credit risk policy in place and the exposure to credit risk is monitored on an ongoing basis. Credit
evaluations are performed on all customers requiring credit over a certain amount. Trade receivables comprise a wide
customer base.
At period end there were no significant concentrations of credit risk. The maximum exposure to credit risk is represented
by the carrying amount of each financial asset in the statement of financial position, grossed up for any allowances for
losses.
(d) Liquidity risk
Prudent liquidity risk management implies maintaining sufficient cash resources and ensuring the availability of funding
through an adequate amount of credit facilities. The company aims to maintain flexibility by monitoring cash flow
forecast, good working capital management and ensuring adequate borrowing facilities are maintained.
The following table details the company and company’s remaining contractual maturity of its non-derivative financial
liabilities.
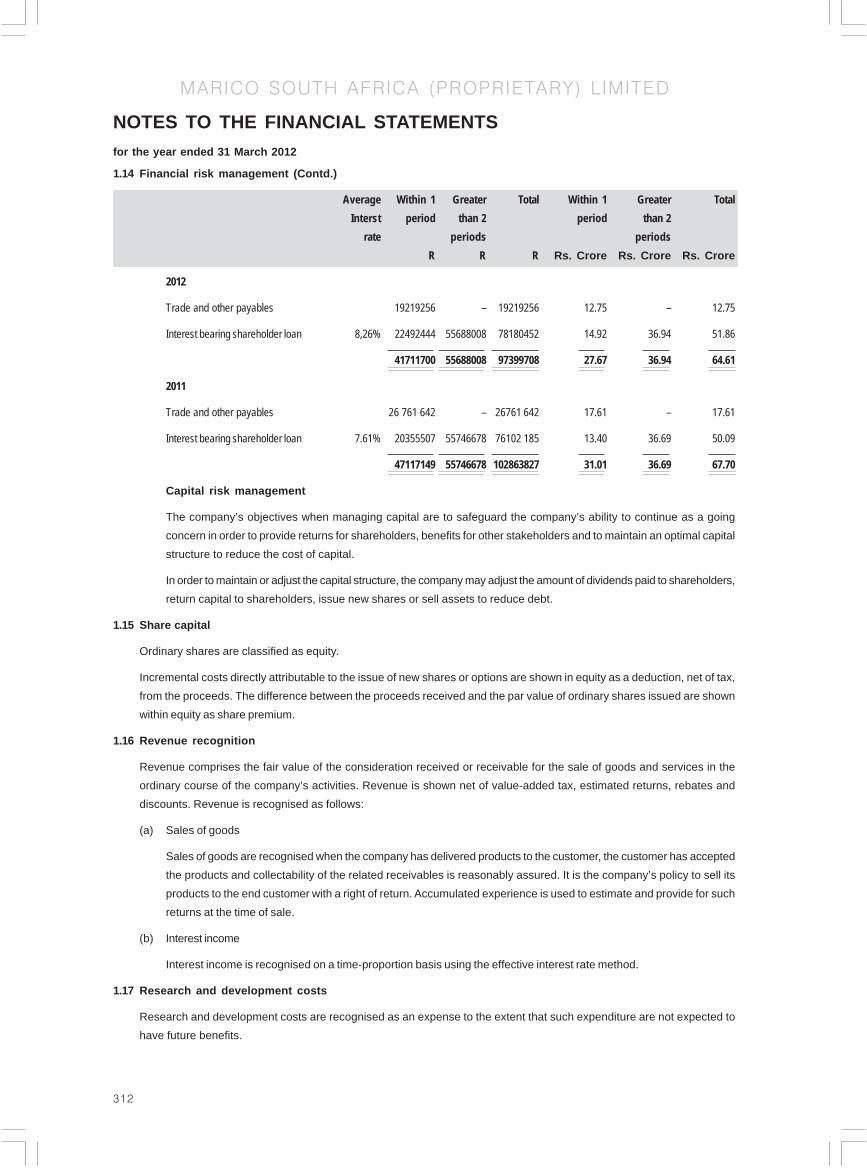
312
MARICO SOUTH AFRICA (PROPRIETARY) LIMITED
NOTES TO THE FINANCIAL STATEMENTSfor the year ended 31 March 2012
1.14 Financial risk management (Contd.)
Average Within 1 Greater Total Within 1 Greater Total
Interst period than 2 period than 2
rate periods periods
R R R Rs. Crore Rs. Crore Rs. Crore
2012
Trade and other payables 19219256 – 19219256 12.75 – 12.75
Interest bearing shareholder loan 8,26% 22492444 55688008 78180452 14.92 36.94 51.86
41711700 55688008 97399708 27.67 36.94 64.61
2011
Trade and other payables 26 761 642 – 26761 642 17.61 – 17.61
Interest bearing shareholder loan 7.61% 20355507 55746678 76102 185 13.40 36.69 50.09
47117149 55746678 102863827 31.01 36.69 67.70
Capital risk management
The company’s objectives when managing capital are to safeguard the company’s ability to continue as a going
concern in order to provide returns for shareholders, benefits for other stakeholders and to maintain an optimal capital
structure to reduce the cost of capital.
In order to maintain or adjust the capital structure, the company may adjust the amount of dividends paid to shareholders,
return capital to shareholders, issue new shares or sell assets to reduce debt.
1.15 Share capital
Ordinary shares are classified as equity.
Incremental costs directly attributable to the issue of new shares or options are shown in equity as a deduction, net of tax,
from the proceeds. The difference between the proceeds received and the par value of ordinary shares issued are shown
within equity as share premium.
1.16 Revenue recognition
Revenue comprises the fair value of the consideration received or receivable for the sale of goods and services in the
ordinary course of the company’s activities. Revenue is shown net of value-added tax, estimated returns, rebates and
discounts. Revenue is recognised as follows:
(a) Sales of goods
Sales of goods are recognised when the company has delivered products to the customer, the customer has accepted
the products and collectability of the related receivables is reasonably assured. It is the company’s policy to sell its
products to the end customer with a right of return. Accumulated experience is used to estimate and provide for such
returns at the time of sale.
(b) Interest income
Interest income is recognised on a time-proportion basis using the effective interest rate method.
1.17 Research and development costs
Research and development costs are recognised as an expense to the extent that such expenditure are not expected to
have future benefits.

313
MARICO SOUTH AFRICA (PROPRIETARY) LIMITED
NOTES TO THE FINANCIAL STATEMENTSfor the year ended 31 March 2012
1.18 Employee benefits
The group operates two retirement benefit schemes. These are both defined contribution funds. A defined contribution fund
is a retirement benefit plan under which the group pays fixed contributions into a separate entity. The group has no legal or
constructive obligations to pay further contributions if the fund does not hold sufficient assets to pay all employees the
benefits relating to employee service in the current and prior periods.
The group pays contributions on a contractual basis and contributions are recognised as an expense when they are due.
1.19 Borrowings
Borrowings are recognised initially at fair value, net of transaction costs incurred. Borrowings are subsequently stated at
amortised cost. Any difference between the proceeds (net of transaction costs) and the redemption value is recognised in
the statement of comprehensive income over the period of the borrowings using the effective interest rate method.
Borrowings are classified as current liabilities unless the group has an unconditional right to defer settlement of the liability
for at least 12 months after the statement of financial position date.
1.20 Changes in accounting policy and disclosures
Standards and amendments to existing standards effective in 2012
There are no IFRS’s or IFRIC interpretations that are effective, that would be expected to have a
material impact on the company.
Standards and amendments issued but not effective for March 2012 year-end
• Amendments to IAS 1, ‘Presentation of Financial Statements’, on presentation of items of OCI.
• IFRS 9 - Financial Instruments (2009).
• IFRS 9 - Financial Instruments (2010).
• Amendment to IFRS 9 - Financial Instruments (2011).
• Amendment to IAS 32 - Financial Instruments: Presentation.
Standards and amendments issued but not effective and not relevant for 31 March 2012
• Amendment to IAS 12,’lncome taxes’ on deferred tax.
• IFRS 12 - Disclosures of interest in other entities.
1.21 Critical accounting estimates and judgements
Estimates and judgments are continually evaluated and are based on historical and other factors, including expectations of
future events that are believed to be reasonable under the circumstances.
1.21.1 Critical accounting estimates and assumptions
The company makes estimates and assumptions concerning the future. The resulting accounting estimates will, by definition,
rarely equal the related actual results. The estimates and assumptions that have a significant risk of causing a material
adjustment to the carrying amounts of assets and liabilities within the next financial year are outlined below.
(a) Estimated impairment of intangible assets
The company tests annually whether intangible assets have suffered any impairment, in accordance with the accounting
policy stated in note 1.3. The recoverable amounts of cash- generating units has been determined based on value-in
use calculations. These calculations require the use of estimates (refer note 7).
If the revised estimated discounting rate applied was 1 % lower/higher than management’s estimates, the company will
not have to recognise an impairment against intangible assets.

314
MARICO SOUTH AFRICA (PROPRIETARY) LIMITED
NOTES TO THE FINANCIAL STATEMENTSfor the year ended 31 March 2012
2012 2011 2012 2011
R R Rs.Crore Rs.Crore
2 Operating profit
2.1 The following items have been charged/( credited)
in arriving at operating profit:
Depreciation on property, plant and equipment 1,114,763 1,236,521 0.74 0.81
(A detailed breakdown of the depreciation expense
is presented in note 6)
Profit on disposal of property, plant and equipment (79,640) (113,740) (0.05) (0.07)
Loss on disposal of intangible asset 367,565 – 0.24 –
Auditor’s remuneration:
Audit fees
- current year provision 360,000 467,004 0.24 0.31
- prior year underprovision 293,541 45,160 0.19 0.03
653,541 512,164 0.43 0.34
Lease rentals
- Buildings 3,411,440 3,418,472 2.26 2.25
- Computers 355,943 214,414 0.24 0.14
3,767,383 3,632,886 2.50 2.39
Directors’ emoluments (refer note 16)
Salaries 1,462,689 3,275,169 0.97 2.16
Other 1,126,635 1,755,616 0.75 1.16
2,589,324 5,030,785 1.72 3.31
Staff costs (see note 3) 18,799,707 14,120,360 12.47 9.29
2.2 Expenses by nature
Depreciation 1,114,763 1,236,521 0.74 0.81
Directors’ emoluments 2,589,324 5,030,785 1.72 3.31
Operating lease rentals 3,767,383 3,632,886 2.50 2.39
Staff costs 18,799,707 14,120,360 12.47 9.29
Cost of sales 88,938,105 71,258,719 59.00 46.90
Commission 4,855,264 4,075,254 3.22 2.68
Advertising 11,474,149 14,495,953 7.61 9.54
Freight 9,066,861 7,625,948 6.01 5.02
Other 9,212,133 12,572,175 6.11 8.28
Total cost of sales and operating expenses 149,817,689 134,048,601 99.39 88.23

315
MARICO SOUTH AFRICA (PROPRIETARY) LIMITED
NOTES TO THE FINANCIAL STATEMENTSfor the year ended 31 March 2012
2012 2011 2012 2011
R R Rs.Crore Rs.Crore
3 Staff costs
Salaries and wages 15,433,476 12,554,853 10.24 8.26
Other 3,366,231 1,565,507 2.23 1.03
18,799,707 14,120,360 12.47 9.29
Average number of persons employed:
Full time 117 116 – –
4 Finance (costs)/income
4.1 Finance income - Bank 64,088 157,402 0.04 0.10
4.2 Finance costs
Related party (refer note 16) (5,825,715) (5,634,865) (3.86) (3.71)
Net finance costs (5,761,627) (5,477,463) (3.82) (3.61)
5 Income tax expense
Deferred tax
current year 296,509 (434,749) 0.20 (0.29)
prior year underprovision 319,137 719,766 0.21 0.47
615,646 285,017 0.41 0.19
The tax on the company profit/(Ioss) before tax differs from the
theoretical amount that would arise using basic rates as follows:
Profit/(loss) before tax 1,830,453 (1,403,675) 1.21 (0.92)
Tax calculated at a rate of 28% 512,527 (393,029) 0.34 (0.26)
Deferred tax - prior year underprovision 319,137 719,766 0.21 0.47
Expenses not deductible for tax (218,018) (41,720) (0.14) (0.03)
Tax charge 615,646 285,017 0.41 0.19
No provision has been made for current taxation as the company has an estimated tax loss of R14,606,510 (2011:R16,337, 712).
The company recognises deferred tax assets to the extent that future taxable profits will be available against which the
unused tax losses and deductible temporary differences can be utilised.

316
MARICO SOUTH AFRICA (PROPRIETARY) LIMITED
NOTES TO THE FINANCIAL STATEMENTSfor the year ended 31 March 2012
6 Property, plant and equipment
Offi
ceO
ffice
furn
iture
and
Cap
ital
furn
iture
and
Cap
ital
Leas
ehol
dPl
ant
and
Mot
orco
mpu
ter
wor
k–in
–Le
aseh
old
Plan
t an
dM
otor
com
pute
rw
ork–
in–
impr
ovem
ents
mac
hine
ryve
hicl
eseq
uipm
ent
prog
ress
Tota
lim
prov
emen
tsm
achi
nery
vehi
cles
equi
pmen
tpr
ogre
ssTo
tal
Gro
upR
RR
RR
RR
s.in
Rs.
inR
s.in
Rs.
inR
s.in
Rs.
in
Cro
reC
rore
Cro
reC
rore
Cro
reC
rore
Year
end
ed 3
1 M
arch
201
2
Ope
ning
net
car
ryin
g am
ount
1,66
4,80
41,
818,
430
25,2
3263
7,86
7–
4,14
6,33
31.
101.
210.
020.
42–
2.75
Addi
tions
–36
9,47
610
8,33
319
3,32
666
,450
737,
585
–0.
250.
070.
130.
040.
49
Dep
recia
tion
(285
,163
)(4
64,3
12)
(46,
130)
(319
,158
)–
(1,1
14,7
63)
(0.1
9)(0
.31)
(0.0
3)(0
.21)
–(0
.74)
Dis
posa
ls–
––
22,8
60–
(22,
860)
––
–0.
02–
(0.0
2)
Clo
sing
net
car
ryin
g am
ount
1,37
9,64
11,
723,
594
87,4
3548
9,17
566
,450
3,74
6,29
50.
921.
140.
060.
320.
042.
49
Cos
t2,
851,
041
5,33
4,70
432
5,38
21,
781,
763
66,4
5010
,359
,340
1.89
3.54
0.22
1.18
0.04
6.87
Accu
mul
ated
dep
reci
atio
n an
d im
pairm
ent
(1,4
71,4
00)
(3,6
11,1
10)
(237
,947
)(1
,292
,588
)–
(6,6
13,0
45)
(0.9
8)(2
.40)
(0.1
6)(0
.86)
–(4
.39)
Clo
sing
net
car
ryin
g am
ount
1,37
9,64
11,
723,
594
87,4
3548
9,17
566
,450
3,74
6,29
50.
921.
140.
060.
320.
042.
49
Dep
reci
atio
n ch
arge
of R
1,11
4,76
3 (2
011:
R1,
236,
521)
has
bee
n ch
arge
d to
ope
ratin
g ex
pens
es. Offi
ceO
ffice
furn
iture
and
Cap
ital
furn
iture
and
Cap
ital
Leas
ehol
dPl
ant
and
Mot
orco
mpu
ter
wor
k–in
–Le
aseh
old
Plan
t an
dM
otor
com
pute
rw
ork–
in–
impr
ovem
ents
mac
hine
ryve
hicl
eseq
uipm
ent
prog
ress
Tota
lim
prov
emen
tsm
achi
nery
vehi
cles
equi
pmen
tpr
ogre
ssT o
tal
Gro
upR
RR
RR
RR
s.in
Rs.
inR
s.in
Rs.
inR
s.in
Rs.
in
Cro
reC
rore
Cro
reC
rore
Cro
reC
rore
Year
end
ed 3
1 M
arch
201
1
Ope
ning
net
car
ryin
g am
ount
1,94
9,96
92,
456,
815
126,
551
418,
752
423,
421
5,37
5,50
81.
281.
620.
080.
280.
283.
54
Addi
tions
–4,
200
–18
5,42
0–
189,
620
––
–0.
12–
0.12
Tran
sfer
––
–39
7,40
7(3
97,4
07)
––
––
0.26
(0.2
6)–
Dis
posa
ls–
(142
,201
)(4
,414
)(9
,645
)(2
6,01
4)(1
82,2
74)
–(0
.09)
–(0
.01)
(0.0
2)(0
.12)
Dep
recia
tion
(285
,165
)(5
00,3
84)
(96,
905)
(354
,067
)–
(1,2
36,5
21)
(0.1
9)(0
.33)
(0.0
6)(0
.23)
–(0
.81)
Clo
sing
net
car
ryin
g am
ount
1,66
4,80
41,
818,
430
25,2
3263
7,86
7–
4,14
6,33
31.
101.
200.
020.
42–
2.73
Cos
t2,
851,
041
5,01
4,02
935
7,04
92,
093,
169
–10
,315
,288
1.88
3.30
0.24
1.38
–6.
79
Accu
mul
ated
dep
reci
atio
n an
d im
pairm
ent
(1,1
86,2
37)
(3,1
95,5
99)
(331
,817
)(1
,455
,302
)–
(6,1
68,9
55)
(0.7
8)(2
.10)
(0.2
2)(0
.96)
–(4
.06)
Clo
sing
net
car
ryin
g am
ount
1,66
4,80
41,
818,
430
25,2
3263
7,86
7–
4,14
6,33
31.
101.
200.
020.
42–
2.73
Com
pany
:
No
item
s of
pro
perty
, pla
nt a
nd e
quip
men
t are
hel
d at
com
pany
leve
l.

317
MARICO SOUTH AFRICA (PROPRIETARY) LIMITED
7 Intangible assets
2012 2011 2012 2011
Brands Total Brands Total
R R Rs.Crore Rs.Crore
Year ended 31 March 2012
Opening carrying amount 49,330,489 49,330,489 32.73 32.73
Disposals (1,267,565) (1,267,565) (0.84) (0.84)
Closing carrying amount 48,062,924 48,062,924 31.88 31.88
Cost 50,062,924 50,062,924 33.21 33.21
Accumulated amortisation (2,000,000) (2,000,000) (1.33) (1.33)
Closing carrying amount 48,062,924 48,062,924 31.88 31.88
Year ended 31 March 2011
Opening carrying amount 33,330,489 33,330,489 21.94 21.94
Additions 16,000,000 16,000,000 10.53 10.53
Closing carrying amount 49,330,489 49,330,489 32.47 32.47
Cost 51,330,489 51,330,489 33.79 33.79
Accumulated amortisation (2,000,000) (2,000,000) (1.32) (1.32)
Closing carrying amount 49,330,489 49,330,489 32.47 32.47
The company has classified its intangible assets as having indefinite useful lives. This conclusion is supported by the fact
that the company is expected to be able to use the brands for the foreseeable future and that the typical product life cycles
for the brands, acquired from public information on estimates of useful lives, indicate that the intangible asset has an
indefinite period of foreseeable usage. This is further supported by the stability of the pharmaceutical and complementary
medicine industry and the strong demand in markets within which these products are marketed and sold.
Detailed impairment testing is performed for the indefinite-life intangible assets annually. The impairment review process is
as follows:
Each period and whenever impairment indicators are present, management calculate the fair value of the asset and record
an impairment loss for the excess of the carrying value over the fair value, if any.
The fair value is generally measured as the net present value of projected cash flows. In addition, a re-evaluation of the
remaining useful life of the asset is performed to determine whether continuing to characterise the asset as having an
indefinite life is appropriate.
The recoverable amounts have been determined based on a value-in-use calculation. The calculation uses a free cash flow
model that discounts the free cash flow available from profit after tax generated by the intangible asset. If the resulting net
present value exceeds the carrying value of the intangible asset, the intangible asset is not impaired. However, if the
resulting net present value is less than the carrying value an impairment charge is raised.
The key assumptions used for the value-in-use calculations are as follows:
Growth rate *1 5.70%
Discount rate *2 8%
*1 Weighted average growth rate used to extrapolate cash flows beyond the budget period.
*2 Post-tax discount rate applied to the cash flow projections.
NOTES TO THE FINANCIAL STATEMENTSfor the year ended 31 March 2012
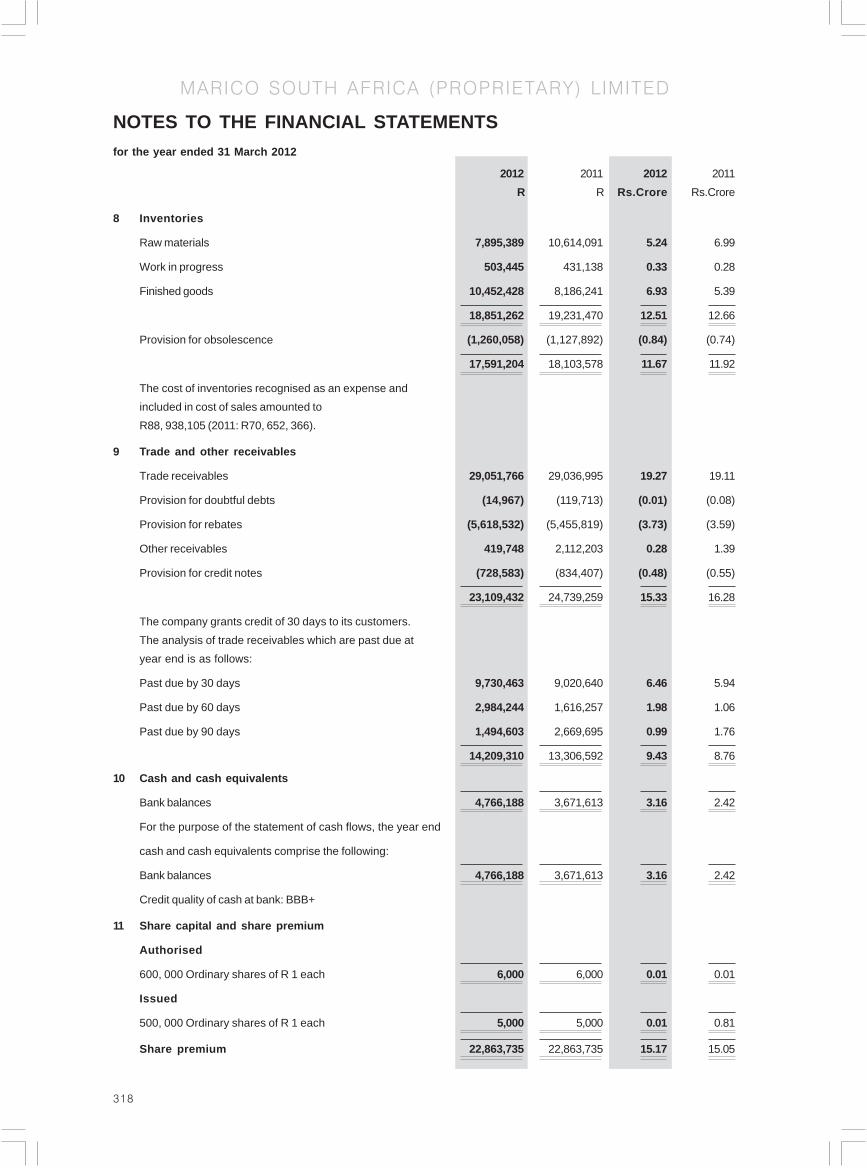
318
MARICO SOUTH AFRICA (PROPRIETARY) LIMITED
NOTES TO THE FINANCIAL STATEMENTSfor the year ended 31 March 2012
2012 2011 2012 2011
R R Rs.Crore Rs.Crore
8 Inventories
Raw materials 7,895,389 10,614,091 5.24 6.99
Work in progress 503,445 431,138 0.33 0.28
Finished goods 10,452,428 8,186,241 6.93 5.39
18,851,262 19,231,470 12.51 12.66
Provision for obsolescence (1,260,058) (1,127,892) (0.84) (0.74)
17,591,204 18,103,578 11.67 11.92
The cost of inventories recognised as an expense and
included in cost of sales amounted to
R88, 938,105 (2011: R70, 652, 366).
9 Trade and other receivables
Trade receivables 29,051,766 29,036,995 19.27 19.11
Provision for doubtful debts (14,967) (119,713) (0.01) (0.08)
Provision for rebates (5,618,532) (5,455,819) (3.73) (3.59)
Other receivables 419,748 2,112,203 0.28 1.39
Provision for credit notes (728,583) (834,407) (0.48) (0.55)
23,109,432 24,739,259 15.33 16.28
The company grants credit of 30 days to its customers.
The analysis of trade receivables which are past due at
year end is as follows:
Past due by 30 days 9,730,463 9,020,640 6.46 5.94
Past due by 60 days 2,984,244 1,616,257 1.98 1.06
Past due by 90 days 1,494,603 2,669,695 0.99 1.76
14,209,310 13,306,592 9.43 8.76
10 Cash and cash equivalents
Bank balances 4,766,188 3,671,613 3.16 2.42
For the purpose of the statement of cash flows, the year end
cash and cash equivalents comprise the following:
Bank balances 4,766,188 3,671,613 3.16 2.42
Credit quality of cash at bank: BBB+
11 Share capital and share premium
Authorised
600, 000 Ordinary shares of R 1 each 6,000 6,000 0.01 0.01
Issued
500, 000 Ordinary shares of R 1 each 5,000 5,000 0.01 0.81
Share premium 22,863,735 22,863,735 15.17 15.05

319
MARICO SOUTH AFRICA (PROPRIETARY) LIMITED
2012 2011 2012 2011
R R Rs.Crore Rs.Crore
12 Deferred income tax assets
Deferred income taxes are calculated on all temporary
differences under the liability method using a principal
tax rate of 28% (2011: 28%).
The movement on the deferred income tax asset
account is as follows:
At beginning of year 7,692,781 7,977,798 5.10 5.25
Current year charge to statement of comprehensive income (615,646) (285,017) (0.41) (0.19)
At end of year 7,077,135 7,692,781 4.69 5.06
Deferred tax assets/(Iiabilities) may be analysed as follows:
Property, plant and equipment (64,584) 51,733 (0.04) 0.03
Other provisions 3,051,896 2,713,323 2.02 1.79
Tax losses carried forward 4,089,823 4,927,725 2.71 3.24
7,077,135 7,692,781 4.69 5.06
13 Trade and other payables
Trade payables 16,540,204 23,292,601 10.97 15.33
Amount due to related party (refer note 16) 158,242 91,354 0.10 0.06
Accruals 1,899,305 2,636,163 1.26 1.74
Audit fee provision 366,080 506,404 0.24 0.33
Bonus provision 1,834,833 1,005,107 1.22 0.66
Leave pay provision 672,118 583,407 0.45 0.38
Other payables 255,425 235,120 0.17 0.15
21,726,207 28,350,156 14.41 18.66
14 Borrowings
Related party (refer note 16)
Non-current portion 55,688,008 55,746,678 36.94 36.69
Current portion 22,492,444 20,355,507 14.92 13.40
78,180,452 76,102,185 51.86 50.09
The loan is unsecured. The non-current portion of the
loan is repayable in four years and bears interest at the
6 month London Interbank Offered Rate plus 7%. The
current portion of the loan is repayable within 12 months
and bears interest at a rate of 9% (2011: 10.5%).
Maturity of borrowings
Due within 1 year 22,492,444 20,355,507 14.92 13.40
Due within 2 - 5 years 55,688,008 55,746,678 36.94 36.69
78,180,452 76,102,185 51.86 50.09
NOTES TO THE FINANCIAL STATEMENTSfor the year ended 31 March 2012

320
MARICO SOUTH AFRICA (PROPRIETARY) LIMITED
NOTES TO THE FINANCIAL STATEMENTSfor the year ended 31 March 2012
2012 2011 2012 2011
R R Rs.Crore Rs.Crore
15 Cash flow from operating activities
Operating profit 7,592,080 4,073,788 5.04 2.68
Adjusted for:
Non-cash items
Depreciation 1,114,763 1,236,521 0.74 0.81
Property, plant and equipment write off – 26,014 – 0.02
Profit on disposal of property, plant and equipment (79,640) (113,740) (0.05) (0.07)
Loss on disposal of intangible asset 367,565 – 0.24 –
Operating profit before working capital changes:
Decrease/(increase) in trade and other receivables 1,629,828 (6,542,252) 1.08 (4.31)
Decrease/(increase) in inventories 512,375 (5,828,542) 0.34 (3.84)
(Decrease)/increase in trade and other payables (6,623,950) 9,043,087 (4.39) 5.95
4,513,021 1,894,876 2.99 1.25
16 Related party transactions
Transactions with related parties:
The following transactions were carried out by the company
with related parties:
Finance costs (refer note 4.2):
Marico South Africa Consumer Care Proprietary Limited 5,825,715 5,634,865 3.86 3.71
Directors’ emoluments (refer note 2) 2,589,324 5,030,785 1.72 3.31
Amounts due to related parties
Amounts due to holding company (refer note 14):
Marico South Africa Consumer Care Proprietary Limited 78,180,452 76,102,185 51.86 50.09
Included in trade payables (refer note 13):
Marico Limited 158,242 91,354 0.10 0.06

321
MARICO SOUTH AFRICA (PROPRIETARY) LIMITED
NOTES TO THE FINANCIAL STATEMENTSfor the year ended 31 March 2012
2012 2011 2012 2011
R R Rs.Crore Rs.Crore
17 Commitments
Operating lease commitments
The future minimum lease payments receivable under non-
cancellable operating leases are as follows:
Within 1 year 1,769,054 1,512,441 1.17 1.00
Between 2 and 5 years 5,971,197 7,013,330 3.96 4.62
Over 5 years – – – –
7,740,251 8,525,771 5.13 5.61
The company leases certain factory facilities under
sub- operating leases. The leases run for a period
of up to 10 years, with an option to renew the lease
after that date.
18 Financial risk management
The company’s financial instruments consist primarily
of deposits with banks, trade accounts receivable
and payable and loans to and from the holding company.
Financial instruments are carried at fair value or
amounts that approximate fair value.
Financial assets
Loans and receivables:
Assets as per the statement of financial position
Trade and other receivables 23,109,432 24,739,259 15.33 16.28
Cash and cash equivalents 4,766,188 3,671,613 3.16 2.42
27,875,620 28,410,872 18.49 18.70
Financial liabilities
Financial liabilities at amortised cost:
Liabilities as per the statement of financial position
Interest bearing liabilities 78,180,452 76,102,185 51.86 50.09
Trade and other payables 19,219,256 26,761,642 12.75 17.61
97,399,708 102,863,827 64.61 67.70
322
M A R I C O M A L A Y S I A S D N . B H D .
Board of Directors Chin Chee Kee, JP
Poh Shiow Mei
Harshraj Charandas Mariwala
Vijay Subramaniam
Registered Offi ce Ground Floor, Lot 7, Block F,
Saguking Commercial Building,
Jalan Patau 87000,
Labuan F.T. Malaysia
Auditors Sundar & Associates
Bankers HSBC Sdn. Bhd.

323
M A R I C O M A L A Y S I A S D N . B H D .
DIRECTORS’ REPORTThe directors have pleasure in submitting their report and the audited fi nancial statements for the fi nancial year ended 31 March 2012.
Principal activities
The principal activity of the Company is as distributor of perfumery, cosmetics, toiletries and related beauty products. There has been no signifi cant change in the nature of this activity during the year.
Financial results
RM
Loss after taxation 1,223,141/–
Reserves and provisions
There were no material transfers to or from reserves or provisions during the fi nancial year.
Issue of shares and debentures
The Company has not issued any shares or debentures during the fi nancial year.
Directorate
The directors in offi ce since the date of last report are:–
DATUK CHIN CHEE KEE, JP
HARSHRAJ CHARANDAS MARIWALA
POH SHIOW MEI (F)
VIJAY SUBRAMANIAM
Particulars of interest in shares of the Company by the directors who held offi ce at the end of the fi nancial year are as follows:
(Ordinary shares of RM 1/– each) As at Bought Sold As at 01/04/2011 31/03/2012
Company
DATUK CHIN CHEE KEE, JP – – – –
HARSHRAJ CHARANDAS MARIWALA – – – –
POH SHIOW MEI (F) – – – –
VIJAY SUBRAMANIAM – – – –
(Ordinary shares of INR 1/– each) As at Bought Sold As at 01/04/2011 31/03/2012
Marico Limited
HARSHRAJ CHARANDAS MARIWALA 23,254,600 – – 23,254,600
The Director retiring by rotation is Datuk Chin Chee Kee, JP who being eligible, offer himself for re–election.
Directors’ benefi ts
Neither at the end of the fi nancial year, nor at any time during the year, did there subsist any arrangement to which the Company was a party whereby the directors might acquire benefi ts by means of the acquisition of shares in, or debentures of the Company or any other body corporate.

324
M A R I C O M A L A Y S I A S D N . B H D .
Since the end of the previous fi nancial period, no director has received or become entitled to receive a benefi t by reason of a contract made by the Company or a related corporation with the director or with a fi rm of which he is a member, or with a Company in which he has a substantial fi nancial interest.
Other statutory information
(a) Before the income statement and balance sheet were made out, the directors took reasonable steps :–
(i) to ascertain that action had been taken in relation to the writing off of bad debts and the making of provision for doubtful debts and satisfi ed themselves that there were no known bad debts and that no provision for doubtful debts was necessary; and
(ii) to ensure that any current assets which were unlikely to be realised in the ordinary course of business including their value as shown in the accounting records of the Company have been written down to an amount which they might be expected so to realise.
(b) At the date of this report, the directors are not aware of any circumstances:
(i) which would render it necessary to write off any bad debts or to make any provisions for doubtful debts in respect of the fi nancial statements of the Company; and
(ii) which would render the values attributed to current assets in the fi nancial statements of the Company misleading, or
(iii) which have arisen which render adherence to the existing method of valuation of assets or liabilities of the Company misleading or inappropriate.
(c) At the date of this report, there does not exist:
(i) any charge on the assets of the Company which has arisen since the end of the fi nancial year which secures the liabilities of any other person.
(ii) any contingent liability of the Company which has arisen since the end of the fi nancial year.
(d) No contingent or other liability has become enforceable or is likely to become enforceable within the period of twelve months after the end of the fi nancial year which, in the opinion of the directors, will or may substantially affect the ability of the Company to meet its obligations as and when they fall due.
(e) At the date of this report, the directors are not aware of any circumstances not otherwise dealt with in this report or the fi nancial statements which would render any amount stated in the fi nancial statements misleading.
(f) In the opinion of the directors,
(i) the results of the Company’s operations during the fi nancial year were not substantially affected by any item, transaction or event of a material and unusual nature;
(ii) there has not arisen in the interval between the end of the fi nancial year and the date of this report any item, transaction or event of a material and unusual nature likely to affect substantially the results of the operations of the Company for the current fi nancial year.
Ultimate holding company
The directors regard Marico Limited, a company incorporated in India, as the ultimate holding company of the Company.
Auditors
Messrs. Sundar & Associates have indicated their willingness to continue in offi ce.
Signed on behalf of the Board of Directors in accordance with a resolution of the Directors dated 13 April 2012.
DATUK CHIN CHEE KEE, JP POH SHIOW MEI(F)Director Director

325
M A R I C O M A L A Y S I A S D N . B H D .
STATEMENT BY DIRECTORSPursuant to Section 169 (15) of the Companies Act, 1965
We, Datuk Chin Chee Kee, JP and Poh Shiow Mei (F), being two of the directors of MARICO MALAYSIA SDN BHD., do hereby state that, in the opinion of the directors , the accompanying balance sheet and statements of income, cash fl ows and changes in equity are drawn up in accordance with MASB approved accounting standards for private entities and the provisions of the Companies Act, 1965 so as to give a true and fair view of the state of affairs of the Company as at 31 March 2012 and of the results and the cash fl ows of the Company for the year then ended.
DATUK CHIN CHEE KEE, JP POH SHIOW MEI(F)Director Director
Petaling Jaya
STATUTORY DECLARATIONI, Poh Shiow Mei (F), being the director primarily responsible for the accounting records and fi nancial management of MARICO MALAYSIA SDN BHD., do solemnly and sincerely declare that the accompanying balance sheet and statements of income, cash fl ows and changes in equity are to the best of my knowledge and belief correct and I make this solemn declaration conscientiously believing the same to be true, and by virtue of the provisions of the Statutory Declarations Act, 1960.
Subscribed and solemnly declared by
the abovenamed at Federal Territory of Labuan POH SHIOW MEI (F)
this day of 13 April 2012 Before me,

326
M A R I C O M A L A Y S I A S D N . B H D .
AUDITORS’ REPORTIndependent Auditors’ Report to the Members of MARICO MALAYSIA SDN. BHD. (881499–V)
Report on the Financial Statements
We have audited the fi nancial statements of MARICO MALAYSIA SDN. BHD. which comprise the balance sheet as at 31 March 2012, and the income statement, statements of changes in equity and cash fl ow statements for the year then ended, and a summary of signifi cant accounting policies and other explanatory information, as set out on pages 8 to 21.
Directors’ Responsibility for the Financial Statements
The directors of the Company are responsible for the preparation of fi nancial statements that give a true and fair view in accordance with Private Entities Reporting Standards and the Companies Act 1965 in Malaysia, and for such internal control as the directors determine are necessary to enable the preparation of fi nancial statements that are free from material misstatement, whether due to fraud or error.
Auditors’ Responsibility
Our responsibility is to express an opinion on these fi nancial statements based on our audit. We conducted our audit in accordance with approved standards on auditing in Malaysia. Those standards require that we comply with ethical requirements and plan and perform the audit to obtain reasonable assurance about whether the fi nancial statements are free from material misstatement.
An audit involves performing procedures to obtain audit evidence about the amounts and disclosures in the fi nancial statements. The procedures selected depend on our judgement, including the assessment of risks of material misstatement of the fi nancial statements, whether due to fraud or error. In making those risk assessments, we consider internal control relevant to the entity’s preparation of fi nancial statements that give a true and fair view in order to design audit procedures that are appropriate in the circumstances, but not for the purpose of expressing an opinion on the effectiveness of the entity’s internal control. An audit also includes evaluating the appropriateness of accounting policies used and the reasonableness of accounting estimates made by the directors, as well as evaluating the overall presentation of the fi nancial statements.
We believe that the audit evidence we have obtained is suffi cient and appropriate to provide a basis for our audit opinion.
Opinion
In our opinion, the fi nancial statements have been properly drawn up in accordance with Private Entities Reporting Standards and the Companies Act 1965 in Malaysia so as to give a true and fair view of the fi nancial position of the Company as of 31 March 2012 and of its fi nancial performance and cash fl ows for the period then ended.
Report on Other Legal and Regulatory Requirements
In accordance with the requirements of the Companies Act 1965 in Malaysia, we also report that in our opinion the accounting and other records and the registers required by the Act to be kept by the Company have been properly kept in accordance with the provisions of the Act.
Other Matters
This report is made solely to the members of the Company, as a body, in accordance with Section 174 of the Companies Act 1965 in Malaysia and for no other purpose. We do not assume responsibility to any other person for the content of this report.
SUNDAR & ASSOCIATES SUNDARASAN A/L ARUMUAF No: 1127Chartered Accountants (M)
SUNDARASAN A/L ARUMUGAM1876/02/14(J/PH)Chartered Accountant (M)
Petaling Jaya
Date : 13 April 2012
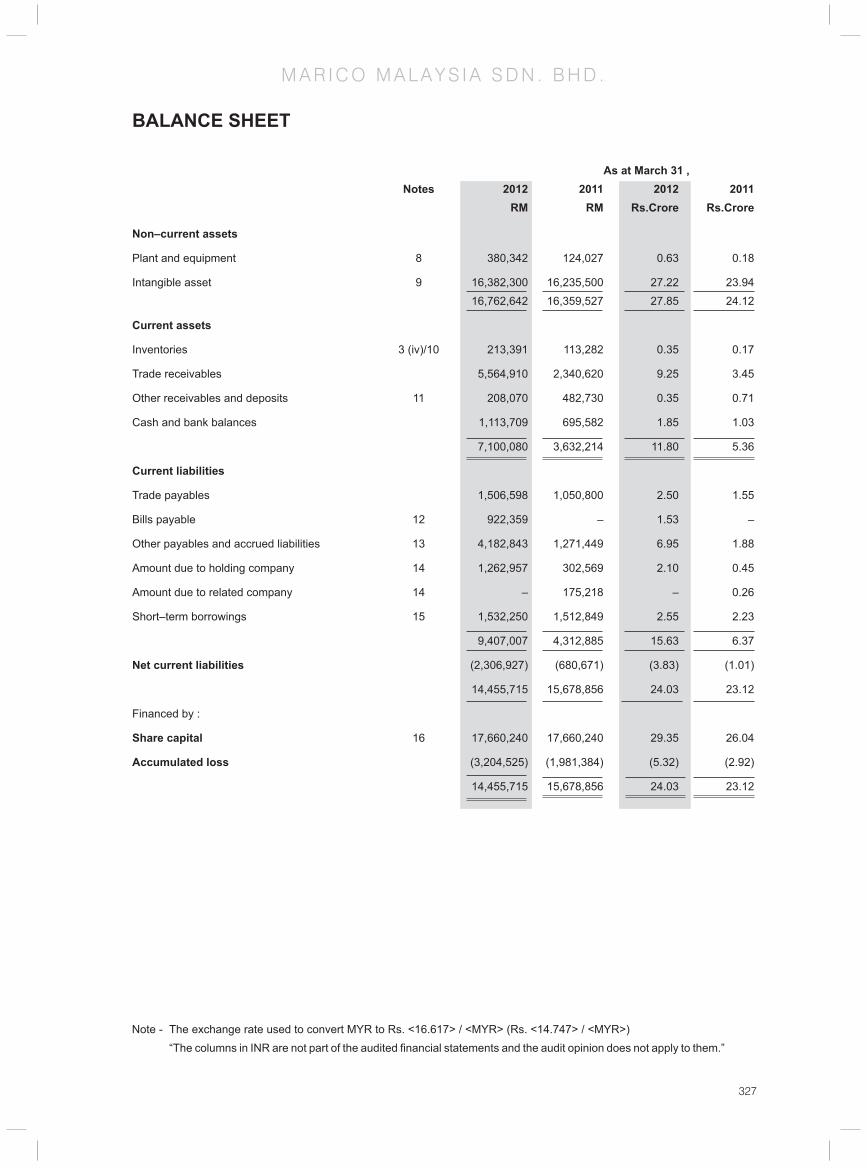
327
M A R I C O M A L A Y S I A S D N . B H D .
BALANCE SHEET
As at March 31 , Notes 2012 2011 2012 2011 RM RM Rs.Crore Rs.Crore
Non–current assets
Plant and equipment 8 380,342 124,027 0.63 0.18
Intangible asset 9 16,382,300 16,235,500 27.22 23.94 16,762,642 16,359,527 27.85 24.12
Current assets
Inventories 3 (iv)/10 213,391 113,282 0.35 0.17
Trade receivables 5,564,910 2,340,620 9.25 3.45
Other receivables and deposits 11 208,070 482,730 0.35 0.71
Cash and bank balances 1,113,709 695,582 1.85 1.03
7,100,080 3,632,214 11.80 5.36
Current liabilities
Trade payables 1,506,598 1,050,800 2.50 1.55
Bills payable 12 922,359 – 1.53 –
Other payables and accrued liabilities 13 4,182,843 1,271,449 6.95 1.88
Amount due to holding company 14 1,262,957 302,569 2.10 0.45
Amount due to related company 14 – 175,218 – 0.26
Short–term borrowings 15 1,532,250 1,512,849 2.55 2.23
9,407,007 4,312,885 15.63 6.37
Net current liabilities (2,306,927) (680,671) (3.83) (1.01)
14,455,715 15,678,856 24.03 23.12
Financed by :
Share capital 16 17,660,240 17,660,240 29.35 26.04
Accumulated loss (3,204,525) (1,981,384) (5.32) (2.92)
14,455,715 15,678,856 24.03 23.12
Note - The exchange rate used to convert MYR to Rs. <16.617> / <MYR> (Rs. <14.747> / <MYR>) “The columns in INR are not part of the audited fi nancial statements and the audit opinion does not apply to them.”

328
M A R I C O M A L A Y S I A S D N . B H D .
Year ended March 31,
Notes 2012 2011 2012 2011 RM RM Rs.Crore Rs.Crore
Revenue 3(ii) 13,216,878 11,325,319 21.96 16.70
Cost of sales (7,705,743) (6,520,039) (12.80) (9.62)
Gross profi t 5,511,135 4,805,280 9.16 7.08
Other income 18,138 130,955 0.03 0.19
Staff costs 5 (1,018,033) (468,350) (1.69) (0.69)
Depreciation (105,072) (17,983) (0.17) (0.03)
Other operating expenses (5,530,018) (6,407,549) (9.19) (9.45)
Operating loss (1,123,850) (1,957,647) (1.86) (2.90)
Finance cost (99,291) (23,737) (0.16) (0.04)
Loss before taxation 6 (1,223,141) (1,981,384) (2.02) (2.94)
Taxation 7 – – – –
Loss after taxation (1,223,141) (1,981,384) (2.02) (2.94)
INCOME STATEMENT(with comparatives for the period from the date of incorporation 04/12/2009 to 31/03/2011)
Note - The exchange rate used to convert MYR to Rs. <16.617> / <MYR> (Rs. <14.747> / <MYR>) “The columns in INR are not part of the audited fi nancial statements and the audit opinion does not apply to them.”

329
M A R I C O M A L A Y S I A S D N . B H D .
STATEMENT OF CHANGES IN EQUITY(with comparatives for the period from the date of incorporation 04/12/2009 to 31/03/2011)
Year ended March 31, 2012 Share (Accumulated) Capital losses Total RM RM RM
Balance as at 01 April 2011 17,660,240 (1,981,384) 15,678,856
Loss after taxation – (1,223,141) (1,223,141)
Balance as at 31 March 2012 17,660,240 (3,204,525) 14,455,715
On incorporation – subscribers’ shares 2 – 2
Issue of shares 17,660,238 – 17,660,238
Loss after taxation – (1,981,384) (1,981,384)
Balance as at 31 March 2011 17,660,240 (1,981,384) 15,678,856
Share (Accumulated) Capital losses Total Rs.Crore Rs.Crore Rs.Crore
Balance as at 01 April 2011 29.35 (3.29) 26.05
Loss after taxation – (2.03) (2.03)
Balance as at 31 March 2012 29.35 (5.32) 24.02
On incorporation – subscribers’ shares – – –
Issue of shares 29.35 – 29.35
Loss after taxation – (3.29) (3.29)
Balance as at 31 March 2011 29.35 (3.29) 26.06
Note - The exchange rate used to convert MYR to Rs. <16.617> / <MYR> (Rs. <14.747> / <MYR>) “The columns in INR are not part of the audited fi nancial statements and the audit opinion does not apply to them.”
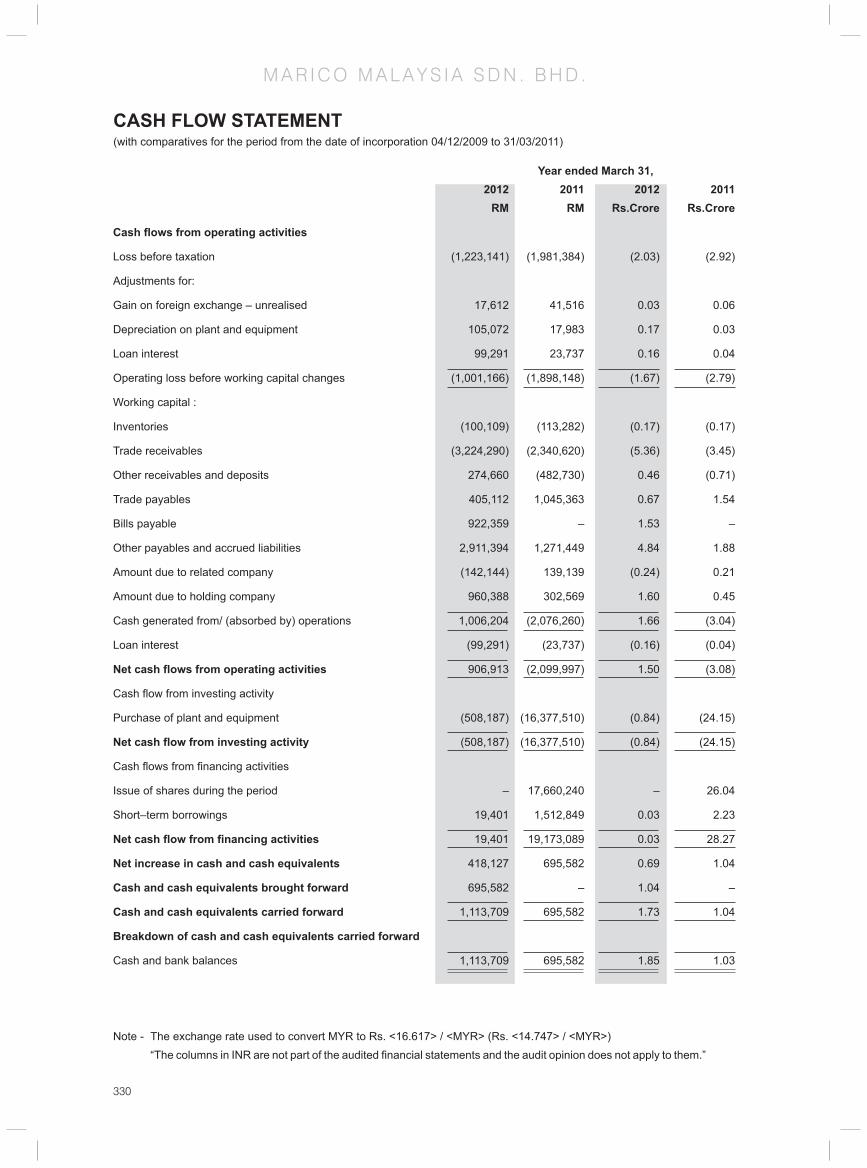
330
M A R I C O M A L A Y S I A S D N . B H D .
Year ended March 31, 2012 2011 2012 2011 RM RM Rs.Crore Rs.Crore
Cash fl ows from operating activities
Loss before taxation (1,223,141) (1,981,384) (2.03) (2.92)
Adjustments for:
Gain on foreign exchange – unrealised 17,612 41,516 0.03 0.06
Depreciation on plant and equipment 105,072 17,983 0.17 0.03
Loan interest 99,291 23,737 0.16 0.04
Operating loss before working capital changes (1,001,166) (1,898,148) (1.67) (2.79)
Working capital :
Inventories (100,109) (113,282) (0.17) (0.17)
Trade receivables (3,224,290) (2,340,620) (5.36) (3.45)
Other receivables and deposits 274,660 (482,730) 0.46 (0.71)
Trade payables 405,112 1,045,363 0.67 1.54
Bills payable 922,359 – 1.53 –
Other payables and accrued liabilities 2,911,394 1,271,449 4.84 1.88
Amount due to related company (142,144) 139,139 (0.24) 0.21
Amount due to holding company 960,388 302,569 1.60 0.45
Cash generated from/ (absorbed by) operations 1,006,204 (2,076,260) 1.66 (3.04)
Loan interest (99,291) (23,737) (0.16) (0.04)
Net cash fl ows from operating activities 906,913 (2,099,997) 1.50 (3.08)
Cash fl ow from investing activity
Purchase of plant and equipment (508,187) (16,377,510) (0.84) (24.15)
Net cash fl ow from investing activity (508,187) (16,377,510) (0.84) (24.15)
Cash fl ows from fi nancing activities
Issue of shares during the period – 17,660,240 – 26.04
Short–term borrowings 19,401 1,512,849 0.03 2.23
Net cash fl ow from fi nancing activities 19,401 19,173,089 0.03 28.27
Net increase in cash and cash equivalents 418,127 695,582 0.69 1.04
Cash and cash equivalents brought forward 695,582 – 1.04 –
Cash and cash equivalents carried forward 1,113,709 695,582 1.73 1.04
Breakdown of cash and cash equivalents carried forward
Cash and bank balances 1,113,709 695,582 1.85 1.03
CASH FLOW STATEMENT(with comparatives for the period from the date of incorporation 04/12/2009 to 31/03/2011)
Note - The exchange rate used to convert MYR to Rs. <16.617> / <MYR> (Rs. <14.747> / <MYR>) “The columns in INR are not part of the audited fi nancial statements and the audit opinion does not apply to them.”
331
M A R I C O M A L A Y S I A S D N . B H D .
NOTES TO THE FINANCIAL STATEMENTSFor the year ended 31 March 2012
1. Corporate information
The Company is a private limited liability company, incorporated and domiciled in Malaysia.
The registered offi ce of the Company is located at Ground Floor, Lot 7, Block F, Saguking Commercial Building, Jalan Patau–Patau,87000 Labuan Ft and the principal place of business is located at 806 Block A, Phileo Damansara 1, No 9, Jalan 16/11, Jalan Damansara, 46350 Petaling Jaya, Selangor.
2. Date of authorisation of issue
The fi nancial statements were authorised for issue by the Board of Directors on 13 April, 2012
3. Signifi cant accounting policies
(i) Basis of preparation
The fi nancial statements comply with applicable approved accounting standards for private entities issued by the Malaysian Accounting Standards Board and the provisions of the Companies Act, 1965.
The fi nancial statements have been prepared under the historical cost convention.
(ii) Revenue recognition
Revenue is recognised when it is probable that the economic benefi ts associated with the transaction will fl ow to the enterprise and the amount of the revenue can be measured reliably.
Sale of goods
Revenue is recognised upon delivery of goods and customers’ acceptance and where applicable, net of returns and trade discounts.
(iii) Plant and equipment
Plant and equipment is stated at cost less accumulated depreciation and impairment loss.
Depreciation on plant and equipment is calculated on a straight – line method based on the estimated useful lives of the assets.
The principal annual rates of depreciation used are as follows:
Computer 33.33%
Furniture and fi ttings 33.33%
Offi ce equipment 33.33%
Moulds 20%
Motor vehicles 27%
Plant and equipment is written down to recoverable amount if, the recoverable amount is less than their carrying value. Recoverable amount is the higher of an asset’s net selling price and its value in use.
(iv) Inventories
Inventories comprises of trading merchandise which are valued at the lower of cost and net realisable value. Cost is determined on fi rst– in, fi rst – out method. Costs of trading merchandise comprise the cost of purchase plus the cost of bringing the inventories to their present location and condition.
(v) Income tax
Income tax on the profi t or loss for the year comprises current and deferred tax. Current tax is the expected amount of income taxes payable in respect of the taxable profi t for the year and is measured using the tax rates that have been enacted at balance sheet date.
332
M A R I C O M A L A Y S I A S D N . B H D .
NOTES TO THE FINANCIAL STATEMENTSFor the year ended 31 March 2012
Deferred tax is provided for, using the liability method, on temporary differences at the balance sheet date between the tax bases of assets and liabilities and their carrying amounts in the fi nancial statements. In principle, deferred tax liabilities are recognised for all taxable temporary differences and deferred tax assets are recognised for all deductible temporary differences, unused tax losses and unused tax credits to the extent that it is probable that taxable profi t will be available against which the deductible temporary differences, unused tax losses and unused tax credits can be utilised.
Deferred tax measured at the tax rates that are expected to apply in the period when the asset is realised or the liability is settled, based on the tax rates that have been enacted or substantively enacted at the balance sheet date.
Deferred tax is recognised in the income statement, except when it arises from a transaction which is recognised directly in equity.
(vi) Provisions
Provisions are recognised when the Company has a present legal and constructive obligation as a result of a past event, when it is probable that an outfl ow of resources embodying economic benefi ts will be required to settle the obligation, and when a reliable estimate can be made of the amount of the obligation.
(vii) Cash and cash equivalents
Cash comprises of cash and bank balances. Cash equivalents comprises of investments maturing within three months from the date of acquisition and which are readily convertible to known amount of cash which are subject to an insignifi cant risk of change in value.
(viii) Receivables
Trade and other receivables are carried at anticipated realisable value. Bad debts are written off in the period in which they are identifi ed. An estimate is made for doubtful debts based on review of all outstanding amounts at the year end.
(ix) Payables
Payables are stated at cost which is the consideration to be paid in the future for products and services received.
(x) Intangible assets
Trademarks acquired are measured at cost less any accumulated impairment losses. Trademarks with indefi nite useful lives are not amortised but is tested for impairment annually and whenever there is an indication that the asset may be impaired.
(xi) Impairment of assets
The carrying values of assets excluding inventories, deferred tax assets, assets arising from employee benefi ts and fi nancial assets are reviewed for impairment when there is an indication that the assets might be impaired. Impairment is measured by comparing the carrying values of the assets with their recoverable amounts. The recoverable amount is the higher of an asset’s net selling price and its value in use, which is measured by reference to discounted future cash fl ows. Recoverable amounts are estimated for individual assets, or if it not possible, for the cash–generating unit.
An impairment loss is charged to the income statement immediately, unless the asset is carried at revalued amount. Any impairment loss of a revalued asset is treated as a revaluation decrease to the extent of previously recognised revaluation surplus for the same asset.
Subsequent increase in the recoverable amount of an asset is treated as reversal of the previous impairment loss and is recognised to the extent of the carrying amount of the asset that would have been determined (net of amortisation and depreciation) had no impairment loss been recognised. The reversal is recognised in the income statement

333
M A R I C O M A L A Y S I A S D N . B H D .
NOTES TO THE FINANCIAL STATEMENTSFor the year ended 31 March 2012
immediately, unless the asset is carried at revalued amount. A reversal of an impairment loss on a revalued asset is credited directly to revaluation surplus. However, to the extent that an impairment loss on the same revalued asset was previously recognised as an expense in the income statement, a reversal of that impairment loss is recognised as income in the income statement.
(xii) Currency conversion
Transactions in foreign currencies are translated to Malaysian Ringgit at rates of exchange ruling at the date of transaction. Monetary assets and liabilities denominated in foreign currencies are translated at the rates of exchange ruling at the balance sheet date. Foreign exchange differences arising on translation are recognised in the income statement.
The principal closing rates used in translation of foreign currency amount are as follows:
2012 2011 RM RM
United States Dollar 3.0645 3.025
Singapore Dollar 2.441 2.400
(xiii) Borrowings
Borrowings are reported at their face value.
All borrowing costs are charged to the income statement in the period in which they are incurred.
(xiv) Employment benefi t
a. Short term benefi ts
Wages, salaries, bonuses and social security contributions are recognised as an expense in the fi nancial year in which the associated services are rendered by employees of the Company. Short term accumulating compensated absences such as paid annual leave are recognised when services are rendered by employees that increase their entitlement to future compensated absences, and short term non–accumulating compensated absences such as sick leave are recognised when the absences occurred.
b. Defi ned contribution plan
As required by law, companies in Malaysia make contributions to the Employee Provident Fund (EPF). Such contributions are recognised as an expense in the income statement as incurred
4. Principal activity
The principal activity of the Company is as distributor of perfumery, cosmetics, toiletries and related beauty products.
5. Staff cost
2012 2011 2012 2011 RM RM Rs.Crore Rs.Crore
Salaries, bonuses and allowance 1,012,605 468,350 1.68 0.04
Contribution to defi ned contribution plan 4,860 – 0.01 –
Other employees benefi ts 568 – – –
1,018,033 468,350 1.69 0.78

334
M A R I C O M A L A Y S I A S D N . B H D .
NOTES TO THE FINANCIAL STATEMENTSFor the year ended 31 March 2012
6. Loss before taxation
Loss before taxation is stated after charging:–
2012 2011 2012 2011 RM RM Rs.Crore Rs.Crore
Loan interest 99,291 23,737 0.16 0.04
Provision of closure costs 77,000 – 0.13 –
Loss on foreign exchange – realised 61,670 5,092 0.10 0.01
Rental of offi ce 51,780 50,400 0.09 0.08
Auditors’ remuneration 8,000 5,000 0.01 0.01
and crediting :–
Gain on foreign exchange – unrealised 17,612 41,516 0.03 0.07
Interest income 526 – – –
Gain on foreign exchange – realised – 89,439 – 0.15
7. Taxation
Tax charge for the year is as follows:
2012 2011 2012 2011 RM RM Rs.Crore Rs.Crore
Transferred to deferred taxation (note 16)
– Deferred tax liabilities 2,488,760 823,735 4.14 1.37
– Deferred tax assets (2,488,760) (823,735) (4.14) (1.37)
A reconciliation of income tax expense applicable to loss before taxation at the statutory income tax rate to income tax expense at the effective income tax rate of the Company is as follows:
2012 2011 2012 2011 RM RM Rs.Crore Rs.Crore
Loss before taxation (1,223,141) (1,981,384) (2.03) (3.29)
Tax at Malaysian statutory tax rate of 25% (305,785) (495,346) (0.51) (0.82)
Expenses not deductible for tax purposes 28,401 8,721 0.05 0.01
Non taxable income (4,403) (10,379) (0.01) (0.02)
Double deduction (9,764) – (0.02) –
Deferred tax assets not recognised 91,680 399,585 0.15 0.66
Proportion of loss in respect of overlapping year 199,871 97,419 0.33 0.16
Tax expense for the period – – – –
Subject to agreement of the Inland Revenue Board, the Company has the following available for set–off against future taxable income.
2012 2011 2012 2011 RM RM Rs.Crore Rs.Crore
Unutilised tax losses 10,078,096 1,580,356 16.75 2.63
Unutilised capital allowances 3,029,242 3,312,925 5.03 5.51
13,107,338 4,893,281 21.78 8.13

335
M A R I C O M A L A Y S I A S D N . B H D .
8. Plant and equipment
Cost Furniture and Computer Offi ce Motor Moulds Total fi ttings equipment vehicles RM RM RM RM RM RM
On incorporation 3,768 3,790 43,200 91,252 – 142,010
Addition – 8,338 – – 353,049 361,387
Disposal – – – – – –
Balance carried forward 3,768 12,128 43,200 91,252 353,049 503,397
Accumulated depreciation
On incorporation 628 631 8,400 8,324 – 17,983
Current charge 1,256 3,493 14,400 15,313 70,610 105,072
Depreciation on disposal – –– – – – –
Balance carried forward 1,884 4,124 22,800 23,637 70,610 123,055
Net book value
2012 1,884 8,004 20,400 67,615 282,439 380,342
2011 3,140 3,159 34,800 82,928 – 124,027
Cost Furniture and Computer Offi ce Motor Moulds Total fi ttings equipment vehicles Rs.Crore Rs.Crore Rs.Crore Rs.Crore Rs.Crore Rs.Crore
On incorporation 0.01 0.01 0.07 0.15 – 0.24
Addition – 0.01 – – 0.59 0.60
Disposal – – – – – –
Balance carried forward 0.01 0.02 0.07 0.15 0.59 0.84
Accumulated depreciation
On incorporation – – 0.01 0.01 – 0.02
Current charge – 0.01 0.02 0.03 0.12 0.18
Depreciation on disposal – – – – – –
Balance carried forward – 0.01 0.03 0.04 0.12 0.20
Net book value
2012 – 0.01 0.03 0.11 0.47 0.62
2011 0.01 0.01 0.06 0.14 – 0.22
NOTES TO THE FINANCIAL STATEMENTSFor the year ended 31 March 2012

336
M A R I C O M A L A Y S I A S D N . B H D .
9. Intangible assets
Trademark Trademark 2012 2011 2012 2011 RM RM Rs.Crore Rs.Crore
Cost
Balance brought forward / on incorporation 16,235,500 – 26.98 –
Acquisition 146,800 16,235,500 0.24 26.98
At 31 March 16,382,300 16,235,500 27.22 26.98
Trademarks related to the “Code 10” brand name were acquired by way of an assignment of full and absolute rights thereto from the registered proprietor. As those rights were assigned without a specifi ed time frame and management believes that is no foreseeable limit to the period over which the brand is expected to generate cash infl ows for the Company, the trademarks were assessed as having an indefi nite useful life subject to use in good faith.
10. Inventories 2012 2011 2012 2011 RM RM Rs.Crore Rs.Crore
At costs :
Consumables – 15,457 – 0.03
Trading merchandise 213,391 97,825 0.35 0.16
213,391 113,282 0.35 0.19
11. Other receivables and deposits 2012 2011 2012 2011 RM RM Rs.Crore Rs.Crore
Other receivables – 289,660 - 0.48
Deposits 208,070 193,070 0.35 0.32
208,070 482,730 0.35 0.80
12. Credit facility 2012 2011 2012 2011 RM RM Rs.Crore Rs.Crore
The credit facility consists of the following :
Trade bills 1,500,000 – 2.49 –
The facility is secured as follows :
i) Standby letter of credit for up to USD 550,000 or other currency equivalent thereof from HSBC India Ltd.
ii) Trade Financing General Agreement from the Company.
The interest rate charged on the facility during the year is 1.25% over the bank’s prescribed base lending rate.
13. Other payables and accrued liabilities 2012 2011 2012 2011 RM RM Rs.Crore Rs.Crore
Other payables 129,601 53,916 0.22 0.09
Accrued expenses 4,053,242 1,217,533 6.74 2.02 4,182,843 1,271,449 6.95 2.11
NOTES TO THE FINANCIAL STATEMENTSFor the year ended 31 March 2012
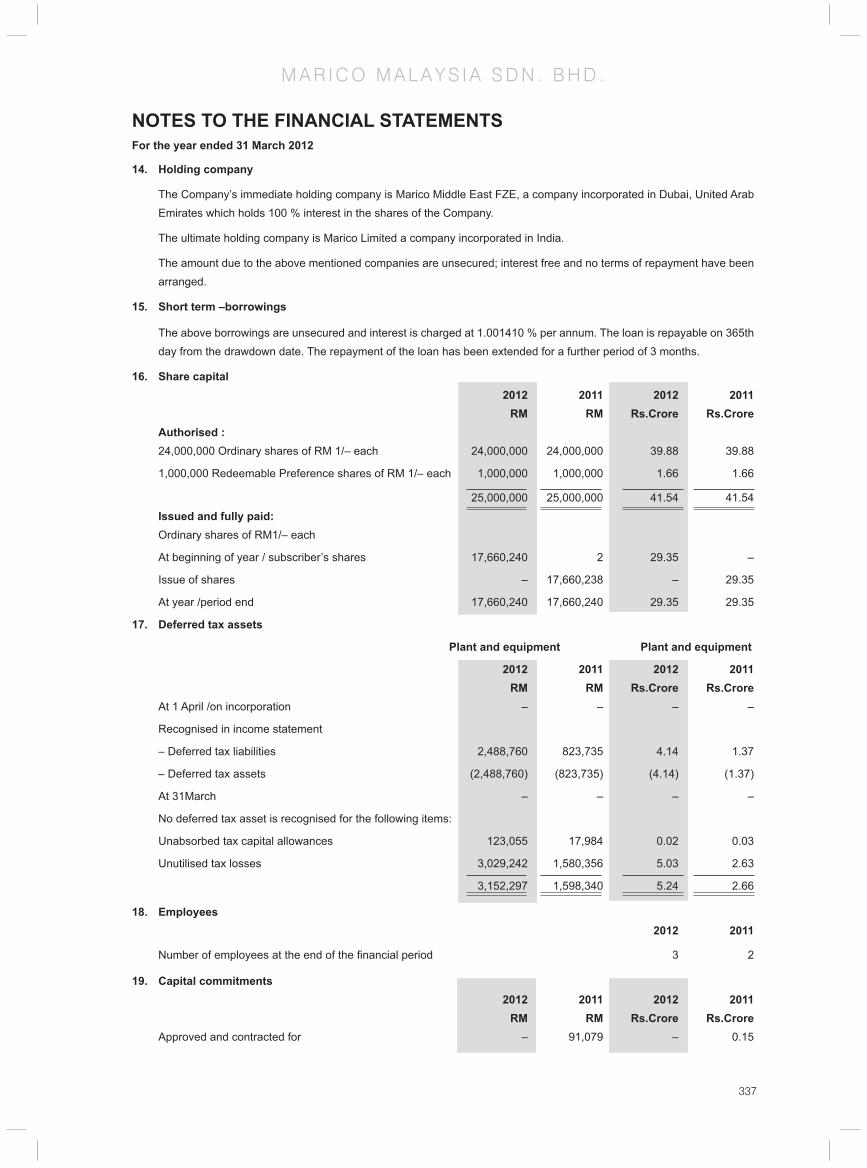
337
M A R I C O M A L A Y S I A S D N . B H D .
NOTES TO THE FINANCIAL STATEMENTSFor the year ended 31 March 2012
14. Holding company
The Company’s immediate holding company is Marico Middle East FZE, a company incorporated in Dubai, United Arab Emirates which holds 100 % interest in the shares of the Company.
The ultimate holding company is Marico Limited a company incorporated in India.
The amount due to the above mentioned companies are unsecured; interest free and no terms of repayment have been arranged.
15. Short term –borrowings
The above borrowings are unsecured and interest is charged at 1.001410 % per annum. The loan is repayable on 365th day from the drawdown date. The repayment of the loan has been extended for a further period of 3 months.
16. Share capital 2012 2011 2012 2011 RM RM Rs.Crore Rs.Crore Authorised : 24,000,000 Ordinary shares of RM 1/– each 24,000,000 24,000,000 39.88 39.88
1,000,000 Redeemable Preference shares of RM 1/– each 1,000,000 1,000,000 1.66 1.66
25,000,000 25,000,000 41.54 41.54 Issued and fully paid: Ordinary shares of RM1/– each
At beginning of year / subscriber’s shares 17,660,240 2 29.35 –
Issue of shares – 17,660,238 – 29.35
At year /period end 17,660,240 17,660,240 29.35 29.35
17. Deferred tax assets
Plant and equipment Plant and equipment
2012 2011 2012 2011 RM RM Rs.Crore Rs.Crore At 1 April /on incorporation – – – –
Recognised in income statement
– Deferred tax liabilities 2,488,760 823,735 4.14 1.37
– Deferred tax assets (2,488,760) (823,735) (4.14) (1.37)
At 31March – – – –
No deferred tax asset is recognised for the following items:
Unabsorbed tax capital allowances 123,055 17,984 0.02 0.03
Unutilised tax losses 3,029,242 1,580,356 5.03 2.63
3,152,297 1,598,340 5.24 2.66
18. Employees 2012 2011
Number of employees at the end of the fi nancial period 3 2
19. Capital commitments 2012 2011 2012 2011 RM RM Rs.Crore Rs.Crore Approved and contracted for – 91,079 – 0.15

338
M A R I C O M A L A Y S I A S D N . B H D .
INCOME STATEMENTS(with comparatives for the period from the date of incorporation 04/12/2009 to 31/03/2011)
Year ended March 31,
Notes 2012 2011 2012 2011 RM RM Rs.Crore Rs.Crore
Revenue Q1 13,216,878 11,325,319 21.96 16.70
Less: Cost of sales
Inventories – at beginning of the year 97,825 – 0.16 –
Purchases Q2 7,274,440 6,533,771 12.09 9.64
Freight charges Q2 517,812 65,638 0.86 0.10
Warehouse charges Q2 29,057 18,455 0.05 0.03
Inventories – at end of the year / period (213,391) (97,825) (0.35) (0.14)
7,705,743 6,520,039 12.81 9.63
Gross profi t 5,511,135 4,805,280 9.15 7.07
Other income :
Interest income Q8 526 – 0.01 –
Gain on foreign exchange – realised – 89,439 – 0.13
Gain on foreign exchange – unrealised Q10 17,612 41,516 0.03 0.06
18,138 130,955 0.03 0.19
Staff costs Appendix I (1,018,033) (468,350) (1.69) (0.69)
Depreciation Appendix I (105,072) (17,983) (0.18) (0.02)
Other operating expenses Appendix II (5,530,018) (6,407,549) (9.19) (9.44)
Operating loss (1,123,850) (1,957,647) (1.88) (2.89)
Finance cost Appendix II (99,291) (23,737) (0.16) (0.04)
Loss for the period (1,223,141) (1,981,384) (2.04) (2.93)
This management income statement is prepared from information furnished by the management of Marico Malaysia Sdn. Bhd. and does not form part of the audited fi nancial statements of the Company.
Appendix I
Notes 2012 2011 2012 2011
RM RM Rs.Crore Rs.Crore
Staff costs
Salary and wages 662,480 409,996 1.10 0.60
Bonus 350,125 58,354 0.58 0.09
EPF – staff 4,860 – 0.01 –
SOSCO– staff 568 – 0.01 –
1,018,033 468,350 1.69 0.69

339
M A R I C O M A L A Y S I A S D N . B H D .
Notes 2012 2011 2012 2011 RM RM Rs.Crore Rs.Crore
Depreciation
Moulds 70,610 – 0.12 –
Motor vehicles 15,313 8,324 0.03 0.01
Offi ce equipment 14,400 8,400 0.02 0.01
Computer 3,493 631 0.01 –
Furniture and fi ttings 1,256 628 – –
H1 105,072 17,983 0.18 0.02
Other operating expenses
Advertisement Q4 4,237,415 5,018,124 7.04 7.40
Visibility windows display Q3/2 740,667 657,172 1.23 0.97
Travelling expenses 165,866 262,617 0.28 0.39
Professional charges Q5 97,061 77,777 0.16 0.11
Provision for closure Q8 77,000 – – 0.13
Freight charges – 226,682 – 0.33
Rental of offi ce Q4 51,780 50,400 0.09 0.07
Loss on foreign exchange – realised Q10 61,670 5,092 0.10 0.01
Telephone,fax and internet Q7 40,598 13,996 0.07 0.02
Miscellaneous expenses Q6 17,847 22,554 0.03 0.03
Bank charges Q9/1 11,970 822 0.02 –
Road tax and insurance Q4 8,646 2,645 0.01 –
Auditors’ remuneration 8,000 5,000 0.01 0.01
Postage and courier 6,433 16,003 0.01 0.02
Tax fee 3,500 3,500 0.01 0.01
Printing and stationery 861 986 – –
Sampling expenses Q3/3 405 18,426 – 0.03
Donation Q4 299 1,308 – –
5,530,018 6,383,104 9.19 9.40
This management schedule of expenses is prepared from information furnished by the management of Marico Malaysia Sdn. Bhd. and does not form part of the audited fi nancial statements of the Company.
INCOME STATEMENTS(with comparatives for the period from the date of incorporation 04/12/2009 to 31/03/2011)

340
M A R I C O M A L A Y S I A S D N . B H D .
Appendix II
2012 2011 2012 2011 RM RM Rs.Crore Rs.Crore
Other operating expenses
Balance brought forward 5,530,018 6,383,104 9.19 9.41
Repair and maintenance – 19,545 – 0.03
Book and periodical – 2,379 – 0.01
Samples – 1,816 – 0.21
Upkeep of offi ce – 705 – 0.01 5,530,018 6,407,549 9.19 9.44
Finance cost
Loan interest Q11/1 99,291 23,737 0.16 0.04
99,291 23,737 0.16 0.04
INCOME STATEMENTS(with comparatives for the period from the date of incorporation 04/12/2009 to 31/03/2011)

341
INTERNATIONAL CONSUMER PRODUCTS CORPORATION
Board of Directors Vijay Subramaniam
Phan Quoc Cong
Harshraj C. Mariwala
Milind S. Sarwate
Chaitanya J. Deshpande
Registered Offi ce 3, Street No. 5, Song Than 1 Industrial Park, Di An District, Binh Duong Province, Ho Chi Minh City, Vietnam
Auditors Ernst & Young Vietnam Ltd.
Bankers Vietcom Bank (VCB)
HSBC
Asia Commercial Bank (ACB)
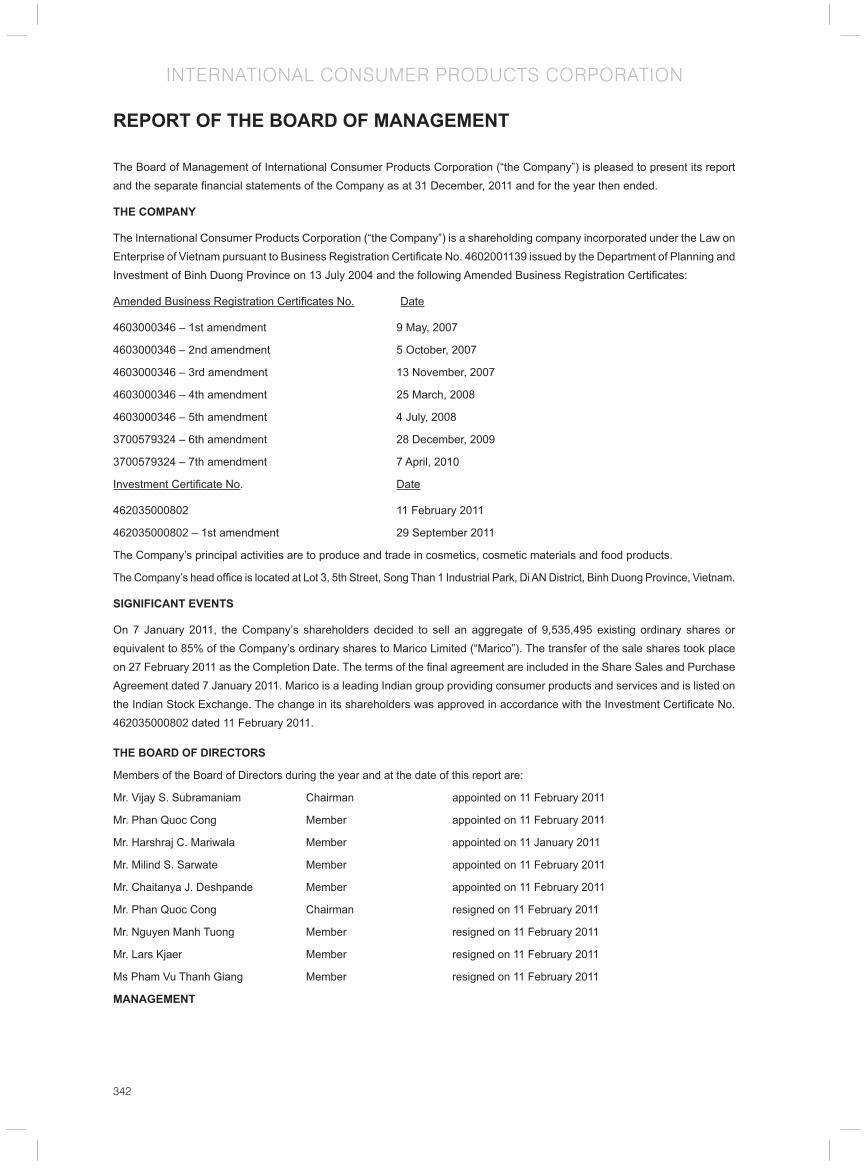
342
INTERNATIONAL CONSUMER PRODUCTS CORPORATION
The Board of Management of International Consumer Products Corporation (“the Company”) is pleased to present its report and the separate fi nancial statements of the Company as at 31 December, 2011 and for the year then ended.
THE COMPANY
The International Consumer Products Corporation (“the Company”) is a shareholding company incorporated under the Law on Enterprise of Vietnam pursuant to Business Registration Certifi cate No. 4602001139 issued by the Department of Planning and Investment of Binh Duong Province on 13 July 2004 and the following Amended Business Registration Certifi cates:
Amended Business Registration Certifi cates No. Date
4603000346 – 1st amendment 9 May, 2007
4603000346 – 2nd amendment 5 October, 2007
4603000346 – 3rd amendment 13 November, 2007
4603000346 – 4th amendment 25 March, 2008
4603000346 – 5th amendment 4 July, 2008
3700579324 – 6th amendment 28 December, 2009
3700579324 – 7th amendment 7 April, 2010
Investment Certifi cate No. Date
462035000802 11 February 2011
462035000802 – 1st amendment 29 September 2011
The Company’s principal activities are to produce and trade in cosmetics, cosmetic materials and food products.
The Company’s head offi ce is located at Lot 3, 5th Street, Song Than 1 Industrial Park, Di AN District, Binh Duong Province, Vietnam.
SIGNIFICANT EVENTS
On 7 January 2011, the Company’s shareholders decided to sell an aggregate of 9,535,495 existing ordinary shares or equivalent to 85% of the Company’s ordinary shares to Marico Limited (“Marico”). The transfer of the sale shares took place on 27 February 2011 as the Completion Date. The terms of the fi nal agreement are included in the Share Sales and Purchase Agreement dated 7 January 2011. Marico is a leading Indian group providing consumer products and services and is listed on the Indian Stock Exchange. The change in its shareholders was approved in accordance with the Investment Certifi cate No. 462035000802 dated 11 February 2011.
THE BOARD OF DIRECTORS
Members of the Board of Directors during the year and at the date of this report are:
Mr. Vijay S. Subramaniam Chairman appointed on 11 February 2011
Mr. Phan Quoc Cong Member appointed on 11 February 2011
Mr. Harshraj C. Mariwala Member appointed on 11 January 2011
Mr. Milind S. Sarwate Member appointed on 11 February 2011
Mr. Chaitanya J. Deshpande Member appointed on 11 February 2011
Mr. Phan Quoc Cong Chairman resigned on 11 February 2011
Mr. Nguyen Manh Tuong Member resigned on 11 February 2011
Mr. Lars Kjaer Member resigned on 11 February 2011
Ms Pham Vu Thanh Giang Member resigned on 11 February 2011
MANAGEMENT
REPORT OF THE BOARD OF MANAGEMENT

343
INTERNATIONAL CONSUMER PRODUCTS CORPORATION
Members of the Management during the year and at the date of this report are:
Mr. Phan Quoc Cong General Director
Mr. Le Quang Hanh Deputy General Director
Mr. Nguyen Ngoc Anh Tuan Deputy General Director
Mr. Vu Hoang Quoc Tuan Deputy General Director
Mr. Pham Hoang Ngan Deputy General Director
Mr. Phung Ngoc Trang Deputy General Director
LEGAL REPRESENTATIVE
The legal representative of the Company during the year and at the date of this report is Mr Chaitanya Jaikrishna Deshpande.
AUDITORS
The auditors of the Company is Ernst & Young Vietnam Limited.
Management of International Consumer Products (‘the Company”) is pleased to present its report and the separate fi nancial
REPORT OF THE BOARD OF MANAGEMENT
344
INTERNATIONAL CONSUMER PRODUCTS CORPORATION
statements of the Company for the year ended 31 December 2011.
STATEMENT OF THE MANAGEMENT’S RESPONSIBILITY IN RESPECT OF THE SEPARATE FINANCIAL STATEMENTS
The management is responsible for the separate fi nancial statements of each fi nancial year which give a true and fair view of the state of affairs of the Company and of its results and cash fl ows for the year. In preparing those separate fi nancial statements, management is required to:
• select suitable accounting policies and then apply them consistently;
• make judgements and estimates that are reasonable and prudent;
• state whether applicable accounting standards have been followed, subject to any material departures disclosed and explained in the separate fi nancial statements; and
• prepare the separate fi nancial statements on the going concern basis unless it is inappropriate to presume that the Company will continue its business.
Management is responsible for ensuring that proper accounting records are kept which disclose, with reasonable accuracy at any time, the fi nancial position of the Company and to ensure that the accounting records comply with the registered accounting system. It is also responsible for safeguarding the assets of the Company and hence for taking reasonable steps for the prevention and detection of fraud and other irregularities.
Management confi rmed that it has complied with the above requirements in preparing the accompanying separate fi nancial statements for the year ended 31 December 2011.
STATEMENT BY MANAGEMENT
Management does hereby state that, in its opinion, the accompanying separate fi nancial statements give a true and fair view of the separate fi nancial position of the Company as at 31 December 2011 and of the separate results of its operations and its separate cash fl ows for the year then ended in accordance with the Vietnamese Accounting Standards and System and comply with relevant statutory requirements.
Users of these separate fi nancial statements should read them together with the consolidated fi nancial statements of the Company and its subsidiaries (“the Group”) as at and for the year ended 31 December 2011 in order to obtain full information on the fi nancial position, results of operations and cash fl ows of the Group as a whole.
For and on behalf of management
Mr. Phan Quoc CongGeneral Director
6 March 2012
REPORT OF THE BOARD OF MANAGEMENT

345
INTERNATIONAL CONSUMER PRODUCTS CORPORATION
INDEPENDENT AUDITORS’ REPORTTo, The Shareholders of International Consumer Products Corporation.
We have audited the separate fi nancial statements of International Consumer Products Corporation (“the Company”) as set out on pages 5 to 31 which comprise the separate balance sheet as at 31 December 2011, the separate income statement and the separate cash fl ow statement for the year then ended and the notes thereto.
The preparation and presentation of these separate fi nancial statements are the responsibility of the Company’s management. Our responsibility is to express an opinion on these separate fi nancial statements based on our audit.
Basis of opinion
We conducted our audit in accordance with Vietnamese Standards on Auditing. Those standards require that we plan and perform the audit to obtain reasonable assurance about whether the separate fi nancial statements are free of material misstatement. An audit includes examining, on a test basis, evidence supporting the amounts and disclosures in the separate fi nancial statements. An audit also includes assessing the accounting principles used and signifi cant estimates made by the Company’s management, as well as evaluating the overall presentation of the separate fi nancial statements. We believe that our audit provides a reasonable basis for our opinion.
Opinion
In our opinion, the separate fi nancial statements give a true and fair view of the separate fi nancial position of the Company as at 31 December 2011, and of the separate results of its operations and its separate cash fl ows for the year then ended in accordance with the Vietnamese Accounting Standards and System and comply with the relevant statutory requirements.
Without qualifying our opinion, we draw attention to Note 2.1 of the separate fi nancial statements, which states that the Company is a parent company with subsidiaries and it is in the process of completing the consolidated fi nancial statements of the Company and its subsidiaries (collectively referred to as “the Group”) as at 31 December 2011 and for the year then ended to meet the prevailing regulatory reporting requirements. Users of these separate fi nancial statements should read them together with the consolidated fi nancial statements of the Group as at 31 December 2011 and for the year then ended in order to obtain full information on the fi nancial position, results of operations and cash fl ows of the Group as a whole.
Earnest & Young Vietnam Limited
Duong Le Anthony Le Quang Minh
Deputy General Director Auditor
Certifi cate No. N. 2223/KTV Certifi cate No. 0426/KTV
Ho Chi Minh City, Vietnam
6 March 2012

346
INTERNATIONAL CONSUMER PRODUCTS CORPORATION
BALANCE SHEETAS AT 31 DECEMBER 2011
Tran Le Kim Loan Phan Quoc CongChief Accountant Chief Executive Offi cer
6 March 2012
VND (Rs. Crore)
ASSETS Notes Ending balance
Beginning balance
Ending balance
Beginning balance
A. CURRENT ASSETS 180,924,095,964 130,227,626,560 45.64 29.86 I. Cash and cash equivalents 4 50,353,360,852 38,241,076,815 12.70 8.77
1. Cash 19,353,360,852 22,503,076,815 4.88 5.16
2. Cash equivalents 31,000,000,000 15,738,000,000 7.82 3.61
II. Short-term investment 10,000,000,000 – 2.52 – 1. Short-term investment 5 10,000,000,000 – 2.52 –
III. Current accounts receivable 50,402,315,038 32,565,943,746 12.71 7.47 1. Trade receivables 20,927,965,578 14,410,016,918 5.28 3.30
2. Advances to suppliers 6 25,768,449,151 18,092,868,639 6.50 4.15
3. Other receivables 7 3,705,900,309 63,058,189 0.93 0.01
IV. Inventories 8 68,575,340,964 58,312,143,306 17.30 13.37 1. Inventories 70,146,746,720 58,472,250,203 17.70 13.41
2. Provision for obsolete inventories (1,571,405,756) (160,106,897) (0.40) (0.04)
V. Other current assets 1,593,079,110 1,108,462,693 0.40 0.25 1. Short-term prepaid expenses 305,421,609 562,886,492 0.08 0.13
2. Tax and other receivables from the State
100,141,901 – 0.03 –
3. Other current assets 1,187,515,600 545,576,201 0.30 0.13
B. NON-CURRENT ASSETS 159,569,706,314 145,543,112,111 40.25 33.37 I. Fixed assets 14,384,942,261 29,497,082,291 3.63 6.76
1. Tangible fi xed assets 9 12,189,999,980 12,739,187,112 3.08 2.92
Cost 32,002,356,896 28,148,014,887 8.07 6.45
Accumulated depreciation (19,812,356,916) (15,408,827,775) (5.00) (3.53)
2. Intangible fi xed assets 10 2,194,942,281 4,782,691,315 0.55 1.10
Cost 10,528,721,363 10,528,721,363 2.66 2.41
Accumulated amortization (8,333,779,082) (5,746,030,048) (2.10) (1.32)
3. Construction in progress – 11,975,203,864 – 2.75
II. Investment property 11 23,843,388,652 – 6.01 – 1. Cost 23,843,388,652 – 6.01 –
III. Long-term investment 113,743,051,308 108,754,186,308 28.69 24.94 1. Investments in subsidiaries 12 113,743,051,308 108,754,186,308 28.69 24.94
IV. Other long-term assets 7,598,324,093 7,291,843,512 1.92 1.67 1. Long-term prepaid expenses 13 5,101,995,663 7,291,843,512 1.29 1.67
2. Deferred tax assets 21.2 978,067,018 – 0.25 –
3. Long-term current assets 1,518,261,412 2 0.38 –
TOTAL ASSETS 340,493,802,278 275,770,738,671 85.90 63.23
Note - The exchange rate used to convert VND to Rs. <0.002523> / <VND> (Rs. <0.002293> / <VND>) “The columns in INR are not part of the audited fi nancial statements and the audit opinion does not apply to them.”

347
INTERNATIONAL CONSUMER PRODUCTS CORPORATION
BALANCE SHEETAS AT 31 DECEMBER 2011
VND (Rs. Crore)
RESOURCES Notes Ending balance
Beginning balance
Ending balance
Beginning balance
A. LIABILITIES 56,079,079,600 38,886,239,305 14.15 8.92
I. Current liabilities 54,735,545,766 37,190,614,093 13.81 8.53
1. Trade payables 29,338,982,324 25,905,092,774 7.40 5.94
2. Advances from customers 696,476,420 547,707,286 0.18 0.13
3. Statutory obligations 14 7,178,602,006 4,775,310,003 1.81 1.09
4. Payable to employees 49,990,730 17,998,518 0.01 –
5. Accrued expenses 15 17,327,357,021 5,676,272,619 4.37 1.30
6. Other payables 144,137,265 268,232,893 0.04 0.06
II. Non-current liabilities 1,343,533,834 1,695,625,212 0.34 0.39
1. Deferred tax liabilities 21.2 – 517,172,410 – 0.12
2. Provision for severance allowance 1,343,533,834 1,178,452,802 0.34 0.27
B. OWNERS’ EQUITY 16 284,414,722,678 236,884,499,366 71.75 54.32
I. Capital 284,414,722,678 236,884,499,366 71.75 54.32
1. Share capital 16.2 112,177,600,000 112,177,600,000 28.30 25.72
2. Share premium 112,213,880,000 112,213,880,000 28.31 25.73
3. Other funds belonging to owners’ equity – 123,392,018 – 0.03
4. Undistributed earnings 16.1 60,023,242,678 12,369,627,348 15.14 2.84
TOTAL LIABILITIES ANDOWNERS’ EQUITY
340,493,802,278 275,770,738,671 85.90 63.23
Tran Le Kim Loan Phan Quoc CongChief Accountant Chief Executive Offi cer
6 March 2012
OFF BALANCE SHEET ITEMS
ITEMS Notes Ending balance
Beginning balance
Ending balance
Beginning balance
Foreign Currency (US$) 4,542.81 244.38 – –
Goods held by the Company on consignment
– 2,732,092,427 – 0.63
Note - The exchange rate used to convert VND to Rs. <0.002523> / <VND> (Rs. <0.002293> / <VND>) “The columns in INR are not part of the audited fi nancial statements and the audit opinion does not apply to them.”
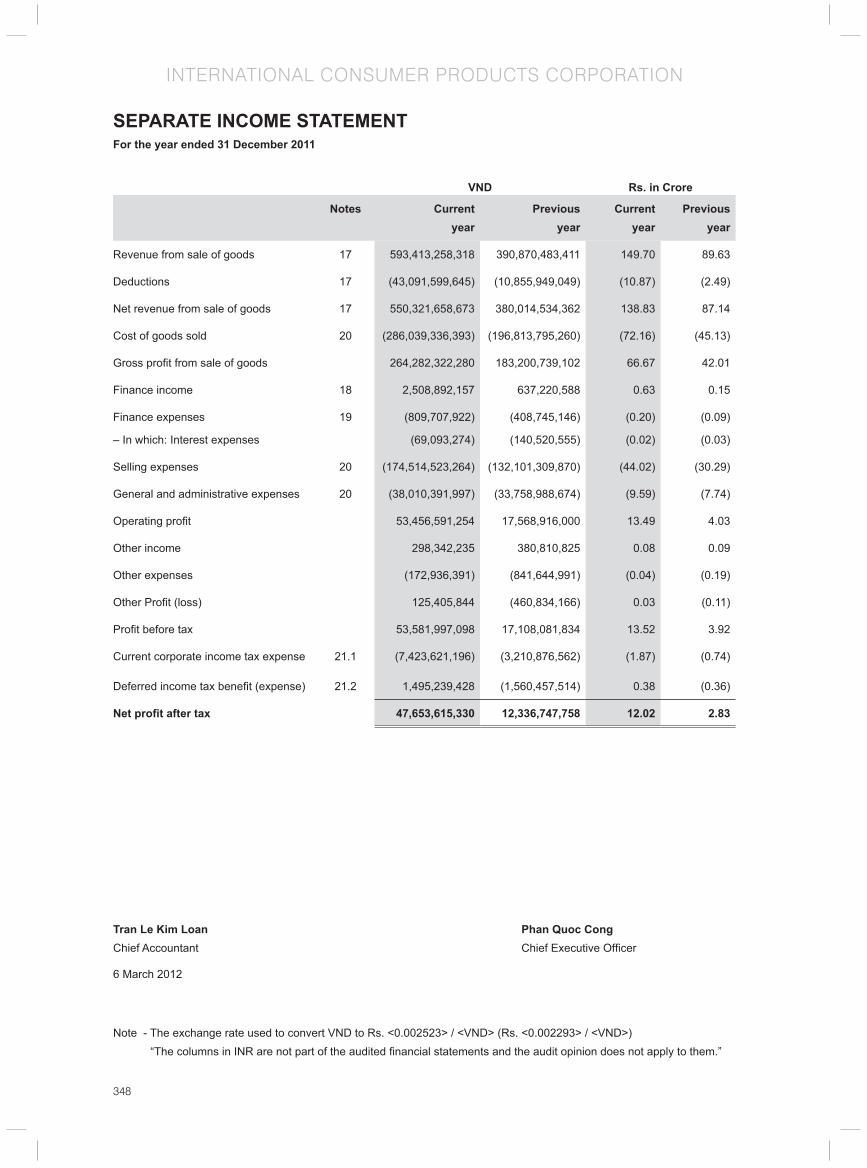
348
INTERNATIONAL CONSUMER PRODUCTS CORPORATION
SEPARATE INCOME STATEMENTFor the year ended 31 December 2011
VND Rs. in Crore
Notes Current year
Previousyear
Current year
Previous year
Revenue from sale of goods 17 593,413,258,318 390,870,483,411 149.70 89.63
Deductions 17 (43,091,599,645) (10,855,949,049) (10.87) (2.49)
Net revenue from sale of goods 17 550,321,658,673 380,014,534,362 138.83 87.14
Cost of goods sold 20 (286,039,336,393) (196,813,795,260) (72.16) (45.13)
Gross profi t from sale of goods 264,282,322,280 183,200,739,102 66.67 42.01
Finance income 18 2,508,892,157 637,220,588 0.63 0.15
Finance expenses 19 (809,707,922) (408,745,146) (0.20) (0.09)
– In which: Interest expenses (69,093,274) (140,520,555) (0.02) (0.03)
Selling expenses 20 (174,514,523,264) (132,101,309,870) (44.02) (30.29)
General and administrative expenses 20 (38,010,391,997) (33,758,988,674) (9.59) (7.74)
Operating profi t 53,456,591,254 17,568,916,000 13.49 4.03
Other income 298,342,235 380,810,825 0.08 0.09
Other expenses (172,936,391) (841,644,991) (0.04) (0.19)
Other Profi t (loss) 125,405,844 (460,834,166) 0.03 (0.11)
Profi t before tax 53,581,997,098 17,108,081,834 13.52 3.92
Current corporate income tax expense 21.1 (7,423,621,196) (3,210,876,562) (1.87) (0.74)
Deferred income tax benefi t (expense) 21.2 1,495,239,428 (1,560,457,514) 0.38 (0.36)
Net profi t after tax 47,653,615,330 12,336,747,758 12.02 2.83
Tran Le Kim Loan Phan Quoc CongChief Accountant Chief Executive Offi cer
6 March 2012
Note - The exchange rate used to convert VND to Rs. <0.002523> / <VND> (Rs. <0.002293> / <VND>) “The columns in INR are not part of the audited fi nancial statements and the audit opinion does not apply to them.”

349
INTERNATIONAL CONSUMER PRODUCTS CORPORATION
CASH FLOW STATEMENTas at and for the year ended 31 December 2011
Tran Le Kim Loan Phan Quoc CongChief Accountant Chief Executive Offi cer
6 March 2012
VND (Rs. Crore)
ITEMS Notes Current year Previous year Current year
Previous year
I. CASH FLOWS FROM OPERATING ACTIVITIESProfi t before tax 53,581,997,098 17,108,081,834 13.52 3.92 Adjustments for:Depreciation and amortization 9,10 7,159,082,880 6,939,377,699 1.81 1.59 Provisions 1,411,298,859 (25,117,800) 0.36 (0.01)Unrealized foreign exchange gains (18,317,743) (68,452,327) – (0.02)Gain from investing activities (2,467,460,283) (526,650,116) (0.62) (0.12)Interest expense 19 69,093,274 140,520,555 0.02 0.03 Operating profi t before changes in working capital
59,735,694,085 23,567,759,845 15.07 5.40
(Increase) decrease in receivables (17,671,855,659) 22,649,783,023 (4.46) 5.19 Increase in inventories (11,674,496,517) (6,888,007,126) (2.95) (1.58)Increase (decrease) in payables 16,393,847,856 (11,377,292,856) 4.14 (2.61)Decrease (increase) in prepaid expenses 287,111,921 (2,843,116,106) 0.07 (0.65)Interest paid (69,093,274) (140,520,555) (0.02) (0.03)Corporate income tax paid 21.1 (6,108,710,597) (4,750,228,702) (1.54) (1.09)Other cash outfl ows from operating activities (123,392,018) (8,925,992,007) (0.03) (2.05)Net cash from operating activities 40,769,105,797 11,292,385,516 10.28 2.59
II. CASH FLOWS FROM INVESTING ACTIVITIESPurchase and construction of fi xed assets (15,948,907,980) (5,746,456,358) (4.02) (1.32)Proceeds from disposals of fi xed assets 67,513,808 10,784,945 0.02 – Bank deposit (10,000,000,000) – (2.52) – Payments for investments in other entities (4,988,865,000) (324,630,000) (1.26) (0.07)Interest and dividends received 2,193,865,419 526,648,579 0.55 0.12 Net cash used in investing activities (28,676,393,753) (5,533,652,834) (7.23) (1.27)
III. CASH FLOWS FROM FINANCING ACTIVITIES Capital contribution – 2,177,600,000 – 0.50 Repayment of borrowings – (13,600,000,000) – (3.12)Net cash used in fi nancing activities – (11,422,400,000) – (2.62)Net increase (decrease) in cash and cash equivalents
12,092,712,044 (5,663,667,318) 3.05 (1.30)
Cash and cash equivalents at beginning of year
38,241,076,815 43,904,744,133 9.65 10.07
Impact of exchange rate fl uctuation 19,571,993 – 0.01 – Cash and cash equivalents at end of year 4 50,353,360,852 38,241,076,815 12.70 8.77
Note - The exchange rate used to convert VND to Rs. <0.002523> / <VND> (Rs. <0.002293> / <VND>) “The columns in INR are not part of the audited fi nancial statements and the audit opinion does not apply to them.”

350
INTERNATIONAL CONSUMER PRODUCTS CORPORATION
1 CORPORATE INFORMATION
International Consumer Products Corporation (“the Company”) is a shareholding company incorporated under the Law on Enterprise of Vietnam pursuant to Business Registration Certifi cate No. 4602001139 issued by the Department of Planning and Investment of Binch Duong Province on 13 Junly 2004 and the following Amended Business Registration Certifi cates
Amended Business Registration Certifi cates No. Date
4603000346 – 1st amendment 9 May 2007
4603000346 – 2nd amendment 5 October 2007
4603000346 – 3rd amendment 13 November 2007
4603000346 – 4th amendment 25 March 2008
4603000346 – 5th amendment 4 July 2008
3700579324 – 6th amendment 28 December 2009
3700579324 – 7th amendment 7 April 2010
Joint Investment Certifi cate No. Date
462035000802 11 February 2011
462035000802 - 1st amendment 29 September 2011
The Company’s principal activities are to produce and trade in cosmetics, cosmetic material and food products
The Company’s head offi ce is located at Lot 3, 5th Street, Song Than 1 Industrial Park, Di An district, Binh Duong province, vinetnam.
The number of the Company’s employees as at 31 December 2011 was 300 (31 December 2010: 392 employees).
2 BASIS OF PREPARATION
2.1 Accounting Standards and System
The separate fi nancial statements of the Company, expressed in Vietnam dong (“VND”), are prepared in accordance with the Vietnamese Accounting System and Vietnamese Accounting Standards issued by the Ministry of Finance as per:
• Decision No. 149/2001/QD–BTC dated 31 December, 2001 on the Issuance and Promulgation of Four Vietnamese Standards on Accounting (Series 1);
• Decision No. 165/2002/QD–BTC dated 31 December 2002 on the Issucance and Promulgation of Six Vietnamese Standards on Accounting (Series 2);
• Decision No. 234/2003/QD–BTC dated 30 December 2003 on the Issuance and Promulgation of Six Vietnamese Standards on Accounting (Series 3);
• Decision No. 12/2005/QD–BTC dated 15 February 2005 on the Issuance and Promulgation of Six Vietnamese Standards on Accounting (Series 4); and
• Decision No. 100/2005/QD–BTC dated 28 December 2005 on the Issuance and Promulgation of Four Vietnamese Standards on Accounting (Series 5).
Accordingly, the accompanying separate balance sheet, separate income statement, separate cash fl ow statement and related notes, including their utilisation are not designed for those who are not informed about Vietnam’s accounting principles, procedures and practices and furthermore are not intended to present the fi nancial position and results of operations and cash fl ows in accordance with accounting principles and practices generally accepted in countries other than Vietnam.
NOTES TO THE FINANCIAL STATEMENTSas at and for the year ended 31 December 2011

351
INTERNATIONAL CONSUMER PRODUCTS CORPORATION
The Company is the parent company of the subsidiaries disclosed in Note 10 and it is in the process of completing its consolidated fi nancial statements of the Company and its subsidiaries (“the Group”) as at 31 December 2011 and for the year then ended to meet the prevailing regulatory reporting requirements.
Users of these separate fi nancial statements should read them together with the fi nal consolidated fi nancial statements of the Group as at and for the year ended 31 December 2010 in order to obtain full information on the consolidated fi nancial position, consolidated results of operations and consolidated cash fl ows of the Group as a whole.
2.2 Applied accounting documentation system
The Company’s applied accounting documentation system is the General Journal.
2.3 Fiscal year
The Company’s fi scal year applicable for the preparation of its separate fi nancial statements starts on 1 January and ends on 31 December.
2.4 Accounting currency
The Company maintains its accounting records in VND.
3. SUMMARY of SIGNIFICANT ACCOUNTING POLICIES
3.1 Change in accounting policies and disclosures
The accounting policies adopted by the Company in preparation of the separate fi nancial statements are consistent with those followed in the preparation of the Company’s separate fi nancial statements for the year ended 31 December 2010 except for the change in the accounting policy in relation to the following:On 6 November 2009, the Ministry of Finance issued Circular No. 210/2009/TT-BTC providing guidance for the adoption in Vietnam of the International Financial Reporting Standards on presentation and disclosures of fi nancial instruments (“Circular 210”) with effectiveness from fi nancial years beginning on or after 1 January 2011.
The adoption of Circular 210 results in new disclosures being added to the separate fi nancial statements as shown in Notes 23 and 24.
Circular 210 also requires the Company to evaluate the terms of non-derivative fi nancial instrument issued by the Company to determine whether it contains both a liability and an equity component. Such components are classifi ed separately as fi nancial liabilities, fi nancial assets or equity instruments in the separate balance sheet. This requirement has no impact on the fi nancial position or result of operation of the Company as the Company has not yet issued such non-derivative fi nancial instrument.
3.2 Cash and cash equivalents
Cash and cash equivalents comprise cash on hand; cash at banks and short-term, highly liquid investments with an original maturity of less than three months that are readily convertible into known amounts of cash and that are subject to an insignifi cant risk of change in value.
3.3 Inventories
Inventories are stated at the lower of cost incurred in bringing each product to its present location and condition, and net realisable value.
Net realisable value represents the estimated selling price in the ordinary course of business less the estimated costs to complete and the estimated costs necessary to make the sale.
NOTES TO THE FINANCIAL STATEMENTSas at and for the year ended 31 December 2011

352
INTERNATIONAL CONSUMER PRODUCTS CORPORATION
NOTES TO THE FINANCIAL STATEMENTSas at and for the year ended 31 December 2011
The perpetual method is used to record inventories, which are valued as follows:
Raw materials, consumables and goods for resale - cost of purchase on a weighted average basis.
Finished goods and work-in-process - cost of direct materials and labour plus attributable manufacturing overheads based on the normal operating capacity on a weighted average basis. Provision for obsolete inventories
An inventories provision is created for the estimated loss arising due to the impairment of value (through diminution, damage, obsolescence, etc.) of raw materials, fi nished goods, and other inventories owned by the Company, based on appropriate evidence of impairment available at the balance sheet date.
Increases and decreases to the provision balance are recorded into the cost of goods sold account in the separate income statement.
3.4 Receivables
Receivables are presented in the separate fi nancial statements at the carrying amounts due from customers and other debtors, after provision for doubtful debts.
The provision for doubtful debts represents amounts of outstanding receivables at the balance sheet date which are doubtful of being recovered. Increases and decreases to the provision balance are recorded as general and administrative expense in the separate income statement.
3.5 Tangible fi xed assets
Tangible fi xed assets are stated at cost less accumulated depreciation.
The cost of a tangible fi xed asset comprises its purchase price and any directly attributable costs of bringing the tangible fi xed asset to working condition for its intended use.
Expenditures for additions, improvements and renewals are added to the carrying amount of the assets and expenditures for maintenance and repairs are charged to the separate income statement as incurred.
When tangible fi xed assets are sold or retired, their costs and accumulated depreciation are removed from the balance sheet and any gain or loss resulting from their disposal is included in the separate income statement.
3.6 Intangible fi xed assets
Intangible fi xed assets are stated at cost less accumulated amortisation.
The cost of an intangible fi xed asset comprises its purchase price and any directly attributable costs of preparing the intangible fi xed asset for its intended use.
Expenditures for additions, improvements are added to the carrying amount of the assets and other expenditures are charged to the separate income statement as incurred.
When intangible fi xed assets are sold or retired, their costs and accumulated amortisation are removed from the balance sheet and any gain or loss resulting from their disposal is included in the separate income statement.
3.7 Depreciation and amortisation
Depreciation and amortisation of tangible fi xed assets and intangible assets are calculated on a straight-line basis over the estimated useful life of each asset as follows:

353
INTERNATIONAL CONSUMER PRODUCTS CORPORATION
NOTES TO THE FINANCIAL STATEMENTSas at and for the year ended 31 December 2011
Buildings & structures 25 years
Machinery & equipment 5 - 7 years
Means of transportation 4 years
Offi ce equipment 4 -5 years
Patent /Copyright 4 years
Computer software 3 - 6 years
3.8 Prepaid expenses
Prepaid expenses are reported as short-term or long-term prepaid expenses on the separate balance sheet and amortised over the period for which the amounts are paid or the period in which economic benefi ts are generated in relation to these expenses.
The following types of expenses are recorded as long-term prepaid expense and are amortised to the separate income statement:
• Land lease represents land use rights of the land situated at unit No. 3, Street 5, Song Than I Industrial Park, Di An District, Binh Duong Province, which the Company occupies under an agreement for a period of 41 years. The cost of the rights is amortised on a straight line basis over the term of the lease.
• Tools and consumables with large value issued into production and can be used for more than one year are amortised over within three years.
3.9 Investment property
Investment properties are stated at cost including transaction costs less accumulated depreciation.
Subsequent expenditure relating to an investment property that has already been recognized is added to the net book value of the investment property when it is probable that future economic benefi ts, in excess of the originally assessed standard of performance of the existing investment property, will fl ow to the Company.
Investment properties are derecognised when either they have been disposed of or when the investment properties are permanently withdrawn from use and no future economic benefi t is expected from its disposal. The difference between the net disposal proceeds and the carrying amount of the assets is recognised in the consolidated income statement in the year of retirement or disposal.
Transfers are made to investment properties when, and only when, there is a change in use, evidenced by ending of owner-occupation, commencement of an operating lease to another party or ending of construction or development. Transfers are made from investment properties when, and only when, there is change in use, evidenced by commencement of owner-occupation or commencement of development with a view to sale. The transfer from investment property to owner-occupied property or inventories does not change the cost or the carrying value of the property for subsequent accounting at the date of change in use.
3.10 Investment in subsidiaries
Investments in subsidiaries over which the Company has control are carried at cost. Distributions from accumulated net profi ts of the subsidiaries arising subsequent to the date of acquisition are recognised in the separate income statement. Distributions from sources other than from such profi ts are considered a recovery of investment and are deducted to the cost of the investment.
3.11 Payables and accruals
Payables and accruals are recognised for amounts to be paid in the future for goods and services received, whether or not billed to the Company.

354
INTERNATIONAL CONSUMER PRODUCTS CORPORATION
NOTES TO THE FINANCIAL STATEMENTSas at and for the year ended 31 December 2011
3.12 Accrual for severance allowance
The severance pay to employee is accrued at the end of each reporting period for all employees who have more than 12 months in service up to 31 December 2008 at the rate of one-half of the average monthly salary for each year of service up to 31 December 2008 in accordance with the Labour Code, the Law on Social Insurance and related implementing guidance. Commencing 1 January 2009, the average monthly salary used in this calculation will be revised at the end of each reporting period following the average monthly salary of the 6-month period up to the balance sheet date. Any changes to the accrued amount will be taken to the separate income statement. From 1 January 2009, the Group pays unemployment insurance in accordance with Decree No.127/2008/ND-CP dated 12 December 2008.
3.13 Foreign currency transactions
The Company follows the guidance under Vietnamese Accounting Standard No.10 “The Effects of Changes in Exchange Rates” (“VAS 10”) in relation to foreign currency transactions as applied consistently in prior years.
Transactions in currencies other than the Company’s reporting currency of VND are recorded at the exchange rates ruling at the date of the transaction. At year-end, monetary assets and liabilities denominated in foreign currencies are revalued at exchange rates ruling at the balance sheet date. All realised and unrealised foreign exchange differences are taken to the separate income statement.
The above guidance related to unrealized foreign exchange differences provided by VAS 10 is different from those stipulated in the Circular No. 201/2009/TT-BTC (“Circular 201”) issued by the Ministry of Finance on 15 October 2009, providing guidance for the treatment of foreign exchange differences as follows:
Transaction Accounting treatment under
VAS 10 Circular 201
Translation of short-term mone ta ry asse ts and liabilities denominated in foreign currencies.
A l l un rea l i sed fo re ign exchange differences are taken to the separate income statement.
All unrealised foreign exchange differences are taken to the “Foreign exchange differences reserve” account in the equity section of the separate balance sheet and will be reversed on the following year.
Tr a n s l a t i o n o f l o n g -term monetary liabilities denominated in foreign currencies at year-end.
A l l un rea l i sed fo re ign exchange differences are taken to the separate income statement.
All unrealised foreign exchange gains are taken to the separate income statement.
All foreign exchange losses will be charged to the separate income statement. However, if the charging of all foreign exchange losses results in net loss before tax for the Company, part of the exchange losses can be deferred and allocated to the separate income statement within the subsequent years. In any case, the total foreign exchange losses to be charged to current year’s income must be at least equivalent to the foreign exchange losses arising from the translation of the current portion of the long-term liabilities, while the remaining portion of the foreign exchange losses can be deferred in the separate balance sheet and allocated to the separate income statement within the subsequent fi ve years.
However, the impact to the separate fi nancial statements had the Company adopted the Circular 201 for the year ended 31 December 2011 was not material as a whole.
355
INTERNATIONAL CONSUMER PRODUCTS CORPORATION
NOTES TO THE FINANCIAL STATEMENTSas at and for the year ended 31 December 2011
3.14 Appropriation of net profi ts
Net profi t after tax is available for appropriation to investors after approval by the shareholders’ meeting.
3.15 Revenue recognition
Revenue is recognised to the extent that it is probable that the economic benefi ts will fl ow to the Company and the revenue can be reliably measured. Revenue is measured at the fair value of the consideration received or receivable, excluding trade discount, rebate and sales return. The following specifi c recognition criteria must also be met before revenue is recognised:
Sale of goods
Revenue is recognised when the signifi cant risks and rewards of ownership of the goods have passed to the buyer, usually upon the delivery of the goods.
Interest income
Revenue is recognised as the interest accrues (taking into account the effective yield on the asset) unless collectibility is in doubt.
Dividend
Revenue is recognised when the Company is entitled to receive dividend.
3.16 Taxation
Current income tax
Current income tax assets and liabilities for the current and prior periods are measured at the amount expected to be recovered from or paid to the taxation authorities. The tax rates and tax laws used to compute the amount are those that are enacted as at the balance sheet date.
Current income tax is charged or credited to the separate income statement, except when it relates to items recognised directly to equity, in which case the current income tax is also dealt with in equity.
Current income tax assets and liabilities are offset when there is a legally enforceable right for the Company to set off current tax assets against current tax liabilities and when the Company intends to settle its current tax assets and liabilities on a net basis.
Deferred income tax
Deferred income tax is provided using the liability method on temporary differences at the balance sheet date between the tax base of assets and liabilities and their carrying amount for fi nancial reporting purposes.
Deferred tax liabilities are recognised for all taxable temporary differences. Deferred tax assets are recognised for all deductible temporary differences, carried forward unused tax credit and unused tax losses, to the extent that it is probable that taxable profi t will be available against which deductible temporary differences, carried forward unused tax credit and unused tax losses can be utilised.
The carrying amount of deferred income tax assets is reviewed at each balance sheet date and reduced to the extent that it is no longer probable that suffi cient taxable profi t will be available to allow all or part of the deferred income tax asset to be utilised. Previously unrecognised deferred income tax assets are re-assessed at each balance sheet date and are recognised to the extent that it has become probable that future taxable profi t will allow the deferred tax assets to be recovered.
Deferred income tax assets and liabilities are measured at the tax rates that are expected to apply in the period when the asset is realised or the liability is settled based on tax rates and tax laws that have been enacted at the balance sheet date.

356
INTERNATIONAL CONSUMER PRODUCTS CORPORATION
Deferred income tax is charged or credited to the income statement, except when it relates to items recognised directly to equity, in which case the deferred tax is also dealt with in the equity account.
Deferred tax assets and liabilities are offset when there is a legally enforceable right for the Company to set off current tax assets against current tax liabilities and when they relate to income taxes levied by the same taxation authority on either the same taxable entity or when the Company intends either settle current tax liabilities and assets on a net basis or to realise the assets and settle the liabilities simultaneously, in each future period in which signifi cant amounts of deferred tax liabilities or assets are expected to be settled or recovered.
3.17 Financial instruments
Financial instruments – initial recognition and presentation
Financial assets
Financial assets within the scope of Circular 210 are classifi ed, for disclosures in the notes to the separate fi nancial statements, as fi nancial assets at fair value through profi t or loss, held-to-maturity investments, loans and receivables or available-for-sale fi nancial assets as appropriate. The Company determines the classifi cation of its fi nancial assets at initial recognition.
All fi nancial assets are recognised initially at cost plus directly attributable transaction costs.
The Company’s fi nancial assets include cash and short-term deposits, trade and other receivables.
Financial liabilities
Financial liabilities within the scope of Circular 210 are classifi ed, for disclosures in the notes to the separate fi nancial statements, as fi nancial liabilities at fair value through profi t or loss or fi nancial liabilities measured at amortised cost as appropriate. The Company determines the classifi cation of its fi nancial liabilities at initial recognition.
All fi nancial liabilities are recognised initially at cost plus directly attributable transaction costs.
The Company’s fi nancial liabilities include trade and other payables.
Financial instruments – subsequent measurement
No subsequent measure of fi nancial instruments is currently required.
Offsetting of fi nancial instruments
Financial assets and fi nancial liabilities are offset and the net amount reported in the separate balance sheet if, and only if, there is a currently enforceable legal right to offset the recognised amounts and there is an intention to settle on a net basis, or to realise the assets and settle the liabilities simultaneously.
4. CASH AND CASH EQUIVALENTS
VND (Rs. Crore)
Ending balance
Beginning balance
Ending balance
Beginning balance
Cash on hand 246,062,581 87,389,821 0.06 0.02
Cash at banks 19,107,298,271 22,415,686,994 4.82 5.14
Cash equivalents 31,000,000,000 15,738,000,000 7.82 3.61
TOTAL 50,353,360,852 38,241,076,815 12.70 8.77
Cash equivalents mainly represent short-term bank deposits with maturity of less than 3 months which are readily convertible into known amounts of cash without any signifi cant risk of change in value, and earn an interest rate at 14% per annum.
NOTES TO THE FINANCIAL STATEMENTSas at and for the year ended 31 December 2011
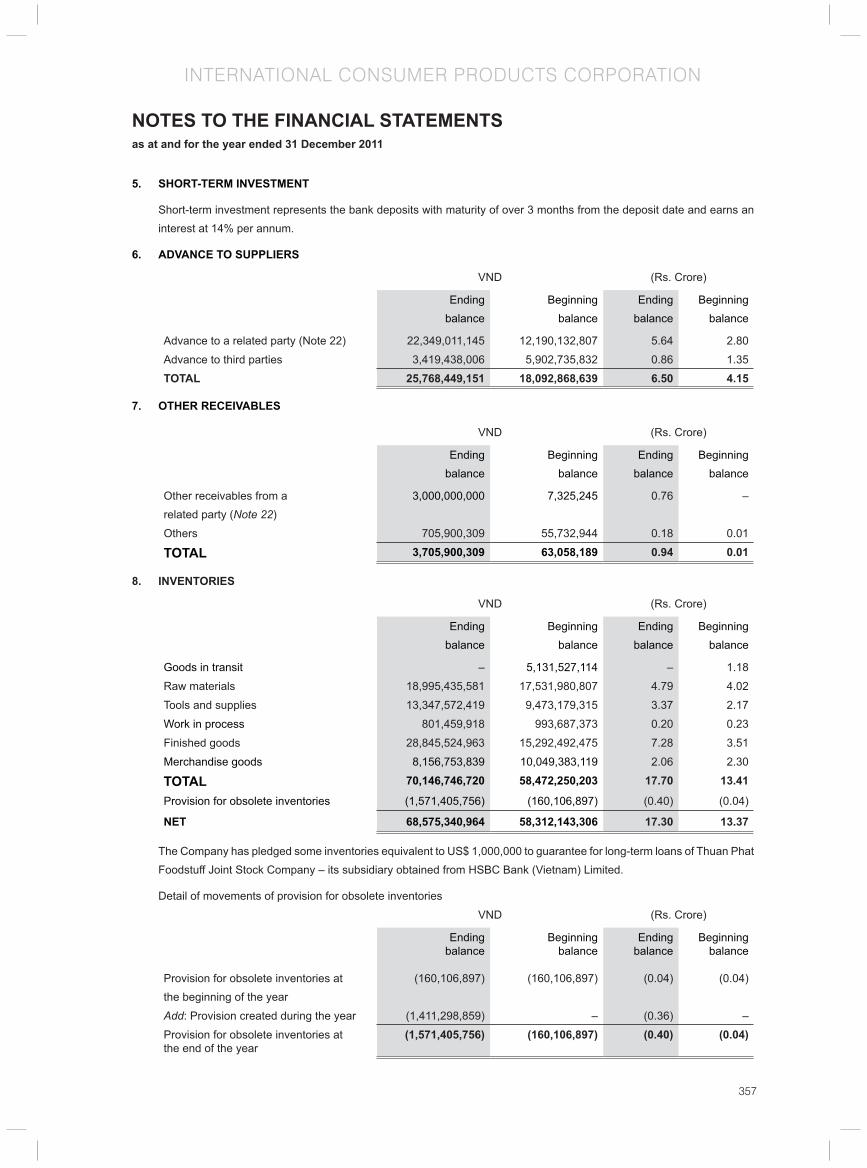
357
INTERNATIONAL CONSUMER PRODUCTS CORPORATION
5. SHORT-TERM INVESTMENT
Short-term investment represents the bank deposits with maturity of over 3 months from the deposit date and earns an interest at 14% per annum.
6. ADVANCE TO SUPPLIERS
VND (Rs. Crore)
Ending balance
Beginning balance
Ending balance
Beginning balance
Advance to a related party (Note 22) 22,349,011,145 12,190,132,807 5.64 2.80
Advance to third parties 3,419,438,006 5,902,735,832 0.86 1.35
TOTAL 25,768,449,151 18,092,868,639 6.50 4.15
7. OTHER RECEIVABLES
VND (Rs. Crore)
Ending balance
Beginning balance
Ending balance
Beginning balance
Other receivables from a related party (Note 22)
3,000,000,000 7,325,245 0.76 –
Others 705,900,309 55,732,944 0.18 0.01
TOTAL 3,705,900,309 63,058,189 0.94 0.01
8. INVENTORIES
VND (Rs. Crore)
Ending balance
Beginning balance
Ending balance
Beginning balance
Goods in transit – 5,131,527,114 – 1.18
Raw materials 18,995,435,581 17,531,980,807 4.79 4.02
Tools and supplies 13,347,572,419 9,473,179,315 3.37 2.17
Work in process 801,459,918 993,687,373 0.20 0.23
Finished goods 28,845,524,963 15,292,492,475 7.28 3.51
Merchandise goods 8,156,753,839 10,049,383,119 2.06 2.30
TOTAL 70,146,746,720 58,472,250,203 17.70 13.41
Provision for obsolete inventories (1,571,405,756) (160,106,897) (0.40) (0.04)
NET 68,575,340,964 58,312,143,306 17.30 13.37
The Company has pledged some inventories equivalent to US$ 1,000,000 to guarantee for long-term loans of Thuan Phat Foodstuff Joint Stock Company – its subsidiary obtained from HSBC Bank (Vietnam) Limited.
Detail of movements of provision for obsolete inventories
VND (Rs. Crore)
Ending balance
Beginning balance
Ending balance
Beginning balance
Provision for obsolete inventories at the beginning of the year
(160,106,897) (160,106,897) (0.04) (0.04)
Add: Provision created during the year (1,411,298,859) – (0.36) –
Provision for obsolete inventories at the end of the year
(1,571,405,756) (160,106,897) (0.40) (0.04)
NOTES TO THE FINANCIAL STATEMENTSas at and for the year ended 31 December 2011

358
INTERNATIONAL CONSUMER PRODUCTS CORPORATION
9. Tangible fi xed assetsVND
Buildings & structures
Machinery & equipment
Means of transportation
Offi ce equipment Total
Cost:Beginning balance 4,835,166,682 17,826,557,586 3,378,524,601 2,107,766,018 28,148,014,887
Newly purchased – 691,260,576 – 779,886,025 1,471,146,601
Transferred from construction in progress – 2,609,576,591 – – 2,609,576,591
Sold, disposed – – – (226,381,183) (226,381,183)
Ending balance 4,835,166,682 21,127,394,753 3,378,524,601 2,661,270,860 32,002,356,896In which:Fully depreciated – 5,841,165,703 16,730,476 428,406,431 6,286,302,610
Accumulated depreciationBeginning balance (1,125,436,850) (11,386,108,165) (1,728,700,743) (1,168,582,017) (15,408,827,775)
Depreciation for the year (218,268,539) (3,096,768,599) (658,553,548) (597,743,160) (4,571,333,846)
Sold, disposed – – – 167,804,705 167,804,705Ending balance (1,343,705,396) (14,482,876,764) (2,387,254,284) (1,598,520,472) (19,812,356,916)
Net carrying amount
Beginning balance 3,709,729,832 6,440,449,421 1,649,823,858 939,184,001 12,739,187,112
Ending balance 3,491,461,293 6,644,550,469 991,270,317 1,062,750,388 12,189,999,980
(Rs. Crore)Buildings &
structuresMachinery &
equipmentMeans of
transportationOffi ce
equipment Total
Cost:Beginning balance 1.22 4.50 0.85 0.53 7.10
Newly purchased – 0.17 – 0.20 0.37
Transferred from construction in progress – 0.66 – – 0.66
Sold, disposed – – – (0.06) (0.06)
Ending balance 1.22 5.33 0.85 0.67 8.07In which:Fully depreciated – 1.47 – 0.11 1.59
Accumulated depreciationBeginning balance (0.28) (2.87) (0.44) (0.29) (3.89)
Depreciation for the year (0.06) (0.78) (0.17) (0.15) (1.15)
Sold, disposed – – – 0.04 0.04Ending balance (0.34) (3.65) (0.60) (0.40) (5.00)
Net carrying amount:
Beginning balance 0.94 1.62 0.42 0.24 3.21
Ending balance 0.88 1.68 0.25 0.27 3.08
NOTES TO THE FINANCIAL STATEMENTSas at and for the year ended 31 December 2011
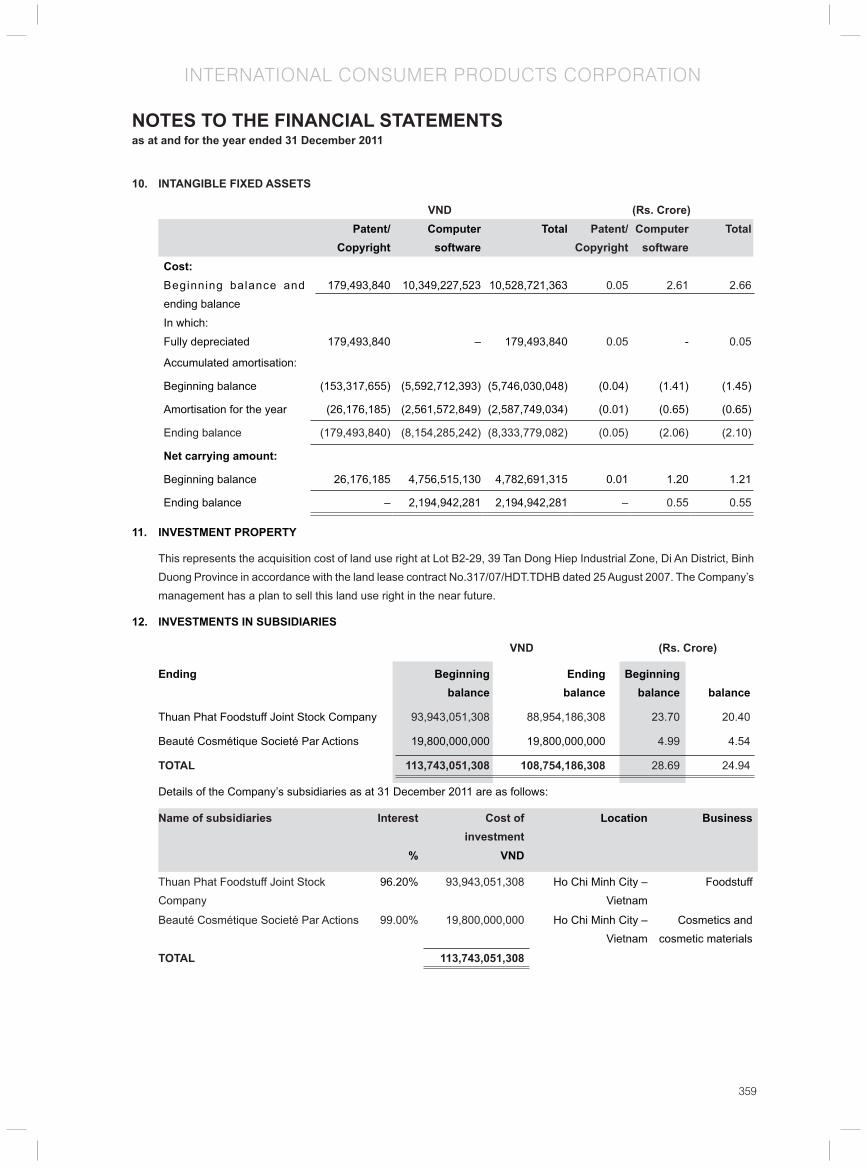
359
INTERNATIONAL CONSUMER PRODUCTS CORPORATION
10. INTANGIBLE FIXED ASSETS
VND (Rs. Crore)Patent/
CopyrightComputer
softwareTotal Patent/
CopyrightComputer
softwareTotal
Cost:Beginning balance and ending balance
179,493,840 10,349,227,523 10,528,721,363 0.05 2.61 2.66
In which:
Fully depreciated 179,493,840 – 179,493,840 0.05 - 0.05
Accumulated amortisation:
Beginning balance (153,317,655) (5,592,712,393) (5,746,030,048) (0.04) (1.41) (1.45)
Amortisation for the year (26,176,185) (2,561,572,849) (2,587,749,034) (0.01) (0.65) (0.65)
Ending balance (179,493,840) (8,154,285,242) (8,333,779,082) (0.05) (2.06) (2.10)
Net carrying amount:
Beginning balance 26,176,185 4,756,515,130 4,782,691,315 0.01 1.20 1.21
Ending balance – 2,194,942,281 2,194,942,281 – 0.55 0.55
11. INVESTMENT PROPERTY
This represents the acquisition cost of land use right at Lot B2-29, 39 Tan Dong Hiep Industrial Zone, Di An District, Binh Duong Province in accordance with the land lease contract No.317/07/HDT.TDHB dated 25 August 2007. The Company’s management has a plan to sell this land use right in the near future.
12. INVESTMENTS IN SUBSIDIARIES
VND (Rs. Crore)
Ending Beginning Ending Beginning balance balance balance balance
Thuan Phat Foodstuff Joint Stock Company 93,943,051,308 88,954,186,308 23.70 20.40
Beauté Cosmétique Societé Par Actions 19,800,000,000 19,800,000,000 4.99 4.54
TOTAL 113,743,051,308 108,754,186,308 28.69 24.94
Details of the Company’s subsidiaries as at 31 December 2011 are as follows:
Name of subsidiaries Interest Cost of investment
Location Business
% VND
Thuan Phat Foodstuff Joint Stock Company
96.20% 93,943,051,308 Ho Chi Minh City – Vietnam
Foodstuff
Beauté Cosmétique Societé Par Actions 99.00% 19,800,000,000 Ho Chi Minh City – Vietnam
Cosmetics and cosmetic materials
TOTAL 113,743,051,308
NOTES TO THE FINANCIAL STATEMENTSas at and for the year ended 31 December 2011

360
INTERNATIONAL CONSUMER PRODUCTS CORPORATION
Name of subsidiaries Interest Cost of investment
Location Business
% Rs. Crore
Thuan Phat Foodstuff Joint Stock Company
96.20% 23.70 Ho Chi Minh City – Vietnam
Foodstuff
Beauté Cosmétique Societé Par Actions 99.00% 4.99 Ho Chi Minh City – Vietnam
Cosmetics and cosmetic materials
TOTAL 28.69
Beauté Cosmétique Societé Par Actions (“BCS”), a shareholding company, was established in accordance with Business Registration Certifi cate No. 4103010586 issued by the Department of Planning and Investment of Ho Chi Minh City on 12 June 2008. As at 31 December 2011, Company holds a 99% equity share in this subsidiary.
Thuan Phat Foodstuff Joint Stock Company (“Thuan Phat”), a shareholding company, was established in accordance with Business Registration Certifi cate No. 41030067667 issued by the Department of Planning and Investment of Ho Chi Minh City on 18 May 2007. As at 31 December 2011, Company holds a 96.20% equity share in this subsidiary.
13. Long-term prepaid expenses
VND (Rs. Crore)
Ending balance
Beginning balance
Ending balance
Beginning balance
Leasehold improvement for Hai Au Offi ce 1,710,412,332 3,327,264,000 0.43 0.76
Land rental 2,202,595,560 2,066,782,822 0.56 0.47
Others 1,188,987,771 1,897,796,690 0.30 0.44
TOTAL 5,101,995,663 7,291,843,512 1.29 1.67
14. STATUTORY OBLIGATIONS
VND (Rs. Crore)
Ending balance
Beginning balance
Ending balance
Beginning balance
Corporate income tax (Note 21.1) 4,276,585,098 2,961,674,499 1.08 0.68
Value added tax 2,206,264,283 1,190,267,396 0.56 0.27
Personal income tax 695,752,625 507,651,737 0.18 0.12
Others – 115,716,371 – 0.03
TOTAL 7,178,602,006 4,775,310,003 1.82 1.10
15. ACCRUED EXPENSES
VND (Rs. Crore)
Ending balance
Beginning balance
Ending balance
Beginning balance
Promotion expenses 8,311,464,705 2,750,396,883 2.10 0.63
Salary for outsource sales person 5,306,210,284 – 1.34 –
Advertising accruals 1,422,557,247 745,180,907 0.36 0.17
Others 2,287,124,785 2,180,694,829 0.58 0.50
TOTAL 17,327,357,021 5,676,272,619 4.38 1.30
NOTES TO THE FINANCIAL STATEMENTSas at and for the year ended 31 December 2011
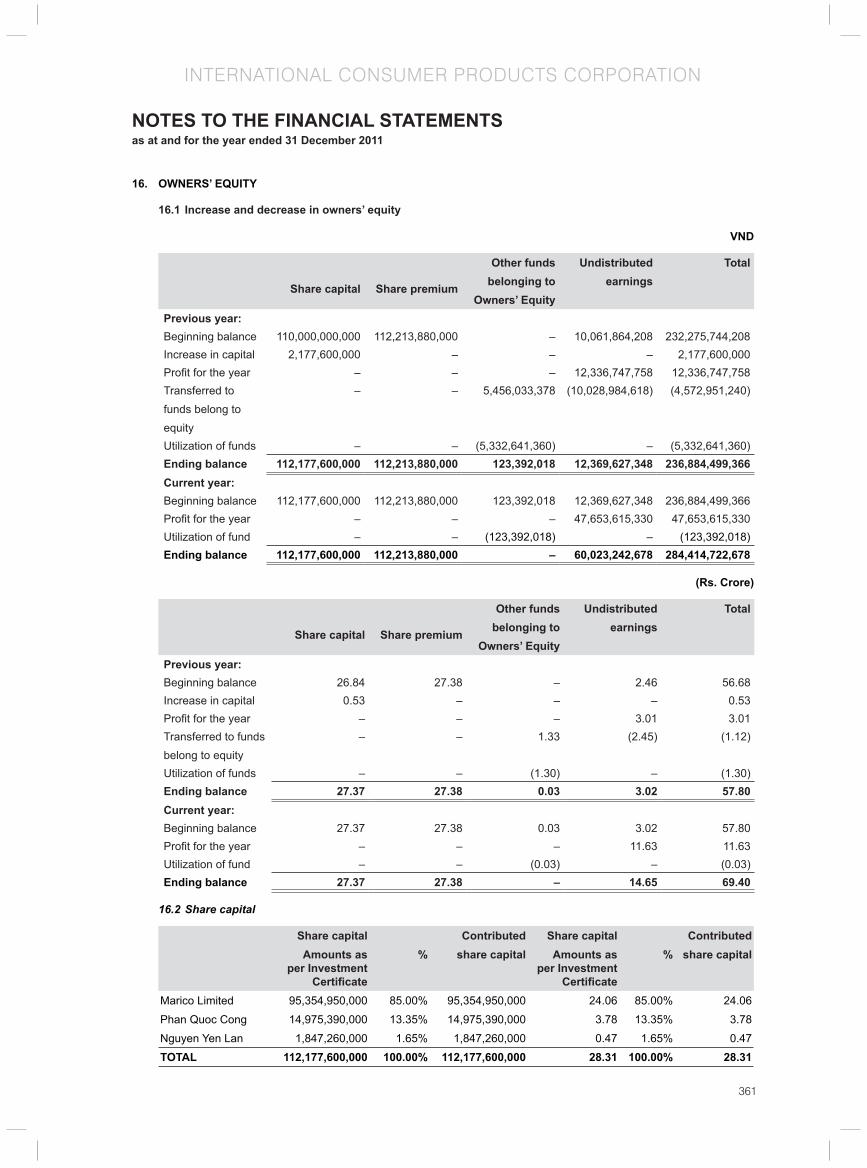
361
INTERNATIONAL CONSUMER PRODUCTS CORPORATION
16. OWNERS’ EQUITY
16.1 Increase and decrease in owners’ equity
VND
Share capital Share premium
Other funds belonging to
Owners’ Equity
Undistributed earnings
Total
Previous year:Beginning balance 110,000,000,000 112,213,880,000 – 10,061,864,208 232,275,744,208Increase in capital 2,177,600,000 – – – 2,177,600,000Profi t for the year – – – 12,336,747,758 12,336,747,758Transferred to funds belong to equity
– – 5,456,033,378 (10,028,984,618) (4,572,951,240)
Utilization of funds – – (5,332,641,360) – (5,332,641,360)Ending balance 112,177,600,000 112,213,880,000 123,392,018 12,369,627,348 236,884,499,366Current year:Beginning balance 112,177,600,000 112,213,880,000 123,392,018 12,369,627,348 236,884,499,366Profi t for the year – – – 47,653,615,330 47,653,615,330Utilization of fund – – (123,392,018) – (123,392,018)Ending balance 112,177,600,000 112,213,880,000 – 60,023,242,678 284,414,722,678
(Rs. Crore)
Share capital Share premium
Other funds belonging to
Owners’ Equity
Undistributed earnings
Total
Previous year:Beginning balance 26.84 27.38 – 2.46 56.68 Increase in capital 0.53 – – – 0.53 Profi t for the year – – – 3.01 3.01 Transferred to funds belong to equity
– – 1.33 (2.45) (1.12)
Utilization of funds – – (1.30) – (1.30)Ending balance 27.37 27.38 0.03 3.02 57.80Current year:Beginning balance 27.37 27.38 0.03 3.02 57.80 Profi t for the year – – – 11.63 11.63 Utilization of fund – – (0.03) – (0.03)Ending balance 27.37 27.38 – 14.65 69.40
16.2 Share capital
Share capital Contributed Share capital ContributedAmounts as
per Investment Certifi cate
% share capital Amounts as per Investment
Certifi cate
% share capital
Marico Limited 95,354,950,000 85.00% 95,354,950,000 24.06 85.00% 24.06
Phan Quoc Cong 14,975,390,000 13.35% 14,975,390,000 3.78 13.35% 3.78
Nguyen Yen Lan 1,847,260,000 1.65% 1,847,260,000 0.47 1.65% 0.47
TOTAL 112,177,600,000 100.00% 112,177,600,000 28.31 100.00% 28.31
NOTES TO THE FINANCIAL STATEMENTSas at and for the year ended 31 December 2011
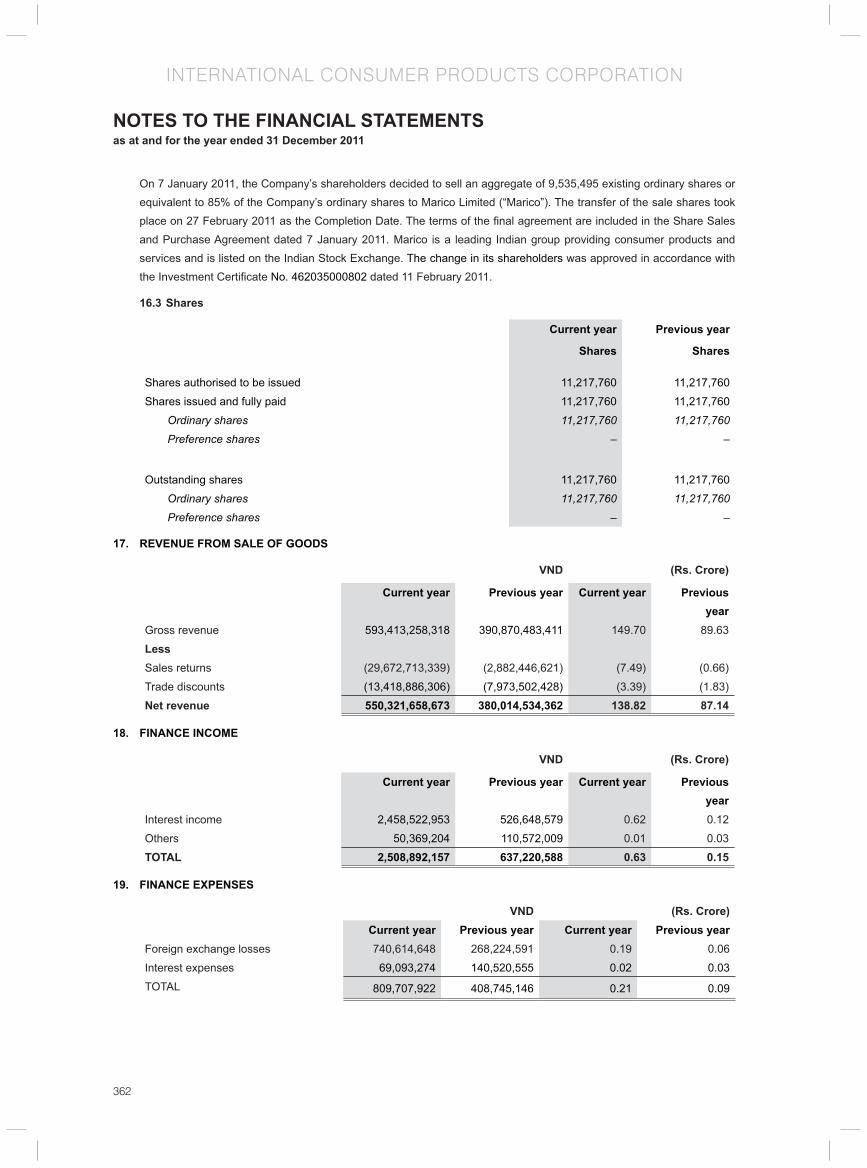
362
INTERNATIONAL CONSUMER PRODUCTS CORPORATION
On 7 January 2011, the Company’s shareholders decided to sell an aggregate of 9,535,495 existing ordinary shares or equivalent to 85% of the Company’s ordinary shares to Marico Limited (“Marico”). The transfer of the sale shares took place on 27 February 2011 as the Completion Date. The terms of the fi nal agreement are included in the Share Sales and Purchase Agreement dated 7 January 2011. Marico is a leading Indian group providing consumer products and services and is listed on the Indian Stock Exchange. The change in its shareholders was approved in accordance with the Investment Certifi cate No. 462035000802 dated 11 February 2011.
16.3 Shares
Current year Previous year
Shares Shares
Shares authorised to be issued 11,217,760 11,217,760
Shares issued and fully paid 11,217,760 11,217,760
Ordinary shares 11,217,760 11,217,760
Preference shares – –
Outstanding shares 11,217,760 11,217,760
Ordinary shares 11,217,760 11,217,760
Preference shares – –
17. REVENUE FROM SALE OF GOODS
VND (Rs. Crore)
Current year Previous year Current year Previous year
Gross revenue 593,413,258,318 390,870,483,411 149.70 89.63
LessSales returns (29,672,713,339) (2,882,446,621) (7.49) (0.66)
Trade discounts (13,418,886,306) (7,973,502,428) (3.39) (1.83)
Net revenue 550,321,658,673 380,014,534,362 138.82 87.14
18. FINANCE INCOME
VND (Rs. Crore)
Current year Previous year Current year Previous year
Interest income 2,458,522,953 526,648,579 0.62 0.12
Others 50,369,204 110,572,009 0.01 0.03
TOTAL 2,508,892,157 637,220,588 0.63 0.15
19. FINANCE EXPENSES
VND (Rs. Crore)Current year Previous year Current year Previous year
Foreign exchange losses 740,614,648 268,224,591 0.19 0.06
Interest expenses 69,093,274 140,520,555 0.02 0.03
TOTAL 809,707,922 408,745,146 0.21 0.09
NOTES TO THE FINANCIAL STATEMENTSas at and for the year ended 31 December 2011
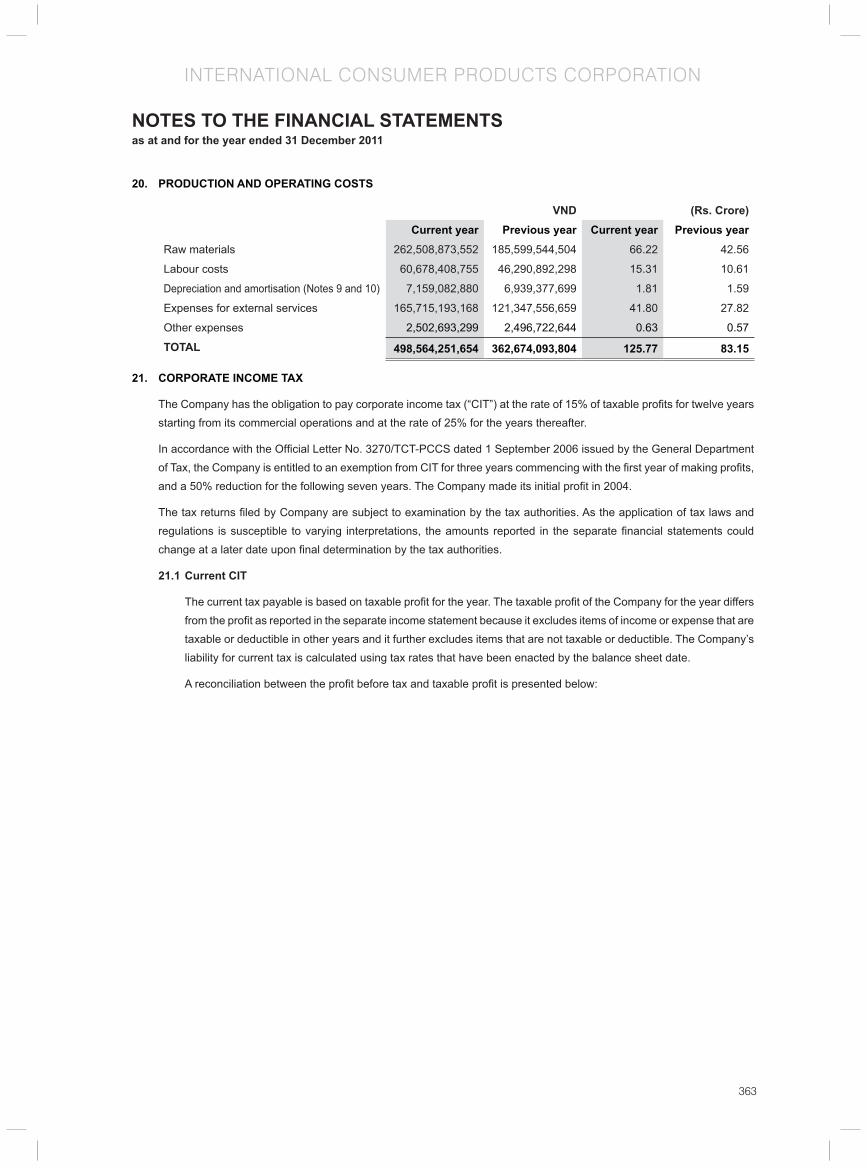
363
INTERNATIONAL CONSUMER PRODUCTS CORPORATION
20. PRODUCTION AND OPERATING COSTS
VND (Rs. Crore)Current year Previous year Current year Previous year
Raw materials 262,508,873,552 185,599,544,504 66.22 42.56
Labour costs 60,678,408,755 46,290,892,298 15.31 10.61
Depreciation and amortisation (Notes 9 and 10) 7,159,082,880 6,939,377,699 1.81 1.59
Expenses for external services 165,715,193,168 121,347,556,659 41.80 27.82
Other expenses 2,502,693,299 2,496,722,644 0.63 0.57
TOTAL 498,564,251,654 362,674,093,804 125.77 83.15
21. CORPORATE INCOME TAX
The Company has the obligation to pay corporate income tax (“CIT”) at the rate of 15% of taxable profi ts for twelve years starting from its commercial operations and at the rate of 25% for the years thereafter.
In accordance with the Offi cial Letter No. 3270/TCT-PCCS dated 1 September 2006 issued by the General Department of Tax, the Company is entitled to an exemption from CIT for three years commencing with the fi rst year of making profi ts, and a 50% reduction for the following seven years. The Company made its initial profi t in 2004.
The tax returns fi led by Company are subject to examination by the tax authorities. As the application of tax laws and regulations is susceptible to varying interpretations, the amounts reported in the separate fi nancial statements could change at a later date upon fi nal determination by the tax authorities.
21.1 Current CIT
The current tax payable is based on taxable profi t for the year. The taxable profi t of the Company for the year differs from the profi t as reported in the separate income statement because it excludes items of income or expense that are taxable or deductible in other years and it further excludes items that are not taxable or deductible. The Company’s liability for current tax is calculated using tax rates that have been enacted by the balance sheet date.
A reconciliation between the profi t before tax and taxable profi t is presented below:
NOTES TO THE FINANCIAL STATEMENTSas at and for the year ended 31 December 2011

364
INTERNATIONAL CONSUMER PRODUCTS CORPORATION
VND
Current year Previous year Manufacturing
activitiesTrading
activitiesOther
activitiesTotal
Profi t before tax 51,637,983,283 119,423,736 1,824,590,079 53,581,997,098 17,108,081,834
Adjustments to increase (decrease) accounting profi t Advertising expenses exceeding the deductible cap
27,830,728,019 – – 27,830,728,019 31,127,937,252
Non-deductible expenses 1,442,953,745 307,713,942 3,600,000 1,754,267,687 1,471,300,541Change in accrued expenses 8,682,550,364 – – 8,682,550,364 (6,840,614,381)Change in provision for obsolete inventories
1,309,677,783 101,621,076 – 1,411,298,859 –
Change in provision for severance allowance
165,081,032 – – 165,081,032 –29,899,946
Unearned profi t from goods issued invoices without delivered
117,204,747 – – 117,204,747 –
G a i n o n f o r e i g n e x c h a n g e difference
– – (18,317,743) (18,317,743) –
Change in provision for doubtful debts – – – – (25,117,800)Estimated current taxable profi t 91,186,178,973 528,758,754 1,809,872,336 93,524,810,063 42,811,687,500Estimated Current CIT 13,677,926,846 132,189,689 452,468,084 14,262,584,619 6,421,753,125CIT reduction (50%) (6,838,963,423) (3,210,876,563)
Estimated Current CIT after reduction
7,423,621,196 3,210,876,562
CIT payable at beginning of year 2,961,674,499 4,501,026,639CIT paid during the year (6,108,710,597) (4,750,228,702)CIT payable at end of year 4,276,585,098 2,961,674,499
(Rs. Crore)Current year Previous year
Manufacturing activities
Trading activities
Other activities Total
Profi t before tax 13.03 0.03 0.46 13.52 3.92
Adjustments to increase (decrease) accounting profi t Advertising expenses exceeding the deductible cap
7.02 – – 7.02 7.14
Non-deductible expenses 0.36 0.08 – 0.44 0.34 Change in accrued expenses 2.19 – – 2.19 (1.57)Change in provision for obsolete inventories
0.33 0.03 – 0.36 –
Change in provision for severance allowance
0.04 – – 0.04 (0.01)
Unearned profi t from goods issued invoices without delivered
0.03 – – 0.03 –
G a i n o n f o r e i g n e x c h a n g e difference
– – – – –
Change in provision for doubtful debts – – – – (0.01)Estimated current taxable profi t 23.00 0.13 0.46 23.59 9.82 Estimated Current CIT 3.45 0.03 0.11 3.60 1.47 CIT reduction (50%) (1.73) (0.74)
Estimated Current CIT after reduction
1.87 0.74
CIT payable at beginning of year 0.75 1.03 CIT paid during the year (1.54) (1.09)CIT payable at end of year 1.08 0.68
NOTES TO THE FINANCIAL STATEMENTSas at and for the year ended 31 December 2011

365
INTERNATIONAL CONSUMER PRODUCTS CORPORATION
21.2 Deferred CIT
The following are the deferred tax assets and liabilities recognised by the Company, and the movements thereon, during the current and prior years:
VNDSeparate balance sheet Separate income statement
Ending balance Beginning Balance Current year Previous year
Accrued expenses 749,459,957 (513,046,079) 1,262,506,036 (1,451,812,875)
Provision for obsolete inventories 123,631,103 – 123,631,103 (12,008,017)
Provision for severance allowance 100,765,038 (2,242,496) 103,007,534 (92,868,952)
Unearned profit from goods issued invoices without delivered
8,790,356 – 8,790,356 –
Foreign exchange difference (4,579,436) – (4,579,436) –
Provision for doubtful debts – (1,883,835) 1,883,835 (3,767,670)
Deferred CIT assets (liabilities) 978,067,018 (517,172,410)Net deferred CIT credit (expense) to separate income statement 1,495,239,428 (1,560,457,514)
(Rs. Crore)
Separate balance sheet Separate income statement
Ending balance Beginning Balance Current year Previous year
Accrued expenses 0.19 (0.12) 0.32 (0.33)
Provision for obsolete inventories 0.03 – 0.03 –
Provision for severance allowance 0.03 – 0.03 (0.02)
Unearned profit from goods issued invoices without delivered
– – – –
Foreign exchange difference – – – –
Provision for doubtful debts – – – –
Deferred CIT assets (liabilities) 0.25 (0.12)Net deferred CIT credit (expense) to separate income statement 0.38 (0.35)
22. TRANSACTIONS with related PARTIES
Signifi cant transactions with related parties during the year were as follows:
VND (Rs,Crore)Related parties Relationship Transactions Amounts
Beauté Cosmétique Societé Par Actions
Subsidiary Non-interest bearing borrowings
3,000,000,000 0.76
Sale of goods 2,347,237,900 0.59
Purchase of goods 106,001,471 0.03
Sale of fi xed assets 45,454,545 0.01
Thuan Phat Foodstuff Joint Stock Company
Subsidiary Purchase of goods 89,003,064,108 22.45
Sale of goods 311,850,057 0.08
NOTES TO THE FINANCIAL STATEMENTSas at and for the year ended 31 December 2011

366
INTERNATIONAL CONSUMER PRODUCTS CORPORATION
Amounts due from related parties at the balance sheet date were as follows:
Relationship Transactions Amount (VND) (Rs,Crore)
Advances to a supplierThuan Phat Foodstuff Joint Stock Company Subsidiary
Advance to purchase goods 22,349,011,145 5.64
Other receivableBeauté Cosmétique Societé Par Actions Subsidiary
Non-interest bearing borrowings 3,000,000,000 0.76
23. FINANCIAL RISK MANAGEMENT OBJECTIVES AND POLICIES
The Company’s principal fi nancial liabilities comprise trade and other payables. The main purpose of these fi nancial liabilities is to fi nance the Company’s operations. The Company has trade and other receivables, and cash and short-term deposits that arise directly from its operations. The Company does not hold or issue derivative fi nancial instruments.
The Company is exposed to market risk, credit risk and liquidity risk.
Risk management is integral to the whole business of the Company. The Company has a system of controls in place to create an acceptable balance between the cost of risks occurring and the cost of managing the risks. The management continually monitors the Company’s risk management process to ensure that an appropriate balance between risk and control is achieved.
Management reviews and agrees policies for managing each of these risks which are summarized below.
Market risk
Market risk is the risk that the fair value of future cash fl ows of a fi nancial instrument will fl uctuate because of changes in market prices. Market prices comprise four types of risk: interest rate risk, currency risk, commodity price risk and other price risk, such as equity price risk. Financial instruments affected by market risk include cash and deposits.
The sensitivity analyses in the following sections relate to the position as at 31 December 2011 and 31 December 2010.
The sensitivity analyses have been prepared on the basis that the amount of net debt, the ratio of fi xed to fl oating interest rates of the debt and the proportion of fi nancial instruments in foreign currencies are all constant.
In calculating the sensitivity analyses, management assumed that:
� the sensitivity of the balance sheet relates to available-for-sale debt instrument;
� the sensitivity of the relevant income statement item is the effect of the assumed changes in respective market risks. This is based on the fi nancial assets and fi nancial liabilities held at 31 December 2011 and 31 December 2010.
Interest rate risk
Interest rate risk is the risk that the fair value or future cash fl ows of a fi nancial instrument will fl uctuate because of changes in market interest rates. The Company’s exposure to market risk for changes in interest rate relates primarily to the Company’s cash and short-term deposits. These investments are mainly short term in nature and they are not held for speculative purposes.
Interest rate sensitivity
The following table demonstrates the sensitivity to a reasonably possible change in interest rates on that portion of cash and short-term deposits.
With all other variables held constant, the Company’s profi t before tax is affected through the impact on cash and short-term deposits as follows:
NOTES TO THE FINANCIAL STATEMENTSas at and for the year ended 31 December 2011
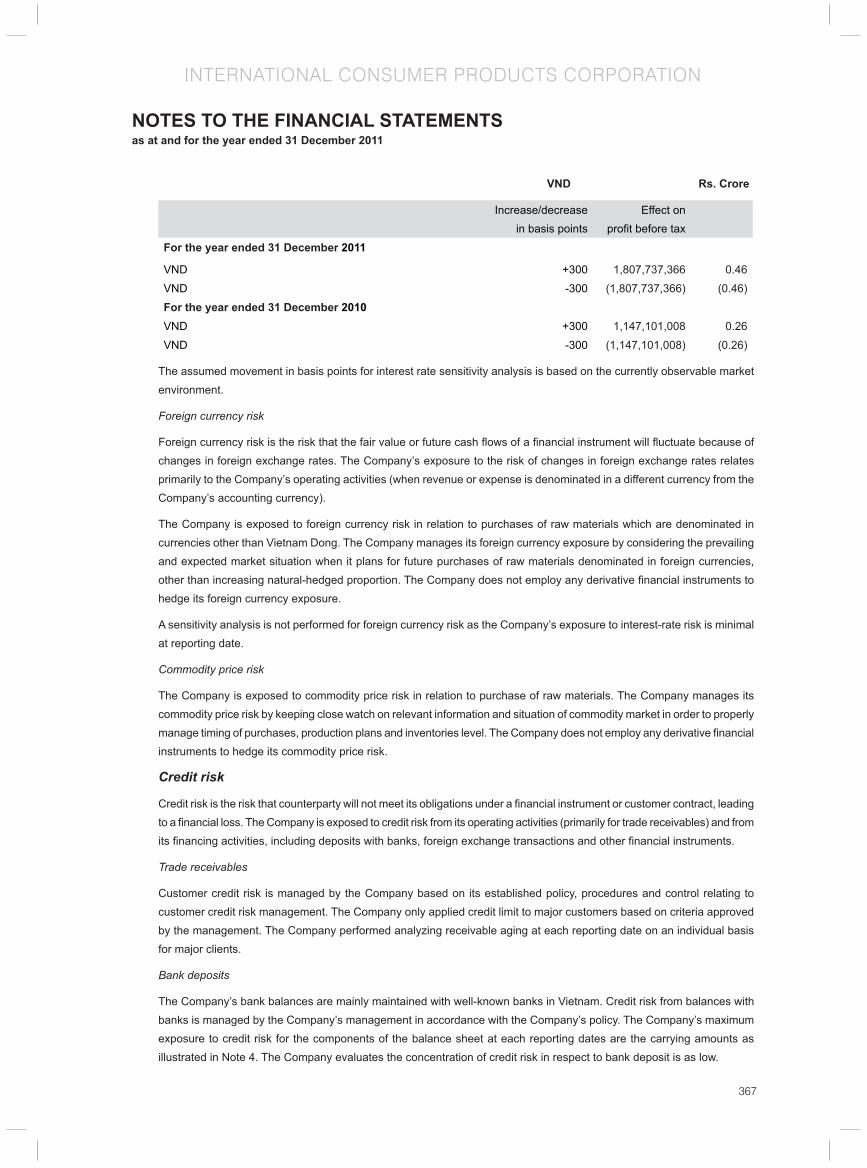
367
INTERNATIONAL CONSUMER PRODUCTS CORPORATION
VND Rs. Crore
Increase/decrease in basis points
Effect on profi t before tax
For the year ended 31 December 2011
VND +300 1,807,737,366 0.46
VND -300 (1,807,737,366) (0.46)
For the year ended 31 December 2010VND +300 1,147,101,008 0.26
VND -300 (1,147,101,008) (0.26)
The assumed movement in basis points for interest rate sensitivity analysis is based on the currently observable market environment.
Foreign currency risk
Foreign currency risk is the risk that the fair value or future cash fl ows of a fi nancial instrument will fl uctuate because of changes in foreign exchange rates. The Company’s exposure to the risk of changes in foreign exchange rates relates primarily to the Company’s operating activities (when revenue or expense is denominated in a different currency from the Company’s accounting currency).
The Company is exposed to foreign currency risk in relation to purchases of raw materials which are denominated in currencies other than Vietnam Dong. The Company manages its foreign currency exposure by considering the prevailing and expected market situation when it plans for future purchases of raw materials denominated in foreign currencies, other than increasing natural-hedged proportion. The Company does not employ any derivative fi nancial instruments to hedge its foreign currency exposure.
A sensitivity analysis is not performed for foreign currency risk as the Company’s exposure to interest-rate risk is minimal at reporting date.
Commodity price risk
The Company is exposed to commodity price risk in relation to purchase of raw materials. The Company manages its commodity price risk by keeping close watch on relevant information and situation of commodity market in order to properly manage timing of purchases, production plans and inventories level. The Company does not employ any derivative fi nancial instruments to hedge its commodity price risk.
Credit risk
Credit risk is the risk that counterparty will not meet its obligations under a fi nancial instrument or customer contract, leading to a fi nancial loss. The Company is exposed to credit risk from its operating activities (primarily for trade receivables) and from its fi nancing activities, including deposits with banks, foreign exchange transactions and other fi nancial instruments.
Trade receivables
Customer credit risk is managed by the Company based on its established policy, procedures and control relating to customer credit risk management. The Company only applied credit limit to major customers based on criteria approved by the management. The Company performed analyzing receivable aging at each reporting date on an individual basis for major clients.
Bank deposits
The Company’s bank balances are mainly maintained with well-known banks in Vietnam. Credit risk from balances with banks is managed by the Company’s management in accordance with the Company’s policy. The Company’s maximum exposure to credit risk for the components of the balance sheet at each reporting dates are the carrying amounts as illustrated in Note 4. The Company evaluates the concentration of credit risk in respect to bank deposit is as low.
NOTES TO THE FINANCIAL STATEMENTSas at and for the year ended 31 December 2011

368
INTERNATIONAL CONSUMER PRODUCTS CORPORATION
Liquidity risk
The liquidity risk is the risk that the Company will encounter diffi culty in meeting fi nancial obligation due to shortage of funds. The Company’s exposure to liquidity risk arises primarily from mismatches of maturities of fi nancial assets and liabilities.
The Company monitors its liquidity risk by maintain a level of cash and cash equivalents deemed adequate by management to fi nance the Company’s operations and to mitigate the effects of fl uctuations in cash fl ows.
As at the balance sheet date, all the Company’s fi nancial liabilities are current liability and have the maturity date within one year. The Company can make cash fl ow from operating activities to pay the current liabilities.
Collateral
The Company has pledged some inventories amounting equivalent to US$ 1,000,000 to guarantee for long-term loans of Thuan Phat Foodstuff Joint Stock Company – its subsidiary obtained from HSBC Bank (Vietnam) Limited..There are no other signifi cant terms and conditions associated with the use of collateral.
The Company did not hold collateral at 31 December 2011 and 31 December 2010.
24. FINANCIAL ASSETS AND FINANCIAL LIABILITIES
Set out below is a comparison by class of the carrying amounts and fair value of the Company’s fi nancial instruments that are carried in the fi nancial statements.
VND
Carrying Amount Fair Value
Ending balance Beginning balance Ending balance Beginning balance
Cost Provision Cost Provision
Financial assetsTrade receivables 20,927,965,578 – 14,410,016,918 – 20,927,965,578 14,410,016,918
Other receivables 3,705,900,309 – 63,058,189 – 3,705,900,309 63,058,189
Other fi nancial assets 2,705,777,012 – 545,576,201 – 2,705,777,012 545,576,201
Cash and cash equivalents 60,353,360,852 – 38,241,076,815 – 60,353,360,852 38,241,076,815
TOTAL 87,693,003,751 – 53,259,728,123 – 87,693,003,751 53,259,728,123
Carrying amount Fair value
Ending balance Beginning balance
Ending balance Beginning balance
Financial liabilitiesTrade payables 29,338,982,324 25,905,092,774 29,338,982,324 25,905,092,774
Other liabilities 17,471,494,286 5,944,505,512 17,471,494,286 5,944,505,512
TOTAL 46,810,476,610 31,849,598,286 46,810,476,610 31,849,598,286
(Rs. Corer)
Carrying Amount Fair Value
Ending balance Beginning balance Ending balance Beginning balance
Cost Provision Cost Provision
Financial assetsTrade receivables 5.28 – 3.30 – 5.28 3.30
Other receivables 0.93 – 0.01 – 0.93 0.01
Other fi nancial assets 0.68 – 0.13 – 0.68 0.13
Cash and cash equivalents 15.23 – 8.77 – 15.23 8.77
TOTAL 22.12 – 12.21 – 22.12 12.21
NOTES TO THE FINANCIAL STATEMENTSas at and for the year ended 31 December 2011
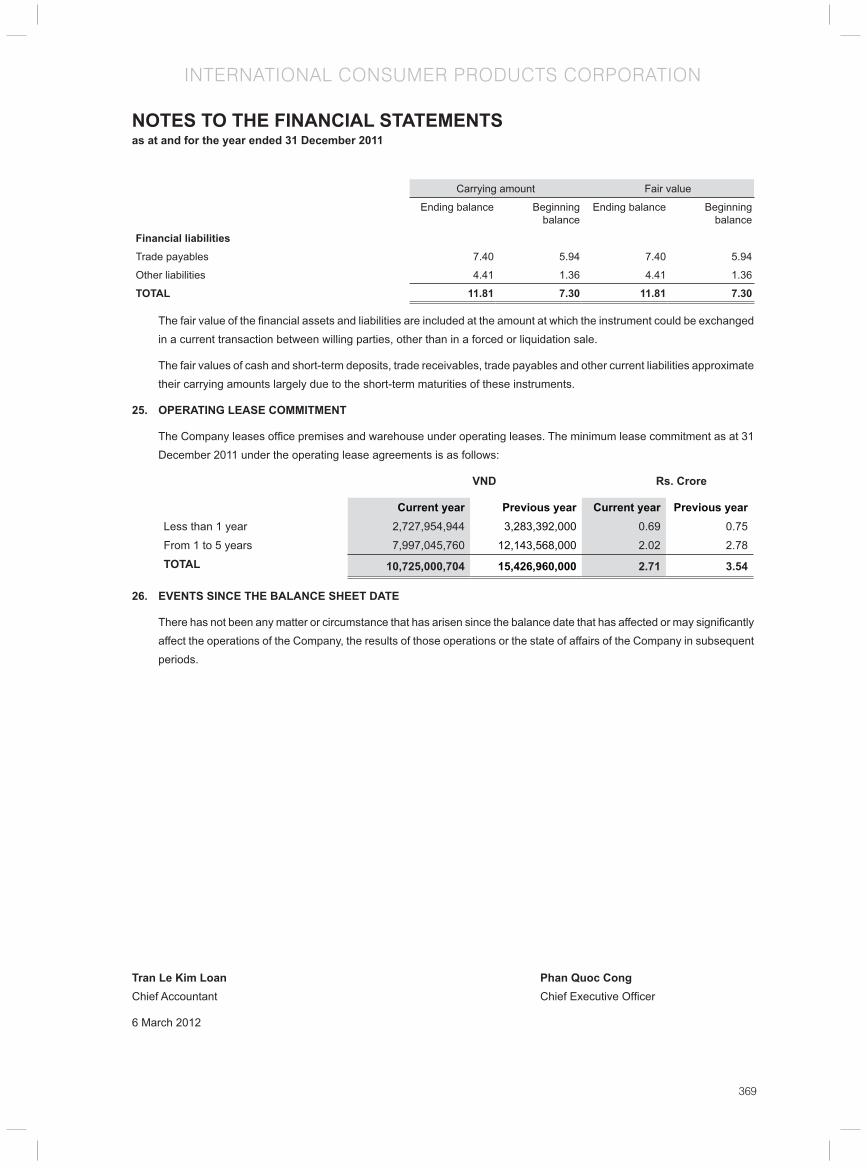
369
INTERNATIONAL CONSUMER PRODUCTS CORPORATION
Carrying amount Fair value
Ending balance Beginning balance
Ending balance Beginning balance
Financial liabilitiesTrade payables 7.40 5.94 7.40 5.94
Other liabilities 4.41 1.36 4.41 1.36
TOTAL 11.81 7.30 11.81 7.30
The fair value of the fi nancial assets and liabilities are included at the amount at which the instrument could be exchanged in a current transaction between willing parties, other than in a forced or liquidation sale.
The fair values of cash and short-term deposits, trade receivables, trade payables and other current liabilities approximate their carrying amounts largely due to the short-term maturities of these instruments.
2 5. OPERATING LEASE COMMITMENT
The Company leases offi ce premises and warehouse under operating leases. The minimum lease commitment as at 31 December 2011 under the operating lease agreements is as follows:
VND Rs. Crore
Current year Previous year Current year Previous yearLess than 1 year 2,727,954,944 3,283,392,000 0.69 0.75
From 1 to 5 years 7,997,045,760 12,143,568,000 2.02 2.78
TOTAL 10,725,000,704 15,426,960,000 2.71 3.54
26. EVENTS SINCE THE BALANCE SHEET DATE
There has not been any matter or circumstance that has arisen since the balance date that has affected or may signifi cantly affect the operations of the Company, the results of those operations or the state of affairs of the Company in subsequent periods.
Tran Le Kim Loan Phan Quoc CongChief Accountant Chief Executive Offi cer
6 March 2012
NOTES TO THE FINANCIAL STATEMENTSas at and for the year ended 31 December 2011
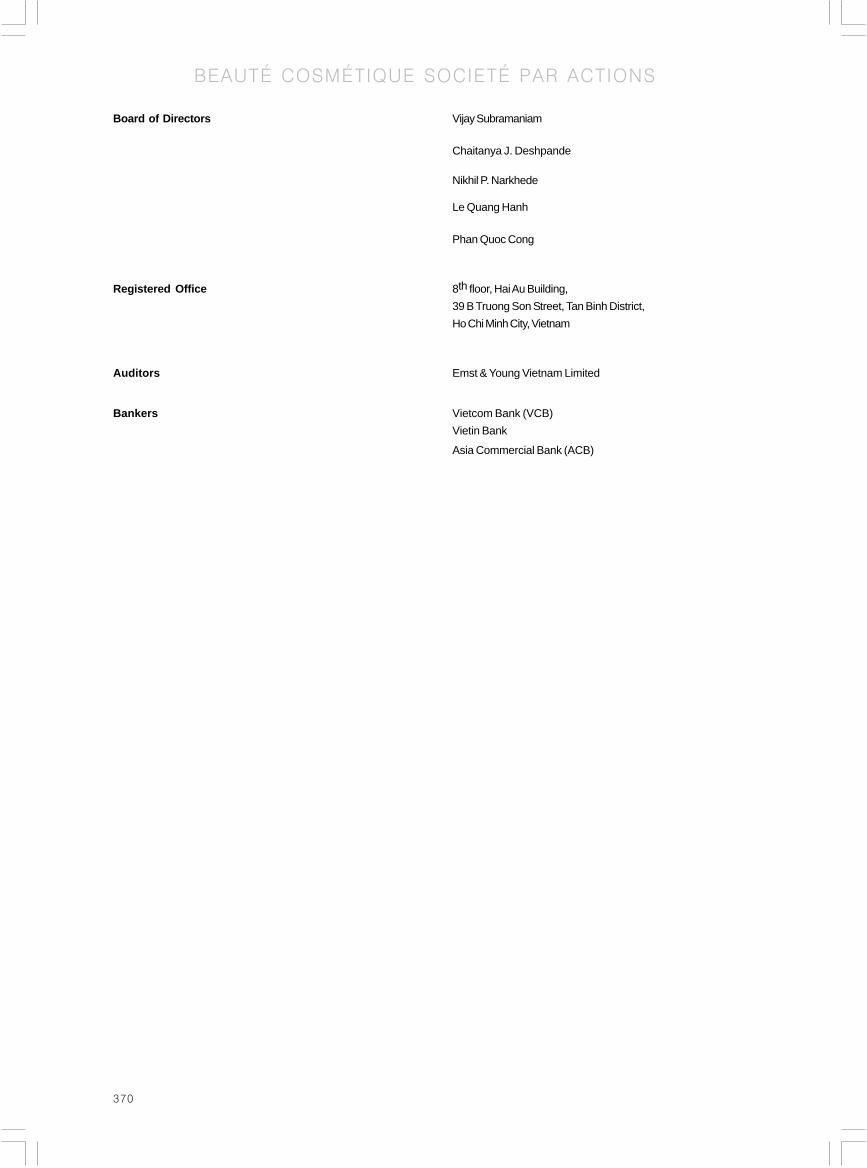
370
BEAUTÉ COSMÉTIQUE SOCIETÉ PAR ACTIONS
Board of Directors Vijay Subramaniam
Chaitanya J. Deshpande
Nikhil P. Narkhede
Le Quang Hanh
Phan Quoc Cong
Registered Office 8th floor, Hai Au Building,
39 B Truong Son Street, Tan Binh District,
Ho Chi Minh City, Vietnam
Auditors Emst & Young Vietnam Limited
Bankers Vietcom Bank (VCB)
Vietin Bank
Asia Commercial Bank (ACB)

371
BEAUTÉ COSMÉTIQUE SOCIETÉ PAR ACTIONS
The Board of Management of Beaute Cosmetique Societe Par Actions (“the Company”) is pleased to present its report and the
financial statement of the Company as at December 2010 and for the year then ended.
THE COMPANY
Beauté Cosmétique Societé Par Actions (“the Company”) was initially established as a limited liability company in accordance
with License of Incorporation No. 4102033640 issued by the Department of Planning and Investment of Ho Chi Minh City on
4 October 2005.
On 12 June 2008, the Company registered to transform from a limited liability company to a joint stock company and was approved
by the Department of Planning and Investment of Ho Chi Minh City in the Business Registration Certificate No. 4103010586 and the
following Amended Business Registration Certificates:
Amended Business Registration Certificate No. Date
0304073031 – 1st amendment 24 December 2008
0304073031 – 2nd amendment 11 December 2009
0304073031 – 3rd amendment 20 January 2010
0304073031 – 4th amendment 28 May 2010
Joint Stock Enterprise Registration Certificate No. Date
0304073031 24 August 2010
The Company’s principal activities are to produce and trade in cosmetics, cosmetic materials and foodstuffs.
The registered office of the Company is located at 8th floor, Hai Au Building, 39B Truong Son Street, Tan Binh District, Ho Chi Minh
City.
THE BOARD OF DIRECTORS
Members of the Board of Directors during the year and at the date of this report are:
Mr. Vijay S. Subramaniam Chairman Appointed on 25 August 2011
Mr. Chaitanya J. Deshpande Member Appointed on 25 August 2011
Mr. Nikhil P. Narkhede Member Appointed on 25 August 2011
Mr. Le Quang Hanh Member Appointed on 25 August 2011
Mr. Phan Quoc Cong Member Appointed on 25 August 2011
GENERAL DIRECTOR
The General Director during the year and at the date of this report is Mrs Pham Thi My Hanh.
LEGAL REPRESENTATIVE
The legal representative of the Company during the year and at the date of this report is Mrs Pham Thi My Hanh.
AUDITORS
The auditors of the Company are Ernst & Young Vietnam Limited.
General Director of Beauté Cosmétique Societé Par Actions (“the Company”) is pleased to present its report and the financial
statements of the Company for the year ended 31 December 2011.
STATEMENT OF GENERAL DIRECTOR’S RESPONSIBILITY IN RESPECT OF THE FINANCIAL STATEMENTS
General Director is responsible for the financial statements of each financial year which give a true and fair view of the state
REPORT OF THE BOARD OF MANAGEMENT

372
BEAUTÉ COSMÉTIQUE SOCIETÉ PAR ACTIONS
of affairs of the Company and of its results and its cash flows for the year. In preparing those financial statements, General
Director is required to:
• select suitable accounting policies and then apply them consistently;
• make judgements and estimates that are reasonable and prudent;
• state whether applicable accounting standards have been followed, subject to any material departures disclosed and
explained in the financial statements; and
• prepare the financial statements on the going concern basis unless it is inappropriate to presume that the Company will
continue in business.
General Director is responsible for ensuring that proper accounting records are kept which disclose, with reasonable accuracy
at any time, the financial position of the Company and to ensure that the accounting records comply with the registered
accounting system. It is also responsible for safeguarding the assets of the Company and hence for taking reasonable steps
for the prevention and detection of fraud and other irregularities.
General Director confirmed that the Company has complied with the above requirements in preparing the accompanying
financial statements.
STATEMENT BY GENERAL DIRECTOR
I do hereby state that, in my opinion, the accompanying financial statements give a true and fair view of the financial position
of the Company as at 31 December 2011 and of the results of its operations and its cash flows for the year then ended in
accordance with the Vietnamese Accounting Standards and System and comply with relevant statutory requirements.
Pham Thi My Hanh
General Director
15 March 2012
REPORT OF THE BOARD OF MANAGEMENT

373
BEAUTÉ COSMÉTIQUE SOCIETÉ PAR ACTIONS
To Shareholders of Beauté Cosmétique Societé Par Actions
We have audited the financial statements of Beauté Cosmétique Societé Par Actions (“the Company”) as set out on pages 4 to 25
which comprise the balance sheet as at 31 December 2011, the income statement and the cash flow statement for the year then
ended and the notes thereto.
The preparation and presentation of these financial statements are the responsibility of the Company’s General Director. Our
responsibility is to express an opinion on these financial statements based on our audit.
Basis of opinion
We conducted our audit in accordance with Vietnamese Standards on Auditing. Those standards require that we plan and
perform the audit to obtain reasonable assurance about whether the financial statements are free of material misstatement.
An audit includes examining, on a test basis, evidence supporting the amounts and disclosures in the financial statements.
An audit also includes assessing the accounting principles used and significant estimates made by the Company’s General
Director, as well as evaluating the overall presentation of the financial statements. We believe that our audit provides a
reasonable basis for our opinion.
Opinion
In our opinion, the financial statements give a true and fair view of the financial position of the Company as at 31 December
2011, and of the results of its operations and its cash flows for the year then ended in accordance with the Vietnamese
Accounting Standards and System and comply with the relevant statutory requirements.
Ernst & Young Vietnam Limited
Duong Le Anthony Le Quang Minh
Deputy General Director Auditor
Certificate No. N.2223/KTV Certificate No. 0142/KTV
Ho Chi Minh City, Vietnam
15 March 2012
INDEPENDENT AUDITORS’ REPORT
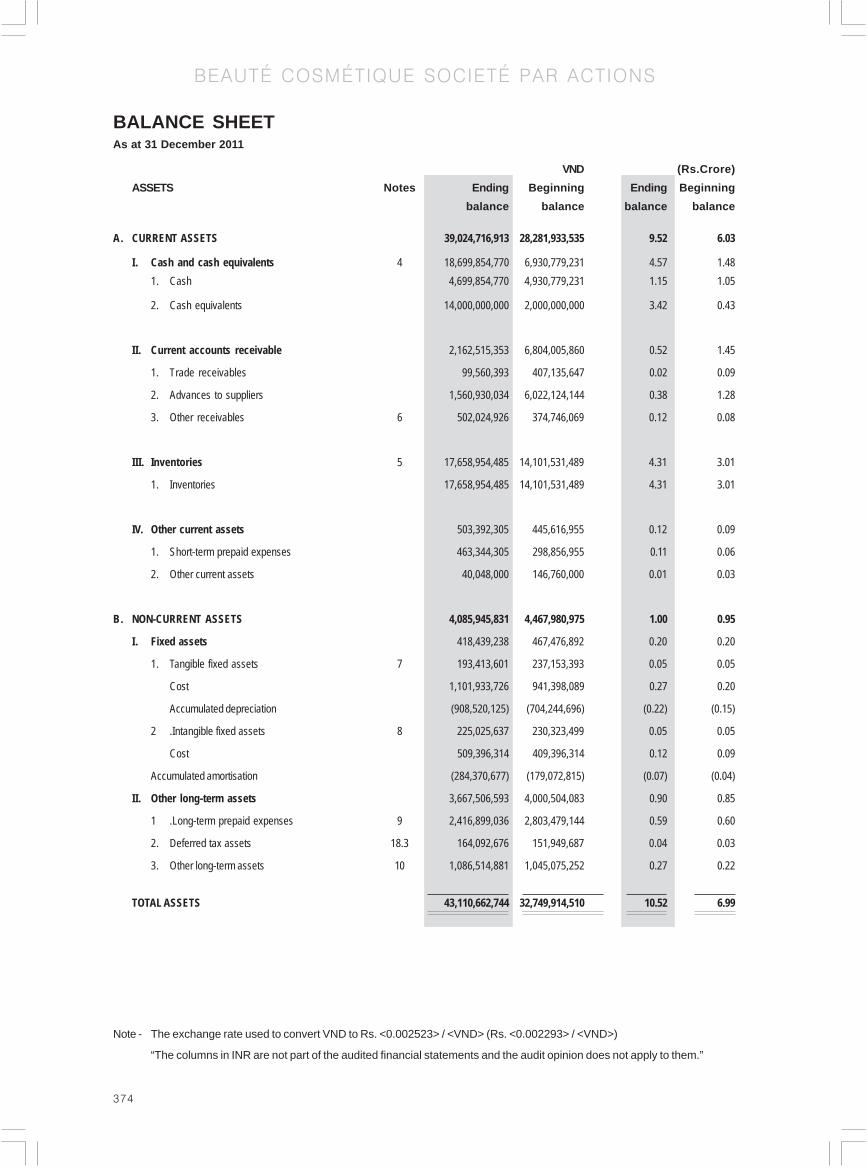
374
BEAUTÉ COSMÉTIQUE SOCIETÉ PAR ACTIONS
BALANCE SHEETAs at 31 December 2011
VND (Rs.Crore)
ASSETS Notes Ending Beginning Ending Beginning
balance balance balance balance
A. CURRENT ASSETS 39,024,716,913 28,281,933,535 9.52 6.03
I. Cash and cash equivalents 4 18,699,854,770 6,930,779,231 4.57 1.48
1. Cash 4,699,854,770 4,930,779,231 1.15 1.05
2. Cash equivalents 14,000,000,000 2,000,000,000 3.42 0.43
II. Current accounts receivable 2,162,515,353 6,804,005,860 0.52 1.45
1. Trade receivables 99,560,393 407,135,647 0.02 0.09
2. Advances to suppliers 1,560,930,034 6,022,124,144 0.38 1.28
3. Other receivables 6 502,024,926 374,746,069 0.12 0.08
III. Inventories 5 17,658,954,485 14,101,531,489 4.31 3.01
1. Inventories 17,658,954,485 14,101,531,489 4.31 3.01
IV. Other current assets 503,392,305 445,616,955 0.12 0.09
1. Short-term prepaid expenses 463,344,305 298,856,955 0.11 0.06
2. Other current assets 40,048,000 146,760,000 0.01 0.03
B. NON-CURRENT ASSETS 4,085,945,831 4,467,980,975 1.00 0.95
I. Fixed assets 418,439,238 467,476,892 0.20 0.20
1. Tangible fixed assets 7 193,413,601 237,153,393 0.05 0.05
Cost 1,101,933,726 941,398,089 0.27 0.20
Accumulated depreciation (908,520,125) (704,244,696) (0.22) (0.15)
2 .Intangible fixed assets 8 225,025,637 230,323,499 0.05 0.05
Cost 509,396,314 409,396,314 0.12 0.09
Accumulated amortisation (284,370,677) (179,072,815) (0.07) (0.04)
II. Other long-term assets 3,667,506,593 4,000,504,083 0.90 0.85
1 .Long-term prepaid expenses 9 2,416,899,036 2,803,479,144 0.59 0.60
2. Deferred tax assets 18.3 164,092,676 151,949,687 0.04 0.03
3. Other long-term assets 10 1,086,514,881 1,045,075,252 0.27 0.22
TOTAL ASSETS 43,110,662,744 32,749,914,510 10.52 6.99
Note - The exchange rate used to convert VND to Rs. <0.002523> / <VND> (Rs. <0.002293> / <VND>)
“The columns in INR are not part of the audited financial statements and the audit opinion does not apply to them.”
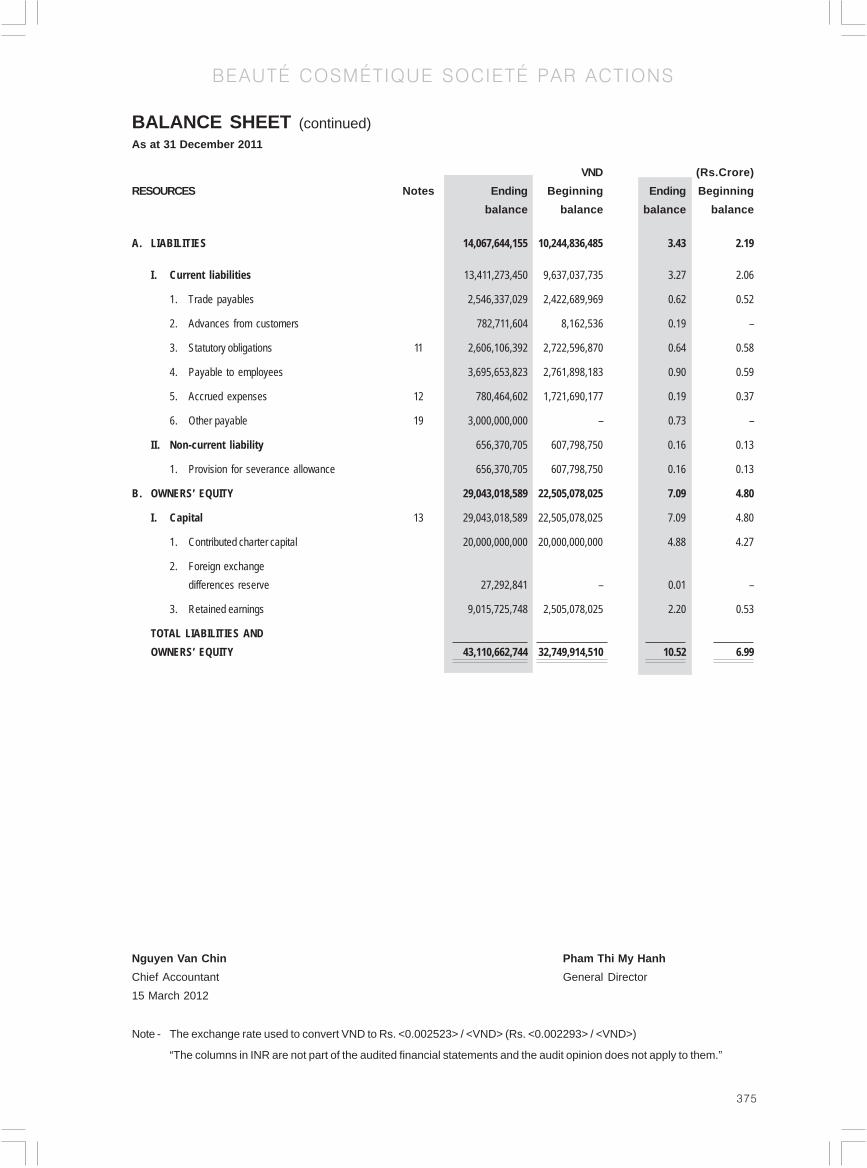
375
BEAUTÉ COSMÉTIQUE SOCIETÉ PAR ACTIONS
VND (Rs.Crore)
RESOURCES Notes Ending Beginning Ending Beginning
balance balance balance balance
A. LIABILITIES 14,067,644,155 10,244,836,485 3.43 2.19
I. Current liabilities 13,411,273,450 9,637,037,735 3.27 2.06
1. Trade payables 2,546,337,029 2,422,689,969 0.62 0.52
2. Advances from customers 782,711,604 8,162,536 0.19 –
3. Statutory obligations 11 2,606,106,392 2,722,596,870 0.64 0.58
4. Payable to employees 3,695,653,823 2,761,898,183 0.90 0.59
5. Accrued expenses 12 780,464,602 1,721,690,177 0.19 0.37
6. Other payable 19 3,000,000,000 – 0.73 –
II. Non-current liability 656,370,705 607,798,750 0.16 0.13
1. Provision for severance allowance 656,370,705 607,798,750 0.16 0.13
B. OWNERS’ EQUITY 29,043,018,589 22,505,078,025 7.09 4.80
I. Capital 13 29,043,018,589 22,505,078,025 7.09 4.80
1. Contributed charter capital 20,000,000,000 20,000,000,000 4.88 4.27
2. Foreign exchange
differences reserve 27,292,841 – 0.01 –
3. Retained earnings 9,015,725,748 2,505,078,025 2.20 0.53
TOTAL LIABILITIES AND
OWNERS’ EQUITY 43,110,662,744 32,749,914,510 10.52 6.99
BALANCE SHEET (continued)As at 31 December 2011
Nguyen Van Chin Pham Thi My Hanh
Chief Accountant General Director
15 March 2012
Note - The exchange rate used to convert VND to Rs. <0.002523> / <VND> (Rs. <0.002293> / <VND>)
“The columns in INR are not part of the audited financial statements and the audit opinion does not apply to them.”
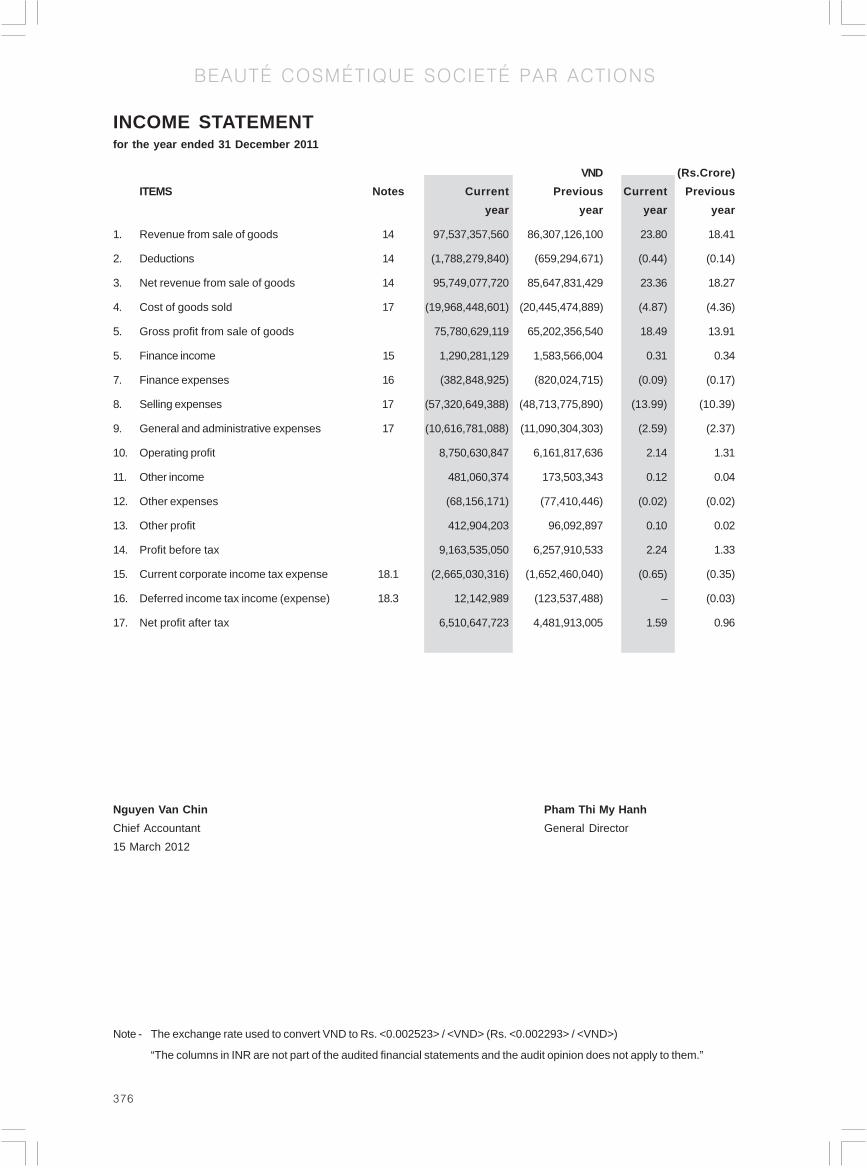
376
BEAUTÉ COSMÉTIQUE SOCIETÉ PAR ACTIONS
INCOME STATEMENTfor the year ended 31 December 2011
VND (Rs.Crore)
ITEMS Notes Current Previous Current Previous
year year year year
1. Revenue from sale of goods 14 97,537,357,560 86,307,126,100 23.80 18.41
2. Deductions 14 (1,788,279,840) (659,294,671) (0.44) (0.14)
3. Net revenue from sale of goods 14 95,749,077,720 85,647,831,429 23.36 18.27
4. Cost of goods sold 17 (19,968,448,601) (20,445,474,889) (4.87) (4.36)
5. Gross profit from sale of goods 75,780,629,119 65,202,356,540 18.49 13.91
5. Finance income 15 1,290,281,129 1,583,566,004 0.31 0.34
7. Finance expenses 16 (382,848,925) (820,024,715) (0.09) (0.17)
8. Selling expenses 17 (57,320,649,388) (48,713,775,890) (13.99) (10.39)
9. General and administrative expenses 17 (10,616,781,088) (11,090,304,303) (2.59) (2.37)
10. Operating profit 8,750,630,847 6,161,817,636 2.14 1.31
11. Other income 481,060,374 173,503,343 0.12 0.04
12. Other expenses (68,156,171) (77,410,446) (0.02) (0.02)
13. Other profit 412,904,203 96,092,897 0.10 0.02
14. Profit before tax 9,163,535,050 6,257,910,533 2.24 1.33
15. Current corporate income tax expense 18.1 (2,665,030,316) (1,652,460,040) (0.65) (0.35)
16. Deferred income tax income (expense) 18.3 12,142,989 (123,537,488) – (0.03)
17. Net profit after tax 6,510,647,723 4,481,913,005 1.59 0.96
Nguyen Van Chin Pham Thi My Hanh
Chief Accountant General Director
15 March 2012
Note - The exchange rate used to convert VND to Rs. <0.002523> / <VND> (Rs. <0.002293> / <VND>)
“The columns in INR are not part of the audited financial statements and the audit opinion does not apply to them.”

377
BEAUTÉ COSMÉTIQUE SOCIETÉ PAR ACTIONS
CASH FLOW STATEMENTfor the year ended 31 December 2011
VND (Rs.Crore)
Code ITEMS Notes Current Previous Current Previous
year year year year
I. CASH FLOWS FROM
OPERATING ACTIVITIES
Profit before tax 9,163,535,050 6,257,910,533 2.24 1.33
Adjustments for:
Depreciation and amortisation 7, 8 309,573,291 307,816,118 0.08 0.07
Provisions – (144,257,948) – (0.03)
Unrealised foreign exchange (gains) losses (36,981,140) 15,625,863 (0.01) –
Profits from investing activities 15 (472,174,922) – (0.12) –
Operating profit before changes in
working capital 8,963,952,279 6,437,094,566 2.19 1.37
Decrease (increase) in receivables 4,766,499,307 (2,828,265,535) 1.16 (0.60)
Increase in inventories (3,557,422,996) (5,949,976,786) (0.87) (1.27)
Increase in payables 4,229,119,790 3,516,377,080 1.03 0.75
Increase in prepaid expenses 222,092,758 26,143,712 0.05 0.01
Corporate income tax paid 18.2 (3,034,208,836) (1,517,244,674) (0.74) (0.32)
Other cash outflows from operating activities 27,292,841 – 0.01 –
Net cash flows from (used in)
operating activities 11,617,325,143 (315,871,637) 2.83 (0.07)
II. CASH FLOWS FROM INVESTING
ACTIVITY
Purchase of fixed assets (260,535,637) (428,657,500) (0.06) (0.09)
Interest received 412,286,033 – 0.10 –
Net cash flows from (used in)
investing activities 151,750,396 (428,657,500) 0.04 (0.09)
III. CASH FLOWS FROM FINANCING
ACTIVITIES
Drawdown of loans and borrowings – 13,000,000,000 – 2.77
Payment of loans and borrowings – (23,000,000,000) – (4.91)
Net cash flows used in financing activities – (10,000,000,000) – (2.13)
Net increase (decrease) in cash and
cash equivalents 11,769,075,539 (10,744,529,137) 2.87 (2.29)
Cash and cash equivalents at
beginning of year 6,930,779,231 17,675,308,368 1.69 3.77
Cash and cash equivalents at end of year 4 18,699,854,770 6,930,779,231 4.56 1.48
Nguyen Van Chin Pham Thi My Hanh
Chief Accountant General Director
15 March 2012
Note - The exchange rate used to convert VND to Rs. <0.002523> / <VND> (Rs. <0.002293> / <VND>)
“The columns in INR are not part of the audited financial statements and the audit opinion does not apply to them.”

378
BEAUTÉ COSMÉTIQUE SOCIETÉ PAR ACTIONS
1. CORPORATE INFORMATION
Beauté Cosmétique Societé Par Actions (“the Company”) was initially established as a limited liability company in accordance
with License of Incorporation No. 4102033640 issued by the Department of Planning and Investment of Ho Chi Minh City on
4 October 2005.
On 12 June 2008, the Company registered to transform from a limited liability company to a joint stock company and was
approved by the Department of Planning and Investment of Ho Chi Minh City in the Business Registration Certificate No.
4103010586 and the following Amended Business Registration Certificate:
Amended Business Registration Certificate No. Date
0304073031 – 1st amendment 24 December 2008
0304073031 – 2nd amendment 11 December 2009
0304073031 – 3rd amendment 20 January 2010
0304073031 – 4th amendment 28 May 2010
Joint Stock Enterprise Registration Certificate No. Date
0304073031 24 August 2010
The Company’s principal activities are to produce and trade in cosmetics, cosmetic materials and functional food.
The registered office of the Company is located at 8th floor, Hai Au Building, 39B Truong Son Street, Tan Binh District, Ho Chi
Minh City.
The number of the Company’s employees as at 31 December 2011 was 238 employees (31 December 2010: 250 employees).
2. BASIS OF PREPARATION
2.1 Accounting Standards and System
The financial statements of the Company, which are expressed in Vietnam dong (“VND”), are prepared in accordance with the
Vietnamese Accounting System and Vietnamese Accounting Standards issued by the Ministry of Finance as per:
� Decision No. 149/2001/QD-BTC dated 31 December 2001 on the Issuance and Promulgation of Four Vietnamese
Accounting Standards (Series 1);
� Decision No. 165/2002/QD-BTC dated 31 December 2002 on the Issuance and Promulgation of Six Vietnamese
Accounting Standards (Series 2);
� Decision No. 234/2003/QD-BTC dated 30 December 2003 on the Issuance and Promulgation of Six Vietnamese
Accounting Standards (Series 3);
� Decision No. 12/2005/QD-BTC dated 15 February 2005 on the Issuance and Promulgation of Six Vietnamese
Accounting Standards (Series 4); and
� Decision No. 100/2005/QD-BTC dated 28 December 2005 on the Issuance and Promulgation of Four Vietnamese
Accounting Standards (Series 5).
Accordingly, the accompanying balance sheet, income statement, cash flow statement and related notes, including
their utilisation are not designed for those who are not informed about Vietnam’s accounting principles, procedures and
practices and furthermore are not intended to present the financial position and results of operations and cash flows in
accordance with accounting principles and practices generally accepted in countries other than Vietnam.
Applied accounting documentation system
The Company’s applied accounting documentation system is the General Journal system.
2.2 Fiscal year
The Company’s fiscal year applicable for the preparation of its financial statements starts on 1 January and ends on 31
December.
NOTES TO THE FINANCIAL STATEMENTSas at and for the year ended 31 December 2011

379
BEAUTÉ COSMÉTIQUE SOCIETÉ PAR ACTIONS
2.3 Accounting currency
The Company maintains its accounting records in VND.
3. SUMMARY OF SIGNIFICANT ACCOUNTING POLICIES
3.1 Change in accounting policies and disclosures
The accounting policies adopted by the Company in preparation of the financial statements are consistent with those
followed in the preparation of the Company’s annual financial statements for the year ended 31 December 2010 except
for the changes in the accounting policies in relation to the following:
3.1.1Circular No. 210/2009/TT-BTC providing guidance for the adoption in Vietnam of the International Financial Reporting
Standards on presentation and disclosures of financial instruments
On 6 November 2009, the Ministry of Finance issued Circular No. 210/2009/TT-BTC providing guidance for the adoption
in Vietnam of the International Financial Reporting Standards on presentation and disclosures of financial instruments
(“Circular 210”) with effectiveness from financial years beginning on or after 1 January 2011.
The adoption of Circular 210 results in new disclosures being added to the financial statements as shown in Notes 20 and 21.
Circular 210 also requires the Company to evaluate the terms of non-derivative financial instrument issued by the
Company to determine whether it contains both a liability and an equity component. Such components are classified
separately as financial liabilities, financial assets or equity instruments in the balance sheet. This requirement has no
impact on the financial position or result of operation of the Company as the Company has not yet issued such non-
derivative financial instrument.
3.1.2Effects of Changes in Foreign Exchange Rates
For the year ended 31 December 2011, the Company has adopted Circular No. 201/2009/TT-BTC issued on 15 October
2009 by the Ministry of Finance (the “Circular 201”). The Circular 201 differs from the accounting policy adopted in prior
year under Vietnamese Accounting Standard No. 10 - Effects of Changes in Foreign Exchange Rates (the “VAS 10”)
providing guidance for the treatment of foreign exchange differences relating to the recognition of unrealised foreign
exchange differences as follows:
Transaction Accounting treatment under
VAS 10 Circular 201
NOTES TO THE FINANCIAL STATEMENTSas at and for the year ended 31 December 2011
Translation of short-term
monetary assets and
liabilities denominated in
foreign currencies at year
end.
Translation of long-term
monetary liabilities
denominated in foreign
currencies at year end.
All unrealised foreign
exchange differences are
taken to the income
statement.
All unrealised foreign
exchange differences are
taken to the income
statement.
All unrealised foreign exchange differences are taken to the “Foreign
exchange differences reserve” account in the equity section of the
balance sheet and will be reversed on the following year.
- All unrealized foreign exchange gains are taken to the
income statement.
- All foreign exchange losses will be charged to the income
statement. However, if the charging of all foreign exchange
losses results in net loss before tax for the Company, part
of the exchange losses can be deferred and allocated to
the income statement within the subsequent years. In any
case, the total foreign exchange loss to be charged to current
period’s income statement must be at least equivalent to
the foreign exchange losses arising from the translation of
the current portion of the long-term liabilities, while the
remaining portion of the foreign exchange losses can be
deferred in the balance sheet and allocated to the income
statement within the subsequent five years.

380
BEAUTÉ COSMÉTIQUE SOCIETÉ PAR ACTIONS
The Circular is applied from 2011 on retrospective basis. The impacts of this change in accounting policy on the current and
previous year’s financial statements are not material as a whole.
3.2 Cash and cash equivalents
Cash and cash equivalents comprise cash on hand, cash at banks and short-term, highly liquid investments with an original
maturity of less than three months that are readily convertible into known amounts of cash and that are subject to an
insignificant risk of change in value.
3.3 Inventories
Inventories are stated at the lower of cost incurred in bringing each product to its present location and condition, and net
realisable value.
Net realisable value represents the estimated selling price in the ordinary course of business less the estimated costs to
complete and the estimated costs necessary to make the sale.
The perpetual method is used to record inventories, which are valued as follows:
Raw materials, consumables and goods for resale - cost of purchase on a weighted average basis.
Finished goods and work-in-process - cost of direct materials and labour plus attributable
manufacturing overheads based on the normal operating
capacity on a weighted average basis.
Provision for obsolete inventories
An inventories provision is created for the estimated loss arising due to the impairment of value (through diminution,
damage, obsolescence, etc.) of raw materials, finished goods, and other inventories owned by the Company, based on
appropriate evidence of impairment available at the balance sheet date.
Increases and decreases to the provision balance are recorded into the cost of goods sold account in the income
statement.
3.4 Receivables
Receivables are presented in the financial statements at the carrying amounts due from customers and other debtors,
after provision for doubtful debts.
The provision for doubtful debts represents amounts of outstanding receivables at the balance sheet date which are
doubtful of being recovered. Increases and decreases to the provision balance are recorded as general and administrative
expense in the income statement.
3.5 Tangible fixed assets
Tangible fixed assets are stated at cost less accumulated depreciation.
The cost of a tangible fixed asset comprises of its purchase price and any directly attributable costs of bringing the
tangible fixed asset to working condition for its intended use.
Expenditures for additions, improvements and renewals are added to the carrying amount of the assets and expenditures
for maintenance and repairs are charged to the income statement as incurred.
When tangible fixed assets are sold or retired, their costs and accumulated depreciation are removed from the balance
sheet and any gain or loss resulting from their disposal is included in the income statement.
3.6 Intangible fixed assets
Intangible fixed assets are stated at cost less accumulated amortisation.
The cost of an intangible fixed asset comprises of its purchase price and any directly attributable costs of preparing the
intangible fixed asset for its intended use.
NOTES TO THE FINANCIAL STATEMENTSas at and for the year ended 31 December 2011
381
BEAUTÉ COSMÉTIQUE SOCIETÉ PAR ACTIONS
Expenditures for additions, improvements are added to the carrying amount of the assets and other expenditures are
charged to the income statement as incurred.
When tangible fixed assets are sold or retired, their costs and accumulated amortisation are removed from the balance
sheet and any gain or loss resulting from their disposal is included in the income statement.
3.7 Depreciation and amortisation
Depreciation and amortisation of tangible fixed assets and intangible assets are calculated on a straight-line basis over
the estimated useful life of each asset as follows:
Machinery & equipment 3 – 5 years
Office equipments 3 -5 years
Computer software 3 years
3.8 Prepaid expenses
Prepaid expenses are reported as short-term or long-term prepaid expenses on the balance sheet and amortised over
the period for which the amounts are paid or the period in which economic benefits are generated in relation to these
expenses.
The following types of expenses are recorded as long-term prepaid expense and are amortised to the income statement:
� Office renovation costs: Renovation costs are amortised to the income statement over 5 years.
� Advertising costs: Advertising costs are amortised over effective period under agreements; and
� Tools and consumables with large value issued into production and can be used for more than one year.
3.9 Payables and accruals
Payables and accruals are recognised for amounts to be paid in the future for goods and services received, whether or
not billed to the Company.
3.10 Accrual for severance allowance
The severance pay to employee is accrued at the end of each reporting period for all employees who have more than
12 months in service up to 31 December 2008 at the rate of one-half of the average monthly salary for each year of
service up to 31 December 2008 in accordance with the Labour Code, the Law on Social Insurance and related
implementing guidance. Commencing 1 January 2009, the average monthly salary used in this calculation will be
revised at the end of each reporting period following the average monthly salary of the 6-month period up to the
balance sheet date. Any changes to the accrued amount will be taken to the income statement.
3.11 Appropriation of net profits
Net profit after tax is available for appropriation to investors after approval by the shareholders’ meeting, and after
making appropriation to reserve funds in accordance with the Company’s Charter and Vietnamese regulatory
requirements.
3.12 Revenue recognition
Revenue is recognised to the extent that it is probable that the economic benefits will flow to the Company and the
revenue can be reliably measured. Revenue is measured at the fair value of the consideration received or receivable,
excluding trade discount, rebate and sales return. The following specific recognition criteria must also be met before
revenue is recognised:
Sale of goods
Revenue is recognised when the significant risks and rewards of ownership of the goods have passed to the buyer,
usually upon the delivery of the goods.
NOTES TO THE FINANCIAL STATEMENTSas at and for the year ended 31 December 2011

382
BEAUTÉ COSMÉTIQUE SOCIETÉ PAR ACTIONS
Interest income
Revenue is recognised as the interest accrues (taking into account the effective yield on the asset) unless collectability is
in doubt.
3.13 Taxation
Current income tax
Current income tax assets and liabilities for the current and prior periods are measured at the amount expected to be
recovered from or paid to the taxation authorities. The tax rates and tax laws used to compute the amount are those that
are enacted as at the balance sheet date.
Current income tax is charged or credited to the income statement, except when it relates to items recognized directly
to equity, in which case the current income tax is also dealt with in equity.
Current income tax assets and liabilities are offset when there is a legally enforceable right for the Company to set off
current tax assets against current tax liabilities and when the Company intends to settle its current tax assets and
liabilities on a net basis.
Deferred income tax
Deferred income tax is provided using the liability method on temporary differences at the balance sheet date between
the tax base of assets and liabilities and their carrying amount for financial reporting purposes.
Deferred tax liabilities are recognised for all taxable temporary differences. Deferred tax assets are recognised for all
deductible temporary differences, carried forward unused tax credit and unused tax losses, to the extent that it is
probable that taxable profit will be available against which deductible temporary differences, carried forward unused tax
credit and unused tax losses can be utilised.
The carrying amount of deferred income tax assets is reviewed at each balance sheet date and reduced to the extent
that it is no longer probable that sufficient taxable profit will be available to allow all or part of the deferred income tax
asset to be utilised. Previously unrecognised deferred income tax assets are re-assessed at each balance sheet date
and are recognised to the extent that it has become probable that future taxable profit will allow the deferred tax assets
to be recovered.
Deferred income tax assets and liabilities are measured at the tax rates that are expected to apply in the period when
the asset is realised or the liability is settled based on tax rates and tax laws that have been enacted at the balance
sheet date.
Deferred income tax is charged or credited to the income statement, except when it relates to items recognised directly
to equity, in which case the deferred tax is also dealt with in the equity account.
Deferred tax assets and liabilities are offset when there is a legally enforceable right for the Company to set off current
tax assets against current tax liabilities and when they relate to income taxes levied by the same taxation authority on
either the same taxable entity or when the Company intends either settle current tax liabilities and assets on a net basis
or to realise the assets and settle the liabilities simultaneously, in each future period in which significant amounts of
deferred tax liabilities or assets are expected to be settled or recovered.
3.14 Financial instruments
Financial instruments – initial recognition and presentation
Financial assets
Financial assets within the scope of Circular 210 are classified, for disclosures in the notes to the financial statements,
as financial assets at fair value through profit or loss, held-to-maturity investments, loans and receivables or available-
for-sale financial assets as appropriate. The Company determines the classification of its financial assets at initial
recognition.
NOTES TO THE FINANCIAL STATEMENTSas at and for the year ended 31 December 2011

383
BEAUTÉ COSMÉTIQUE SOCIETÉ PAR ACTIONS
NOTES TO THE FINANCIAL STATEMENTSas at and for the year ended 31 December 2011
All financial assets are recognised initially at cost plus directly attributable transaction costs.
The Company’s financial assets include cash and short-term deposits, trade and other receivables..
Financial liabilities
Financial liabilities within the scope of Circular 210 are classified, for disclosures in the notes to the financial statements, as
financial liabilities at fair value through profit or loss or financial liabilities measured at amortised cost as appropriate. The
Company determines the classification of its financial liabilities at initial recognition.
All financial liabilities are recognised initially at cost plus directly attributable transaction costs.
The Company’s financial liabilities include trade and other payables, loans and borrowings.
Financial instruments – subsequent measurement
No subsequent re-measurement of financial instruments is currently required.
Offsetting of financial instruments
Financial assets and financial liabilities are offset and the net amount reported in the balance sheet if, and only if, there is a
currently enforceable legal right to offset the recognised amounts and there is an intention to settle on a net basis, or to
realise the assets and settle the liabilities simultaneously.
4. CASH AND CASH EQUIVALENTS
VND (Rs.Crore)
Ending Beginning Ending Beginning
balance balance balance balance
Cash on hand 2,197,115,872 1,259,223,368 0.54 0.27
Cash at banks 2,502,738,898 3,671,555,863 0.61 0.78
Cash equivalents 14,000,000,000 2,000,000,000 3.42 0.43
TOTAL 18,699,854,770 6,930,779,231 4.57 1.48
Cash equivalents mainly represent short-term bank deposits with maturity of less than 3 months which are readily
convertible into known amounts of cash without any significant risk of change in value, and earn an interest rate at 14%
per annum.
5. INVENTORIES
VND (Rs.Crore)
Ending Beginning Ending Beginning
balance balance balance balance
Merchandise goods 16,038,119,372 12,512,674,328 3.91 2.67
Goods in transit 727,232,995 1,320,928,323 0.18 0.28
Tools and supplies 893,602,118 267,928,838 0.22 0.06
TOTAL 17,658,954,485 14,101,531,489 4.31 3.01
6. OTHER RECEIVABLE
VND (Rs.Crore)
Ending Beginning Ending Beginning
balance balance balance balance
Social Insurance 363,366,010 357,246,069 0.09 0.08
Deposit interest 77,388,889 17,500,000 0.02 –
Others 61,270,027 – 0.01 –
TOTAL 502,024,926 374,746,069 0.12 0.08
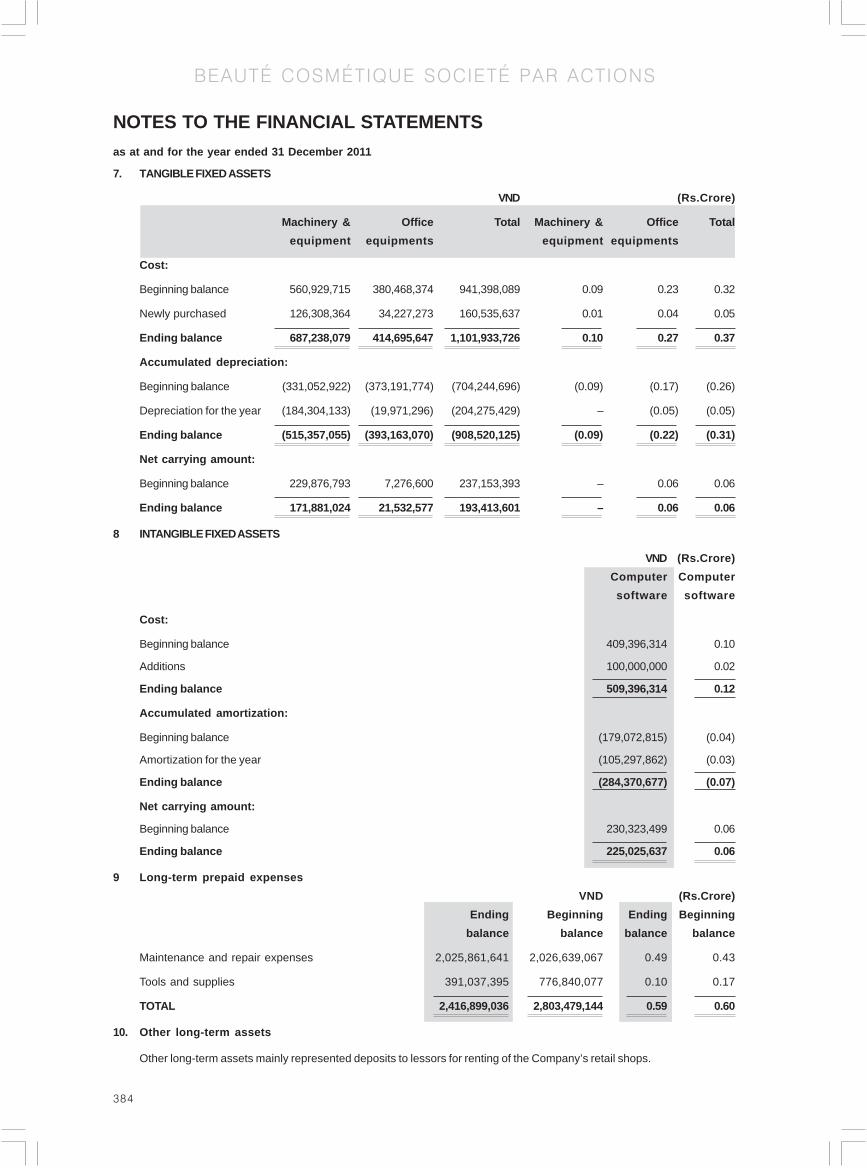
384
BEAUTÉ COSMÉTIQUE SOCIETÉ PAR ACTIONS
7. TANGIBLE FIXED ASSETS
VND (Rs.Crore)
Machinery & Office Total Machinery & Office Total
equipment equipments equipment equipments
Cost:
Beginning balance 560,929,715 380,468,374 941,398,089 0.09 0.23 0.32
Newly purchased 126,308,364 34,227,273 160,535,637 0.01 0.04 0.05
Ending balance 687,238,079 414,695,647 1,101,933,726 0.10 0.27 0.37
Accumulated depreciation:
Beginning balance (331,052,922) (373,191,774) (704,244,696) (0.09) (0.17) (0.26)
Depreciation for the year (184,304,133) (19,971,296) (204,275,429) – (0.05) (0.05)
Ending balance (515,357,055) (393,163,070) (908,520,125) (0.09) (0.22) (0.31)
Net carrying amount:
Beginning balance 229,876,793 7,276,600 237,153,393 – 0.06 0.06
Ending balance 171,881,024 21,532,577 193,413,601 – 0.06 0.06
8 INTANGIBLE FIXED ASSETS
VND (Rs.Crore)
Computer Computer
software software
Cost:
Beginning balance 409,396,314 0.10
Additions 100,000,000 0.02
Ending balance 509,396,314 0.12
Accumulated amortization:
Beginning balance (179,072,815) (0.04)
Amortization for the year (105,297,862) (0.03)
Ending balance (284,370,677) (0.07)
Net carrying amount:
Beginning balance 230,323,499 0.06
Ending balance 225,025,637 0.06
9 Long-term prepaid expenses
VND (Rs.Crore)
Ending Beginning Ending Beginning
balance balance balance balance
Maintenance and repair expenses 2,025,861,641 2,026,639,067 0.49 0.43
Tools and supplies 391,037,395 776,840,077 0.10 0.17
TOTAL 2,416,899,036 2,803,479,144 0.59 0.60
10. Other long-term assets
Other long-term assets mainly represented deposits to lessors for renting of the Company’s retail shops.
NOTES TO THE FINANCIAL STATEMENTSas at and for the year ended 31 December 2011

385
BEAUTÉ COSMÉTIQUE SOCIETÉ PAR ACTIONS
11. STATUTORY OBLIGATIONS
VND (Rs.Crore)
Ending Beginning Ending Beginning
balance balance balance balance
Corporate income tax (Note 18.2) 1,149,686,830 1,518,865,350 0.28 0.32
Value added tax 791,093,116 647,412,377 0.19 0.14
Personal income tax 665,326,446 556,319,143 0.16 0.12
TOTAL 2,606,106,392 2,722,596,870 0.63 0.58
12. ACCRUED EXPENSES
VND (Rs.Crore)
Ending Beginning Ending Beginning
balance balance balance balance
Bonus for employees 423,000,000 514,231,917 0.10 0.11
Advertising accruals – 1,076,779,570 – 0.23
Others 357,464,602 130,678,690 0.09 0.03
TOTAL 780,464,602 1,721,690,177 0.19 0.37
13. OWNERS’ EQUITY
13.1 Increase and decrease in owners’ equity
VND
Contributed Retained Foreign Total
charter capital earnings exchange
differences
reserve
Previous year:
Beginning balance 20,000,000,000 (1,976,834,980) – 18,023,165,020
Net profit for the year – 4,481,913,005 – 4,481,913,005
Ending balance 20,000,000,000 2,505,078,025 – 22,505,078,025
Current year:
Beginning balance 20,000,000,000 2,505,078,025 – 22,505,078,025
Net profit for the year – 6,510,647,723 – 6,510,647,723
Foreignexchange differences – – 27,292,841 27,292,841
Ending balance 20,000,000,000 9,015,725,748 27,292,841 29,043,018,589
NOTES TO THE FINANCIAL STATEMENTSas at and for the year ended 31 December 2011

386
BEAUTÉ COSMÉTIQUE SOCIETÉ PAR ACTIONS
13.1 Increase and decrease in owners’ equity (Continued)
(Rs.Crore)
Contributed Retained Foreign Total
charter capital earnings exchange
differences
reserve
Previous year:
Beginning balance 4.88 (0.48) – 4.40
Net profit for the year – 1.09 – 1.09
Ending balance 4.88 0.61 – 5.49
Current year:
Beginning balance 4.88 0.61 – 5.49
Net profit for the year – 1.59 – 1.59
Foreignexchange differences – – 0.01 0.01
Ending balance 4.88 2.20 0.01 7.09
13.2 Contributed charter capital
VND (Rs.Crore)
Charter capital Charter capital
Amounts as per Amounts as per
Joint Stock Joint Stock
Enterprise Enterprise
Registration Contributed Registration Contributed
Certificate % Charter Certificate % Charter
captial captial
International Consumer
Products Corporation 19,800,000,000 99 19,800,000,000 4.83 99 4.83
Nguyen Thi Tuyet Suong 100,000,000 0.5 100,000,000 0.02 0.5 0.02
Nguyen Khanh Ngoc 100,000,000 0.5 100,000,000 0.02 0.5 0.02
TOTAL 20,000,000,000 100 20,000,000,000 4.87 100 4.87
13.3 Shares
VND
Current year Previous year
Shares Shares
Shares authorised to be issued 2,000,000 2,000,000
Shares issued and fully paid 2,000,000 2,000,000
Ordinary shares 2,000,000 2,000,000
Preference shares – –
Outstanding shares 2,000,000 2,000,000
Ordinary shares 2,000,000 2,000,000
Preference shares – –
NOTES TO THE FINANCIAL STATEMENTSas at and for the year ended 31 December 2011
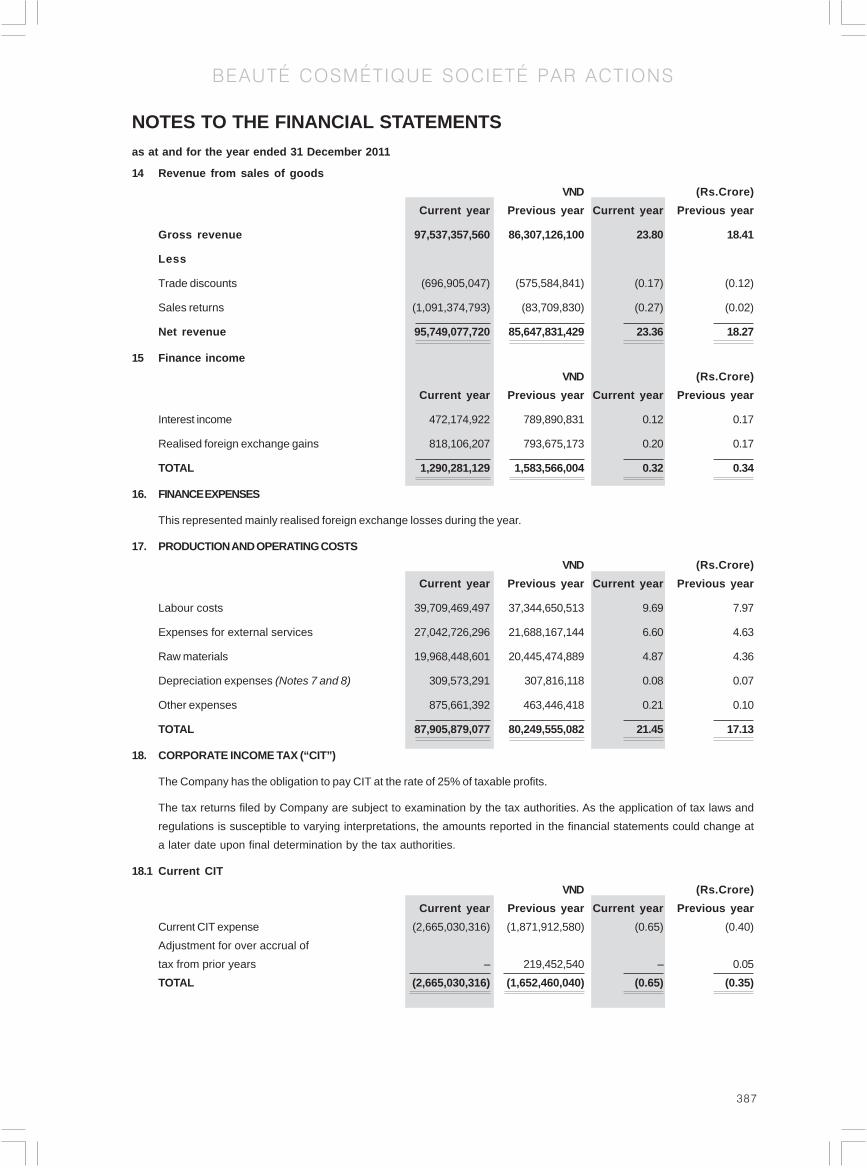
387
BEAUTÉ COSMÉTIQUE SOCIETÉ PAR ACTIONS
14 Revenue from sales of goods
VND (Rs.Crore)
Current year Previous year Current year Previous year
Gross revenue 97,537,357,560 86,307,126,100 23.80 18.41
Less
Trade discounts (696,905,047) (575,584,841) (0.17) (0.12)
Sales returns (1,091,374,793) (83,709,830) (0.27) (0.02)
Net revenue 95,749,077,720 85,647,831,429 23.36 18.27
15 Finance income
VND (Rs.Crore)
Current year Previous year Current year Previous year
Interest income 472,174,922 789,890,831 0.12 0.17
Realised foreign exchange gains 818,106,207 793,675,173 0.20 0.17
TOTAL 1,290,281,129 1,583,566,004 0.32 0.34
16. FINANCE EXPENSES
This represented mainly realised foreign exchange losses during the year.
17. PRODUCTION AND OPERATING COSTS
VND (Rs.Crore)
Current year Previous year Current year Previous year
Labour costs 39,709,469,497 37,344,650,513 9.69 7.97
Expenses for external services 27,042,726,296 21,688,167,144 6.60 4.63
Raw materials 19,968,448,601 20,445,474,889 4.87 4.36
Depreciation expenses (Notes 7 and 8) 309,573,291 307,816,118 0.08 0.07
Other expenses 875,661,392 463,446,418 0.21 0.10
TOTAL 87,905,879,077 80,249,555,082 21.45 17.13
18. CORPORATE INCOME TAX (“CIT”)
The Company has the obligation to pay CIT at the rate of 25% of taxable profits.
The tax returns filed by Company are subject to examination by the tax authorities. As the application of tax laws and
regulations is susceptible to varying interpretations, the amounts reported in the financial statements could change at
a later date upon final determination by the tax authorities.
18.1 Current CIT
VND (Rs.Crore)
Current year Previous year Current year Previous year
Current CIT expense (2,665,030,316) (1,871,912,580) (0.65) (0.40)
Adjustment for over accrual of
tax from prior years – 219,452,540 – 0.05
TOTAL (2,665,030,316) (1,652,460,040) (0.65) (0.35)
NOTES TO THE FINANCIAL STATEMENTSas at and for the year ended 31 December 2011

388
BEAUTÉ COSMÉTIQUE SOCIETÉ PAR ACTIONS
18.2 Current CIT
The current tax payable is based on taxable profit for the year. The taxable profit of the Company for the year differs from
the profit as reported in the income statement because it excludes items of income or expense that are taxable or deductible
in other years and it further excludes items that are not taxable or deductible. The Company’s liability for current tax is
calculated using tax rates that have been enacted by the balance sheet date.
A reconciliation between the profit before tax on the income statement and estimated taxable profit is presented below:
VND (Rs.Crore)
Current year Previous year Current year Previous year
Profit before tax 9,163,535,050 6,257,910,533 2.24 1.33
Adjustments to increase (decrease)
accounting profit
Non-deductible expenses 951,906,838 904,764,730 0.23 0.19
Advertising expenses exceeding the
deductible cap 544,679,321 904,244,453 0.13 0.19
Change in accrued expenses – (404,204,696) – (0.09)
Change in provision for severance
allowance – (30,806,750) – (0.01)
Change in provision for obsolete
inventories – (144,257,948) – (0.03)
Estimated current taxable profit 10,660,121,209 7,487,650,322 2.60 1.58
Estimated Current CIT 2,665,030,316 1,871,912,580 0.65 0.40
CIT payable at beginning of year 1,518,865,350 1,383,649,984 0.37 0.30
Adjustment for over accrual of tax
from prior years – (219,452,540) – (0.05)
CIT paid during the year (3,034,208,836) (1,517,244,674) (0.74) (0.32)
CIT payable at the end of year 1,149,686,830 1,518,865,350 0.28 0.33
18.3 Deferred CIT
The following are the deferred tax assets and liabilities recognized by the Company, and the movements thereon,
during the current and prior reporting years.
Balance sheet Credit (charge)
to Income
statement
Current year Previous year Current year Previous year
VND VND VND VND
Severance allowance 164,092,676 151,949,687 12,142,989 (7,701,688)
Accrued expenses – – – (101,051,174)
Accrued interest income – – – (36,064,487)
Unrealised foreign exchange gain – – – 21,279,861
Deferred CIT assets 164,092,676 151,949,687 – –
Net deferred CIT credit (charge)
to income statement – – 12,142,989 (123,537,488)
NOTES TO THE FINANCIAL STATEMENTSas at and for the year ended 31 December 2011

389
BEAUTÉ COSMÉTIQUE SOCIETÉ PAR ACTIONS
Balance sheet Credit (charge)
to Income
statement
Current year Previous year Current year Previous year
(Rs.Crore) (Rs.Crore) (Rs.Crore) (Rs.Crore)
Severance allowance 0.04 0.03 0.01 (0.01)
Accrued expenses – – – (0.02)
Accrued interest income – – – (0.01)
Unrealised foreign exchange gain – – – –
Deferred CIT assets 0.04 0.03 – –
Net deferred CIT credit (charge)
to income statement – – – (0.03)
19 TRANSACTIONS WITH RELATED PARTY
Significant transactions with a related party during the year were as follows:
Current year Previous year Current year Previous year
(Rs.Crore) (Rs.Crore) (Rs.Crore) (Rs.Crore)
VND (Rs.Crore)
Related parties Relationship Transactions Amounts Amounts
International Consumer Parent company Sale of goods 116,601,618 0.03
Products Corporation
Sales return
from ICP 882,882,352 0.22
Purchase of 2,631,961,690 0.64
goods
Non-interest
bearing
borrowings 3,000,000,000 0.73
Amount due to a related party at the balance sheet date is as follows:
Relationship Transactions Amount Amount
Other payable
International Consumer Parent company Non-interest
Products Corporation bearing
borrowings (3,000,000,000) (0.73)
20. FINANCIAL RISK MANAGEMENT OBJECTIVES AND POLICIES
The Company’s principal financial liabilities comprise trade and other payables. The main purpose of these financial
liabilities is to finance the Company’s operations. The Company has trade and other receivables, and cash and short-
term deposits that arise directly from its operations. The Company does not hold or issue derivative financial instruments.
The Company is exposed to market risk, credit risk and liquidity risk.
Risk management is integral to the whole business of the Company. The Company has a system of controls in place to
create an acceptable balance between the cost of risks occurring and the cost of managing the risks. General Director
continually monitors the Company’s risk management process to ensure that an appropriate balance between risk and
control is achieved.
NOTES TO THE FINANCIAL STATEMENTSas at and for the year ended 31 December 2011

390
BEAUTÉ COSMÉTIQUE SOCIETÉ PAR ACTIONS
General Director reviews and agrees policies for managing each of these risks which are summarized below.
Market risk
Market risk is the risk that the fair value of future cash flows of a financial instrument will fluctuate because of changes
in market prices. Market prices comprise four types of risk: interest rate risk, currency risk, commodity price risk and
other price risk, such as equity price risk. Financial instruments affected by market risk include cash and deposits.
The sensitivity analyses in the following sections relate to the position as at 31 December 2011 and 31 December 2010.
The sensitivity analyses have been prepared on the basis that the amount of net debt, the ratio of fixed to floating
interest rates of the debt and the proportion of financial instruments in foreign currencies are all constant.
In calculating the sensitivity analyses, General Director assumed that:
� the sensitivity of the balance sheet relates to available-for-sale debt instrument;
� the sensitivity of the relevant income statement item is the effect of the assumed changes in respective market risks.
This is based on the financial assets and financial liabilities held at 31 December 2011 and 31 December 2010.
Interest rate risk
Interest rate risk is the risk that the fair value or future cash flows of a financial instrument will fluctuate because of
changes in market interest rates. The Company’s exposure to market risk for changes in interest rate relates primarily
to the Company’s cash and short-term deposits. These investments are mainly short term in nature and they are not
held for speculative purposes.
Interest rate sensitivity
The following table demonstrates the sensitivity to a reasonably possible change in interest rates on that portion of
cash and short-term deposits.
With all other variables held constant, the Company’s profit before tax is affected through the impact on cash and short-
term deposits as follows:
VND Rs.Crore
Increase/decrease Effect on Effect on
in basis points profit before tax profit before tax
For the year ended 31 December 2011
VND 300 560,995,643 0.12
VND (300) (560,995,643) (0.12)
For the year ended 31 December 2010
VND 300 207,923,377 –
VND (300) (207,923,377) (0.05)
The assumed movement in basis points for interest rate sensitivity analysis is based on the currently observable market
environment.
Foreign currency risk
Foreign currency risk is the risk that the fair value or future cash flows of a financial instrument will fluctuate because of
changes in foreign exchange rates. The Company’s exposure to the risk of changes in foreign exchange rates relates
primarily to the Company’s operating activities (when revenue or expense is denominated in a different currency from
the Company’s accounting currency).
The Company exposes to foreign currency risk in relation to purchases of raw materials which are denominated in currencies
NOTES TO THE FINANCIAL STATEMENTSas at and for the year ended 31 December 2011

391
BEAUTÉ COSMÉTIQUE SOCIETÉ PAR ACTIONS
other than Vietnam Dong. The Company manages its foreign currency exposure by considering the prevailing and expected
market situation when it plans for future purchases of raw materials denominated in foreign currencies, other than increasing
natural-hedged proportion. The Company does not employ any derivative financial instruments to hedge its foreign currency
exposure.
A sensitivity analysis is not performed for foreign currency risk as the Company’s exposure to interest-rate risk is
minimal at reporting date.
Commodity price risk
The Company exposes to commodity price risk in relation to purchase of raw materials. The Company manages its
commodity price risk by keeping close watch on relevant information and situation of commodity market in order to
properly manage timing of purchases, production plans and inventories level. The Company does not employ any
derivative financial instruments to hedge its commodity price risk.
Equity price risk
The Company is not exposed to equity securities price risk.
Credit risk
Credit risk is the risk that counterparty will not meet its obligations under a financial instrument or customer contract,
leading to a financial loss. The Company is exposed to credit risk from its operating activities (primarily for trade
receivables) and from its financing activities, including deposits with banks, foreign exchange transactions and other
financial instruments.
Trade receivables
Customer credit risk is managed by the Company based on its established policy, procedures and control relating to
customer credit risk management. The Company only applied credit limit to major customers based on criteria approved
by General Director.. The Company performed analyzing receivable aging at each reporting date on an individual basis
for major clients.
Bank deposits
The Company’s bank balances are mainly maintained with well-known banks in Vietnam. Credit risk from balances with
banks is managed by the Company’s General Director in accordance with the Company’s policy. The Company’s
maximum exposure to credit risk for the components of the balance sheet at each reporting dates are the carrying
amounts as illustrated in Note 4. The Company evaluates the concentration of credit risk in respect to bank deposit as
low.
Liquidity risk
The liquidity risk is the risk that the Company will encounter difficulty in meeting financial obligation due to shortage of
funds. The Company’s exposure to liquidity risk arises primarily from mismatches of maturities of financial assets and
liabilities.
The Company monitors its liquidity risk by maintain a level of cash and cash equivalents deemed adequate by General
Director to finance the Company’s operations and to mitigate the effects of fluctuations in cash flows.
As at the balance sheet date, all the Company’s financial liabilities are current liabilities and have the maturity date
within one year. The Company can make cash flow from operating activities to pay the current liabilities.
Collateral
The Company did not pledge or hold collateral at 31 December 2011 and 31 December 2010.
NOTES TO THE FINANCIAL STATEMENTSas at and for the year ended 31 December 2011
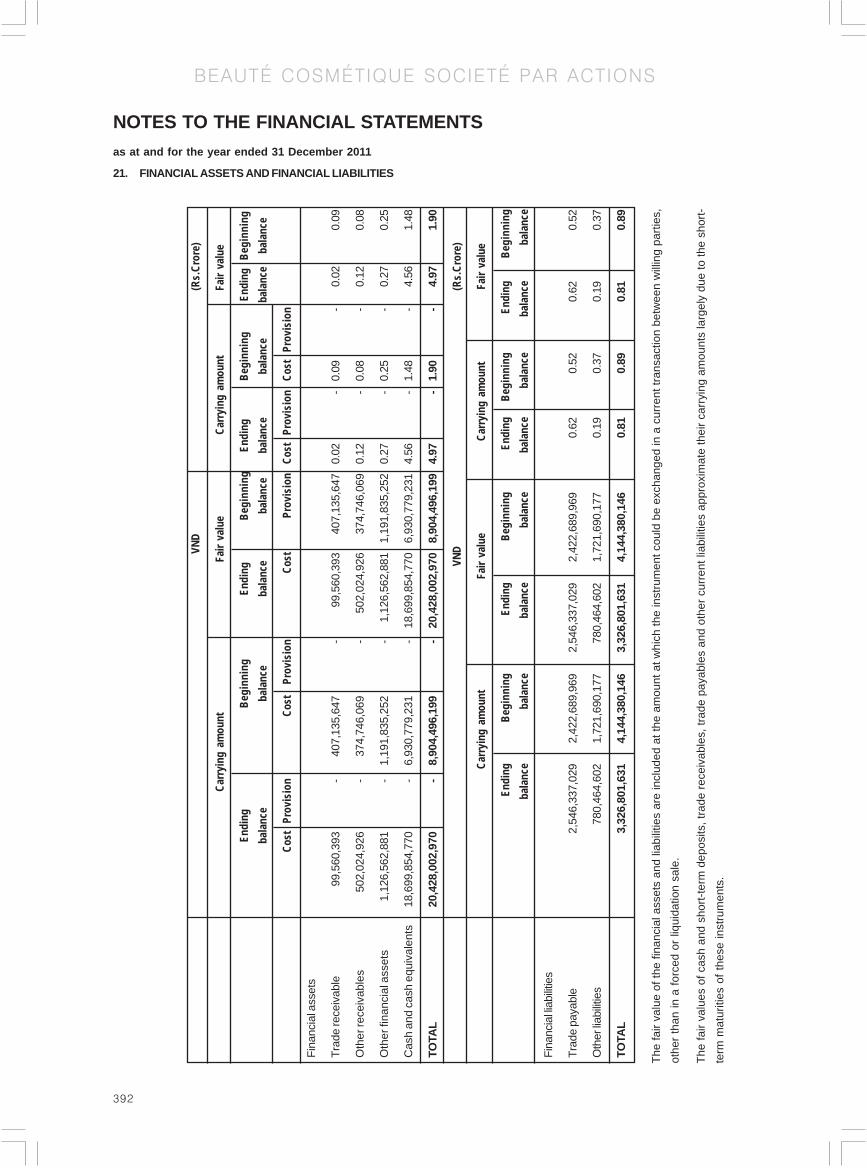
392
BEAUTÉ COSMÉTIQUE SOCIETÉ PAR ACTIONS
VND
(Rs.
Cro
re)
Car
ryin
g am
ount
Fair
valu
eC
arry
ing
amou
ntFa
ir va
lue
Endi
ngB
egin
ning
Endi
ngB
egin
ning
Endi
ngB
egin
ning
Endi
ngB
egin
ning
bala
nce
bala
nce
bala
nce
bala
nce
bala
nce
bala
nce
bala
nce
bala
nce
Cos
tPr
ovis
ion
Cos
tPr
ovis
ion
Cos
tPr
ovis
ion
Cos
tPr
ovis
ion
Cos
tPr
ovis
ion
Fin
anci
al a
sset
s
Tra
de re
ceiv
able
99,5
60,3
93-
407,
135,
647
-99
,560
,393
407,
135,
647
0.02
-0.
09-
0.02
0.09
Oth
er re
ceiv
able
s50
2,02
4,92
6-
374,
746,
069
-50
2,02
4,92
637
4,74
6,06
90.
12-
0.08
-0.
120.
08
Oth
er fi
nanc
ial a
sset
s1,
126,
562,
881
-1,
191,
835,
252
-1,
126,
562,
881
1,19
1,83
5,25
20.
27-
0.25
-0.
270.
25
Cas
h an
d ca
sh e
quiv
alen
ts18
,699
,854
,770
-6,
930,
779,
231
-18
,699
,854
,770
6,93
0,77
9,23
14.
56-
1.48
-4.
561.
48
TOTA
L20
,428
,002
,970
-8,
904,
496,
199
-20
,428
,002
,970
8,90
4,49
6,19
94.
97-
1.90
-4.
971.
90
VND
(Rs.
Cro
re)
Car
ryin
g am
ount
Fair
valu
eC
arry
ing
amou
ntFa
ir va
lue
Endi
ngB
egin
ning
Endi
ngB
egin
ning
Endi
ngB
egin
ning
Endi
ngB
egin
ning
bala
nce
bala
nce
bala
nce
bala
nce
bala
nce
bala
nce
bala
nce
bala
nce
Fin
anci
al li
abili
ties
Tra
de p
ayab
le2,
546,
337,
029
2,42
2,68
9,96
92,
546,
337,
029
2,42
2,68
9,96
90.
620.
520.
620.
52
Oth
er li
abili
ties
780,
464,
602
1,72
1,69
0,17
778
0,46
4,60
21,
721,
690,
177
0.19
0.37
0.19
0.37
TOTA
L3,
326,
801,
631
4,14
4,38
0,14
63,
326,
801,
631
4,14
4,38
0,14
60.
810.
890.
810.
89
NOTES TO THE FINANCIAL STATEMENTSas at and for the year ended 31 December 2011
The
fair
valu
e of
the
finan
cial
ass
ets
and
liabi
litie
s ar
e in
clud
ed a
t the
am
ount
at w
hich
the
inst
rum
ent c
ould
be
exch
ange
d in
a c
urre
nt tr
ansa
ctio
n be
twee
n w
illin
g pa
rtie
s,
othe
r th
an in
a f
orce
d or
liqu
idat
ion
sale
.
The
fair
valu
es o
f cas
h an
d sh
ort-
term
dep
osits
, tra
de r
ecei
vabl
es, t
rade
pay
able
s an
d ot
her
curr
ent l
iabi
litie
s ap
prox
imat
e th
eir
carr
ying
am
ount
s la
rgel
y du
e to
the
shor
t-
term
mat
uriti
es o
f th
ese
inst
rum
ents
.
21. FINANCIAL ASSETS AND FINANCIAL LIABILITIES

393
BEAUTÉ COSMÉTIQUE SOCIETÉ PAR ACTIONS
22. OPERATING LEASE COMMITMENTS
The Company leases office premises, showrooms and warehouses under operating leases. The minimum lease
commitment as at 31 December 2011 under the operating lease agreements is as follow:
VND (Rs.Crore)
Current year Previous year Current year Previous year
Within one year 1,075,446,000 7,431,290,672 0.26 1.59
More than one year to five years 24,272,600,000 19,848,278,139 5.92 4.23
More than five years – 1,181,356,800 – 0.25
TOTAL 25,348,046,000 28,460,925,611 6.18 6.07
23. EVENTS AFTER THE BALANCE SHEET DATE
There has not been any matter or circumstance that has arisen since the balance date that has affected or may
significantly affect the operations of the Company, the results of those operations or the state of affairs of the Company
in subsequent periods.
Nguyen Van Chin Pham Thi My Hanh
Chief Accountant General Director
6 March 2012
NOTES TO THE FINANCIAL STATEMENTSas at and for the year ended 31 December 2011

394
T H U A N P H A T F O O D S T U F F J O I N T S T O C K C O M P A N Y
Board of Directors Vijay Subramaniam
Phan Quoc Cong
Nikhil P. Narkhede
Le Quang Hanh
Chaitanya J. Deshpande
Registered Offi ce 7th fl oor, Hai Au Building,
39 B Truong Son Street, Tan Binh District,
Ho Chi Minh City, Vietnam
Factory Lot D2, Street 7A, Le Minh Xuan Industrial Zone, Tan Nhut Commune, Binh Chanh District, Ho Chi Minh City, Vietnam
Street 31/4, Duong Dong
Funal Ward, Phu Quoc District,
Kien Giang Provice, Vietnam
Auditors Ernst & Young Vietnam Ltd.
Bankers Vietcombank (VCB)
Bank of Investment & Development of Vietam (BIDV)

395
T H U A N P H A T F O O D S T U F F J O I N T S T O C K C O M P A N Y
The Board of Managemnet of Thuan Phat foodstuff Joint Company (“the Company”) is pleased to present its report and reporate fi nancial statements as at 31 December,2011 and for the year then ended.
THE COMPANY
Thuan Phat Foodstuff Joint Stock Company (“the Company”) is a joint stock company incorporated under the Law on Enterprise of Vietnam pursuant to the Business Registration Certifi cate No. 4103006767 issued by the Department of Planning and Investment of Ho Chi Minh City on 18 May 2007 and the following Amended Business Registration Certifi cates:
Amended Business Registration Certifi cates No. Date
4103006767 – 1st amendment 23 January 2009
4103006767 – 2nd amendment 18 June 2009
4103006767 – 3rd amendment 30 November 2009
4103006767 – 4th amendment 18 January 2010
4103006767 – 5th amendment 27 January 2010
Joint Stock Enterprise Registration Certifi cate No. Date
0304979919 – 6th amendment 3 November 2010
The Company’s principal activities are to manufacture, process and trade food products and materials.
In accordance with the Joint Stock Enterprise Registration Certifi cate No. 0304979919, the Department of Planning and Investment of Ho Chi Minh City, on 3 November 2010, approved the incorporation of the Company’s branch. The branch is located at Lot D2, 7A Street, Tan Nhut Ward, Le Minh Xuan Industrial Park, Binh Chanh District, Ho Chi Minh City, Vietnam.
The Company’s head offi ce is located at 7th Floor, Hai Au Building, 39 B Truong Son Street, Ward 2, Tan Binh District, Ho Chi Minh City, Vietnam.
BOARD OF DIRECTORS
Members of the Board of Directors during the year and at the date of this report are:
Mr Vijay S.Submaniam Chairman appointed on 25 August 2011
Mr Phan Quoc Cong Chairman resigned on 25 August 2011
Mr Nguyen Cong Hai Member resigned on 25 August 2011
Mr Chaitanya J. Deshpande Member appointed on 25 August 2011
Mr Nikhil P. Narkhede Member appointed on 25 August 2011
Mr Phan Quoc Cong Member appointed on 25 August 2011
Mr Le Quang Hanh Member appointed on 25 August 2011
BOARD OF SUPERVISION
Members of the Board of Supervision during the year and at the date of this report are:
Mr Nguyen Van Chin Head of Board of Supervision
Ms Doan Kim Lien Member
Ms Ho Thi Thanh Hao Member
REPORT OF THE BOARD OF MANAGEMENT

396
T H U A N P H A T F O O D S T U F F J O I N T S T O C K C O M P A N Y
GENERAL DIRECTOR
General Director of the Company during the year and at the date of this report is Mr Le Quang Hanh.
LEGAL REPRESENTATIVE
The legal representative of the Company during the year and at the date of this report is Mr Le Quang Hanh.
AUDITORS
The auditors of the Company are Ernst & Young Vietnam Limited.
The General Director of Thuan Phat Joint Stock Company (“the Company”) is pleased to present his report and the Company’s fi nancial statements as at and for the year ended 31 December 2011.
GENERAL DIRECTOR’S RESPONSIBILITY IN RESPECT OF THE FINANCIAL STATEMENTS
The General Director is responsible for the fi nancial statements of each fi nancial year which give a true and fair view of the state of affairs of the Company and of its results and cash fl ows for the year. In preparing those fi nancial statements, the Company’s General Director is required to:
• select suitable accounting policies and then apply them consistently;
• make judgements and estimates that are reasonable and prudent;
• state whether applicable accounting standards have been followed, subject to any material departures disclosed and explained in the fi nancial statements; and
• prepare the fi nancial statements on the going concern basis unless it is inappropriate to presume that the Company will continue in business.
The General Director is responsible for ensuring that proper accounting records are kept which disclose, with reasonable accuracy at any time, the fi nancial position of the Company and to ensure that the accounting records comply with the registered accounting system. It is also responsible for safeguarding the assets of the Company and hence for taking reasonable steps for the prevention and detection of fraud and other irregularities.
The General Director has confi rmed that the Company has complied with the above requirements in preparing the accompanying fi nancial statements.
STATEMENT BY MANAGEMENT
I do hereby state that, in my opinion, the accompanying fi nancial statements give a true and fair view of the fi nancial position of the Company as at 31 December 2011 and of the results of its operations and its cash fl ows for the year then ended in accordance with the Vietnamese Accounting Standards and System and comply with relevant statutory requirements.
Le Quang Hanh
General Director
15 March 2012
REPORT OF THE BOARD OF MANAGEMENT
397
T H U A N P H A T F O O D S T U F F J O I N T S T O C K C O M P A N Y
INDEPENDENT AUDITORS’ REPORTTo:
The Shareholders of Thuan Phat Foodstuff Joint Stock Company
We have audited the fi nancial statements of Thuan Phat Foodstuff Joint Stock Company (“the Company”) as set out on pages 4 to 26 which comprise the balance sheet as at 31 December 2011, the income statement and the cash fl ow statement for the year then ended and the notes thereto.
The preparation and presentation of these fi nancial statements are the responsibility of the Company’s General Director. Our responsibility is to express an opinion on these fi nancial statements based on our audit.
Basis of opinion
We conducted our audit in accordance with Vietnamese Standards on Auditing. Those standards require that we plan and perform the audit to obtain reasonable assurance about whether the fi nancial statements are free from material misstatement. An audit includes examining, on a test basis, evidence supporting the amounts and disclosures in the fi nancial statements. An audit also includes assessing the accounting principles used and signifi cant estimates made by The General Director, as well as evaluating the overall presentation of the fi nancial statements. We believe that our audit provides a reasonable basis for our opinion.
Opinion
In our opinion, the fi nancial statements give a true and fair view of the fi nancial position of the Company as at 31 December 2011, and of the results of its operations and its cash fl ows for the year then ended in accordance with the Vietnamese Accounting Standards and System and comply with the relevant statutory requirements.
Ernst & Young Vietnam Limited
Duong Le Anthony Le Quang Minh
Deputy General Director Auditor
Certifi cate No. N.2223/KTV Certifi cate No. 0426/KTV
Ho Chi Minh City, Vietnam
15 March 2012

398
T H U A N P H A T F O O D S T U F F J O I N T S T O C K C O M P A N Y
BALANCE SHEETAs at 31 December 2011
Nguyen Chi Thanh Le Quang HanhChief Accountant General Director
15 March 2012
VND Rs.Crore
ASSETS Notes Ending Beginning Ending Beginning balance balance balance balance
A. CURRENT ASSETS 23,172,728,731 23,738,007,838 5.83 5.43
I. Cash 4 1,859,981,712 529,092,667 0.47 0.12
II. Current accounts receivable 894,911,378 2,433,383,248 0.22 0.56
1. Trade receivables 2,845,998 974,970,932 – 0.22
2. Advances to suppliers 45,480,000 168,906,002 0.01 0.04
3. Other receivables 846,585,380 1,289,506,314 0.21 0.30
III. Inventories 5 20,039,508,674 20,163,899,756 5.05 4.62
1. Inventories 20,460,591,117 20,299,128,456 5.16 4.65
2. Provision for obsolete inventories -421,082,443 -135,228,700 (0.11) (0.13)
IV. Other current assets 378,326,967 611,632,167 0.09 0.13
1. Short-term prepaid expenses 280,963,105 406,098,368 0.07 0.09
2. Taxes and other receivables from the State 17.1 56,473,862 56,473,862 0.01 0.01
3. Other current assets 40,890,000 149,059,937 0.01 0.03
B. NON-CURRENT ASSETS 3 5,649,794,514 37,086,574,058 8.99 8.50
I. Fixed assets 34,614,358,046 35,709,786,018 17.45 16.38
1. Tangible fi xed assets 6 12,142,132,046 13,095,695,351 3.06 3.00
Cost 19,402,298,282 18,178,092,459 4.89 4.17
Accumulated depreciation (7,260,166,236) (5,082,397,108) (1.83) (1.17)
2. Intangible fi xed assets 7 22,459,650,779 22,614,090,667 5.67 5.19
Cost 23,399,278,817 23,235,918,817 5.90 5.33
Accumulated amortisation (939,628,038) (621,828,150 (0.24) (0.14)
3. Construction in progress 12,575,221 – – –
II. Other long-term asset 1,035,436,468 1,376,788,040 0.26 0.32
1. Long-term prepaid expenses 1,035,436,468 1,376,788,040 0.26 0.32
TOTAL ASSETS 58,822,523,245 60,824,581,896 14.82 13.93
Note - The exchange rate used to convert VND to Rs. <0.002523> / <VND> (Rs. <0.002293> / <VND>)
“The columns in INR are not part of the audited fi nancial statements and the audit opinion does not apply to them.”

399
T H U A N P H A T F O O D S T U F F J O I N T S T O C K C O M P A N Y
Nguyen Chi Thanh Le Quang HanhChief Accountant General Director
15 March 2012
BALANCE SHEET (CONTD.)As at 31 December 2011
OFF BALANCE SHEET ITEM
VND Rs.Crore
ASSETS Notes Ending Beginning Ending Beginning balance balance balance balance
Foreign currency
- United states dollar (US$) 1,165.98 8,086 0.01 0.04
VND Rs.Crore
RESOURCES Notes Ending Beginning Ending Beginning balance balance balance balance
A. LIABILITIES 30,255,844,718 25,681,660,447 7.63 5.89
I. Current liabilities 29,888,410,536 25,263,699,994 7.55 5.80
1. Short-term loans 5,671,703,413 – – 1.30
2. Trade payables 5,744,829,167 6,742,620,125 1.45 1.55
3. Advances from customers 8 22,349,011,145 12,195,132,807 5.64 2.80
4. Statutory obligations 9 513,007,768 245,877,516 0.13 0.06
5. Accrued expenses 10 977,490,061 406,333,850 0.25 0.09
6. Other payables 304,072,395 2,032,283 0.08 –
II. Non-current liability 367,434,182 417,960,453 0.09 0.10
1. Provision for severance allowance 367,434,182 417,960,453 0.09 0.10
B. OWNERS’ EQUITY 28,566,678,527 35,142,921,449 7.21 8.06
I. Capital 11 28,566,678,527 35,142,921,449 7.92 7.20
1. Share capital 31,400,000,000 31,400,000,000 7.92 7.20 2. (Accumulated losses) Undistributed earnings (2,833,321,473) 3,742,921,449 (0.71) 0.86
TOTAL LIABILITIES AND 58,822,523,245 60,824,581,896 14.84 13.95 OWNERS’ EQUITY
Note - The exchange rate used to convert VND to Rs. <0.002523> / <VND> (Rs. <0.002293> / <VND>)
“The columns in INR are not part of the audited fi nancial statements and the audit opinion does not apply to them.”

400
T H U A N P H A T F O O D S T U F F J O I N T S T O C K C O M P A N Y
INCOME STATEMENTfor the year ended 31 December 2011
VND Rs.Crore
ITEMS Notes Current Previous Current Previous year year year year
1. Revenue from sale of goods 12 91,590,543,853 77,003,496,863 23.11 17.66
2. Deductions 12 (1,602,434,212) (1,780,922,423) (0.40) (0.41)
3. Net revenue from sale of goods 12 89,988,109,641 75,222,574,440 22.70 17.25
4. Cost of goods sold 16 (80,767,751,768) (65,406,477,578) (20.38) (15.00)
5. Gross profi t from sale of goods 9,220,357,873 9,816,096,862 2.33 2.25
6. Finance income 13 74,942,059 202,061,500 0.02 0.05
7. Finance expenses 14 (187,728,956) (1,665,110,697) (0.05) (0.38)
In which: Interest expense (180,302,141) (1,655,369,474) (0.05) (0.38)
8. Selling expenses 16 (6,075,012,343) (7,434,256,098) (1.53) (1.70)
9. General and administrative expenses 16 (9,545,233,906) (6,658,626,471) (2.41) (1.53)
10. Operating loss (6,512,675,273) (5,739,834,904) (1.64) (1.32)
11. Other income 15 121,728,397 4,632,927,248 0.03 1.06
12. Other expenses 15 (185,296,046) (789,650,550) (0.05) (0.18)
13. Other (loss) profi t 15 (63,567,649) 3,843,276,698 (0.02) 0.88
14. Loss before tax (6,576,242,922) (1,896,558,206) (1.66) (0.43)
15. Current corporate income tax expenses 17.1 – (275,130,747) – (0.06)
16. Net loss after tax (6,576,242,922) (2,171,688,953) (1.66) (0.50)
Nguyen Chi Thanh Le Quang HanhChief Accountant General Director
15 March 2012
Note - The exchange rate used to convert VND to Rs. <0.002523> / <VND> (Rs. <0.002293> / <VND>)
“The columns in INR are not part of the audited fi nancial statements and the audit opinion does not apply to them.”

401
T H U A N P H A T F O O D S T U F F J O I N T S T O C K C O M P A N Y
CASH FLOW STATEMENTas at and for the year ended 31 December 2011
Nguyen Chi Thanh Le Quang HanhChief Accountant General Director
15 March 2012
VND Rs.Crore
ITEMS Notes Current Previous Current Previous year year year year
I. CASH FLOWS FROM OPERATING ACTIVITIES
Loss before tax (6,576,242,922) 1,896,558,206 (1.66) (0.43)
Adjustments for:
Depreciation and amortisation 6,7 2,495,569,016 2,315,617,135 0.63 0.53
Provisions 336,380,014 (190,430,090) 0.08 (0.04)
Profi ts from investing activities (42,284,258) (141,308,065) (0.01) (0.03)
Interest expense 14 180,302,141 1,655,369,474 0.05 0.38
Operating (loss) profi t before changes
in working capital (3,606,276,009) 1,742,690,248 (0.91) (0.40)
Decrease in receivables 1,646,641,807 23,563,897,498 0.42 5.40
(Increase) decrease in inventories (161,462,661) 1,206,271,487 (0.04) 0.28
Increase (decrease) in payables 10,195,361,413 (2,874,247,757) 2.57 (0.66)
Decrease (increase) in prepaid expenses 466,486,835 (350,188,617) 0.12 (0.08)
Interest paid (180,302,141) (1,763,841,256) (0.05) (0.40)
Corporate income tax paid 17.1 – (56,473,862) – (0.01)
Net cash fl ows from operating activities 8,360,449,244 21,468,107,741 2.11 4.92
II. CASH FLOWS FROM INVESTING ACTIVITIES
Purchase of fi xed assets (1,400,141,044) (2,065,524,177) (0.35) (0.47)
Proceeds from disposals of fi xed assets – 300,909,091 – 0.07
Interest received 13 42,284,258 48,836,453 0.01 0.01
Net cash fl ows used in investing activities (1,357,856,786) (1,715,778,633) (0.34) (0.39)
III. CASH FLOWS FROM FINANCING ACTIVITIES
Drawdown of borrowings 4,525,139,479 8,395,866,826 1.14 1.93
Repayment of borrowings (10,196,842,892) (27,924,163,413) (2.57) (6.40)
Net cash fl ows used in fi nancing activities (5,671,703,413) (19,528,296,587) (1.43) (4.47)
Net increase in cash 1,330,889,045 224,032,521 0.34 0.06
Cash at beginning of year 529,092,667 305,060,146 0.13 0.07
Cash at end of year 4 1,859,981,712 529,092,667 0.47 0.12
Note - The exchange rate used to convert VND to Rs. <0.002523> / <VND> (Rs. <0.002293> / <VND>)
“The columns in INR are not part of the audited fi nancial statements and the audit opinion does not apply to them.”

402
T H U A N P H A T F O O D S T U F F J O I N T S T O C K C O M P A N Y
NOTES TO THE FINANCIAL STATEMENTSNotes to the fi nancial Statements as of 31 December 2011
1. CORPORATE INFORMATION
Thuan Phat Foodstuff Joint Stock Company (“the Company”) is a joint stock company incorporated under the Law on Enterprise of Vietnam pursuant to Business Registration Certifi cate No. 4103006767 issued by the Department of Planning and Investment of Ho Chi Minh City on 18 May 2007 and the following Amended Business Registration Certifi cates:
Amended Business Registration Certifi cate No. Date
4103006767 – 1st amendment 23 January 2009
4103006767 – 2nd amendment 18 June 2009
4103006767 – 3rd amendment 30 November 2009
4103006767 – 4th amendment 18 January 2010
4103006767 – 5th amendment 27 January 2010
Joint Stock Enterprise Registration Certifi cate No. Date
0304979919 – 6th amendment 3 November 2010
The principal activities of the Company are to manufacture, process and trade food products and materials.
In accordance with the Joint Stock Enterprise Registration Certifi cate No. 0304979919, the Department of Planning and Investment of Ho Chi Minh City, on 3 November 2010, approved the incorporation of the Company’s branch. The branch is located at Lot D2, 7A Street, Tan Nhut Ward, Le Minh Xuan Industrial Park, Binh Chanh District, Ho Chi Minh City, Vietnam.
The Company’s head offi ce is located at 7th Floor, Hai Au Building, 39 B Truong Son Street, Ward 2, Tan Binh District, Ho Chi Minh City, Vietnam.
The number of the Company’s employees as at 31 December 2011 was 163 persons (31 December 2010: 202 persons).
2. BASIS OF PREPARATION
2.1 Accounting standards and system
The fi nancial statements of the Company, expressed in Vietnam dong (“VND”), are prepared in accordance with the Vietnamese Accounting System and Vietnamese Accounting Standards (“VAS”) issued by the Ministry of Finance as per the:
• Decision No. 149/2001/QD-BTC dated 31 December 2001 on the Issuance and Promulgation of Four Vietnamese Accounting Standards (Series 1);
• Decision No. 165/2002/QD-BTC dated 31 December 2002 on the Issuance and Promulgation of Six Vietnamese Accounting Standards (Series 2);
• Decision No. 234/2003/QD-BTC dated 30 December 2003 on the Issuance and Promulgation of Six Vietnamese Accounting Standards (Series 3);
• Decision No. 12/2005/QD-BTC dated 15 February 2005 on the Issuance and Promulgation of Six Vietnamese Accounting Standards (Series 4); and
• Decision No. 100/2005/QD-BTC dated 28 December 2005 on the Issuance and Promulgation of Four Vietnamese Accounting Standards (Series 5).
Accordingly, the accompanying balance sheet, income statement, cash fl ow statement and related notes, including their utilisation are not designed for those who are not informed about Vietnam’s accounting principles, procedures and practices and furthermore are not intended to present the fi nancial position and results of operations and cash fl ows in accordance with accounting principles and practices generally accepted in countries other than Vietnam.

403
T H U A N P H A T F O O D S T U F F J O I N T S T O C K C O M P A N Y
NOTES TO THE FINANCIAL STATEMENTSFor the year ended 31 December 2011
2.2 Applied accounting documentation system
The Company’s applied accounting documentation system is the General Journal system.
2.3 Financial year
The Company’s fi scal year applicable for the preparation of its fi nancial statements starts on 1 January and ends on 31 December.
2.4 Accounting currency
The Company maintains its accounting records in VND.
3. SUMMARY OF SIGNIFICANT ACCOUNTING POLICIES
3.1 Change in accounting policies and disclosures
The accounting policies adopted by the Company in preparation of the fi nancial statements are consistent with those followed in the preparation of the Company’s fi nancial statements for the year ended 31 December 2010 except for the change in the accounting policy in relation to the following:
On 6 November 2009, the Ministry of Finance issued Circular No. 210/2009/TT-BTC providing guidance for the adoption in Vietnam of the International Financial Reporting Standards on presentation and disclosures of fi nancial instruments (“Circular 210”) with effectiveness from fi nancial years beginning on or after 1 January 2011.
The adoption of Circular 210 results in new disclosures being added to the fi nancial statements as shown in Notes 19 and 20.
Circular 210 also requires the Company to evaluate the terms of non-derivative fi nancial instrument issued by the Company to determine whether it contains both a liability and an equity component. Such components are classifi ed separately as fi nancial liabilities, fi nancial assets or equity instruments in the balance sheet. This requirement has no impact on the fi nancial position or result of operation of the Company as the Company has not yet issued such non-derivative fi nancial instrument.
3.2 Cash
Cash comprises cash on hand and cash in banks.
3.3 Inventories
Inventories are stated at the lower of cost incurred in bringing each product to its present location and condition, and net realisable value.
Net realisable value represents the estimated selling price in the ordinary course of business less the estimated costs to complete and the estimated costs necessary to make the sale.
The perpetual method is used to record inventories, which are valued as follows:
Raw materials, consumables and goods for resale - cost of purchase on a weighted average basis.
Finished goods and work-in-process - cost of direct materials and labour plus attributable manufacturing overheads based on the normal operating capacity on a weighted average basis.
Provision for obsolete inventories
An inventories provision is created for the estimated loss arising due to the impairment (through diminution, damage, obsolescence, etc.) of raw materials, fi nished goods, and other inventories owned by the Company, based on appropriate evidence of impairment available at the balance sheet date.

404
T H U A N P H A T F O O D S T U F F J O I N T S T O C K C O M P A N Y
NOTES TO THE FINANCIAL STATEMENTSNotes to the fi nancial Statements as of 31 December 2011
Increases and decreases to the provision balance are recorded into the cost of goods sold account in the income statement.
3.4 Receivables
Receivables are presented in the fi nancial statements at the carrying amounts due from customers and other debtors, along with the provision for doubtful debts.
The provision for doubtful debts represents the estimated loss due to non-payment arising on receivables that were outstanding at the balance sheet date. Increases and decreases to the provision balance are recorded as general and administrative expense in the income statement.
3.5 Tangible fi xed assets
Tangible fi xed assets are stated at cost less accumulated depreciation.
The cost of a tangible fi xed asset comprises its purchase price and any directly attributable costs of bringing the tangible fi xed asset to working condition for its intended use. Expenditures for additions, improvements and renewals are added to the carrying amount of the assets and expenditures for maintenance and repairs are charged to the income statement as incurred.
When tangible fi xed assets are sold or retired, their costs and accumulated depreciation are removed from the balance sheet and any gain or loss resulting from their disposal is included in the income statement.
3.6 Intangible fi xed assets
Intangible fi xed assets are stated at cost less accumulated amortisation.
The cost of an intangible fi xed asset comprises its purchase price and any directly attributable costs of preparing the intangible fi xed asset for its intended use. Expenditures for additions, improvements are added to the carrying amount of the assets and other expenditures are charged to the income statement as incurred.
When intangible fi xed assets are sold or retired, their costs and accumulated amortisation are removed from the balance sheet and any gain or loss resulting from their disposal is included in the income statement.
Land use rights
Land use rights relate to the land located in Le Minh Xuan Industrial Zone, Binh Chanh District, Ho Chi Minh City, Vietnam which the Company occupies under an agreement expiring in 40 years from 30 November 2007. The cost of the rights is amortised on a straight-line basis over the life of the agreement. In addition, the Company has owned the indefi nite land use rights of lands in Phu Quoc District, Kien Giang Province with indefi nite duration which are not amortised in accordance with prevailing regulations.
3.7 Depreciation and amortisation
Depreciation and amortisation of tangible fi xed assets and intangible fi xed assets are calculated on a straight-line basis over the estimated useful life of each asset as follows:
Buildings and structures 22 - 25 years
Machinery and equipment 3-10 years
Means of transportation 5-6 years
Offi ce equipment 3-4 years
Land use rights 40 years

405
T H U A N P H A T F O O D S T U F F J O I N T S T O C K C O M P A N Y
NOTES TO THE FINANCIAL STATEMENTSFor the year ended 31 December 2011
3.8 Prepaid expenses
Prepaid expenses are reported as short-term or long-term prepaid expenses on the balance sheet and amortised over the period for which the amounts are paid or the period in which economic benefi ts are generated in relation to these expenses.
3.9 Borrowing costs
Borrowing costs consist of interest and other costs that an entity incurs in connection with the borrowing of funds and are recorded as expense during the year in which they are incurred.
3.10 Payables and accruals
Payables and accruals are recognised for amounts to be paid in the future for goods and services received, whether or not billed to the Company.
3.11 Accrual for severance allowance
The severance pay to employee is accrued at the end of each reporting year for all employees who have more than 12 months in service up to 31 December 2008 at the rate of one-half of the average monthly salary for each year of service up to 31 December 2008 in accordance with the Labour Code, the Law on Social Insurance and related implementing guidance. Commencing 1 January 2009, the average monthly salary used in this calculation will be revised at the end of each reporting year following the average monthly salary of the 6-month period up to the balance sheet date. Any changes to the accrued amount will be taken to the income statement.
3.12 Foreign currency transactions
The Company follows the guidance under VAS No.10 “The Effects of Changes in Exchange Rates” (“VAS 10”) in relation to foreign currency transactions as applied consistently in prior years.
Transactions in currencies other than the Company’s reporting currency of VND are recorded at the exchange rates ruling at the date of the transaction. At the end of the year, monetary assets and liabilities denominated in foreign currencies are translated at inter-bank exchange rates ruling at the balance sheet date. All realised and unrealised foreign exchange differences are taken to the income statement.
The above guidance related to unrealized foreign exchange differences provided by VAS 10 is different from those stipulated in the Circular No. 201/2009/TT-BTC issued by the Ministry of Finance on 15 October 2009 providing guidance for the treatment of foreign exchange differences (“Circular 201”) as follows:
Accounting treatment underTransaction VAS 10 Circular 201Translation of short-term monetary assets and liabilities denominated in foreign currencies.
All unrealised foreign exchange differences are taken to the income statement.
All unrealised foreign exchange differences are taken to the “Foreign exchange differences reserve” account in the equity section of the balance sheet and will be reversed on the following year.
Translation of long-term monetary liabilities denominated in foreign currencies at year-end.
All unrealised foreign exchange differences are taken to the income statement.
All unrealised foreign exchange gains are taken to the income statement.

406
T H U A N P H A T F O O D S T U F F J O I N T S T O C K C O M P A N Y
NOTES TO THE FINANCIAL STATEMENTSNotes to the fi nancial Statements as of 31 December 2011
Accounting treatment underTransaction VAS 10 Circular 201
All foreign exchange losses will be charged to the income statement. However, if the charging of all foreign exchange losses results in net loss before tax for the Company, part of the exchange losses can be deferred and allocated to the income statement within the subsequent years. In any case, the total foreign exchange losses to be charged to current year’s income must be at least equivalent to the foreign exchange losses arising from the translation of the current portion of the long-term liabilities, while the remaining portion of the foreign exchange losses can be deferred in the balance sheet and allocated to the income statement within the subsequent fi ve years.
However, the impact to the fi nancial statements had the Company adopted the Circular 201 for the year ended 31 December 2011 was not material as a whole.
3.13 Appropriation of net profi ts
Net profi t after tax is available for appropriation to investors as proposed by the Board of Directors and subject to approval by shareholders at the Annual General Meeting, after making appropriation to reserve funds in accordance with the Company’s Charter and Vietnamese regulatory requirements.
3.14 Revenue recognition
Revenue is recognised to the extent that it is probable that the economic benefi ts will fl ow to the Company and the revenue can be reliably measured. Revenue is measured at the fair value of the consideration received or receivable, excluding trade discount, rebate and sales return. The following specifi c recognition criteria must also be met before revenue is recognised:
Sale of goods
Revenue is recognised when the signifi cant risks and rewards of ownership of the goods have passed to the buyer, usually upon the delivery of the goods.
Interest
Revenue is recognised as the interest accrues (taking into account the effective yield on the asset) unless collectability is in doubt.
3.15 Taxation
Current tax
Current tax assets and liabilities for the current and prior periods are measured at the amounts expected to be recovered from or paid to the taxation authorities. The tax rates and tax laws used to compute the amounts are those that are enacted by the balance sheet date.

407
T H U A N P H A T F O O D S T U F F J O I N T S T O C K C O M P A N Y
NOTES TO THE FINANCIAL STATEMENTSFor the year ended 31 December 2011
Current income tax is charged or credited to the income statement, except when it relates to items recognised directly to equity, in which case the deferred current income tax is also dealt with in equity.
Current income tax assets and liabilities are offset when there is a legally enforceable right for the Company to set off current tax assets against current tax liabilities and when the Company intends to settle its current tax assets and liabilities on a net basis.
Deferred tax
Deferred tax is provided using the balance sheet liability method on temporary differences at the balance sheet date between the tax base of assets and liabilities and their carrying amount for fi nancial reporting purpose.
Deferred tax liabilities are recognised for all taxable temporary differences. Deferred tax assets are recognised for all deductible temporary differences, carried forward of unused tax credit and unused tax losses, to the extent that it is probable that taxable profi ts will be available against which deductible temporary differences, carried forward of unused tax credit and unused tax losses can be utilised.
Deferred income tax assets and liabilities are measured at the tax rates that are expected to apply in the year when the asset is realised or the liability is settled based on tax rates and tax laws that have been enacted at the balance sheet date.
Deferred tax assets and liabilities are offset when there is a legally enforceable right to set off current tax assets against current tax liabilities and when they relate to income taxes levied by the same taxable entity and the same taxation authority and the Company intends to settle its current tax assets and liabilities on a net basis.
The carrying amount of deferred income tax assets is reviewed at each balance sheet date and reduced to the extent that it is no longer probable that suffi cient taxable profi ts will be available to allow all or part of the deferred income tax asset to be utilised. Previously unrecognised deferred income tax assets are re-assessed at each balance sheet date and are recognised to the extent that it has become probable that future taxable profi t will allow the deferred tax assets to be recovered.
4 CASH
VND Rs.CroreEnding
balanceBeginning
balanceEnding
balanceBeginning
balanceCash on hand 115,490,000 1,376,225 0.03 –
Cash in banks 1,744,491,712 527,716,442 0.44 0.12
TOTAL 1,859,981,712 529,092,667 0.47 0.12
5 INVENTORIES
VND Rs.CroreEnding
balanceBeginning
balanceEnding
balanceBeginning
balanceRaw materials 8,907,371,669 9,793,283,727 2.25 2.25
Work in process 10,301,529,696 9,601,436,497 2.60 2.20
Finished goods 1,251,689,752 904,408,232 0.32 0.21
TOTAL 20,460,591,117 20,299,128,456 5.17 4.66
Provision for obsolete inventories (421,082,443) (135,228,700) (0.11) (0.03)
NET 20,039,508,674 20,163,899,756 5.06 4.63
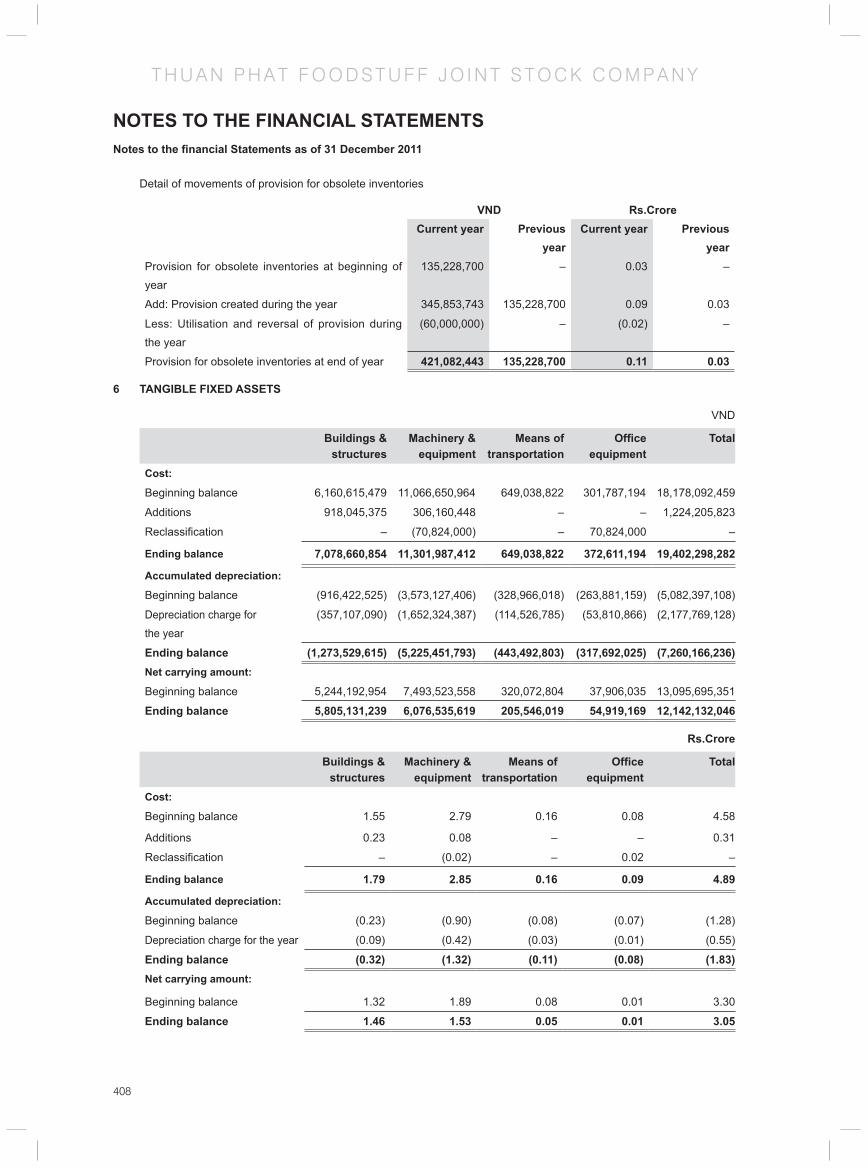
408
T H U A N P H A T F O O D S T U F F J O I N T S T O C K C O M P A N Y
NOTES TO THE FINANCIAL STATEMENTSNotes to the fi nancial Statements as of 31 December 2011
Detail of movements of provision for obsolete inventories
VND Rs.CroreCurrent year Previous
yearCurrent year Previous
yearProvision for obsolete inventories at beginning of year
135,228,700 – 0.03 –
Add: Provision created during the year 345,853,743 135,228,700 0.09 0.03
Less: Utilisation and reversal of provision during the year
(60,000,000) – (0.02) –
Provision for obsolete inventories at end of year 421,082,443 135,228,700 0.11 0.03
6 TANGIBLE FIXED ASSETS
VND
Buildings &structures
Machinery &equipment
Means oftransportation
Offi ce equipment
Total
Cost:
Beginning balance 6,160,615,479 11,066,650,964 649,038,822 301,787,194 18,178,092,459
Additions 918,045,375 306,160,448 – – 1,224,205,823
Reclassifi cation – (70,824,000) – 70,824,000 –
Ending balance 7,078,660,854 11,301,987,412 649,038,822 372,611,194 19,402,298,282
Accumulated depreciation:
Beginning balance (916,422,525) (3,573,127,406) (328,966,018) (263,881,159) (5,082,397,108)
Depreciation charge for the year
(357,107,090) (1,652,324,387) (114,526,785) (53,810,866) (2,177,769,128)
Ending balance (1,273,529,615) (5,225,451,793) (443,492,803) (317,692,025) (7,260,166,236)Net carrying amount:
Beginning balance 5,244,192,954 7,493,523,558 320,072,804 37,906,035 13,095,695,351
Ending balance 5,805,131,239 6,076,535,619 205,546,019 54,919,169 12,142,132,046
Rs.Crore
Buildings &structures
Machinery &equipment
Means oftransportation
Offi ce equipment
Total
Cost:
Beginning balance 1.55 2.79 0.16 0.08 4.58
Additions 0.23 0.08 – – 0.31
Reclassifi cation – (0.02) – 0.02 –
Ending balance 1.79 2.85 0.16 0.09 4.89
Accumulated depreciation:
Beginning balance (0.23) (0.90) (0.08) (0.07) (1.28)
Depreciation charge for the year (0.09) (0.42) (0.03) (0.01) (0.55)
Ending balance (0.32) (1.32) (0.11) (0.08) (1.83)Net carrying amount:
Beginning balance 1.32 1.89 0.08 0.01 3.30
Ending balance 1.46 1.53 0.05 0.01 3.05

409
T H U A N P H A T F O O D S T U F F J O I N T S T O C K C O M P A N Y
NOTES TO THE FINANCIAL STATEMENTSFor the year ended 31 December 2011
7 INTANGIBLE FIXED ASSETS
VND
Land use rights Software Others TotalCost:Beginning balance 22,515,101,000 – 720,817,817 23,235,918,817
Additions - 163,360,000 – 163,360,000
Ending balance 22,515,101,000 163,360,000 720,817,817 23,399,278,817Accumulated amortisation:Beginning balance (561,760,000) – (60,068,150) (621,828,150)
Amortisation for the year (168,528,000) (5,104,998) (144,166,890) (317,799,888)
Ending balance (730,288,000) (5,104,998) (204,235,040) (939,628,038)Net carrying amount:Beginning balance 21,953,341,000 – 660,749,667 22,614,090,667
Ending balance 21,784,813,000 158,255,002 516,582,777 22,459,650,779
Rs.Crore
Land use rights Software Others TotalCost:Beginning balance 5.68 – 0.18 5.86
Additions – 0.04 – 0.04
Ending balance 5.68 0.04 0.18 5.90Accumulated amortisation:Beginning balance (0.14) – (0.02) (0.16)
Amortisation for the year (0.04) – (0.04) (0.08)
Ending balance (0.18) – (0.05) (0.23)Net carrying amount:Beginning balance 5.54 – 0.17 5.71
Ending balance 5.50 0.04 0.13 5.67
8 ADVANCE FROM CUSTOMERS
VND Rs.CroreEnding
balanceBeginning
balanceEnding
balanceBeginning
balanceRelated party (Note 18) 22,349,011,145 12,190,132,807 5.64 2.80
Third parties – 5,000,000 – –
TOTAL 22,349,011,145 12,195,132,807 5.64 2.80
9 STAUTUORY OBLIGATIONS
VND Rs.CroreEnding
balanceBeginning
balanceEnding
balanceBeginning
balanceValue added tax 435,458,710 167,739,366 0.11 0.04
Personal income tax 77,549,058 78,138,150 0.02 0.02
TOTAL 513,007,768 245,877,516 0.13 0.06

410
T H U A N P H A T F O O D S T U F F J O I N T S T O C K C O M P A N Y
NOTES TO THE FINANCIAL STATEMENTSNotes to the fi nancial Statements as of 31 December 2011
10 ACCRUED EXPENSES
VND Rs.CroreEnding
balanceBeginning
balanceEnding
balanceBeginning
balanceMarketing expenses 831,690,061 166,823,388 0.21 0.04
Professional service fees 37,000,000 105,300,000 0.01 0.02
Interest expenses –- 17,138,516 – –-
Others 108,800,000 117,071,946 0.03 0.03
TOTAL 977,490,061 406,333,850 0.25 0.09
11 OWNERS’ EQUITY
11.1 Increase and decrease in owner’s equity
VND Rs.Crore
Share capital
(Accumulated losses)
Undistributedearnings
Total Share capital
(Accumulated losses)
Undistributedearnings
Total
Previous year:Beginning balance 31,400,000,000 5,914,610,402 37,314,610,402 7.92 1.49 9.41Net loss for the year – (2,171,688,953) (2,171,688,953) – (0.55) (0.55)
Ending balance 31,400,000,000 3,742,921,449 35,142,921,449 7.92 0.94 8.86Current year:Beginning balance 31,400,000,000 3,742,921,449 35,142,921,449 7.92 0.94 8.86
Net loss for the year – (6,576,242,922) (6,576,242,922) – (1.66) (1.66)
Ending balance 31,400,000,000 (2,833,321,473) 28,566,678,527 7.92 (0.72) 7.2
11.2 Details of owner’s equity
VND Rs.Crore
Share capital
Amount
% Contributed share capital
Share capital
Amount
% Contributed share capital
International Consumer ProductsCorporation 30,213,940,000 96.2 30,213,940,000 7.62 96.2 7.62Others 1,186,060,000 3.8 1,186,060,000 0.3 3.8 0.3TOTAL 31,400,000,000 100 31,400,000,000 7.92 100 7.92
11.3 Shares
VND
Current year Shares Previous year shareShares authorised to be issued 3,140,000 3,140,000Shares issued and fully paid 3,140,000 3,140,000Ordinary shares 3,140,000 3,140,000Preference shares – –Outstanding shares 3,140,000 3,140,000Ordinary shares 3,140,000 3,140,000Preference shares - -
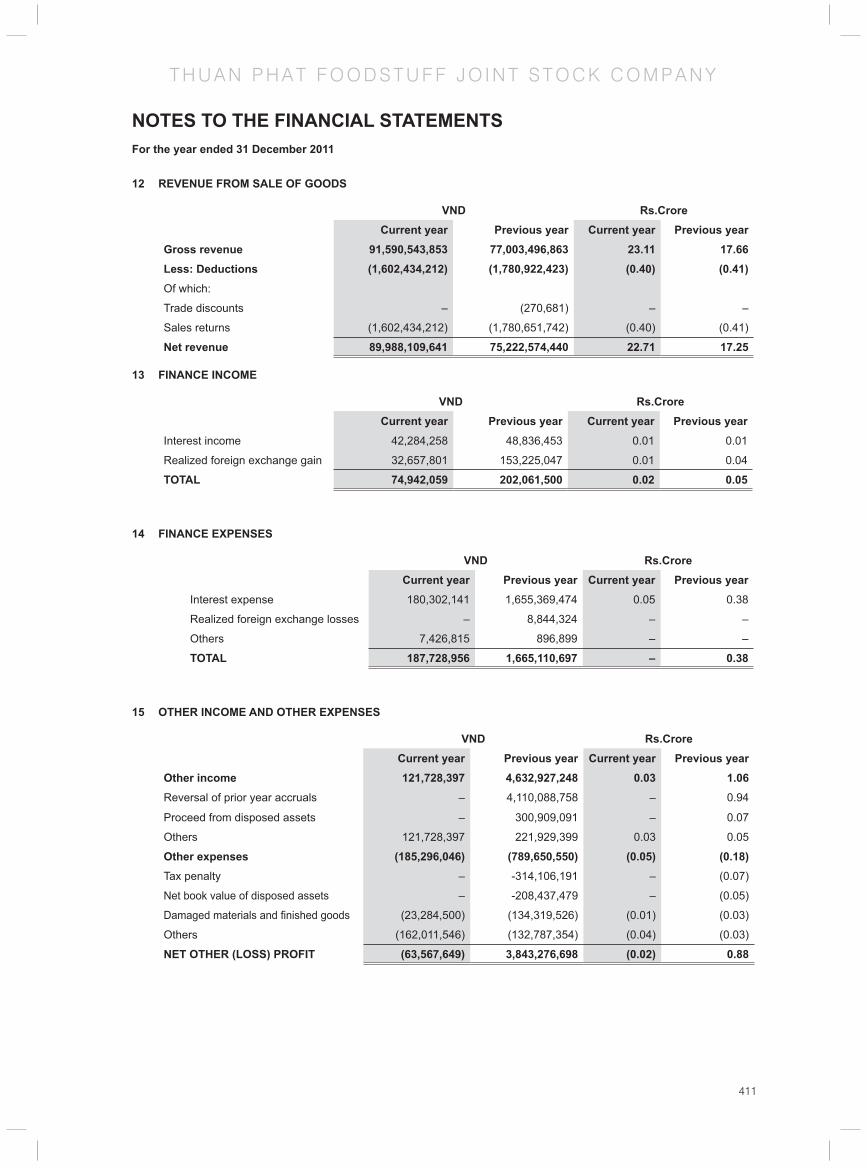
411
T H U A N P H A T F O O D S T U F F J O I N T S T O C K C O M P A N Y
NOTES TO THE FINANCIAL STATEMENTSFor the year ended 31 December 2011
12 REVENUE FROM SALE OF GOODS
VND Rs.CroreCurrent year Previous year Current year Previous year
Gross revenue 91,590,543,853 77,003,496,863 23.11 17.66Less: Deductions (1,602,434,212) (1,780,922,423) (0.40) (0.41)Of which:
Trade discounts – (270,681) – –
Sales returns (1,602,434,212) (1,780,651,742) (0.40) (0.41)
Net revenue 89,988,109,641 75,222,574,440 22.71 17.25
13 FINANCE INCOME
VND Rs.CroreCurrent year Previous year Current year Previous year
Interest income 42,284,258 48,836,453 0.01 0.01
Realized foreign exchange gain 32,657,801 153,225,047 0.01 0.04
TOTAL 74,942,059 202,061,500 0.02 0.05
14 FINANCE EXPENSES
VND Rs.CroreCurrent year Previous year Current year Previous year
Interest expense 180,302,141 1,655,369,474 0.05 0.38
Realized foreign exchange losses – 8,844,324 – –
Others 7,426,815 896,899 – –
TOTAL 187,728,956 1,665,110,697 – 0.38
15 OTHER INCOME AND OTHER EXPENSES
VND Rs.CroreCurrent year Previous year Current year Previous year
Other income 121,728,397 4,632,927,248 0.03 1.06Reversal of prior year accruals – 4,110,088,758 – 0.94
Proceed from disposed assets – 300,909,091 – 0.07
Others 121,728,397 221,929,399 0.03 0.05
Other expenses (185,296,046) (789,650,550) (0.05) (0.18)Tax penalty – -314,106,191 – (0.07)
Net book value of disposed assets – -208,437,479 – (0.05)
Damaged materials and fi nished goods (23,284,500) (134,319,526) (0.01) (0.03)
Others (162,011,546) (132,787,354) (0.04) (0.03)
NET OTHER (LOSS) PROFIT (63,567,649) 3,843,276,698 (0.02) 0.88
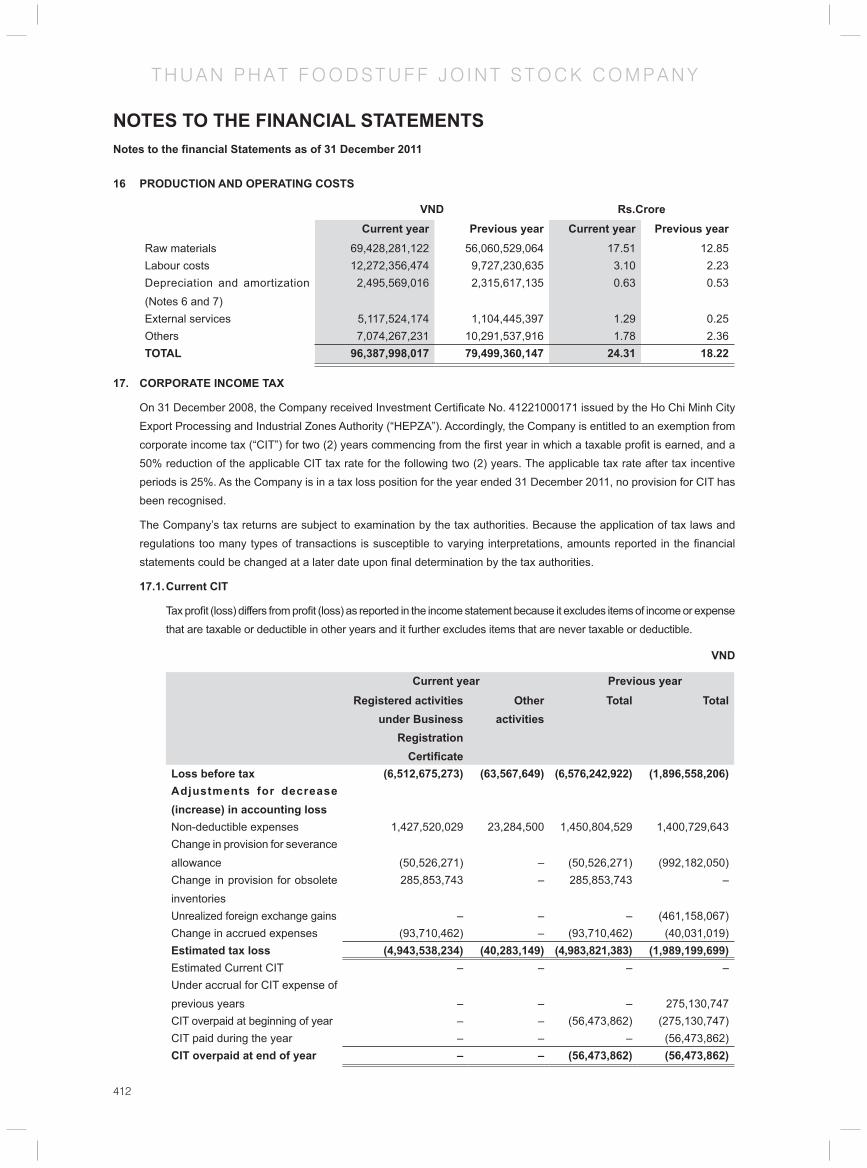
412
T H U A N P H A T F O O D S T U F F J O I N T S T O C K C O M P A N Y
NOTES TO THE FINANCIAL STATEMENTSNotes to the fi nancial Statements as of 31 December 2011
16 PRODUCTION AND OPERATING COSTS
VND Rs.CroreCurrent year Previous year Current year Previous year
Raw materials 69,428,281,122 56,060,529,064 17.51 12.85 Labour costs 12,272,356,474 9,727,230,635 3.10 2.23 Depreciation and amortization (Notes 6 and 7)
2,495,569,016 2,315,617,135 0.63 0.53
External services 5,117,524,174 1,104,445,397 1.29 0.25 Others 7,074,267,231 10,291,537,916 1.78 2.36 TOTAL 96,387,998,017 79,499,360,147 24.31 18.22
17. CORPORATE INCOME TAX
On 31 December 2008, the Company received Investment Certifi cate No. 41221000171 issued by the Ho Chi Minh City Export Processing and Industrial Zones Authority (“HEPZA”). Accordingly, the Company is entitled to an exemption from corporate income tax (“CIT”) for two (2) years commencing from the fi rst year in which a taxable profi t is earned, and a 50% reduction of the applicable CIT tax rate for the following two (2) years. The applicable tax rate after tax incentive periods is 25%. As the Company is in a tax loss position for the year ended 31 December 2011, no provision for CIT has been recognised.
The Company’s tax returns are subject to examination by the tax authorities. Because the application of tax laws and regulations too many types of transactions is susceptible to varying interpretations, amounts reported in the fi nancial statements could be changed at a later date upon fi nal determination by the tax authorities.
17.1. Current CIT
Tax profi t (loss) differs from profi t (loss) as reported in the income statement because it excludes items of income or expense that are taxable or deductible in other years and it further excludes items that are never taxable or deductible.
VND
Current year Previous yearRegistered activities
under BusinessRegistration
Certifi cate
Other activities
Total Total
Loss before tax (6,512,675,273) (63,567,649) (6,576,242,922) (1,896,558,206)Adjustments for decrease (increase) in accounting lossNon-deductible expenses 1,427,520,029 23,284,500 1,450,804,529 1,400,729,643Change in provision for severance allowance (50,526,271) – (50,526,271) (992,182,050)Change in provision for obsolete inventories
285,853,743 – 285,853,743 –
Unrealized foreign exchange gains – – – (461,158,067)Change in accrued expenses (93,710,462) – (93,710,462) (40,031,019)Estimated tax loss (4,943,538,234) (40,283,149) (4,983,821,383) (1,989,199,699)Estimated Current CIT – – – –Under accrual for CIT expense of previous years – – – 275,130,747CIT overpaid at beginning of year – – (56,473,862) (275,130,747)CIT paid during the year – – – (56,473,862)CIT overpaid at end of year – – (56,473,862) (56,473,862)
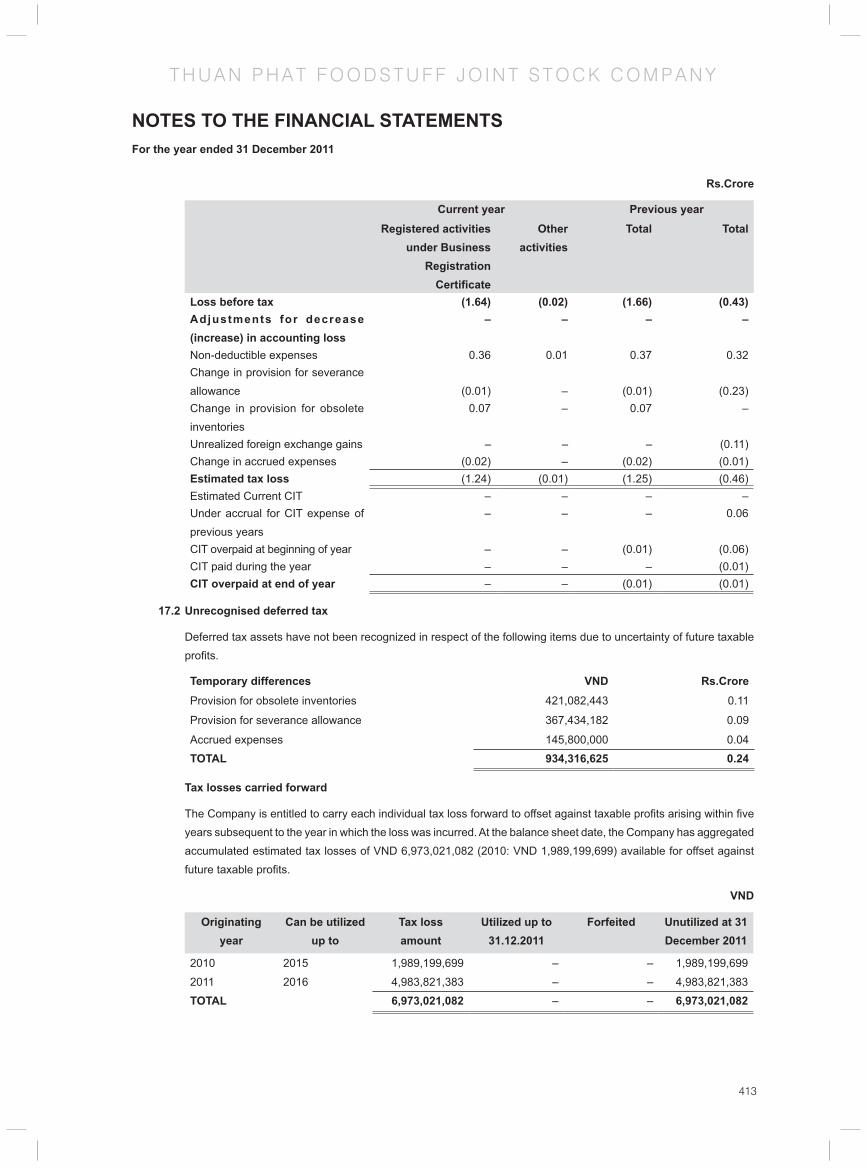
413
T H U A N P H A T F O O D S T U F F J O I N T S T O C K C O M P A N Y
NOTES TO THE FINANCIAL STATEMENTSFor the year ended 31 December 2011
Rs.Crore
Current year Previous yearRegistered activities
under BusinessRegistration
Certifi cate
Other activities
Total Total
Loss before tax (1.64) (0.02) (1.66) (0.43)Adjustments for decrease (increase) in accounting loss
– – – –
Non-deductible expenses 0.36 0.01 0.37 0.32Change in provision for severance allowance (0.01) – (0.01) (0.23)Change in provision for obsolete inventories
0.07 – 0.07 –
Unrealized foreign exchange gains – – – (0.11)Change in accrued expenses (0.02) – (0.02) (0.01)Estimated tax loss (1.24) (0.01) (1.25) (0.46)Estimated Current CIT – – – –Under accrual for CIT expense of previous years
– – – 0.06
CIT overpaid at beginning of year – – (0.01) (0.06)CIT paid during the year – – – (0.01)CIT overpaid at end of year – – (0.01) (0.01)
17.2 Unrecognised deferred tax
Deferred tax assets have not been recognized in respect of the following items due to uncertainty of future taxable profi ts.
Temporary differences VND Rs.CroreProvision for obsolete inventories 421,082,443 0.11
Provision for severance allowance 367,434,182 0.09
Accrued expenses 145,800,000 0.04
TOTAL 934,316,625 0.24
Tax losses carried forward
The Company is entitled to carry each individual tax loss forward to offset against taxable profi ts arising within fi ve years subsequent to the year in which the loss was incurred. At the balance sheet date, the Company has aggregated accumulated estimated tax losses of VND 6,973,021,082 (2010: VND 1,989,199,699) available for offset against future taxable profi ts.
VND
Originatingyear
Can be utilizedup to
Tax lossamount
Utilized up to31.12.2011
Forfeited Unutilized at 31December 2011
2010 2015 1,989,199,699 – – 1,989,199,699
2011 2016 4,983,821,383 – – 4,983,821,383
TOTAL 6,973,021,082 – – 6,973,021,082

414
T H U A N P H A T F O O D S T U F F J O I N T S T O C K C O M P A N Y
NOTES TO THE FINANCIAL STATEMENTSNotes to the fi nancial Statements as of 31 December 2011
Rs.Crore
Originatingyear
Can be utilizedup to
Tax lossamount
Utilized up to31.12.2011
Forfeited Unutilized at 31December 2011
2010 2015 0.50 – – 0.50
2011 2016 1.26 – – 1.26
TOTAL 1.70 – – 1.76
Estimated tax loss as per the Company’s corporate income tax declarations for the years 2010 and 2011 have not been audited by the local tax authorities as of the date of these fi nancial statements.
18 TRANSACTIONS WITH RELATED PARTIES
Signifi cant transactions with a related party during the year were as follows:
Related company Relationship Transactions AmountsVND Rs.Crore
International Consumer Parent company Sale of goods 87,282,837,875 22.02
Products Corporation Purchase of goods 324,382,149 0.08
Payments made on behalf
290,702,739 0.07
Amounts due to a related party at the balance sheet date were as follows:
Related company Relationship Transactions Amount(VND) Rs.Crore
Advance from customerInternational Consumer Parent company Advance for
Products Corporation purchase of goods 22,349,011,145 5.64
19. FINANCIAL RISK MANAGEMENT OBJECTIVES AND POLICIES
The Company’s principal fi nancial liabilities comprise loans and borrowings and trade and other payables. The main purpose of these fi nancial liabilities is to fi nance the Company’s operations. The Company’s principal fi nancial assets include trade and other receivables, cash and short-term deposits that arise directly from its operations.
The Company is exposed to market risk, credit risk and liquidity risk.
Risk management is integral to the whole business of the Company. The Company has a system of controls in place to create an acceptable balance between the cost of risks occurring and the cost of managing the risks. The General Director continually monitors the Company’s risk management process to ensure that an appropriate balance between risk and control is achieved.
The General Director reviews and agrees policies for managing each of these risks which are summarized below.
Market risk
Market risk is the risk that the fair value of future cash fl ows of a fi nancial instrument will fl uctuate because of changes in market prices. Market prices comprise four types of risk: interest rate risk, currency risk, commodity price risk and other price risk, such as equity price risk. Financial instruments affected by market risk include loans and borrowings, and deposits.
Interest rate risk
Interest rate risk is the risk that the fair value or future cash fl ows of a fi nancial instrument will fl uctuate because of changes in market interest rates. The Company’s exposure to market risk for changes in interest rate relates primarily to the Company’s cash and short-term deposits and loans.
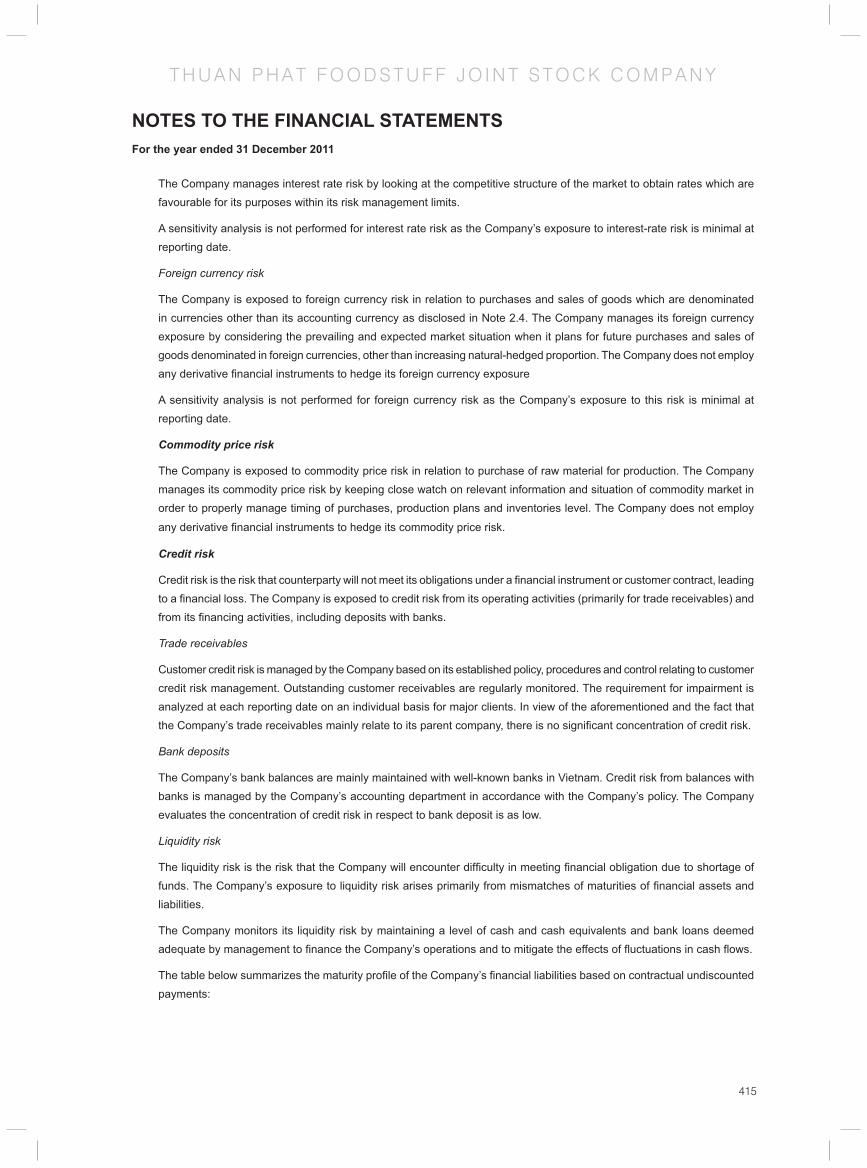
415
T H U A N P H A T F O O D S T U F F J O I N T S T O C K C O M P A N Y
NOTES TO THE FINANCIAL STATEMENTSFor the year ended 31 December 2011
The Company manages interest rate risk by looking at the competitive structure of the market to obtain rates which are favourable for its purposes within its risk management limits.
A sensitivity analysis is not performed for interest rate risk as the Company’s exposure to interest-rate risk is minimal at reporting date.
Foreign currency risk
The Company is exposed to foreign currency risk in relation to purchases and sales of goods which are denominated in currencies other than its accounting currency as disclosed in Note 2.4. The Company manages its foreign currency exposure by considering the prevailing and expected market situation when it plans for future purchases and sales of goods denominated in foreign currencies, other than increasing natural-hedged proportion. The Company does not employ any derivative fi nancial instruments to hedge its foreign currency exposure
A sensitivity analysis is not performed for foreign currency risk as the Company’s exposure to this risk is minimal at reporting date.
Commodity price risk
The Company is exposed to commodity price risk in relation to purchase of raw material for production. The Company manages its commodity price risk by keeping close watch on relevant information and situation of commodity market in order to properly manage timing of purchases, production plans and inventories level. The Company does not employ
any derivative fi nancial instruments to hedge its commodity price risk.
Credit risk
Credit risk is the risk that counterparty will not meet its obligations under a fi nancial instrument or customer contract, leading to a fi nancial loss. The Company is exposed to credit risk from its operating activities (primarily for trade receivables) and from its fi nancing activities, including deposits with banks.
Trade receivables
Customer credit risk is managed by the Company based on its established policy, procedures and control relating to customer credit risk management. Outstanding customer receivables are regularly monitored. The requirement for impairment is analyzed at each reporting date on an individual basis for major clients. In view of the aforementioned and the fact that the Company’s trade receivables mainly relate to its parent company, there is no signifi cant concentration of credit risk.
Bank deposits
The Company’s bank balances are mainly maintained with well-known banks in Vietnam. Credit risk from balances with banks is managed by the Company’s accounting department in accordance with the Company’s policy. The Company evaluates the concentration of credit risk in respect to bank deposit is as low.
Liquidity risk
The liquidity risk is the risk that the Company will encounter diffi culty in meeting fi nancial obligation due to shortage of funds. The Company’s exposure to liquidity risk arises primarily from mismatches of maturities of fi nancial assets and liabilities.
The Company monitors its liquidity risk by maintaining a level of cash and cash equivalents and bank loans deemed adequate by management to fi nance the Company’s operations and to mitigate the effects of fl uctuations in cash fl ows.
The table below summarizes the maturity profi le of the Company’s fi nancial liabilities based on contractual undiscounted payments:
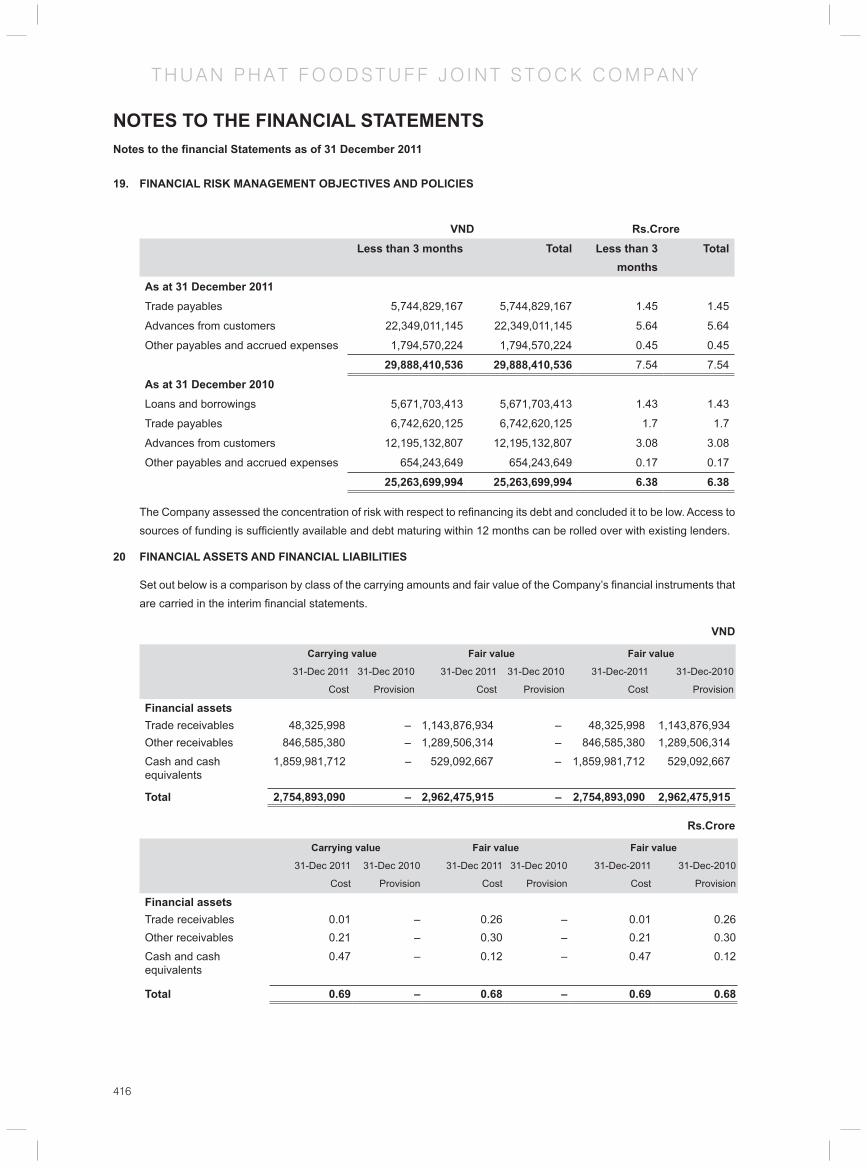
416
T H U A N P H A T F O O D S T U F F J O I N T S T O C K C O M P A N Y
NOTES TO THE FINANCIAL STATEMENTSNotes to the fi nancial Statements as of 31 December 2011
19. FINANCIAL RISK MANAGEMENT OBJECTIVES AND POLICIES
VND Rs.Crore
Less than 3 months Total Less than 3 months
Total
As at 31 December 2011Trade payables 5,744,829,167 5,744,829,167 1.45 1.45
Advances from customers 22,349,011,145 22,349,011,145 5.64 5.64
Other payables and accrued expenses 1,794,570,224 1,794,570,224 0.45 0.45
29,888,410,536 29,888,410,536 7.54 7.54
As at 31 December 2010Loans and borrowings 5,671,703,413 5,671,703,413 1.43 1.43
Trade payables 6,742,620,125 6,742,620,125 1.7 1.7
Advances from customers 12,195,132,807 12,195,132,807 3.08 3.08
Other payables and accrued expenses 654,243,649 654,243,649 0.17 0.17
25,263,699,994 25,263,699,994 6.38 6.38
The Company assessed the concentration of risk with respect to refi nancing its debt and concluded it to be low. Access to sources of funding is suffi ciently available and debt maturing within 12 months can be rolled over with existing lenders.
20 FINANCIAL ASSETS AND FINANCIAL LIABILITIES
Set out below is a comparison by class of the carrying amounts and fair value of the Company’s fi nancial instruments that are carried in the interim fi nancial statements.
VND
Carrying value Fair value Fair value
31-Dec 2011 31-Dec 2010 31-Dec 2011 31-Dec 2010 31-Dec-2011 31-Dec-2010
Cost Provision Cost Provision Cost Provision
Financial assetsTrade receivables 48,325,998 – 1,143,876,934 – 48,325,998 1,143,876,934Other receivables 846,585,380 – 1,289,506,314 – 846,585,380 1,289,506,314
Cash and cash equivalents
1,859,981,712 – 529,092,667 – 1,859,981,712 529,092,667
Total 2,754,893,090 – 2,962,475,915 – 2,754,893,090 2,962,475,915
Rs.Crore
Carrying value Fair value Fair value
31-Dec 2011 31-Dec 2010 31-Dec 2011 31-Dec 2010 31-Dec-2011 31-Dec-2010
Cost Provision Cost Provision Cost Provision
Financial assetsTrade receivables 0.01 – 0.26 – 0.01 0.26Other receivables 0.21 – 0.30 – 0.21 0.30
Cash and cash equivalents
0.47 – 0.12 – 0.47 0.12
Total 0.69 – 0.68 – 0.69 0.68

417
T H U A N P H A T F O O D S T U F F J O I N T S T O C K C O M P A N Y
NOTES TO THE FINANCIAL STATEMENTSFor the year ended 31 December 2011
VND
Carrying value Fair value31-Dec 2011 31-Dec 2010 31-Dec 2011 31-Dec 2010
Cost Provision Cost Provision
Financial liabilitiesLoans and borrowings – 5,671,703,413 – 5,671,703,413Payable to a related party 22,349,011,145 12,195,132,807 22,349,011,145 12,195,132,807
Trade payables 5,744,829,167 6,742,620,125 5,744,829,167 6,742,620,125Other payables 1,794,570,224 654,243,649 1,794,570,224 654,243,649Total 29,888,410,536 25,263,699,994 29,888,410,536 25,263,699,994
RS.Crore
Carrying value Fair value31-Dec 2011 31-Dec 2010 31-Dec 2011 31-Dec 2010
Cost Provision Cost Provision
Financial liabilitiesLoans and borrowings – 1.30 – 1.30Payable to a related party 5.64 2.80 5.64 2.80
Trade payables 1.45 1.55 1.45 1.55Other payables 0.45 0.15 0.45 0.15Total 7.54 4.50 7.54 4.50
The fair value of the fi nancial assets and liabilities are included at the amount at which the instrument could be exchanged in a current transaction between willing parties, other than in a forced or liquidation sale.
The following method and assumption were used to estimate the fair values:
• Cash and short-term deposits, trade receivables, trade payables and other current liabilities approximate their carrying amounts largely due to the short-term maturities of these instruments.
21. EVENTS AFTER THE BALANCE SHEET DATE
There have been no signifi cant events occurring after the balance sheet date which would require adjustments or disclosures to be made in the fi nancial statements.
Nguyen Chi Thanh Le Quang HanhChief Accountant General Director
15 March 2012

NOTES

Designed by Alok Nanda and Company, Printed by Dhote Offset Technokrafts Pvt. Ltd.