(designing frame, knuckle and suspension arms)
TRANSCRIPT

Design Analysis and Optimization of an
All-Terrain Vehicle (ATV) (Designing Frame, Knuckle and Suspension Arms)
Abhinav Mishra / B.Tech UG Student
Department of Mechanical Engineering
National Institute of Technology
Raipur, Chhattisgarh
Aniket Kumar Sahu / B.Tech UG Student
Department of Mechanical Engineering
National Institute of Technology
Raipur, Chhattisgarh
Abstract— The paper summarizes the steps taken in finalizing
the design of an electric ATV, made for SAE BAJA which
provides a platform for undergraduate students to apply the
principles of engineering to expose their proficiency in the
automotive world. The purpose of the paper is to calculate
various boundary conditions on the frame, steering knuckle,
suspension arms of a light ATV under extreme conditions and
use them to improve the overall design which requires the
minimum amount of material while providing a significant
Factor of safety. An iterative approach using standard
calculations & FEA is discussed in the study for simulation and
optimization of the design. For all parts, stress & deformation
analysis is performed. For design optimization in the knuckle,
topology is done. Von mises Stress, total deformation and safety
factor were calculated for each part under appropriate
boundary conditions. The study discussed step by step
calculations of forces on each component in detail and their
simulations with an appropriate degree of precision. Following
the methodology shown in the study will be useful in the
development of a Light ATV, further, the suggested
simulations will ensure the safety of the vehicle.
Keywords— Von mises stress, Deformation, Safety factor,
Design, Material Selections, FEA, Topology, Knuckle, Frame,
Suspension Arms.
I. INTRODUCTION
As the name suggests an ATV is a vehicle that runs on tough
terrains and hence every part of the vehicle was designed
such that it can successfully withstand different types of
loadings in off-road conditions without having any
permanent deformation in it (i.e., von-mises stress value in
the analysis should be very much lower than the yield stress
of the material).
All the parts of the vehicle are designed in SOLIDWORKS
2018 and analyzed in ANSYS 19.2 with extreme boundary
conditions and for setting up the steering and suspension
geometry LOTUS shark was used.
II. RESEARCH GAP
A detailed calculation of boundary conditions and stepwise
approach to design the parts of a light ATV which can
withstand extreme loads was needed so that one can find a
complete study in one paper, further current publications
either fail to take all the required forces in consideration or
fail to explain their calculations.
III. METHODOLOGY
Finalizing the design was an iterative process. Steps
included in the process-
1. Preparation of basic design
2. Calculation of boundary conditions.
3. Analysis of the design under calculated boundary
conditions using the finite element method in
Ansys software
4. Optimization of design based on results obtained
from the analysis
5. Again, applying step 3 and 4 on optimized design
6. Repeating the process to get the desired design
IV. FRAME
The Frame is a structure made up of metal tubes whose main objective is to ensure the safety of the driver and carry different components of the vehicle such as powertrain, steering & suspension etc.
The design process of the frame can be divided into four
steps-
1. Material and cross-section Selection
2. Designing the roll cage according to the rulebook,
3. Analysis of the roll cage with calculated boundary
conditions.
4. Ergonomics check using PVC Pipes.
A. Material & Cross Section Selection
After considering each parameter like strength, weight, stiffness, cost, availability and a detailed market survey we shortlisted two AISI graded materials which were fulfilling the requirements first one was AISI 1018 steel and the second one was AISI 4130 steel, the details of both, as provided by the dealer, are given in the below table.
TABLE 1. COMPARISON BETWEEN AISI 4130 AND AISI 1018
Material AISI 4130 AISI 1018
Yield Strength 659 MPa 418.82 MPa
Welding Method TIG/MIG SMAW/MIG
Carbon % 0.3 0.18
Density 7.85 g/cc 7.87 g/cc
International Journal of Engineering Research & Technology (IJERT)
ISSN: 2278-0181http://www.ijert.org
IJERTV10IS010120(This work is licensed under a Creative Commons Attribution 4.0 International License.)
Published by :
www.ijert.org
Vol. 10 Issue 01, January-2021
271

We can see AISI 4130 provides good strength, but at the
same time it is costlier than AISI 1018 and has poor
weldability, and also after considering the fabrication
constraints like available welding method (we used
SMAW), availability of the material in local market and total
cost, we selected AISI 1018 steel as our primary and
secondary material because it is cheap, easily available, can
be welded by SMAW and it also provides sufficient bending
strength and bending stiffness to overcome the constraints
for primary material as given in the rulebook.
The cross-section was selected after calculating bending
strength and bending stiffness of primary material and the
calculated figures are as below
Material Used - AISI 1018
Yield Strength (Sy) - 418.82 MPa
Young's Modulus of elasticity (E) - 205 GPa
Outer diameter (Do) - 25.4 mm
Inner diameter (Di) - 19.4 mm (thickness = 3mm)
Second moment of area (I) - 13478.64 mm4
Distance from central axis (c) - 12.7 mm
Calculated bending strength - 444.497 MPa
Calculated bending stiffness - 2763.121 Nm2
We can see that bending strength and bending stiffness is
exceeding the minimum required value i.e. 387.377 MPa
and 2763.121 Nm2.
So, the cross-section of primary material was decided to be
1-inch outer diameter and 3 mm thickness and that of
secondary material to be 1-inch outer diameter and 2 mm
thickness.
B. Designing of Roll Cage
The design process of the roll cage was iterative and based
on several engineering and reverse engineering processes.
Firstly, we decided the driver of the vehicle according to
weight and height and then took every required
measurement to start the designing process of the roll cage
in SOLIDWORKS 2018. During the designing, we took care
of each rule given in the rulebook, the driver ergonomics and
also the requirements of various domains. In this way, we
prepared a basic model of our roll cage and we used CATIA
V5 to prepare a driver manikin and checked for required
clearances for the driver. Now the only thing we had to do
was certain modifications based on the analysis. After these
modifications, we got the final design of the frame.
Fig-1: Final design of the roll cage Fig-2: Driver’s view in CATIA V5
C. Finite Element Analysis (FEA)
The roll cage is made up of circular pipes with hollow
sections and thus we can neglect the thickness of the pipe
and the pipe can be assumed as a curved rectangular surface,
so we have used 2D elements for meshing the roll cage. The
method used was quadrilateral dominant. We tried both the
first order and second-order elements but didn't find any
significant difference in the results so after considering the
time & hardware constraints, we used first-order elements.
We also did the mesh dependency test (grid independence)
for different element sizes and found the saturation around
3mm as shown in the Figure. We have used the appropriate
value of proximity for the joints, as they are the areas of
high-stress concentration. The Boundary conditions were
considered such that they satisfy the actual dynamic loading
conditions in static structural.
Fig-3 Variation of Stress with the mesh size.
Fig-4: Variation of Deformation with the mesh size.
From Impulse-Momentum Theorem,
F*t = m*(u-v)
here,
F = Impulsive force,
t = time,
m = mass of the vehicle,
v = final velocity,
u = initial velocity
Suppose the vehicle is going with its maximum velocity and
strikes with an obstacle and comes into rest after the impact.
F*t = m*(vmaxx-0)
F = (m*vmax)/t (1)
We have considered two types of impact forces -
1. Impact of roll cage with a rigid body (like rock,
wall): impulsive time of impact =0.15 seconds
International Journal of Engineering Research & Technology (IJERT)
ISSN: 2278-0181http://www.ijert.org
IJERTV10IS010120(This work is licensed under a Creative Commons Attribution 4.0 International License.)
Published by :
www.ijert.org
Vol. 10 Issue 01, January-2021
272

2. Impact of roll cage with a deformable body (like a
tree, another roll cage): impulsive time of impact
=0.30 seconds Front Impact –
For front impact analysis, we assume the vehicle is going in the forward direction and it suddenly strikes a rigid obstacle like a wall with a maximum speed (i.e. 45 km/h) and comes into rest after the collision.
Then the impact force F will be,
F = (m*vmax)/t (from 1)
m = 270 kg, vmax= 45 km/h or 11.12 m/s
F = (270*11.12)/0.15
F = 20,016 N
The impact forces were applied on the forward part of the vehicle and the rear suspension points were constrained to restrict all of the six degrees of freedom.
Fig-5: Front Impact - von-mises stress- 329.9 MPa FOS-1.27.
Fig 6: Front Impact - Max deformation- 1.84mm.
Rear and Side Impact –
For rear and side-impact analysis, it was assumed that some other vehicle comes and strikes with our vehicle, in this case, the impact will be of the second type, that is the impact of the roll cage with a deformable body, so the impact time will be 0.30 seconds.
Then the impact force F will be,
F = (m*vmax)/t (from 1)
m = 270 kg, vmax= 45 km/h or 11.12 m/s
F = (270*11.12)/0.30
F = 10,008 N
The impact forces were applied on the rearmost part of the vehicle and the front suspension points were constrained.
Fig 7. Rear impact von-mises stress- 183.3 MPa FOS-2.23.
Fig 8. Rear impact Max deformation- 1.2844mm.
Rollover –
As we know that the chances of having a rollover are more than that of the front, rear or side impacts, in adverse off-road conditions so to analyze the vehicle against a rollover condition becomes crucial.
We have to analyze the vehicle in the worst condition which it can experience at the event and that is when the vehicle falls upside down from a height let us say one meter.
Then from the law of conservation of energy,
m*g*h = (½)*m*V2
V = (2*g*h) ^(½)
here,
h = 1m and g = 9.81 m/s2
V = (2*9.81*1) ^(½)
V = 4.42 m/s
Now from (1),
F = (m*vmax)/t
F = (270*4.42)/0.15
International Journal of Engineering Research & Technology (IJERT)
ISSN: 2278-0181http://www.ijert.org
IJERTV10IS010120(This work is licensed under a Creative Commons Attribution 4.0 International License.)
Published by :
www.ijert.org
Vol. 10 Issue 01, January-2021
273

F = 7956 N
Time taken was 0.15 seconds as the ground is considered a rigid boundary.
The impact force is applied at the joint of RHO and FBM members at an angle of 45 degrees with the vertical and lower part of the roll cage being constrained.
RHO – Roll Hoop Overhead member
FBM – Front Bracing Members
Fig 9. Roll cage roll over von-mises stress - 274.74 MPa FOS-1.58.
Fig 10. Roll cage (rollover) Max deformation- 1.60 mm.
Torsional Rigidity –
Torsional Analysis of the roll cage is carried out to determine the torsional stiffness to withstand off road conditions while taking into consideration the torsional forces acting on the frontal and Rear members of the vehicle. Both tyres on the front and rear axle experience a moment. The torque is applied to one tyre and reacted by the other one which is equal and opposite hence a couple is generated which tries to twist the roll cage.
Front track width = BF= 1.37m
Rear track width = BR= 1.32m
Average track width = B = 1.34 m
Let us assume our vehicle is going over a bump and droop simultaneously with a left wheel over the bump and right over the droop,
Then the Net Torque = T = (FL -FR) *(B/2)
Here FL, FR are the upward forces acting on the left and right wheels,
Maximum torque will act when FR equals zero.
i.e. Tmax = FL*(B/2)
In this position, all the downward force will be equal to FL
i.e. FL= mg,
and also Tmax = mg*(B/2)
Tmax= 270*9.81*1.34/2
Tmax= 1782.5 Nm
Calculating the couple forces
2*F*(1.34/2) = 1782.5
F = 1330 N
Applying a force of 1330 N at front left suspension points and at the rear right suspension points with the rest of the two as constraints.
Fig 11. Roll cage (Torsion) Max stress 284.11MPa FOS-1.40.
Fig 12. Roll cage (Torsion) Max Deformation 5.46mm.
V. STEERING KNUCKLE
The Steering Knuckle is a very vital component that integrates the wheel assembly (that includes the steering, suspension, and brakes) and is connected to the frame with the help of suspension arms. It also plays a very important role in the steering mechanism by using the linear motion of the tie rod to give a turning effect to the wheel’s assembly (following Ackerman geometry).
Designing of Knuckle was a complex task as it is included
in unsprung mass so it has to be lightweight and also it has
to withstand various forces in off-road conditions so we had
International Journal of Engineering Research & Technology (IJERT)
ISSN: 2278-0181http://www.ijert.org
IJERTV10IS010120(This work is licensed under a Creative Commons Attribution 4.0 International License.)
Published by :
www.ijert.org
Vol. 10 Issue 01, January-2021
274

to design the knuckle in such a way that it would give the
best strength to mass ratio.
The complete design process of Knuckle can be divided into
following steps-
1) Basic designing of knuckle according to
suspension hardpoints.
2) Calculation of forces in different boundary
conditions.
3) Analysis of Knuckle.
4) Topology optimization of analyzed Knuckle.
5) Final Designing according to optimized data.
6) Analysis of Final Knuckle.
A. Basic Designing
The basic design of the knuckle was made considering –
a) Suspension Hardpoints: The location of Suspension
points was calculated with the help of LOTUS Suspension
Analysis software with the following wheel Alignment
parameters at static:
Table 2. Wheel alignment parameters & their values.
Parameter Value
Camber angle -1.00 deg
Castor angle 5.09 deg
KingPin Angle 9.18 deg
Castor trail 23.27 mm
Scrub Radius 20.65 mm
Toe angle 0 deg
Ackermann% 76.3%
Roll Centre Height from ground 300 mm
Anti-Dive% 0
Anti-Squat% 0
b) Weight of the knuckle: Weight of the knuckle is very
crucial as it adds up to the unsprung mass of the vehicle, so
the design must give sufficient strength with the least
possible weight.
c) Material to be used: Material selection is also a very
important parameter; it defines the volume of the design and
also the weight according to the strength of the material.
d) Machining Process adopted: Design is very much
influenced by the available machining processes.
e) Cost: Along with the machining process, the cost is also a
major constraint at the time of designing, as it influences
many other parameters like material selection, machining
process, accuracy in fabrication, etc
Firstly, the suspension hardpoints along with wheel centre
point and outer track rod ball joint were plotted with their
respective coordinates in a space of SOLIDWORKS. The
next step was to locate the distance of brake calliper
mounting from the wheel centre, which depends on the
positions of the hub and brake rotor and also on the distance
between both the holes of the brake calliper. Now we have
all the required points for designing the knuckle, so
designing starts with the main body that connects the lower
wishbone outer ball joint to the upper wishbone outer ball
joint and then the steering arm and calliper mountings are
added on to it.
After some finishing works and reducing the sharp edges
with the help of fillets and other features basic design looks
like this
Fig 13. The final design of the knuckle
B. Calculation of Forces
For calculating the forces acting on the knuckle in adverse
conditions we have considered a situation when effects of a
bump, cornering, steering, and braking are acting at the same
time. The forces in each case were calculated separately.
Force calculation due to a Bump -
We have considered a case when the vehicle goes over a
bump and the wheel reaches its maximum travel in this
position, the damper compresses completely and suspension
arms rotate to their maximum, in that instant we can assume
the whole assembly to be in static equilibrium.
We have used FOX Float 3 and referred to its manual for
calculating force at maximum compression which is 5700 N
for 4 inches of longitudinal travel. Now with the help of
suspension hardpoints, we made two sketches of lower
suspension arm assembly one for the vehicle in a static
position and another for the above-described position.
Distances and angles from the front view are shown in Fig.
International Journal of Engineering Research & Technology (IJERT)
ISSN: 2278-0181http://www.ijert.org
IJERTV10IS010120(This work is licensed under a Creative Commons Attribution 4.0 International License.)
Published by :
www.ijert.org
Vol. 10 Issue 01, January-2021
275

Fig 14. Analysis of Suspension arm travel.
We can see that the angle between fox and suspension arms
at extreme conditions is 51 degrees.
Let the force on the lower ball joint in vertical direction be
(FLB)V, then at maximum compression position (i.e.static
equilibrium) moment about pivot will be conserved.
(FLB)V*cos(3.27)*408.55 = 5700*sin(51)*245
(FLB)V=(5700*sin(51)*245)/(cos(3.27)*408.5)
(FLB)V = 2660.76N
Fig 15. Knuckle side view, Force due to bump
Force calculation due to cornering -
All the horizontal force on the ball joints is assumed to be
acting due to cornering force only.
Let FC be the total cornering force acting on one wheel of
the front turning with a velocity of V = 45 km/h or 11.12 m/s
and with a turning radius of R = 2.5 m.
Then,
FC = m*V2/R
(m = 20% of total mass of vehicle)
FC = (0.2*270*(11.12)^2)/2.5
FC = 2670.93N
This force will be acting on the spindle that passes through
the wheel centre, therefore by considering static equilibrium
condition we can calculate the value of the forces acting on
both the ball joints. Let the force on lower ball joint in
horizontal direction be (FLB)H and that on upper ball joint be
(FUB)H
Then, from moment conservation about lower ball joint,
(FUB)H = FC *(distance of wheel centre from the
lower ball joint)/(distance of upper ball joint from the lower
ball joint)
(FUB)H = (2670.93*45.81)/95.49
(FUB)H= 1281.34 N
and,
FC = (FLB)H + (FUB)H
(FLB)H = 1389.58 N
Fig 16. Forces due to cornering.
Calculation of forces on Steering Arm -
The steering axis intersects the ground at some distance from
the point of contact of the wheel, this distance is equal to the
vector addition of scrub radius and caster trail. Due to this
separation, the net frictional force causes a moment about
the steering axis and this moment is balanced by a force
acting on the steering arm of the knuckle. Wheel and ground
were assumed to be a point contact pair with the patch area
zero.
Two Frictional forces are acting on the wheel in the
described boundary conditions, one is cornering frictional
force and the other is trailing frictional force hence there are
two moments caused by each force with cornering frictional
force and caster trail causing a clockwise moment and
trailing frictional force and scrub radius causing an
anticlockwise moment.
Clockwise moment -
Clockwise moment = (Cornering force)*(caster trail)
= (2670.93)*(23.27) Nmm
Clockwise moment = 62152.54 Nmm
Anticlockwise moment -
Trailing frictional force = μ*(20% of mass)*(g)
Trailing frictional force = 1*0.2*270*9.81 N
Trailing frictional force = 529.74 N
International Journal of Engineering Research & Technology (IJERT)
ISSN: 2278-0181http://www.ijert.org
IJERTV10IS010120(This work is licensed under a Creative Commons Attribution 4.0 International License.)
Published by :
www.ijert.org
Vol. 10 Issue 01, January-2021
276

Anticlockwise moment = (Trailing frictional force)*(scrub
radius)
= (529.74)*(20.65)
Anticlockwise moment = 10912.64 Nmm
Net moment -
Net moment = (clockwise moment) + (anticlockwise
moment)
Net moment = 62152.54 - 10912.64
Net moment = 51239.9 Nmm
Moment due to steering arm -
Moment due to steering arm = (F)*(Perpendicular distance
between outer track rod ball joint and steering axis)
Moment due to steering arm = (F)*(82.82)
Moment due to steering arm = Net moment
F*(82.82) = 51239.9
F = 618.69 N
Fig 17. Standard angles of wheel alignment.
Fig 18. Force of steering arm.
Calculation of Moment due to the clamping force of brake
calliper -
Mass of vehicle with driver= 270kg
FOS taken =1.5
Mass taken in Calculation=400 kg
Coefficient of friction between road and tyre=0.6
Centre of gravity (COG) height=485 mm Horizontal
distance between front-wheel and COG=900 m
Horizontal distance between rear-wheel and COG=420 m
Dynamic weight transfer ratio: 55:45
Total braking force=2354.4 N
Total applied braking force= 3262.38N
Tyre radius= 10.5 inches
Front braking :
Force=1294.92 N
Force on one wheel = 1294.92/2 = 647.46
So moment about wheel centre due to braking force,
Moment = (braking force)*(distance from wheel center)
Moment = 647.46*67.82
Moment = 43910.73 Nmm
C. Analysis of Knuckle-
After basic designing and calculation of forces, now this was
the time to analyse the design in calculated boundary
conditions.
Spindle and knuckle were analysed separately, in this
segment we will be discussing the analysis of knuckle only.
The purpose of the analysis is to make sure the designed
knuckle withstands the calculated forces with an appreciable
factor of safety. Since the knuckle is a three-dimensional
object, we need to have 3D mesh elements inside the volume
and therefore we have used three-dimensional Hex
Dominant mesh elements of second order with a mesh size
of 2mm and with free face mesh type being quad/tri. Sharp
corners and edges and curved surfaces are the locations
which are very likely to have maximum stress concentration
and therefore it becomes very important to have a good
quality mesh in these areas, to fulfil this purpose we have
used certain mesh features provided in Ansys Mechanical -
a) Mesh Defeaturing: Small corners can deviate the
results by having maximum stress concentration to
avoid this deviation Mesh Defeaturing is used it
defeatures or removes small corners. The value of
Mesh defeaturing taken was 0.4mm.
b) Capture Curvature: To capture small curves and to
have good quality mesh at curvature. The minimum
curvature size taken was 0.5mm.
c) Capture Proximity: This is the most important
feature. It captures all proximities and helps to
generate a small and good quality mesh in these
areas. The minimum proximity size taken was
0.5mm.
International Journal of Engineering Research & Technology (IJERT)
ISSN: 2278-0181http://www.ijert.org
IJERTV10IS010120(This work is licensed under a Creative Commons Attribution 4.0 International License.)
Published by :
www.ijert.org
Vol. 10 Issue 01, January-2021
277
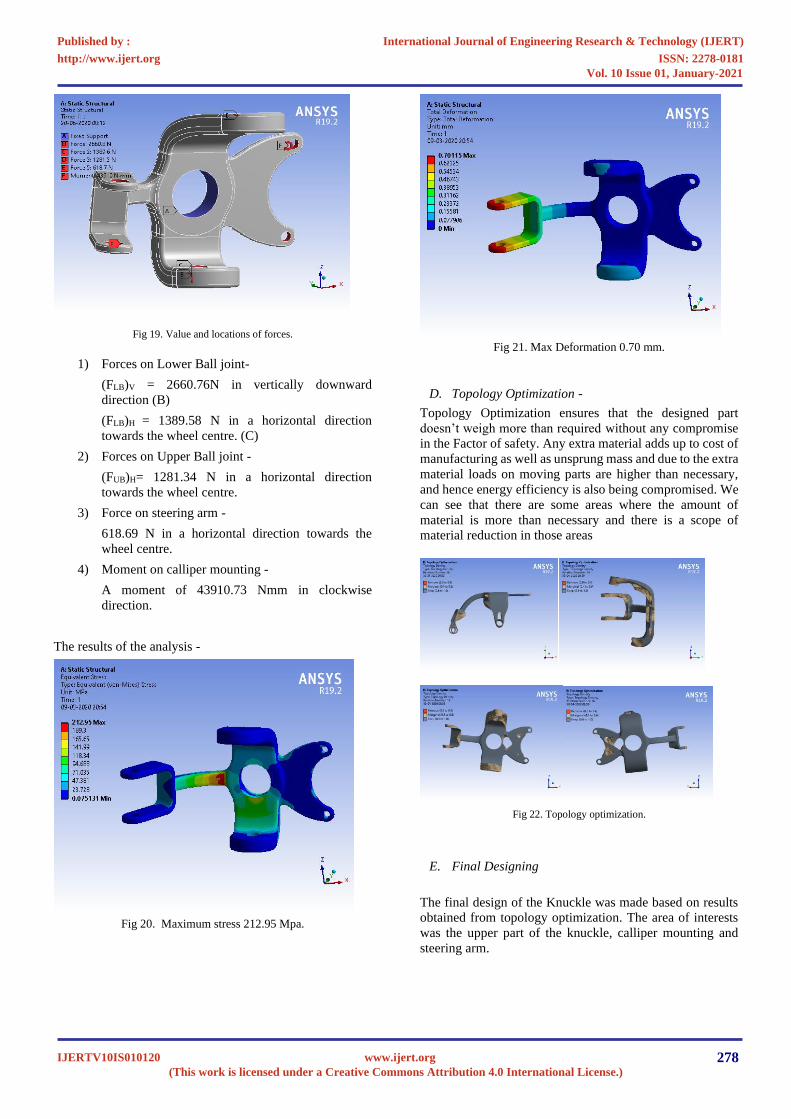
Fig 19. Value and locations of forces.
1) Forces on Lower Ball joint-
(FLB)V = 2660.76N in vertically downward
direction (B)
(FLB)H = 1389.58 N in a horizontal direction
towards the wheel centre. (C)
2) Forces on Upper Ball joint -
(FUB)H= 1281.34 N in a horizontal direction
towards the wheel centre.
3) Force on steering arm -
618.69 N in a horizontal direction towards the
wheel centre.
4) Moment on calliper mounting -
A moment of 43910.73 Nmm in clockwise
direction.
The results of the analysis -
Fig 20. Maximum stress 212.95 Mpa.
Fig 21. Max Deformation 0.70 mm.
D. Topology Optimization -
Topology Optimization ensures that the designed part
doesn’t weigh more than required without any compromise
in the Factor of safety. Any extra material adds up to cost of
manufacturing as well as unsprung mass and due to the extra
material loads on moving parts are higher than necessary,
and hence energy efficiency is also being compromised. We
can see that there are some areas where the amount of
material is more than necessary and there is a scope of
material reduction in those areas
Fig 22. Topology optimization.
E. Final Designing
The final design of the Knuckle was made based on results
obtained from topology optimization. The area of interests
was the upper part of the knuckle, calliper mounting and
steering arm.
International Journal of Engineering Research & Technology (IJERT)
ISSN: 2278-0181http://www.ijert.org
IJERTV10IS010120(This work is licensed under a Creative Commons Attribution 4.0 International License.)
Published by :
www.ijert.org
Vol. 10 Issue 01, January-2021
278

Fig 23. Final designed knuckle.
F. Analysis of Final Knuckle
The final design was verified under the same boundary
conditions. The results were satisfactory as there is no
change in deformation and also stress is in the permissible
range with a safety factor of more than 1.7.
Fig 24. Max Deformation 0.72mm.
Fig 25. Max Stress 243.55 Mpa.
VI. SUSPENSION ARMS
The selection of Suspension geometry is done to fulfil our
requirements with the minimum material application. A
double-wishbone with dual A-arm, with a damper to lower
wishbone is chosen for the front as it has the advantage of
more variation in toe angle, camber angle and caster angle,
for rear H-arm with camber link arm is selected due to its
robust structure and lesser material requirement and
fulfilment of requirements of rear suspension geometry.
To satisfy our wheel alignment parameters, the coordinates
of the control arms were located using Lotus suspension
analysis software for appropriate length and dimensions. For
the selection of appropriate thickness of the control arms we
used bending equation,
Fig 26. Loadings on suspension arms.
Considering Pure Bending,
Force due to Fox on Maximum compression = 5700N
Vertical component = 5700sin(51)
=4429.73N
As it is distributed across 2 sides of the control arm,
Force= 4429.73/2 = 2214.865N
Now, Balancing Moments about R2
2214.86 N* 245mm = R1 * 408.15mm
R1= 1329.512 N
Maximum Bending Moment at 163.15mm from
M1 = 1329.512 * 163.15 = 216910.033 Nmm
Safety Factor, n= 2
Yield Stress = 418.18 MPa
σ/n=(M*y)/I
418.18/2 = (216910.03*25.4/2)/I
I= 13174.9838 mm4
For 1 Inch external Diameter Tubular Pipe,
I = π/64* [(25.4)4 – (d)4]
d = 19.6 mm
Therefore thickness = (D - d)/2= 2.9 mm
International Journal of Engineering Research & Technology (IJERT)
ISSN: 2278-0181http://www.ijert.org
IJERTV10IS010120(This work is licensed under a Creative Commons Attribution 4.0 International License.)
Published by :
www.ijert.org
Vol. 10 Issue 01, January-2021
279

The minimum requirement of thickness is 2.9mm and hence
we used a pipe of external dia 1 inch with a thickness of 3
mm.
The control arms were designed and then simulated with
extreme boundary conditions.
A force of 5700N was applied at the suspension link at an
angle of 51 degrees with both inner and outer pivot point
constrained.
Fig 27. Front suspension arm max deformation 0.30 mm.
Fig 28. Front suspension arm max stress 232.65Mpa.
Fig 29. Rear suspension arm max stress 265.07 Mpa.
Fig 29. Rear suspension arm max deformation 0.183 mm.
VII. RESULTS
Frame - Maximum stresses (Von mises stress) and max
deformation in all the impact tests of the designed frame are
in acceptable range with a good safety factor.
Table: 3 Stress, Deformation and FOS results on frame
Test Force (N) Stress
(MPa) Deformation
(mm) FOS
Front 20000 329.9 1.84 1.24
Rear 10000 183.3 1.28 2.29
Side 10000 276.31 1.85 1.52
Roll Over 8000 274.74 1.60 1.52
Torsion 1330 (couple) 284 5.46 1.47
Knuckle - Knuckle was analysed in calculated boundary
conditions and results obtained were used in topology
optimization which eventually led us to the final design of
the part. Table 4: Stress, Deformation and FOS results on Knuckle
Stress
(MPa)
Deformation
(mm)
FOS
243.55 0.721 1.7
Suspension Arm - Thickness of suspension arm was
calculated and arms were analysed at maximum wheel
travel. Table 5: Stress, Deformation and FOS results on Suspension Arm
Arm Stress
(MPa)
Deformation
(mm)
FOS
Front 232.65 0.30 1.8
Rear 265.07 0.183 1.57
VIII. CONCLUSION
This paper summarizes ways for calculations, optimization,
and economic as well as ergonomic designing of a light ATV
with maximum possible safety factor under extreme
boundary conditions. The impact analysis of the roll cage,
structural and topological analysis of steering knuckle,
suspension arms are well illustrated above.
ACKNOWLEDGEMENT
We would like to thank our seniors, professors & college
administration for their guidance and support throughout our
career. We would also like to thank our teammates for
successfully helping to complete the designing and
manufacturing of the ATV. Lastly, we want to thank our
family and friends for motivating us to be part of the project
and to write this paper.
REFERENCES
[1] U. Yashvanth , Mohammad raffi , G. Raghu Vamsi Reddy . (2019).
Dynamic impact analysis on ATV upright.International Journal of
Mechanical and Production Engineering Research and Development (IJMPERD) 9, 5, 689– 698.
[2] Anshul Dhakar and Rishav Ranjan. (2016). Force calculation in
upright of a FSAE race car. International Journal of Mechanical Engineering and Technology (IJMET) 7, 2, 168–176.
International Journal of Engineering Research & Technology (IJERT)
ISSN: 2278-0181http://www.ijert.org
IJERTV10IS010120(This work is licensed under a Creative Commons Attribution 4.0 International License.)
Published by :
www.ijert.org
Vol. 10 Issue 01, January-2021
280

[3] Duygu Güler. (2006). Dynamic analysis of double-wishbone
suspension. A Thesis Submitted to the Graduate School of
Engineering and Sciences of İzmir Institute of A Thesis Submitted to
the Graduate School of Engineering and Sciences of İzmir Institute of Technology.
[4] Sanjay Yadav, Ravi Kumar Mishra (2016). Design and Analysis of Steering Knuckle Component. International Journal of Engineering Research & Technology (IJERT) 5, 4.
[5] Gondi Prabhu Charan Teja, K.V.P.P.Chandu.(2016). Weight
optimization of steering knuckle joint using FEA. International Research Journal of Engineering and Technology (IRJET) 3, 12.
[6] Noorbhasha, IN. (2010). Computational analysis for improved design
of an SAE BAJA frame structure. UNLV Theses, Dissertations, Professional Papers, and Capstones. Paper
International Journal of Engineering Research & Technology (IJERT)
ISSN: 2278-0181http://www.ijert.org
IJERTV10IS010120(This work is licensed under a Creative Commons Attribution 4.0 International License.)
Published by :
www.ijert.org
Vol. 10 Issue 01, January-2021
281