designing of pic 16f877a based ph node for the …
TRANSCRIPT
International Research Journal of Engineering and Technology (IRJET) e-ISSN: 2395-0056
Volume: 08 Issue: 03 | Mar 2021 www.irjet.net p-ISSN: 2395-0072
© 2021, IRJET | Impact Factor value: 7.529 | ISO 9001:2008 Certified Journal | Page 1447
Designing of PIC 16F877A based pH node for the development of water
quality monitoring system for housing societies
S. A. Pote1, D. M. Adat1, A. B. More1, P. S. Wagh1, T. K. Pise1, and S. K. Tilekar2
1Assistant Professor, Post Graduate Department of Electronics, S. M. M. Akluj, Maharashtra, India 2 Professor and Head, Department of Electronics, S. M. M. Akluj¸ Maharashtra, India
---------------------------------------------------------------------***---------------------------------------------------------------------
Abstract –
Water is vitally important to our day to day lives. Whether it is the water that is used in housing societies or in industrial processes consistent monitoring of its quality is a challenging task. Various characteristics of water took the roll in determination of its quality. pH level of water is a parameter that changes even with the slightest alteration in the composition of the water and hence needs a sophisticated instrumentation for its testing.
An embedded system is designed and developed about Microcontroller PIC 16F877A for real time monitoring of the quality of water. From the past few years the PIC series microcontroller has vitally contributed for rapid growth in the field of embedded systems and instrumentation. It has also expanded the number of applications in which pH measurements can be concluded. The advanced microcontrollers are widely recommended due to its promising features for developing such a smart embedded systems and hence used at the core place of the present system. The pH electrode used in the present system promises the reliability and accuracy. The signal acquired from the electrode is modulated before it is processed in the microcontroller. The firmware for the signal processing in the microcontroller is developed in embedded C into the IDE Mikro C pro for PIC. The zigbee technology is involved to establish the wireless communication between end devices. Keywords: pH, pH electrode, PIC 16F877A, WSN, zigbee Etc.
1. INTRODUCTION:
The major goal of the present research work is to design a wireless real time water quality monitoring (WQM) system consisting of pH measuring node for testing water stored in tanks in housing societies. The smart system has to be worked precisely and reliably. In recent years the microcontroller are highly recommended for smart embedded systems. The system presented in this paper is designed around microcontroller PIC 16F877A. The PIC microcontroller is precisely chosen due to its promising features which are highlighted in this paper.
The never dying need of water has brought limitations to natural waterways. Water is indeed an irreplaceable element in various industrial processes. The increased number of population has extremely strained the natural water resources. At present, the world is facing the inadequacy for availability of clean and safe water which cannot be ignored.
The quality testing is a necessary step to ensure the supply of safe water. The traditional water quality monitoring methods involves manual systems. It includes manual collection of water samples from water sources that need to be monitored. Water resources may cover large stretches of field areas, for example, Ujjani dam located in Solapur district of Maharashtra, India has an area of 14,850 km2[1]. Therefore, a large number of samples need to be taken at different locations of the same water sources. Such a water quality analysis at laboratories is a lengthy process and costs much valuable time and needs to be done more often with intervals of time. The major drawback of traditional methods is that it has a lack of real time monitoring. The method needs frequent maintenance, also is not cost efficient. The traditional methods are failed at accuracy in results and reliability. With the involvement of wired systems other methods of quality monitoring are also available but with the absence of remote monitoring, in the sense, the water quality officer needs to be present at the actual field location. This has given rise to the need of an on-line precise water quality monitoring system with the facility of Remote Distance Monitoring (RDM). Therefore, it is proposed to design and develop a system for real time water quality monitoring.
In the present system Remote distance monitoring proposes the idea of handshaking of the signals with the implementation of wirelessly communicating devices i.e. zigbee. The system by far works with coordination of the software. The firmware is developed in accordance with the peripherals of the system. With the deployment of the system anyone would be able to analyze the quality of water in real time at a remote distance. Moreover, the system could work without human interference. 2. Hardware:
International Research Journal of Engineering and Technology (IRJET) e-ISSN: 2395-0056
Volume: 08 Issue: 03 | Mar 2021 www.irjet.net p-ISSN: 2395-0072
© 2021, IRJET | Impact Factor value: 7.529 | ISO 9001:2008 Certified Journal | Page 1448
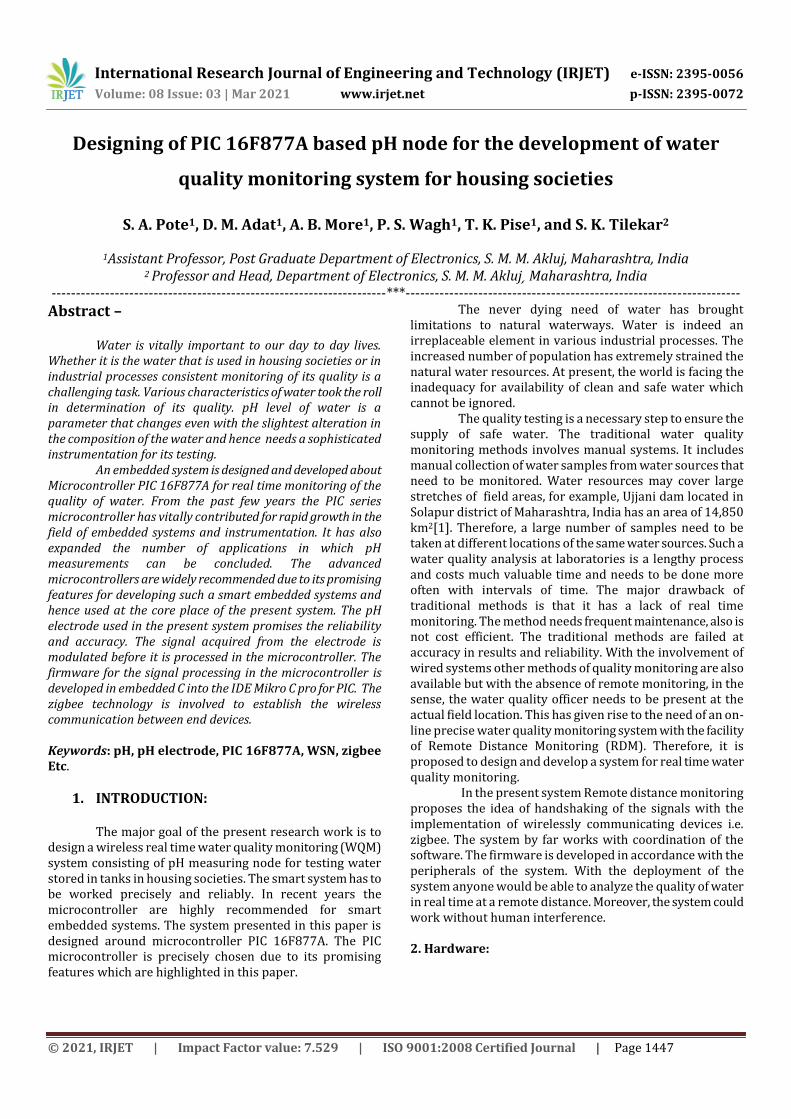
Fig -1: Block diagram of the system
Choosing the hardware components of the system has an effect on the result or outcome of the system. Preciseness of the sensing unit has a major impact on its reliability. So, while designing the present system the utmost care has been taken about choosing the components for sensing node, signal processing units and Wireless nodes etc. Along with this the cost is a considerable factor in finalizing the components of the design. The hardware consisting components which satisfies all above considered factors is shown in block diagram in figure (1) that comprises pH electrode at sensing unit which was readily available in our laboratory. The circuitry around pH electrode is discussed in
detail in this paper. As mentioned earlier the core place of the system is occupied by the PIC series Microcontroller 16F877A. The system works with the DC +5 volt power supply. As seen in the block diagram the signal conditioning
unit comprises two instrumentation amplifiers that plays the key role in recovering the signal of desired strength. Zigbee works with +3.3 volt power supply. As could be depicted by the observation of the block diagram the voltage level converter IC MAX 232 is connected between the receiving zigbee node and PC. 2.1 Circuit diagram of the system:
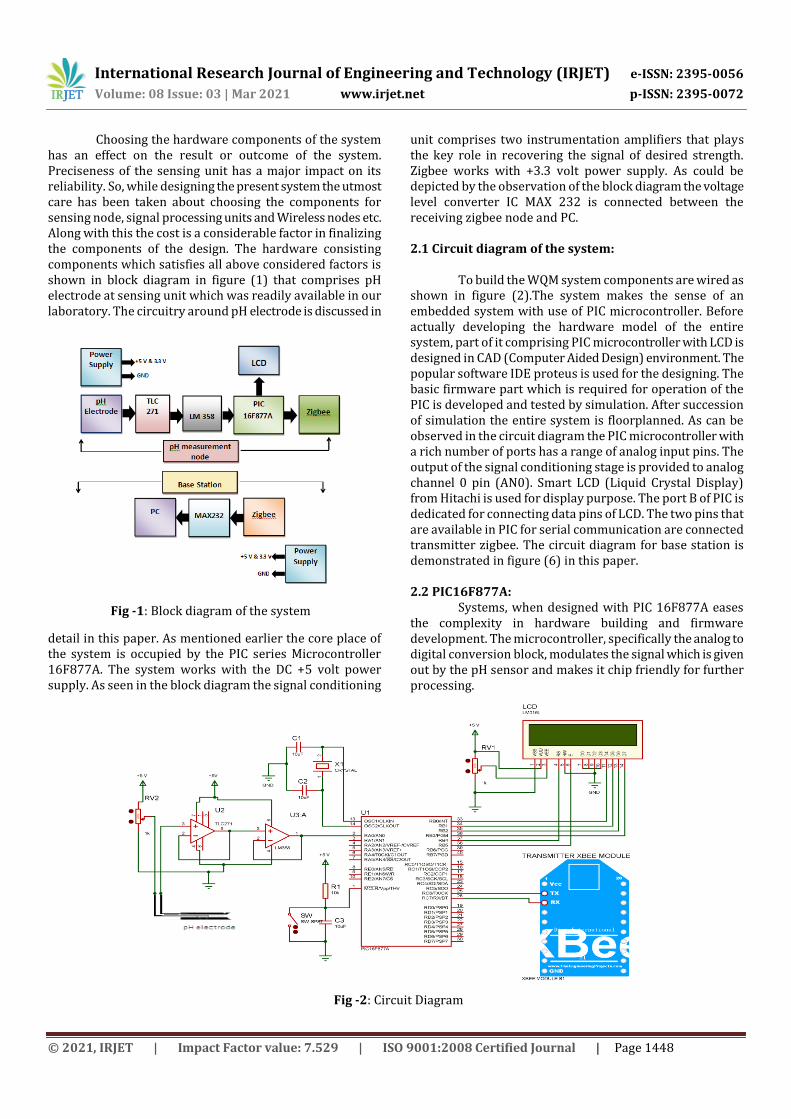
To build the WQM system components are wired as shown in figure (2).The system makes the sense of an embedded system with use of PIC microcontroller. Before actually developing the hardware model of the entire system, part of it comprising PIC microcontroller with LCD is designed in CAD (Computer Aided Design) environment. The popular software IDE proteus is used for the designing. The basic firmware part which is required for operation of the PIC is developed and tested by simulation. After succession of simulation the entire system is floorplanned. As can be observed in the circuit diagram the PIC microcontroller with a rich number of ports has a range of analog input pins. The output of the signal conditioning stage is provided to analog channel 0 pin (AN0). Smart LCD (Liquid Crystal Display) from Hitachi is used for display purpose. The port B of PIC is dedicated for connecting data pins of LCD. The two pins that are available in PIC for serial communication are connected transmitter zigbee. The circuit diagram for base station is demonstrated in figure (6) in this paper. 2.2 PIC16F877A:
Systems, when designed with PIC 16F877A eases the complexity in hardware building and firmware development. The microcontroller, specifically the analog to digital conversion block, modulates the signal which is given out by the pH sensor and makes it chip friendly for further processing.
Fig -2: Circuit Diagram

International Research Journal of Engineering and Technology (IRJET) e-ISSN: 2395-0056
Volume: 08 Issue: 03 | Mar 2021 www.irjet.net p-ISSN: 2395-0072
© 2021, IRJET | Impact Factor value: 7.529 | ISO 9001:2008 Certified Journal | Page 1449
2.3 pH and pH measuring Electrode:
pH is a measure of the relative amount of free hydrogen in the water. In simpler manner, pH is a measure of how acidic or basic a solution is or to determine whether it is a neutral solution. The pH scale has a range of 0 to 14. If pH of a solution 7,then it is supposed to be a neutral solution. A solution is acidic if its pH is less than 7. A pH greater than 7 indicates the basicity of the solution [2].
For optimal pH measurement it is important to choose the right pH probe for each application [3].The consistent progression in the field of instrumentation has reduced the dimensions of the devices. As a result of this specially designed electrodes are available to measure the pH of water as well as semi-solid substances. Before using the available pH electrode its characteristics are studied. It is a combination electrode. It consists of a reference electrode and glass H+ ion sensitive electrode called a sensing electrode placed in a packing as one unit. The reference electrode is dipped into a buffer solution inside the glass. A leached layer forms on both sides of the pH glass membrane. The difference in potential between the inner and outer layers is a potential difference [4]. This potential difference is directly proportional to the pH difference between the solutions on both sides of glass. Here, the reference electrode works like a battery with the chemical components producing a predictable voltage in the range of milli-volt that is also in electrical contact with the solution being tested. The reference is a constant voltage thus, it gives the glass a reference point to distinguish changes in Hydrogen ion concentration observed as a potential difference. 2.4 Calibration of pH Electrode:
The pH electrode comes with the cable and BNC male. The output signal of the sensor is in milli- volt range. The signal conditioning stage recovers the original signal for further processing. Before signal conditioning there are the chances of signal loss over the transmission line. This is avoided with the use of Ethernet cable with a BNC female connector for coupling with pH electrode. The potential difference relevant to pH of the solution is in the range of -420 mV to 420 mV, for the pH range from 0 to 14. Moreover,
it provides the emf 59.16 mV per pH. In short, one must consider that, the emf given by pH electrode for acidic solution is positive, whereas, for base its sign alters. However, for further digital processing the positive voltages are essential only. So a 420 mV voltage is supplied to the reference electrode to get a positive voltage range at output of sensing electrode as shown in figure (3). The pH electrode is then dipped into the standard solutions of pH values of 4, 7 & 10. The potential difference generated between reference electrode and sensing electrode is measured for respective know pH values.
2.5 Signal Conditioning System: Most analog signals require some form of modulation before they can be digitized. The signal conditioning may include process of signal modulation till the stage outcomes signal of desired dimensions. The signal processing stage may include process of filtering, amplification, signal regeneration, elimination of distortion, reduction in various factors that attenuates the signal etc. The signal conditioning stage in the present system strongly utilized for the purpose of signal amplification. Operational amplifiers (op-amps) are commonly employed to carry out the amplification of the signal in the signal conditioning stage. The precision single op- amp TLC 271 as shown in figure (2) is configured for unit gain in the first stage of signal conditioning system. The output of TLC 271 is then feed to single supply, dual operational amplifier LM358 having internally frequency compensated for unity gain [5]. Figure (4) shows the signal conditioning circuit of the system. This signal is in the form of analog voltage and needs to be digitized. The on –chip ADC feature of microcontroller PIC 16F877A has compensated the need of external ADC module for signal digitization and has saved the circuit from
being bulky [6]. The signal derived from amplifier LM358 is given to pin 2 (ADC channel 0) of PIC microcontroller. The calibration process as described above gives the pH value of solution into consideration.
Fig- 3: Circuitry around pH electrode
Fig- 4: Signal conditioning circuit
International Research Journal of Engineering and Technology (IRJET) e-ISSN: 2395-0056
Volume: 08 Issue: 03 | Mar 2021 www.irjet.net p-ISSN: 2395-0072
© 2021, IRJET | Impact Factor value: 7.529 | ISO 9001:2008 Certified Journal | Page 1450
Fig- 5: RF module Xbee
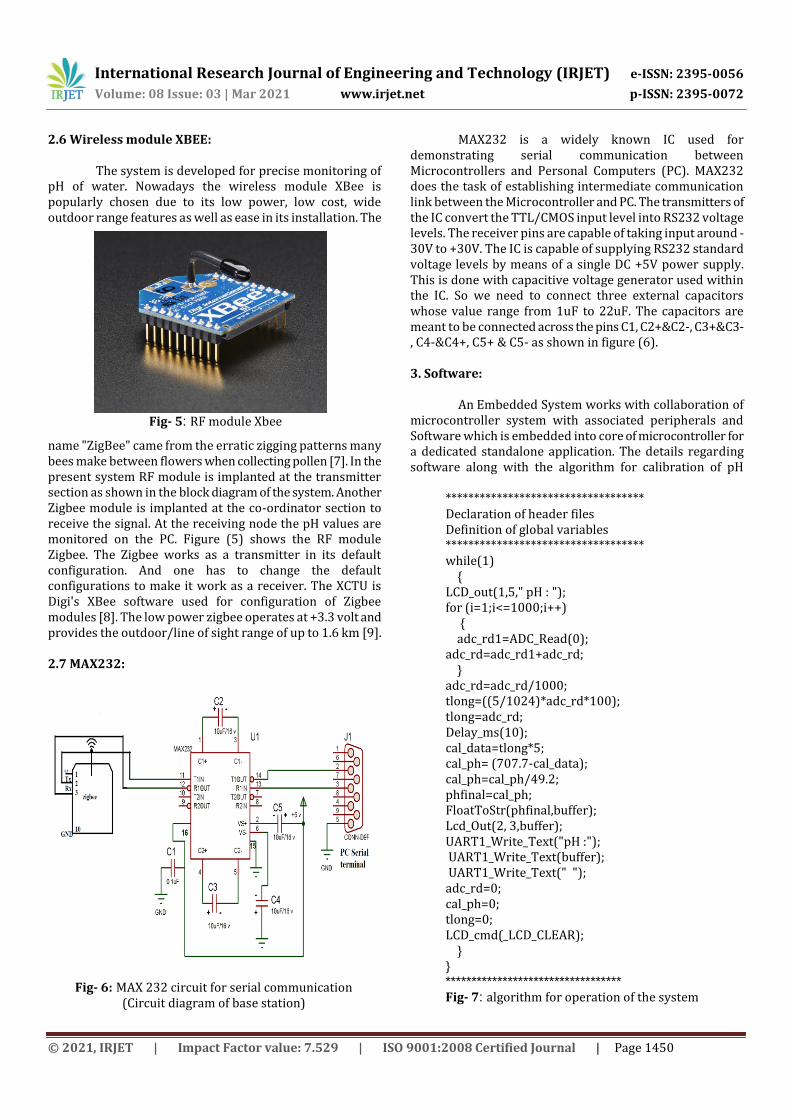
2.6 Wireless module XBEE:
The system is developed for precise monitoring of pH of water. Nowadays the wireless module XBee is popularly chosen due to its low power, low cost, wide outdoor range features as well as ease in its installation. The
name "ZigBee" came from the erratic zigging patterns many bees make between flowers when collecting pollen [7]. In the present system RF module is implanted at the transmitter section as shown in the block diagram of the system. Another Zigbee module is implanted at the co-ordinator section to receive the signal. At the receiving node the pH values are monitored on the PC. Figure (5) shows the RF module Zigbee. The Zigbee works as a transmitter in its default configuration. And one has to change the default configurations to make it work as a receiver. The XCTU is Digi's XBee software used for configuration of Zigbee modules [8]. The low power zigbee operates at +3.3 volt and provides the outdoor/line of sight range of up to 1.6 km [9].
2.7 MAX232:
MAX232 is a widely known IC used for demonstrating serial communication between Microcontrollers and Personal Computers (PC). MAX232 does the task of establishing intermediate communication link between the Microcontroller and PC. The transmitters of the IC convert the TTL/CMOS input level into RS232 voltage levels. The receiver pins are capable of taking input around -30V to +30V. The IC is capable of supplying RS232 standard voltage levels by means of a single DC +5V power supply. This is done with capacitive voltage generator used within the IC. So we need to connect three external capacitors whose value range from 1uF to 22uF. The capacitors are meant to be connected across the pins C1, C2+&C2-, C3+&C3-, C4-&C4+, C5+ & C5- as shown in figure (6).
3. Software:
An Embedded System works with collaboration of microcontroller system with associated peripherals and Software which is embedded into core of microcontroller for a dedicated standalone application. The details regarding software along with the algorithm for calibration of pH
Fig- 6: MAX 232 circuit for serial communication
(Circuit diagram of base station)
*********************************** Declaration of header files Definition of global variables *********************************** while(1) { LCD_out(1,5," pH : "); for (i=1;i<=1000;i++) { adc_rd1=ADC_Read(0); adc_rd=adc_rd1+adc_rd; } adc_rd=adc_rd/1000; tlong=((5/1024)*adc_rd*100); tlong=adc_rd; Delay_ms(10); cal_data=tlong*5; cal_ph= (707.7-cal_data); cal_ph=cal_ph/49.2; phfinal=cal_ph; FloatToStr(phfinal,buffer); Lcd_Out(2, 3,buffer); UART1_Write_Text("pH :"); UART1_Write_Text(buffer); UART1_Write_Text(" "); adc_rd=0; cal_ph=0; tlong=0; LCD_cmd(_LCD_CLEAR); } } **********************************
Fig- 7: algorithm for operation of the system

International Research Journal of Engineering and Technology (IRJET) e-ISSN: 2395-0056
Volume: 08 Issue: 03 | Mar 2021 www.irjet.net p-ISSN: 2395-0072
© 2021, IRJET | Impact Factor value: 7.529 | ISO 9001:2008 Certified Journal | Page 1451
electrode are explained in this section. The popular IDE Mikro C Pro for PIC microcontroller is used to develop the firmware of the system. The software IDE MikroC PRO for PIC allows you to manage multiple projects [10]. After the successful development of program in the IDE the generated hex file of the program is needed to be written into program memory of PIC 16F877A microcontroller. PIC pgm is an IDE used to burn the firmware into the microcontrollers. The significant portion of the firmware of the present system is written for mutual collaboration of two major tasks of the system are written in C in the IDE is shown in figure (7).The firmware is then debugged and errors are removed. The first task includes the collection of signal from sensor, conversion of signal into digital data and data processing. The second task includes the transmission of result for water quality analysis. The result could be monitored by the operator on LCD.
4. Outcome of calibration process:
The pH node developed is calibrated by taking three different solutions of known pH as mentioned in the hardware section. The table (1) summarizes the calibration
readings for the same. A calibration graph as shown in figure (8) is plotted against each pH value and by using least square fitting process of data analysis the coefficients are obtained
for straight line expression. The expression resulted from curve fitting procedure is, y= - 49.2x + 707.7 …….. (1) Where, x is the known pH value of solutions and y is the generated output voltage for respective pH value. 5. Result:
After successful calibration, the system is tested for measurement of pH of distilled water having ideal pH of 7. Figure (9) shows the system prototype. Figure (10) shows the stream of pH value of received. The pH node does the task of collecting and processing of the signal. The xbee at the transmitter side spreads the data in the air in the form of Electromagnetic waves. On the receiving side the data stream is received by the base station and same can be monitored by the operator.
6. Conclusion:
Hence it can be concluded that the pH electrode is precisely calibrated and system works successfully when tested with water. The data stream received and monitored at base station PC. The successfully established wireless sensor network does the task of remote distance monitoring (RDM) satisfactorily Hence, it can be concluded that, the pH measuring node and water quality monitoring system are developed successfully and works satisfactorily.
pH value of the solution
Observed output voltage in mV
4 541
7 303.1
10 245.8
Table – 1 - output voltage readout against known
pH value
Fig- 8: chart- 1-The plot of known pH value against
emf observed in mV
Fig- 9: Prototype of the system
Fig- 10: Stream of pH values received at base station

International Research Journal of Engineering and Technology (IRJET) e-ISSN: 2395-0056
Volume: 08 Issue: 03 | Mar 2021 www.irjet.net p-ISSN: 2395-0072
© 2021, IRJET | Impact Factor value: 7.529 | ISO 9001:2008 Certified Journal | Page 1452
REFERENCES:
[1] https://en.wikipedia.org/wiki/Ujjani_Dam [2] A.V.Gangurde, SmitaS.Pagar, Ashish V. Kadam, Roshan S. Ghodke,[2016],IOSR Journal of Computer Engineering (IOSR-JCE),page(s)-(45-49) [3] Cho Cho Myint, [2018] “Microcontroller-Based Temperature and pH Measuring System”, International Journal of Trend in Scientific Research and Development (IJTSRD), Volume – 2, Page(s)- (694-698) [4] https://iccontrols.com/wp-content/uploads/art-6-1_ph_theory_and_measurement.pdf [5]LM358 datasheet from http://www.ti.com/lit/ds/symlink/lm158-n.pdf [6]Microcontroller chip Technology, 2001, PIC16F877A Datasheet www. microchip.com. [7] N. Ammu Abirami, B. Menaka Devi,[2015], ” Implementation of Sensor Nodes for Drinking Water Quality Assessment”, IJSRD - International Journal for Scientific Research & Development| Vol. 3,page(s) (98-101) [8] XBEE datasheet- https://www.digi.com/resources/documentation/digidocs/PDFs/90001458-13.pdf [9]XBee®/XBee-PRO®RFModules https://www.sparkfun.com/datasheets/Wireless/Zigbee/XBee-Datasheet.pdf
[10]Micro C Pro for PIC user manual
https://www.mouser.com/pdfdocs/mikroc_pic_pro_manual_v101.PDF
BIOGRAPHIES
Miss. S. A. POTE is presently working as an Assistant Professor at Shankarrao Mohite College, Akluj Dist. Solapur, Maharashtra, India. She completed her M.Sc. from Solapur University, Solapur (India). Her areas of research are Embedded Technology, VLSI Design and Technology and Instrumentation
designing. She presented 2 research papers in National level conferences. This is her first paper publication in international journal. E mail: [email protected]
Miss. D. M. ADAT is presently working as an Assistant Professor at Shankarrao Mohite College, Akluj Dist. Solapur, Maharashtra, India. She completed her M.Sc. from Solapur University, Solapur (India). Her areas of research are in Embedded Technology, VLSI Design and
Technology, and Mixed Signal SoC Design. She awarded with best paper presentation award at Research Festival and
Conferences twice. She has published a paper in an International Journal. She has presented 5 research papers in National level Conferences. E mail: [email protected]
Miss. A. B. MORE is presently working as an Assistant Professor at Shankarrao Mohite College, Akluj Dist. Solapur, Maharashtra, India. She completed her M. Sc. from Solapur University, Solapur (India). The area of research is Embedded Technology, Wireless Sensor
Network and Instrumentation designing. She published 1 paper in International Journal. She presented 2 research papers in National level conferences. E mail: [email protected]
Miss. PRANALI S. WAGH is presently working as an Assistant Professor at Shankarrao Mohite College, Akluj Dist. Solapur, Maharashtra, India. The area of research is Embedded Technology, Wireless Sensor Network and Instrumentation designing. She presented 1 research papers in National level conferences.
She has published a paper in an international journal. E mail: [email protected]
Miss. T. K. PISE is presently working as an Assistant Professor at Shankarrao Mohite College, Akluj Dist. Solapur, Maharashtra, India. She completed her M. Sc. from Solapur University, Solapur (India). The area of research is VLSI design and technology, Mixed Signal SoC Design, Embedded Technology, Wireless Sensor Network and
Instrumentation designing. She presented 1 research papers in National level conferences. E mail: [email protected]
Dr. S. K. TILEKAR is working as Head, Department of Electronics, Shankarrao Mohite College, Akluj. He completed his M. Phil. And Ph.D. from Solapur University, Solapur (India). The area of research is Embedded technology, VLSI design and technology, Mixed signal SoC design. Presently, he is working as
Associate Professor at Shankarrao Mohite College, Akluj, Dist. Solapur. He awarded with best paper presentation award at Research Festival and conferences, two times. He presented 78 research papers in International & National level conferences. He published 30 papers in International Journal. E mail: [email protected]