designing traffic barriers februarv 1976 vol. i
TRANSCRIPT
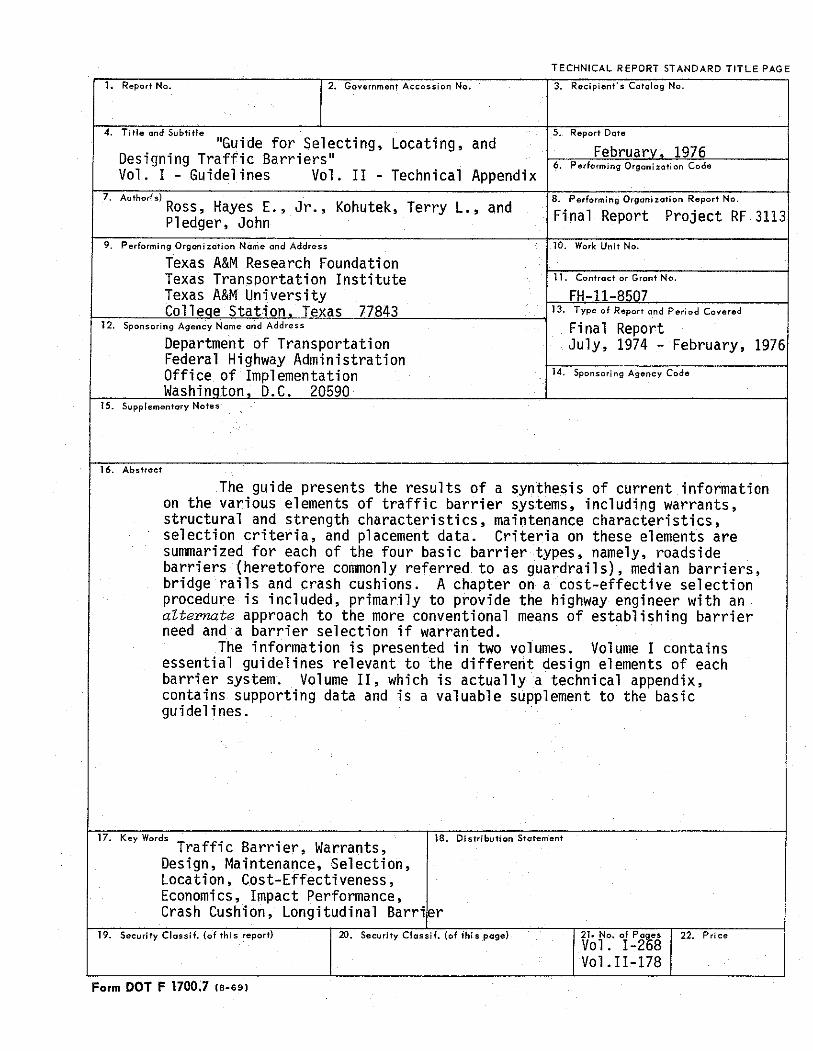
TECHNICAL REPORT STANDARD TITLE PAGE
1. Report No. 2. Government Accession No. 3. Recipient's Catalog No.
4. Title and Subtitle 5. Report Date "Guide for Selecting, Locating, and Februarv 1976 Designing Traffic Barriers" 6. Performing Orgoni%otion Code
Vol. I -Guidelines Vol. II - Technical Appendix 7. Authorf s)
Kohutek, Terry L., and 8. Performing Orgoni%ation Report No. · Ross, Hayes E., Jr., Final Report Project RF 3113 Pledger, John 9. Performing Orgoni%ation Nome and Address 10. Work Unit No.
Texas A&M Research Foundation Texas Transportation Institute 11. Contract or Grant No.
Texas A&M University FH-11-81107 Colleoe Station Texas 77843 13. Type of Report and Period Covered
12. Sponsoring Agency Nome and Address Final Report Department of Transportation July, 1974 - February, 1976 Federal Highway Administration Office of Implementation .
14. Sponsoring Agency Code
Washinoton D.C. 20590 15. Supplementary Notes
16. Abstract
The guide presents the results of a synthesis of current information on the various elements of traffic barrier systems, including warrants, structural and strength characteristics, maintenance characteristics, selection criteria, and placement data. Criteria on these elements are summarized for each of the four basic barrier types, namely, roadside barriers (heretofore commonly referred to as guardrails), median barriers, bridge rails and crash cushions. A chapter on a cost-effective selection procedure is included, primarily to provide the highway engineer with an alternate approach to the more conventional need and a barrier selection if warranted.
means of establishing barrier
The information is presented in two volumes. Volume I contains essential guidelines relevant to the different design elements of each barrier system. Volume II, which is actually a technical appendix, contains supporting data and is a valuable supplement to the basic guidelines.
17. Key Words • . Traff1c Barr1er, Warrants,
18. Distribution Statement
Design, Maintenance, Selection, Location, Cost-Effectiveness, Economics, Impact Performance, Crash Cushion, Longitudinal Barri l:!r
19. Security Classif. (of this report) 20. Security Classif. (of fhis page) 21. No. of Po~es 22. Price Vol.I-28
. Vol. II-178 Form DOT F 1700.7 cs-691

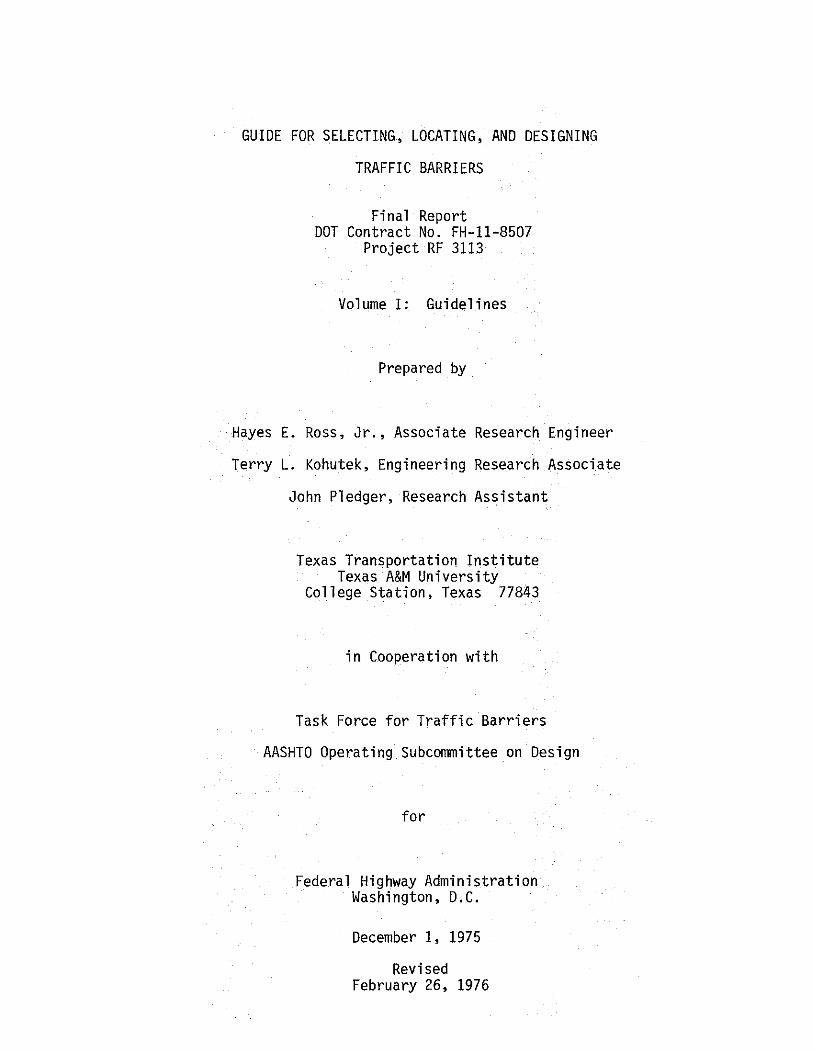
GUIDE FOR SELECTING, LOCATING, AND DESIGNING
TRAFFIC BARRIERS
Fi na 1 Report DOT Contract No. FH-11-8507
Project RF 3113
Volume I: Guidelines
Prepared by
Hayes E. Ross, Jr., Associate Research Engineer
Terry L. Kohutek, Engineering Research Associate
John Pledger, Research Assistant
Texas Transportation Institute Texas A&M University
College Station, Texas 77843
in Cooperation with
Task Force for Traffic Barriers
AASHTO Operating Subcommittee on Design
for
Federal Highway Administration Washington, D.C.
December 1, 1975
Revised February 26, 1976

PREFACE
This guide was prepared through a cooperative effort involving the
Task Force for Traffic Barrier Systems of the AASHTO Operating Subcom
mittee on Design, the Federal Highway Administration, and the Texas
Transportation Institute of Texas A&M University. The Task Force served
as an advisory group to the FHWA contract manager and to the researchers.
Members of the Task Force and other members of a technical advisory com
mittee are listed at the end of the preface.
The guide presents the results of a synthesis of current information
on the various elements of traffic barrier systems, including warrants,
structural and strength characteristics, maintenance characteristics,
selection criteria and placement data. Criteria on these elements are
summarized for each of the four basic barrier types, namely, roadside
barriers (heretofore commonly referred to as guardrails), median barriers,
bridge rails and crash cushions. A chapter on a cost-effective selection
procedure is included, primarily to provide the highway engineer with an
alternate approach to the more conventional means of establishing barrier
need and a barrier selection if warranted.
The information is presented in two volumes. Volume I contains essen
tial guidelines relevant to the different design elements of each barrier
system. Volume II is a technical appendix containing support data to
supplement the basic guidelines.
References have generally been limited in the guide to preserve a
clear, straightforward presentation. Citations are given if further
study by the reader will enhance the guidelines or if a complete summary
i
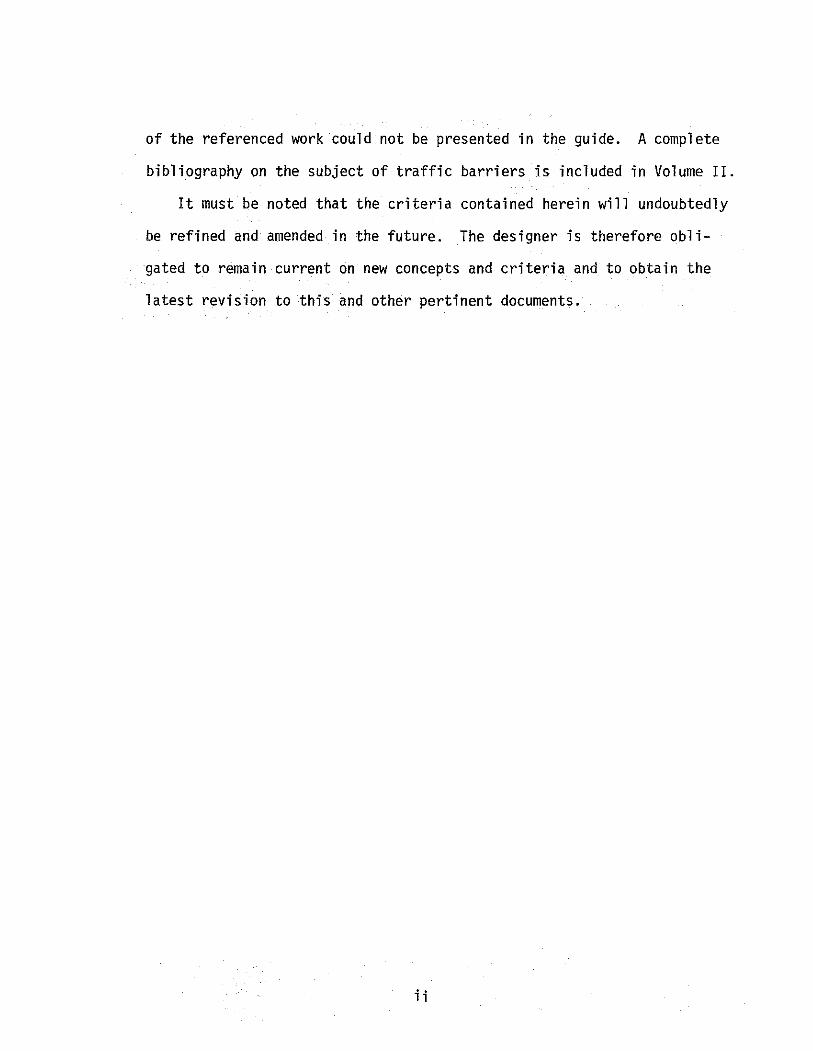
of the referenced work could not be presented in the guide. A complete
bibliography on the subject of traffic barriers is included in Volume II.
It must be noted that the criteria contained herein will undoubtedly
be refined and amended in the future. The designer is therefore obli
gated to remain current on new concepts and criteria and to obtain the
latest revision to this and other pertinent documents.
ii
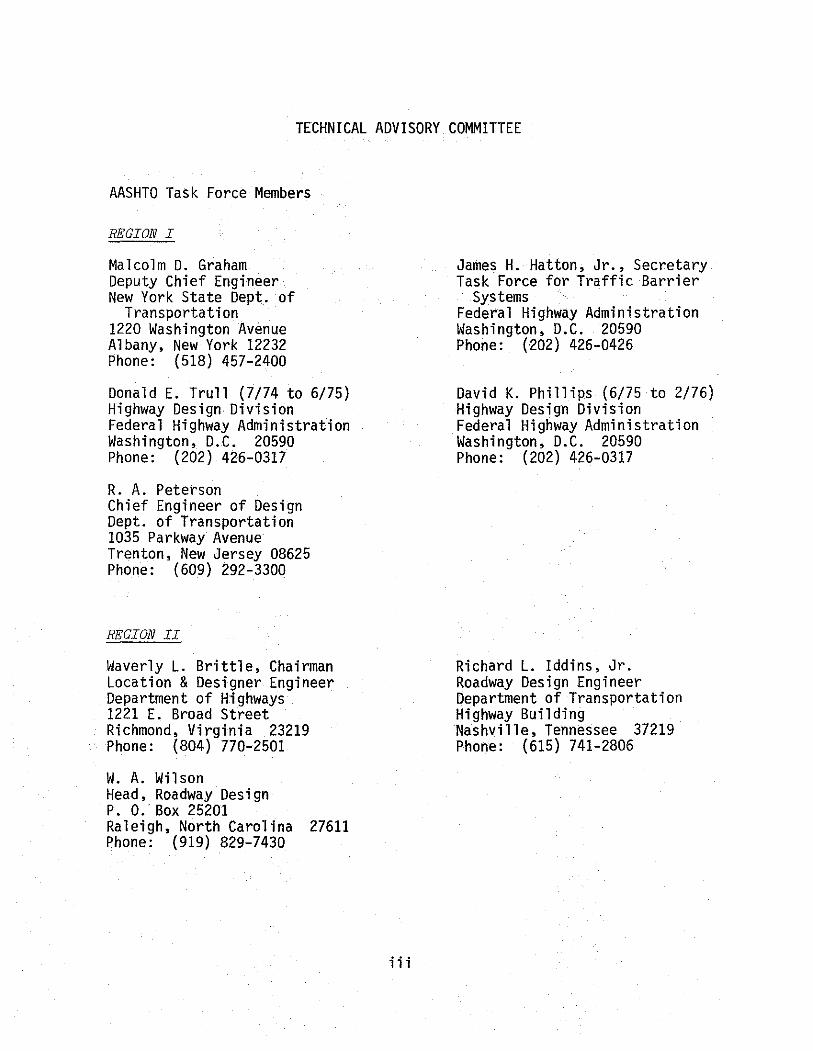
TECHNICAL ADVISORY COMMITTEE
AASHTO Task Force Members
REGION I
Malcolm D. Graham Deputy Chief Engineer New York State Dept. of
Transportation 1220 Washington Avenue Albany, New York 12232 Phone: {518) 457-2400
Donald E. Trull {7/74 to 6/75) Highway Design Division Federal Highway Administration Washington, D.C. 20590 Phone: {202) 426-0317
R. A. Peterson Chief Engineer of Design Dept. of Transportation 1035 Parkway Avenue Trenton, New Jersey 08625 Phone: {609) 292-3300
REGION II
Waverly L. Brittle, Chairman Location & Designer Engineer Department of Highways 1221 E. Broad Street Richmond, Virginia 23219 Phone: {804) 770-2501
W. A. Wilson Head, Roadway Design P. 0. Box 25201 Raleigh, North Carolina 27611 Phone: {919) 829-7430
iii
James H. Hatton, Jr., Secretary Task Force for Traffic Barrier
Systems Federal Highway Administration Washington, D.C. 20590 Phone: {202) 426-0426
David K. Phillips {6/75 to 2/76) Highway Design Division Federal Highway Administration Washington, D.C. 20590 Phone: {202) 426-0317
Richard L. Iddins, Jr. Roadway Design Engineer Department of Transportation Highway Building ·Nashville, Tennessee 37219 Phone: {615) 741-2806
Region III
I. C. Herried Chief of Facilities Development Department of Transportation State Office Building 4802 Sheboygan Avenue Madison, Wisconsin 53702 Phone: (608) 266-0122
Region IV
Tom M. Cox Assistant Chief Engineer-
Engineering State Division of Highways 4201 East Arkansas Avenue Denver, Colorado 80222 Phone: (303) 757-9206
Sheldon McConkie Chief Roadway Design Division Utah State Department of Highways State Office Building Salt Lake City, Utah 84114 Phone: (801) 328-5222
Federal Highway Administration Officials
Webster H. Collins Project Manager Federal Highway Administration
(HDV-21) 2100 2nd Street, S.W. Washington, D.C. 20590 Phone: (202) 426-9211
John G. Viner Chief, Protective Systems Group Federal Highway Administration Washington, D.C. 20590 Phone: (703) 557-5275
iv
James F. Roberts Division Engineer, Surveys & Plans Missouri State Highway Commission State Highway Building Jefferson City, Missouri 65101 Phone: (314) 751-2251
E. S. Hunter Asst. State Highway Engineer-Design Department of Transportation State Highway Building Salem, Oregon 97310 Phone: (503) 373-6888
John R. Watson, Jr. Contract Manager Federal Highway Administration
(HDV-21) 2100 2nd Street, S.W. Washington, D.C. 20590 Phone: (202) 426-9211
A. R. Cowan Chief, Design Branch Federal Highway Administration
(HN6-21) Washington, D.C. 20590 Phone: (202) 426-0312
National Cooperative Highway Research Program Official
Robert J. Reilly Projects Engineer, NCHRP 2101 Constitution Avenue Washington, D.C. 20418 Phone: (202) 389-6741
v
GLOSSARY
APea of ConcePn - An object or roadside condition that warrants the
shielding of a traffic barrier.
BarPieP WarPant- A criterion that identifies an area of concern which
should be shielded by a traffic barrier. The criterion may be a
function of relative safety, economics, etc., or a combination of
factors.
BPidge Rail - A longitudinal barrier whose primary function is to
prevent an errant vehicle from going over the side of the bridge
structure.
Clear Distance - Minimum lateral distance from the edge of the traveled
way needed by a driver of an errant vehicle to either regain control
and begin a return to the roadway or to slow the vehicle to a safe
speed. Unshielded rigid objects and certain other hazards should
not be permitted in the area between the edge of the traveled way
and the clear distance.
CPash Cushion - A barrier whose primary function is to decelerate an
errant vehicle to a safe speed or to stop it. Examples are the
sand filled plastic barrels, steel drums, etc.
CPashwoPthy BarPieP - One that can be impacted by a vehicle at or below
the anticipated operating speed of the roadway with low probability
of serious injury to the vehicle's occupants.
ExpePimental BarPieP- One that has performed satisfactorily in full-scale
crash tests and promises satisfactory in-service performance.
vi
Impaat Angle - For a longitudinal barrier, it is the angle between a
tangent to the face of the barrier and a tangent to the vehicle's
path at impact. For a crash cushion, it is the angle between the
axis of symmetry of the crash cushion and a tangent to the vehicle's
path at impact.
Length of Need - Total length of a longitudinal barrier, measured with
respect to centerline of roadway needed to shield an area of concern.
Longitudinal BaPTier - A barrier whose primary function is to redirect
an errant vehicle away from a roadside or median hazard. The three
types of longitudinal barriers are roadside barriers, median barriers,
and bridge rails.
Median Barrier - A longitudinal barrier used to prevent an errant vehicle
from crossing the portion of a divided highway separating the
traveled ways for traffic in opposite directions.
Operational Barrier- One that has performed satisfactorily in full~scale
crash tests and has demonstrated satisfactory in-service performance.
Researah and Development Barrier - One that is in the development stage
and has had insufficient full-scale tests and in-service performance
to be classified otherwise.
Roadside Barrier- A longitudinal barrier used to shield hazards between
the edge of the traveled way and the clear distance. It may also
be used to shield hazards in extensive areas between the roadways
of a divided highway. It may occasionally be used to protect
pedestrians or "bystanders" from vehicular traffic.
Road0ay - The portion of a highway, including shoulders, for vehicular use.
vii
Shy Distance - Distance from the edge of the travel way beyond which
a roadside object will not be perceived as an immediate hazard by
the typical driver, to the extent that he will change his vehicle's
placement or speed.
Traffic Barrier - A device used to shield a hazard that is located on
the roadside or in the median, or a device used to prevent crossover
median accidents. As defined herein, there are four classes of
traffic barriers, namely, roadside barriers, median barriers, bridge
rails, and crash cushions.
Traveled Way - The portion of the roadway for the movement of vehicles,
exclusive of shoulders and auxiliary lanes.
viii
ACKNOWLEDGEMENTS
The authors sincerely appreciate the excellent cooperation and
contribution of the Task Force members who served as an Advisory Group
to the researchers and the FHWA. Task Force members are listed at the
end of the Preface. Special thanks go to the chairman Waverly Brittle
and to the secretary, Jim Hatton. Jim was very helpful in providing
advice and information throughout the study.
The cooperation and assistance provided by John Watson, Jr., FHWA
contract manager, was invaluable to the researchers.
During the course of this study, the authors had the opportunity
to meet a number of state highway officials who willingly provided valu
able information and constructive ideas on traffic barriers. These
included Dave Squires and Chuck Barndt, North Carolina Department of
Transportation; Bill Burnett, Joe Allison and Ted Koch, New York State
Department of Transportation; Bernard Lookatch and Ron Cook, State of
Wisconsin Department of Transporation; Duward Vernon, Paul Chuvarsky,
and Malcom Harrison, State of Colorado Department of Highways; Eric
Nordlin, Ed Tye, Roger Stoughton, J. R. Stoker, Ernie Holt, and Philip
Hale, State of California Department of Transportation; and John Panak,
Billy Rogers, Harold Cooner, Dave Hustace, and John Nixon, Texas Depart
ment of Highways and Public Transportation. The authors are especially
indebted to Ed Tye, Eric Nordlin and Roger Stoughton for their informa
tion and ideas throughout the study.
The authors appreciate the information and cooperation of Maurice
Bronstad and Jarvis Michie of the Southwest Research Institute. Researchers
ix
at the Calspan Corporation were also helpful. The reports and sugges
tions of Bob Reilly of the NCHRP and John Viner of the FHWA were very
helpful. A. R. Cowan, representing AASHTO Subcommittee on Design, was
most cooperative. The consultation and advice of our TTI colleagues,
Ted Hirsch, Bob Olson, and Gene Marquis were also invaluable.
Many others contributed to this effort both directly and indirectly
to whom the authors are most grateful.
X
VOLUME I TABLE OF CONTENTS
PREFACE . . . . . . . . . . . . . . . . . . . . . . . . . . . . . . . . • . . . . . . . . . . . . . . . . . . . . . . . i
TECHNICAL ADVISORY COMMITTEE ....•..............•............... iii
GLOSSARY . . . . . . . . . . . . . . . . . . . . . . . . . . . . . . . . . . . . • . . . . . . . . . . . . . . . . . . vi
ACKNOWLEDGEMENTS . . . . . . . . . . . . . . . . . . . . . . . . . • . . . . . . . . . . . . . . . . . . . . . ix
LIST OF FIGURES . . . . . . . . . . . . . . . . . . . . . . . . . . . . . . . . . . . • . . . . . . . . . . . . xv
LIST OF TABLES . . . . . . . . . . . . . . . . . . . . . . . . . . . . . . . . . . . . . . . . . . . . . . . . . xx
I. INTRODUCTION . . . . . . . . . . . . . . . . . . . . . . . . . . . . . . . . . . . . . . . . . . . . . 1 A. Background . . . . . . . . . . . . . . . . . . . . . . . . . . . . . . . . . . . . . . . . . . . 1
B. Purpose of Guide . . . . . . . . . . . . . . . . . . . . . . . . . . . . . . . . . . . . . 1
C. Application of Guide . . . . . . . . . . . . . . . . . . . . . . . . . . . . . . . . . 3
D. Format of Guide • . . . . . . . . . . . . . . . . . • . . . . . . . . . . . . . . . . . . . 4
I I. EVALUATION CRITERIA • . . . . . . . . . . . . . . • . . . . . . . . . . . . . . . . . . . . . . 6
A. Warrants . . . . . . . . . . . . . . . . . . . . . . . . . . . . . . . . . . . . . . . . . . . . . 6
B. Structural and Safety Characteristics .....•..•....... 8
C. Maintenance Characteristics .................••....... 14
III. ROADSIDE BARRIERS . .. . . . . . . . . . . . . .. . . . . . . . . . . . . . . . . . . •. . . . 15
A. Warrants . . . . . . . . . . . . . . . . . . . . . . . . . . . . . . . . . . . . . . . . . . . . . 15
1. Embankments . . . . . . . . . . . . . . . . . . . . . . . . . . . . . . . . . . . . . . 16
2. Roadside Obstacles . . . . .. . . . . . . . . . . . . .• .. . . . . . . . . . 19
3. Bridge Rail Ends, Transitions, and End Treatments. 25
4. Bystanders, Pedestrians and Cyclists . . . . .. . . . . . . . 28
5. Preferred Ditch Cross Sections ................... 29
6. Steep Grades . . . . . . . . . . . . . . . . . . . . . . . . . . . . . . . . . . . . . 33
7. Example Problems .. .. . ... .•. ...... ... ... . ..... .. . . 33
B. Structural and Safety Characteristics ................ 41
1. Standard Sections of Roadside Barriers .•.•....... 45
2. Transitions . . . . . . . . . . . . . . . . . . . . . . . . . . . . . . . . . . . . . . 54
3. End Treatment . . . . . . . . . . . . . . . . . . . . . . . . . . . . . . . . . . . . 63
C. Maintenance Characteristics .......................... 66
D. Selection Guidelines ................................. 71
xi
E. Placement Recommendations ..........•................... 74
1. Uniform Clearance and Distance Between Barrier and Hazard . . . . . . . . . . . . . . . . . . . . . . . . . . . . . . . . . . . . . . . . . . . . . 75
2. Probability of Impact . . . . . . . . . . . . . . . . . . . .. . . . . .. . . . 77
3. Terrain Effects . . . . . . . . . . . . . . . . . . . . . . . . . . . . . . . . . . . . 78
4. Flare Rate and Length of Need . . . . . . . . . . . . . . . . . .. . . . 81
5. Slow Moving Vehicles . . . . . . . . . . .• . . . . . . . . . . . . . .. . . . . 89
F. Upgrading Substandard Systems .......................... 91
1. Guidelines . .. . . . . . . . . . . . . . . . . • . . . . . . . . . . ... .. . . . . . . 91
2. Ex amp 1 e Prob 1 em . . . . . . . . . . . . . . . . . . . • . . . . . . . . . . . . . . . . 94
IV. MEDIAN BARRIERS . . . . . . . . . . . . . . . . . . . . . . . . • . . . . . . . . . . . . . . . . . . . 1DO
A. Warrants . . . . . . . . • . . . . . . . . . . . . . . . . . . . . . . . . . • . . . . . . . . . . . . 100
1. Standard Section . . . . . . . . . • . . . • . . . . . . . . . . . . . . . . . . . . . 100
2. Transitions .. . .. . . . . . . . . . . . . . . . . . . . . . . . . . .. . . .. . . . . 104
3. End Treatment . . . . . . . . . . . . . . . . . . . . . . . . . . . . . . . . . . . . . . 104
B. Structural and Safety Characteristics .................. 105
1. Standard Sections of Median Barriers ............... 105
2. Transitions . . . . . . . . . . . . . . . . . . . . . . . . . . . . . . . . . . . . . . . . 119
3. End Treatment . . . . . . . . . . . . . . . . . . . . . . . . . . . . . . . . . . . . . . 122
C. Maintenance Characteristics ..••........................ 128
D. Selection Guidelines ... .......... ........ .......... ... . 131
E. Placement Recommendations . . . • . . . . . . . . . . . . . . . . . . . . . . . . . . 134
1. Terrain Effects . . . . . . . . . . . • . . . . . . . . . . . • . . . . . . . . . . . . 135
2. Flare Rate . . . . . . . . . . . . . . . . . . . • • . . . . . . . . . . . . . . . . . . . . 142
F. Upgrading Substandard Systems .......................... 144
V. BRIDGE RAILS . . . . . . . . . . . . . . . . . . . . . . . • . . . . • . . . . . . . . . . . . . . . . . . 147
A. Warrants . . . . . . . . • . . . . . . . . . . . . . . . . • . . . . . • . . . . • . . . . . . . . . . 147
B. Structural and Safety Characteristics .................. 151
C. Maintenance Characteristics • . . . . . . . . . . . . . . . . . . . • . . . . . • . 159
D. Selection Guidelines . . . . . . . . . . . . . . . . . . . . . • . . . . . . . .. . . . . 160
E. Placement Recommendations .............................. 163
F. Upgrading Substandard Systems .......................... 164
1. Guidelines . . . . . . . . . . . . . . . . . . . . . . . . . . . . . . . . . . . . . . . . . 164
2. Suggested Upgrading Designs ........................ 167
xii
VI. CRASH CUSHIONS . . . . . . . . . . . . . . . . . . . . . . . . . . . . . . . . . . . . . . . . . . . . 169
A. Warrants . . . . . . . . . . . . . . . . . . . . . . • . . . . . . . . . . . . . . . . . . . . . . . 169
B. Structura 1 and Safety Characteristics . . . . . . . . . . . . . . . . . 172
1. S tee 1 Drums ( Cl) . . . . . . . . . . . . . . . . . . . . . . . . . . . . . . . . . . 180
2. Hi-Dro Cell Sandwich (C2) • . . . . . . .. . . .. . . . . .. . . . . . . 183
3. Sand Filled Plastic Barrels (C3 and C4) ........... 186
4. Hi-Dri Cell Sandwich (C5) . . . . •. .. . . .. . . . . . .. . . ... . 191
5. Hi-Dro Cell Cluster (C6) . . . . . . . . . . . . . . . . .. . .. .. . . . 193
6. Summary . . . . . . . . . . . • . . . . . . ... . . . . . . . . . . . . . . . . . . . . . . . 194
C. Maintenance Characteristics . . . . . . . . . . . . . • . . . . . . . . . . . . . 196
1. Collision Maintenance ............................. 199
2. Regular Maintenance . . . . . . . . . . . . . . . . . . . . . . . . . • . . . . . 199
3. Material Storage .......•. ·--....................... 200
D. Site Considerations . . . . . • . . . . . . . . . . . . . . . . . . . . . . . • . . . . . 201
1 . New Roadways . . . . . . . . . . . . . . . . . . . . . . . . . . . . . . . . . . . . . . 201
2. Existing Roadways . . . . . . . . . . . . . . . . . . . . . . . . . . . • . . . . . 203
E. Selection Guidelines . . . . . . . . . . . .. . . . . . . . . . . . . . . . . . . . . . 206
F. Placement Recommendations ............................. 209
VI I. A COST EFFECTIVE SELECTION PROCEDURE . . . • . . . . . . . . . . . . . . . . . . 213
A. Introduction . . . . . . . . . . . . . • . . . . . . . . . . . . . . . . . . . . . . . . . . . . 213
B. Development, Assumptions and Limitations . . . . . . . . . . . . . . 214
C. Applications . . . . . . .. . .. . . . . . . . . . . . . . .. . . .. . . . .. . . . . . . . 217
1. Ex amp 1 e 1 - Roadside S 1 opes . . . . . . . . . . . . . . . . . . . . . . . 232
2. Example 2 - Bridge Piers . . . . . . . . . . . . . . . . . . . . . . . . . . 241
3. Ex amp 1 e 3 - Eleva ted Gore Abutment . . . . . . . . . . . . . . . . 252
REFERENCES . . . • . . . . . . . . . . . . . . . . . . . . . . . . . . . . . . . . . . . . . . . . . . . . . . . . . 256
xiii
VOLUME II
TABLE OF CONTENTS
PREFACE . . . . . . . . . . . . . . . . . . . . . . . • . . . . . . • • . • . . . . . . . . . . . . . . . . . . . . . i
GLOSSARY.......... . . . . • . . . . . . . . • . . . . . . • . . . . . . . . • . . . . . . . . . . . . . . . vi
LIST OF FIGURES ................................•.............. xvi i i
LIST OF TABLES .....................•........................... xxii
APPENDICES ....••...•........................................... A-1
A. Field Data on Barrier Systems .....•..•...........•.... A-1
B. Experimenta 1 Barrier Systems. . . . . . . . . . . . . . . . . . . . • . . . . . B-1
C. Crash Test Data for Barrier Systems ..•................ C-1
D. Design Guides for Crash Cushions ...................•.. D-1
E. Supporting Data for Cost-Effective Selection Procedure............................................. E-1
F. Automobile Trajectory Data for Slopes and Curbs ....... F-1
G. Method for Estimating Impact Loads on Longitudinal Barriers .........................•.................... G-1
H. Bibliography ...........•.............................. H-1
I. References. . . . . . . . . . . . • . . . . . . . . . • . . . . . . . . . . . . . . . . . . . . . I -1
xiv
VOLUME I LIST OF FIGURES
Figure No. Title Page
III-A-1. Warrants for Fill Section Embankments ......•....... 17
III-A-2. Dimensional Data for Optimum Rounding (1_!_) ••••••••• 18
III-A-3. Clear Distance Criterion for Roadside Obstacles . . . 20
III-A-4. Summary of Roadside Barrier Warrants............... 26
II I -A-5. Bridge Approach Barrier Criteria. . . . . . . . . . . . . . . . . . . 27
III-A-6. Preferred Ditch Sections for: (a) Vee Ditch; or (b) Round Ditch, Bottom Width <8ft.; or (c) Trapezoidal Ditch, Bottom Width <4ft.; or (d) Rounded Trapezoidal Ditch, Bottom Width
<4 ft. . . . . . . . . . . . . . . . . . . . . . . . . . . . . . . . . . . . . . . . . 30
III-A-7. Preferred Ditch Sections for:
II I-A-8.
(a) Trapezoidal Ditch, Bottom Width = 4 ft. to 8 ft. ; or
(b) Round Ditch, Bottom Width = 8 ft. to 12 ft. 31
Preferred Ditch Sections for: (a) Trapezoidal Ditch, Width >8 ft.; or (b) Round Ditch, Width >12ft.; or (c) Rounded Trapezoidal Ditch, Width >4 ft. 32
III-A-9. Illustrative Example for Roadside Barrier Warrants........ . . . . . . . . . . . . . . . . . . . . . . . . . . . . . . . . . . . 34
III-B-1. Definition of Roadside Barrier Elements ............ 43
III-B-2. A Suggested W-Beam to Parapet Connection ........... 61
III-E-1. Barrier-to-Hazard Distance for Roadside Protection ......................................... 76
III-E-2. Roadside Slope Definition ......•................... 80
III-E-3. Roadside Barrier Location on Typical Barn Top Section............................................ 82
III-E-4. Approach Barrier Layout Variables .................. 83
III-E-5. Approach Barrier Layout for Opposing Traffic ....... 88
III-E-6. Suggested Roadside Slopes for Approach Barriers .... 90
XV

Figure No. Title Page
III-F-l. Inspection Procedure for Existing Roadside Barriers .......................................... 92
III-F-2. Example of Substandard Design and Layout of Approach Barrier. . . . . . . . . . . . . . . . . . . . . . . . . . . . . . . . . . 96
III-F-3. Suggested Design and Layout for Example Problem ........................................... 98
IV-A-1. Definition of Median Barrier Elements ............. 101
IV-A-2. Median Barrier Warrants ........................... 102
IV-B-1. Suggested Emergency Opening Design for Semi-Rigid or Rigid Systems ................•........... 127
IV-E-1. Definitions of Median Sections .................... 137
IV-E-2. Suggested Orientation of MB5 Shape on Super-elevated Section .................................. 140
IV-E-3. Example of Median Barrier Placement at Super-elevated Section .................................. 141
IV-E-4. Suggested Layout for Shielding of Rigid Object in Median ........................•................ 143
V-A-1. Model for Predicting Percentage of Bridge Rail End Impacts. . . . . . . . . . . . . . . . . . . . . . . . . . . . . . . . . . . . . . . 149
V-A-2. Percentage End Impacts vs. Bridge Length for e =5° and Lc = 96 inches ......•.................. 150
V-A-3. Percentage End Impacts vs. Bridge Length for e = 10° and Lc = 96 inches ........................ 150
V-F-1. Inspection Procedure for Existing Bridge Rails .... 165
V-F-2. Possible Retrofit Concepts for Bridge Rails (88) .. 168
VI-B-1. Illustration of Side Impacts in Transition Zone ... 182
VI-B-2. Suggested Layout for Last Three Exterior Modules in an Inertial Barrier ............................ 187
VI-D-1. Reserve Area for Gores ............................ 202
VI-E-1. Examples of Possible Crash Cushion Application to the Roadside or in the Median ..................... 211
xvi

Figure No. Title Page
VI I -C-1. Encroachment Frequency ...........•................ 218
VII-C-2. Collision Frequency Nomograph, Lengths from 0-200 Feet .................•.•....•............... 220
VII-C-3. Collision Frequency Nomograph, Lengths from 200-2000 Feet ..................................... 221
VII-C-4. Example Nomograph ...............•••......•........ 223
VII-C-5. Lateral Displacement Distribution ................. 225
VII-C-6. Average Occupant Injury and Vehicle Damage Costs .. 227
VII-C-7. Roadside Slope Geometry ........................... 233
VII-C-8. Cost Comparison Curves ............................ 239
VII-C-9. Bridge Pier Hazard ..........••.................... 242
VII-C-10. Elevated Gore Abutment ..........•..............•.. 253
xvii
Figure No.
VOLUME II
LIST OF FIGURES
Title Page
D-1. Available Area for Crash Cushions .................. D-5
D-2. A Solution to Steel Drum Example Problem ........... D-10
D-3. Nomograph for Design of Inertial Barrier ........... D-18
D-4. A Solution to Inertia Barrier Example Problem ...... D-24
D-5. Deceleration Chart for Hi-Oro Cell Cluster Design (100) ............................... ; .............. D-26
F-1. Normal Bumper Position of Full-Size Car ......•..... F-9
F-2. Bumper Position at Impact .......................... F-10
F-3. Normal Bumper Position -- Full Size Car Relative to Hydraulic Crash Cushion ......................... F-11
F-4. Normal Bumper Position -- Full Size Car Relative to Steel Drum Crash Cushion ........................ F-12
F-5. Normal Bumper Position -- Full Size Car Relative to 400 Pound Sand Module ........................... F-13
F-6. Normal Bumper Position -- Full Size Car Relative to 2100 Pound Module ....•.......................... F-14
F-7. Bumper Position at Impact- Hydraulic Crash Cushion ............................................ F-15
F-8. Bumper Position at Impact - Steel Drum Crash Cushion ............................................ F-16
F-9. Bumper Position at Impact- 400 Pound Sand Module .. F-17
F-10. Bumper Position at Impact - 2100 Pound Sand Module ............................................. F-18
F-11. Design Parameters for Vehicle Encroachments on Embankments ........................................ F-19
F-12. Parameters for Superelevated Cases •................ F-20
F-13. Design Parameters for Vehicle Encroachments on Sloped Medians ..................................... F-21
xviii

Figure No. Title Page
F-14. Design Parameters for Vehicle Encroachments on Curbs .....................•.................... F-22
F-15. Curb Geometry .•..........................••.•..... F-23
xix

VOLUME I LIST OF TABLES
Table No. Title Page
II-B-1. Dynamic Performance Criteria for Traffic Barriers........................................... 9
II-B-2. Recommended Crash Tests to Evaluate Impact Performance of Traffic Barriers .................... 10
III-A-1. Warrants for Nontraversable Hazards ..............•. 22
III-A-2. Warrants for Fixed Objects .............. ,.......... 24
III-B-1. Operational Roadside Barrier Systems ............... 46
III-B-2. Roadside Barrier Data Summary ..........•........... 50
III-B-3. Operational Roadside Barrier Transition Sections ... 55
III-B-4. Operational Roadside Barrier End Treatments ........ 64
III-C-1. Maintenance Factors Influencing Roadside Barrier Selection ..................•....................... 67
III-C-2. Collision Repair Data for Roadside Barriers ........ 69
III-D-1. Selection Criteria for Roadside Barriers ........... 72
III-E-1. Design Parameters for Roadside Barrier layout ...... 85
III-F-l. Structural Inadequacies of Roadside Barriers ..•..... 93
IV-B-1. Operational Median Barrier Systems ...........•..... 106
IV-B-2. Median Barrier Data Summary ........................ 111
IV-B-3. Variations in the Continuous Concrete Median Barrier Design (MB5) ..........•.................... 114
IV-B-4. Suggested Median Barriers as Related to Median Width .............•................................ 117
IV-B-5. Operational Median Barrier End Treatments .......... 123
IV-C-1. Collision Repair Data for Median Barriers .......... 129
IV-D-1. Selection Criteria for Median Barriers ............. 132
V-B-1. Operational Bridge Rail Systems .................... 152
V-B-2. Bridge Rail Crash Data Summary ..................... 156
XX
Table No. Title Page
V-D-1. Selection Considerations for Bridge Rails........ 161
V-F-1. Conformance Checks for Bridge Rails.............. 166
VI-B-1. Operational Crash Cushion Systems................ 173
VI-B-2. Crash Cushion Crash Data Summary................. 179
VI-B-3. Center of Gravity Data for Inertial System Modules.......................................... 189
VI-B-4. Summary of Structural and Safety Characteristics of Crash Cushions................................ 195
VI-C-1. Maintenance Characteristics of Operational Crash Cushions......................................... 197
VI-D-1. Reserve Area for Gores........................... 202
VII-C-1. Severity Index and Accident Cost................. 226
VII-C-2. Values of Kr.................................... 229
VII-C-3. Values of KJ........ .. . . . . .. . ... .. . . . . .. . . .. . . . . . 230
VII-C-4. Example and Comparison........................... 250
xxi
VOLUME II
LIST OF TABLES
Table No. Title Page
A-1. Field Data on Roadside Barriers..................... A-3
A-2. Field Data on Median Barriers ...................•... A-4
A-3. Field Data on Crash Cushions........................ A-6
B-1. Experimental Roadside Barrier Systems ............... B-3
B-2. Research and Development Roadside Barrier Systems ... B-5
B-3. Experimental Median Barrier Systems ................. B-7
B-4. Research and Development Median Barrier Systems •.... B-9
B-5. Experimental Bridge Rail Systems .................... B-11
B-6. Research and Development Bridge Rail Systems ........ B-13
B-7. Experimental Crash Cushion Systems .................. B-15
B-8. Research and Development Crash Cushion Systems ..•... B-18
B-9. Experimental Transition Sections .................... B-22
B-10. Research and Development Transition Sections ........ B-23
C-1. Roadside Barrier Crash Test Data .................... C-3
C-2. Median Barrier Crash Test Data ...................... C-5
C-3. Bridge Rail Crash Test Data......................... C-9
C-4. Crash Cushion Crash Test Data ....................... C-11
C-5. Transition Crash Test Data ..................••...... C-15
C-6. End Treatment Crash Test Data....................... C-17
D-1. Summary of Static and Dynamic Crush Strengths for Various Steel Drum Configurations Recommended for Design .............................................. D-4
D-2. Calculations for Steel Drum Example................. D-9
D-3. Design Data Table for Hi-Dro Cell Sandwic.h Cushion {100) .................................. ; ............ D-13
xxii
Table No. Title Page
D-4. Calculations for Inertia Barrier Example ............... D-19
E-1. Obstacle Inventory Codes............................... E-3
E-2. Severity Indices....................................... E-6
F-1. Dimensional Data for Optimum Shoulder-Side Roundings Tangent to Shoulder at 8 Ft. From EOP (11) .. ............................................. F-24
F-2. Bumper Trajectory Data for 60 mph Embankment Encroachments -- Negligible Shoulder to Embankment Rounding -- No Traveled Way Superelevation............. F~25
F-3. Bumper Trajectory Data for 60 mph Embankment Encroachments -- Shoulder to Embankment Rounding --No Traveled Way Superelevation ....•..........•........• F-26
F-4. Bumper Trajectory Data for Embankment Encroachments -- Superelevated Traveled Way ........•.......•....•.... F-27
F-5. Bumper Trajectory Data
F-6. Bumper Trajectory Data
F-7. Bumper Trajectory Data
F-8. Bumper Trajectory Data
F-9. Bumper Trajectory Data
Raised Slope Medians ..•.•.... F-28
Raised Slope Medians ..•...... F-29
Raised Slope Medians......... F-30
Raised Slope Medians......... F-31
9-Inch Type A Curb........... F-32
F-10. Bumper Trajectory Data - 8-Inch Type A Curb -- Full Size Car............................................... F-33
F-11. Bumper Trajectory Data - 6-lnch Type A Curb............ F-34
F-12. Bumper Trajectory Data - 6-Inch Type C Curb -- Full Size Car............................................... F-35
F-13. Bumper Trajectory Data - 6-Inch Type E Curb -- Full Size Car............................................... F-36
F-14. Bumper Trajectory Data- 6-Inch type G Curb ............ F-37
F-15. Bumper Trajectory Data - 4-Inch Type H Curb -- Full Size Car............................................... F-38
F-16. Bumper Trajectory Data - 13-Inch Type X Curb -- Full Size Car............................................... F-39
G-1. Estimates of Longitudinal Barrier Loads .........•...... G-4
xxiii
I. INTRODUCTION
I-A. Background
An extensive effort has been made in recent years to improve high
way safety. To accomplish this, a major emphasis has been placed on
the elimination of hazardous roadside conditions and on the improvement
of traffic barriers to shield those hazards that can not be eliminated.
Numerous studies have been made at the national, state, and local level.
These studies have focused on a wide range of traffic barrier subjects,
including warrants, impact performance, and economics.
Highway Research Board Special Report 81 (~),published in 1964,
National Cooperative Highway Research Program (NCHRP) Report 36 (~),
published in 1967, and NCHRP Report 54(~), published in 1968, contained
state-of-the-practice information on traffic barriers. NCHRP Report 118
(l), published in 1971, updated and superseded previous NCHRP reports.
I-B. Purpose of Guide
Since the publication of NCHRP Report 118 (l), additional research
has been done in the traffic barrier area and additional inservice
experience has been gained on existing traffic barrier systems. The
purpose of this document is to summarize the current state of knowledge
and to present specific design guidelines for highway traffic barriers.
The guidelines estahlish the conditions which warrant barrier protection,
the type of barriers available, their strength, safety, and maintenance
characteristics, selection procedures, and how the barrier should he
installed dimensionally or geometrically.
1
Also presented in the guide is a cost-effective selection procedure.
This procedure is presented as an alternate to the more conventional
selection procedures. In the conventional procedures, barrier need is
usually based on an evaluation of the relative hazard of the barrier
versus the hazard of the unprotected obstacle. The barrier is warranted
if the obstacle is more hazardous to the motorist than the barrier it
self. In the cost-effective procedure, need is based on an evaluation
of the costs associated with the barrier versus the costs associated with
the unprotected obstacle. Initial costs, maintenance costs, and accident
costs are included in the evaluation. In addition to establishing need,
the procedure can also be used to compare the cost-effectiveness of
various barrier systems.
For the purpose of this guide all traffic barriers are classified
as one of two basic types, namely, longitudinal barriers and crash
cushions. Longitudinal barriers function primarily by redirecting errant
vehicles. Crash cushions function primarily by decelerating errant vehicles
to a stop. Roadside barriers (guardrail, etc.), median barriers, and
bridge rails are the three types of longitudinal barriers. Each of these
types performs a particular function as does the crash cushion and these
functions are delineated in this guide.
It has been said that a traffic barrier is like life insurance -
it is good to have as long as it is not needed. Although this is an
overstatement, it cannot be overemphasized that a traffic barrier is
itself a hazard. Every effort should be made in the design stage to
eliminate the need for traffic barriers. Existing roadways should be
upgraded when feasible to eliminate hazardous conditions that require
2
barrier protection. A traffic barrier should be installed discrimi
nately and only when it is unfeasible to remove the hazardous condition.
I-C. Application of Guide
The contents of this document are intended as guidelines for those
responsible for the design, installation, and maintenance of traffic
barriers. It will have app.lications primarily to high speed facilities
since the vast majority of studies to date have concerned such facilities.
However, all available criteria relevant to low speed, low volume road
ways are included. In this regard, the chapter on cost-effectiveness
can be used to evaluate the effects of traffic conditions on traffic
barrier needs.
The guide will have applications to both new and existing roadways.
Consideration should be given to the application of the principles and
criteria presented in the guide for new construction. A survey of exist
ing facilities should be made and substandard conditions should be
identified with reference to the guide. Unnecessary barriers should be
removed, substandard barriers should be upgraded or replaced with
acceptable systems, improperly located barriers should be relocated, and,
if warranted, barriers should be installed to shield hazardous conditions
which cannot be removed. It is recognized that limited budgets may pre
clude the full implementation of these guidelines. In those cases, a
priority system should be established to insure that cost-effective
alternatives are employed.
The guide relates primarily to the proteative aspects of traffic
barriers. These guidelines must be considered together with social,
environmental, and economic factors.
3

Due to the complex nature of the subject matter, muchof the criteria
contained in this guide is by necessity based on subjective data. In
some areas, only general suggestions and recommendations can be made. It
can therefore not be overemphasized that application of these guidelines
must be made in conjunction with sound evaluation of the facts and en
gineering judgment to effect the proper solution.
I-D. Format of Guide
The main body of the guide is contained in Chapters II through VI.
Chapter II summarizes criteria used in the evaluation of the different
barrier types. Chapters III through VI contain criteria relevant to the
four barrier types, respectively. Each of these chapters is, to the
extent possible, autonomous. For example, Chapter IV contains guidelines
for median barrier warrants, the structural and safetycharacteristics
of operational median barriers, maintenance characteristics, a selection
procedure, placement recommendations, and suggested procedures for up
grading substandard median barrier systems. To avoid repetition and a
voluminous document, reference is sometimes made to other parts of the
guide if common criteria exists between different barrier types.
Separation of the guide subjects by barrier type is not meant to
imply that each type can be independently designed, selected, and installed.
A systems or integrated approach should be used to insure compatibility
of design of each of the barrier elements. For example, the selection
of a bridge rail should be based in part on the type of roadside approach
barrier to be used. The impact performance of the transition between the
two systems depends heavily on the compatibility of the two rail systems.
4

Supporting data and design procedures are given in the Appendix. A
bibliography of traffic barrier literature, indexed by year and barrier
type, is also presented in the Appendix.
Underlined numbers in parenthesis refer to references listed in
Appendix,r. Note that a list of references is included in both volumes
of the Guidelines.
5
II. EVALUATION CRITERIA
Various factors may affect the determination of .barrier need and,
if warranted, the barrier best suited for the given conditions. Safety
requirements, economic constraints, environmental constraints, and in
some cases traffic control constraints are all factors the designer must
usually confront. This guide addresses primarily the safety requirements
and the economic constraints.
It is the purpose of this chapter to summarize criteria used in the
guide to eval.uate the different elements in design.
II-A. Warrants
A survey of various state practices showed that barrier warrants are
usually based on an evaluation of the relative hazard of the barrier
versus the unshielded hazard. In some cases, warrants are also based on
the probability of run-off-the-road accidents and economic factors.
To the extent possible, warrants presented in this guide are based on
objective criteria. All of the warrants are based on the premise that
a traffic barrier should be installed only if it reduces the severity
of potential accidents. It is important to note that the probability or
frequency of accidents will not in general affect the severity of potential
accidents. As has been stated (18), "If it is judged that a guardrail
installation is not necessary at a particular embankment (that is, the
guardrail is a greater hazard than the embankment) .... , such a decision
remains valid whether one or one thousand vehicles run off the road at
that point." 6
Warrants may also be established by the cost-effective procedure
presented in Chapter VII. Through this procedure, factors such as design
speed and traffic volume can be evaluated in relation to barrier need.
Costs associated with the barrier (installation, maintenance, and acci
dent costs) are compared with costs associated with the unshielded
hazard. Typically, the cost-effective procedure can be used to evaluate
three options: (1) remove or reduce the hazard so that it no longer needs
to be shielded, (2) install a barrier, or (3) leave the hazard unshielded.
The third option would normally be cost effective only on low volume
and/or low speed facilities, where the probability of accidents is low.
The procedure also allows one to evaluate the cost effectiveness of any
number of barriers that could be used to shield the hazard.
As new and additional data become available on accidents involving
traffic barriers, the relative hazard of barriers versus unshielded
hazards and other factors, the warrants presented herein should be
updated. Each agency using this guide is encouraged to record and
document such information and to make it available to the public. Such
data will also greatly enhance the applicability of the cost-effectiveness
technique of Chapter VII.
Although the warrants cover a wide range of roadside conditions,
special cases or conditions will arise for which there is no clear choice.
Such cases must be evaluated on an individual basis, and, in the final
analysis, must usually be solved by engineering judgment.
7
II-B. Structural and Safety Characteristics
A traffic barrier serves dual and often conflicting roles. It must
be capable of redirecting and/or containing an errant vehicle without
imposing untolerable conditions on the vehicle occupants. It should be
able to do this for a range of vehicle sizes and weights, impact speeds,
and impact angles. Compromises are sometimes necessary to achieve a
balance between the structural and safety requirements.
To promote uniform testing and evaluation criteria for traffic barriers
and other highway appurtenances, NCHRP Report 153 (i) was published. The
recommended criteria and test procedures presented in the report are
directed to the structural and safety performance of these appurtances.
Table II-B-1 summarizes the evaluation criteria as it relates to the
different barrier types (i). As shown in the table, there are three
appraisal factors used in the evaluation, namely (I) structural adequacy,
(II) impact severity, and (III) vehicle trajectory hazard.
The most complex and controversial item in the evaluation criteria
concerns maximum vehicle accelerations. While most agree that vehicle
accelerations and impact severity are related, there is no concensus of
opinion as to just how they are related. However, until more definitive
criteria are established, the suggested acceleration values should be
considered the best available guidelines.
Full scale crash tests are the suggested means for evaluating the
structural and safety performance criteria of Table II-B-1. Shown in
Table II~B-2 are the crash tests suggested to evaluate the different
barrier types, taken from NCHRP Report 153. Each test is designed to
8
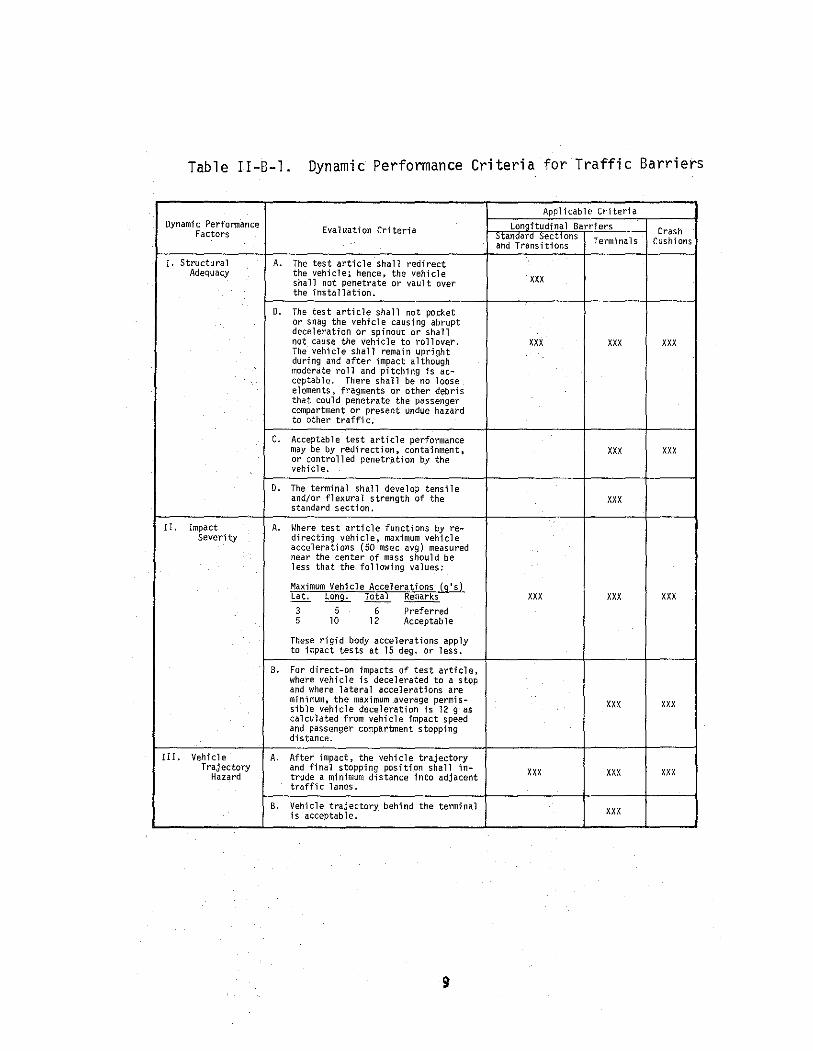
Table II-B-1. Dynamic Performance Criteria for Traffic Barriers
Applicable Criteria Dynamic Performance
Evaluation 'Criteria Lonai'tudinal Barriers Crash Factors ---naMard SectTons Terminals Cushions and Transitions
r. Structural A. The test article shall redirect Adequacy the vehicle; hence, the vehicle
XXX shall not penetrate or vault over the installation.
B. The test article shall not pocket or snag the vehicle causing abrupt deceleration or spinout or shall not cause the vehicle to rollover. XXX XXX XXX The vehicle shall remain upright during and after impact although madera te ro 11 and pitching is ac-ceptable. There sha 11 be no loose elements, fragments or other debris that could penetrate the passenger compartment or present undue hazard to other traffic,
c. Acceptable test article performance may be by redirection, containment, XXX XXX or controlled penetration by the vehicle.
D. The termi na 1 shall develop tensile and/or flexural strength of the XXX standard section.
II. Impact A. Where test article functions by re-Severity directing vehicle, maximum vehicle
accelerations (50 msec avg) measured near the center of mass should be less that the following values:
Maximum Vehicle Accelerations (g' s) Lat. ~ Total Remarks XXX XXX XXX
3 5 6 Preferred 5 10 12 Acceptable
These rigid body accelerations apply to impact tests at 15 deg. or less.
B. For direct-on impacts of test article, where vehicle is decelerated to a stop and where lateral accelerations are minimum, the maximum _average permis-sible vehicle deceleration is 12 g as calculated from vehicle impact speed
XXX XXX
and passenger compartment stopping distance.
III. Vehicle A. After impact, the vehicle trajectory Trajectory and final stopping position shall in-
XXX XXX XXX Hazard trude a minimum distance into adjacent traffic 1 anes.
B. Vehicle trajectory behind the terminal XXX is acceptable.
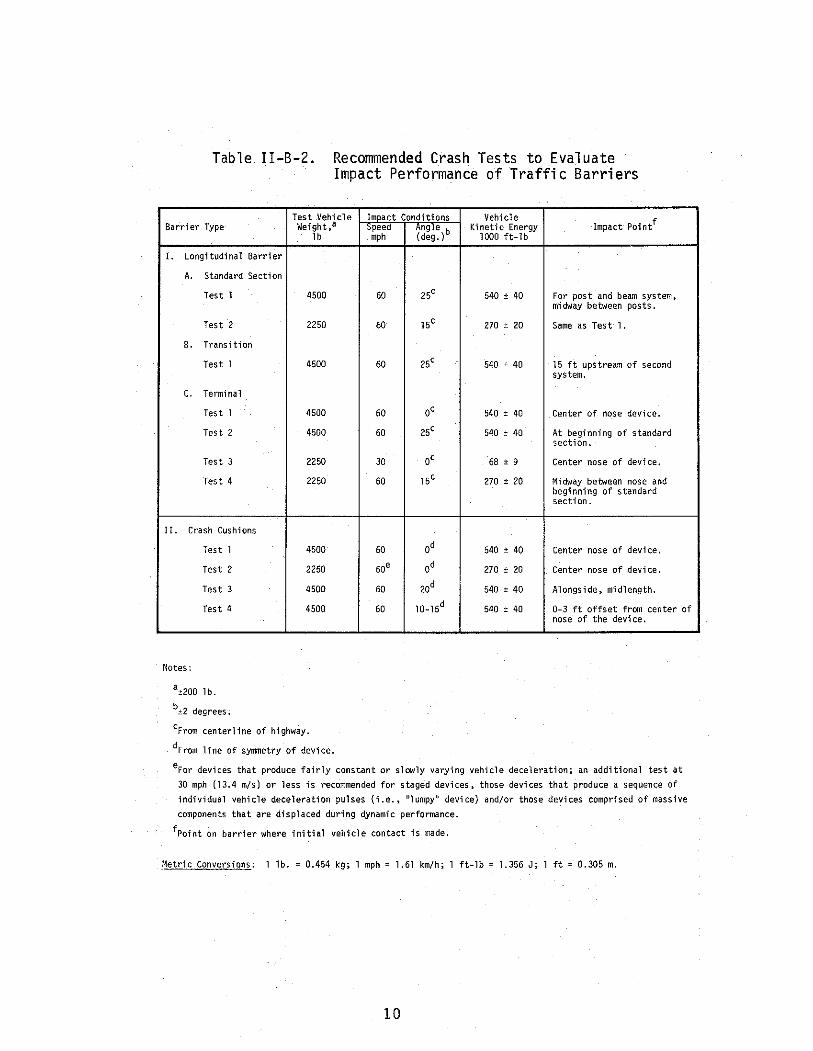
Table II-B-2. Recommended Crash Tests to Evaluate Impact Performance of Traffic Barriers
Barrier Type
I. Longitudinal Barrier
A. Standard Section
Test 1
Test 2
B. Transition
Test 1
c. Terminal
Test 1
Test 2
Test 3
Test 4
II. Crash Cushions
Test 1
Test 2
Test 3
Test 4
Notes:
a.±:200 lb.
b±2 degrees.
Test Vehicle Weight,a
1b
4500
2250
4500
4500
4500
2250
2250
4500
2250
4500
4500
cFrom centerline of highway.
dFrom line of symmetry of device.
Impact Conditions Vehicle Impact Pointf ::.peea 7ng1e Kinetic Energy
mph (deg. )b 1000 ft-lb
60 25' 540 ± 40 For post and beam system, midway between posts.
60 15' 270 ± 20 Same as Test 1.
60 25' 540 ± 40 15 ft upstream of second system.
60 o' 540 ± 40 Center of nose device.
60 25' 540 ± 40 At beginning of standard section.
30 o' 68 ± 9 Center nose of device.
60 15' 270 ± 20 Midway between nose and beginning of standard section.
60 ad 540 ± 40 Center nose of device.
so• ad 270 ± 20 Center nose of device.
60 20d 540 ± 40 Alongside, midlength.
60 10-lSd 540 ± 40 0-3 ft offset from center of nose of the device.
eFor devices that produce fairly constant or slowly varying vehicle deceleration; an additional test at 30 mph (13.4 m/s) or less is recommended for staged devices, those devices that produce a sequence of individual vehicle deceleration pulses (i.e., "lumpy" device) and/or those devices comprised of massive components that are displaced during dynamic performance.
fPoint on barrier where initial vehicle contact is made.
!4etric Conversions: 1 lb. = 0.454 kg; 1 mph= 1.61 km/h; 1 ft-lb = 1.356 J; 1 ft = 0.305 m.
10
evaluate either the structural adequacy of the barrier or its impact
severity and vehicle trajectory hazard. Generally, the structural
adequacy of a longitudinal barrier is determined by impacting it with
a 4500 lb (2040 kg) automobile at a 25 degree angle. The impact severity
and vehicle trajectory hazard of a longitudinal b.arrier is determined
by impacting it with a 2250 lb (1020 kg) automobile at a 15 degree angle.
Test 1 .and 2 for crash cushions are designed to demonstrate the
energy-absorbing capabi 1 i ties .of the cushion for both 1 arge and sma 11
cars. Test 3 is designed to evaluate the redirection capabilities of the
cushion when impacted from the side. Test 4 evaluates the cushion for
unsymmetric impacts. Detailed commentary on the basis of each test in
Table II-B-2 is presented in NCHRP Report 153, together with suggested
testing facility practices, data acquisition systems, and data reduction
techniques.
Barrier systems chosen for inclusion in the guide are classified
as either opePational, expePimental, or PeseaPch and development (R & D)
defined herein as follows. An opePational system is one that has per
formed satisfactorily in full scale crash tests and has demonstrated
satisfactory in-service performance. It must be noted that there is
no widely accepted evaluation criteria whereby "satisfactory in-service
performance" can be determined. In general, however, satisfactory
performance can be established by documented evidence that the barrier
is functioning as intended by the evaluation criteria presented herein.
An expePimental system is one that has performed satisfactorily in full
scale crash tests and promises satisfactory in-service performance.
11

An R & D system is one that is in the development stage and has had
i nsuffi ci ent full-sea 1 e crash testing and in-service performance to be
classified otherwise.
omission of a barrier system does not necessarily imply that the
system is non-operational. There are numerous traffic barrier systems
on the roadways that have not been subjected to full-scale crash tests.
However, it was not within the scope of this effort to evaluate and
determine the status of these systems.
To the extent that pertinent information was available the barrier
systems given in this guide were evaluated in terms of the NCHRP Report
153 criteria. However, prior to its publication in 1974, there were no
unified test procedures for evaluating traffic barriers. As a consequence
barriers have been tested at a wide range of impact conditions. Many
longitudinal barriers have never been subjected to a 15 degree crash test.
There have been considerable variations in the type and size of the test
vehicles used, the type and location of photographic and electronic
instrumentation used during the tests, and the manner in which the test
data was reduced and evaluated.
Evaluation forms for the longitudinal barriers and the crash cushions
have been designed to present the impact performance of each barrier in
terms of the suggested criteria (e.g., see Table III-B-1 and Table IV-B-1).
The impact conditions shown on the forms are those which most nearly
represent the recommended test conditions. Although the data shown is
indicative of the general performance of each barrier, discretion must be
used when comparing the performance of the different systems due to the
differences in impact conditions described above.
12

Although crash testing is definitely the recommended way to evaluate
the impact performance of a traffic barrier, itmay be necessary in
certain instances to use other means. Scale model tests, pendulum tests,
and computer aided math models are often used in the conceptual and
design stage, and occasionally are used as the means of final evaluation.
Of course, there is no substitute for the application of basic engineering
principles throughout the design and test phases.
If a barrier must be designed and installed without evaluation by
full scale tests, the design should adhere to the criteria outlined in
Table II-B-1. A method of estimating impact loads on a longitudinal
barrier is presented in the Appendix G of this guide. Methods are also
presented in the Appendix D to aid the highway engineer in designing
certain types of crash cushions.
It should be noted that most traffic barriers have been designed for
automobiles weighing approximately 4500 lb (2040 kg) or less. Although
the vehicle population is composed predominantly of automobiles, there
is a need, in some cases, for barriers which can contain and/or redirect
large trucks and heavy vehicles. Testing of prototype bridge rails to
accomplish this is already underway. The Federal Highway Administration
is sponsoring studies in this area, aimed at the development of design
criteria and the development of bridge rails, median barriers, and road
side barriers to restrain heavy vehicles. The highway engineer should
remain cognizant of research in this area, and, if conditions warrant,
consider the installation of such barriers.
13
II-C. Maintenance Characteristics
Maintenance is an important factor to consider when selecting a
traffic barrier. Repair requirements in terms of manpower, material
and equipment for typical collisions, the future availability of parts
and the normal maintenance requirements are items to consider. Another
important consideration is the time maintenance crews must be exposed
to dangerous traffic conditions to repair the barrier. Repairs can
also disrupt the traffic flow which increases the potential for accidents.
A very limited amount of objective criteria exists from which to
eva 1 uate the rna intenance characteristics of current traffic barriers.
As a consequence, the maintenance guidelines presented herein are,
for the most part, general in nature. If the barrier system under
consideration is being used by other agencies, the designer should con
sult with these agencies to determine their in-service experience.
Agenaies are enaouraged to record and doaument maintenanae experience
with traffia barriers and to publish the data. Such data would be very
beneficial to everyone responsible for the selection of efficient and cost
effective barrier systems.
14
III. ROADSIDE BARRIERS
A roadside barrier is a longitudinal system used to shield
vehicles from hazards in the roadside. It may also be used to shield
hazards other than opposing traffic in extensive areas bethleen divided
highways. It may occasionally be used to protect pedestrians and
''bystanders" from vehicular traffic. It is the purpose of this chapter
to delineate criteria pertinent to the various elements of design,
including warrants, structural and safety characteristics of operational
systems, maintenance characteristics of operational systems, a selec
tion procedure, placement recommendations, and guidelines for upgrading
substandard installations.
III-A. Warrants
Highway hazards that may warrant shielding by a roadside barrier
can be placed. in one of two basic categories: embankments and roadside
obstacles. Pedestrians or "innocent bystanders" may a 1 so warrant pro
tection from vehicular traffic. The highway features contained in each
of these categories are discussed in the following sections.
It is noted that these warrants apply primarily to roadways designed
for vehicle speeds of approximately 50 mph (80.5 k/h) or greater. For
roadways with design speeds less than 50 mph or roadways with very low
volumes, the designer may consider amending these warrants. Such changes
should be based on a careful evaluation of the existing conditions, and,
preferably on documented criteria to support the changes. In this
regard, the procedure presented in Chapter VII can be used to evaluate
15
barrier needs as related to traffic conditions. This procedure is
included as an alternate or optional approach to the establishment
of barrier need.
III-A-1. Embankments
Height and slope of the embankment are the basic factors in
determining barrier need for a fill section (an embankment that slopes
downward). Warranting criteria for fill sections are shown in Figure
III-A-1. The criteria are based on studies of the relative severity of
encroachments on embankments versus impacts with roadside barriers
(~, ~. 10). Embankments with slope and height combinations below the
curve do not warrant protection. Obstacles on the slope may, however,
warrant protection. The criteria in Section III-A-2 should be used in
such cases. Embankments with slope and height combinations above the
curve warrant protection.
Recent studies (]JL) have shown that rounding at the shoulder and
the toe of an embankment can significantly reduce its hazard potential.
Rounded slopes reduce the chances of an errant vehicle becoming airborne,
thereby reducing the hazard of the encroachment and affording the driver
more contro 1 over the vehicle. Figure I II -A-2 i 11 ustrates the rounding
geometry at the shoulder and it contains "optimum" rounding dimensions.
Optimum rounding is arbitrarily defined as the minimum radius a standard
automobile can negotiate without losing tire contact. It is dependent
on the encroachment speed and angle, as well as the vehicle itself.
The 25 degree values shown in Figure III-A-2 are considered desimbZe
and the 15 degree values are considered aaaeptable.
~ -0 '0.5 .Q ~
Q) Q. 0 (/)
~ 0.4 +-0 Q) (/)
LL 0.3
LL 0
....J <( (.)
0 0.2 a:: a. (.) w a::
0.1
TRAVELED WA'(<SHOULDER /FILL SECTION EMBANKMENT
b~ !HEIGHT
a, -----------
BARRIER OT WARRA TED FOR EMBANKM HOWEVER CHECK BARRIER NE D FOR OT ROADSIDE HAZARDS.
NT. ER
0.0~--------~--------~--------~--------~--------~--------~ 0 10 20 30 40 50 60
Fill Section Height (ft)
METRIC CONVERSION: I ft = .305m
Figure m A-1. Warrants For Fill Section Embankments.
17
~
2Y2: I .D 0 0 -0 ~
II> Q.
3:1 0
(/)
c: .2 ... 0
4:1 II> (/)
:5: I iJ.
6:1
8'
1-------R ----oo-4 . ~·.···.· .. . •....
A
20: I SHOULDER SLOPE
A= SHOULDER SLOPE TANGENT POINT
B =INTERSECTION OF SHOULDER AND SIDE SLOPES
C• SIDE SLOPE TANGENT POINT
D • CENTER OF ROUNDING CIRCLE
IY4o1. Us
D METRIC CONVERSIONS:
1 ft. = o. 30 5 m I mph= 1.61km/h
-··
SIDE ROUNDING LATERAL DISTANCE FROM ELEVATION OF SLOPE (2R) RADIUS EOP TO POINT-FT POINT C RATIO FT FT. A B c D FTBELOW EOP
DEPARTURE@ 60 MPH & 25 DEG.
10:1 4.1'* 81.8 8.0 10.0 12.0 3.9 0.7 6:1 9.4* 81.8 8.0 12.7 17.4 3.9 1.4 4:1 16.0 81.8 8.0 16.0 23.8 3.9 2.7 3:1 22.4 81.8 8.0 19.2 29.8 3.9 4.5 2:1 34.3 81.8
. 8.0 25.2 40.5 3.9 8.9
DEPARTURE@ 60 MPH & 15 DEG. .. 10:1 2.0* 40.9 8.0 9.0 10.0 6.0 0.6
6:1 4.7* 40.9 8.0 10.4 12.7 6.0 0.9 4·:1 8.0 40.9 8.0 12.0 15.9 6.0 1.6 3:1 .· .. 11.2 40.9 8.0 13.6 18.9 6.0 2.5 2:1 17.2 40.9 8.0 16.6 24.3 6.0 4.7
---· • INDICATES ROUNDING IS LARGER THAN REQUIRED FOR OPTIMUM
Figure III-A-2. Dimensional Data for Optimum Rounding (}l)
18
Rounding at the toe of the slope is also essential to minimize the
hazard at the side slope to ground line hinge. Rounding values at the
toe should equal those at the shoulder. Although unrounded slopes of
3:1 and flatter need not be shielded, every effort should be made to
round any slope as much as practical. The added safety benefits of
slope rounding will be ample justification.
III-A-2. Roadside Obstacles
Roadside obstacles are further classified as nontraversable
hazards and fixed objects. These highway hazards account for over thirty
percent of all highway fatalities each year. Removal of these obstacles
should be the first alternative considered. If it is not feasible or
possible to remove the hazard, then a barrier should be considered.
However, a barrier should be installed only if it is clear that the barrier
offers the least hazard potential.
Barrier warrants for roadside obstacles are a function of the
nature of the obstacle and its distance from the edge of the traveled
way. Figure III-A-3 shows a suggested criterion for determining the
clear distance on fill and cut sections. Clear distance is defined as
the minimum lateral distance measured with respect to the edge of the
traveled way needed by the driver of an errant vehicle to either
regain control and begin a return to the roadway or to slow the vehicle
to a safe speed. The criterion in Figure III-A-3 is based on run-off
the road accident studies (Z., !.§.) and research studies (.!Q., g_, 144).
It must be noted that the criterion is based on operating speeds of
approximately 60 mph (96.54 km/h). For operating speeds below 60 mph,
19
.. co. 0
(/)
c 0 -u ..
(/)
.. co. 0
(/)
c: 0
:;:: u ..
(/) -::1
===,,-=---~~{2~oSHOULDER TRAVELED ~
WAY I a1 Fill Section
Check Roadway Obstale For Removal Or Sorrier Protection (Table m-A-1 And Table
01----+--
0.11-----t--
LE
u O.SL-----'2-0-1 60 80
Distance From Edge Of Traveled Way
.... ' ...s .. co. 0
(/)
c: 0
r.;: u .. (f)
=
I~
-u .. (/) -" u
To Roadside Obstacle (Clear Distance) (ft.)
Figure m-A-3.
METRIC CONVERSION I f t
Suggested Clear Distance Criterion Roaetside Obstacles
20
' 0.305 m For
smaller clear distances would be permissible. However, engineering
judgment must be used in such cases due to an absence of objective
criteria. Also, no appreciable slope rounding was used in the studies.
Rounding will also reduce the clear distance required.
This procedure for use of Figure III-A-3 is as follows:
(a) First locate the point on the figure whose coordinates
are the distance from the traveled way to the obstacle
in question (horizontal axis) and the slope of the
embankment (vertical axis}.
(b) If this point lies below the line then protection is not
warranted. If it lies above the curve then protection
may be warranted, depending on the nature of the obstacle.
It is recognized that the suggested clear distance criterion
represents a significant change in previous guidelines. Strict adherence
to this criterion may be impractical in many situations due to limited
right-of-way or other restricted conditions. It does, however, represent
the present state of knowledge and it underlines the fact that flat,
unobstructed roadsides are highly desirable.
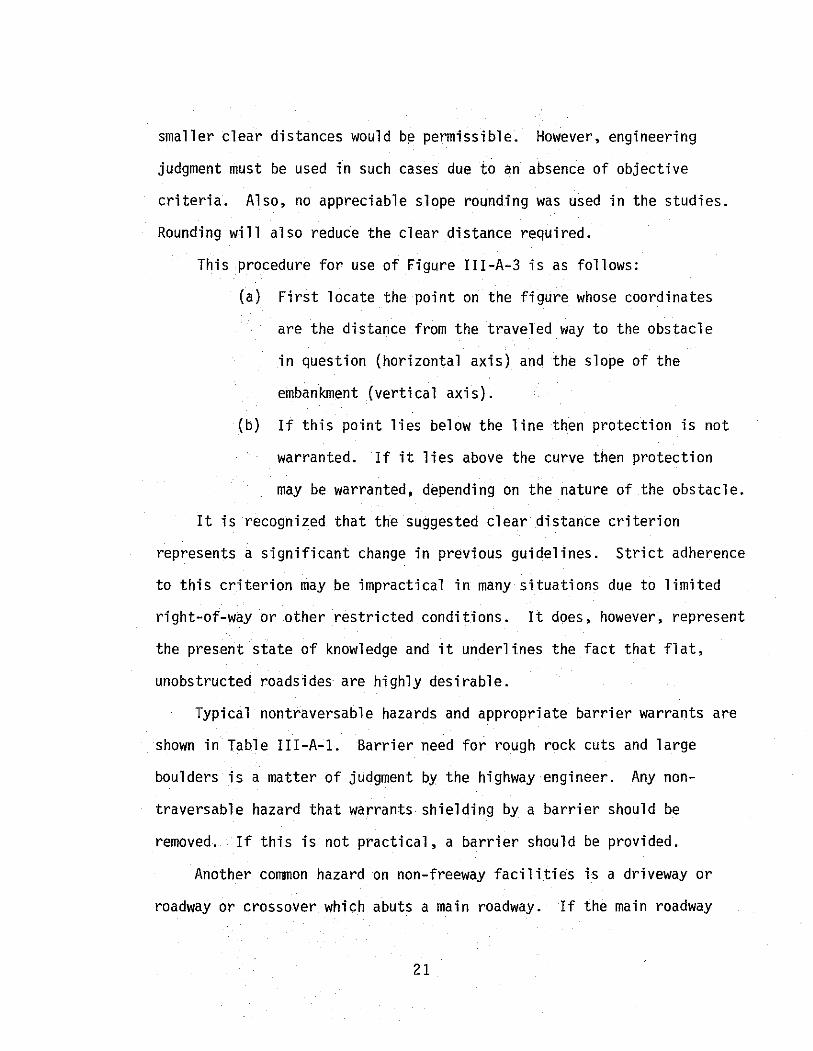
Typical nontraversable hazards and appropriate barrier warrants are
shown in Table III-A-1. Barrier need for rough rock cuts and large
boulders is a matter of judgment by the highway engineer. Any non
traversable hazard that warrants shielding by a barrier should be
removed. If this is not practical, a barrier should be provided.
Another common hazard on non-freeway facilities is a driveway or
roadway or crossover which abuts a main roadway. If the main roadway
21
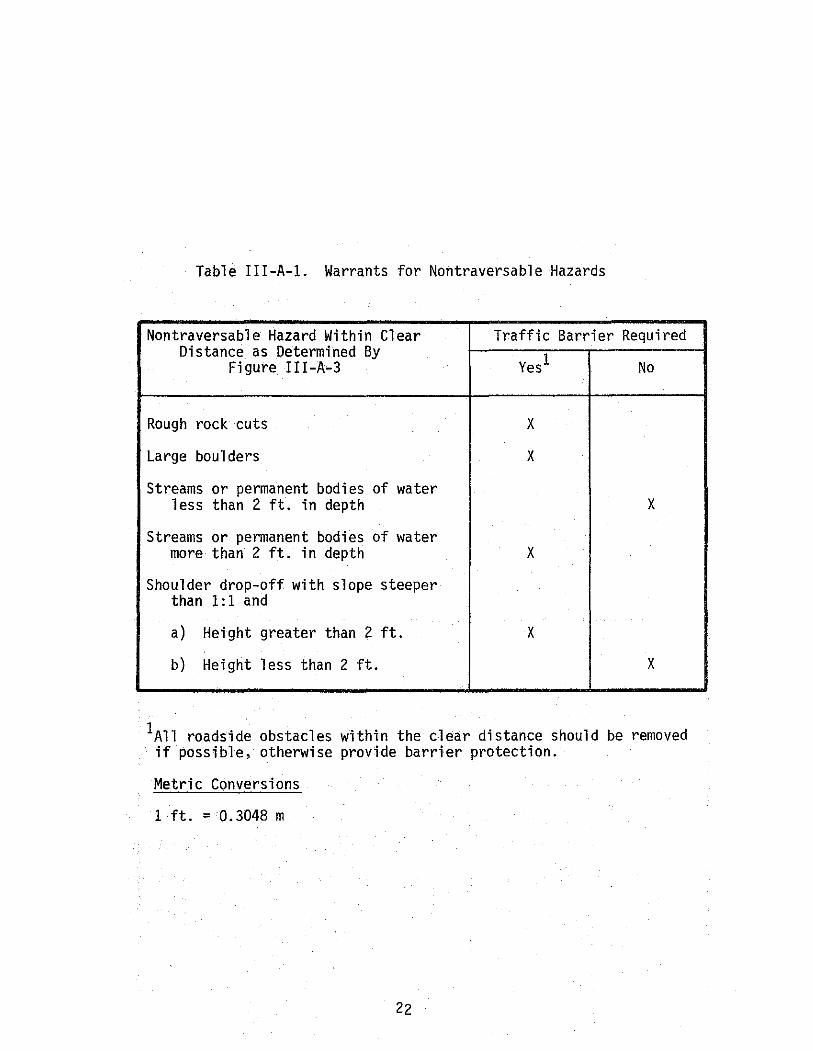
Table III-A-1. Warrants for Nontraversable Hazards
Nontraversable Hazard Within Clear Traffic Barrier Required Distance as Determined By
Yes1 Figure II I -A•3 No
Rough rock cuts X
Large boulders X
Streams or permanent bodies of water less than 2 ft. in depth X
Streams or permanent bodies of water more than 2 ft. in depth X
Shoulder drop-off with slope steeper than 1:1 and
a) Height greater than 2 ft. X
b) Height less than 2 ft. X
1All roadside obstacles within the clear distance should be removed if possible, otherwise provide barrier protection.
Metric Conversions
1 ft. = D.3D48 m
22

is in a fill section or has adjoining ditches of considerable depth,
the driveway will of necessity also be on a fill. A culvert is often
necessary under the driveway. However, a roadside barrier would not
normally be used to shield the driveway due to the restrictions it
would impose on the sight distance of users of the driveway. Barrier
ends also pose special problems. It is therefore highly desirable that
the slope of the driveway embankment be as flat as possible, preferably
10:1 or flatter, to minimize the hazard potential to motorists on the
main roadway. Sloping inlet and outlet culvert grates will also
reduce the hazard of open culverts.
Typical fixed objects and the appropriate warranting criteria are
given in Table III-A-2. Current AASHTO specifications (~) state that
satisfactory dynamic performance for breakaway supports is indicated
when "the maximum change in momentum for a standard 2250 lb {1020 kg)
vehicle, or its equivalent, striking a breakaway support at speeds from
20 mph (32 km/h) to 60 mph (97 km/h) does not exceed 1100 lb-sec
(4893 N-sec), but desirably does not exceed 750 lb-sec (3336 N-sec)."
As used by AASHTO (~), the term breakaway support ... "refers to all
types of signs, luminaire and traffic signal supports that are designed
to be safely displaced under vehicle impacts, whether the release
mechanism is a slip plane, plastic hinges, fracture elements or a
combination of these." While this criterion is objective, the ability
of a given support to satisfy the criterion is not easily determined
other than by full-scale tests. If analytical evaluation methods are
used, they should include a consideration of the mass of the struc
ture, its stiffness properties, the fai 1 ure mechanism of the support,
23
Table III-A-2. Warrants for Fixed Objects
Fixed Objects Within Clear Traffic Barrier Required Distance as Determined by
Figure I II -A-3 . Yes No
Sign, trafflc signal, and luminaire supports a) Breakaway or yieldin~ design
with linear impulse: 1) less than 1,100 lb-sec
x3 X
2) greater than 1,100 lb-sec b) Concrete base extending 6 in.
or more above ground X Fixed sign bridge supports X Bridge piers and abutments at
underpasses X Retaining walls and culverts X Trees with diameter greater than
6 in. X Wood poles or posts with area greater
than 50 in.2 X
1Breakaway or yielding design is desirable regardless of distance from traveled way.
2see discussion in text. 3A judgement decision (see discussion in text).
Metric Conversions: 1 lb-sec.= 4.45 N-sec 1 in = 0.0254 m
24
and the vehicle's characteristics. While the momentum criterion on
breakaway supports represents the best available guidelines, its
application to barrier warrants should be tempered with discretion.
It is conceivable that a support that exceeds the 1100 lb-sec (4893
N-sec) momentum criterion may still not be as hazardous as a roadside
barrier. Until more definitive data are available, barrier need for
such supports must be based on engineering judgment. Also, installa
tion of a roadside barrier greatly increases the target area for an
errant vehicle, reduces the lateral clearance, and poses special problems
at its ends. Such factors can be evaluated by the cost-effective pro
cedure presented in Chapter VII.
Fixed objects within the clear distance as determined by Figure
III-A-3 that warrant barrier protection by Table III-A-2 should be
removed. If removal is not practical or feasible, a barrier should be
provided.
Figure III-A-4 outlines the procedure to follow to determine
roadside barrier needs for fill and cut sections and roadside obstacles.
The procedure should be followed for each roadside hazard until barrier
need is established.
III-A-3. Bridge Rail Ends, Transitions, and End Treatments
Most bridge rail approach barrier systems are some type of road
side barrier. Figure III-A-5 summarizes the warrants for an approach
barrier to a bridge. This criteria is again based on 30 ft (9.14 m)
clear distance requirement for fixed hazards since the unprotected end
of a bridge rail is considered a fixed object hazard. For twin
25
N
"'
FIGURE III-A-4. Summary of Roadside Barrier Warrants
Start Here
Is the embankment Yes Is barrier warranted Yes a fill or flat by Figure III-A-1? section?
No No
Is the slope of cut section No steeper than 2:1?
Yes .
Are roadside obstacles Is barrier warranted within clear distance Yes based on Table III-
Is slope of cut section Yes as determined by A-1 and/or Table III-steeper than 0.7:1? Figure III-A-3? A-2?
No No No
Can hazard be removed or reduced so that Yes\ "\ Yes barrier sheilding is
"' ,/ unnecessary? tNo
Barrier ~
Barrier Not ..
Warranted Warranted -
Yes
Can hazard be removed or reduced so that barrier shielding is unnecessary?
·~No
Barrier Warranted
END TREATMENT
TRANSITION
TRANSITION
END TREATMENT
TRAFFIC
DIRECTION
I AND li
I AND II
w
JI I
END TREATMENT
I---BRIDGE RAIL
TRANSITION
END TREATMENT
DISTANCE BETWEEN APPROACH BARRIER
BRIDGE RAILS-W (ft.) REQUIRED AT*
i 60
) 60
A,B,C,D
A,D
ll ONL:Y ALL WIDTHS A, B
I ONLY ALL WIDTHS C, D *Check roadside for other warranting features. METRIC CONVERSION: I ft. =0.305m
Figure m-A-5. Bridge Approach Barrier Criteria
bridges, the length of the approach rail on the median side of each
bridge should be of sufficient length to prevent an errant vehicle
from impacting the bridge rail end of the other bridge. Lengths of
need and flare rates for approach barriers are given in Section III-E.
If an approach barrier is warranted based on Figure III-A-5, an
adequate transition section between the approach barrier and the
bridge rail is warranted. If the end of the approach barrier ter
minates within the clear distance, a.crashworthy end treatment is also
warranted.
In general, a transition section is warranted when there is a
significant change in the lateral strength or lateral stiffness of
a roadside barrier. A crashworthy end treatment of a roadside barrier
is warranted when the barrier terminates within the clear distance.
III-A-4. Bystanders, Pedestrians, and Cyclists
An area of concern to highway offici a 1 s is what has been termed
the "innocent bystander" problem. In most such cases, the conven
tional criteria presented in the previous sections cannot be used to
establish barrier needs. For example, a major street, highway, or
freeway may adjoin a school yard, but the boundaries are beyond the
clear distance. Conventional criteria would not require that a barrier
be installed. However, if there is any reasonable probability of an
errant vehicle encroaching on the school yard, a barrier would be
warranted. If possible, the barrier could be placed near the school
boundary to minimize the hazard to the motorist. Reference should
be made to Section III-E for lateral placement criteria. Special
consideration should also be given to businesses and/or residences
28

which are near the right of way.
Pedestrians and cyclists are another area of concern to highway
engineers. The most desirable solution to this problem is to physi
cally separate them from vehicular traffic. Since this solution is not
always practical, alternate means of protecting them is sometimes neces
sary.
As in the case of bystander warrants, there is no objective
criteria to draw on for pedestrian and cyclist barrier warrants. On low
speed streets, a barrier curb will usually suffice to protect pedestrians
and cyclists from vehicular traffic. However, at speeds in excess of
30 to 40 mph (48.3 to 64.4 km/h), a vehicle will mount the curb for
relatively flat approach angles. Hence, when sidewalks or bicycle
paths are near the traveled way of high speed facilities, some provision
should be made for the safety of the pedestrians and the cyclists.
If necessary, one of the roadside barriers presented in Section III-B
should be installed. Proper consideration should be given to the deflec
tion characteristics of the barrier in the lateral placement of the barrier.
III-A-5. Preferred Ditch Cross Sections
Although specific warrants for barrier protection of ditches do not
exist, the designer should recognize their potential hazard. Ditches
near the traveled way can be a significant hazard if their cross section
cannot be easily traversed by an errant vehicle.
Figures III-A-6, III-A-7, and III-A-8 present preferable front
slopes and back slopes for various ditch configurations (144). Ditch
29

N 0
' N ..c II
w a.. 0 --' (f)
:.:: u <{ CD
TRAVELED WAY
SLOPE
SHOULDER b1 L:----==,._____
0.4+--····· .. ······
0. 3
0.2
0.2 0.3 0.1
METRIC CONVERSION: I ft.' 0.305m
FRONT SLOPE = b1 /a 1
0.4
Figure m-A-6. Preferred Ditch Sections For: (a) Vee Ditch; or (b) Round Di tch,Bottom Width ( 8ft. ; or
:I
N .c ..
"' " 4:1
5:1
6: I
8:1
10:1
0.5
(c) Trapezoidal Ditch, Bottom Width< 4ft.; or (d) Rounded Trapez,oidal Ditch, Bot. Wid.<4ft.
30
FRONT SLOPE BACK SLOPE
SHOULDER
1 width I
10:1 a:1 s:1 s:1 2:1 .5r--------~+---~~---+--~--------~-------;2:1
N
" ..... N
..:0
II
.... Q.
0 ..J (/)
~ 0 C( I!)
METRIC CONVERSION" 1ft.' 0.305m
FRONT SLOPE =b 1 ta1
Figure m-A-7. Preferred Ditch Sections For: (a) Trapezoidal Ditch, Bottom Width = 4ft.
To 8ft.; or (b) Round Ditch, Bottom Width= 8ft. to 12ft.
31
3:1
N ..:0
.,N

s!' II
w 0.. 0 ...J (J')
:X: u <( Ill
FRONT SLOPE
WIDTH
3:1
(\J .0
(\J 0
••
5:1
0.4 0.5
METRIC CONVERSION: 1ft. =0.305m
FRONT SLOPE= b1 /a 1
Figure JIT-A-8.Preferred Ditch Sections For: (a)Trgpezoidol Ditch,Width>Sft.;or (b) Round Ditch, Width> 12ft.; or (c) Rounded Trapezoidal Ditch,Width>4ft.
32
sections which fall in the shaded region of each of the figures are
considered to have a tolerable cross section. Tolerable implies that
the occupants of an errant vehicle traversing the ditch would not
likely experience serious injuries. Ditch sections which fall outside
the shaded region are considered undesirable. If feasible, problem
ditch sections may be flattened and/or rounded or internal drainage
systems may be added.
III-A-6. Steep Grades
Heavy vehicles occasionally lose their brakes when going down
long steep grades. Reference should be made to Section VI-A for a
discussion of this problem and possible solution.
III-A-7. Example Problems
This section presents illustrative problems for determining barrier
need at roadside hazards. Figure III-A-9 shows common roadside features
that might warrant roadside barrier protection. Figure III-A-4 is used
at each station or hazard in conjunction with the other appropriate
figures and tables presented previously in this chapter. Note that a
shoulder width of 12 feet (3.66 m) is assumed at each section in deter
mining the clear distance.
33
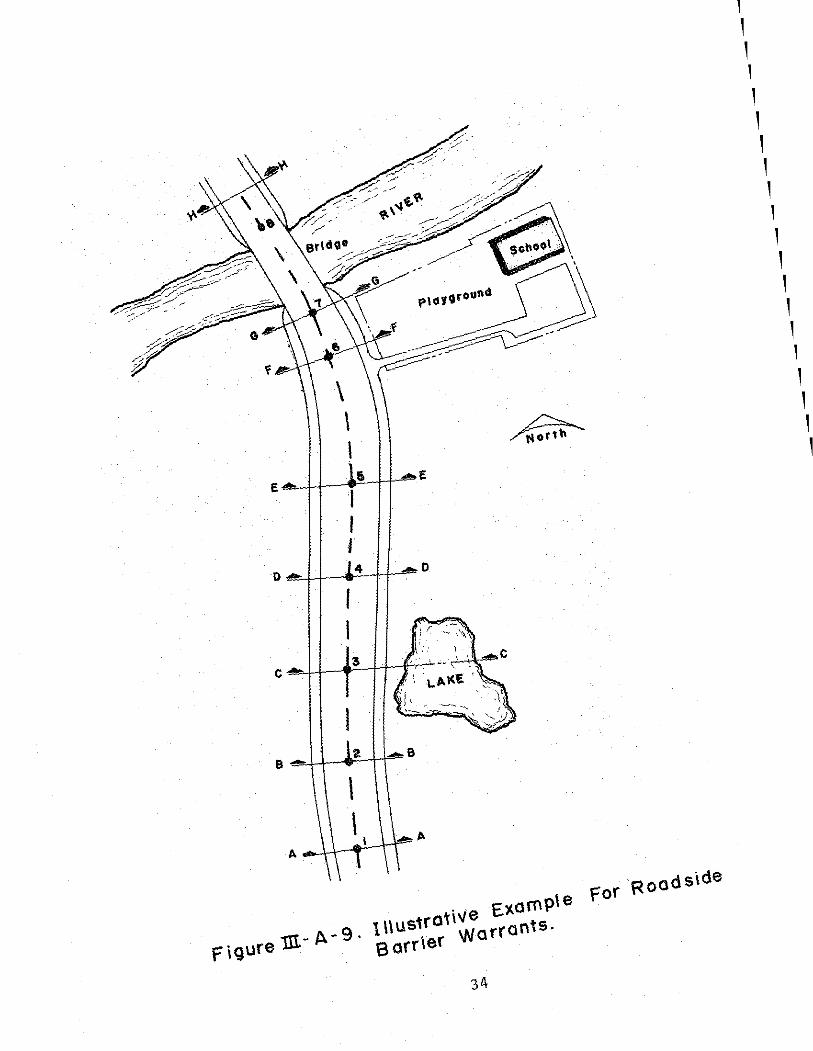
B e-
\ \
f\gure11t· .,_.g. tllustroliV• E<""'ple for Roadside sorrier warrants.
1 1 1 1 1 1 1 1 1 1 1 1 1 1 1 1 1 1 1 1 1 1 1 1 1 1 1 1 1 1 1 1 1 1 1 1 1 1 1 1 1 1 1 1

.!:---- 90' ----tl2'-j---24'---tl2'-i
' I I I I ., '
41'R. I 41'R.
METRIC CONVERSIONS:
1ft• 0.3048 m I rection r-HJ J);f T pc;.;; I ';f'iijl =,U ... ·''"it:,..!l 2 .... ..__..-
,;a::; a<
Section
1G-~
I ' SCHOOL
r-30~ 1 I ""·r--:::-t:ence 3:L,_f2 3 ,, 1 .. , I I FLAT
PLAYGROUND
Figure.m:-A-9. (Cont.}
' iection r-1 I I
~eot;oo ~-E "~ 15'120'
4
80'
I I
Section A-A / FLAT
Illustrative E.xample For Roadside Barrier Warrants (Cross Sections)
35
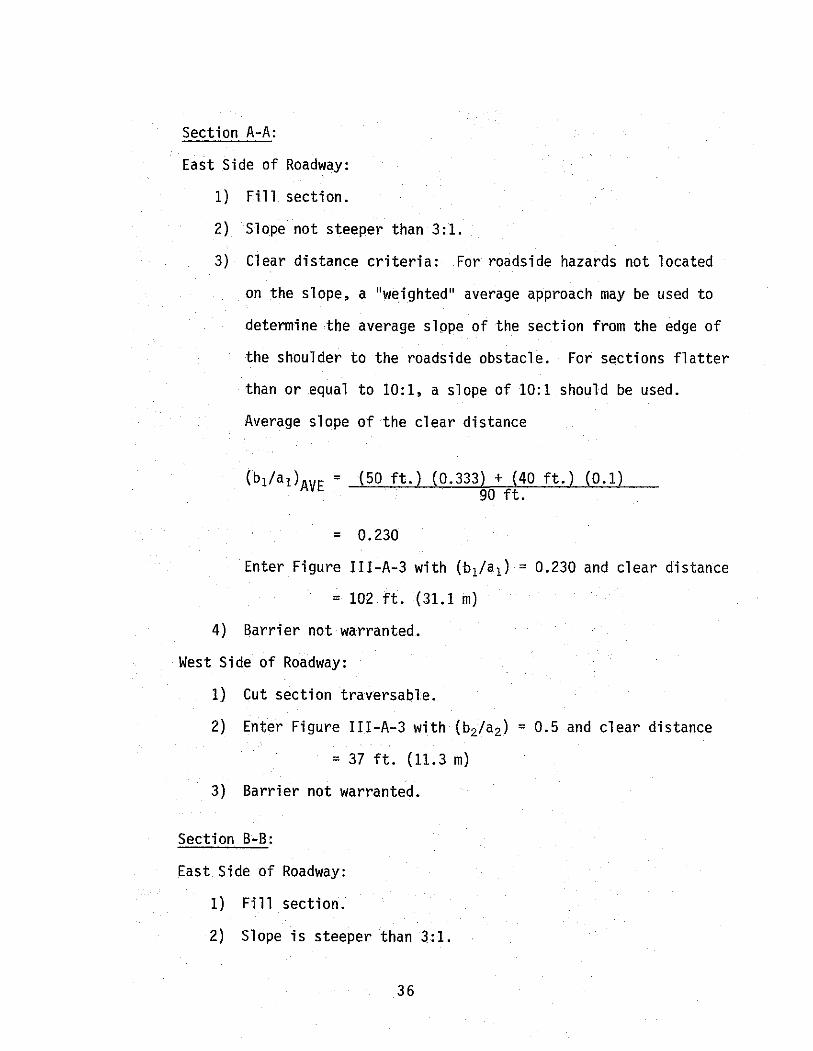
Section A-A:
East Side of Roadway:
1) Fill section.
2) Slope not steeper than 3:1.
3) Clear distance criteria: For roadside hazards not located
on the slope, a "weighted" average approach may be used to
determine the average slope of the section from the edge of
the shoulder to the roadside obstacle. For sections flatter
than or equal to 10:1, a slope of 10:1 should be used.
Average slope of the clear distance
( b 1 I a 1 ) AVE = _(~..o:5:.o!.O ...!f..!:.t :...~.· )~( 0~. 3~3~31:,) _.:..+._!(..::.40~f~t .:.L) --'('-"!0.:...:· 1"-J_)_ 90 ft.
= 0.230
Enter Figure III-A-3 with (b1/a 1 ) = 0.230 and clear distance
= 102 ft. (31.1 m)
4) Sarrier not warranted.
West Side of Roadway:
1) Cut section traversable.
2) Enter Figure III-A-3 with (b2/a 2 ) = 0.5 and clear distance
= 37 ft. (11.3 m)
3) Barrier not warranted.
Section B-B:
East Side of Roadway:
1) Fill section.
2) Slope is steeper than 3:1.
36
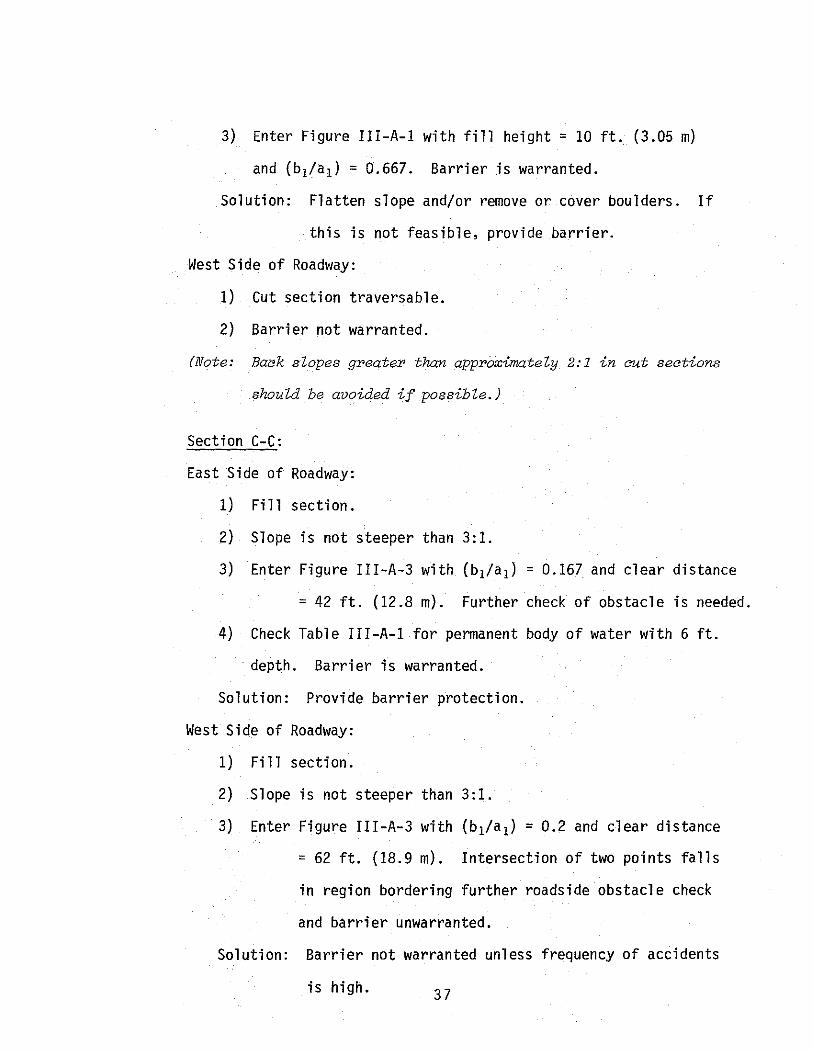
3) Enter Figure III-A-1 with fill height = 10 ft. (3.05 m)
and (b1/a 1 ) = 0.667. Barrier is warranted.
Solution: Flatten slope and/or remove or cover boulders. If
this is not feasible, provide barrier.
West Side of Roadway:
1) Cut section traversable.
2) Barrier not warranted.
(Note: Baek slopes greater than approximately 2:1 in cut sections
should be avoided if possible.)
Section C-C:
East Side of Roadway:
1) Fill section.
2) Slope is not steeper than 3:1.
3) Enter Figure III-A-3 with (b1/a 1 ) = 0.167 and clear distance
= 42 ft. (12.8 m). Further check of obstacle is needed.
4) Check Table III-A-1 for permanent body of water with 6 ft.
depth. Barrier is warranted.
Solution: Provide barrier protection.
West Side of Roadway:
1) Fill section.
2) Slope is not steeper than 3:1.
3) Enter Figure III-A-3 with (b 1/a 1) = 0.2 and clear distance
= 62 ft. (18.9 m). Intersection of two points falls
in region bordering further roadside obstacle check
and barrier unwarranted.
Solution: Barrier not warranted unless frequency of accidents
is high. 37
Section D-D:
East .Side of Roadway:
1) Fill or flat section.
2) Slope is not steeper than 3:1.
3) Enter Figure III-A-3 with (b1/a 1 ) = 0.1 and clear distance
= 22 ft. (6.7 m). Further check of obstacle needed.
4) Check Table III-A-2 for sign supports.
5) Assuming breakaway design of support does not cause momen
tum change greater than 1100 lb-sec (4893 N~sec) barrier
not warranted.
(Note: Move sign support outside JO ft. clear distance if feasible.)
West S.ide of Roadway:
1) Cut section.
2) Slope is not steeper than 2:1.
3) No roadside obstacles to be checked.
4) Barrier not warranted ..
Section E-E:
East Side of Roadway:
1) Fill section.
2) Average slope of fill section
=
(55 ft.) (0.25) +(20ft.) (0.333) 35 ft.
0.30
Average slope is less than 3:1.
38
3) Average slope of clear distance
(15 ft.) (0.25) + (20 ft.) (0.333) 95 ft.
(60 ft.) (0.1) 95 ft. = 0.173
+
Enter Figure III-A-3 with (b 1/a 1 ) = 0.173 and clear distance
= 107ft. (32.6 m). No further check of rough rock
cut needed.
4) Barrier not warranted.
West Side of Roadway:
Cut section not traversable. However, barrier would probably
not be warranted if back slope surface is smooth and does not
cause vehicle to pocket and/or overturn.
Section F-F:
East Side of Roadway:
1) Flat section.
2) Slope not steeper than 3:1.
3) Enter Figure III-A-3 with (b 1/a 1 ) = 0.1 and clear distance
=33ft. (10.1 m).
4) Barrier not warranted by standard criteria, however, a
playground near a high speed facility may need to be shielded.
Need must be based on judgment. The driveway presents special
problems. Reference should be made to the discussion in
Section III-A-2.
39
West Side of .Roadway:
1) Fill Section
2) Slope not steeper than 3:1.
3) Enter Figure III-A-3 with (b 1/a 1) = 0.167 and clear dis
tance = 42 ft. ( 12.8 m) . Further check of obstacle
needed.
4) Check Table III-A-1 for drop-off .of 3 ft. (0.91 m) at bottom
of slope. Barrier warranted.
Solution: Fill in drop-off and taper to slope of 6:1 or
flatter.
Section G-G:
East Side of Roadway:
1) By bridge approach barrier criteria in Figure III-A-5, an
approach barrier system is warranted. An appropriate tran
sition section and end treatment should also be provided
with the approach rail. (See Section III-E-4 for discussion.)
West Side of Roadway:
1) Again, by bridge approach barrier criteria in Figure III-A-5,
an approach barrier system is warranted. An appropriate
transition section and end treatment should also be provided
with the approach rail system. Note that at Station 8, bridge
approach barrier with appropriate transition section and end
treatment would also be warranted on the east and west
side of the roadway, although this is not considered in
this example. (See Section III-E-4 for discussion.)
40
Section H-H:
East Side of Roadway:
1) Fill section.
2) Slope is steeper than 3:1.
3) Enter Figure III-A-1 with (b 1/a1 ) = 0.5 and fill height
=3ft. (0.91 m). Height and slope of fill section
does not warrant protection.
4) No roadside obstacle on or near fill section.
5) Barrier protection not warranted.
West Side of Roadway:
1) Fill section.
2) Slope is steeper than 3:1.
3) Slope is 2:1 and height is approximately 40ft. (12.2 m).
By Figure III-A-1, barrier is warranted. It should be
noted, however, that the slope has optimum rounding (see
discussion in Section III-A-1 and Figure III-A-2). Under
some circumstances, such as low volume roadways or roadways
with operating speeds below 60 mph (96.5 km/h) or favorable
accident records, the highway engineer may choose not to
provide a barrier for such a cross-section.
III-B. Structural and Safety Characteristics
It is the purpose of this section to present operational roadside
barrier systems and to point out desirable structural and safety charac
teristics. The section is subdivided according to standard sections of
41
roadside barriers, transitions, and end treatments for roadside barriers.
Figure III-B-1 is an example to illustrate these three roadside barrier
elements. In this example, the length of need is composed of a standard
section and a transition. For embankment shielding, the length of need
would only consist of the standard section. Length of need criteria is
discussed in a subsequent section.
Structural and safety characteristics of operational systems within
each of these three roadside barrier elements are presented on standard
forms (e.g., Table III-B-1). Information on each form consists of the
following:
(a) A sketch of the barrier and its basic dimensions.
(b) A system designation, used for convenience in referring to the
barrier, consistent with standardized barrier notation (22, £l).
(c) Barrier description - This section contains a description of
the main structural elements of the as-tested barrier and
post spacing. Prior to seZection of a particuZar barrier
system, the designer shouZd obtain fuU detaiZs of the system
through the references given on the form. AZso, some of the
systems have been standardized, in terms of hardware, and this
shouZd be considered in the selection process. Identification
of the standardized systems are given in the following sub
sections.
It has been shown that small variations in designs or in
construction details can have adverse effects on the impact
performance of barriers. Thus, the design detaiZs shouZd
correspond to the as-tested detaiZs unZess adequate justifica
tion exists for changing the design.
42
""' w
D LENGTH OF NEED (BRIDGE RAIL) LENGTH OF NEED
1wnstream Upstrea m Terminal Standard Sect Transitio!l .Iransitio_n_ Standard Sect. Terming!
or or End End Treat· I Treat· ment
I ment
I I <ez._' I I I I 'J 0 R A 8 R R A R R RA ...... ·. .· .. · .. ·.· A H R R R 8 B B B B
EOPJ
, DIRECTION of ' TRAVEL ( ad"jacent traffic)
--- -------DIRECTION of
--~) TRAVEL (opposing traffic)
Figure III-B-1. Definition of Roadside Barrier Elements
(d) Impact performance - The contents of this part of the form are
designed to allow the evaluation of each system in terms of the
recommended evaluation criteria discussed in Section II-B.
However, before comparing the impact performance of the systems,
reference should be made to the discussion in Section II-B
concerning the absence of uniform test conditions.
In many cases, the barrier was subjected to a series of
crash tests. Appendix C contains a summary of all crash tests
performed on each of the systems.
It is also to be emphasized that these crash tests were
conducted under ideal conditions. The vehicle approached on
a level surface, the posts were embedded in a firm to stiff
s.oi 1 , attention was given to erection deta i 1 s and the ends of
the installation were anchored properly. To the extent possible,
the designer should evaluate the conditions under which the
barrier will be installed in the field, i.e., typical soil
conditions, the expertise required of the personnel who must
install and maintain the barrier, and the sensitivity of the
barrier to structural detail variations.
(e) Barrier damage - A brief description of the barrier parts
damaged during the test is given. These parts would have to
b.e either repaired or replaced. Supplemental data in this
area is given in Section III-C.
(f) References - The reference shown in the form contains the
reported test data. However, Appendix C should be reviewed
for other reported tests which may have been performed on the
44

system. These references should be consulted for further
structural details and for more in-depth reports on the crash
tests.
(g) Field performance data - Documented field data that describes
their in-service performance is available on some of the
barriers. The designer is encouraged to review these and
any other field data during the selection process.
(h) Remarks - General comments are given regarding the barrier's
design and/or impact performance.
III-B-1. Standard Sections of Roadside Barriers
Table III-B-1 presents a summary of the structural and safety
characteristics of current operational roadside barriers._ Table III-B-2
contains a summary of the impact performance data on each of the opera
tional systems. Before comparing the impact performance of the systems,
reference should be made to the limitations of test methods discussed in
Section II-B. Appendix B contains a summary of roadside barriers which
appear promising but which do not have sufficient in-service use to be
classified operational.
Although it is difficult to classify or categorize the performance
of roadside barriers, they are usually denoted as either a flexible or a
semi-rigid system. Flexible systems undergo considerable dynamic deflec
tion upon impact and are generally more forgiving than the semi-rigid
systems since they impose lower impact forces on the vehicle.
In selecting a roadside barrier, close attention must be given
to its deflection characteristics. If the barrier can be placed a
considerable distance from the hazard or hazards being protected, a
45

Table I I I -B-1. Operational Roadside Barrier Systems
I"
~·I - ___ .[:_:~- -
~-~,~ Metric Converaions :30"
ft. ~ o.~m • NOM. 5'-3" I
I lo. • 2e.4 mm 2"NOM 2"NoM] I I mph~ 1.61 km/hr
~~ ,...-I lb. • 0.4!i4ko 1~ s'-3" r· .. 24"
U=------·_L U=: ____ L SYSTEM G1
"'·'" " . '" ~~' o Ooo> c b1 Go c i1 BARRIER DESCRIPTION
POST SPACING 16' 0" 12' 6" Nominal POST TYPE S3x5. 7 steel S3x5. 7 steel BEAM T.VPE Three 3/4" diameter steel cables Steel "W" section, 12 GA. OFFSET BRACKETS ------ ------MOUNTINGS 5/16" diameter steel hook bolts 5/16" diameter steel bolt FOOTINGS '.;"x8"x24" steel plate welded to l,;''x8"x24" steel plate welded to
post post IMPACT IMPACT IMPACT IMPACT
IMPACT PERFORMANCE ANGLE~ 15a ANGLE·'" 25° ANGLE" 6° ANGLE • 27.8°
IMPACT CONDITIONS Speed (mph) NO TEST 44.0 57.0 59.2 Vehicle Weight {lb.) 3500 3500 4051
BARRIER Dynamic Defl_ection (ftJ 11.0 " 0 7. 30
VEHICLE ACCLEAAn~SCG'•/ Loterol UNAV UNAV 3.80 Longitudinal UNAV UNAV 3.10 Total 6.10 1.00. lJNAV
VEHICLE TRAJECTORY E)(ft Angle (deg.) 15 1 9 Roll Angle (deg.) UNAV 0 ,zo Pitch Angle (deg.) UNAV 0 "'10
6 posts 12' of "W" UNAV
BARRIER DAMAGE da"1aged section '"d
2 pasts
REFERENCES 17 17 18
FIELD PERFORMANCE DATA2 YES YES
Smooth redirection. System re- In 27.8° test, vehicle was air-qu1res large recovery area due borne for' 50' , however, smooth
REMARKS to large dynamic deflection. redirection and overall good bar-Limited crash test data. ri er perfon11ance. Fairly large
dynamic def.lections.
UNAV- unavailable 1 ~0mill I 1econd average unless otherwise noted 2
1 f avo/lable, see summary In Append he A 3Through studies {1_32} subsequent to the tests reported W-beam performs better at a height of 33 inches.
here, the State of New York has concluded that the
46

Table III-B-1. Operational Roadside Barrier Systems (Continued)
~--,-- ----- r.Cl .. -BS ·r Metric Conversions 27"
)""I I fl. ~o-~m .
1~"0' 1!!1'-3"
15·- 4" I in. ~ 25.4 mm I mph= 1.61 km/hr ~ 1-- ·=- ' I lb. e 0.4!54kg 24"
TI~ ---_,_
-- 0
SYSTEM GJ "W'~~~1a'1r: rwood Post I Box Beam Blocked-Out
BARRIER DESCRIPTION POsT SPACING 6' 4" 6'' -3" POST TYPE S3x5.7 steel 8"x8" Douglas Fir BEAM TvPE 6"x6"x0.180" steel tube Steel "W" section, 12 GA. OFFSET BRACKETS L5"x3~"x>.," steel angle, 41,;" long 8"x8"xl4" Douglas Fir Block MOUN-TINGS 3/8" dia. steel bolt(beam to <w91E 5/8" diameter carriage bolts FOOTINGS !4"X8"x24" steel plate welded to None
post
IMPACT IMPACT lr.FACT IMPACT IMPACT PERFORMANCE ANGL.E"l5o ANGlE •26° ANGLE•l5" ANGLE•22.2°
IMPACT CONDITIONS Speed (mph) NO TEST 57.7 NO TEST 60.1 Vehicle Weight {lb.) 4031 4123
BARRIER Dynamic Deflection (ff.) 4.80 2.80
VEHICLE ACCLERATIONSCG'•~ Lateral 5.80 6.10 Lon~itudinol 2.80 3.00 Tot or UNAV UNAV
VEHICLE TRAJECTORY Exit An~le (deg.l 0.00 15 Roll An~le (de~. ) UNAV UNAV Pitch Angle (deg.) UNAV UNAV
BARRIER DAMAGE UNAV UNAV
REFERENCES J8 18
FIELD PERFORMANCE DATA2 YES YES 3
Excellent redirection, vehicle Smooth redirection. Southern came to rest parallel to the yellow pine is acceptable al-
REMARKS rail. ternate to DougJas Fir. See G4(2W) system for smaller post size.
--,-UNAV- unavailable 1!10mlllla:econd overoge un~••• otherwise noted
2r f oval table, ••• 1ummory In Appendix A
3oata for 6-inch block-ollt.
4rhrough studies {137) subsequent to the tests reported here, box beam.perfonnsbetter at a height of 30 inches.
the State of New York has concluded that the
47
Table III-B-1. Operational Roadside Barrier Systems (Continued)
rl"
f' ..... l=£_] lt I I I
Metric Converalone 27" I
I It " 0.305 m !6'-o" I lo. ~ 2~.4 mm 5'·4" -I mph: 1.61 km/hr i=
I
I lb . • 0.4~4 kg
0 S:c Q __ i
-- _l
SYSTEM G4(2W) G4(1S) Blocked-Out "W" Beam (Wood Post) Blocked-Out "W" Beam (Steel Post)
BARRIER DESCRIPTION POsT SPACING 6' 3" 6' 3" POST TYPE 6" x 8" Douglas Fir W6x8.5 steel post BEAM TYPE Steel "W" section, 12 GA Steel "W" section, 12 GA OFFSET BRACKETS 6" x 8" x 14" Douglas Fir Block W6x8.5xl' 2" long steel block4 MOUNTINGS 5/8" diameter carriage bolts 5/8" diameter bolt FOOTINGS None None
IMPACT IMPACT IMPACT 0 IMPACTzs0 IMPACT PERFORMANCE ANGLE" 15° ANGLE: 24° ANGLE" 15 ANGLE(za.4°)
IMPACT CONDITIONS Speed {mph) NO TEST 68.0 NO TEST 66.0 (56.8) Vehicle Weight {lb.) 4960 4960 (3813)
BARRIER 2.33 3 Dynamic Deflection (ft.) 2.60 (4.05)
VEHICLE ACCLERATIONS(G'e)l Late rol 7.0 6.85 {6.60) Longitudinal 6.8 3.78 {3.90) Total UNAV UNAV {UNAV)
VEHICLE TRAJECTORY E~ i 1 Angle (de g. ) 14 16 (8) Roll Angle {deg.) "15 0 (UNAV) Pitch Angle (deg.) UNAV 0 (UNAV)
25' of ''W" 25' of "W" BARRIER DAMAGE section and section and
4 posts 3 posts
.
REFERENCES 19 19, ( 18)
FIELD PERFORMANCE OATA2 NO YES
System is similar to G4(1W) except See text for explanation of djf-for smaller posts and block-out feregces in data shown for 25 and
REMARKS size. System performed well. 28.4 tests. Smooth redirection.
.
UNAV- unovoil able 150milllucond overotjle unless otherwise noted
2tf available, see summary In Appendix
3Maximum permanent deflection 4Tests show that a "W" section back-up plate, 1 ft. in length, must be placed behind rail elements at intermediate posts (non-splice posts).
48
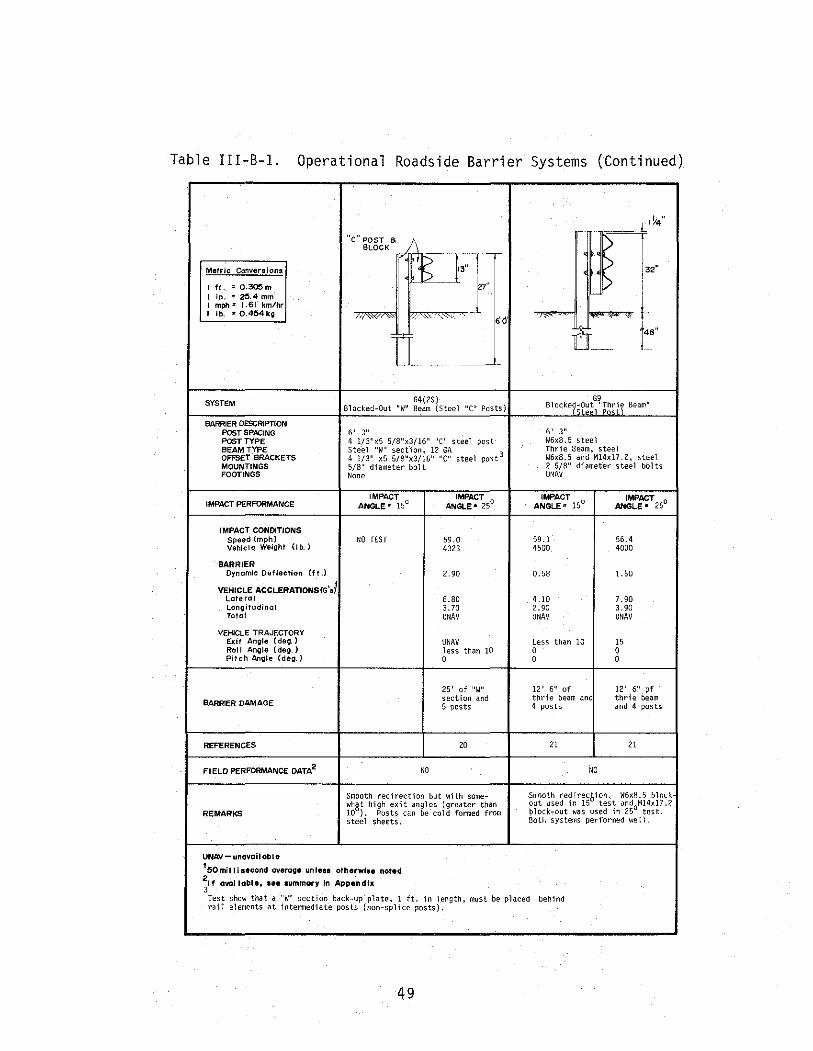
Table III-B-1. Operational Roadside Barrier Systems (Continued)
-
rr~:· "c" POST • !l BLOCK
Metric Conversions ~~ ]"" I ft. = o.~m 27''
I in. : 2~.4 mm
j I mph= 1.61 km/hr I lb. ,. 0.404kg
' /,·-.; ,,·C·. -· f!·d'
Lt. j••" ~ fi __ --· -- ____ __[_
SYSTEM G4(2S} G9 Blocked-Out "W" Beam {Steel "C" Posts) Blocke1~?u!; 1 "Jhr~~ Beam"
BARRIER DESCRIPTION POST SPACING 6' 3" 6' 3" POST TYPE 4 l/3"x5 5/8"x3/16" "C" steel post W6x8. 5 steel BEAM TYPE Steel "W" section, 12 GA
post 3 Thrie !learn, steel
OFFSET BRACKETS 4 1/3" x5 5/8"x3/l6" "C" steel W6x8.5 and M14xl7.2, steel MOUNTINGS 5/8" diameter bolt 2 5/8" diameter steel bolts FOOTINGS None UNAV
IMPACT IMPACT IMPACT IMPACT IMPACT PERFORMANCE ANGLE~ 15° ANGLE• 25° ANGLE• 15° ANGLE • 25°
IMPACT CONDITIONS Speed {mph) NO TEST 59.0 59.1 56.4 Vehicle Weight (lb.) 4323 4500 4000
BARRIER Dynamic Deflection (ft.) 2. 90 0. 58 1. 50
VEHICLE ACCLERATIONSCG'a)t Lateral 6.80 4.10 7. 90 Longitudinal 3. 70 2. 90 3. 90 Total UNAV UNAV UNAV
VEHICLE TRAJECTORY Exit Angle (deg.) UNAV Less than 10 15 Roll Angle (de g. ) less than 10 0 0 Pitch Angle (deg.) 0 0 0
25' of "W" 12' 6" of 12' 6" pf
BARRIER DAMAGE section "' thrie beam "' thrie beam 5 posts 4 posts and 4 posts
REFERENCES 20 21 21
Fl ELD PERFORMANCE DATA2 NO NO
Smooth redirection but with some- Smnoth red i rec& ion. W6x8. 5 b 1 od whgt high exit angles (greater than out used in 15 test ~nd0Ml4xl7 .?.
REMARKS 10 ) . Posts can be cold formed from block-out was used in 25 test. steel sheets. Both systems performed we 11 .
UNAV-unavoilobl& 150mllllsecond overoge unleea otherwise noted 2tf ovoi table, see aummory in Appendix
3 Test show that a "W" section back-up plate, I ft. in length, rail elements at intermediate posts (non-splice posts).
must be placed behind
49
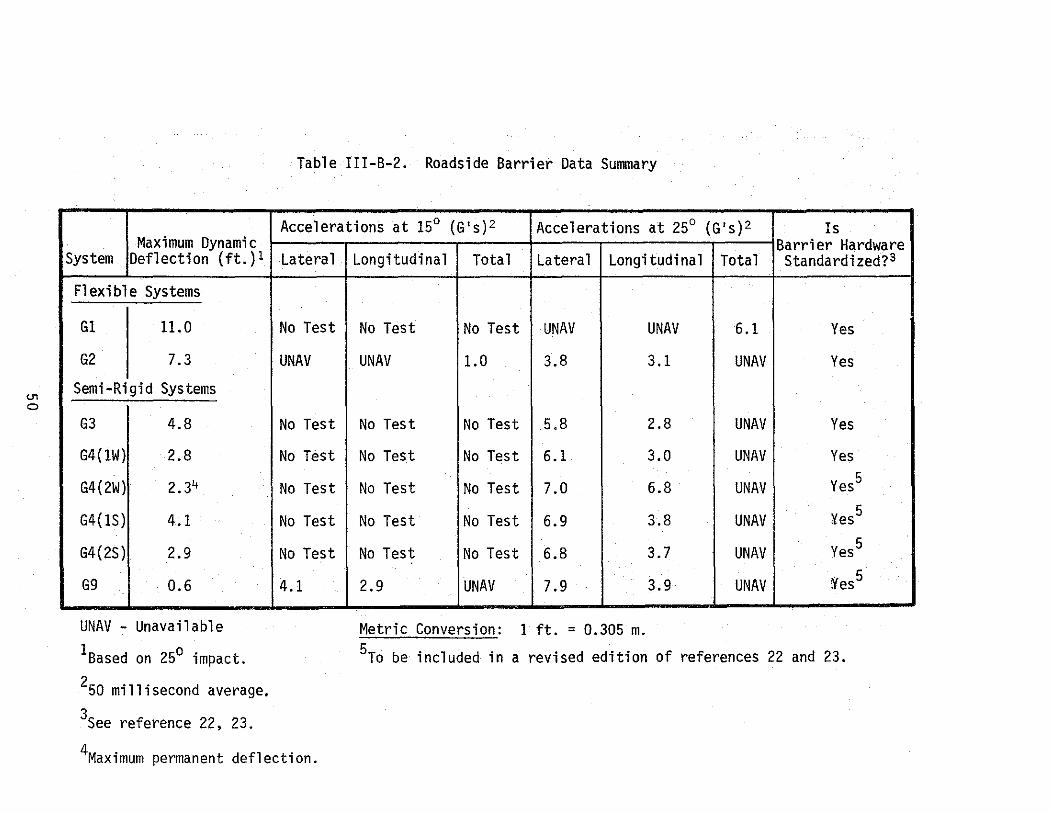
(J1
0
Table III-B-2. Roadside Barrier Data Summary
Accelerations at 15° (G's)2 Accelerations at 25° (G's)2 Is Maximum Dynamic Barrier Hardware
System Deflection (ft.)l Lateral Longitudinal Total Lateral Longitudinal Total Standardized?3
Flexible Systems
G1 11.0 No Test No Test No Test UNAV UNAV 6.1 Yes
G2 7.3 UNAV UNAV 1.0 3.8 3.1 UNAV Yes
Semi-Rigid Systems
G3 4.8 No Test No Test No Test 5.8 2.8 UNAV Yes
G4(1W) 2.8 No Test No Test No Test 6.1 3.0 UNAV Yes
G4(2W) 2.34 No Test No Test No Test 7.0 6.8 UNAV Yes5
G4(1S) 4.1 No Test No Test No Test 6.9 3.8 UNAV ¥es 5
G4(2S) 2.9 No Test No Test No Test 6.8 3.7 UNAV Yes5
G9 0.6 4.1 2.9 UNAV 7.9 3.9 UNAV f{ 5 es
UNAV - Unavailable Metric Conversion: 1 ft. = 0.305 m. 1Based on 25° impact. 5To be included in a revised edition of references 22 and 23. 250 millisecond average, 3see reference 22, 23.
4Maximum permanent deflection.
flexible barrier can be used. Conversely, semi-rigid barriers are
necessary if the barrier-to-hazard distance is small. However, short
intermittent sections of two different types of roadside barriers are
not recommended. Such installations present problems at their terminals
and at points where the two systems join (transition). In general,
short intermittent sections of any roadside barrier are undesirable.
Gaps of less than 200 feet between barrier installations are to he
avoided.
Based on the test results shown in Table III-B-2, systems Gl and
G2 are considered flexible barriers. In these systems, the resistance
to impact is due in most part to the tensile forces developed in the
cable (Gl) or theW-beam (G2). The cable and the rail tear away from
the support posts upon impact, the posts thus offering negligible resis
tance in the impact zone but are essential to control lateral deflection.
Splices are designed to carry the full tensile strength of the cable
(Gl) or the rail (G2).
Systems G3 through G9 are considered semi-rigid barriers. In the
G3 system, the resistance is achieved through the rail's combined
flexure and tensile stiffness. The posts near the point of impact are
designed to break or tear away, thereby distributing the impact force
by beam action to adjacent posts. Systems G4(1W) through G9 resist impact
through the combined tensile and flexural stiffness of the rail and the
bending resistance of the posts. Note that the rail is blocked out from
the posts in these systems to minimize vehicle snagging and to reduce the
tendency for the vehicle to vault over the barrier. Block-outs are
suggested for a "strong post" roadside barrier system.
51

Note that the rail heights range from 27 inches (0.69 m) to 32
inches (0.81 m), with 27 inches (0.69 m) as the most common height.
Current roadside barrier heights have been established as a result of
many years of research and field evaluations. Visibility or the ability
to see over the barrier was one of the more important factors in early
barrier height considerations. A minimum height of approximately 27
inches (0.69 m) is a necessary, but not sufficient, condition to insure
proper barrier impact performance. The barrier must also be designed so
that upon impact the rail remains essentially at its original mounting
height. Note also that the post spacing for strong post systems, G4(1W)
through G9. is 6.25 feet (1.91 m). Tests have shown that this spacing
is needed for this type of system to minimize vehicle snagging or pocketing.
The degree to which the operational systems satisfy the recommended
structural and safety criteria of Section II-B varies. All are considered
to be structurally adequate, although some obviously deflect more than
others. All do not satisfy the impact severity criteria, i.e., the
maximum vehicle acceleration criteria. However, the acceleration
criteria is tenuous and currently under review. Nonetheless, barriers
which minimize impact forces should receive strong consideration. The
barriers can only be evaluated in subjective terms with regard to the
post crash vehicle trajectory hazard since there are little objective
criteria. A vehicle rebounded back into the traffic lanes may present
a hazard to other drivers. Ideally, a vehicle should redirect parallel
to the barrier.
Two means of measuring post impact vehicle trajectory are the exit
angle after impact and rebound distance (distance from the original
roadside barrier line to the maximum outermost point which the vehicle
52
travels during the post impact trajectory). Current vehicle trajectory
hazard criteria states: "after impact, the vehicle trajectory and final
stopping position shall intrude a minimum distance into adjacent traffic
lanes." The "minimum distance" suggested in the above standards is a
matter of judgment left to the design engineer. No maximum exit angle
has been established since the rebound distance is considered a more
meaningful trajectory parameter. However, since little data is available
for rebound distance, exit angle is normally used as the indicator of
trajectory hazard. An exit angle of 10° or less may be considered a
non-hazardous post impact trajectory.
It is important to note that the performance of a roadside barrier
is sensitive to a variety of conditions. The results of tests by two
different agencies on system G4(1S) are a good example. For the 25° impact,
two sets of data are shown in Table III-B-1 for this system. In one test,
a 4960 lb (2250 kg) vehicle struck the system at 66 mph (106.3 km/hr) and
caused a maximum dynamic deflection of 2.60 ft (0.79 m). In the other
test a 3813 lb (1729 kg) vehicle struck the system at 56.8 mph (91.4 km/hr)
and caused a maximum dynamic deflection of 4.05 ft (1.23 m). Thus, for
the same barrier system impacted essentially at the same angle, the
smaller, slower vehicle caused a much larger deflection than the heavier,
faster vehicle. Differences in the response are attributed to three im
portant parameters: the type of soil, the length of installation and
the end treatment. The barrier system with the smaller deflection was
considerably shorter, its ends had a positive anchorage system, and it
was located in a much stiffer soil, thus creating a much stiffer overall
system. Barriers installed in soft or yielding soil may require deeper
embedment of the posts and/or closer post spacing.
53
Another example of barrier sensitivity to details again concerns
the G4(1S) system. Note that a back-up plate is required between the
rail and intermediate posts (non-splice posts). Without this plate,
crash tests showed that the rail would tear and fail at the intermediate
posts, and the impact performance was therefore unacceptable. Studies
have been conducted to determine the sensitivity of roadside barriers
to parameters such as rail tension, soil properties, and post strength
and the reader is encouraged to review the results (.!§.}.
An effort has been made to standardize hardware for widely used
traffic barriers (22, Q). Standardization is beneficial in terms of
economy, improved availability of parts, readily available details and
specifications, reduced repair time, and reduced inventory of replacement
parts because of interchangeability of parts. Roadside barriers which
have been standardized are so noted in the last column of Table III-B-2.
The referenced standardized documents continue to be revised periodically
and the designer should obtain the latest publications.
III-B-2. Transitions
Transition sections are necessary to provide continuity of protection
when two different roadside barriers join, when a roadside barrier joins
another barrier system (such as a bridge rail), or when a roadside barrier
is attached to a rigid object (such as a bridge pier). The most common
use of transition occurs between approach roadside barriers and bridge
rail ends or bridge abutments.
Shown in Table III-B-3 are transition sections that are considered
operational. Transition systems that are not considered operational but
that have shown promising crash test results are presented in Appendix B.
54
Table III-B-3. Operational Roadside Barrier Transition Sections
.l _n ~~A. (G4 (IW)Roodtlde td'x !0" Rou~h D. F.
r> Barrier P~~'-4"Lf,~ ~~all Abutment, Brld~e rail Etc.
j., ~.:!Typ ·tt- 5~ould1r O:t'\' curb a loel Po31 St>aCing·
'~; 3'-1 ~2 " c. toe.
TRAFFiC Metric Conversions
I ft. r 0.30!5m ~ I in. 0 25.4 mm ,.. i' I mph= 1.61 kmlhr ITT , ..
~--~ , ..
I lb . . 0.4!54kg --JL_D a··xa" S4Sx v n~:~_:sx v 1'·2" O.f' t'·g" Block-.----leg"
Block------
---- ""'~~ "' (X!f'RougtiX-f] -~:-o" "!.'-o" 5·4 D.F. Post ~'-4"D.F. Pot!
SECTION A-A Typical poll soaclng•
6'<3" c. to c. SECTION B-B
SYSTEM T1 G4(HI)Jipproach Rail to Concrete Parapet
POST SPACING - as shown on sketch; POST TYPE - B"xfl" and lO"xlO" Douglas Fir; BEAM TYPE- steel "~!" section, 12 GA.; OFFSET BRACK-
BARRIER DESCRIPTION ETS - 8''x8" Douglas Fir block; MOlJNTJNGS - 1" diameter steel bolt; FOOTINGS - none.
IMPACT PERFORMANCE IMPACT ANGLE= 15° IMPACT ANGLE=25°
IMPACT CONDITIONS Speed (mph) NO TEST 58.8 Vehicle Weight{ lb.) 4297
BARRIER Dynamic Deflection (ft.) UNAV
VEHICLE ACCELERATIONS (G's)l Lateral 19.0 Longitudinal 8.8 Total UNAV
VEHICLE TRAJECTORY Exit An<,~le (de<,~.l UNAV Roll Angle (deg.) UNAV Pitch Allgle (deg.) UNAV
BARRIER DAMAGE UNAV
REFERENCES w
FIELD PERFORMANCE DATA2
NO
.
REMARKS Severe vehicle damage. System that was tested had no flare.
UNAV..: unavailable
,~0 mill I second average unl"" otherwl~e noted 2 rt available, see tummory In Appendix A
55
Table III-B-3. Operational Roadside Barrier Transition Sections (Continued)
48'-6" Measured alon front laee of rollin Exlalin rollin 0'-0" ' 10'-0"• 30'-o" 8'-4" ,.,_,_,
·~ ,.......---eR2 Brld~t Rail
r; I'Y . ..,~ :: :: -'!<>" :: "<"' "-.:'·;:t.rt~O~YP• ' \j " ralllno paropel wall
·~ (California Type9)
Mottrlc Conversions TANGENT ELEVAT!Q!L
I fl. • 0.30~m
~··~ ---t c_fl• 240' L6R2 Brid~e Rail I lo. .. 2!5.4mm
I mph• 1.61 km/hr '*' <lJ ~rr - rr-j
I lb .• 0.4-Mkg ~ TrO"ifu ,. PLAN
--~ . 2'-3"
1'-6" -
:,·-, SECTION A-A 1: ~~ .. --i;.J __ 3~~o"
:L_l] 6
SYSTEM T2 Tubular Approach Ra i 1 to BR2 Bridge Rail
POST SPACING- 10'10"; POST TYPE- W6x25, steel; BEAM TYPE -TS6"x2"x0.25" steel tubing; OFFSET BRACKETS - none; MOUNTINGS -
BARRIER DESCRIPTION two 3/4" diameter steel studs; FOOTINGS - 18" diameter, 36" concrete.
IMPACT PERFORMANCE IMPACT ANGLE= 15° IMPACT ANGLE= 26"
IMPACT CONDITIONS Speed (mph) NO TEST 60.0 Velllele We lght (lb.) 4540
BARRIER Oynomie Deflection (ft.) 0.23
VEHIQ.£ ACCELERATIONS (G'I)1
Lateral UNAV Longitudin(ll UNAV Totol UNAV
VEHICLE TRAJECTORY Exit AnQie (deg.) 13 Roll Anole {deg.) >5 Pitch Angle (deg.) >0
BARRIER DAMAGE 3 rail sections and 1 post
REFERENCES 24
FIELD PERFORMANCE OATA2 NO
Smooth redirection. Vehicle damage moderate with substantial REMARKS sheet metal deformation.
UNAV- unavailable 1 ~0 mill i eecond overage unless otherwise noted 2 rt ova liable, see 1ummary In Appendix A
56
Table III-B-3. Operational Roadside Barrier Transition Sections (Continued)
Metric Conversions
1ft. E o.~~m I in." 2!5.4mm I mph" 1.61 km/hr I lb. "0.4~kg
SYSTEM
BARRIER DESCRIPTION
IMPACT PERFORMANCE
IMPACT CONDITIONS S.,eed {mph) Vehicle- WeiQht (lb.)
BARRIER Oynomic Deflection (ft.)
VEHICLE ACCELERATIONS (G'sJ1
Lateral Longitudinol Tot Ill
VEHICLE TRAJECTORY £)(if Angle (deg.) Roll Angle (deg.) Pitch Aogle (deg.)
BARRIER DAMAGE
REFERENCES
FIELD PERFORMANCE DATA2
REMARKS
UNAV- unavailable
_t:;:;:r ~ 1/2"
""I:y:l:J' ,,. 5/16- , ~a~
-,- !-'2-~-~ 3/4"
1'-o\"
p-- 1'-o~"
SECTION 8-B
';.· f
2'-3"
3'-0" MIN-
T3 GE3 Approach Rail to BRS Bridge Rail
POST SPACING - as shown on sketch; POST TYPE - 5~"x71,;" H section aluminum; BEAM TYPE- two standard aluminum extrusions; OFFSET BRACKETS- none; -MOUNTINGS- standard hardware; FOOTINGS - 110ne.
IMPACT ANGLE=IS"
NO TEST
NO
IMPACT ANGL.E=-23Q
58.0 3965
1.4
7.8 6. 6 UNAV
20 UNAV UNAV
2 sections of rail and 3 posts
25
Some vehicle snagging. First post of bridge rail was taken out by impact.
1 ~0 mil It .second average unles• otherwise noted 2 rt available, ••• summary In Appendix A
57
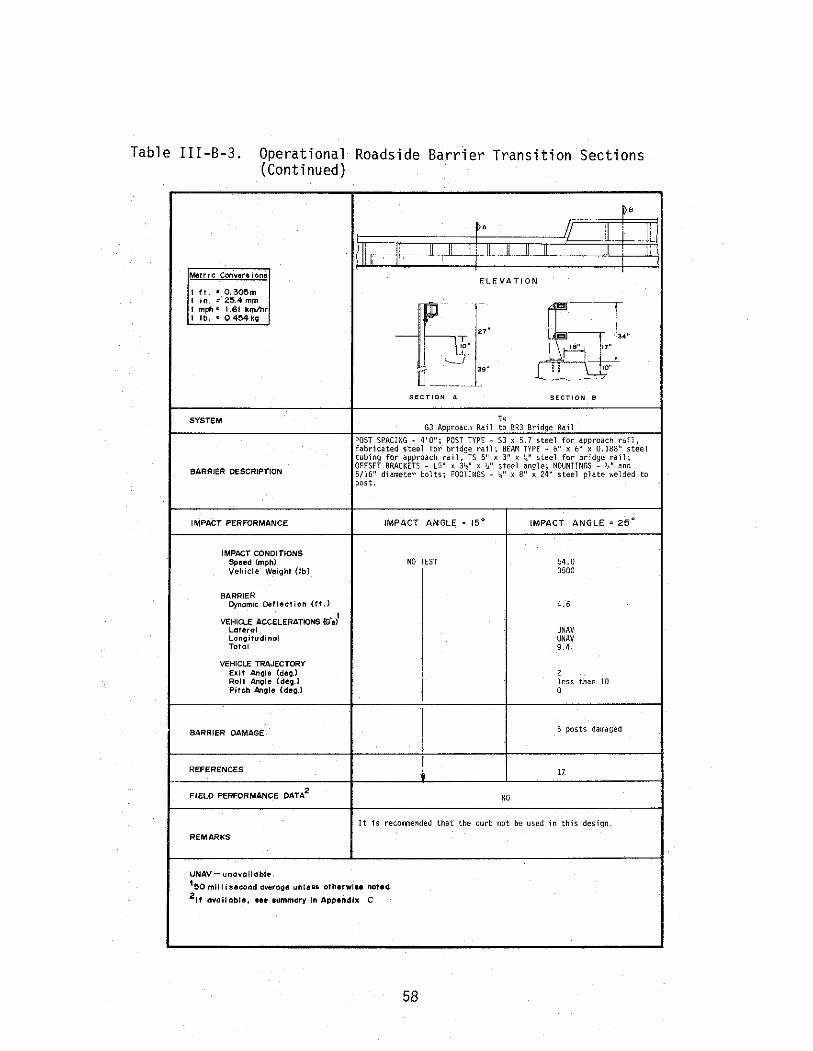
Table III-B-3. Operational Roadside Barr1er Transition Sections (Continued)
r II I /llr, c-£ 1LS.tt f II ] [[ ]__I I
Metric Coriver•iona ELEVATION
I ft. • 0.3®m I in. " 2!5.4 mm
~}r:. JJ I mph~ 1.61 kmlhr I lb. ~ 0.4!54kQ
34"
o"
t i[J --- -- - - -------SECTION A SECTION '
SYSTEM T4 GJ Approaci1 Rail to BRJ Bridge Rail
POST SPACING· 4'0"; POST TYPE -53 x 5.7 steel for approach rail, fabricated steel for bridge rail; BEAM TYPE- 6" x 6" x 0.188" steel tllbing for approach rail, TS 5" x 3" x !4" steel for bridge rail;
BARRIER DESCRIPTION OFFSET BRACKETS - l5" x 31:;" x !4" steel angle; MOUNTINGS - \;" and 5/16" diameter bolts; FOOTINGS - '4" x 8" x 24" steel plate welded to post.
IMPACT PERFORMANCE IMPACT ANGLE; " 15° IMPACT ANGLE" 25"
IMPACT CONDITIONS Sp11ed (mph) NO TEST 54.0 Vehicle Weight (lb) 3500
BARRIER Dynamic Deflection {ft ) 4.6
I VEHICLE ACCELERATIONS (G's)
Lateral UNAV Longifl.ldinol UNAV Total 9.4
VEHICLE TRAJECTORY Exit Angle {deo.J 2 Roll Angle (de'll.l less than 10 Pitch Angle (deo.l 0 .
BARRIER ·DAMAGE 5 posts damaged
.
REFERENCES 17 --
FIELD PERFORMANCE OATA2
NO
It 1 s recoJOOiended that the curb not be used in this design.
REMARKS
UNAV- unovallobh~ 1!50 millisecond averoge unless otherwise noted 2 rt available, see summary In Appendix c
58

Supporting crash test data for all transition sections is contained in
Table C-5 of Appendix C.
shown.
Several comments are necessary with regard to the transitions
(1) The Tl system is adaptable to other roadside barrier
transition problems. See example in Section II-F-2.
{2) While the T2 transition itself is considered operational,
means other than that shown should be sought to terminate
the approach rail.
{3) The operational status of the T3 system should be "qualified"
in that the GE3 approach barrier (described in Appendix B) is
an experimental system.
It can be seen that more research, development, and testing of transition
sections is needed. The problem is compounded by the existence of a
large number of bridge rail types. Due to the lack of a wide range of
operational transition sections, the highway engineer must often design
and install transition sections without the benefit of crash tests. In
such cases, the engineer should follow closely the guidelines presented
herein.
Impact performance requirements of roadside transitions are
essentially the same as those for the standard section of a roadside
barrier. Special emphasis must be placed on the avoidance of designs
which may cause vehicle snagging or excessive deflection of the tran
sition. Such actions can lead to impact with the bridge end or other un
acceptable results. Structural details of special importance are as
follows: 59
(a) The approach rail-to-bridge rail splice should develop the
full tensile and flexure strength of the approach rail.
(b) The approach rail-to-bridge rail or bridge parapet connection
should be flared or sloped so that an errant vehicle from the
opposing lane (of a two-way bridge) will not snag on the
connection. In this regard, the standardized te!'minaZ con
nector (22), sometimes referred to as the "Michigan end shoe",
is suggested for attaching approach W-beam rail to bridge
parapets and to structurally compatible bridge rails. An
example of the use of the terminal connector is shown in the
TR2 system, Appendix B, Table B-10. Another effective rail-to
parapet connection can be achieved by providing a recessed
area in the parapet wall to receive the rail. This is illus
trated in Figure III-B-2. Other potential connections and
transitions are shown in the last part of NCHRP 129 {39).
Continuity can also be achieved by continuing the approach rail
through the structure.
(c) Strong post systems must be used on transitions to rigid bridge
rails or parapets or rigid objects. Such systems must be
blocked-out to prevent vehicle snagging on the posts. However,
block-outs alone may not be sufficient to prevent snagging
at the section just upstream of the rigid bridge rail or
parapet. A rub rail may be desirable in some designs using
the standard W-beam or box beam. Rub rails are especially
needed when the approach rail is terminated in a recessed area
of the parapet. The rub rail should also be terminated in
60
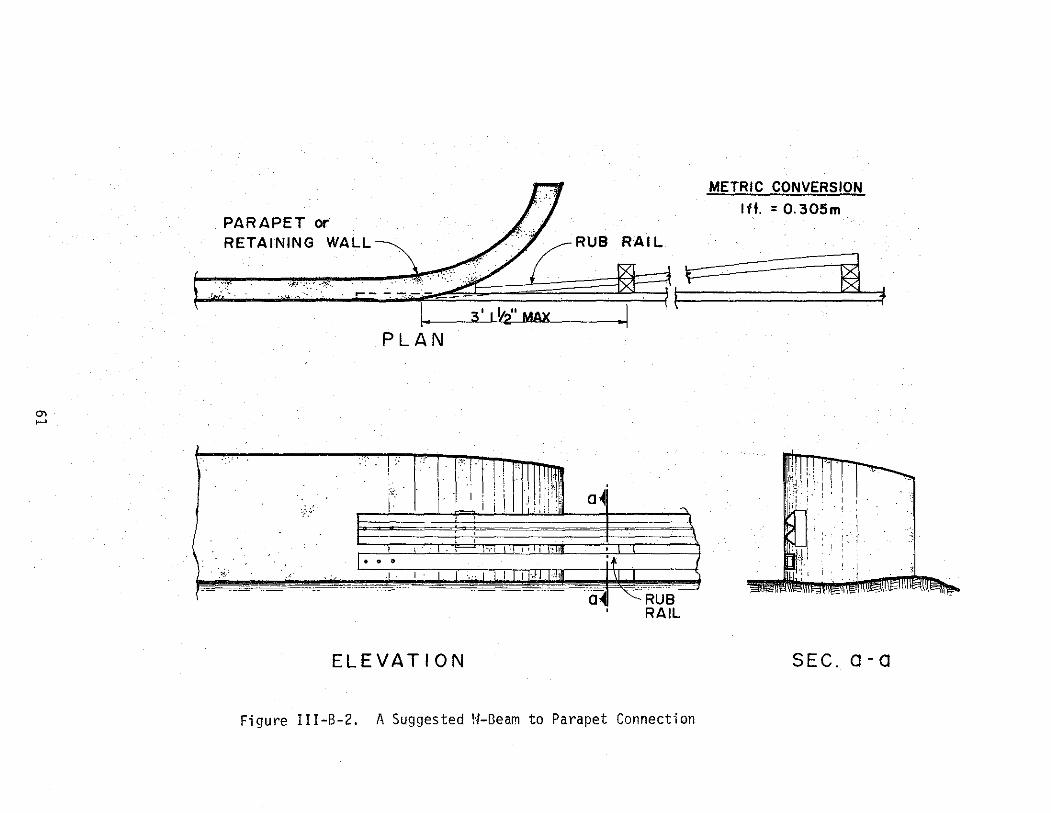
0> ,__.
PARAPET or RETAINING WALL
a .·· ~·~~ J i'~ ''·'"" -- -::--· - I II AX ~ : ./ . ' :. . ~ . . .. I ' I Y2 M J :-.-·. . • ····- 3
PLAN
-~ ,.-' ·"'·n~-
1
. ' . . .. ! ! ;!
. i :
I i i I -~-- .
I
RUB RAIL
a~ ~
-..·i \·\I' I i \"•\1\t I
\ .. ,, ) ...
I
I· • ;:t T+ . :.-. I I I 11-.11 1-•lo
-- --- ·-·''0'''··.·· 0 RUB ' RAIL
ELEVATION
Figure III-B-2. A Suggested H-13eam to Parapet Connection
METRIC CONVERSION
Iff. =0.305m
~ +
SEC. a- a
~
the recessed area as illustrated in Figure III-B-2. The curved
end of the parapet or retaining wall is desirable to further
minimize the possibility of vehicle snagging. The designer
is also encouraged to investigate the potential use of the
thrie beam system (Gg) for transition sections. Tests have
shown that the thrie beam performs well as a transition rail
(see TR4, Appendix B, Table B-10). Although there is no opera
tional end treatment for the G9 system, solution to this limi
tation appears near.
(d) The length of the transition should be such that significant
changes in the lateral stiffness do not occur within a short
distance. It is suggested that the transition length be
approximately 25 feet (7.6 m) at a minimum.
(e) The stiffness of the transition should increase smoothly and
continuously from the weaker to the stronger system. This is
usually accomplished by decreasing the post spacing and/or
decreasing the post spacing and increasing the post size.
(f) The flare rate and lateral placement of a transition should
adhere to the guidelines presented in Section III-E.
Design loads for roadside barriers are difficult to determine due
to the number and complexity of variables involved. Nonetheless, the
engineer is sometimes faced with the problem of designing a barrier
element such as a transition section. NCHRP Report 115 (18) summarized
available longitudinal barrier computer programs and analytical procedures
used to investigate vehicle impacts, and presented an evaluation of each.
The reader is encouraged to investigate these and other appropriate
62
analytical models for possible application. As an aid in the design,
a procedure for estimating the impact loads on a longitudinal barrier
is presented in Appendix G. Although this procedure over-simplifies
the actual vehicle-barrier interaction, it provides reasonable results
and it is easy to use. In the absence of more accurate means, this
procedure can be used.
III-B-3. End Treatment
An untreated end of a roadside barrier is extremely hazardous if
impacted, since the beam of the system tends to penetrate the passenger
compartment and will generally stop the vehicle abruptly. A crashworthy
end treatment is therefore recommended if the barrier terminates within
the "clear distance". As shown in Figure III-B-1, both an upstream
terminal and a downstream terminal must be considered. The clear distance
for the upstream terminal is dependent on the adjacent traffic and the
clear distance for the downstream terminal is dependent on the opposing
traffic. However, for most divided highways a crashworthy terminal for
the downstream end would not be warranted. Reference should be made to
Section III-E-4 for a further discussion of this subject.
To be crashworthy, the end treatment should not spear, vault,
or roll the vehicle for head-on or "nose" impacts. Vehicle accelera
tions should not exceed the recommended limits. For impacts between
the end and the standard section, the end treatment should have the
same redirectional characteristics as the standard roadside barrier,
which means that the end must be properly anchored. The end treatment
must be capable of developing the full tensile strength of the standard
63
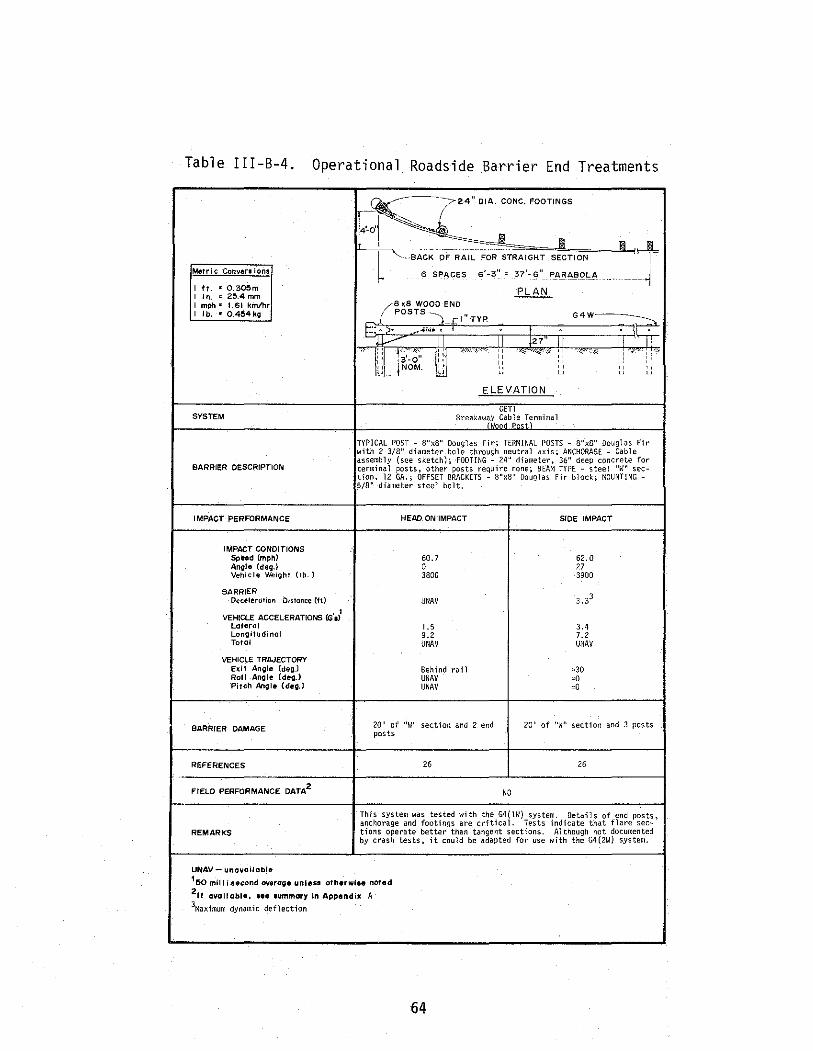
Table III-B-4. Operational Roadside _Barrier End Treatments
. ---724" DIA. CONC. FOOTINGS -
4'-o"l ~ ~ Ill ~ II! ' ·--- '+ l -·-BACK OF RAIL FOR STRAIGHT SECTION
Metric Conver'• ions 6 SPfi.CES s'-3': = _37'- §" P~_B~_EI_Q~ -~ -· - ---
I "- ~ o.3oam PLAN I in. ., 25.4 mm I mph • 1.61 km/hr /8 ~a WOOD END I lb. • 0.4~4 kg _j POSTS}_ ., G4W~ .r I TYP.
~:·- . -·· ,; ... -· ~ II II j27
" r · r ' i!j " ~ '" ,, ,,·_""
" .
" ,,
, i •3'-o" " " " ,, :! ., " '•
'' ~OM. " ~: " ~ ~ " ''·- " " " ELEVATION
GETl SYSTEM Breaka11nr Cab~; J~rminal
TYPICAL POST- 8"x8" Douglas Fir; TERMINAL POSTS- 8"x8" Douglas Fir with 2 3/8'' diameter hole through neutral axis; ANCHORAGE - Cable
BARRIER DESCRIPTION assembly (s!.!e sketch); ·FOOTING - 24" diameter, 36" deep concrete for terminal posts, other posts require none; BEAr~ TYPE- steel "W" sec-tion. 12 GA.; OFFSET BRACKETS - 8"x8" Douglas Fir block; 110UNTING -5/B" diameter steel bolt.
IMPACT PERFORMANCE HEAD ON'IMPACT SIDE IMPACT
IMPACT CONDITIONS Speed (mph) 60.7 62.0 Anole (deq.) 0 27 Vehicle We1ght (lb ) 3800 3900
BARRIER 3. 33 Decelerotion Distan~ (ft.) UNAV
VEHICLE ACCELERATIONS (G's)1
Lateral 1.5 3. 4 Lon'oiludinol 9.2 7. 2 Total UNAV UNAV
VEHICLE TRAJECTORY Exit Angle (de;.l Behind rail ~30 Roll Angle (de;.) UNAV "' Pitch Angle (deo.J UNAV "'
BARRIER DAMAGE 20' of "W" section and 2 end 20' of "W" section and 3 posts posts
REFERENCES 26 26
FIELD PERFORMANCE DATA2
NO
This system was tested with the G4(1W) system. Details of end posts, Tests indicate that flare sec-anchorage and footings are critical.
REMARKS .
tions operate better than tangent sections. Although not documented by crash tests, it could be adapted for use with the G4(2W) system .
UNAV- unavailable 150 mil I isecond 0\lerage unres• otherwile noted 2 u available, see summary In Appendi)l A 3Maximum dynamic deflection
64
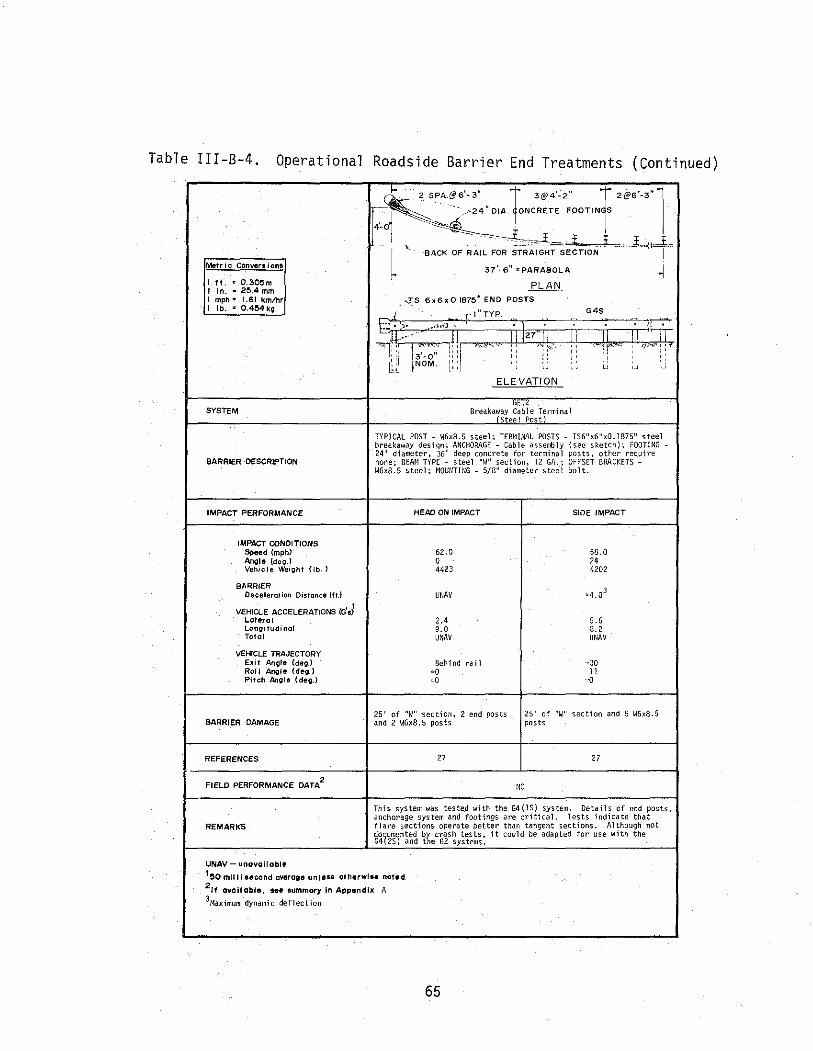
Tab 1 e I II-B-4. Operational Roadside Barrier End Treatments (Continued)
~3@4'-2' f 2@6'-3''-l
--~
1 NCRETE FOOTIN S
4- - •• --1_ _f_ t - " - --·· J.,, f .. l BACK OF RAIL FOR STRAIGHT SECTION
Metric Conversions 37'-6" ~PARABOLA ~ I ft. c 0.305m PLAN I in.= 25.4mm I mph= 1.61 km/hr ,Ts 6x6x0.1875" END POSTS I I b. " 0.454 kg J ci"TYP. G4S
~:::- . ·-~'''} 0
~li_-'' • IIJ27 II II II l' 1 '! -- , •. -. " rr '·' " ' '' 'I '' " :: !3'-o" ::: " " ::
" " [;_~ !NOM. ·I'" ,, " u ,. ·~
ELEVATION
SYSTEM ~E.'~
Break~~~b~~slf'mina 1
TYPICAL POST - W6x8.5 steel; TERmNAL POSTS - TS6"x6"x0.1875" steel breakaway design; ANCHORAGE - Cab 1 e a sserrb 1 y (see sketch); FOOTING 24" diameter, 36'' deep concrete for terminal posts, other require
-BARRIER DESCRIPTION nor~e; llEA'1 TYPE - steel "W" section, 12 GA.; OFFSET BRACKETS -
W6x8.5 steel; MOUNTING- 5/8" diameter steel bolt.
IMPACT PERFORMANCE HEAD ON IMPACT SIDE IMPACT
IMPACT CONDITIONS Speed (mph) 62.0 58.0 Angle Cde9.) 0 24 Vehicle Wei9hf {fb. l 4423 4202
BARRIER "4.0
3 Deceleration Distance (ft.l UNAV
VEHICLE ACCELERATIONS {G's~ Late-rol 2.4 5.5 Longitudinal 9. 0 0. 2 Toto I UNAV UNAV
VEHICLE TRAJECTORY Exit Angle (deg.) Behind rai 1 "30 Roll Angle {de-g.) •0 11 Pitch Angle (deg.) ~o -0
25' of "W" section, 2 end posts 25' of "W" section and 5 W6x8.5 BARRIER DAMAGE and 2 W6x8. 5 posts posts
REFERENCES 27 27
FIELD PERFORMANCE DATA2
NO
This system was tested with the G4 (IS) system. Details of end posts, anchorage system and footings are critical. Tests indicate that
REMARKS flare sections operate better than tangent sections. Although not do1umented bt crash tests, it could be adapted for use with the G4 2S) and t e G2 systems.
UNAV- unovoiloble' 1!50 mil 1 i second average unless otherwise noted 2 !f available, 11111 summary In Appendix A 3Maximum dynamic deflection
65
rail element, whether a crashworthy end treatment is warranted or not.
Shown in Table III-B-4 are the two operational end treatments.
Both systems are similar with the exception of the type of support post
and the breakaway mechanism. As indicated on the form, the GETl system
is designed for terminating the G4(1W) roadside barrier but it could be
adapted for use with the G4(2W) system. Similarly, the GET2 system is
designed for the G4(1S) and G4(2S) systems but it could be adapted for
use with the G2 system. In both of these systems, the "1 ength of need"
(see Section III-E) can be considered to begin at the third post from
the end. It should be noted that at the time of this writing further
refinements and modifications are being made to the GETl and GET2 systems.
The reader should contact the NCHRP for information on these developments.
Table C-6 in Appendix C contains a summary of all crash test data avail
able for end treatments. Although not shown, an inertia type crash
cushion (see Section VI-B) could also be used to shield an untreated
barrier end.
If possible, terminating and anchoring the roadside barrier in a
backsl ope provides an excellent end treatment. In such cases, the
approach rail should not violate the placement recommendations made in
Sections III-B-3 and III-B-4.
III-C. Maintenance Characteristics
Table III-C-1 contains a number of maintenance factors which should
be considered before selecting a roadside barrier system. The factors
are grouped in one of four categories: collision maintenance, routine
maintenance, environmental conditions, and material and storage require-
ments. 66
TABLE III-C-1. Maintenance Factors Influencing Roadside Barrier Selection
CATEGORY
A. Collision Maintenance
B. Routine Maintenance
C. Environmental Conditions
D. Material and Storage Requirements
.
61
CONSIDERATIONS
1. Typical crew size
2. Typical man-hours to repair (exposure)
3. Typical barrier damage
4. Special equipment
5. Ability of rail to be repaired or straightened
6. Salvage value
7. Level of working knowledge
1. Cleaning and painting
2. Mowing and Clearing vegetation
1. Snow or sand drifting
2. Snow or sand removal
3. Weathering or corrosion due to environment or chemica 1 effects
1. Dependence on a number of parts
2. Availability of parts
3. Storage facilities required
Collision maintenance concerns the activities required as a
result of vehicle impacts. Such activities should play an important
role in the selection of a barrier system since the majority of
maintenance costs are usually due to collision repairs.
The number of impacts that will occur over any given length of
barrier will depend on a number of factors, such as traffic volume, road
way alignment, distance barrier is off traveled way, etc. Chapter VII
describes a method by which an estimate of the number of impacts can
be made. It may be assumed, however, that the number of impacts is
independent of the barrier selected, provided the lateral placement is
the same for all systems considered. This assumption implies that deli
neation by a roadside barrier has negligible effect on impact frequency,
something which has yet to be substantiated.
The extent of barrier damage for given impact conditions will
depend on the strength of the barrier. Where available, the tables in
Section B of this chapter give the barrier damage as a result of a crash
test for specific impact conditions. To supplement these data, a gross
survey was made of several states to determine typical collision repair
values experienced. Table III-C-2 summarizes the available field data.
It should be remembered that these a-re average values needed to repair
a damaged section and not average values based on all hits. Many hits
are only brushes and cause no appreciable barrier damage.
Information in Table III-C-2 was taken from both urban and rural
areas. However, the data did not permit a differentiation between the
two. It is speculated that the majority of the impacts with roadside
barriers occur in urban areas where traffic densities are high. More
68

"' <0
Table III-C-2. Collision Repair Data for Roadside Barriers. 1
Typical Average Typical Material Reoaired or Reolaced Refurbishment Time
System Crew Size Rail_(ft.) Posts (Man-Hours/Foot of Rail)
Gl-Cable Guardrail UNAV 112 8 0.30
G2-W-Beam on Steel Weak Posts UNAV 45 4 0.33
G3-Box Beam 5-6 32 5 0.92
G4(1W)- Blocked Out W-Beam on Wood
Posts 4 35 4 0.35
G4(1S)-Blocked Out 1~-Beam on Steel
Posts 3-4 38 4-5 0.32
1No data available for G4(2W), G4(2S), and G9 systems.
manpower is usually needed for traffic control purposes in urban areas
than rural areas. In this regard, the hazard to both the motorists and
the crew during repairs should be a major concern. Operating speeds
for the roadways are unknown but it is probable that the data came
primarily from high speed facilities.
Another important consideration in collision maintenance is the
ability of the rail element, and possibly the post, to be straightened
or repaired. Savings may be realized if the rail can be straightened.
For example, one state reports that it straightens W-beam for less than
10 percent of its original cost. In some cases, the rail will be damaged
beyond repair. In such cases, the sa 1 vage value of the rai 1 is an im
portant consideration.
The degree of expertise or the level of working knowledge of the
system by the repair crew should be considered. Some systems require
greater attention to details than others. A proven system installed or
maintained improperly can be of little value.
Two items of consideration are listed under the routine maintenance
category. In most cases, however, there would not be appreciable differences
in these maintenance tasks for the operational systems.
Environmental factors may be important to consider in the selection
process. Barriers with considerable frontage area may contribute to
drifting of snow and sand. Snow plow operators should be cautioned against
running the blade next to the face of roadside barriers. Experience has
shown that this will tear the rail, loosen mounting hardware and loosen
posts. Snow loads piled on top of the barrier may also cause damage as
the snow settles and consolidates.
70

Before selecting a barrier system, an effort should be made to
determine the future availability of the materials needed and their
storage requirements. The need for the stocking of spare parts increases
as a function of the number of parts in the barrier. In this regard,
strong consideration should be given to use of barrier systems whose
hardware has been standardized(~, 23). Reference should be made to
Section III-B-1 for further information about standardization.
III-D. Selection Guidelines
Once it has been determined that a barrier system is warranted,
a selection must be made. Although the process is complicated by the
number of variables and the lack of objective criteria, there are guide
lines which should be followed. In general, the most desirable system is
one that offers the best protection at the least cost, and is consistent
with the given constraints. Table III-D-1 presents eight items which
should be considered before a selection is made. Although these items
are not necessarily listed in order of importance, the deflection, strength,
and safety requirements should never be compromised.
Section B of this chapter discusses the deflection, strength, and
safety aspects of roadside barriers. It also presents the deflection,
strength, and safety characteristics of the operational roadside barriers.
Maintenance factors which should influence barrier selection are
discussed in Section C of this chapter. Available maintenance data on
the operational systems are also presented there. A special point of
interest in maintenance concerns the availability of replacement parts.
Recent shortages in some barrier hardware has pointed to the need for
71
Table III-D-1 .. Selection Criteria For Roadside Barriers
ITEM
A. Deflection
B. Strength and Safety
C. Maintenance
D. Compatibility
E. Costs
F. Fie 1 d Experience
G. Aesthetics
H. Promising New Desi:gns
CONSIDERATIONS
1. Space available behind barrier must be adequate to permit dynamic deflection of barriers.
1. System sh.ould contain and redirect vehicle at design condi-tions. ·
2. System sl)ould be least hazardous .available, consistent with costs and other cons i derations.
1. Co 1 li s.i on maintenance.
2. Routine maintenance.
3. Environmental conditions.
1. Can system be transitioned to other barrier systems?
2. Can system be terminated properly?
1. Initial costs.
2. Maintenance costs.
3. Accident costs to motorist.
1. Documented evidence of barrier's performance in the field.
1. Barrier should have a pleasing appearance.
1. It may be desirable to install new systems on an experimental basis.
72
·.

advance planning and alternate hardware. Before selecting a system,
material suppliers should give some assurance of future availability.
Reference should be made to the discussion of standardization in Section
III-B-1.
Compatibility is a very important item that should be considered
in the selection process. Two major deficiencies of many roadside
barriers are the absence of crashworthy transitions to other barriers
(usually bridge rails), and the absence of crashworthy end or terminal
treatments. Section B of this chapter addresses these problems and
presents the operational transitions and terminal designs.
Initial costs and future maintenance costs in particular should be
carefully evaluated. As a general rule, the initial cost of a system
increases as a rigidity or strength increases but the maintenance costs
usually decrease with increased strength. Also, the degree of hazard
the barrier poses to the motorist may increase as the rigidity increases.
Consideration should be given to the costs incurred by the motorist as a
result of collision with the barrier. Both damage costs to the vehicle
and injury costs to the occupants need to be evaluated for a typical
collision. The decision may ultimately involve the question of what
level of protection the state or agency is able to provide. The pro
cedure presented in Chapter VII should provide a means with which to
approach this question.
Item F in Table III-D-1 concerns field experience. There is no
substitute for documented proof of a barrier's field performance. In
this regard, the impact performance data for each operational system as
presented in Section B of this chapter indicates the availability of
field data. If none exists, the state or states which developed and/or
73
implemented the system should be contacted for data and their views and
comments.
With .regard to aesthetics, the barrier should have a pleasing
appearance. In scenic areas, it may be appropriate to select a barrier
which allows the motorist the largest field of view possible. However,
under no circumstances should .aesthetics justify a compromise in the
crashworthiness of the selection.
Many of the experimental systems included in Appendix B exhibit
excellent impact performance characteristics. The designer should give
serio.us consideration to the installation of some of these barriers, at
least on an experimental basis. The performance of the barrier should
be monitored and if proven satisfactory it may be installed on a perma
nent basis.
III-E. Placement Recommendations
Major factors to consider in the lateral placement of a ro.adside
barrier are:
(1) uniform clearance and distance between barrier and hazard
being shielded;
(2) effects of terrain between edge of traveled way and the
barrier on the errant vehicle's trajectory;
(3) probability of impact w.ith b.Q;rrier as a function of its
distance off the traveled way;
(4) flare rate and length of need of transitions and approach
barriers; and
(5) slow moving vehicles on. the shoulder o.f the roadway.
74
A discussion of each of these factors and the available criteria
related thereto follows.
III-E-1. Uniform Clearance and Distance Between Barrier and Hazard
A highly desirable characteristic of any roadway is that it have
shoulders of constant width, whether it is in a cut, fill, or on a
structure. Uniform clearance to bridge rails or parapets, retaining
walls, abutments, and roadside barriers is also desirable, especially
in urban areas where there is a preponderance of such elements. Such
an alignment of these elements enhances highway safety by reducing driver
reaction and concerns for those objects and by reducing the probabil i:ty
of vehicle snagging. However, care must be exercised to insure proper
transition designs where the roadside barrier connects with one of these
other features. Care must also be exercised to insure a proper barrier
to-hazard distance, as discussed in subsequent paragraphs.
Where a roadside barrier is needed to shield an isolated hazard,
adherence to the uniform clearance criteria is not essential. It is
more important in such cases that the barrier be located as far from
the traveled way as conditions permit (see Section III-E-2). However,
gaps less than approximately 200 feet (61 m) between barrier installa
tions are to be avoided. In such cases, the barrier should be continued
at a constant distance from the traveled way until all hazards are
shielded.
The amount a barrier will deflect upon impact is a critical factor
in its placement, especially if the hazard being shielded is a rigid
object. Figure III-E-1 illustrates the two basic types of roadside
75
Barrier -to- Ha2;ard Distance
(a) Rigid Object Protection
(b) Embankment Protectio.n
METRIC CONVERSION: 1ft = 0.305m
FIGURE :m-E-1 Barrier- to- Hazard Distance for Roadside Protection
76

configurations of concern. If the hazard being shielded is a rigid
object, the barrier-to-hazard distance should be sufficient to avoid
snagging by the vehicle on the rigid object. If the hazard is a drop
off or a steep embankment, the barrier-to-hazard distance should be
sufficient to prevent the wheels from dropping and thus causing the
vehicle to roll excessively. However, limited test results (1Z)
indicate that the barrier-to-hazard distance for embankments is not as
critical as it is for rigid objects. A 2 ft (0.61 m) minimum distance
is desirable as shown in Figure III-E-1 (b). This minimum distance is
also needed to insure adequate lateral soil resistance for the posts
during impact.
Deflection characteristics for the operational roadside systems are
given in Section B of this chapter and in Appendix B for the experimental
systems. The barrier-to-hazard distance for rigid objects should not
be less than the dynamic deflection of the barrier for impact by a full
size automobile at impact conditions of approximately 25 degrees and
60 mph (96.5 km/hr).
In some cases, the available space between the barrier and the
hazard may not be adequate. In such cases, the barrier should be
stiffened in the area of the hazard. This will involve a transition
section, usually flared. The designer should refer to Section III-B-2
for structural design criteria and to Section III-E-4 for flare rate
criteria.
III-E-2. Probability of Impact
As a general rule, a roadside barrier should be placed as far
from the traveled way as conditions permit. As such, the probability
77
of impact will be minimized. However, the lateral placement should
not violate the requirements of Sections III-E-1, Ili-E-3, .and lli-E-4
of this chapter.
III-E-3. Terrain Effects
Terra in conditions between the traveled way and the barrier can
have significant effects on the barrier '.s impact performance. Curbs
and sloped roadsides are two prominent features Which deserve special
attention. A vehicle which traverses one of these features prior to
impact may go over the barri.er or submarine under the barrier or snag
on its suppor·t posts. Research .studies .have provided considerable
insight regarding the dynamic behavior of an automobile upon traversing
a curb or a slope. Automobile orientation (translation and angular
position) as a function of.distance.off the traveled way is now known
for a number of curbs and slopes for ·various encroachment conditions
(speed and angle of vehicle). Thus, the ·impact position of a car relative
to a given barrier, placed at a ·given lateral distance from the traveled
way, is now known for a variety of conditions. Background data, upon
which the criteria in this section are·based, are presented and discussed
in Appendix F.
Curbs- In general, it has been found that curbs offer no safety
benefits on •high-speed roadways from the standpoint of vehicle behavior
following .impact. It is therefore .suggested that a ourb, either used
alone or when plaoed in front of a roadside barrier, not be used for
purposes of redirecting errant vehioles. Although curbs may improve
delineation and drainage, it is suggested that other methods can be used
to achieve these functions.
78
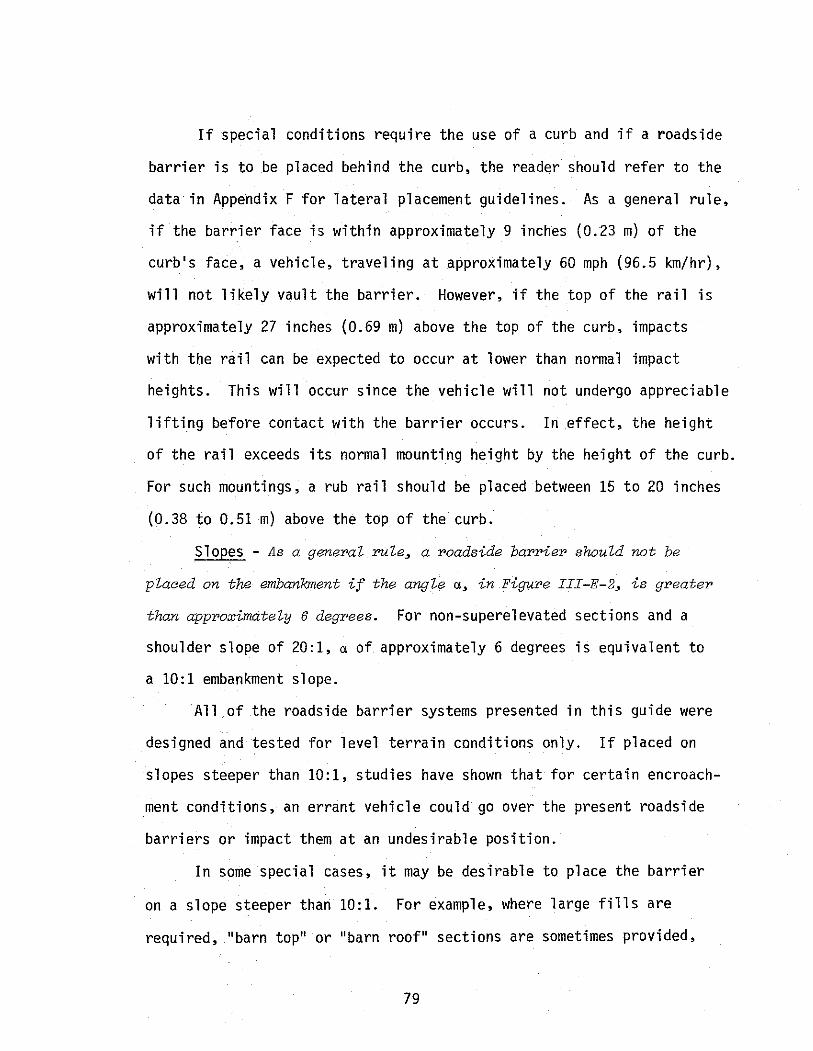
If special conditions require the use of a curb and if a roadside
barrier is to be placed behind the curb, the reader should refer to the
data in Appendix F for lateral placement guidelines. As a general rule,
if the barrier face is within approximately 9 inches (0.23 m) of the
curb's face, a vehicle, traveling at approximately 60 mph (96.5 km/hr),
will not likely vault the barrier. However, if the top of the rail is
approximately 27 inches (0.69 m) above the top of the curb, impacts
with the rail can be expected to occur at lower than normal impact
heights. This will occur since the vehicle will not undergo appreciable
lifting before contact with the barrier occurs. In effect, the height
of the rail exceeds its normal mounting height by the height of the curb.
For such mountings, a rub rail should be placed between 15 to 20 inches
(0.38 to 0.51 m) above the top of the curb.
Slopes - As a general rule, a roadside barrier should not be
placed on the embankment if the angle a, in Figure III-E-2, is greater
than approximately 6 degrees. For non-superelevated sections and a
shoulder slope of 20:1, a of approximately 6 degrees is equivalent to
a 10:1 embankment slope.
All of the roadside barrier systems presented in this guide were
designed and tested for level terrain conditions only. If placed on
slopes steeper than 10:1, studies have shown that for certain encroach
ment conditions, an errant vehicle could go over the present roadside
barriers or impact them at an undesirable position.
In some special cases, it may be desirable to place the barrier
on a slope steeper than 10:1. For example, where large fills are
required, "barn top" or "barn roof" sections are sometimes provided,
79
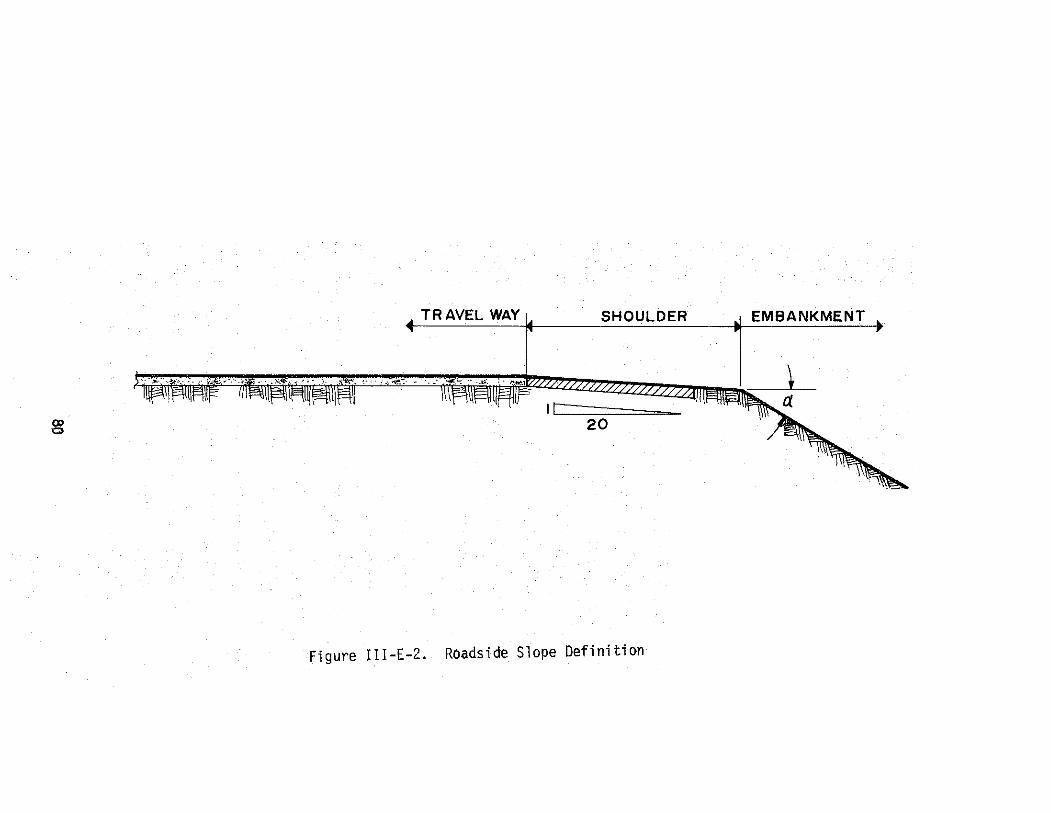
. ..... . •.?,~.- •. ,: f.~~:. ~ -.
< TRAVEL WAY r ,'.,--;.e.;.;_:. - .• _ •
SHOULDER .J EMBANKMENT ~
1 I ~ """'
II 8 20
Figure Ill-E-2. Roadside Slope Definition

as shown in Figure III-E-3. As a general rule, a barrier may be placed
on a 6:1 or flatter slope provided it is more than 12 feet (5. 66 m) from
the shoulder hinge point.
As discussed in Section III-A-1, slope rounding enhances the ability
of a driver to maintain control of an errant vehicle and it reduces the
potential for the vehicle to become airborne. When the shoulder-to-embank
ment hinge has "optimum" rounding, as defined in Figure I II -A-2, i.t may
be desirable to place the barrier on the embankment, provided the slope
is no steeper than 6:1.
III-E-4. Flare Rate and Length of Need
Figure III-E-4 illustrates the variables of interest in the layout
of an approach barrier to shield an area of concern. Length of need is
equal to the length of the area of concern parallel to the roadway, plus
the length of the approach barrier on the upstream side (and downstream
side if needed).
Ends of roadside barriers should be flared where possible. The
function of the flare is threefold: (1) to locate the barrier and
its terminal as far from the traveled way as is feasible, (2) to re
direct an errant vehicle without serious injuries to the occupants, and
(3) to minimize a driver's reaction to a hazard near the traveled way.
With regard to the latter function, it has been shown (l) that an object
(or barrier) which appears close to the traveled way may cause a driver
to shift laterally, slow down, or both. Such reactions are undesirable.
The flare should therefore be such that a driver does not perceive the
barrier as a hazard.
81
!\
!:I . !I
ii li II I
I
'
ii' I!.
!I
~~~ I. :>- i <(
31: 1
·. 0 'I ,,
~~: ·. LLI i' a::
..J ILLI LLI IO > !-l <( I~ a:: 10 1- I :I:
i i(f) i
I ;I
l 10 II ,,
l .J I .....
PLAN
ELEVATION
FIGURE 111-E-3. Roadside Barrier Location on Typical Barn Top Section.
82
co w
Lc
Clear Distance Line-
Area of Concern\ · (Hazard) r:-... ---
L1 I .,..------- I ; ; ; 1--
LH
See Figure .III-E- 5
X
a
LR
End of Barrier Need
be::::==-
Use Crashworthy Terminal
Shy Line
t i L3i L2i . EOP :=-,.... t :::;;;: I =rLs
.....,..~--Traffic ----------------- ---- --- ---- -----
FIGURE m.-E-4. Approach Barrier Layout Variables
If the flare rate is too steep, functions 2 and 3 may not bE'!
satisfied and if it is too flat functions 1 and 3 may not be satisfied.
A compromisE'! must therefore be made.
Table III-E-1 contai-ns the suggested runout length (LR), flare
rate (a:b), and shy line offset (L5) as a function of ADT and <!esign
speed. Shy li.ne offset is defined as a distance beyond which a road
side object will not be perceived by a driver (143). In other words,
a driver will not react to an object beyond the shy 1 i ne offset. If
possibl-e, the roadside ba:rrier shoul-d be pl-aced beyond the shy line
offset. Values in Table III-E-1 .were determined from an evaluation of
previous studies (16, 3, 41, 143) and engineering judgment. ----- ..
For roadways with operating speeds of approximately 60 mph
(96.5 km/h), clear distance (Lc) can be cletermined from Figure III-E-3.
Clear distance criteria for roadways with lower operating speeds have
not been established. In the absence of more objective data, the clear
distances given in Figure III-E-3 may be reduced proportionally to
the reduction in the runout length given in Table III-E-1, Le,, reduc
tions below a design speed of 60 mph (9!).5 km/h). For example, the
required clear distance for a 6:1 slope on a 40 mph (64.4 km/h) facility
with an ADT of 5000 would be computed as follows:
where
Lc (at 40 mph)
Lc (at 60 mph) =
LR (at .40 mph)
LR (at 60 fllph)
Lc(at 60 mph) = 50ft (15.2 m), from Figure III-A-3;
LR(at 40 mph) =220ft (!57.1 m), from Table III-E-1; and
84

Table III-E-1. Design Parameters for Roadside Barrier Layout
Traffic Volume (ADT) Over 6000 2000-6000 800-2000 Under 800
Operating Runout Runout Runout Runout Speed Length Length Length Length Shy Line, Flare (mph} LR{ft) LR(ft) LR(ft) LR(ft) Offset ( ft) Rate (a:b)
ffi 70 480 440 400 360 10.0 25: l
60 400 360 330 300 8.0 20: l
50 320 290 260 240 6.5 16: l .
40 240 220 200 180 5.0 14: l
---·--
Metric Conversions:
1 ft = 0. 305 m 1 mph = 1.61 km/h
Thus
or
LR(at 60 mph) = 360ft (109.7 m), from Table III-E-1.
Lc (at 40 mph)
50 = 220
360
Lc (at 40 mph) = 30.6 ft (9.3 m).
To determine the position (see Figure III-E-4) of the end of need,
the following equations apply:
X = LH +(~) (ll) - (L2) (III-E-1)
(+) + (~~)
(lii-E-2)
where,
LH = distance from edge of traveled way, commonly referred to as
edge of pavement (EOP), to the lateral extent of the hazard. Note that
LH should never exceed the "clear j:listance" (LC);
~ = slope of flare (see Figure III-E-4);
L1 = length of tangent section of barrier upstream from hazard.
When the approach barrier connects with a bridge parapet or bridge
rail, a tangent section, consisting of a transit.ion section, is commonly
used; 86

L2 = distance from EOP to tangent section of barrier; and
LR = runout length (see Figure III-E-4).
Note that the distance (L3-L2) should satisfy the criteria of Section
III-E-1.
Coordinates X andY will locate the end of need for the approach
barrier, however, to teminate the barrier properly, some type of
arashworthy end treatment should be used. If the end treatment permits
the vehicle to penetrate (such as the ETl or ET2 design described in
Section III-B-3), the end treatment should extend upstream from the point
defined by X andY. A vehicle should be redirected for contacts down
stream of the point defined by X andY. If the approach barrier is in
a cut section, it is desirable to terminate the barrier by anchoring it
in the back slope.
A parabolic layout of the frared section may also be used. If so,
the maximum slope of the curve should not exceed the suggested slopes
(flare rates) given in Table III-E-1.
It is noted that the flare rate of the end treatment or terminal
is permitted to exceed the suggested flare rates provided such rates are
essential for proper impact performance (as is the case for the ET1 and
ET2 systems).
Figure III-E-5 illustrates the layout variables of an approach
barrier for opposing traffic. The length of need and the end of the
barrier are determined by use of Equations III-E-1 and III-E-2, together
with the suggested values in Table III-E-1. However, note that all of
the lateral dimensions are with respect to the edge of the traveled way
of the opposing traffic. If there is a two-way divided roadway, the
87
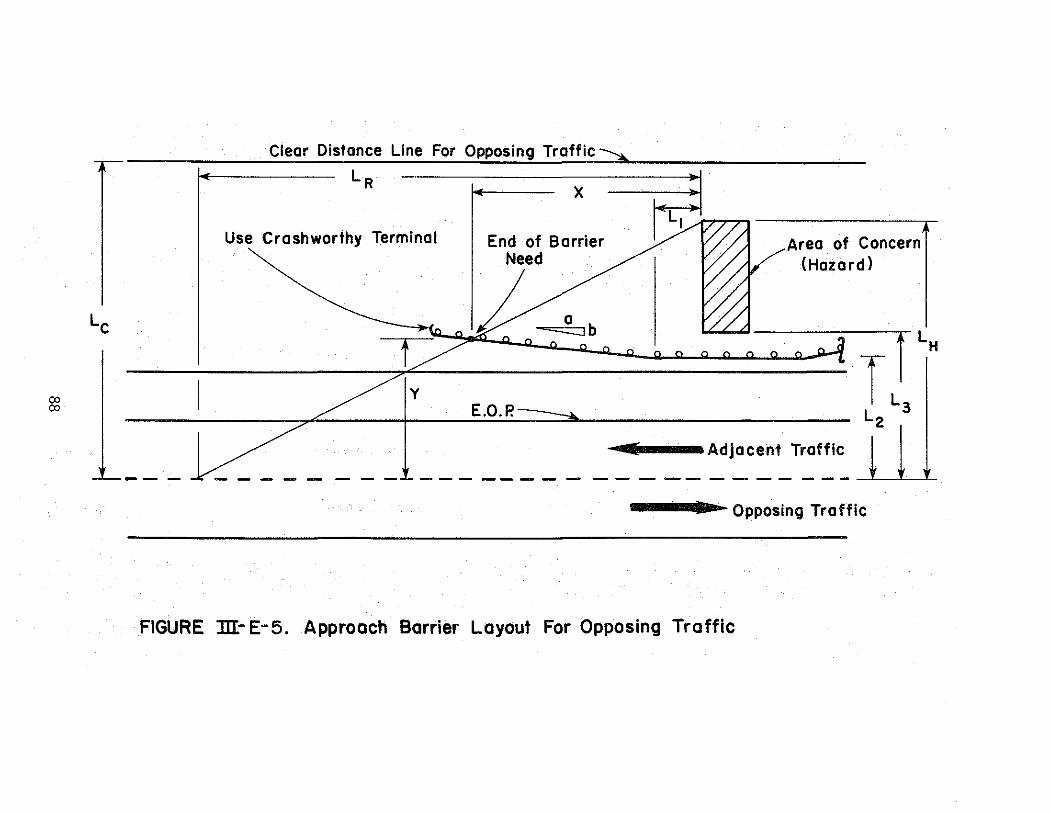
00 00
Lc
---
Clear Distance Line For Opposing Traffic-.....,._
LR
Use Crashworthy Terminal
G y
End of Barrier Need
/- ~ .• E.O.P.
Area of Concern (Hazard)
.....,.._ __ Adjacent Traffic
----------------------'!! ---•~opposing Traffic
FIGURE :m- E-5. Approach Barrier Layout For Opposing Traffic
edge of the traveled way for the opposing traffic would be the EOP on
the median side. There are three ranges of Lc which deserve special
attention for an approach barrier for opposing traffic:
(1) L3 < Lc ,:: LH In this case use LH = LC"
(2) Lz < Lc .,:: L3 In this case, no approach barrier is needed
(i.e., X= 0), but a crashworthy terminal is suggested.
(3) Lc ,:: L2 In this case, no approach barrier is needed and no
crashworthy terminal is needed.
The lateral placement of the approach rail should also satisfy the
criteria on embankment slopes in Section III-E-3. If the existing slope
is greater than 10:1, it is suggested that fill be provided to flatten
the slope to a 10:1, as illustrated in part A of Figure III-E-6. An
acceptable alternative is to flatten the slope of the flare so that the
embankment slope criteria is not violated, as illustrated in part B of
Figure III-E-6. Note that in the latter alternative, a slightly longer
length of approach barrier would be needed. In some cases, it may be
necessary to have no flare at all on the approach barrier.
III-E-5. Slow Moving Vehicles
In some areas, there is a significant number of slow moving vehicles,
primarily farm machinery, that travel on the shoulder of the roadway.
In these areas, consideration should be given to placing the barrier at
a lateral distance that will allow slow moving vehicles to travel on the
shoulder without obstructing the normal traffic, provided the placement
does not compromise the impact performance of the barrier.
89

Area of Concern
Flare Slope Meets Criteria in Tcble:DI.- E -I
(A) Destra ble
Area of Concern
Flare Slope Flatter Then Criteria in Table :DI-E-1
(8) Acceptable
End of Need
TRAFFIC
End of Need
10:1 Slope or Flatter
TRAFFIC
FIGURE JII.-E-6. Suggested Roadside Slopes For Approach Barriers
90
III-F. Upgrading Substandard Systems
III-F-l. Guidelines
Some existing roadside barriers are not necessary while others are
substandard and will not meet suggested performance levels. Substan
dard barriers usually fall into one of two categories, namely, those
that have structural inadequacies and those that are improperly located.
Figure III-F-1 presents an inspection procedure designed to identi
fy unnecessary or substandard barriers. It is suggested that this inspec
tion be conducted on a regularly scheduled basis. Personnel performing
this inspection should stay abreast of current traffic barrier standards
and guidelines as well as promising new research findings.
With regard to item 3, the criteria presented in Section III-B
should be used where possible to evaluate existing systems. Of course,
there is no substitute for field data or accident records to evaluate
the performance of a system. If a barrier system is judged substandard,
it is suggested that the barrier either be modified to conform to an
operational system, or be replaced by an operational system. It is
recognized that this action is not always feasible and other remedial
action must be taken. Table III-F-1 lists common structural inadequacies
that occur and the suggested remedial action. If the upgraded system
does not conform to an operational system, crash tests are suggested to
verify the design, especially if substantial use of the system is planned.
The criteria given in Section III-E should be used to evaluate the
adequacy of the lateral placement of existing barriers. If the barrier
is placed on an embankment, in a depressed median etc., it may not
91
1.
2.
3.
4.
5.
6.
7.
Figure III-F-l. Inspection Procedure for Existing Roadside Barriers
No I Is barrier warranted? Remove barrier
Yes I Can hazard be reduced Yes Eliminate or reduce or eliminated so that hazard and remove barrier is no 1 onger barrier needed?
No • No 1 T k Does barrier meet corrective action* · 1 a e
strength and safety standards?
Yes 1
Does the lateral place- No r T k - 1 a e corrective action* ment of the barrier meet suggested criteria?
Yes .-Is rail height No 1 T k corrective action* proper 1 a e distance above ground? t Yes .-
Are posts firmly No r embedment em- 1 Restore
bedded? ~ Yes 1
Are rails firmly No [Tighten attachments attached to posts?
Yes -1-
rEnd of check
* See text for discussion
g2
I I

Table III-F-l. Structural Inadequacies of Roadside Barriers
INADEQUACY I REMEDIAL ACTION
Transition Section
'No rail continuity
'Post too weak 'Post spacing too large
'No block out or rub rail
~ I Terminal
'Nonconforming end treatment
Longitudinal Section
'Post spacing too large
'No block out or rub rail for strong post systems
'Too close to rigid object
'Attach to adjoining system to provide axial and flexure strength. May need new rail.
'Increase post size or build up existing post. 'Reduce post spacing to prevent pocketing or snagging of vehicle.
'Install block out and/or rub rail to prevent snagging by tires.
'Flare and anchor end of barrier in back slope if possible. 'Install crashworthy end treatment, such as ETl system described in Section III-B-3.
'Post spacing for W-beam rail should not be greater than approximately 6'3" (1.9 m) for high speed facilities.
'Install block out and/or rub rail to prevent snagging by tires. Use of Thrie Beam (see G6 system described in Section III-B-1 will eliminate need for rub.rail.
'Move barrier to proper distance, or stiffen section near rigid object.

function properly. If improperly located, corrective measures should
be considered. If necessary, the barrier can be moved near the shoulder's
edge or returned to a position in which the approach terrain to the
barrier is no steeper than the criteria suggest. Another possible solu
tion would be to provide fill material to the lateral distance desired
and place the barrier on the fill. Steep flare rates for approach and
transition sections should be flattened to conform to the suggested
criteria.
With regard to item 5 of Figure III-F-1, the rail height of an
operational system should be approximately equal to the original design
height of the system. In any case, it is suggested that the barrier be
approximately 27 inches (0.69 m) above the ground or greater.
In some cases, the effective rail height will be decreased due to
an accumulation of dirt, pavement overlays, etc. Of course, dirt should
be removed if feasible to return the barrier to its correct height. If
necessary and if the length and strength of the post and foundation per
mits, the rail can be raised an appropriate amount. If not, it may be
necessary to install taller posts with added strength and deeper embed
ment to accommodate the increased rail height.
Items 6 and 7 of Figure III-F-1 can be accomplished by maintenance
personnel.
III-F-2. Example Problem
The following example will illustrate how the guidelines in Section
F can be applied to upgrade an installation.
94
Given: Figure III-F-2 shows a roadside barrier installation in
which the design is substandard and the layout does not
meet the suggested criteria. The design speed is 60 mph
(96.5 k/h) and the ADT is 5,000. The problems with this
installation are as follows:
a. Flare rate too steep.
b. No end treatment for exposed rail.
c. Barrier not structurally adequate since it is not
anchored and it is too close to the pier for the post
spacing.
d. No protection for the opposing traffic.
Required: Upgrade this installation according to the criteria and
and guidelines contained herein.
Solution: From Table III-E-1,
LR = 360 ft (109.7 m)
L5 = s.o ft (2.4 m);
a:b = 20:1
To determine the end of need for the approach barrier for the "adjacent"
traffic, Equations III-E-1 and III-E-2 are used with the following values
(refer to Figures III-A-3 and III-E-4):
Lc =30ft (9.1 m);
LH = 15ft (4.6 m);
L1 = 0.0 (no tangent section); and
L2 = 11.3 ft (3.4 m).
Due to the limited space between the edge of the shoulder and the pier,
the barrier must be stiffened in the area of the pier. The dynamic
95
<0 Q)
::u 0 0 a. ~ 0
... 0 II> II>
g • 9. -Ul 0 't:l (1)
, II II Bridge P1er x See Detail 'A
,..~ Edoe of Shoulder CE.o: sJ"¥"
\ J E.QP.--...,..
~ Adjacen.!_!raffic_ ~I
o' 2'
t 15'
---•- Opposing Traffic
II 8" a B 1-l D ~ ( w- Beam on 8 X Wood Post ----.-- ..------;:-=11 6'-3" Post Spacing with s"x 8"
Blackout (G4W System}
12' II'
- DWG. Not to scale-E.QP.
DETAIL "A" Metric Conversions: I FT. =0,3048m I IN. =0,0254 m
FIGUREm-F-2. Example of Substandard Design and Layout of Approach Barrier
deflection of the G4(1W) system is 2.8 feet (0.85 m). Thus, theW-beam
rail will be attached to the pier but blocked out by an 8 inch (0.2 m)
by 8 inch (0.2 m) wood block. From Equations III-E-1 and III-E-2,
X= 40.4 ft (12.3 m), and
Y = 13.3 ft (4.1 m).
To determine the end of need for the approach barrier for the "opposing"
traffic, Equations III-E-1 and III-E-2 are used with the following values
(refer to Figures III-A-3 and III-E-4):
Lc =30ft (9.1 m)
LH = 27 ft {8.2 m)
L1 = 0.0 ft; and
L2 = 23.3 ft (7.1 m).
Note that an approach rail for the opposing traffic is needed since LH
is less than Lc. Thus,
X = 29.6 ft (9.0 m) and
Y = 24.8 ft (7.6 m).
The suggested design and layout is shown in Figure III-F-3. Note
that a T1 transition is suggested for the area near the pier and a G4(1W)
system for the remainder of the barrier. Also note that an ETl end
treatment is suggested to terminate both ends of the barriers or some
crashworthy end treatment. As an alternate end treatment, the barrier
could be extended, at the given flare rate, to the back slope and anchored
there. This would require considerably more barrier but it would eliminate
the possibility of an end impact with the barrier. If anchored in the
back slope, the guidelines of Section III-B-3 should be followed.
97
"' 00
B'x 8" X 1'- 2" D. F. Block
12 Go. w-Beam~ " 5/8 Machine Bolt~
W!Nuta Cut Washer
2'
~L 2-518' Machine Bolt W/Nuts,Cut Steel Washers and 3 Expansion Units Per Bolt.
METRIC CONVERSIONS
I FT.=0.3048m. I in. =0.0254m. i 7/R~~~~/~~~\~--~~~~~~--c r /))S.J)"" ~' /.{'..
~ -"'~;. B DETAIL-A 1 8 8 8 a R R ~~--,~:t'q B 11 H 8 B 6 z .,. ~ . ~ A ~ . ,\ G4(1 W) ..-
G4(1W) Tl Transition ~I Transition System System System System
ETI. or a Crashworthy -1 ETI Crashworth r-= 29.6' 40:4' "I -Terminal 1~1 IIIIIIUI
~I ,c39=
12.8 See Detail-A 13.3'
12' Adjacent Traffic
-------- ------------------------------~--- Opposing Traffic
FIGURE lJI- F-3. Suggested Design and Layout for Example Problem
It is emphasized that the suggested design shown in this example
is not unique. There are other designs which would serve the intended
purpose. However, proven systems should be used as was done in this
example to upgrade substandard systems where possible.
99

IV. MEDIAN BARRIERS
A median barrier is a Longitudinal system used to prevent an
errant vehicle from crossing the portion of a divided highway separating
the traveLed ways for traffic in opposite directions. It is the purpose
of this chapter to delineate the criteria pertinent to the various
elements of median barrier design, including warrants, structural and
safety characteristics of operational systems, maintenance characteristics
of operational systems, selection guidelines, placement recommendations,
and guidelines for upgrading substandard installations. Figure IV-A-1
illustrates the three basic median barrier elements, namely, the
standard section, the transition section and the end treatment.
IV-A. Warrants
IV-A-1. Standard Section
Figure IV-A-2 presents the suggested warrants for median barriers
on high speed, controlled access roadways which have relatively flat,
unobstructed medians. This criteria is based on an evaluation of median
crossover accidents (28), research studies (29), and on the combined
judgment of the Task Force which assisted in the preparation of this
guide (30).
As indicated in Figure IV-A-2, median barriers are warranted for
combinations of average daily traffic (ADT) and median widths that fall
within the dotted area. At low ADT's, the probability of a vehicle
crossing the median is relatively low. Thus, for ADT's less than 20,000
and median widths within the optional area of the figure, a 100
b ,__.
TRANSITION
< sTD~I. TRANSITION .\4
STANDARD SECTION .. I. l .. \ .. sTANDARD sEcT: 1 ~.
SECT. J ...,.
EOP ~ ·· · .. "f · " .· . ,.,. ···r . ~· .. . ~
\ )
Semi- rigid system! I Rigid Object
... ·~t::oP
'" TRAFFIC"
:1
-. •,'f~: .
·~ .. I . I
(TRAFFI~ ·-1. "'-'l:'<··· ___ .,,., __ ,_
Rigid System
""·'"l>·.
_, ...
'" 7
~
~ North
Figure IV-A-1. Definition of f·1edian narrier Elements
END TREATMENT
MEDIAN OPENING
STD.
SECT.
,,-,,-, .. I ,.q vzz, i
. ·:~:-· ~ i.
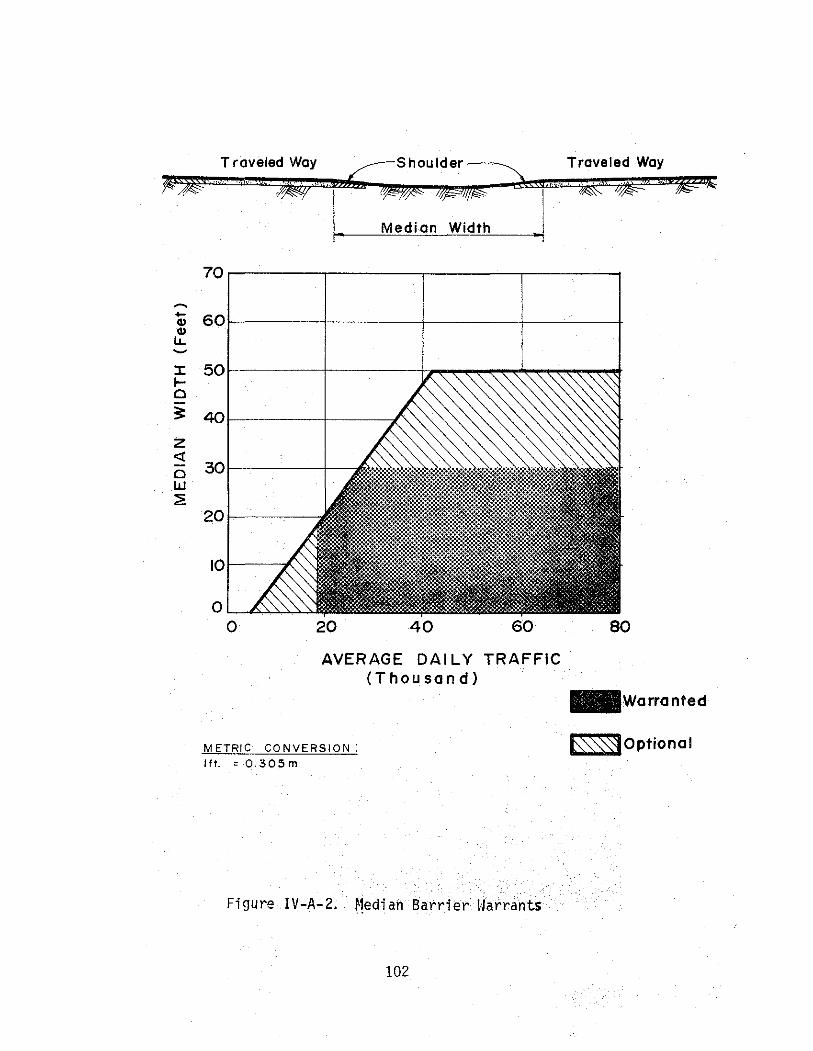
~ .... Cl) Cl)
LL ~
J: ..... 0
3:
z <(
0 LLl ~
Traveled Way ... :, ... , dAAf,·'····k
/ I 'r¥1% 4%fo/!(R> I Median~
70r-------,-------.--------,------~
20
AVERAGE DAILY TRAFFIC (Thousand)
METRIC CONVERSION;
1ft. "0.305m
Figure IV-A-2. t1edi an Barrier Harrahts
102
-Warranted
~'\}Optional
barrier is warranted only if there has been a history of high rate of
across-the-median accidents. For new roadways, an estimate of the
potential for crossover accidents should be made for median widths
falling within the optional areas. Likewise for relatively wide medians,
the probability of a vehicle crossing the medians is also relatively
low. Thus, for median widths greater than 30 ft (9.1 m) and within
the optional area of the figure, a barrier may or may not be warranted,
depending on the across-the-median accident history. Medians that are
wider than 50 ft ( 15.24 em) do not warrant a barrier unless there is an
adverse history of across-the-median accidents. It should be noted that
after a warranted median barrier is installed, accident severity will
decrease, however, accident frequency will generally increase since the
space available for return-to-the-road maneuvers is decreased.
Special consideration should be given to barrier needs for medians
separating traveled ways at different e 1 evati ons. The abi 1 i ty of an
errant driver leaving the higher elevated roadway to return to the road
or to stop diminishes as the difference in elevation increases. Thus,
the potential for cross-over, head-on accidents increases. For such
sections, it is suggested that the clear distance criterion given in
Figure III-A-3 be used as a guideline for establishing barrier need.
Careful consideration should be given to the installation of median
barriers on multilane expressways or other roadways with parti a 1 contra 1
of access. Problems are created at each intersection or median cross
over since the median barrier must be terminated at these points. An
evaluation of the number of crossovers, accident history, alignment,
sight distance, design speed, traffic volume, and median width should be
made prior to non-freeway installations.
103

IV-A-2. Transition
Median barrier transition sections are warranted when it becomes
necessary to connect median barriers of differing lateral stiffness.
In general, a median barrier transition section is needed when there is
a significant change in the lateral strength of the barrier. Another
example is median barriers which must also shield fixed objects in a
narrow median. In such cases, the median barrier is usually flared so
that it encompasses the rigid object.(for example, see TRS system, Table
B-10, Appendix B).
Rigid objects in wide medians which separate the traveled ways
for traffic in opposite direction require special attention, i.e.,
medians of sufficient width which do not warrant a continuous median
barrier. If the hazard warrants shielding for travel in one direction
only, the criteria of Chapter III applies. If shielding is warranted
for both directions of travel, the placement recommendations of Section
IV-E should be followed.
IV-A-3. End Treatment
An untreated median barrier terminal is essentially a fixed-object
hazard to the motorist. Therefore, for freeways, a crashworthy end
treatment is warranted if the median barrier is terminated within the
clear distance.
Emergency median openings in median barriers are to be minimized
to avoid the end treatment problem. Highway engineers should work closely
with law enforcement officials and other emergency vehicle officials in
this regard.
purposes.
Emergency openings should never be installed for maintenance
104
IV-B. Structural and Safety Characteristics
This section presents operational median barrier systems and
points out their desirable structural and safety characteristics. It
is subdivided according to standard sections of median barriers, tran
sitions, and end treatments.
Structural and safety characteristics of operational systems within
each of these three median barrier elements are presented on standard forms
(e.g., see Table IV-B-1). The information consists of a sketch, a system
designation, barrier description, impact performance, barrier damage,
references, field performance data, and remarks. Reference should be
made to the introduction of Section III-B for a discussion of each of
these items. It is noted that the evaluation criteria for a median
barrier is essentially the same as that for a roadside barrier, since both
are longitudinal barriers whose functions are similar.
IV-B-1. Standard Sections of Median Barriers
Table IV-B-1 presents a summary of the structural and safety
characteristics of current operational median barriers. Table IV-B-2
contains a summary of the impact performance data on each of the opera
tional systems. Unfortunately, acceleration data are unavailable for
several of the systems. Most of these systems were developed and tested
prior to the establishment of the standard test procedures. Appendix B
contains a summary of median barriers which appear promising but which do
not have sufficient in-service use to be classified operational.
105
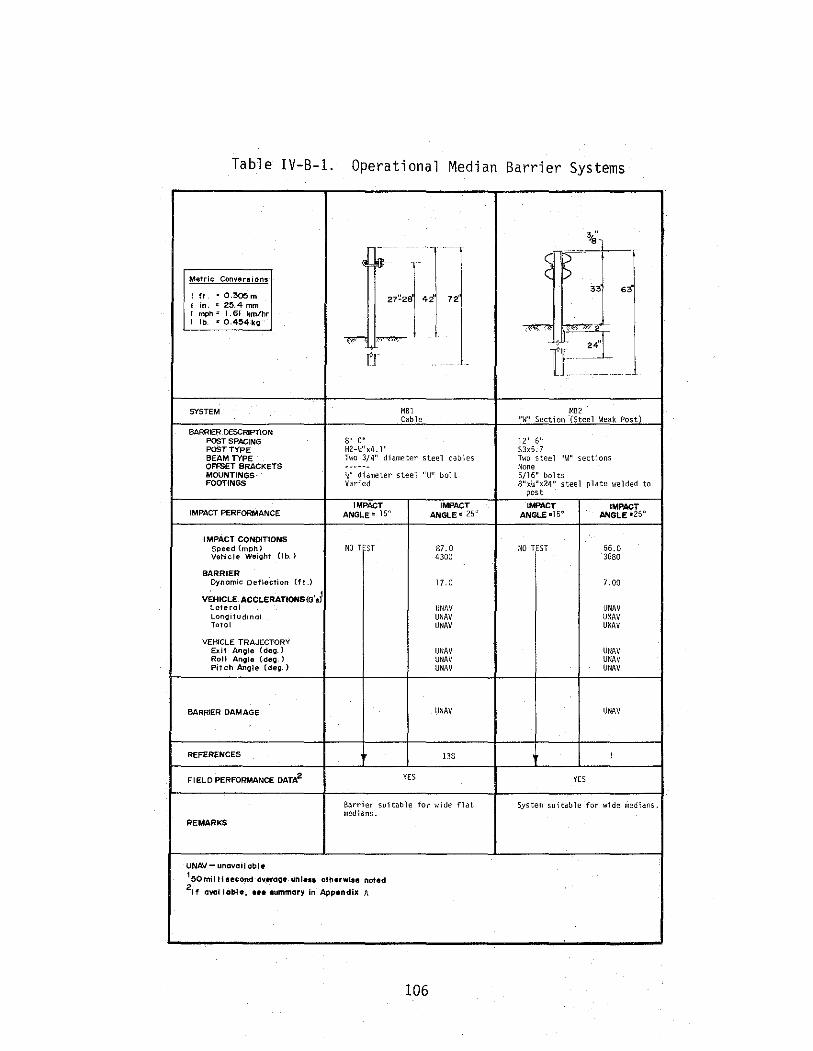
Table IV-B-1. Operational Median Barrier Systems
Metric Convereions
I ft = 0.3~m I in. " 2!1.4 mm r mph= 1.61 km/hr r tb. "'0.4!14ko
SYSTEM
BARRIER DESCRIPTION POST SPACING POST TYPE BEAM TYPE OFFSET BRACKETS MOUNTINGS FOOTINGS
IMPACT PERFORMANCE
IMPACT CONDITIONS Speed (mph) Vehicle Weight (lb.)
BARRIER Dynamic Deflection (ft.)
V~HICLE ACCLERATIONS(G'sJ1
loterol Lonoitudinol Toto I
VEHICLE TRAJECTORY Exit Angle (deo. l Roll Angle { deg, l Pitch Angle (deg.)
BARRIER DAMAGE
REFERENCES
FIELD PERFORMANCE DATA2
REMARKS
UNAV- unovail able
r']
8' 0" H2->4''x4.1"
l l
MBl Cable
L
Two 3/4" diameter steel cables
-'1;" diameter steel "U" bolt Varied
IMPACT ANGLE" 15"
NO TEST
YES
IMPACT ANGLE"' 25"
117.0 4300
17.0
UNAV UNAV UNAV
UNAV UNAV UNAV
UNAV
138
Barrier suitable for wide flat medians.
1BOmilllaecond averooe unleas otherwlae noted
21f available, ••• aummory In Appendix A
106
.MB2 . "W" Section (Steel Weak Post)
12' 6" S3x5. 7 Two steel "W" sections None 5/16" bolts 8"x!4"X24" steel plate welded to
post
IMPACT IMPACT ANGLE •15" ANGLE •25"
NO TEST
YES
56.0 3680
7 .oo
UNAV UNAV UNAV
UNAV UNAV UNAV
UNAV
System suitable for wide o1edians.
..
Table IV-B-1. Operational Median Barrier Systems (Continued)
Metric Conversions
I ft. : 0.305m I in. = 2!5.4 mm I mph= 1.61 km/hr I lb. = 0.454 kg
SYSTEM
BARRIER DESCRIPTION POST SPACING POST TYPE BEAM TYPE OFFSET BRACKETS MOUNTINGS FOOTINGS
IMPACT PERFORMANCE
IMPACT CONDITIONS Speed (mph) Vahicle Weight (lb.)
BARRIER Dynamic Deflection (ft.)
VEHICLE ACCLERATIONSCG'a)l Lateral LonQitudinol Total
VEHICLE TRAJECTORY Exit Angle (dec;~.) Roll Angle (deg.) Pifch Angle (deo;r.)
BARRIER DAMAGE
REFERENCES
Fl ELD PERFORMANCE DATA2
REMARKS
UNAV- unavailable
~ ' 30
6' 0" S3x5. 7
MB3 Box Beam
8"x6"xl;)" steel tube ~one Steel paddles
1
8"xl,;"x24" steel plate welded to post
IMPACT IMPACT ANGLE =JOn ANGLE '"25"
49.0 4540
0. 75
UNAV UNAV UNAV
3 posts only.
14
YES
56.0 3500
5. 50
UNAV UNAV 5.30
30' of steel tube beam ar,d 10 posts.
17
System suitable for wide medians.
150 mllllst•cond overage unlea• otherwise noted
21f aval !able, ••• summary in Appendhc A
\6" x 8" post acceptable alternate based on G4(2W) test results. ~6" x 8" x 14" block acceptable based on G4(2W) test results.
107
Blocked-Out "W~B~~am (Wood Posts)
6' 3" 8"x8" Douglas Fir "1
Two "VI" section, two C6x(l 2 ruhrails Two <l"x8"xl4" Douglas rir Blocks'' 5/8" dia111eter bolt~ None
IMPACT ANGLE"15"'
NO TEST
.
YES
IMPACT ANGLE • 25"
69.0 4S70
~z .oo
UtlAV UNAV UNAV
15 UNAV UNAV
UNAV
140
Southern yellow pine is acceptable alternate for Douglas Fir. A "W" beam centered at 10" above grade is an acceptable alternate rubrail.

Table IV-B-.1. Operational Median Barrier Systems (Continued)
Metric Conver!!lions
1ft. =0.305m I in. " 25,4 mm 1 mph= 1.61 km/hr I lb. = 0.'454kg
SYSTEM
· BARRIER DESCRIPTION POST SPACING POST TYPE BEAM TYPE OFFSET BRACKETS MOUNTINGS FOOTINGS
IMPACT PERFORMANCE
IMPACT CONDITIONS Speed (mphl VehiclE" .Weight (lb.)
BARRIER Qynomic Deflection (ftJ
VEHICLE ACCLERAnONS(G'e)1
Lateral Lonoitudinol Total
VEHICLE TRAJECTORY Exit Anole (deQ.) Rolf Anole (deQ.) Pitch ·Angle (deg.)
BARRIER DAMAGE
REFERENCES
FIELD PERFORMANCE DATA2
~: t£11 s'-o"l
__ j MB4S
lllockcd~Out "W' Bea1n (Steel Posts)
5' 3" \~6X3. 5 ., T110 steel "W" sections Two W6X8. 5 '• 5/8'' diameter steel bolts None
IMPACT ANGLE" Hi"
67.0 3500
1. 50
UNAV UNAV 5. 70
g 0 0
25' of "\i" section and 2 posts.
17
YES
IMPACT ANGLE• 25°
NO TEST
1"]- (Footing S Reinforcing Varies)
MB5 Concrete Median Barrier
Continuously poured, reinforced, sloped face, concrete section. Barrier can be anchored by dmvels or an asphalt key. See text for further details of various configurations tested.
60.7 4210
0.00
6.00 5.00 UNAV
11 .5 «25 "10
None
Jl
IMPACT ANGLE • 25°
62.4 4000
0.00
9.00 7.00 UNAV
7 "35 "20
None
31
YES
.·~---------------------------t-------------------------------i~G~o~od~c~o~dCic~o~o,ti.io:o~f~oc~i~'~P~''~'-;'~""''"'~'--"1 of 1So or less. At larger impact
REMARKS
UNAV-unavallable 150millleecond Cverooe unleee otherwise noted
21r ovollable, eeeeummoryln Appendix A
angles vehicle roll and pitch may be~
come critical. Recommended use on narrow medians, retaining walls, rock cut~,h~tc. Several modified versions
"l4 1/3" x 5 5/8" x 3/16" "C" steel post acceptable based on G4{2S) test results.
''4 l/3" x 5 5/fl" x 3/16" "C" steel blackout acceptable based on G4(2S) test results.
108
Table IV-B-1. Operational Median Barrier Systems (Continued)
c" -
' L'"a I
1F ,,(~· l I
Metric ConversiQOS 27"
I fl. = 0.305 m ' 163"z''
12!.-2"
163" I lo. = 25.4 mm
____, ~ 2"- I I mph= 1 .61 km/hr ~~ I lb. ~ 0.454kg ll 24"[ j I I
l1 ' !
I
SYSTEM
" 'M~/ ' c ' ~~: _ll
' "" AI " c " BARRIER DESCRIPTION
POST SPACING 6' 3" 11' (,"
POST TYPE Aluminum I or steel S3x5.7 ~';,''x7!4 " II section illuminum BEAM TYPE Aluminum extrusions 5',"x7'4".H section aluminu~l OFFSET BRACKETS None Four standard oluminum extrusions MOUNTINGS Steel or aluminum paddles None FOOTINGS 8"x3/16"x24" steel or aluminum Standard Hardware
plate None
IMPACT IMPACT IMPACT IMPACT IMPACT PERFORMANCE ANGLE%15" ANGL£"26 6" ANGLEe7" ANGLE •25"
IMPACT CONDITIONS Speed {mph) 53.0 62.7 51.0 56.0 Vehicl"' Weight (lb.) 4000 4057 4000 4000
BARRIER Dynamic Deflection (ft.) 1. 50 7.20 UNAV lJNAV
VEHICLE ACCLERATIONS(G'aJ1
4.0~ Late ro! lJNAV 4.10 0. 70 Longitudinal UNAV 3. 70 1.00 9.0 Toto! UNAV UNAV UN/IV UNAV
VEHICLE TRAJECTORY E:dt Angle (deq.) UNAV UNAV 4 oQ Roll Anqle (deg.) UNAV UNAV UNAV UNAV Pitch Angle (deg.) lJNAV lJNAV UNAV LINAV
BARRIER DAMAGE UNAV UNAV UNAV UN/IV
REFERENCES 1 1 I 1
FIELD PERFORMANCE DATA2 NO NO
REMARKS
UNAV- unavoil able 150mllllaecond overage unle11 otherwise noted 21t avol I able, see summary in Appendix A 3Fro111 lllt'(hdllic.11 Pt'<lk->l dC<elei·PniC'ler
.
109
Table IV-B-1. Operational Median Barrier Systems (Continued)
,, " I" _____ _l '•
~ < l)-i .
7' Metric Conversions < k> 132"
~Jt f" I fL = 0.3Cem·- < r> I I in. = 2!5.4 mm :%"Fi!le I mph~ 1.61 'km/hr
il - X4"Lon
I lb. = 0.454 kg-
"i•~" ' " -~ ·"'" I ·.·.I .. -·~
IT
MB 9 MB 10 SYSTEM Blocked-Out Thrie Beam , ~~eta 1" Beam Guar~ ~ence
BARRIER DESCRIPTION POST SPACING 6' 3" 6' 3" POST TYPE W6x8.5 W6x8.5 steel BEAM TYPE Two Thrie Beams Two steel "W" sections OFFSET BRACKETS W6x8.5 None MOUNTINGS 5/8" diameter steel bolts 5/8" diameter bolt FOOTINGS UNAV 7"xll"x5/8" steel plate
IMPACT IMPACT IMPACT IMPACT IMPACT PERFORMANCE ANGLE= 17" ANGLE" 25° ANGLE"l4.r ANGLE•zso
IMPACT CONDITIONS Speed (mph) 54.1 66.1 63.4 57.3 Vehicle Wei<;~ht Ob. l 2200 4500 4200 3640
BARRIER Dynamic Deflection (ft.) 0 33 3. 17 1.00 1. 50
VEHICLE ACCLERATIONS(G'a>' Loferol 5. 30 6. 30 6.30 UNAV Lonoitudinol 2.00 6.60 4. 30 10.0 Total UNAV UNAV UNAV UNAV
VEHICLE TRAJECTORY Exit Anole (deo. l "2 .o less than 10 3.8 19.7 Roll Angle (deg.) 0 0 0 less than 10 Pitch Angle (deg.) 0 0 0 less than 10
BARRIER DAMAGE None 25' of thrie 50' of "W" 50' of "W" beam and 3 section '"' 3 section and posts. posts 3 posts.
REFERENCES 21 21 32 31
FIELD PERFORMANCE DATA2 NO NO
Good redirection. Some wheel Provides smooth redirection. Rub- snagging occurred in 25° test, rail not needed. Chance of but was not severe. Fillet weld
REMARKS vehicle snagging on post is mini- at base ts 3/B'' weld along out-mal. side edge of flange only. This
~s ~~!tical :or shearing at low
UNAV- unavailable 150mllll•econd overooe unle11 otherwl•e noted
211 available, ••• 1ummory In Appendix A
110
...... ...... ......
Table IV-B-2. Median Barrier Data Summary
2 0 2 Accelerations at 15° (G's) Accelerations at 25 (G's) Is
Maximum Dynamic 1 Barrier Hardware System Deflection (ft.) Lateral Longitudinal Total Lateral Longitudinal Total Standardized?3
Flexible S~stems
MB1 17.0 No Test No Test No Test UNAV UNAV UNAV Yes MB2 7.0 No Test No Test No Test UNAV UNAV UNAV Yes
Semi-Rigid Systems
MB3 5.5 UNAV UNAV UNAV UNAV UNAV 5.3 Yes MB4W ~2.0 No Test No Test No Test UNAV UNAV UNAV Yes MB4S 1. 5" UNAV UNAV 5.7 7.1 7.6 UNAV Yes MB7 7.2 UNAV UNAV UNAV 4.1 3.7 UNAV Yes MB8 UNAV 0.7 1.0 UNAV 4.05 9.05 UNAV Yes· MB9 3.2 5.3 2.0 UNAV 6.3 6.6 UNAV Yes6 MB10 1.5 6.3 4.3 UNAV UNAV 10.0 UNAV No
Rigid System
MB5 0.0 6.0 5~0 UNAV 9.0 7.0 UNAV Yes ..
UNAV - Unavailable Metric Conversion: 1 ft = 0.305 m. lBased on 25° impact unless otherwise noted. 250 millisecond average unless otherwise noted. 3See reference 22, 23. '+Based on 15° impact data. SPeak acceleration. 6To be included in a revised edition of references 22, 23.
Although it is difficult to classify or categorize. the performance
of median barriers, they are usually denoted as one of three types:
flexible, semi-rigid, or rigid. Flexible systems undergo .considerable
dynamic deflection upon impact and are generally more forgiving than
the semi-rigid or the rigid systems since they impose lower impact forces
on the vehicle.
Based on the test results shown in Table IV-B-2, systems MBl and
MB2 are considered to be flexible barriers. In these systems, the resis
tance to impact is due in most part to the tensile force developed in
the cable {MBl) or the W-beam (MB2). The cable and the rail tear away
from the support posts upon impact, the posts thus offering negligible
resistance in the impact zone. However, posts outside the impact zone
provide resistance essential to control the deflection to an acceptable
limit. Splices are designed to carry the full tensile strength of the
cable (MBl) or the rail (MB2).
Systems ·MB3 through MB4S and systems MB7 through MBlO are considered
semi-rigid barriers. In the MB3 and the MB7 systems, the resistance is
achieved through the rail's combined flexure and tensile stiffness. The
posts near the point of impact are designed to break or tear away,
thereby distributing the impact force by beam action to adjacent posts.
The remaining .semi-rigid systems resist impact through the combined tensile
and flexural stiffness of the rail and the bending resistance of the posts.
In the MBlO system, the posts are designed to breakaway at the base at a
relatively low impact force, about 5,000 pounds (22,240 N). Note that the
rail is blocked out from the support post in the "strong post" systems,
with the exception of the MB8 and MBlO systems. Block-outs in these
112
systems minimize the potential for vehicle snagging on the posts and
reduce the tendency for the vehicle to vault over the rail. Additional
protection against snagging is provided in the MB4W by the rub rail.
The MB5 system or the Concrete Median Barrier (CMB) is the only
operational rigid median barrier. However, variations in the footing and
reinforcing of the MB5 have been tested and proven adequate. These
variations are summarized in Table IV-B-3. A continuously poured, post
tensioned MB5 system has also been tested but has not received sufficient
in-service experience to be classified as operational (see MBE2 system,
Table B-3, Appendix B).
A considerable amount of interest has been shown in precast seg
ments for the MB5 system, and some crash tests have been performed.
Reference should be made to systems MBEl and MBE3, Table B-3, Appendix B,
for promising precast barriers. As of this writing, these systems have
not received ample in-service experience to be classified as operational.
To date, there has been no general agreement as to the minimum lengths
permitted in precast segments, the connection details, the anchorage
details, and the amount of reinforcing needed for handling and/or impact
performance.
It is also to be noted that current research (~) indicates that
the impact performance of the MB5 system can be improved by slight
changes to its shape. Reference should be made to the MBE4 system
(known as Configuration F), Table B-3, Appendix B, for the suggested new
shape. The MB5 shape is shown on the drawing as a dotted line. The
reader should keep abreast of these and other median barrier developments.
113
..... ..... ""'
Length of Barrier Barrier
Configuration Tested(ft.)
A 150
B 160(poured in 20 ft. segments)
c 97
Table IV-B-3. Variations in the Continuous Concrete Median Barrier Design (MB5)
Description Description of of
Reinforced? Reinforcing Footing
Yes 8- #5 continuous, System placed on grade. grade 60, reinforc- 1 in. layer of hot mix ing bars. asphalt placed at base
of barrier to provide lateral restraint.
No None Base of system (unre-inforced concrete) is extended 10 in. below grade.
Yes 1 - #4, continuous, System is placed on reinforcing bar. Ad- grade over existing ditional reinforcing lowered cable bar-is provided by 3/4 in. rier. Footing of diameter cable from existing barrier pro-existing lowered ca- vides lateral restraint. ble barrier.
Note: 1 ft. = 0.305 m; 1 in. = 25.4 mm
Reference
31
14
33
Note that the rail heights range from 27 inches (0.69 m) to 33
inches (0.84 m). A minimum height of approximately 27 inches (0.69 m)
is a necessary, but not sufficient, condition to insure proper barrier
impact performance. The barrier must also be designed so that upon im
pact the rail remains essentially at its original mounting height. Note
a 1 so that the post spacing for "strong post" systems is 6. 25 feet ( 1. 91 m)
with the exception of the MB8 system. Tests have shown that this spacing
is needed for this type of system to minimize vehicle snagging or pocket
ing.
Current research indicates that the most desirable height of the
MB5 system is 32 inches (0.81 m). This height has been reached after
carefully evaluating factors such as vehicle redirection, sight distance,
structural stability of the barrier, and the psychological effect of
barrier height on driver reaction. Unless sufficient justification exists,
variations in this height are to be avoided.
The degree to which the operational systems satisfy the recommended
structural and safety criteria of Section II-B varies. All are considered
to be structurally adequate, although some obviously deflect more than
others. Although all do not satisfy the impact severity criteria, the
acceleration criteria is tenuous and currently under review. Nonetheless,
median barriers which minimize impact forces should receive strong con
sideration. With regard to the vehicle trajectory hazard, it is desirable
that the vehicle be redirected parallel to the barrier. An exit angle
of 10° or less may be considered a non-hazardous post impact trajectory.
115
The designer should be aware of the impact performance sensiti
vity of median barriers to a number of conditions. These include soil
conditions, length of installation, type of end anchorage and rail
tension, post spacing and post size. Some of these parameters have
been investigated and the reader is encouraged to review the results
{]&).
An effort has been made to standardize hardware for widely used
traffic barriers (g, 23). Standardization is beneficial in terms of
economy, improved availability of parts, readily available details and
specifications, reduced repair time, and reduced inventory of replace
ment parts because of interchangeability of parts. Median barriers
which have been standardized are so noted in the·last column of Table
IV-B-2. The referenced standardized documents continue to be revised
periodically and the designer should obtain the latest publications.
Shown in Table IV-B-4 are the types of median barriers recom
mended for the given median widths. The primary consideration in
establishing these guidelines was safety, both to the motorist and the
maintenance personnel who must repair damaged barriers. Each barrier
type exhibits characteristics which make it more desirable for a given
median condition than the others. These characteristics are as follows;
Rigid Systems - The MB5 system (often referred to as the CMB) is
the only operational rigid barrier. It does not deflect upon impact and
it therefore dissipates a negligible amount of the vehicle's impact
energy. At shallow impact angles, which is characteristic of impact in
narrow medians, the MB5 system will redirect the vehicle with little
or no damage to the vehicle. At higher impact angles, major damage to
116
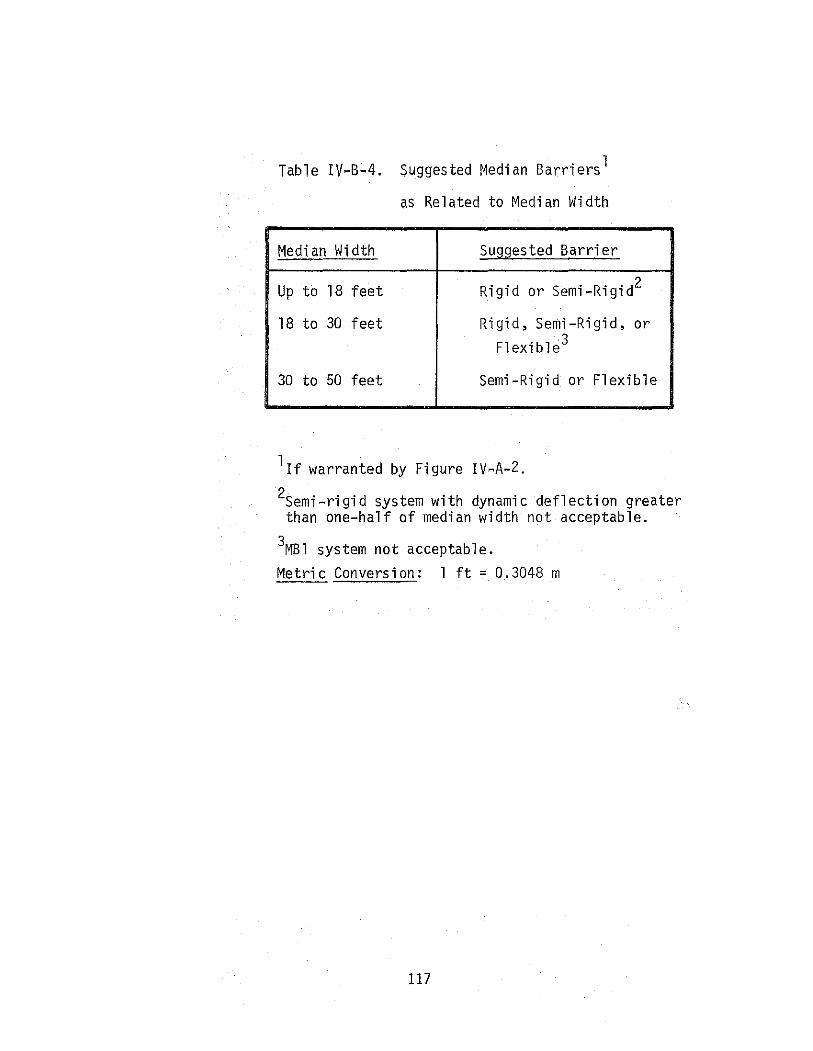
Table IV-B-4. Suggested Median Barriers 1
as Re 1 a ted to t~edi an Width
Median Width Suggested Barrier
Up to 18 feet Rigid or Semi-Rigid2
18 to 30 feet Rigid, Semi-Rigid, or Flexible3
30 to 50 feet Semi-Rigid or Flexible
1rf warranted by Figure IV-A-2. 2semi-rigid system with dynamic deflection greater than one-half of median width not acceptable.
3MB1 system not acceptab 1 e. Metric Conversion: 1 ft = 0.3048 m
117
the vehicle can be expected, together with the probability of occupant
injuries. It has been shown that the MB5 system can safely redirect a
tractor-trailer truck at a moderate impact speed and impact angle (85).
On impact, this barrier suffers little or no damage and hence requires
little maintenance. This has an added benefit as traffic is not dis
rupted by extensive maintenance operations and the maintenance forces
are not exposed to the hazard of large volumes of relatively high-speed
traffic.
Semi-Rigid Systems - Some of these systems are practically rigid
while others are quite flexible. Each system, however, will dissipate
some of the impact energy through yielding of the rail and post elements
and the soil in some cases. For this reason, the semi-rigid systems are
more forgiving. than the MB5 system and thus reduce the probability of
injury, at least for the high speed-high angle impact. Most of the
semi-rigid barrier systems can sustain minor impacts without requiring
immediate and extensive restoration work. As noted in Table IV-B-4, a
semi-rigid system with a dynamic deflection greater than one-half of the
median width (assuming barrier in the middle of the median) is not
acceptable.
Flexible Systems - The flexible barrier is more "forgiving" than
the other types of barriers. However, its deflection characteristics
are such that it can only be used in relatively wide medians. It func
tions primarily by containing rather than redirecting the vehicle. Even
minor impacts usually require some restoration work.
It is important· to point out that the height of the cable in the
~1Bl system is critical. ·If its height is above approximately 28 inches
118

(0.71 m), small cars submarine under it. If its height is less than
approximately 27 inches (0.69 m), large cars can vault over it. The
MBl should therefore not be used in medians with significant terrain
irregularities.
IV-B-2. Transitions
Median barrier transition sections are needed between adjoining
median barriers of significant differences in lateral stiffness, between
a median barrier and another type of barrier, such as a bridge rail, or
when a median barrier must be stiffened to shield fixed objects in the
median such as a continuous illumination system. Reference should be
made to Figure IV-A-1 for examples of median barrier transitions.
Unfortunately, there are no operational median barrier transition
sections to report. A system (TR5) has been developed and tested
for transitioning the MB10 system around luminaire poles in the median,
and is described in Table B-10, Appendix B. It is likely this system
will become operational in the near future.
Until operational median barrier transitions are developed, the
engineer may have to design and install transition sections without the
benefit of crash test evaluations. In such cases, the design guidelines
presented herein should be followed closely.
Impact performance requirements of median barrier transitions are
essentially the same as those for the standard median barrier section.
Special emphasis must be placed on the avoidance of designs which may
cause vehicle snagging or excessive deflection of the transition.
Structural details of special importance are as follows.
119
(a) All rail splices should be capable of developing the full
tensile and flexure strength of the weaker rail. Examples
are the MB1 to the MB4W, or the MB4W to the MB5.
(b) A flared or sloped connection should be used when it can
snag an errant vehicle. With reference to Figure IV·-A-1,
such a connection would be needed on the north side of the
semi-rigid-to-rigid transition. In this regard, the stan
dardized te=inal connector (ll_) (sometimes referred to as the
"Michigan end shoe") is suggested for attaching approach W-beam
rail to the MB5 system or parapets, and to structurally com
patible rails. An example of the use of the terminal connector
is shown in the TR2 system, Appendix B, Table B-10. Another
effective rail-to-parapet connection can be achieved by pro
viding a recessed area in the parapet wall to receive the rail.
This is illustrated in Figure III-B-2. Other potential con
nections and transitions are shown in the last part of NCHRP
129 (39).
(c) Strong post median barrier systems must be used on transitions
to the MB5 system or to bridge rails or parapets or rigid ob
jects. Such systems should be blocked out to prevent vehicle
snagging on the posts. However, block-outs alone may not be
sufficient to prevent snagging at the section just upstream
of the rigid system or obstacle. A rub rail may be desirable
in some designs using the standard W-beam or box beam (see rub
rail on MB4W system). Rub rails are especially needed when
the approach rail is terminated in a recessed area of the
parapet. The rub rail should also be terminated in the
120
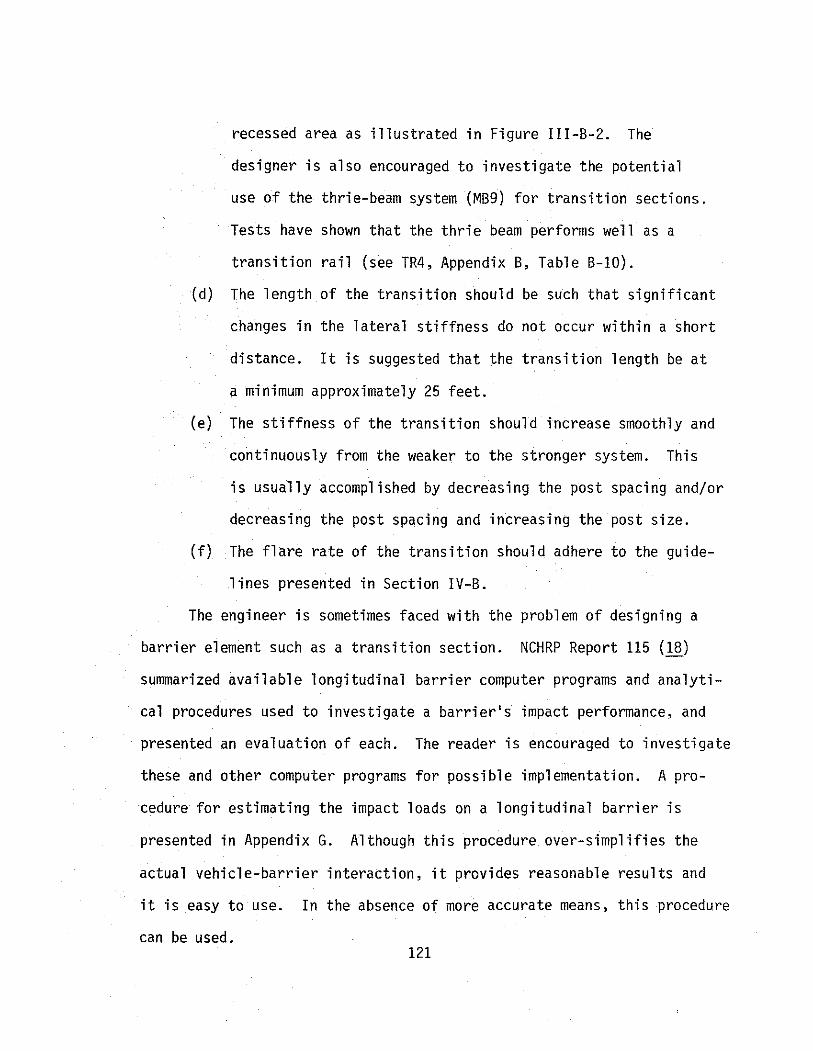
recessed area as illustrated in Figure III-B-2. The
designer is also encouraged to investigate the potential
use of the thrie-beam system (MB9) for transition sections.
Tests have shown that the thrie beam performs well as a
transition rail (see TR4, Appendix B, Table B-10).
(d) The length of the transition should be such that significant
changes in the lateral stiffness do not occur within a short
distance. It is suggested that the transition length be at
a minimum approximately 25 feet.
(e) The stiffness of the transition should increase smoothly and
continuously from the weaker to the stronger system. This
is usually accomplished by decreasing the post spacing and/or
decreasing the post spacing and increasing the post size.
(f) The flare rate of the transition should adhere to the guide
lines presented in Section IV-B.
The engineer is sometimes faced with the problem of designing a
barrier element such as a transition section. NCHRP Report 115 (18)
summarized available longitudinal barrier computer programs and analyti
cal procedures used to investigate a barrier's impact performance, and
presented an evaluation of each. The reader is encouraged to investigate
these and other computer programs for possible implementation. A pro
cedure for estimating the impact loads on a longitudinal barrier is
presented in Appendix G. Although this procedure over-simplifies the
actual vehicle-barrier interaction, it provides reasonable results and
it is easy to use. In the absence of more accurate means, this procedure
can be used. 121
IV-B-3. End Treatment
An untreated end of a median barrier is extremely hazardous. Im
pact with the untreated end of a metal beam type system may result in
the beam penetrating the passenger compartment as well as an abrupt stop.
Impact with the. untreated end of the MB5 system will result in untolerable
impact forces. A crashworthy end treatment for a median barrier is
es.sential if the barrier is terminated within the clear distance of
travel from either direction.
To be. crashworthy, the end treatment should not spear, vault, or
roll the vehicle for head-on or "nose" impacts. Vehicle accelerations
should not exceed the recommended 1 imits. For impacts between the end
and the standard section, the end treatment should have the same redirec
tional characteristics as the standard median barrier which means that
the end must be properly anchored. The end treatment must thus be capable
of developing the full tensile strength of the standard rail element,
whether a arashworthy end treatment is warranted or not.
Shown in Table IV-B-5 are the three operational median barrier end
treatments. The MBETl was tested with the MB4W system but could probably
be adapted to any of the systems using the W-beam. With some modifications
it could also be adapted to the MB5 system. The remarks of the MBET2
system discuss its. adaptabi 1 ity to other systems. The MBET3 system is
ideally suited. for the MB9 system, as well as the MB5 system.
If adequate space is available at the median barrier terminal, a
crash cushion can also serve as an effective end treatment. Reference
should be made to Chapter VI for crash cushion details.
122
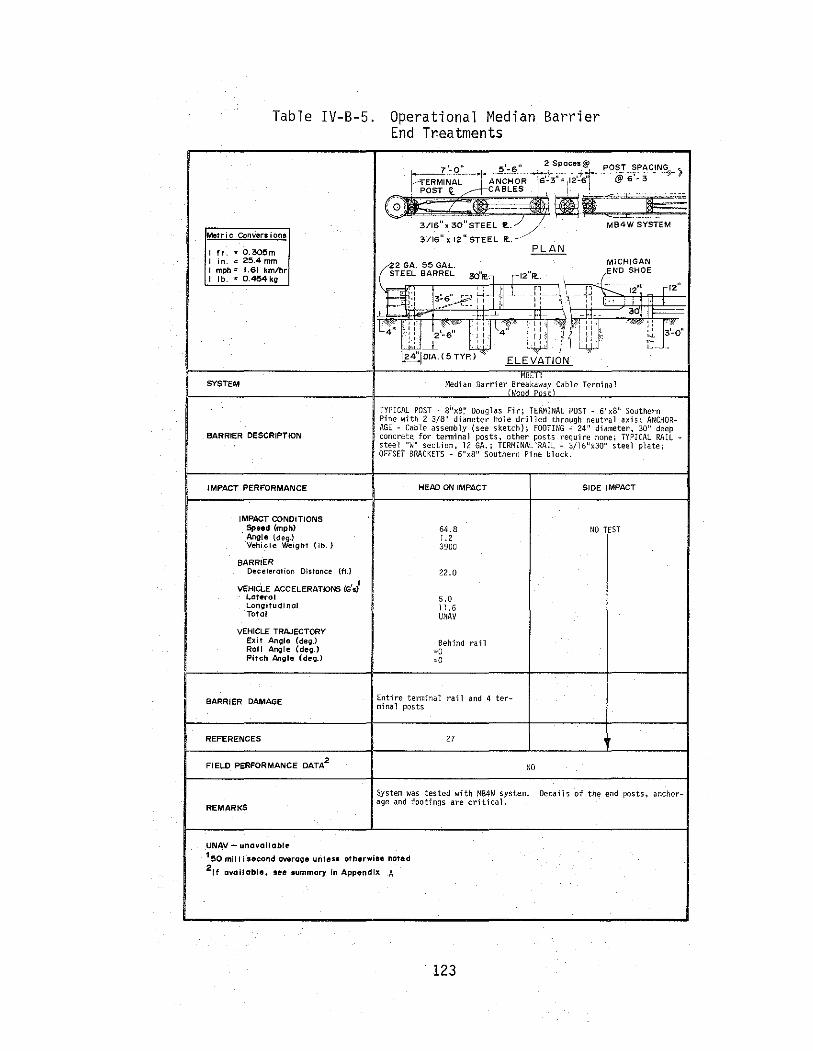
Table IV-B-5.
Metric Conversions
I ft. "' C. 305m I in. "' 25.4 mm 1 mph,. 1.61 km/hr I lb. "'0.454kg
SYSTEM
BARRIER DESCRIPTION
IMPACT PERFORMANCE
IMPACT CONDITIONS Speed (mph) Angle (deg.} Vehicle Weight {lb.)
BARRIER Deceleration Distance (ft.}
VEHICLE ACCELERATIONS (G's)1
Lateral Longitudinal Total
VEHICLE TRAJECTORY Exit Angle (deg.l Roll Angle (deg.) Pitch Angle {deg.l
BARRIER DAMAGE
REFERENCES
FIELD PERFORMANCE DATA2
REMARKS
UNAV- unavailable
Operational Median Barrier End Treatments
e'-s" 2 Spaces@ pOST SPACING -- - i;.-t-" .~,j-- - @- •• , - +'
ANCHOR 1
6-3 ~ 112-61 -"' 7'-o"
p~~NjL-~ .-~a~~, -n ~~·L:~ , \BJw:: __ g
3/16"K30"STEEL 12.-.// MB4WSYSTEM
3/16" x 12" STEEL ll. ~
'-"
PLAN
. MBETl Median Barrier,~;e~k~~ay Cable Terminal
TYPICAL POST- 8;'xB:' Douglas Fir; TERMINAL POST- 6"x8" Southern Pine with 2 3/8" diameter hole drilled through neutral axis; ANCHORAGE - Cable assembly (see sketch); FOOTING - 24" diameter, 30'' deep concrete for terminal posts, other posts require none; TYPICAL RAILsteel "W" section, 12 GA.; TERMINAL 'RAIL - 3/l6"x30" steel plate; OFFSET BRACKETS - 6"x8" Southern Pine block.
HEAD ON IMPACT
64.8 1.2 3900
22.0
5.0 11.6 UNAV
Behind rail eQ eQ
Entire terminal rail and 4 terminal posts
27
SIDE IMPACT
NO TEST
NO
System was tested with MB4W system. Details of the end posts, anchorage and footings are critical.
1!50 millisecond overOQe untesa otherwise noted 2 tt available, eee summary In Appendix A
123
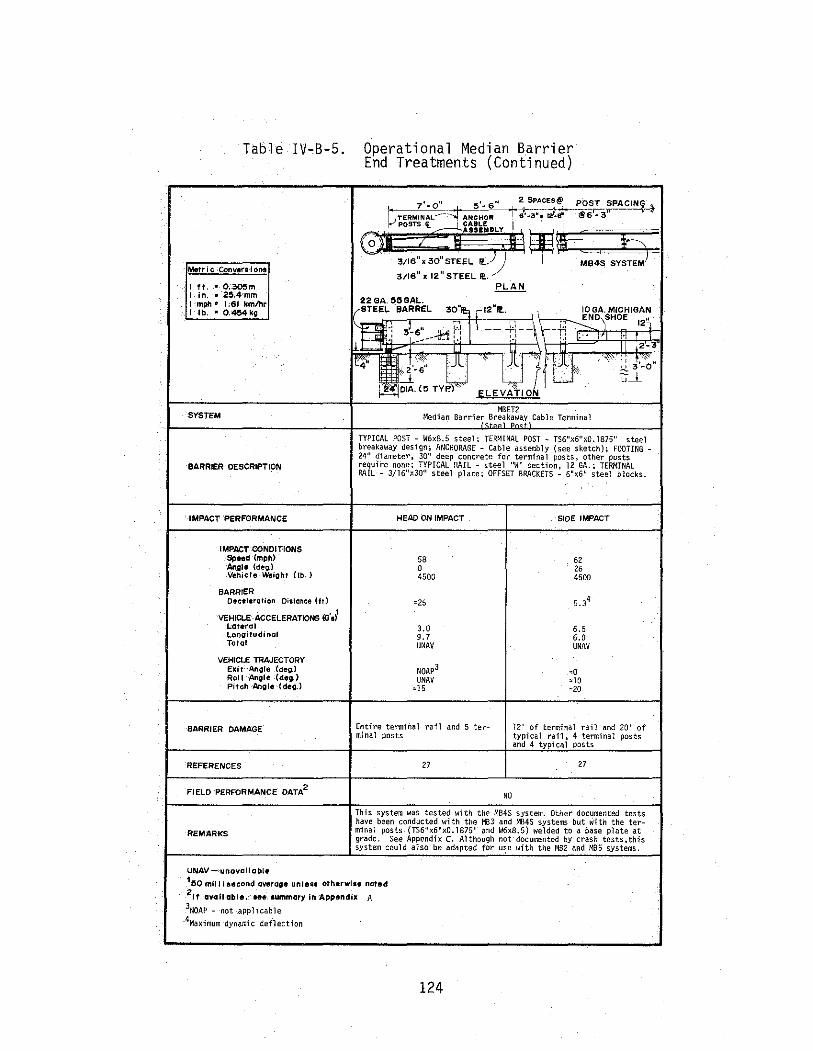
.
.
Table IV-B-5.
Metric Convanlona
I ft. • 0.3~m I in. • -2S.4·mm I mph • L61 km/l'lr I lb .• 0."4e4kQ
SYSTEM
BARRIER. DESCRIPTION
-IMPACT 'PERFORMANCE
IMPACT'OONDITIONS Speed·(mph) An.ol• lde9.) Vehi<:le-~ight (tb. )
BARRIER Oeceteratian Distance lft.l
VEHICLE-ACCELERATIONS (G's)1
Lateral Longitudinal Total
VEHICLE TRAJECTORY Exit· Angle Cdeg.l Roti·-Angle (deg.) Pitch -Angle (degJ
BARRIER DAMAGE
REFERENCES
FIELD PERFORMANCE DATA2
REMARKS
UNAV- unavailable
Operational Median Barrier End Treatments (Continued)
7'-0" !5'-6" 2 SPACES@ POST SPACI~ ~-;;----t-+- I ;;J ' " ~
. ~TERMINAL..- ANCHOR . 6'·3"• 12· . §6- 3 POSTS t -l CABLE I I I ,,0.
1 AUEMILY ~--= ;~ c . . )
. 3/16",30"STEEL ":~ I MB4S SYSTEM
3/16" x 12" STEEL II!.. PLAN
22 GA. 155 GAL. :_,.-STEEL EIARREL 30"~ rl2"f!_. IOGA. MICHIGAN
~NO) SHOE E:-: .'-a" 8 9-iL ·- ·\ " 12'1 '·' ,., ~· T: !·: . ' ., _______ '·' :.' ' .,
II 2-3
':'; . t}~ ,kj . "~ ' ··~ '' ' J,'"' 'I ,
0 ..
2'-6" ' . ~ ~ 3-
~~.(OTY•) • LJ_l_
ELEvATro~ MBET2
Median Barriei<:;~~eak~~~l Cable Terminal
TYPICAL POST - W5x8.5 steel; TERMINAL POST - TS6"x6"x0.1875" steel breakaway design; ANCHORAGE- Cable assembly (see sketch); FOOTING-24" diameter, 30" deep concrete for terminal posts, other posts require none; TYPICAL RAIL - steel "W" section, 12 GA.; TERMINAL RAIL- 3/16"x30" steel plate; OFFSET BRACKETS- 6"x6" steel blocks.
HEAD ON IMPACT SIDE IMPACT
58 62 0 26 4500 4500
. ~25 5.34
.
3.0 6. 5 9. 7 6.0 UNAV UNAV
N0AP3 •0
UNAV ~10 ;:,]5 =<20
Entire terminal rail and 5 ter- 12' of terminal rail and 20' of minal posts typical rail, 4 -terminal posts
and 4 typi ca 1 posts
27 27 .
NO
This system was tested with the MB4S system. Other- documented tests have been conducted with the MB3 and NB4S systems but With the ter-minal posts (TS6"x6"x0.1875" and W6x8.5) welded to a base plate at grade. See Appendix C. Although not· documented by crash tests, this system could also be adapted for u~e ll'ith the MB2 and MB5 systems.
100 millisecond overage untett otherwise noted 2 tt -avail able.-· see. summary In ·Appendix A 3NOAP - -not -appl i cab 1 e 4Maximum dynamic deflection
124

Table IV-B-5.
Metric Conversions
I ft. "0.3~m I in. = 2~.4 mm I mph" 1.61 kmlhr I lb. "0.4~k~
SYSTEM
BARRIER DESCRIPTION
IMPACT PERFORMANCE
IMPACT CONDITIONS Speed (mph) Angle (deg.) Vehicle Wei<;~hl ((b. )
BARRIER Deceleration Distance {ft.)
VEHI~ ACCELERATIONS CG's)1
Lateral Longitudinal TotO I
VEHICLE TRAJECTORY Exit Angle (deg.) Roll Angle (deg.) Pitch Angle (deo.l
BARRIER DAMAGE
REFERENCES
FIELD PERFORMANCE OATA2
REMARKS
UNAV- unavoilobl~
Operational Median Barrier End Treatments (Continued)
tt 24'·3"
11:1 1=~ TI ~ ~
II It Jl: [ : I ~
CD HIDRI CARTRIDGE
@ DIAPRAGMS PLAN
@ THRIE BEAM PANELS
... GJ~, ••• , cr -2-8 4 3
12'-o" ~LOTTED HOLES
I -- ''\ill
(j) ELEVATION (if
MBETJ
Hi-dri cell cartridges used in conjunction with telescoping steel thrie beam fender panels.
HEAD ON IMPACT SIDE IMPACT
62.0 63.0 0 20 Pontiac Sedan 1968 Buick leSabre
UNAV UNAV
UNAV3 15.0 8.0~ 5.0
UNAV UNAV
UNAV 8 less than IO 0 less than IO 0
Hi~dri cell cartridges destroyed. Thrie beam not damaged. None
34 34
NO
Vehicle yawed 48u in headHon test. Slight barrier damage reported in all tests.
1!50 millisecond avilraoe unle&ll otherwlu noted 2 11 available, fleet 11ummary In Appendix A
"3 Peak acceleration
125
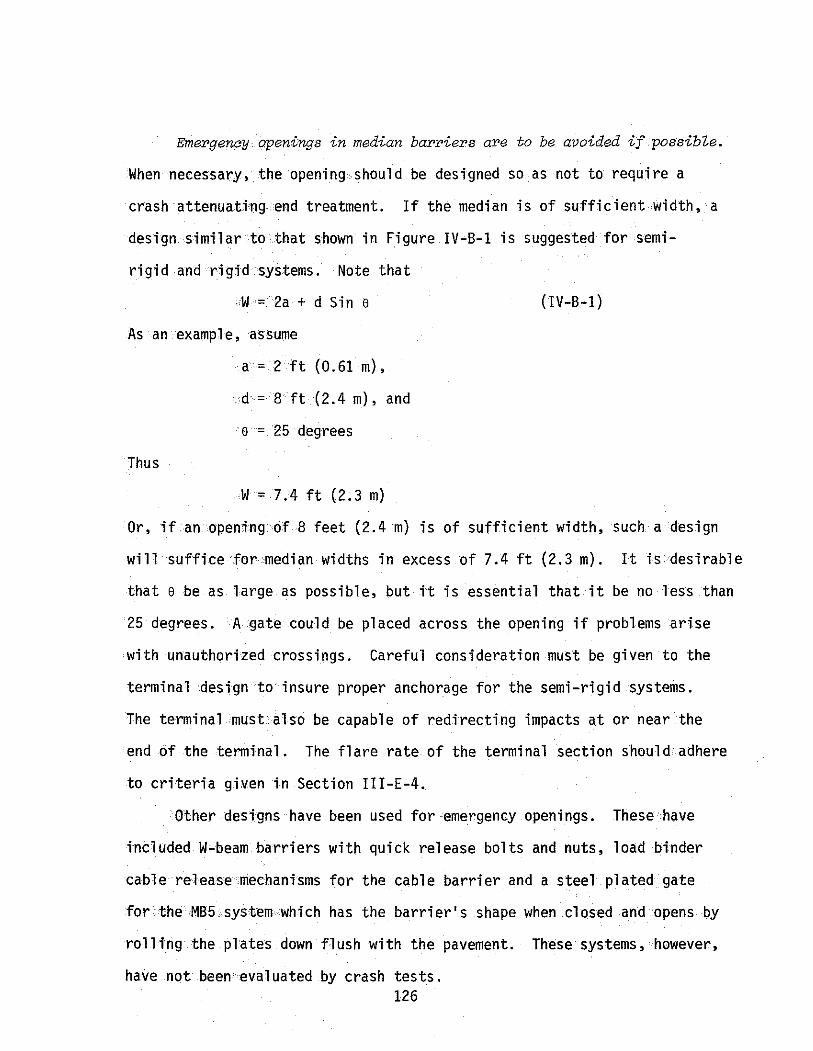
Emergenay openings in median barriers are to be avoided if possible.
When necessary, the opening.should be designed so as not to require a
crash attenua.Hng end treatment. If the median is of sufficient width, a
design. similar to that shown in Figure IV•B-1 is suggested for semi
rigid and rigid systems. Note that
W = 2a + d Sin e (IV-B-1)
As an example, assume
a= 2ft (0.61 m),
· d'= 8ft (2.4 m), and
e = 25 degrees
Thus
W = 7.4 ft (2.3 m)
Or, if an opening of 8 feet (2.4 m) is of sufficient width, such a design
will suffice for median widths in excess of 7.4 ft (2.3 m). It is desirable
that e be as large as possible, but it is essential that it be no less than
25 degrees. A gate could be placed across the opening if problems arise
with unauthorized crossings. Careful consideration must be given to the
terminal design to insure proper anchorage for the semi-rigid systems.
The terminal must also be capable of redirecting impacts at or near the
end of the terminal. The flare rate of the terminal section should adhere
to criteria gi)Jen in Section III-E-4.
Othe.r designs have been used for emergency openings. These :have
included W-beam barriers with quick release bolts and nuts, load binder
cable release mechanisms for the cable barrier and a steel plated gate
for the MB5 system which has the barrier's shape when closed and opens by
rolling the plates down flush with the pavement. These systems, however,
have not been evaluated by crash tests. 126

* e must be ::: 25 degrees.
**The flare rate of the terminal section should not exceed the flare rates suggested in Section JII-E-4 (Table m-E-1).
Figure IV-B-1. Suggested Emergency Opening Design for Semi-Rigid or Rigid Systems
IV-C. Maintenance Characteristics
Section III-C contains a discussion of the maintenance factors to
consider before selecting a roadside barrier. Those factors are essen
tially the same ones that should be considered before selecting a median
barrier. The reader should therefore refer to Section III-C and Table
III-C-1. There are, however, some differences in maintenance consider
ations between the two types of barriers and these are discussed below.
The extent of median barrier damage for a given set of impact
conditions will depend on the strength of the barrier. Where available,
the tables in Section B of this chapter give the barrier damage as a
result of a crash test for specific impact conditions. To supplement
these data, a gross survey was made of several states to determine typ
ical collision repair values experienced in the field. Table IV-C-1
summarizes the available field data. It should be remembered that these
are average values needed to repair a damaged section and not average
values based on all hits. Many hits are only brushes and cause no
appreciable barrier damage.
Information in Table IV-C-1 was taken from both urban and rural
areas. However, the data did not permit a differentiation between the
two. It is speculated that the majority of the impacts with road-
side barriers occur in urban areas where traffic densities are high.
More manpower is usually needed for traffic control purposes in urban
areas than rural areas. In this regard, the hazard to both the motorists
and the crew during repairs should be a major concern. Operating speeds
for the roadways are unknown but it is probable that the data came pri
marily from high speed facilities.
128
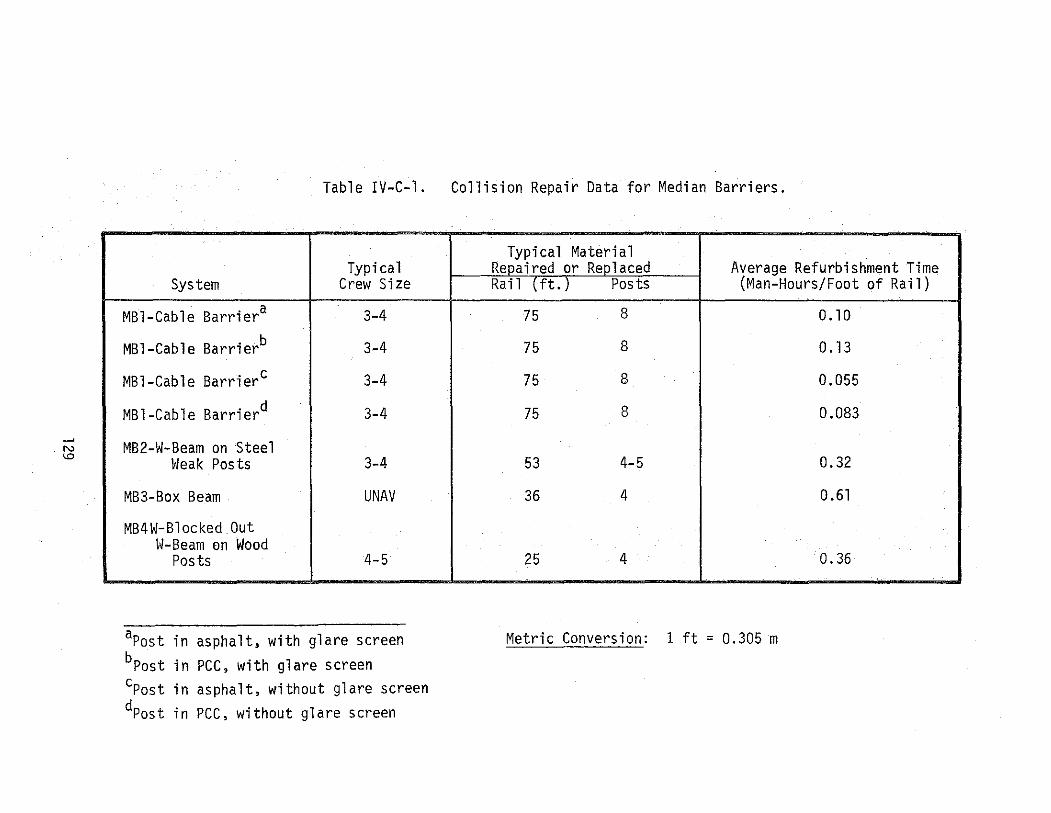
N
"'
Table IV-C-1. Collision Repair Data for Median Barriers.
Typical System Crew Size
MBl-Cable Barriera 3-4
MBl-Cable Barrierb 3-4
MBl-Cable Barriere 3-4
MBl-Cable Barrierd 3-4
MB2-W-Beam on Steel Weak Posts 3-4
MB3-Box Beam UNAV
MB4W-Blocked Out W-Beam on Wood
Posts 4-5
aPost in asphalt, with glare screen bPost in PCC, with glare screen cPost in asphalt, without glare screen dPost in PCC, without glare screen
Typical Material Repaired or Replaced Average Refurbishment Time Rail (ft.) Posts (Man-Hours/Foot of Rail)
75 8 0.10
75 8 0.13
75 8 0.055
75 8 0.083
53 4-5 0.32
36 4 0.61
25 4 0. 36
Metric Conversion: 1 ft = 0.305 m
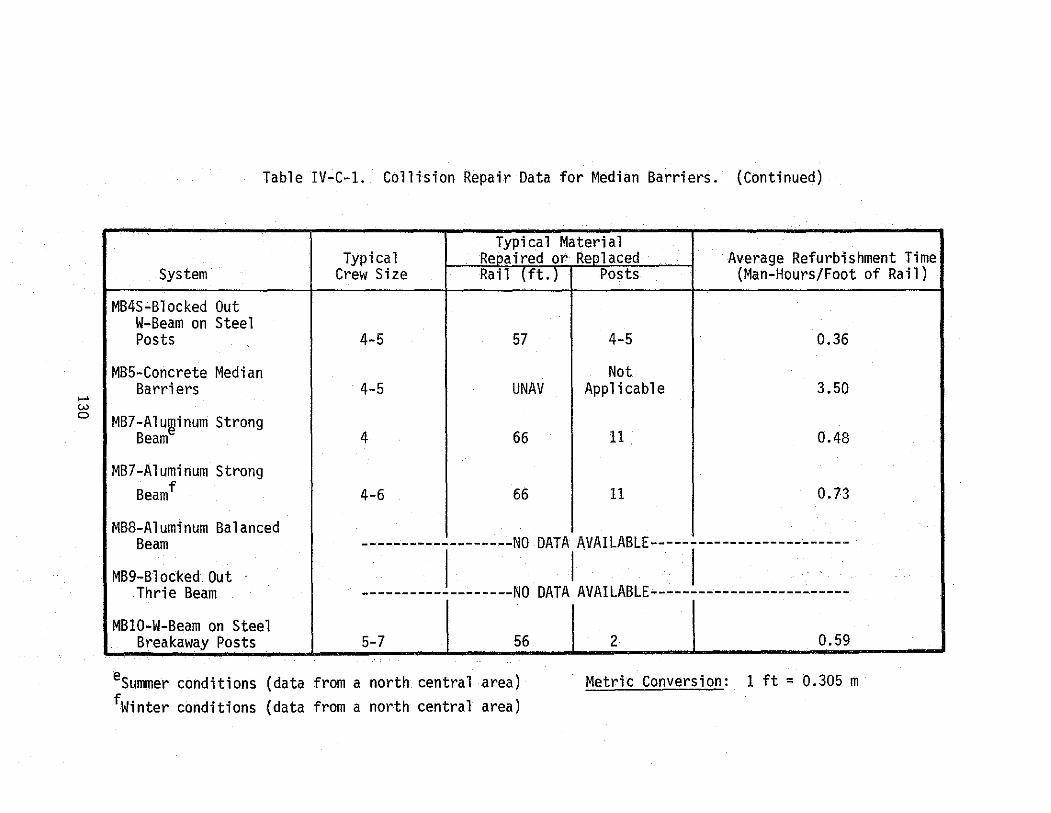
.... w 0
Table IV-C-1. Collision Repair Data for Median Barriers. (Continued)
Typical Material Typical Reoaired or Reolaced Average Refurbishment Time
System Crew Size Rail (ft:T Posts (Man-Hours/Foot of Rail)
MB4S-Blocked Out W-Beam on Steel Posts 4-5 57 4-5 I 0.36
MB5-Concrete Median Not Barriers 4-5 UNAV Applicable 3.50
MB7-Alu~inum Strong Beam 4 66 11 0.48
MB7-Aluminum Strong Beamf 4-6 66 11 0.73
MB8-Aluminum Balanced Beam -------------------NO DATA AVAILABLE-------------------------
MB9-Blocked.Out I I I Thrie Beam -------------------NO DATA AVAILABLE-------------------------
MB10-W-Beam on Steel j__ I Breakaway Posts 5-7 56 2 0.59 ------- ---- ------
eSummer conditions (data from a north central area) fWinter conditions (data from a north central area)
Metric Conversion: 1 ft = 0.305 m

It must be noted that the relatively high refurbishment time for
the MB5 system can be misleading. Although the typical length of barrier
repaired was unavailable, it is widely known that the MB5 system requires
far less maintenance than any other longitudinal barrier.
With regard to environmental factors, questions have arisen about
the potential of snow drifting on the MB5 system and the MB6 system, due
to their large frontal area. At this time, there is no documented
evidence that these barriers cause any more drifting than other barriers.
However, an effort should be made to determine if such a problem exists
before insta 11 ing these barriers on roadways with high snowfa 11 s.
IV-D. Selection Guidelines
Once it has been determined that a median barrier is warranted, a
selection must be made. Although the process is complicated by the
number of variables and the lack of objective criteria, there are guide
lines which should be followed. In general, the most desirable system
is one that offers the best protection at the least cost and is consis
tent with the given constraints. Table IV-D-1 presents nine items which
should be considered before a selection is made.
The first item in the selection process is to determine the type
of median barrier recommended for the given median width. This is done
by use of Table IV-B~4. Then a selection must be made from the avail
able barriers within the type recommended, i.e., rigid, semi-rigid, or
flexible. In this regard, the designer must give careful consideration
to the deflection characteristics as well as the safety aspects of the
available barriers. Detailed discussions of these characteristics are
given in Section B. 131
Table IV-D-1. Selection Criteria for Median Barriers
Item Consideration
A. Median Width and Deflection
B. Strength and Safety
C. Maintenance
D. Compatibility
E. Costs
F. Field Experience
G. Aesthetics
H. Promising New Design
1. Criteria in Table IV-B-4 should be used.
2. Dynamic deflection of barrier should not be greater than onehalf of median width.
3. Cable barrier should be placed on flat medians.
1. System should contain and redirect vehicle at design conditions.
2. System should be least hazardous available, consistent with costs and other considerations.
1. Collision maintenance.
2. Routine maintenance.
3. Environmental conditions.
1. Can system be transitioned to other barrier systems?
2. Can system be terminated properly?
1. Initial costs.
2. Maintenance costs.
3. Accident costs to motorists.
1. Documented evidence of barrier's performance in the field.
1. Barrier should have pleasing appearance.
1. It may be desirable to install new systems on an experimental basis.
132
Maintenance factors which should influence median barrier selec
tion are discussed in Section C of this chapter. Available maintenance
data on the operational systems are also presented there. A special
point of interest in maintenance concerns the availability of replacement
parts, as well as their interchangeability and acceptable alternates.
Recent shortages in some barrier hardware has pointed to the need for
advance planning and alternate hardware. Before selecting a system
material suppliers should give some assurance of future availability.
Reference should be made to the discussion of standardization in Section
IV-B-1.
.Compatibility is a very important item that should be considered
in the selection process. Two major deficiencies of many median barriers
are the absence of crashworthy transitions and the absence of crash
worthy end or terminal treatments. In selecting a median barrier, strong
consideration should be given to its adaptability to operational transi
tions and end treatments. Sections IV-B-2 and IV-B-3 address these
problems and present the operational transitions and end treatments.
Initial costs and future maintenance costs of each candidate median
barrier should be carefully evaluated. As a general rule, the initial
cost of a system increases as the rigidity or strength increases, but
the maintenance costs usually decrease with increased strength. Consid
eration should also be given to the costs incurred by the motorist as a
result of collision with the barrier. Both damage costs to the vehicle
and injury costs to the occupants need to be evaluated for a typical
collision. The decision may ultimately involve the question of what
level of protection the state or agency is able to provide. The procedure
133
presented in Chapter VII should provide a means with which to approach
this question.
Item F in Table IV-D-1 concerns the field experience. There is no
substitute for documented evidence of a barrier's field performance. In
this regard, the evaluation forms for each operational system, presented
in Section B of this chapter, indicate the availability of field data.
If none exists, the state or agency which developed and implemented the
system should be contacted for data and their views and comments.
With regard to aesthetics, the barrier should have a pleasing
appearance. However, under no circumstances should aesthetics justify
a compromise in the crashworthiness of the selection.
Many of the experimental systems included in Appendix B exhibit
excellent impact performance characteristics. The designer should give
serious consideration to the installation of some of the barriers, at
least on an experimental basis. The performance of the barrier should
be monitored, and if proven satisfactory, it may be installed on a
permanent basis.
IV-E. Placement Recommendations
Major factors to consider in the lateral placement of a median
barrier are the effects of the terrain between the edge of the traveled
way and the barrier on the errant vehicle's trajectory, and the flare
rate of transition sections. Another factor of concern is rigid objects
in the median.
A discussion of these factors and the available criteria related
thereto follows. 134
IV-E-1. Terrain Effects
Terrain conditions between the traveled way and the barrier can
have significant effects on the barrier's impact performance. Curbs and
sloped medians (including superelevated sections) are two prominent
features which deserve special attention. A vehicle which traverses one
of these features prior to impact may go over the barrier or submarine
under the barrier or snag on its support posts. Research studies have
provided considerable insight regarding the dynamic behavior of an auto
mobile upon traversing these features. Automobile orientation (trans
lation and angular position) as a function of distance off the traveled
way is now known for a number of curbs and slopes for various encroach
ment conditions (speed and angle of vehicle). Thus, the impact position
of a car relative to a given barrier, placed at a given lateral distance
from the traveled way, is now known for a variety of conditions. Back
ground data, upon which the criteria in this section are based, are pre
sented and discussed in Appendix F.
Curbs - In general, it has been found that curbs offer no safety
benefits on high-speed roadways from the standpoint of vehicle behavior
following impact. It is therefore suggested that a curb, either when
used alone or when placed in front of a median barrier, not be used for
purposes of redirecting errant vehicles. Although curbs may improve
delineation and drainage, it is suggested that other methods can be used
to achieve these functions.
If special conditions require the use of a curb and if a median
barrier is to be placed behind the curb, the reader should refer to the
135
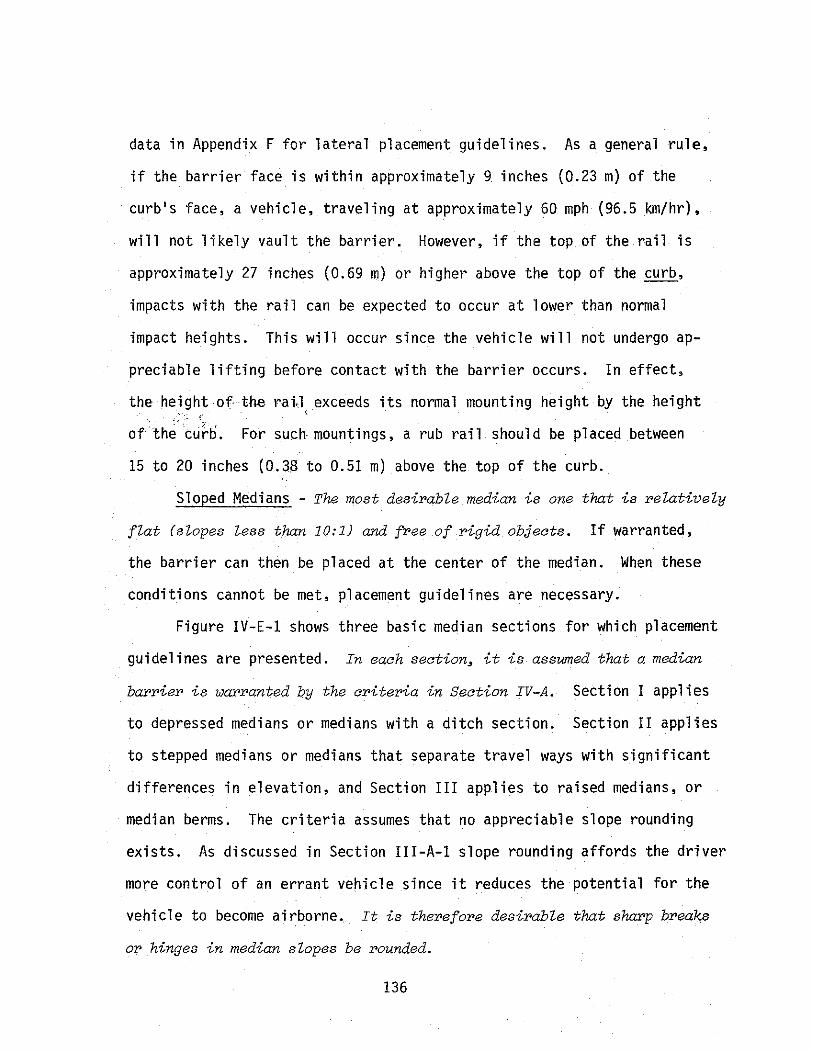
data in Appendix F for lateral placement guidelines. As a general rule,
if the barrier face is within approximately 9 inches (0.23 m) of the
curb's face, a vehicle, traveling at approximately 60 mph (96.5 km/hr),
will not likely vault the barrier. However, if the top of the rail is
approximately 27 inches (0.69 m) or higher above the top of the curb,
impacts with the rail can be expected to occur at lower than normal
impact heights. This will occur since the vehicle will not undergo ap
preciable lifting before contact with the barrier occurs. In effect,
the height of- the rai.l, exceeds its normal mounting height by the height
of lhe cu,~ti. For such mountings, a rub rail should be placed between
15 to 20 inches (0.38 to 0.51 m) above the top of the curb.
Sloped Medians - The most desirable median is one that is relatively
flat (slopes less than 10:1) and free of rigid objects. If warranted,
the barrier can then be placed at the center of the median. When these
conditions cannot be met, placement guidelines are necessary.
Figure IV-E-1 shows three basic median sections for which placement
guidelines are presented. In each section, it is assumed that a median
barrier is warranted by the criteria in Section IV-A. Section I applies
to depressed medians or medians with a ditch section. Section II applies
to stepped medians or medians that separate travel ways with significant
differences in elevation, and Section III applies to raised medians, or
median berms. The criteria assumes that no appreciable slope rounding
exists. As discussed in Section III-A-1 slope rounding affords the driver
more control of an errant vehicle since it reduces the potential for the
vehicle to become airborne. It is therefore desirable that sharp breaks
or hinges in median slopes be rounded.
136
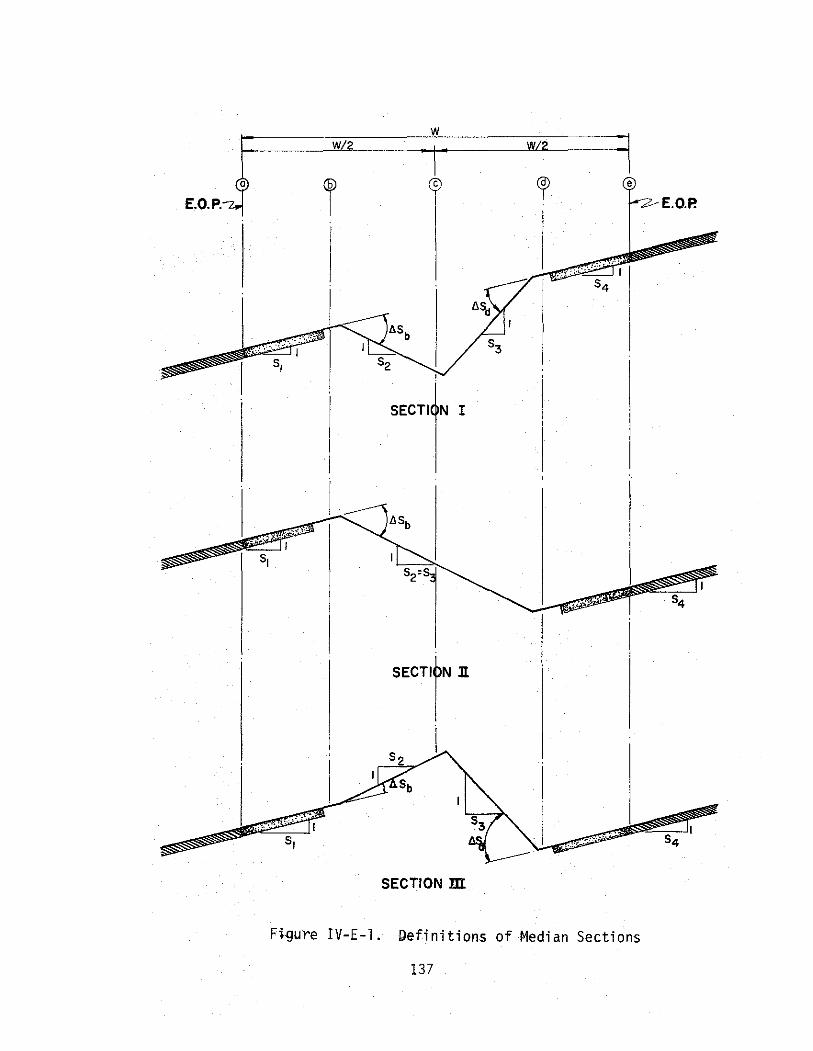
w W2
E.O.P. a i c
E.O.P.
: • • 1
I I 54
I
I
SECT! N I
- ~·.
. .. _..,.
SECTION m
Fl.gure IV-E-1. Definitions of Median Sections
137
Section I - The slopes and the ditch section should first be checked
by the criteria in Section III-A to determine if a roadside barrier is
warranted. If both slopes require protection, a roadside barrier should
be placed near the shoulder on each side of the median ("b" and "d"). If
only one slope requires protection, e.g., s3, a median barrier should be
placed at "d". In this situation, a rigid or semi-rigid barrier is sug-
gested, and a rub rail should be installed on the ditch side of the bar-
rier.
If neither slope requires protection but t.Sb or t.Sd is greater than
approximately 6 degrees, a median barrier should be placed on the side
with the larger liS. For example, if
0 t.Sb = 12 , and
0 t.Sd = 10 ,
the barrier would be placed at "b". A rigid or semi-rigid system is
suggested in this situation.
If t.Sb and t.Sd are both less than approximately 6 degrees, a
median barrieP should be placed at or near the center of the median (at
"c"). Any type of median barrier can be used, provided its dynamic
deflection is not greater than W/2.
Section II - If t.Sb is greater than approximately 6 degrees, a
median barrier should be placed at "b". If the slope is not traversable
(rough rock cut, etc.) a roadside barrier should be placed at "b" and
"d". It is not unusual for this section to have a retaining wall at "d".
If so, it is suggested that the base of the wall be contoured to the
exterior shape of the MB5 system.
138
If ~Sb is less than approximately 6 degrees, a median barrier
should be placed at or near the center of the median.
Section III - Placement criteria for median barriers on this
cross-section are not clearly defined. Research has shown that such a
cross-section, if high enough and wide enough, can itself redirect
vehicles (see MBR2 system, Table B-4, Appendix B).
As a general rule, if the cross-section itself is inadequate for
redirecting errant vehicles, i.e., the slopes are relatively flat, a
semi-rigid median barrier should be placed at the apex of the cross
section.
If the slopes are not traversable (rough rock cut, etc.), a road
side barrier should be placed at "b" and "d.... If retaining walls are
used at "b" and "d", it is recommended that the base of the wall be
contoured to the exterior shape of the MB5 system. Guidelines for the
orientation of the MB5 shape on superelevated sections is as shown in
Figure IV-E-2.
When a median barrier is warranted, it is desirable that the same
barrier be used throughout the length of need, and that the barrier be
placed in the middle of a flat median. However, it may be necessary to
deviate from this policy in some cases. For example, the median in
Section I of Figure IV-E-1 may require a barrier on both sides of the
median. If a median barrier is warranted upstream and downstream from
the section, it is suggested that the median barrier be ''split'' so that
continuity is maintained. This is illustrated in Figure IV-E-3. Most
of the operational median barriers can be split this way, especially the
W-beam types and the MB5 system. It involves a transition on both ends
139
,_ -1'. 0
AXES OF SYMMETRy
I~ VERTIC
(a) IDEAL
Figo"' IV-£-2. Sogg,,tod o,;,,t,tfoo of HBS Sh,., oo SopoceJ'''''' 50<tfoo,. (b) BEST COMPROMiSE
-
~ '·;-;:..
_, TRAFFIC '
. ,;,••1· EQP_ . I c•p
.- BOUNDARIES OF median barrier STEPPED MEDIA
!i;: >-'
.,--FLAT MEDIAN---:
-... .::-·:~~'7 ,. -:. ~-
TRAFFIC .... ,
*Flare rate should not exceed suggested limits (Section m-E-4).
Figure IV-E-3. Ex-ample of fledian Barrier Placement at Superelevated Section
~ 9'~
-<. ~«;/' ,_..., .....
~" /
and a compatible operational roadside barrier at the superelevated section.
It is noted that although a rigid roadside barrier similar to the MB5
system has not been tested, such a system will obviously perform the same
as the MB5 as long as it is structurally adequate. In other words, the
impact performance of the MB5 shape has been clearly established.
A layout similar to that of Figure IV-E-3 is also suggested where
depressed medians require barriers on both sides of the median, or at the
approach to a divided structure.
IV-E-2. Flare Rate
When it becomes necessary to flare a median barrier, such as at a
rigid object in a median, divided structures, etc., the flare rate
should not significantly increase the hazard potential of the barrier.
The flare rates given in Table III-E-1 for roadside barriers apply to
median barriers also. Reference should be made to Figure III-E-4 for
parameter definitions.
Another special layout problem concerns medians whose widths are
such that a median barrier is not warranted but that have a rigid object
which warrants shielding. Typical examples are bridge piers and an over
head sign support structure. If shielding is necessary for one direction
of travel only, or if the object is in a depressed median and shielding
from either or both directions of travel is necessary, the criteria of
Chapter III should be used. If shielding for both directions of travel
is necessary and if the median is flat (side slopes less than approximately
6 degrees), two means of protection are suggested. In the first case, the
designer should investigate the possible use of crash cushions to shield
the object (see Section VI-F). The second suggestion is illustrated in
142
~ ..,. w
(TRAFFIC
•:.>.: ___ • ••• ,,. ~c .-~~,-'· , •• '.·;· EQP~ .. Crashworthy median barrier terminal--
Operational roadside barrier •. • .... . .. · .-,. .~···.,... •. . . i. ·. • .. • v . · ..... , ... EOP .. .
... TRAFFIC'
NOTE: Designer should also investigate use of crash cushion to shield hazard.
Figure IV-E-4. Suggested Layout for Shielding of Rigid Object in Median
Figure IV-E-4. If semi-rigid systems are used, the barrier-to-hazard
distance should be greater than the dynamic deflection of the barrier
(see Table III-B-1).. If the MB5 shape is used, the barrier can be
placed adjacent to the hazard, as shown in Figure IV-E-4. However, the
MB5 system should be used with discretion if the distance from the EOP
to the barrier is greater than approximately 15 feet (4.6 m).
IV-F. Upgrading Substandard Systems
Some existing median barriers are not necessary while others are
substandard and will not meet suggested performance levels. Substandard
barriers usually fall into one of two categories, namely, those that
have structural inadequacies and those that are improperly located.
Figure I:II-f-1 of Chapter I II presents an inspection procedure
designed to idel'ltify unnecessary or substandard roadside barriers. The
same inspeation pr>oaedure should be followed for> median barriers, and
it is suggested that it be aonduated on a regularly saheduled basis.
Personnel perfo:rming this inspeation should stay abreast of aur>r>ent
traffia barrier standards and guidelines, as wen as promising new
r>esearah findings.
With regard to item 3 of Figure III-F-1, the criteria presented in
Section IV-H ·should be used where possible to evaluate existing systems.
•Of cours·e, there is no substitute for field data or accident records to
evaluate the performance of a system. If a barrier system is judged
substandard, it is suggested that the barrier> either> be modified to
aonfor>m to an operational system, or> be r>eplaaed by an operational sys
tem. It is recognized that this action is not always feasible and other
144

remedial action must be taken. Table III-F-1 of Chapter III lists
common structural inadequacies that occur and the suggested remedial
action. If the upgraded system does not conform to an operational
system, crash tests are suggested to verify the design, especially
if substantial use of the system is planned.
The criteria given in Section IV-E should be used to evaluate the
adequacy of the lateral placement of existing barriers. If the barrier
is placed in a depressed median or a median with surface irregularities,
it may not function properly. If improperly located, corrective measures
should be considered. If necessary, the barrier can be moved near the
shoulder's edge, or returned to a position in which the approach terrain
to the barrier is no steeper than the criteria suggest. Another possible
solution would be to extend the shoulder to the lateral distance desired,
and place the barrier on the shoulder. Steep flare rates for approach
and transition sections should be flattened to conform to the suggested
criteria.
With regard to item 5 of Figure III-F-1, the rail height of an
operational system should be approximately equal to the original design
height of the system. In any case, it is suggested that the barrier be
approximately 27 inches (0.69 m) above the ground or greater. The cable
in the MB1 system should not be less than 27 inches (0.69 m) and not
greater than approximately 28 inches (0.71 m).
In some cases, the effective rail height will be decreased due to
an accumulation of dirt, pavement overlays, etc. Of course, dirt should
be removed if feasible to return the barrier to its. correct height.
145
If necessary and if the length and strength of the post and foundation
permits, the rail can be raised an appropriate amount. If not, it may
be necessary to install taller posts with added strength and deeper
embedment to accommodate the increased rail height.
Items 6 and 7 of Figure III-F-1 can be accomplished by maintenance
personnel.
146

V. BRIDGE RAILS
A bridge rail is a longitudinal harrier whose primary function
is to prevent an errant vehicle from going over the side of the bridge
structure. Metal rails and concrete parapets are the most common types
of bridge rails. It is the purpose of this chapter to delineate the
criteria pertinent to the various elements of bridge rail design,
including warrants, structural and safety characteristics of operational
systems, maintenance characteristics of operational systems, selection
guidelines, placement recommendations, and guidelines for upgrading sub
standard installations.
Information in this chapter is intended as supplement and not as
a replacement to existing AASHTO design criteria and specifications for
highway bridges, including bridge rails (~ 87).
V-A. Warrants
Current criteria suggest that bridge rails should be installed on
all bridge structures. However, the view is now held by some highway
engineers that this criteria is too restrictive and in some cases has
resulted in the unnecessary use of bridge rails. A possible example of
this would be their use on a short structure that spans a shallow stream
or drainage area on a low volume rural roadway. Many such structures do
not have an approach roadside barrier to shield the bridge rail end. It
is likely that the exposed end of the rigid bridge rail is more hazardous
to the motorist than would be the stream or drainage area. Judgment must
therefore be used to determine if the overall hazard of the bridge rail
and the approach roadside barrier necessary to shield the bridge rail
147

end is less hazardous than the roadside condition being shielded. Warrants
for barriers to S'hi,eld culverts can be estab 1 i shed from the criteria in
SecUon III-A. If warranted, a roadside barrier will probably suffice for
shielding culv:ert openings.
When the !bridge a 1 so serves pedestrians and/or cyclists, a barrier
to shield tlrem from the traveled way may be warranted. In addition, a
pedestrian rail at the bridge's edge may a 1 so be warranted. If .necessary,
a "fence" should be placed on the side of the bridge to prevent pedestrians
from throwi,ng ,hazardous objects on a roadway bel ow. The need for pedes
trian and/or cycHst railing should be predicated on an evaluation of
the density and ,qperating speed of the vehicles and the number of pedes
trians and/or cyclists using the bridge.
Exposed ,brid,ge rail ends or parapet walls are to be cwoided. In
most designs, ,an approach roadside barrier with a smooth transition to
the bridge ba:rrier is warranted. Chapter III contains warrants for ap-
proach barriers,, 'operational transitions and roadside barrier end treat
ments and 'Placement recommendations.
Reports of accidents in which vehicles collided with barriers on
and near ,bddges were examined, and factors causing the accidents were
stuMed ( 36).. It was reported (36) that "from 1:967 to 1969, California
and Texas experienced a notable decrease -- from 52 to 13 percent and
57 to 2.5 percent,, respectively -- in the proportion of single-vehicle
accidents occundng at the ends of bridge rails or parapets. Th,is
probably reflects the emphasis placed on smooth transitions."
Figure v~A-1 is included to further illustrate the need for shield-
ing a bridge ra'il end. It can be shown that of all possible impacts with the
bridge rail :for a vehicle leaving the traveled way at an angle a, the
probability, 'P, ,of ,impacting the end of the rail is given by
148
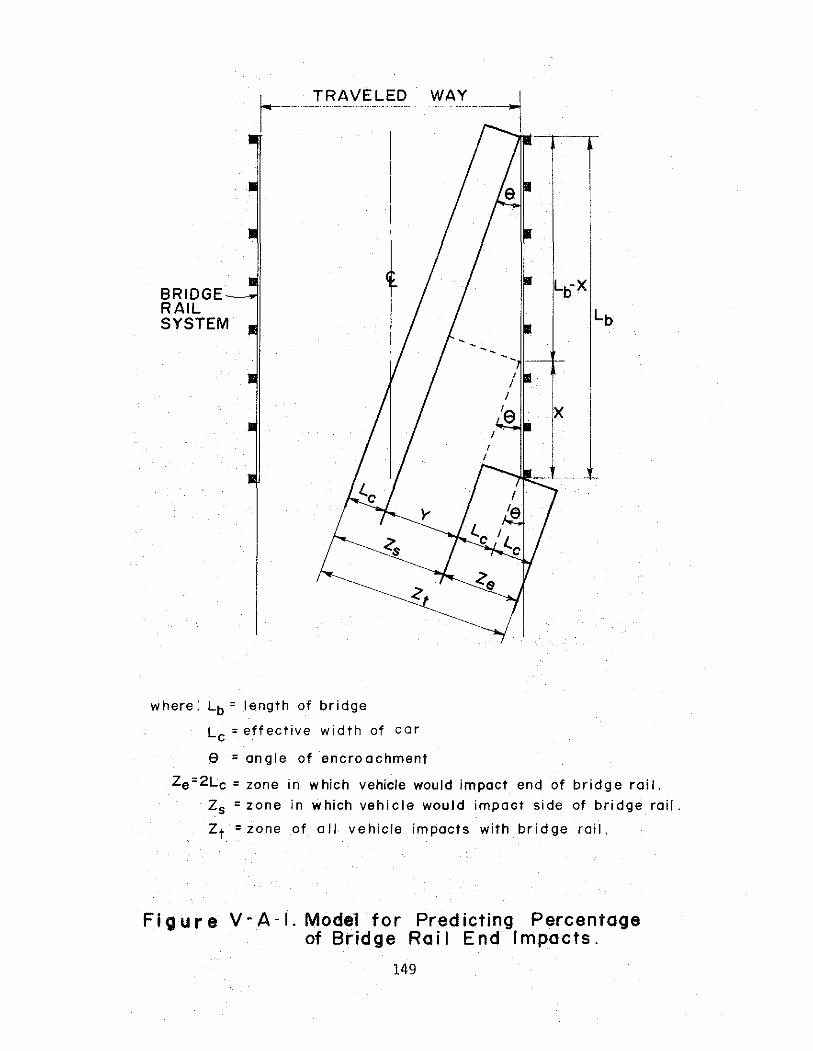
BRIDGE RAIL SYSTEM
where: Lb = length of bridge
Lc =effective width of car
e =angle of encroachment
Ze=2Lc =zone in which vehicle would impact end of bridge roil.
Zs =zone in which vehicle would impaot side of bridge rail.
Zt =zone of all vehicle impacts with bridge roil.
Fi our e V-A -I. Model for Predicting Percentage of Bridge Rail End Impacts.
149
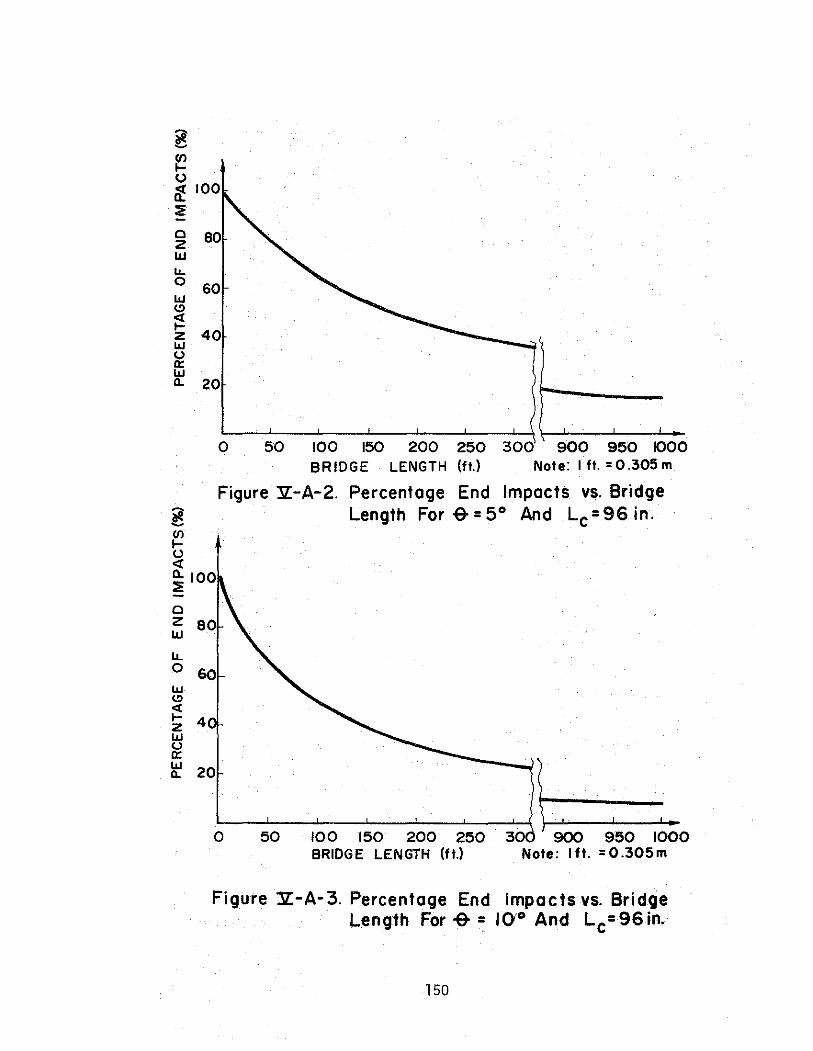
~ ~ 0 ~ 100 ~
0 so 2 UJ IJ... 0 60 UJ (!)
;! 40 2
11..1 u a: 11..1 a. 20
0 50 100 150 200 250 300 900 950 1000 BRIDGE LENGTH (ft.) Note: I ft.= 0.305 m
Figure Jz:-A-2. Percentage End Impacts vs. Bridge ~ Length For -&=5° And Lc=96in.
0 2 UJ
lJ.. 0
llJ (!) <l 1-2 11..1 u a: 11..1 a.
60
4
20
0 50 100 150 200 250 30 900 950 1000 BRIDGE LENGTH (ft.) Note: 1ft. =0.305m
Figure Jz:-A-3. Percentage End Impacts vs. Bridge Length For-&~ 10'0 And Lc=96in.
150
p = 2Lc X 100% (V-A-1)
Lb Sin e + 2L c
Figures V-A-2 and V-A-3 show this probability as a function of bridge
length for encroachment angles of 5 degrees and 10 degrees. Most
errant vehicles leave the traveled way at angles less than about 13
degrees. The effective width of the vehicle of 92 inches (2.3 m) is
assumed to represent an automobile in a partial skid.
Consider, for example, 10 degree encroachments for a bridge length
of 100 feet (30.5 m). It is predicted that of all impacts with the rail,
approximately 50 percent would impact the bridge end if no approach rail
were used.
V-B. Structural and Safety Characteristics
This section presents operational bridge rail systems and points
out desirable structural and safety characteristics.
Structural and safety characteristics of operational bridge rail
systems are presented in Table V-B-1. The information on each barrier
consists of a sketch, a system designation, barrier description, impact
performance, barrier damage, references, field performance data, and
remarks. Reference should be made to the introduction of Section III-B
for a discussion of each of these items. All of these barriers, with
the exception of the BR1 system have been crash tested. The BR1 is
considered operational since its shape has been evaluated through crash
tests (same face as MB5), and its strength satisfies the AASHTO specifi
cations (86, §Z). Note that the BR4 system was designed for use on
secondary roadways with maximum bridge widths of 32 feet (9.75 m).
Appendix B contains a summary of bridge rails which appear promising but
151
Table V-B-1. Operational Bridge Rail Systems
, •• 9"
_t' Cn" ,. -o"
..,, -.·,
. 1'-2" .
Metric Conversions t'-7" . ,;; . 1'-d
I ft. = 0.305 m s" I I lo • ~-4 mm ·•r-£. 2~3 I mph·" 1.61 kmlhr
IJ;!·. I lb. • o.4D4ko .. a" 1~6"
1'<5 10." .-
... r- I r£i ___:rES _::f C''::"'J I 1-----=--' .. .. ~:D
__.
SYSTEM BR1 BR2
BARRIER·'OESCRIPTION P()ST SPACING Continuously poured, reinforced, 10' 0" POST-TYPE" sloped face concrete section. Fabricated steel plates BEAM TYPE Shape of system simi 1 ar to MBS TS 6"x2"x\o" tubing (steel) OFFSET BRACKETS (Chapter IV). Barrier anchored None MOUNTINGS to bridge deck with appropriate Two 3/4" diameter steel bolts FOOTINGS reinforcing steel. Concrete parapet
IMPACT IMPACT IMPACT IMPAcT IMPACT PERFORMANCE ANGLE•l5" ANGLE•25° ANGLE•l5° ANGLE·• 26°
IMPAcT· CONDITIONS Speed (mph) NO TEST NO TEST NO TEST 57.0 Vohic;Je Weight (lb.) (See remarks (See remarks 4540
below) below) BARRIER
0.423 Dynamic Deflection Cft.)
VEHICLE ACCLERATIONSCG'e)1
Lateral UNAV Lonoitudinal UNAV Total UNAV
VEHICLE TRAJECTORY Exit Anole: Cdeg. l 6 Roll Angle- {deQ. l 0 Pitch Angle (deg.) ·5
20' of rai 1 section and 1 post. Some
BARRIER DAMAGE concrete spalling on parapet at posts.
REFERENCES 24
FIELD PERFORMANCE OATA2 NO NO
Safety aspects of barrier shape have Some vehicle snagging on posts. been evaluated by full scale crash Vehicle damage relatively
REMARKS tests (see MB5, Chapter IV). Struc- severe. tural adequacy has not been evaluated by crash tests (see more discussion in text).
UNAV- unavailable 1somilllsecond average unleas otherwise noted
2r-f aYCIIIabre. •••--summary _In Appendix A
3Pennanent set in barrier
152
Table V-B-1. Operational Bridge Rail Systems (Continued)
-~~ 3"
I co fl J ' Metric Conversions
., j I ft. = Q.:3~m ~ l~o I in. = 25.4 mm 34 [[]I· I ,._,. I mph= 1.61 km/hr 1"--iL I lb. c 0.4!54kg 17''
!r ' ' It l ,: J rz:-
,, '
td' " _::j~ J .... !! :!
-
1'-0" MIN
SYSTEM "'' Bll4
BARRIER DESCRIPTION ' POsT SPACING 8' 9" 6. J"
POST TYPE Fabricated steel Wf6x25 steel BEAM TYPE Two TS 5"x3"x!-.;" steel Two TS ]!~" x3';' xO. 25" (Steel) OFFSET BRACKETS None None MOUNTINGS UNAV 3/4" diameter steel stud bolts FOOTINGS Bridge deck Bridge deck
IMPACT IMPACT IMPACT IMPACT IMPACT PERFORMANCE ANGLE" 15o ANGLE,. 25o ANGLE•12" ANGLE • 25"
IMPACT CONDITIONS Speed (mph) NO TEST 55.0 64.0 NO EST Vehicle Weight (lb.) 3500 4550
BARRIER Dynamic Deflection (ft.) 0 0. 21
VEHICLE ACCLERATIONS(G'sJ Late rol UNAV 9.0 longitudinal UNAV 4. 7 Total 12.3 UNAV
VEHICLE TRAJECTORY Exit AnQie (deQ.) 1 3 Roll AnQie {deQ.) •0 5 Pitch Anole {deQ.) ·0 0
BARRIER DAMAGE Slight. 15' of rail section ood 3 posts.
REFERENCES 17 " FIELD PERFORMANCE OATA2
NO NO
Tested with 10" curb. Curb This bridge rail was designed severely damaged the steering. for use on secondary highways
REMARKS Subsequent studies have shown with maximum bridge widths of that wrb should not be used. 32 ft.
UNAV- unavailable 1eOmllll .. cond av•rage union otherwr .. not•d 2
rf avoi table, ••• summary in App•ndlx A 3rest results indicatE' ll' 0" po~t spacing is optimum although as~tested systems used 5' 3" and 9' 4';' spacing.
153
Table V-B-1. Operational Bridge Rail Systems (Continued)
Metric -Conversions '-'
I 1t. " 0.300m 12~· I ln. • 2~.4_mm -r mph" 1.61 .jcm/hr I lb. .. 0.4~4tl:g '-I
zl'
r~· J. ' . 'I 1 "
SYSTEM BR5
BARRIER DESCRIPTION -POST SPACING 6' 6" POST'TYPE Fabricated aluminum BEAM TYPE Two aluminum extrusions OFFSET BRACKETS None MOUNTINGS UNAV FOOTINGS Bridge deck
IMPACT IMPACT IMPACT IMPACT IMPACT,PERFORMANCE ANGLE" lSo ANGLE•27° ANGLE• ANGLE• I
fMPACT CONDITIONS I Spe'ed (mph) NO TEST 58.0 Vehicle Weight (lb.) 1956 Plymouth
BARRIER Dynamic Deflection (ft.) 1.4
VEHICLE ·ACCLERAnONSCG's/ lateral UNAV Longitudinal UNAV Total UNAV
VEHICLE TRAJECTORY Exit Angle (.deg.) oQ Roll An"gle- (deg.) UNAV Pitch Angr·e (dl:lg.) UNAV
BARRIER DAMAGE UNAV.
REFERENCES 1
FIELD PERFORMANCE DATA2 NO
REMARKS This system is similar to many state standards.
UNAI/- una vail abt e 1!iOmllll••eond ov.woge unl••• otherwise noted
21 f ovalloble, ... IUmmory In Appendix A
.
154
which do not have sufficient in-service use to be classified operational.
Table V-B-2 presents a summary of the impact performance data on
each of the operational systems. Unfortunately, acceleration data was
unavailable for several of the systems. Most of these systems were
developed and tested prior to the establishment of standard test pro
cedures.
Evaluation criteria for the impact performance of a bridge rail
are given in Table II-B-1 (longitudinal barrier). Recommended crash
tests to evaluate bridge rails, and other longitudinal barriers, are
given in Table II-B-2.
Omission of an existing bridge rail system is not meant to imply
that the system is non-operational. Many bridge rails have been designed
and installed which meet AASHTO bridge specifications (86, 87). It was
decided, however, that only those bridge rails that have been evaluated
through crash tests would be considered for inclusion in the guide.
Inclusion of all bridge rail designs which meet the AASHTO bridge speci
fications was beyond the scope of this guide. Although not required,
it is desirable that new bridge rail designs (as well as other new traffic
barrier systems) be evaluated by crash tests.
The degree to which the operational systems satisfy the recommended
structural and safety criteria of Section II-B varies. All are considered
to be structurally adequate. Although all do not satisfy the impact
severity criteria, the acceleration criteria is tenuous and currently
under review. Nonetheless, barriers which minimize impact forces should
receive strong consideration. With regard to the vehicle trajectory
hazard, it is desirable that the vehicle be redirected parallel to the
155
,_,, "'
Table V-B-2. Bridge Rail Crash Data Summary
Accelerations at 15° (G's) 2 Accelerations at 25° (G's) 2 Is
System Maximum Dynamic1 Deflection (ft.) Lateral Longitudinal Total Lateral Longitudinal Total
Barrier Hardwa3e I
Standardized? , .
BR1 4 No Test No Test No Test No Test No Test No Test No Test No
BR2 0.425 No Test No Test No Test UNAV UNAV UNAV Yes
BR3 ~o.oo No Test No Test No Test UNAV UNAV 12.3 Yes
BR4 0.21 6 9.0 4.7 UNAV No Test No Test No Test No
BR5 1.40 No Test No Test No Test UNAV UNAV UNAV Yes '- -------------~
UNAV - Unavailable. 1 Based on 25° impact unless otherwise noted. 2 50 millisecond average unless otherwise noted. 3 See reference 22, 23. 4 Although no tests have been conducted on this system, barrier and vehicle performance would be
similar to MB5 (Chapter IV). 5 Permanent set in barrier. 6 Based on 12° impact.
Note: 1 ft. = 0.305 m
barrier. An exit angle of 10° or less may be considered a non-hazardous
post impact trajectory.
Note that the rail heights range from 27 inches (0.69 m) to 34
inches (0.84 m). Barrier heights have been established as a result of
many years of research and field evaluations. Visibility or the ability
to see over the barrier was one of the more important factors in early
barrier height consideration. A minimum height of approximately 27 inches
(0.69 m) is a necessary, but not sufficient, condition to insure proper
barrier impact performance.
Current research indicates that the most desirable height of the
BR1 system is 32 inches (0.81 m). This height has been reached after
carefully evaluating factors such as vehicle redirection, sight distance,
and the psychological effect of barrier height on driver reaction.
Unless sufficient justification exists, variations in this height are to
be avoided.
A 10 inch (0.25 m) curb is shown in front of the BR3 barrier,
since this was the as-tested configuration of the barrier. However, as
discussed in Section V-E, curbs in front of harriers are to he avoided
where possible.
The designer should be aware of the impact performance sensitivity
of bridge rails to a number of factors. These include post spacing,
rail height, post size, rail tension, and end anchorage. Some of these
parameters have been investigated and the reader is encouraged to review
the results (~).
An effort has been made to standardize hardware for widely used
traffic barriers (22, ~). Standardization is beneficial in terms of
157

economy, improved availability of parts, readily available details
and specifications, reduced repair time, and reduced inventory of
replacement parts because of interchangeability of parts. Bridge rai 1 s
which have been standardized are so noted in the last column of Table
V-B-2. The referenced standardized documents continue to be revised
periodically and the designer should obtain the latest publications.
Where a pedestrian rail is to be provided in addition to the
traffic bridge rail, reference should be made to the AASHTO specifi
cations (86, 87) for its design requirements. Placement guidelines
for traffic and pedestrian rails are discussed in Section V-E.
Current design criteria for bridge rails, as well as other traffic
barriers, relates primarily to standard size automobiles. However, it
may be desirable in certain situations to install bridge rails which
can contain and redirect heavy vehicles, such as large busses and trucks.
Bridge structures which span roadways or which are near businesses
should be given careful evaluation, especially if the bridge carries
significant heavy vehicle traffic. With regard to heavy vehicle contain
ment, the BRE3 system shown in Table B-5, Appendix B, is a very promising
barrier. Crash tests have shown that it can safely contain and redirect
both automobiles and heavy vehicles. The BRl, although not designed
specifically for heavy vehicles, offers promise in this area also.
On the other hand, there is an awareness that the structural require
ments presented herein for bridge rails, and other longitudinal barriers,
may be too stringent on certain roadways. For example, bridges in
recreational areas such as state and federal parks often carry low traf
fic volumes at greatly reduced speeds. It seems reasonable that such
bridge rails need not be designed to the specifications for high speed-
158
high volume roadways. Once again, however, the lack of objective
criteria precludes the presentation of specific guidelines. The
engineer must once again rely on his best judgment. An NCHRP study._ is
planned which will focus on the need and design of traffic barri.ers for
roadways with lower levels of service. The designer should stay abreast
of developments in this area.
V-C. Maintenance Characteristics
Section III-C contains a discussion of the mai·ntenance factors
to consider before selecting a roadside barrier. Those factors are
essentially the same ones that should be considered before selecting a
bridge rail. The reader should therefore refer to Section III-C
and Table III-C-1.
The extent of bridge rail damage for a given set of impact
conditions will depend on the strength and shape of the barrier. Where
available, Table V-B-1 gives the barrier damage as a r.esult of a crash
test for the operational barriers. Efforts to supplement the crash test
damage data with field data were unsuccessful. The large number of
different bridge rail types in use within each state makes it difficult
to determine typical damage data for a specific bridge rail design.
Potential damage to the bridge deck as a result of vehicle impacts should
also be evaluated in selecting a bridge rail system.
An environmental factor to consider in barrier selection is its
potential for creating snow drifts. At this time, there is no evidence
that a particular barrier causes more drifting than other barriers.
However, an effort should be made to determine if such a problem exists
159

before installing a barrier on roadways with high snowfalls. Also,
the barrier should not impede the flow of rainfall from the traveled
way.
V-D. Selection Guidelines
Table V-D-1 presents eight items which should be considered in
selecting a bridge rail. Although these items are not necessarily
listed in order of importance, the strength and safety requirements should
never be compromised.
Section B of this chapter discusses the desirable strength and
safety aspects of a bridge rail. It also presents the deflection, strength,
and safety characteristics of operational bridge rails. If the bridge rail
is to be placed between traffic and pedestrians, it should not def"l ect or
permit vehicle structure protrusions into the sidewalk area.
Maintenance factors which should influence barrier selection are
discussed in Section C of this chapter. Available maintenance data on
the operational systems are also discussed there. A special point of
interest in maintenance concerns the availability of replacement parts.
Recent shortages in some barrier hardware has pointed to the need for
advance planning and alternate hardware. Before selecting a system,
material suppliers should give some assurance of future availability.
Reference should be made to the discussion of standardization in Section
V-B.
Compatibility is a very important item that should be considered in
the selection process. A major deficiency of many bridge rail systems is
the absence of a crashworthy transition section to the roadside barrier.
160
Table V-D-1. Selection Considerations for Bridge Rails
ITEM CONSIDERATIONS
A. Strength and Safety
B. Compatibility
C. Maintenance
D. Costs
E. Field Experience
F. Aesthetics
G. Promising New Designs
161
1. System should contain and redirect vehicles at design at design conditions.
2. Deflection should not exceed specified amount.
1. Can system be transitioned to other barrier systems?
1. Collision maintenance.
2. Routine maintenance.
3. Environmental conditions.
1. Initial costs.
2. Maintenance costs.
3. Accident costs to motorist.
1. Documented evidence of barrier's performance in the field.
1. Barrier should have a pleasing appearance.
1. It may be desirable to install new systems on an experimental basis.
Incompatibility of bridge rails with approach roadside barriers is
attributed i.n la,rge part to the proliferation of bridge rail types.
Highway engineers should strive to standardize bridge rail designs
with an eye toward compatible approach rail-to-bridge designs. Section
III-B addresses these problems and presents the operational transitions
and termi·nal designs.
Initial costs and future maintenance costs in particular should
be carefully evaluated. As a general rule, the initial cost of a system
increases as th.e ricgidity or strength increases, but the maintenance
costs usuany decrease with increased strength. Consideration s·hould be
given to the co·sts incurred by the motorist as a result of collision with
the barrier. Bot·h damage costs to the vehicle and injury costs to the
occupants need to ·be evaluated for a typical collision. The decision
may ultimately involve the question of what level of protection the state
or .agency is able to provide. The procedure presented in Chapter VII
should provi·de a means with which to approach this question.
Item E i·n Table V-D-1 concerns field experience. There is no sub
stitute for documented proof of a barrier's field performance. In this
regard, the impact performance data for each operational system, pre
sented in SecUon B of this chapter, indicates the availability of field
data.. If none exists, the state or states which developed and implemented
the system should be contacted for data and their views and comments .
.With regard to aesthetics,· the barrier should have a pleasing
appearance. In scenic areas, it may be appropriate to select a barrier
which allows the motorist the largest field of view possible. However,
aesthetic considerations should not be used to justify a compromis.e in
the crashworthiness of the selection.
162
Many of the experimental systems included in Appendix B exhibit
excellent impact performance characteristics. The designer should give
serious consideration to the installation of some of these barriers, at
least on an experimental basis. The performance of the barrier should be
monitored, and if proven satisfactory, it may be installed on a permanent
basis.
V-E. Placement Recommendations
A desirable feature of a bridge structure is that it provide a
full continuous shoulder so that the uniform clearance to roadside ele
ments is maintained (see discussion in Section III-E-1). It is also
desirable that the bridge rail be placed beyond the shy distance (see
discussion in Section III-E-4).
If possible, curbs in front of the bridge rail and other barriers
are to be avoided (see discussion in Section III-E-3). For speeds less
than 40 mph (64.4 km/hr), a barrier curb provides marginal protection for
pedestrians. If used for this purpose, it is desirable that the sidewalk
be offset from the curb as far as feasible to minimize the possibility
of pedestrian accidents.
If pedestrian protection is warranted, consideration should be
given to placing the bridge rail between the traffic and the sidewalk.
A hand rail (and protective fence if necessary) would be needed at the
outer edge of the sidewalk. It is desirable that the sidewalk not compro
mise the uniform clearance concept discussed previously. To avoid such
a compromise, it may be possible to cantilever the sidewalk off the edge
of the bridge deck.
163
V-F. Upgrading Substandard Systems
It has been estimated that 67 percent of all bridge rails do not
conform to current safety performance standards and another 25 percent
are considered mar.gina.l (36). Obviously, a major effort is needed to
upgrade a large number of bridge rails.
V-F-1. Gutdel ines
Figure V~F-1 presents an inspection procedure designed to identify
substandard bridge rail installations. It is suggested that this inspec
tion be conducted on a regularly scheduled basis. Personnel performing
this inspection should stay abreast of current traffic barrier standards
and guidelines, as weU as promising new research findings.
Wi.th regard 'to item 1, current AASHTO specifications (86, 87) and
the guidelines presented herein should be used to evaluate the structural
adequacy and safety aspects of bridge rails. Of course, there is no
substitute for field data or accident records to evaluate the performance
of a system. If a barrier installation is substandard, it is suggested
that the barrier either be modified to conform to an operational r;ystem,
or be replaced by an operational system. Suggested methods of upgrading
are discussed later in this section. If neither of these actions is
feasible, the designer should insure that the upgraded system conforms
to the aforementioned standards and guidelines. Crash tests are recom
mended for the final evaluation of such a system, especially if sub
stantial use of the system is planned.
Table v~F-1 lists elements of bridge rail design which should be
164
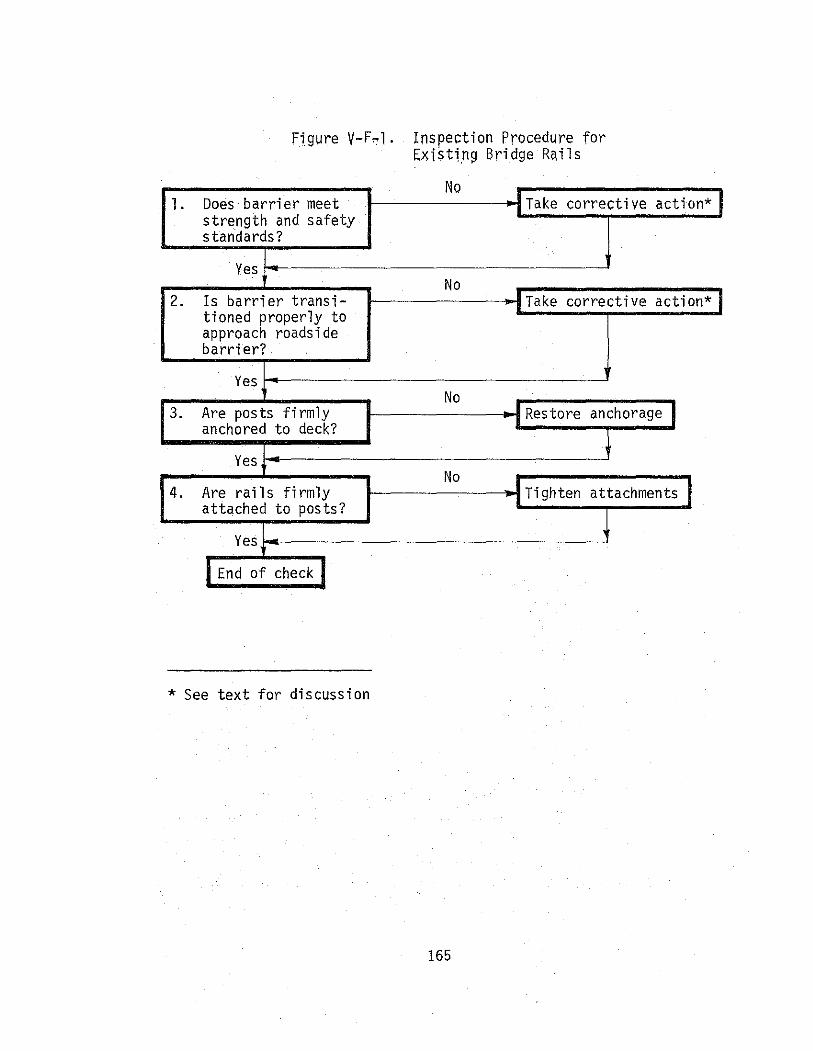
1.
2.
3.
4.
Figure V-F~l. Inspection Procedure for Existing Bridge Rails
0 :Take corrective action* J Does barrier meet
N
strength and safety standards?
Yes No
Is barrier transi- ·1 Take corrective action* I tioned properly to approach roadside barrier?
Yes No
Are posts firmly ~Restore anchorage I anchored to deck?
Yes No
~Tighten attachments I Are rails firmly attached to posts?
Yes
I End of check I
* See text for discussion
165
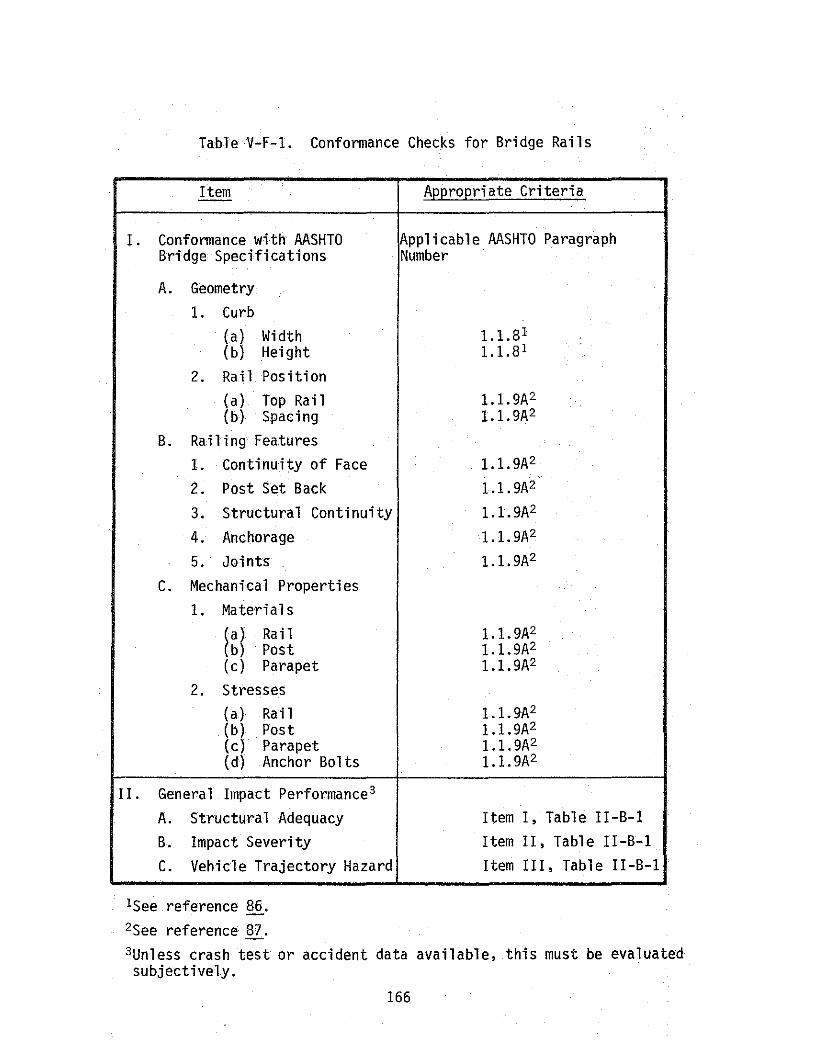
Table V-F-1. Conformance Checks for Bridge Rails
Item --
I. Conformance with AASHTO Bridge Specifications
A. Geometry 1. Curb
(a) Width (b) Height
2. Rail Position (a) Top Rai 1 (b) Spacing
B. Railing Features 1. Continuity of Face 2. Post Set Back 3. Structural Continuity 4. Anchorage 5. Joints
c. Mechanical Properties 1. Materials
fal Rail b) Post
(c) Parapet 2. Stresses
(a} Rai 1 (b) Post (c) Parapet (d) Anchor Bolts
II. General Impact Performance3 A. Structural Adequacy B. Impact Severity c. Vehicle Trajectory Hazard
1See reference 86. 2See reference 87.
A~~ro~riate Criteria
Applicable AASHTO Paragraph Number
1.1. 81 1.1.81
1.1. 9A2 1.1. 9A2
1.1. 9A2
1.1. 9A2 1.1. 9A2
1.1. 9A2
1.1. 9A2
1.1. 9A2 1.1. 9A2 1.1. 9A2
1.1. 9A2 1.1.9A2 1.1. 9A2 1.1. 9A2
Item I, Table II-B-1 Item II, Table II-B-1 Item III, Table II-B-1
3Unless crash test or accident data available, this must be evaluated subjectively.
166
checked for conformance to specifications and guidelines. Nonconfonnanoe
with the strength (stress) requirements of the rail and post was found
to be a prime reason many bridge rails are substandard (88). It was
also found (88) that many bridge rails are marginal or nonconforming
with respect to the evaluation criteria given in Table II-B-1.
Another area which demands close attention is the bridge rail ends.
Appropriate criteria for approach barriers and transitions sections is
given in Sections III-B-2 and III-E-4.
V-F-2. Suggested Upgrading Designs
A recent study (88) developed conceptual modifications to upgrade
certain types of bridge rails. Three concepts were formulated: (a)
a collapsing ring bridge rail system, (b) a concrete safety shape, and
(c) a thrie beam offset from backup structure with deforming cylinders.
These concepts are illustrated in Figure V-F-2. It must be emphasized
that these are only concepts, whose details and impact evaluation are
to be determined.
A variation of the thrie beam system has been developed and tested,
for possible use in upgrading concrete baluster bridge rails (62) (BRR4
system in Table B-6 of Appendix B). The designer should keep abreast of
these and other efforts to upgrade barrier systems.
167
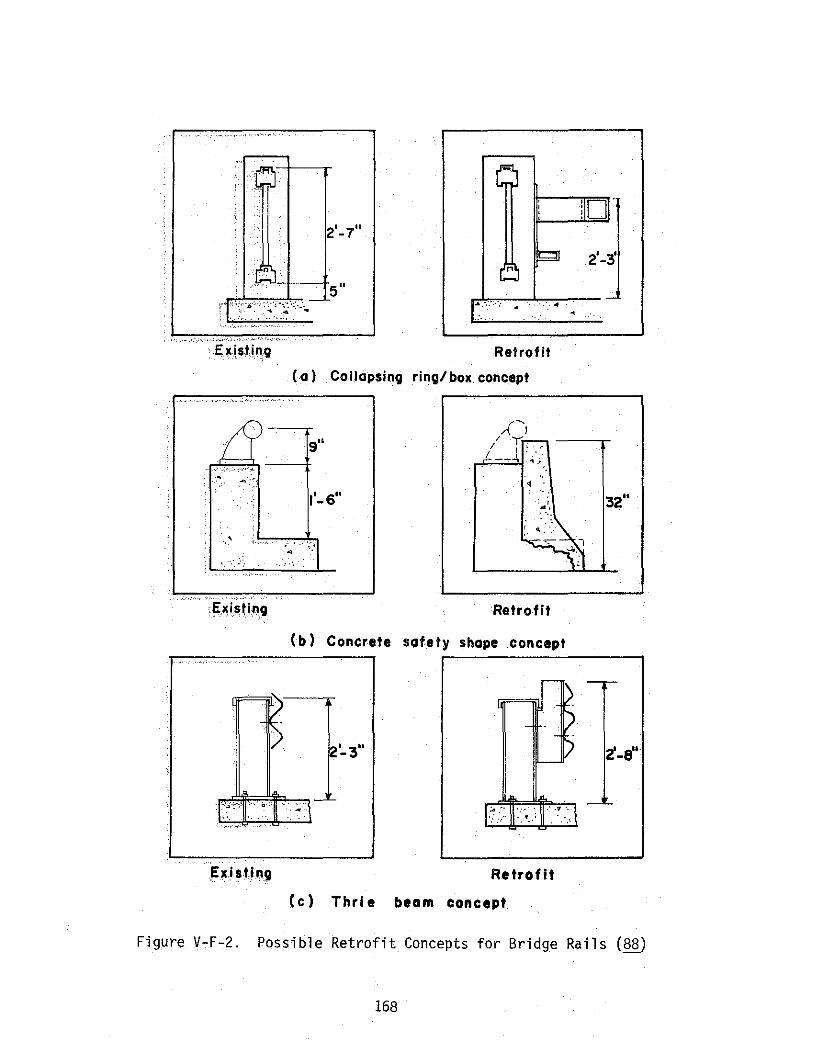
' ··:. :·:.
5" .. - · .. ·. . "' ..
Retrofit
(a) Co !lapsing ring/ box concept
9"
r'-6"
Retrofit
(b) Concrete satety shape concept r-~~~~~~~-.
Exisfl.ng Retrofit
(c) Thri e beam concept
2'-3'
. 32"
t-e"
Figure V-F-2. Possible Retrofit Concepts for Bridge Rails (88)
168
VI. CRASH CUSHIONS
Crash cushions are protective systems which prevent errant vehicles
from impacting hazards by either smoothly decelerating the vehicle to a
stop when hit head-on, or by redirecting it away from the hazard for
glancing impacts. These barriers are used to shield rigid objects or
hazardous conditions that cannot be removed, relocated, or made breakaway.
Before the development of crash cushions, many of these objects could not
.be shielded at all, and others could only be partially shielded by road
side barriers. The relatively low cost and potentially high safety payoff
offered by crash cushions justifies national emphasis on their installa
tion.
This chapter delineates criteria pertinent to the various elements
of design, including warrants, structural and safety characteristics of
operational systems, maintenance characteristics of operational systems,
selection guidelines and placement and site considerations. It is noted
that the Federal Highway Administration has published a report to assist
the designer choose the best type of cushion for the particular location
under consideration (~). It also presents crash cushion design procedures.
The reader is encouraged to supplement the contents of this chapter with
the FHWA document.
VI-A. Warrants
Crash cushions have proven to be a cost-effective and safe means
of shielding rigid objects. Their use is therefore warranted to shield
rigid objects within the clear distance that cannot be removed or shielded
169
by more cost-effective means. Studies indicate that crash .cushions
are considerably more cost effective than conventional longitudinal
barriers in many instances (see example in Section VII-C-3). Chapter
VII presents an alternate procedure that can be used to determine crash
cushion warrants. It provides the designer with a means with which to
evaluate the effectiveness of various types of barrier protection in
terms of initial costs, maintenance costs, and accident costs to the
motorist. Specific policies have been established by the FHWA concern
ing crash cushion need and installation on Federal-Aid construction
( 40, 97}.
The most common application of a crash cushion is in the ramp exit
gore wherein practical design for the site calls for a bridge rail end
in the gore. Where site conditions permit, a crash cushion should also
be considered as an alternate to a roadside barrier for shielding rigid
objects such as bridge piers, overhead sign supports, abutments, and
retaining wall ends. Crash cushions may also be used to shield roadside
and median barrier terminals. Examples and placement recommendations are
given in Section VI-F.
Since limited resources may preclude the shielding of all rigid
objects, a priority system should be established for crash cushion
installation. In the absence of a more definitive procedure, the follow
ing equation may be used to establish priority:
where
RF = ~ NOA) x ADT x S 10,000
RF = ranking factor;
NOA = number of accidents at the site over a given period
170
of time (the same period should be used for all sites);
ADT = average daily volume of traffic; and
S = operating speed of roadway.
Locations with the higher ranking number are considered the most hazard
ous and should be the first to receive crash cushion protection. If other
procedures are used, they should always include a consideration of each
site's accident history.
Long steep downgrades present a unique type of problem with regard
to traffic barriers. Loss of brakes on a vehicle on such a grade quickly
produces a hazardous condition to its driver and to other motorists.
Where such problems exist, special consideration should be given to the
installation of a roadside decelerating device. An experimental device
which shows considerable promise is the gravel bed attenuator (CR4)
shown in Table B-8, Appendix B. Some states have installed similar sys
tems and the results are very encouraging.
Another special condition for which crash cushions are warranted
concerns the protection of maintenance personnel, and the motorist,
during maintenance operations. It has been shown that a portable crash
cushion can be used effectively to provide this type of protection (98).
Further studies have been made to establish recommended design configu
rations (99). Also, a portable "truck mounted attenuator" is being
developed and marketed commercially (100).
A crash cushion or a vehicle arresting device may also be warranted
at the end of a dead-end street or beyond a "T" intersection. Need
should be based on an evaluation of the probability and consequence of
an errant driver going beyond the intersection.
171
VI-B. Structural and Safety Characteristics
This section presents the operational crash cushions and summarizes
desirable structural and safety characteristics of a crash cushion. Also
discussed are the different crash cushion design concepts.
Shown in Table VI-B-1 are the operational crash cushions. Informa
tion on each system consists of a sketch, a system designation, barrier
description, impact performance, barrier damage, references, field perfor
mance data and remarks. Reference should be made to .the introduction of
Section TTI-B for a discussion of each of these items. It is noted that
the particular configurations shown in each sketch represent the as-tested
configurations and are not necessarily typical installations. Each system
can be designed for a wide range of performance requirements.
Table VI-B-2 summarizes the impact performance data of the six
operational systems. Although the values in Table VT-B-2 are indicative
of the general performance of each barrier, discretion must be used in
comparing each system based on these data. First, as can be seen in
Table VI~B-1, the impact conditions were not consistent. This problem
should be remedied in the future due to the publication of standard test
procedures (i). Secondly, the as-tested designs would not all necessarily
be used for the same site conditions. Design and functional characteris
tics will be discussed in subsequent paragraphs.
As indicated in Table VI-B-2, none of the crash cushions have been
standardized. Also note that all of the operational crash cushions are
patented with the exception of the steel drum system.
Recommended structural and safety criteria for crash cushions is
172
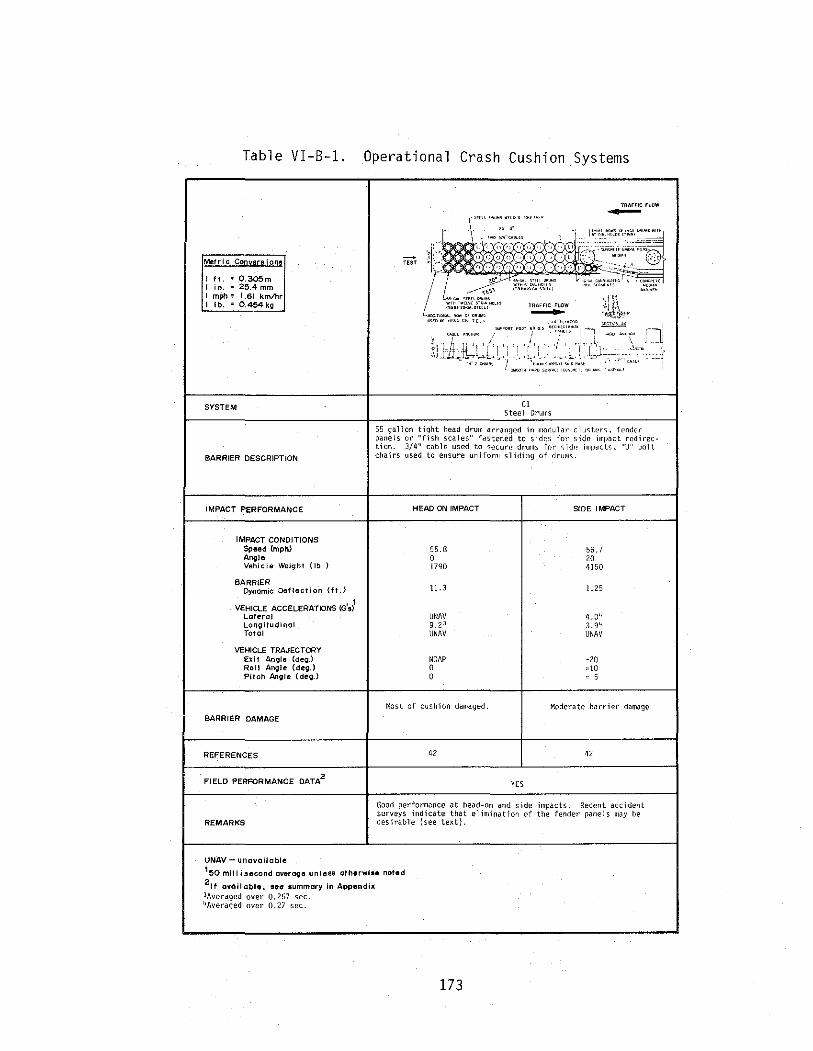
Table VI-B-1.
Metric Conversions
ft. = 0.305m in. 25.4 mm mph= I .61 km/hr lb. "0.454kg
SYSTEM
BARRIER DESCRIPTION
IMPACT PERFORMANCE
IMPACT CONDITIONS Speed {mph) Angle Vehicle Weight (lb
BARRIER Dynamic Deflection (ft
VEHICLE ACCELERATIONS (G's)1
Lateral Lon<;~itudinol
Total
VEHICLE TRAJECTORY Exit Anole (degJ Roll Angle (de<;~J Pitch Angle (deg.)
BARRIER DAMAGE
REFERENCES
FIELD PERFORMANCE OATA2
REMARKS
UNAV- unavailable
Operational Crash Cushion Systems
TEST
C1 S tee 1 Drums
TRAFFIC FlOW -
55 gallon tight head drum arranged in modular clu~t.er~. fend0r panels or "fish scales" fastened to sidr:s fm· side impact redirection. 3/4" cable used to secure drums fnr ~;i<Je imp~ctc,, "U" bnlt chairs used to ensure unifom sliding of dn1111S.
HEAD ON IMPACT
55.8 0 1790
11.3
UNAV g, 23 UNAV
NOAP 0 0
t1ost of cushion damaged.
42
YES
SIDE IMPACT
56.7 20 4150
1.25
4.0'' 3.g'• UNAV
Moderate barrier damage
1)%
Good performance at head-on and side impacts. Recent accident surveys indicate that elimination of the fender panels n1ay be desirable {see text).
1 ~0 millisecond overot;~e unless otherwl•e noted 2 1t ovailoble, see summary In AppendiX lAveraged over 0.257 sec. '•Averaged over 0.27 sec.
173
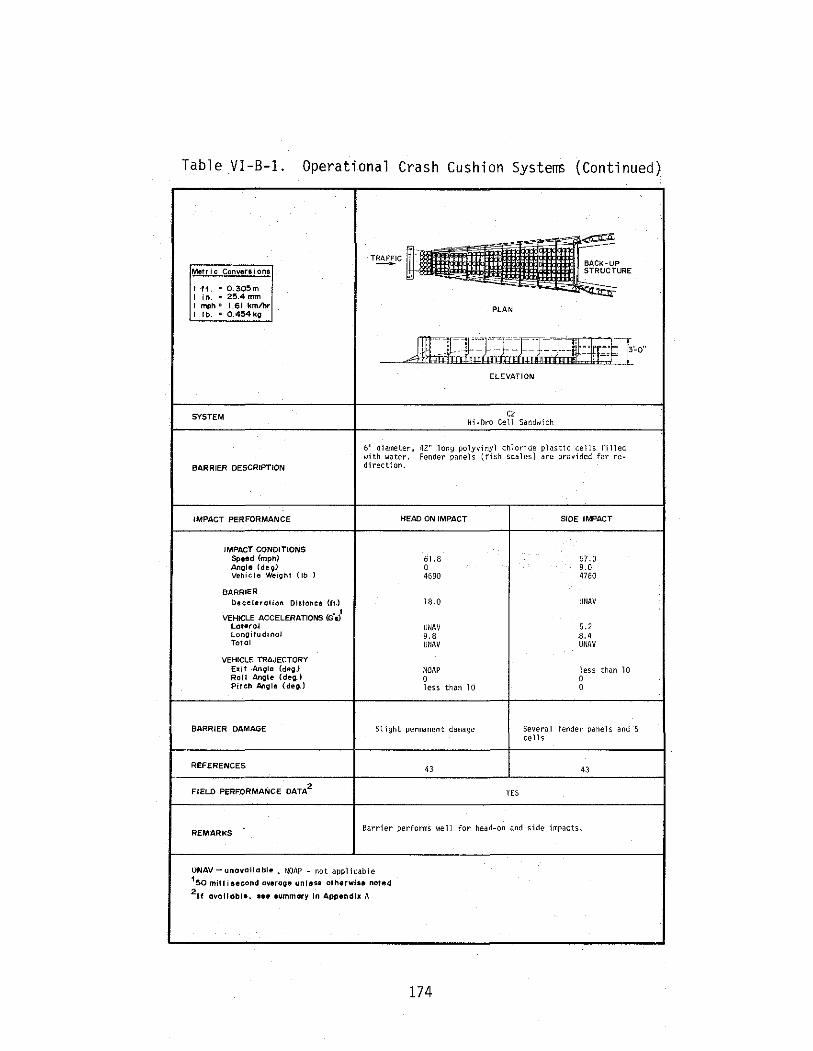
Table Vl-B-1. Operational Crash Cushion Systems (Continued}
Metric Conversions
rt. " 0.30~m in. c 2~.4mm mph~ 1.61 kmlhr lb. c o.4Mko
SYSTEM
BARRIER DESCRIPTION
IMPACT PERFORMANCE
IMPACT CONDITIONS Speed (mph) Anole (dellJ Vehicle We1ghl (lb
BARRIER Decelerglion Distance (ft.)
VEHICLE ACCELERATIONS «ls)1
Lateral Longitudinal Total
VEHICLE TRAJECTORY E~if -Anote {daoJ Roll Angle {de10J.) Pitch Angle {deg.}
BARRIER DAMAGE
REFERENCES
FIELD PERFORMANCE DATA_2
REMARKS
5" diameter, 1-1i th water. direction.
PLAN
ELEVATION
C2 Hi*Oro Cell Sandwich
42" long polyvinyl chloride plastic ce11s filled Fender panels (fish scales) are provided for rew
HEAD ON IMPACT SIDE IMPACT
61.8 0 4690
18.0
UNAV 9. 8 UNAV
NOAP 0 less than 10
Slight permanent damage
43
YES
57.0 9.0 4760
UNAV
5.2 8.4 UNAV
less than 10 8 0
Several fender panels and 5 cells
43
Barrier performs well for head-on and side impacts.
UNAV-unovaHable. NOIIP- not applicable 1 ~0 millisecond average unless otherwise noted 2 1t ovalloble, ••• 1ummory In Appendix A
174

Table VI-B-1. Operational Crash Cushion Systems (Continued)
Metric Conversions
I ft. = 0.:30~m 1 in. = 25.4 mm I mph= 1.61 kmlhr 1 lb. = 0.454ko
SYSTEM
BARRIER DESCRIPTION
IMPACT PERFORMANCE
IMPACT CONDITIONS Speed (mph) Angle (deg.J Vehicle WeighT (lb. J
BARRIER Deceleration Distance (f!J
VEHICLE ACCELERATIONS (G's)l Lateral Longitudinal Total
VEHICLE TRAJECTORY Exit Angle (deg.) Roll Angle {deg.l Pitch Angle (deg.J
BARRIER DAMAGE
REFERENCES
FIELD PERFORMANCE DATA2
REMARKS
c::::t-'0 \ 8""'- '' )~7 14 ~ ~g(4 r== ~SEAle f2Y2'\ Bock-up ~ 1 ~ 4 14 14 14 "'""~' f o-jDISC '- _ 7 14 ~ >-< ....____.., ' ~ 14 ~ 14
.,,,, ' l,l"==== (CYLI N E"~~ _
GJlf"' c:::;;;::,.,,. "" J
ON SOFT GROUND ONLY
gONTA!NER DETAIL
PLAN
CJ Fitch Inertial Barrier
Specially manufactured plastic containers (36" in diameter and height) filled with sand. Standard weights are 200, 400, 700, 1400 and 2100 lb. Volume and density of sand may vary.
HEAD ON IMPACT
59.0 0 1940
19.0
UNAV 8. 7 UNAV
NOAP 0 15
14 of 17 b~rrels either d~m~ged or destroyed.
44
YES
SIDE IMPACT
57.0 15 4770
UNAV
UNAV 7. 9 UNAV
No redirection 0
·"l 0
15 of 17 b~rrels were either d~m~ged or destroyed
44
Good performance for head-on and side impact tests. No redirection capabilities with this type of barrier.
UNAV-unavoilable, NOAP not applicable 150 mi 1 1 i second overage unless otherwise noted 2 rt ovallable, see summary In Appendix A
175
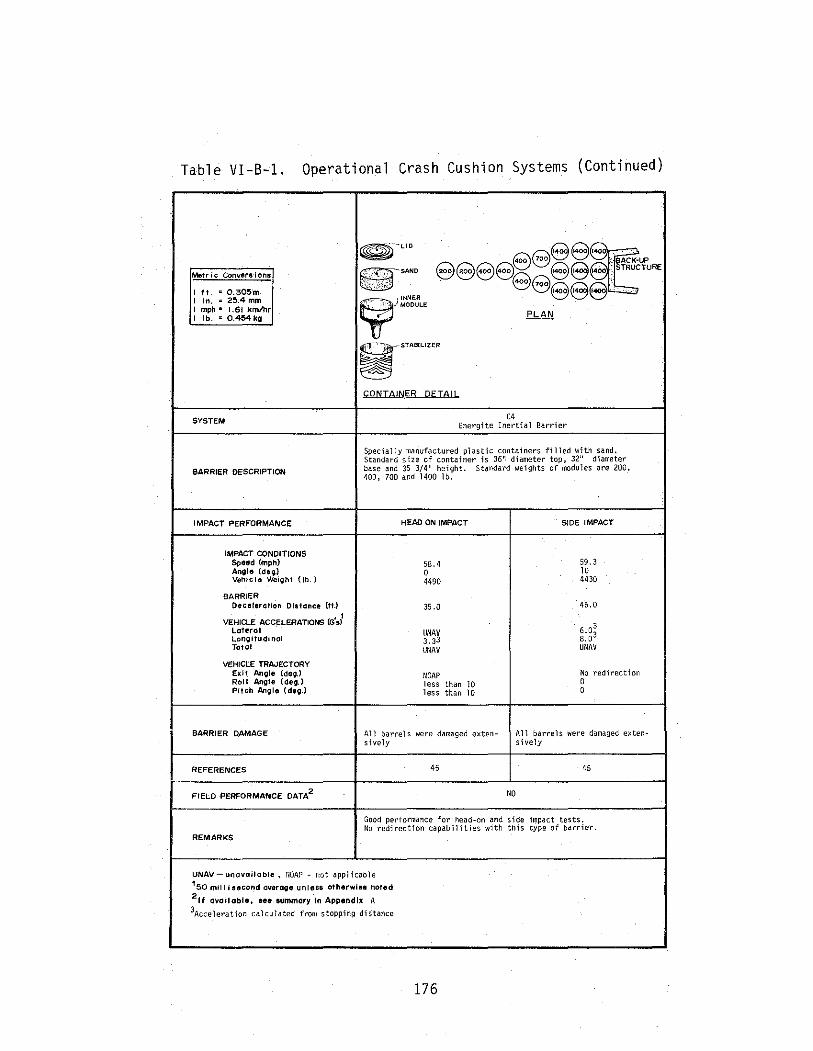
Table VI-B-1. Operational Crash Cushion Systems (Continued)
0 --LID
g888~ 400 _:· BACK·UP
Metric Conver•lons ~SAND esee8 eee;STRUCTURE ' 8 8eee· I ,, . 0.305'm 1<100 14 1400 "
I in. = 25.4 mm ~~;~~" I mph= 1.61 kmlhr I lb, ~ 0.454kg PLAN
~"'"'""
CONTAINER DET8l!..
SYSTEM C4
Energite Inertial Barrier
Specially manllfactured plastic containers filled with sand. Standard size of container is 36"· diameter top, 32" diameter
BARRIER DESCRIPTION base and 35 3/4" height. Standard weights of modules are 200, 400, 700 and 1400 lb.
IMPACT PERFORMANCE HEAD ON IMPACT SlOE IMPACT
IMPACT CONDITIONS Speed (mph) 58.4 59.3 Angle (de'il.} 0 10 Vehicle Weight {lb ) 4490 4430
BARRIER Decelerotion Distance (ft.) 35 .o 46.0
VEHICLE ACCELERATIONS (G's)1
6.0~ Lateral UNAV Longitudinal 3. J3 8, 0 Total UNAV UNAV
VEHICLE TRAJECTORY Exit AnQie (deQ.l NOAP No redirection Roll AnQie (deg.) less than lO 0 Pitch Anglo (deg.l less than 10 0
BARRIER DAMAGE All barrels were damaged exten- All barrels were damaged exten-sively sively
REFERENCES 45 45
FIELD PERFORMANCE OATA2 NO
Good performance for head-on and side impact tests. No redirection capabilities with this type of barrier.
REMARKS
UNAV-uoovoiloble, r·lOAP- not applicable 150 millisecond overage unto&& othorwlee noted 2 u ovolloble, see summary lo Appendix A 3Acceleration calculated from stopping distance
176

Table VI-B-1. Operational Crash Cushion Systems (Continued)
"'~'L~ 5 .. -- "' ~· '1' '
~~-, ''f''W' ' \
Metric Conversions - -~ -- ,
PLAN .. fii.'
' " "0.305m "' ' in. . 25.4 mm
~ [1''
' mph" 1.61 km/hr
) ) ) I) ) ) Jl ' "· " 0.454kg .... " ~ ~l!IJ ELEVATION
- LEGEI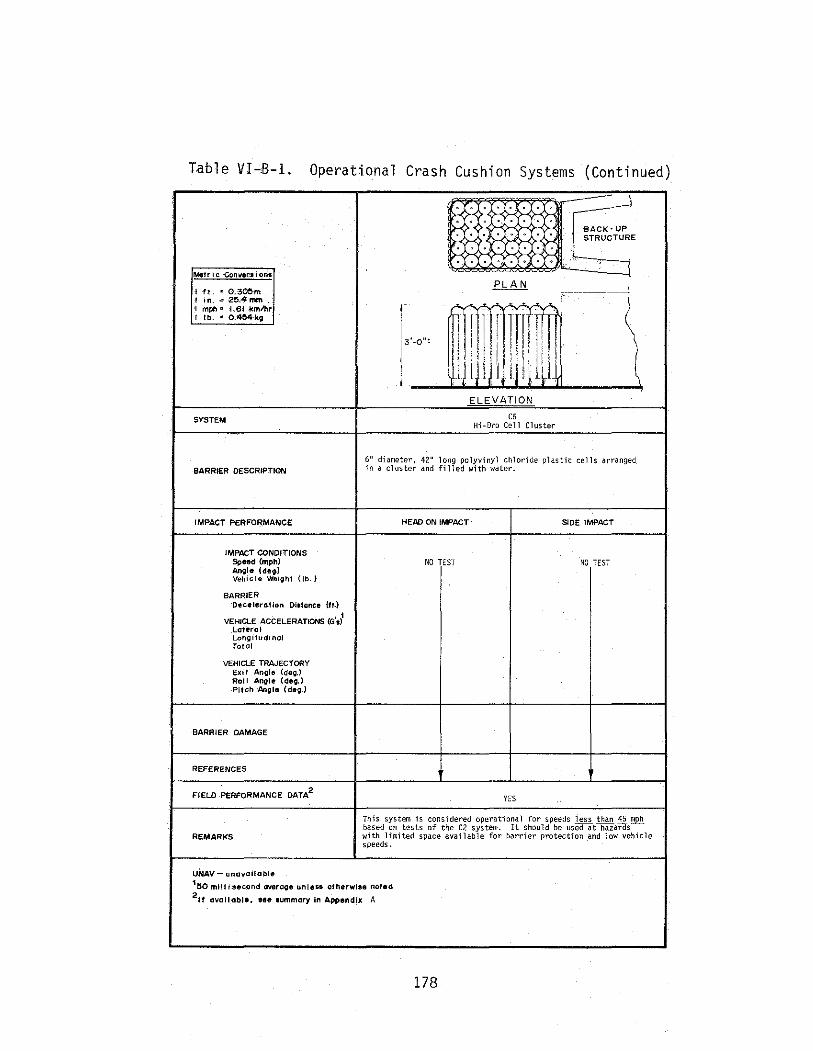
Table VI-'B-1. Operational Crash Cushion Systems (Continued)
8 ;, .-l
>;< >;< BACK·UP STRUCTURE
., l
Metric Conr.ter.sioria
I ft. ~ 0.3~m PLAN
-- ----~ I .•. "-2~.4mm I mph u ·1.61 -kmlhr
[, ... n 1 11~1 "ill I lb. ~ 0.464.kt;J
- II II! L I' \ ·J l' ;'ld H ~ ~ ,
lilJ!,jlji 1:1- 'j (, ~~ L''H ! I )1~~
I
ELEVATION
SYSTEM C5 Hi-Dro Cell Cluster
6" diameter, 42" long polyvinyl chloride plastic cells arranged BARRIER DESCRIPTION in a cluster and filled with water.
IMPACT PERFORMANCE HEAD ·ON IMPACT SIDE IMPACT
IMPACT CONDITIONS Speed {mph) NO TEST NO TEST Angle (deg.) VehiGie WeiQh1 ((b.)
BARRIER De.celerollon Dl•tanee {fl.)
VEHICLE ACCELERATIONS (G's)1
Lateral LonQifud•nol Total
VEHICLE TRAJECTORY Exit AnQie (deoJ Roll Angle (de'iJ.) Pitch Ailvle (deo.l
BARRIER DAMAGE
REFERENCES
FIELD PERFORMANCE DATA2
YES
This system is considered operational for speeds less than _1i !!~£!!_ based on tests of the C2 system. It should be used at hazards
REMARKS with limited space available for barrier protection and low vehicle speeds.
UNAV- unavailabl~ 1 ~0 mill! second averooe unles• otherwise noted 2 u available. eee 1ummary in AppendiX A
178

.... " <.D
Table VI-B-2. Crash Cushion Crash Data Summary
Accelerations 2 for Head-On Impacts (G's)
System Deceleration 1 Distance ( ft . ) Lateral Longitudi na 1 Total
Cl 11.3 UNAV 9.25' 10 UNAV C2 18.0 UNAV 9.8 UNAV C3 19.0 UNAV 8. 710 UNAV C4 35.0 UNAV 3.3 UNAV C5 14.5 UNAV 7.25 UNAV C69 No Test No Test No Test No Test
UNAV - Unavailable. 1 Based on head-on impact. 2 50 millisecond average unless otherwise noted. 3 Based on 20° impact unless otherwise noted. 4 Patented or proprietary system.
Accelerations 2 for Side Impacts (G's) •3
Lateral Longitudinal Total
4.06 3.96 UNAV 5.27
8.47 UNAV UNAV 7.98 UNAV 6.05 8.05 UNAV 4.55 4.05 UNAV No Test No Test No Test
5 Average acceleration calculated from stopping distance. 6
Averaged over 0.27 sec. 7 Based on go impact. 8 Based on 15° impact.
Is Barrier Hardware Standardized?
No No4
No4
No4
No4
No4
9 Although no tests have been conducted on this 45 mph) based on·the tests of the C2 system.
system, it is considered operational (for speeds under
10 Test conducted with small car.
Note: 1 ft. = 0.305 m
given in Table II-B-1. The degree to which the operational systems
satisfy these criteria is discussed below.
VI-B-1. Steel Drums (C1)
This system, sometimes referred to as the "Texas Barrels", dis
sipates the kinetic energy of the impacting vehicle primarily through
the plastic deformation or crushing of the steel drums. The cushion
is designed so that the resultant force at the vehicle-barrier inter-
face is applied at a height approximately equal to the vertical position
of the center of gravity of a standard size vehicle. The drums are
restrained vertically and laterally by steel cables, but are free to move
to the rear during impact. A rigid back-up structure (usually the rigid
object being shielded) is necessary at the rear of the cushion. The drums
are either bolted or welded together. As a consequence, there are no
loose elements, fragments or other debris following an impact. It is
desirable that the cushion be placed on a level concrete or asphalt pad
to facilitate free movement of the U-bolt support chairs during impact.
The cushion is composed of 55 gallon, 20 gauge steel tight-head
drums. Each drum has an 8 inch (0.2 m) diameter hole centered in the
top and bottom. A "softer nose" can be achieved by placing drums with
12 - 3 inch (0.08 m) diameter holes around the periphery of the top and
bottom, at the front of the cushion (as shown in Table VI-B-1). The
soft nose cushion produces a smaller initial decelerating force than would
be obtained in a cushion with 8 inch (0.20 m) diameter hole leading drums.
While the soft nose is desirable, acceptable performance can be achieved
without it. 180
The decelerating force produced by the steel drum cushion is depen
dent primarily on the amount of crush or deformation of the cushion and
is independent of the rate of crush. Barrier inertia forces are negli
gible. The length of the cushion and the number and orientation of the
drums needed is a function of the range of kinetic energy to be dissipated.
Usually, the barrier is designed to safely stop both small vehicles, 2250 lb,
(1021 kg) and large vehicles, 4500 lb, (2043 kg) at a given design speed.
Once the kinetic energy ranges have been established, the design is
achieved through an iterative process. The two major constraints are that
the barrier must dissipate the energy within a given stopping distance
and it must do so without producing excessive decelerations. As a conse
quence, design of the front portion of the barrier is usually dictated
by the small vehicle requirements, and the design of the remainder of the
barrier is usually dictated by the large vehicle requirements. The C1
system can be designed to meet the recommended dynamic performance criteria
with regard to direct-on impacts (see item II-B of Table II-B-1) for a
wide range of design conditions. Further design aids for the steel drum
system are given in Appendix D and in an FHWA publication (ll).
The steel drum system is one of three operational systems designed
to redirect a vehicle if hit from the side, i.e., for side impacts it
functions essentially as a longitudinal barrier. In the C1 system, this
is achieved through plywood "fish scales" or fender panels attached to
the side of the barrier. This is illustrated in Figure VI-B-1. Impact
in the "transition zone" can result in an impact with the fixed object
if redirection panels are not provided.
Although the concept of redirection for crash cushions is sound,
181
CRASH CUSHIO A X IS_ ~o.!-f -4---~- -----+--1--l--\----
OBJECT
SYMMETRY
Imp a Angle
(a) Potential impact with fixed object without redirection panels.
(b) Redirection with side panels.
Hard, Stiff and Smooth Panels or Cia dding
Figure Vl-B-1. Illustration of Side Impacts in Transition Zone
182

the cost-effectiveness of redirection panels is currently being reviewed
(~). Statistics from the referenced report indicate that transition
zone impacts, with the steel drum system without side panels, may not be
of sufficient frequency to warrant the added cost of the panels. Con
clusions, however, cannot be drawn at this writing as to the cost-effec
tiveness of side panels on the steel drum system. Regardless, it is
probable that their use will be warranted for certain conditions, for
example, where alignment increases the potential for side impacts or where
there is a record of side impact accidents. The designer should stay
abreast of future developments in this area.
In summary, the steel drum crash cushion can be designed to satisfy all
of the recommended dynamic performance criteria, as listed in Table II-B-1,
for a wide range of design conditions.
VI-B-2. Hi-Dro Cell Sandwich (C2)
This system dissipates the kinetic energy of the impacting vehicle
by the discharge of water from plastic filled tubes through orifices in
the tubes, and by the transfer of momentum (movement of the water mass).
It is a patented device and is manufactured and distributed by Energy
Absorption Systems, Inc. (100). Standard installations, detailed design
guides and installation procedures are available from the manufacturer.
The interested designer should consult with the manufacturer to determine
availability of designs and insure proper selection and installation.
The cushion is designed so that the resultant force at the vehicle
barrier interface is applied at a height approximately equal to the
vertical position of the center of gravity of a standard size vehicle.
183
It is composed of 6 inch (0.15 m) diameter, 42 inch (1.07 m) polyvinyl
plastic cells filled with water. These cells are arranged in clusters
or bays to make up the cushion for a given set of design conditions. A
rigid back-up structure (usually the rigid object being shielded} is
necessary at the rear of the cushion. The cells are restrained verti
cally and laterally by steel cables, but are free to move to the rear
during impact. As a consequence, there are no loose elements, fragments
or other debris following an impact. However, water on the roadway may
increase the potential for accidents by reducing the skid resistance of
the pavement, especially if it freezes. It is desirable that the cushion
be placed on a level concrete or asphalt pad to facilitate its movement
during impact.
The decelerating force produced by the hi -dro cell system is
dependent on the depth of vehicle penetration and on the rate of deform
ation of the cells, i.e., the force is velocity dependent. Upon head-on
impact the. nose cluster is directly contacted. As the vehicle penetrates
the crash cushion, the nose cluster cartridges are compressed. There
are no diaphrams in the nose cluster therefore all of the force of the
vehicle is located at the bumper; this makes the nose cluster reaction
relatively soft.
As the vehicle penetrates further into the cushion it exerts force
on the first bay of cartridges which contains diaphrams that distribute
the force over a T1 of the cartridges uniformly thereby causing the crash
cushion system to resist the force of the impacting vehicle. Further
penetration activates the remaining bays of cartridges which bring the
vehicle to a stop.
184
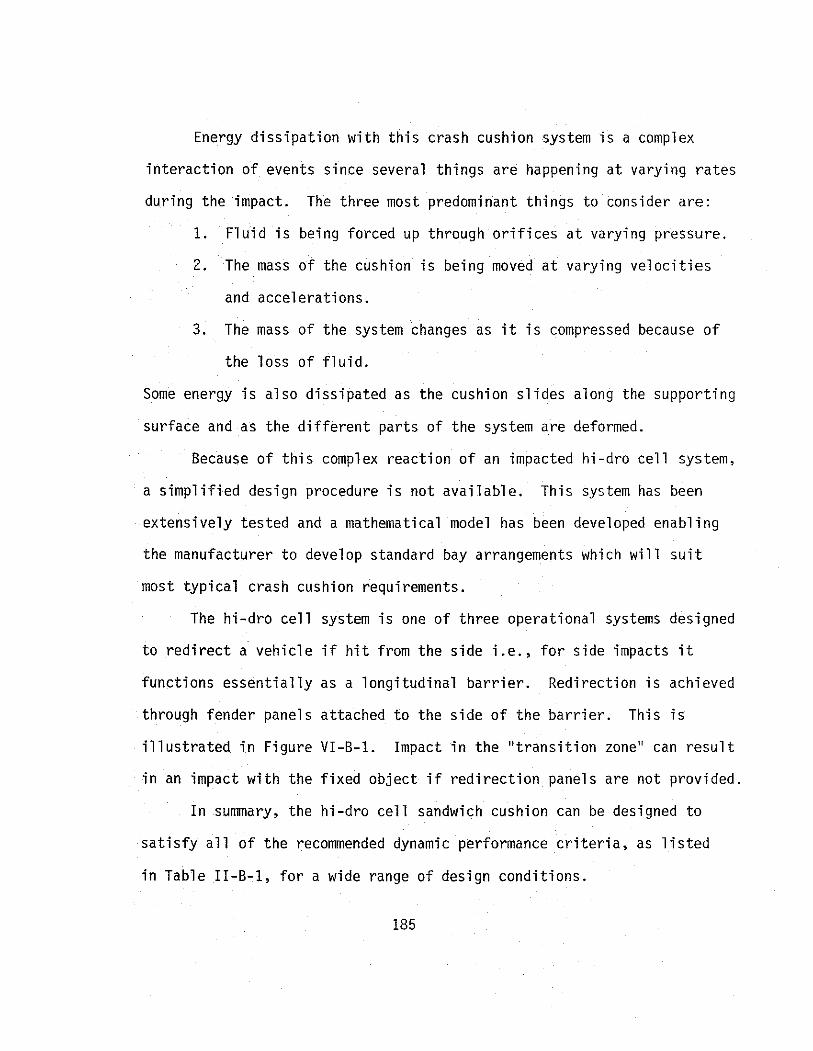
Energy dissipation with this crash cushion system is a complex
interaction of events since several things are happening at varying rates
during the impact. The three most predominant things to consider are:
1. Fluid is being forced up through orifices at varying pressure.
2. The mass of the cushion is being moved at varying velocities
and accelerations.
3. The mass of the system changes as it is compressed because of
the loss of fluid.
Some energy is also dissipated as the cushion slides along the supporting
surface and as the different parts of the system are deformed.
Because of this complex reaction of an impacted hi-dro cell system,
a simplified design procedure is not available. This system has been
extensively tested and a mathematical model has been developed enabling
the manufacturer to develop standard bay arrangements which will suit
most typical crash cushion requirements.
The hi-dro cell system is one of three operational systems designed
to redirect a vehicle if hit from the side i.e., for side impacts it
functions essentially as a longitudinal barrier. Redirection is achieved
through fender panels attached to the side of the barrier. This is
illustrated in Figure VI-B-1. Impact in the ''transition zone'' can result
in an impact with the fixed object if redirection panels are not provided.
In summary, the hi-dro cell sandwich cushion can be designed to
satisfy all of the recommended dynamic performance criteria, as listed
in Table II-B-1, for a wide range of design conditions.
185
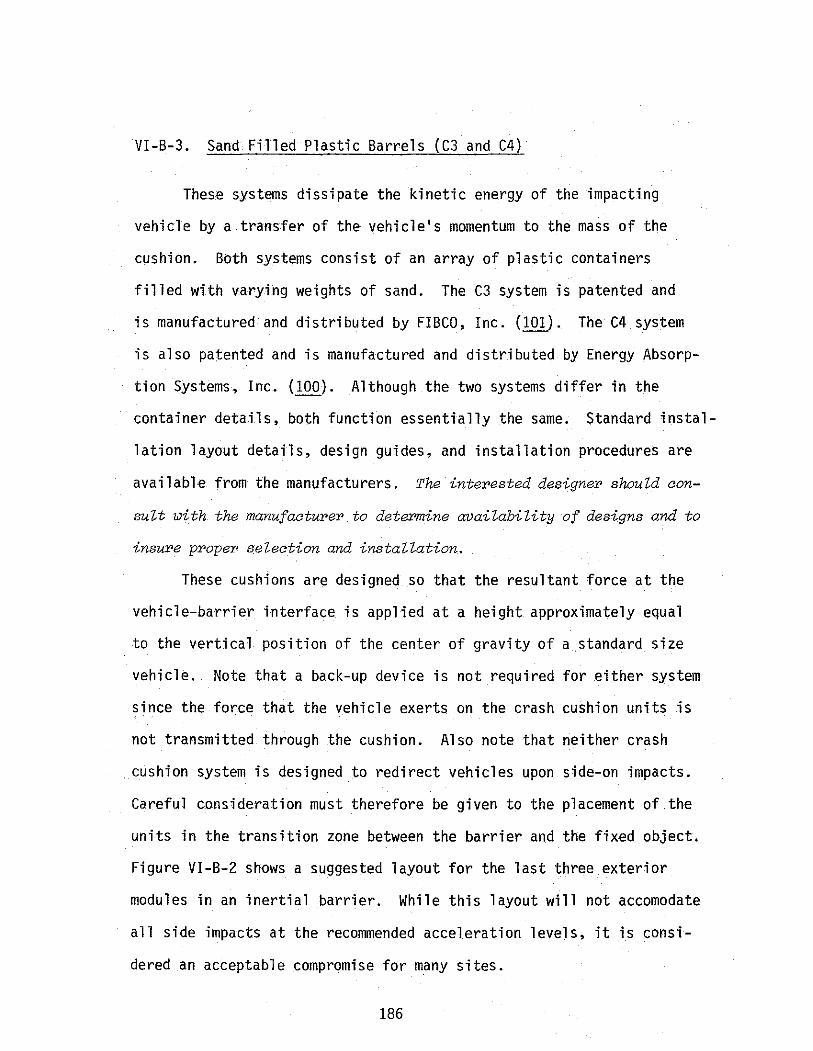
VI-B-3. Sand Filled Plastic Barrels (C3 and C4)
These systems dissipate the kinetic energy of the impacting
vehicle by a transfer of the vehicle's momentum to the mass of the
cushion. Both systems consist of an array of plastic containers
fi 11 ed wi.th varying weights of sand. The C3 system is patented and
is manufactured and distributed by FIBCO, Inc. (101). The C4 system
is also patented and is manufactured and distributed by Energy Absorp
tion Systems, Inc. (100). Although the two systems differ in the
container details, both function essentially the same. Standard instal
lation layout details, design guides, and installation procedures are
available from the manufacturers. The.interested designer should oon
sult with the manufacturer to determine availability of designs and to
insure proper seleotion and installation.
These cushions are designed so that the resultant force at the
vehicle-barrier interface is applied at a height approximately equal
to the vertical position of the center of gravity of a standard size
vehicle. Note that a back-up device is not required for either system
since the force that the vehicle exerts on the crash cushion units is
not transmitted through the cushion. Also note that neither crash
cushion system is designed to redirect vehicles upon side-on impacts.
Careful consideration must therefore be given to the placement of the
units in the transition zone between the barrier and the fixed object.
Figure VI-B-2 shows a suggested layout for the last three exterior
modules in an inertial barrier. While this layout will not accomodate
all side impacts at the recommended acceleration levels, it is consi
dered an acceptable compromise for many sites.
186
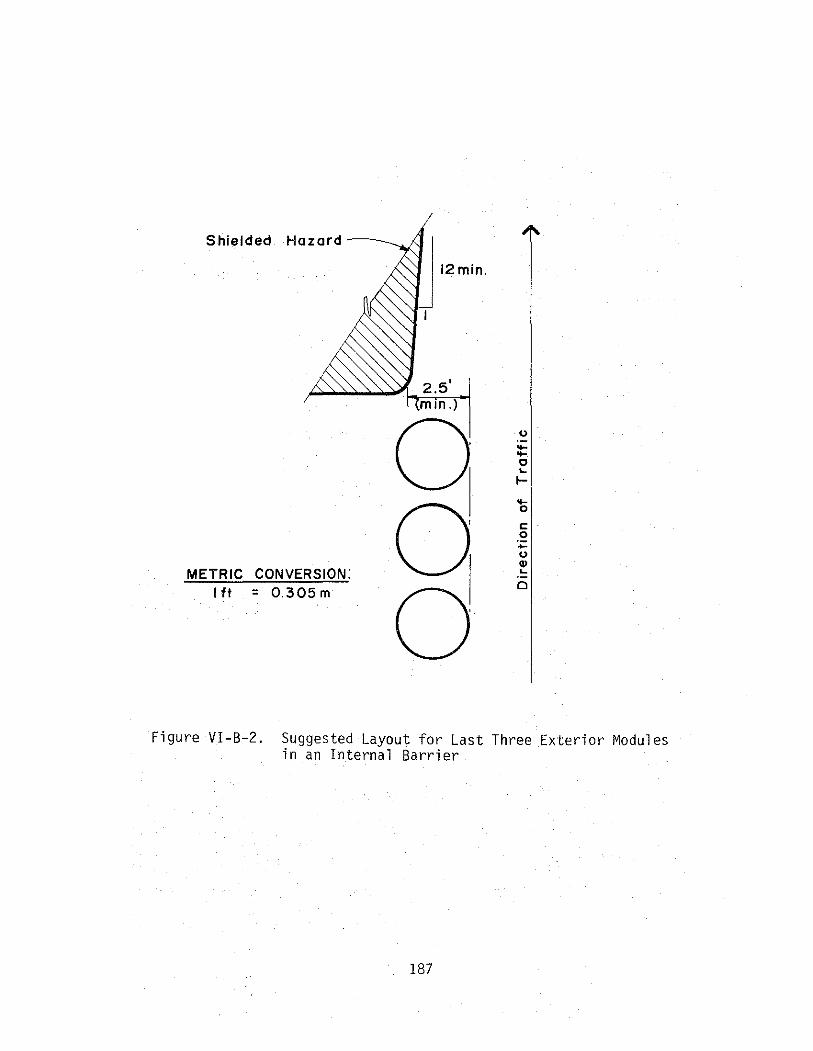
Shielded Hazard---
2.5' mm .)
0 " .... ... 0 ... 1-
0 ... 0
1: 0 -" "' METRIC CONVERSION: ...
I ft = 0.305 m
0 Cl
Figure VI-B-2. Suggested Layout for Last Three Exterior Modules in an Internal Barrier
187

Both of these systems generate debris upon impact, consisting of
sand and remnants of the plastic barrels. As such, there is a poten
tial danger to other motorists. If the cushion is on a structure, the
debris may fall into traffic lanes below. However, at this writing,
there is no documented evidence that these characteristics are a signi
ficant 1 iability to inertial barriers.
Design of an inertial barrier system is relatively simple and
straightforward. By use of the law of conservation of momentum, the
barrier is designed to incrementally reduce the vehicle's impact velo
city from module to module (or from a row of modules to the succeeding
row of modules}. To obtain a constant change in velocity, or a constant
decelerating force, as the vehicle impacts each successive container,
the containers must increase in weight as they get closer to the hazard.
Theoretically, the vehicle cannot be stopped completely by this
principle. Practically, it is usually adequate to design this type of
crash cushion to reduce the vehicle speed to 10 mph after the final
container is impacted. At this point, the remaining vehicle kinetic
energy is dissipated by friction in the sand as the vehicle "bulldozes"
into the final containers. Design aids and examples of their application
are given in Appendix D. The designer should also refer to an FHWA
publication (1]) for design procedures and examples.
Standard sizes and weights of available modules. for each of the
systems are given in the "barrier description" on Table VI-B-1. Sand
heights and center of gravity data of modules for both systems is given
in Tab 1 e VI-B-3. Note that the height of the center of gravity of the
188
..... 00
""
Module Wright
1 til
200
400
700
1400
2100
*
Table VI-B-3. Center of Gravity Data for Inertial System Modules
FITCH INERTIAL SYSTEM Height of Center
Core Height Sand Depth of Gravity (in. l lin.) (in. )
20.5 3.5 22.5
20.5 7.0 24.5
16.5 12.0 23.0
11 .5 24.0 24.0
0 26.0 18.0
Energite designations
METRIC CONVERSIONS: 1 in. = 0.0254 m
1 1 b = 0. 454 kg
ENERGITE INERTIAL SYSTEM Wine Glass Height of Center
Core* Sand Depth of Gravity lin.i __(_in._)
A 28.0 24.0
A 31.5 26.0
B 32.5 24.5
c 36.0 22.0
N 0 T A V A I L A 8 L E
I I
I I
2100 lb (953 kg) module is 18 inches (0.46 m) above the ground, a
height which is lower than the center of gravity of most standard size
automobiles. It is placed at the rear of the array to completely stop
the slowed vehicle before it impacts the rigid object. Head-on tests
at 60 mph (96.5 km/h) have shown that the 2100 lb (953 kg) module can per
form this function effectively. However, its impact performance during
transition zone or shallow angle side impacts is questionable due to its
relatively low center of gravity. The 2100 lb (953 kg) module should
therefore be used with discretion and if space permits, consideration
should be given to the use of a smaller module.
The width of the back row of modules should always be greater than
the width of the fixed object. This will soften the impacts of those
vehicles striking the rear portion of the barrier at an angle and pro
vide some deceleration prior to striking the fixed object. The barrier
modules should be set back from the traffic lanes to minimize the number
of casual vehi.cul ar contacts with the barrier and the amount of debris
thrown into the traveled way when an impact does occur. Also, space
should be left behind the last row of modules so the sand and debris will
not be confined and produce a ramping effect on the vehicle. It is
suggested that this space be one foot (0.3 m) to two feet (0.6 m).
When fixed objects are more than 6 feet (1.8 m) wide, extra longi
tudinal rows of modules may be added to the barrier. The first few
modules in each of these rows should be no more than 3 feet (0.9 m)
apart (clear dimension) in the lateral direction. Then impacting ve
hicles, most of which have a width of about 6 feet (1.8 m), will displace
190
approximately the same mass of sand whether they hit one longitudinal
row of modules head-on or carry away one-half of each row on either
side. Depending on available space, modules may be separated by any
distance in the longitudinal direction. Extra distance may lower the
deceleration rates.
The standard containers have been sized to hold the standard
weights based on sand density of 100 lb/cu ft. A significant varia
tion in sand density actually used could have some effect on the per
formance of the crash cushion.
Care must be exercised in selecting the modules in an inertial
system so that the small car will not be subjected to undesirable
decelerating forces. For example, a 2000 pound (go8 kg) vehicle im
pacting a 400 pound (182 kg) module at 60 mph (96.5 km/hr) will be slowed
to 50 mph (80.5 km/hr) with a 12.2 g deceleration. Whenever stopping
distance permits, it is suggested that 200 pound (91 kg) modules be
used on the nose of inertial barriers exposed to high speed traffic.
In summary, the inertial barriers (systems C3 and C4) can be
designed to satisfy the recommended dynamic performance criteria, as
listed in Table II-B-1, for a wide range of design conditions. Although
debris is produced upon impact for both systems, it is not considered
a significant limitation. Neither of the two systems is designed to
redirect if impacted from the side.
VI-B-4. Hi-Dri Cell Sandwich (C5)
This system dissipates the kinetic energy of the impacting vehicle
through the crush of the lightweight concrete components and
191
through the transfer of momentum (movement of cushion mass). It is a
patented device, manufactured and distributed by Energy Absorption
Systems, Inc. (100). Standard installations, detailed design guides,
and installation procedures are available from the manufacturer. The
interested designer should consult with the manufacturer to determine
availability of designs, appropriate selections, and installation
procedures.
The·cushion is designed so that the resultant force at the vehi
cle-barrier interface is applied at a height approximately equal to the
vertical position of the center of gravity of a standard size vehicle.
The energy absorbing elements of this system are 7 inch (0.18 m) dia
meter cylindrical cells made of 1 ightwei ght concrete. The cell has a
hole in its center and steel wire wound around the outside. Each cell
is wrapped with a weatherproof covering to keep water out and to prevent
pieces of concrete from being scattered about during impact.
The hi-dri cells are installed in bays very similar to the hi-dro
cell bays as discussed in Section VI-B-2. Side panels, diaphragms, cables,
and some of the-hardware are the same as used in the hi-dro cell sandwich
crash cushion. This cushion is one of three operational systems designed
to redirect a vehicle if hit from the side. Redirection is achieved
through the fender panels attached to the side of the barrier. This is
illustrated in Figure VI-B-1. It also generates minimal debris upon
impact. A rigid back-up structure (usually the rigid object being shielded)
is required at the rear of the cushion.
Upon impact, the lightweight concrete cells crush. The void in
the center of the cell fills with concrete pieces as the ce 11 is com
pressed. Then the concrete is forced outward between the steel wires.
192
This action converts the kinetic energy of the impacting vehicle into
work. Simultaneously, other actions are taking place that absorb the
KE of the impacting vehicle. These are:
1. The mass of the crash cushion is being moved.
2. The crash cushion parts are being dragged along the pavement
surface.
3. The parts of the crash cushion are being physically deformed.
Because of the complex reaction of an impacted hi-dri cell sandwich
crash cushion, a simplified rational design procedure does not appear
to be feasible. This system has been extensively tested and a mathe
matical model has been developed enabling the manufacturer to develop
standard bay arrangements which will suit most typical crash cushion
requirements.
In summary, the hi-dri cell sandwich system can be designed to
satisfy the recommended impact performance criteria, as listed in Table
II-B-1, for a wide range of design conditions.
VI-B-5. Hi-Oro Cell Cluster (C6)
This system functions along the same principle as the hi-dro
cell sandwich cushion discussed in Section VI-B-2. It is also a
patented device and is manufactured and distributed by Energy Absorption,
Inc. (100). Standard installations, detailed design guides, and install
ation procedures are available from the manufacturer. The interested
designer should consult the manufacturer to determine availability of
designs, appropriate selections, and installation procedures.
Its application is limited to roadways with design speeds of 45 mph
193
(72. 4 l<m/hr>J or less. It can be used where there are space 1 imitations
and it can be arranged in various patterns to fit the object to be
protected. Typical applications are to shield gore walls, bridge abut
ments, traffic control devices, toll booths, etc.
A back-up structure is required at the rear of the cushion. It
has minimal redirection capabilities when impacted from the side. There
is no debris, with exception of water, produced upon impact.
Design aids for this system are relatively straightforward and
easy to use. These aids are included in Appendix D.
In summary, the hi-dro cell cluster system can be designed to
shield various rigid objects when the design speeds are 45 mph (72.4 km/hr)
or less. It has no redirection capabilities. Negligible debris is
produced upon impact.
VI-B-6. Summary
All of the operational crash cushions, with the exception of the
hi-dro cell cluster, can be designed to satisfy the recommended impact
performance criteria of Table II-B-1 for a wide range of design conditions.
The hi-dro cell cluster cushion is limited to roadways with a design
speed of 45 mph (72.4 km/hr) or less. Table VI-B-4 summarizes the struc
tural and safety characteristics of the operational systems.
Although not mentioned in the preceding discussion, the vehicle
itself will deform and dissipate some of the kinetic energy. However,
each cushion should be designed to dissipate the vehicle's total kinetic
energy. Any vehicle crush that occurs will then be an added safety fac-
tor. 194
.... "" 0"1
1.
2.
3.
4 .
5.
Table VI-B-4. Summary of Structural and Safety Characteristics of Crash Cushions
Steel Hi -Oro Drums Cell Sandwich
Item ( Cl) (C2)
Tolerable accelerations? Yes1 Yes 1
Redirection capabilities? Yes Yes
Back-up structure required? Yes Yes
Debris produced upon impact? No No3
Anchorage required? Yes Yes ------
1 For any reasonab 1 e design speed . 2 For a speed of 45 mph ( 72. 4k/h) or 1 ess . 3Except water. Water on the roadway can increase
the potential for accidents by reducing skid resistance of pavement, especially if it freezes.
Fitch Energite Hi~Dri Inertia 1 Inertial Cell Sandwich
(C3) (C4) (C5)
Yes 1 Yes 1 Yes 1
No No Yes
No No Yes
Yes Yes No
No No Yes -
Hi -Oro Cell Cluster
(C6)
Yes 2
No
Yes
No3
Yes
Finally, there are several promising crash cushion systems which
at present are not considered operational. Reference should be made to
Table B-7 and B-8 of Appendix B for a summary of these systems. Three of
these systems need further discussion. First, the CE3 system of Table B-7
has been installed on an experimental basis to prevent an errant vehicle
from entering the opening between t11in structures and at a ferry landing.
It also has potential for use at the end of a dead-end street or beyond
a "T" intersection. Second, the CRl system of Table B-8 has performed
very well in crash tests and has the potential for reuse without signi
ficant repairs after each hit. Third, the CR3 system of Table B-8 offers
promise as a crash cushion that is compatible with the standard W-beam
roadside or median barrier.
It is likely that some of these experimental systems will become
operational in the near future. The designer may wish to install one of
these systems on a trial basis. If so, the system .should be monitored for
its in-service performance.
VI-C. Maintenance Characteristics
Since all .of the operational systems can be designed to meet the
recommended impact performance criteria for a wide range of design
conditions, the maintenance characteristics of the barriers can and should
play a very important role in the selection process. To aid the designer,
an attempt has been made to summarize the pertinent maintenance character
istics of each crash cushion. The data is presented in Table VI-C-1.
The data in the table was obtained from state maintenance records where
available. However, as can be seen, some of the data is based on 196
...... <0
"'
(!:,
I.
Table VI-C-1. Maintenance Characteristics of Operational Crash Cushions
Maintenance Steel Barrel Requirement Cushion
Collision Maintenance A. Manpower and Equipment
1. Crew Size 6 men 2. Expertise required welding
3. Special equipment flat-bed truck, welding equipment
B. Collision aftermath 1. Immediate removal of
scattered debris, water, anti-freeze needed? no
2. Immediate problem created? no 3. Lane closure necessary? yes, to repair
c. Restoration 1. Overall difficulty above average 2. Any salvageable hardware? yes 3. Energy absorption unit
reusable? usually not D. Considera~le maintenance due
to the nuisance hit? no E. Dis osal of debris a roblem? yes F. Average exposure time per h1t
(man-hours) 34
1certain types of anti-freeze 2only if "oil slick" develops from anti-freeze or water freezes 3"average", assuming most of hardware reusable
Hy-Dro Fitch Energite Cushion Barrier System
6 men 5 men UNAV hardware very little very little training water truck, loader, loader, maintenance maintenance truck maintenance truck truck, pick-up
yes, anti-freeze1 yes, sand and yes, sand and
yes 2 plastic plastic yes, debris yes, debris
yes, to repair yes, clean and yes, clean and repair repair
average3 average average usually very little very little
usually no no
no yes yes no yes yes
13 10 UNAV
Hy-Dri Cell
UNAV UNAV
UNAV
no
I no yes, to repair
average3 usually
usually '
no I yes _j
UNAV I
~
<0 00
'/
II.
III.
Table VI-C-1. Maintenance Characteristics of Operational Crash Cushions (Continued)
>
Maintenance steel Barrel Hy-Dro Fitch Energite Requirement Cushion Cushion Barrier System
Reqular Maintenance A. General condition checks
1. Cushion in position? no no yes yes 2. Vandalism damage? no yes yes yes 3. Hardware and cables
intact? yes yes no no 4. Nuisance hit? yes yes yes yes 5. Water level and anti-
freeze quantity ade- no yes no no quate?
B. Pa1nting, cleaning, and other treatments to assure adequate appearancejperfor-mance needed? yes, paint and yes, paint and yes, clean yes, clean
clean clean c. Weathering/corrosion pro-
blem due to environmental/ chemical effects? yes, salt corrosion yes yes yes
may be a problem Material Storage and/or Availability Requirements A. Dry sand stock pile neces-
saY._v? no . no yes yes B. Modules/barrels for replace-
ment? yes, 55 gallon yes, cells enough yes, Fitch Modules yes, Energi te drums to replace damaged Modules
c. Water supply and anti-freeze. no yes no no D. Hardware and connections ·for
assembly? yes _,yes no no E. Paint and/or aesthetic
coverings for appearance/ performance? if desired if desired if des ired if desired
-~~ -- -~
Hy-Dri Cell
.
no no
yes yes
no
yes, paint and clean
UNAV
no
yes, vermicu-lite cell replace-ment no
yes
if ·desired --·~
subjective evaluations. Figures given in the table are based on average
values of several agencies, and should be used as "indicators" or "ball
park" estimations. The three major categories given in the table are
discussed below.
VI-C-1. Collision Maintenance
Special consideration should be given to this phase of crash
cushion maintenance since it will require the most effort and expendi
ture. Careful evaluation of items I-A, I-C, and I-F are suggested since
these items have a large influence on the maintenance costs. The latter
item is also significant in terms of the hazard the maintenance crew is
subjected to while repairing the barrier and the disruption of normal
traffic flow.
When a particular site has a relatively high frequency of accidents,
consideration should be given to the installation of a reusable crash
cushion. Hardware in the hi-dro cell (C2) and the hi-dri cell (C5)
sandwich systems is reusable for many impact conditions (head-on impacts
by automobiles traveling at 60 mph (96.5 km/hr)or less). Of~course,
water must be added to the C2 system and the damaged cartridges must be
replaced in the C5 system. A cushion with redirection panels may be
appropriate for sites with a high frequency of brush hits (or nuisance
hits), or where the potential for such hits exists.
VI-C-2. Regular Maintenance
In general, the operational systems require relatively little regu
lar or routine maintenance. However, periodic maintenance checks should
199
be performed to accomplish the appropriate checks outlined in II-A.
Several instances of vandalism have been reported with the sand inertial
barriers. It is more prevalent where pedestrians have access to the
roadside. Item II-A-5 is a particularly critical item for the hi-dro
systems. For minor impacts, the hi-dro cell cluster system and the nose
of the hi -dro cell sandwich system can return to its original position
and thus appear outwardly that it had not been hit. However, with each
impact, water can be lost, thereby diminishing its crash attenuating
capabilities for the next hit. Checks are also needed to determine if
leaks or .evaporation has occurred. Damages to any of the systems which
diminish their original crash attenuating capabilities should be repaired
immediately.
Some cracking problems have occurred in the past with polyethylene
plastic containers used in the sand inertial systems. These problems have
been attributed in part to the effects of actinic radiation, vibrations
(when placed on a structure), salt if mixed with the sand, and to earlier
design problems with the container. The manufacturer reports that these
problems have been solved through improved designs.
VI-C-3. Material Storage
It will be necessary to store a certain amount of hardware and
supplies for each of the operational systems. The point to be emphasized
is that a sufficient stockpile of parts must be maintained to avoid delays
in restoring a damaged barrier. Availability of parts and delivery times
should be considered before selecting a system.
200

In summary, the criteria in Table VI-C-1 should be used as guide
lines in evaluating the maintenance characteristics of the operational
crash cushions. However, the designer is urged to seek out supplemental
data from agencies using the different crash cushions. There is no
substitute for documented evidence of a barrier's in-service performance.
VI-D. Site Considerations
VI-D-1. New Roadways
It has been recommended that space be reserved on all new construc
tion for potential crash cushion installations (40). These recommendations
are presented in Table VI-D-1. Under the "minimum" column, the "restricted
conditions" represent the absolute minimums and should only be considered
where there are extremely tight geometric contro 1 s. The "unrestricted
conditions" represent the minimum for all projects except for those sites
where it can be shown that the increased cost for accomodating these
dimensions, as opposed to those for restricted conditions, will be un
reasonable. The "preferred" values should be considered optimum. There
is no intention to imply that if space is provided in accordance with
these dimensions that the space will be fully occupied by a crash cushion
device. The reason for proposing these dimensions is so that if experience
shows that devices should be designed for greater ranges of vehicle
weights and/or for lower deceleration forces there will be space available
for installation of such devices in the future. In the meantime, the un
occupied reserve crash cushion space will provide valuable additional
recovery a rea.
201
N 0 N
Crash Cushion reserve
Traffic Shoulder=----1
Traffic Shoul<fer-==r
*No curbs, raised pavement, or prows to be built or remain in the area surrounding or occupied by the crash cushion.
Design Speed on
Mainline (m.p.h.)
30
50
70
r.J!
.,. .• 7 ~
~/M
F
L
12!min.) I c:::::=:==- Face of rail or parapet-:=
End of rail or equivalent fixed object
12 (min.) -
Dimensions for Crash Cushion Reserve Area
(Feet)
Minimum Restricted Unrestricted Preferred Conditions Conditions N L F N L F N L F
6 8 2 8 11 3 12 17 4 6 17 2 8 25 3 12 33 4 6 28 2 8 45 3 12 55 4
80 6 35 2 8 55 3 12 70 4
Table VI-D-1. Reserve Area for Gores
It is suggested that considerations be given, at the design stage
of new projects, to the use of crash cushions at other locations also.
These would be hazardous sites that could not be avoided in the project.
Examples are bridge piers, overhead sign supports, and other non-avoidable
rigid objects. These sites could be designed to facilitate the instal
lation of a crash cushion.
VI-D-2. Existing Roadways
The selection of a crash cushion for some existing roadways may
be dictated by site conditions. The following factors should be considered
in the selection.
Dimensions of object or hazard to be shielded - The width of the
object or hazard is an important factor. While the Cl, C2, and C5 crash
cushions can be designed for a range of object widths, they are not
normally used to shield relatively wide objects. The Cl is usually
limited to widths of approximately 12 feet (3.7 m) and the C2 and C5
systems are usually limited to widths of approximately 7.5 feet (2.3 m).
Inertial barriers are more adaptable to the wider objects.
Structural details of object to .be shielded- Systems Cl, C2, C5,
and C6 require a back-up structure that is capable of withstanding the
impact forces. If the object being shielded is structurally inadequate,
provisions will have to be made to support or restrain the barrier during
impact if these systems are used. Site preparations on existing struc
tures can be extensive. This usually involves removing a concrete gore
nose. In some instances, bridge railing ends are revised and a concrete
wall or backstop is built. A backstop or secondary barrier is suggested
203

for inertial c:rash. cushions where the vehicle could penetrate the
cushion and p,l:unge down a slope.
Spaee available. for erash eushion - Two dimensions must be con
sidered with regard to the available space. These are the length ("L"
in Figure VI-D-1} over which the barrier can be placed, and the distance
on either s.ide of the barrier to the hazard ("F" in Figure VI-D-1).
While the length. is important in the design of each barrier, all of the
operational sys.tems (excluding C6) will perform in a similar manner for
a given length, o;f installation if designed properly, at least for reason
able vehic.le sp.eeds and weights.
As shown in Figure VI-B-2, the suggested minimum distance "F" for
inertial cras:h cushions is 2.5 feet (0.8 m). Where this cannot be ac
complished, a cushion with redirectional capabilities should be strongly
considered. Care must be exercised, however, with the fendering systems
to insure that a structurally adequate transition is used between the
cushion and the object it shields. Snag points are not acceptable. If
the cushion requires speci a 1 anchorage, it will have to be provided in
the available space.
Physical conditions of the available space - The following site
conditions should be considered:
1. the presence of a curb which could affect the performance of
the crash cushion;
2. the existing surface material and condition thereof;
3. the longitudinal and transverse slope of the crash cushion
area;
4. expected low temperature since several of the systems are
sensitive to below freezing temperatures;
204
5. high wind and/or abnormal vibration conditions; and
6. the existence of construction or expansion joints in the
crash cushion area.
Reference should be made to Section VI-F for more discussion of items 1
and 3. With regard to item 2, it is desirable that all of the systems
be placed on a concrete or asphalt surface, but it is essential for
the steel drums, hi-dro cell sandwich, and the hi-dri cell sandwich. This
permits the systems to slide back with uniform response during an impact.
In the case of the inertial crash cushions, the paved surface provides
uniform support for the modules. In addition, it provides a surface
on which the pattern and weights of the modules can be marked. This
helps maintenance forces in subsequent restorations after impacts. The
following comments are offered with regard to items 4 and 5:
a. If the hi-dro cell sandwich or cluster crash cushion is pro
posed for a location that is subject to prolonged freezing
temperatures, an anti-freeze treatment will be necessary for
the water.
b. Plowed snow might infiltrate an array of sand filled barrels
but have less effect on barriers with the side fender panels.
The effects of falling, drifting, or blowing snow can be mini
mized with a cover of some type of flexible material. Of
course, snow should be completely cleared away from all crash
cushions.
c. When the hi-dro cell sandwich or cluster crash cushion is in
stalled where extremely hot weather is prevalent, extra consi
deration of water loss due to evaporation is needed. A thin
205
layer of mineral oil on top of the water will provide
added protection against evaporation loss.
d. Sand filled barrels may be less desirable in high wind areas
because barrier debris can be scattered, i.e., barrel pieces,
core pieces, and sand.
With regard to item 6, special design accomodations may be necessary for
those systems that require anchorage.
VI-E. Selection Guidelines
The number and complexity of factors which enter the selection
process for crash cushions preclude the development of a simple selection
procedure. As has been alluded to in the previous sections, each opera
tional system has its own unique physical and functional characteristics.
In some cases, one crash cushion will stand out as the most appropriate,
while in other cases two or more crash cushions may be considered essen
tially equal in performance. Listed as discussed below are factors which
should be evaluated before making a selection. It is suggested that these
factors be evaluated in the order given, although they are not necessarily
listed in order of importance.
It is assumed, at this point, that a crash cushion is warranted
and that a selection must be made. As an aid to the guidelines presented
in this section, the designer should also c.onsider the application of
the cost-effective selection procedure presented in Chapter VII.
1. Site considerations - The first item to evaluate is the site
conditions. Factors to evaluate include dimension of object being
shielded, structural characteristics of object being shielded, available
206
space for cushion, and physical condition of site. Reference should be
made to Section VI -D for a discussion of all the factors related thereto.
In many cases, the site conditions will establish the type of barrier
needed.
2. Structural and safety characteristics of candidate systems -
If more than one system can be used, the designer should carefully
evaluate the structural and safety characteristics of each candidate
system. These include factors such as impact decelerations, redirection
capabilities, anchorage requirements, debris produced by impact, and
back-up structure requirements. It is desirable that the most crashworthy
system be installed. Reference should be made to Section VI-B for a dis
cussion of the structural and safety characteristics of the operational
systems. Table A-3 of Appendix A summarizes crash cushion accident data.
3. Maintenance characteristics and aesthetic appeal - Not too
infrequently the most appropriate barrier will still not be evident after
evaluating items 1 and 2 above. The maintenance characteristics of each
barrier may therefore play an important role in the selection. Section
VI-C identifies the pertinent facts and provides guidelines to aid in
evaluating the maintenance and aesthetic characteristics of the operational
systems.
4. Costs- Limited cost data has indicated that some crash cushions
are more expensive than others. This variation in cost can readily be
seen in the components which go to make up the systems and the installa
tion effort required. The designer should, if other design factors for
the site under consideration have not indicated the one best crash cushion,
employ engineering economics so as to arrive at the least expensive system
207

over the estimated life of the system. The economic factors to be consi-
dered are intial cost, maintenance costs, vehicle damage and occupant
injury costs, time value of money, life of the system, and salvage value.
The procedure described in Chapter VII can be used to evaluate these
factors.
The initial cost indications shown below are based on a very
few installations. Each State should determine local costs for each
of the approved systems. Limited initial and maintenance cost data
are given in Table A-3 of Appendix A .
.
Low Moderate High Initial Initial Initial
System Costs Costs Costs
Cl - Steel Drums I
C2 - Hi-Oro Cell Sandwich I
C3 - Fitch Inertial I
C4 - Energite Inertial I
C5 - Hi-Dri Cell Sandwich I
C6 - Hi-Oro Cell Cluster I
Reference should be made to Section VI-C and Table VI-C-1 to aid in
estimating maintenance costs and salvage values. All of the approved
systems will produce damage to impacting vehicles whether hit on the
nose or on the side. Experience does not indicate that one system is
better than the other in this respect. Naturally, the higher the impact
speed-the higher the degree of damage. Field experience has shown that
most vehicles which impact crash cushions are driven away.
208
VI-F. Placement Recommendations
It must be recognized that all of the crash cushions were designed
and tested for relatively level terrain conditions. Adverse and unac
ceptable performance can be expected if the barrier is placed on or behind
certain terrain conditions. It is highly desirable that the crash cushion
be placed on a relatively flat surface (5 percent slope or less preferrable)
and that there be no appurtenances bewteen the traveled way and the barrier.
Two prominent roadside features which the designer must often con
tend with are curbs and slopes. Tests and computer simulations have shown
that both of these features can cause an errant vehicle to rise above the
terrain and become airborne and reach undesirable roll and pitch angles.
For new projects, curbs should not be built where crash cushions are to
be installed. Existing curbs where cushions are to be installed should
be removed if feasible, in particular those that are higher than approx
imately 4 inches (0.1 m).
For roadside or median installations, it is desirable that the
shoulder be extended to provide a relatively flat appraoch area to the
cushion. A more detailed discussion of the effects of curbs and slopes
on barrier performance is given in Section III-E-3. Also, Appendix F
contains a summary of vehicle trajectory data for various slopes and curb
sizes and types.
Unanchored crash cushions (C3 and C4), when placed on elevated
gores, may walk or crack due to vibration of the structure. However,
at this writing there is no clear pattern of such occurrences. Manufac
turers should assure the adequacy of their design in this regard.
209
Hazardous gore areas have received the greatest attention with
regard to crash cushion installations. It cannot be refuted that
these areas have a higher potential for serious accidents than any other
area of similar size along the roadway. Treatment of these areas should
be given top priority. It now appears, however, that other areas, which
heretofore had been shielded by conventional roadside barriers, can best
be shielded, cost effectively, by crash cushions. Reference should be
made to Example 2 of Section VII-C for an illustration of this.
Figure VI-E-1 shows examples of median and roadside hazards which
can be shielded either totally or partially by crash cushions. The
approach areas should be flat and have no appurtenances between the
traveled way and the cushion. If these conditions do not exist and can
not be provided, a roadside barrier placed near the shoulder is the
recommended system. Selection of the barrier angle, e, should be based
on the probable impact angle of encroaching vehicles. Impact angles
will be dependent in most part on operating speeds, roadway alignment,
and lateral distance from the traveled way to the cushion. For most
roadside conditions, an angle of approximately 10 degrees or less is
suggested.
All of the operational crash cushions can probably be adapted to
shield rigid objects such as those shown in Figure VI-E-1. However, with
the possible exception of the median barrier end treatments (see Table
IV-B-5), the inertial barriers are more easily adapted to shield rigid
objects than others. First, they do not require a back-up structure.
Secondly, if exposed, the rear part of a non-inertial barrier system may
itself be a significant hazard. Such problems would arise for median
210

N 1-' 1-'
/TRAFFIC .... TRAFFIC ' ~
··,I_c,,..-------. '•17'";
crash cushion crash cushion ~
.Jl?OOC? ....... ~ ... , ,.liW-. ::·:·.·:·
I
~-------.·· rigid/object ·-·· ~ ~~n5c~~ffb~~er A~~.:,. <•
TRAFFIC'-TRAFFIC ) 7
-FLAT MEDIANS-
(a) Single Object (b) Multiple Object
TRAFFIC ) TRAFFIC, .....
/_/ / /
e*l' "' ,,..... . .... ·"·:·---c-. ---"""' --)_ ;.:crash cushion
Section A-A
rigid object ' MB5 shaped/roadside i concrete barrier ts
lit SEE TEXT FOR SUGGESTED VALUE
pier
-FLAT ROADSIDE AREA-Fiqure Vl-E-1. Examples of Possible Crash Cushion Application
· on the Roadside or in the Median Section B-B
installations. It is likely, however, that the non-inertial systems
could be adapted by careful design of transition and attachment details.
212

VII. A COST-EFFECTIVE SELECTION PROCEDURE
VII-A. Introduction
Collisions involving vehicles with roadside objects represent a
problem inherent to any existing highway facility. Consequently, road
side safety improvement programs have evolved to provide guidance in
eliminating those problem locations where attention is vitally needed.
For the most part, these programs share the following policy base.
1. Obstacles which may be removed should be eliminated.
2. Obstacles which may not be removed should be relocated
laterally or in a more protected location.
3. Obstacles which may not be moved should be reduced in impact
severity. Breakaway devices and flattened side slopes offer
such an improvement.
4. Obstacles which may not be otherwise treated should be shielded
by attenuation or deflection devices.
While the above mentioned points of design summarize the available alter
natives, the questions of "where, when or how" are often left unanswered.
Limited funds is also a factor most agencies face. The designer is thus
confronted with the problem of selecting those alternatives which offer
the greatest return in terms of safety benefits.
The purpose of this cost-effective selection procedure is to pro
vide a technique for comparing alternate solutions to problem locations.
Present value of the total cost of each alternative is computed over a
given period of time, taking into consideration initi.al costs, mainten
ance costs, and accident costs. Accident costs incurred by the motorist,
213
including vehicle damage and personal injury, are considered together
with accident costs incurred by the highway department or agency.
Selection of the alternative with the 1 east tota 1 cost waul d normally
be made.
With regard to traffic barriers, the cost-effective procedure can
be used to evaluate three alternatives:
1) remove or reduce hazard so that shielding is unnecessary;
2} install a barrier; or
3) do nothing, i.e., leave hazard unshielded.
The third option would normally be cost effective only on low
volume and/or low speed facilities, or where the probability of accidents
is low. With regard to item 2, the procedure allows one to evaluate any
number of barriers that can be used to shield the hazard. Each location
and its alternatives should be approached on an individual basis. Through
this method the effects of average daily traffic, offset of barrier or
hazard, size of barrier or hazard, and the relative severity of the barrier
or the hazard can be evaluated.
The procedure presented herein will allow one to objectively
establish priorities for the options at a given site. Although not pre
sented, the procedure can be extended to establish priorities for a road
way system, either on a local, regional or statewide basis. Such a
procedure can be found in the literature (102, 103, 141).
VII-B. Development, Assumptions and Limitations
Although certain assumptions were essential to the development of
the cost-effective procedure, it reflects a rational approximation based
214

on existing technology. Generally, the formulation of the procedure
parallels closely other cost-effective selection techniques (102, 103,
141). The procedure is structured around an accident prediction tech
nique used to estimate the frequency at which a roadside object or hazard
will be struck over a given period of time. For an in-depth discussion
of the basis for the procedure, its assumptions and limitations, the
reader may refer to the citations given above. Specific limitations and
assumptions are listed and discussed below.
Generality and fl exi bi l ity have been preserved in the procedure
presented herein. This allows the user to incorporate new data as it
becomes available and to make subjective adjustments as deemed necessary.
Limitations which exist in the procedure relate primarily to the
data needed to implement it. In this regard, the following observations
are made:
1. Encroachment frequency - Frequency of accidents with road
side objects is closely related to the nature and frequency
of vehicle encroachments from the traveled way. Encroach
ment data presented herein is based on observations conducted
on relatively flat medians along tangent sections of multi
lane facilities (16). Studies are needed to determine the
effects of vertical and horizontal alignment, roadway width
and number of lanes, operating speed, and other variables
on the encroachment frequency. Recent studies with regard
to encroachments on secondary roadways has increased the
state of knowledge in this area (142).
215
2. Encroachment speed - Encroachment speed is not considered
directly in the model. Indirectly, effects of encroachment
speed can be accounted for by adjusting the anticipated
relative severity of the impact with the roadside object or
hazard. Also, the speed of an errant vehicle will generally
diminish with lateral movement on the roadside, i.e., the
driver will usually be stopping the vehicle, or it will be
slowed due to skidding. Again, the effects of such speed
reductions can be accounted for by adjustments in the rela
tive severity of the object as a function of its offset
distance. However, there is no data to indicate how speed
and lateral movement of an errant vehicle are related.
Roadside slopes or ditches would also be a factor in such
a relationship, as discussed below. Suggested severity
ratings for roadside objects are included herein. These
apply to high speed facilities and are based on assumed
impacts at high speeds, approximately 60 mph (96.5 km/hr).
3. Roadside slopes - Recent studies have shown that the ability
to return an errant vehicle to the traveled way after en
croaching on an embankment decreases as the slope of the
embankment increases. Results of these studies are reflected
in the ''clear distance'' criteria suggested in Figure III-A-3.
However, at this time, there is no field or accident data
to describe the statistical distribution of the lateral
movement of errant vehicles on embankments. Data used to
develop the cost-effective procedure are based on observations
216
of encroachments on relatively flat medians (1£).
4. Directional split - It is assumed that the directional
split is 50/50 with respect to average daily traffic.
Whenever alternate data is available, it may be used as input at the
discretion of the designer. By providing this option to the user, the
model assumes a general format as opposed to being strictly dependent on
existing technology relative to the current state of the art.
VII-C. Applications
Implementation of the cost-effective procedure primarily involves
the determination of several input values. The computations are simple
and require only basic mathematics. It should be noted that during the
course of the text, the word "obstacle" is used quite frequently. In
this context, the term is meant to apply to either a hazard or improvement,
whichever the case may be. The following steps summarize the procedure
to be followed in the cost-effective analysis.
1. From existing or proposed geometry determine the following:
A= lateral placement of the roadside obstacle.from EOP (feet),
L =horizontal length of the roadside obstacle (feet), and
W =width of the .roadside obstacle (feet).
2. From volume counts or estimates, determine the average daily
traffic, ADT (vehicles per day). This value should represent
the two-way volume flow.
3. Determine the encroachment frequency, Ef (vehicle encroachments
per mile per year), from Figure VII-C-1. Figure VII-C-1 was
obtained from data discussed previously (1£). Other available
217
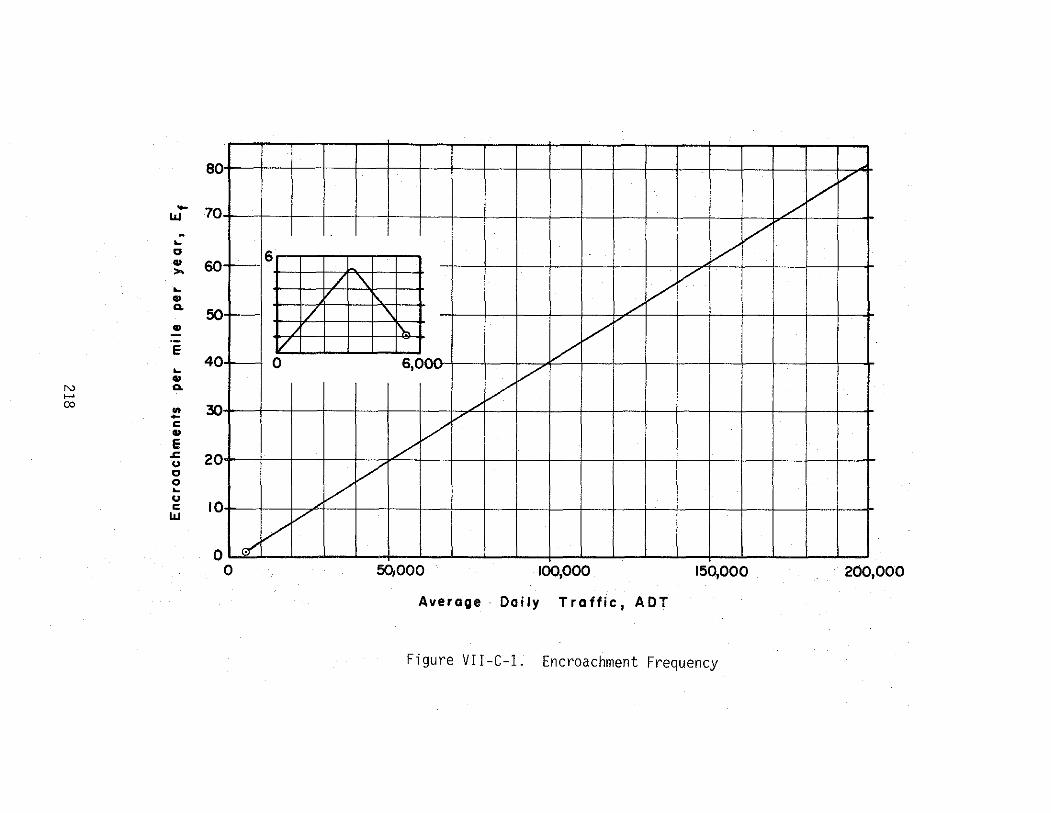
-LIJ
... " ... .... ... ... ... .. E ... ...
N a. ..... co .. -c ..
E J:. u
" 0 ... u c
LIJ
80
70
60 ~
50 ~
40 ~
30
20
10
0 0
_if'
6
/
/
v 0
v v v
v /
/
v v '\ v v I
/ ' ~
!)., v v 6,0~ v v L
v v
/ v
50,000 100,000 150,000 200,000
Average Doily T ro ffic, A DT
Figure VII-C-1. Encroachment Frequency
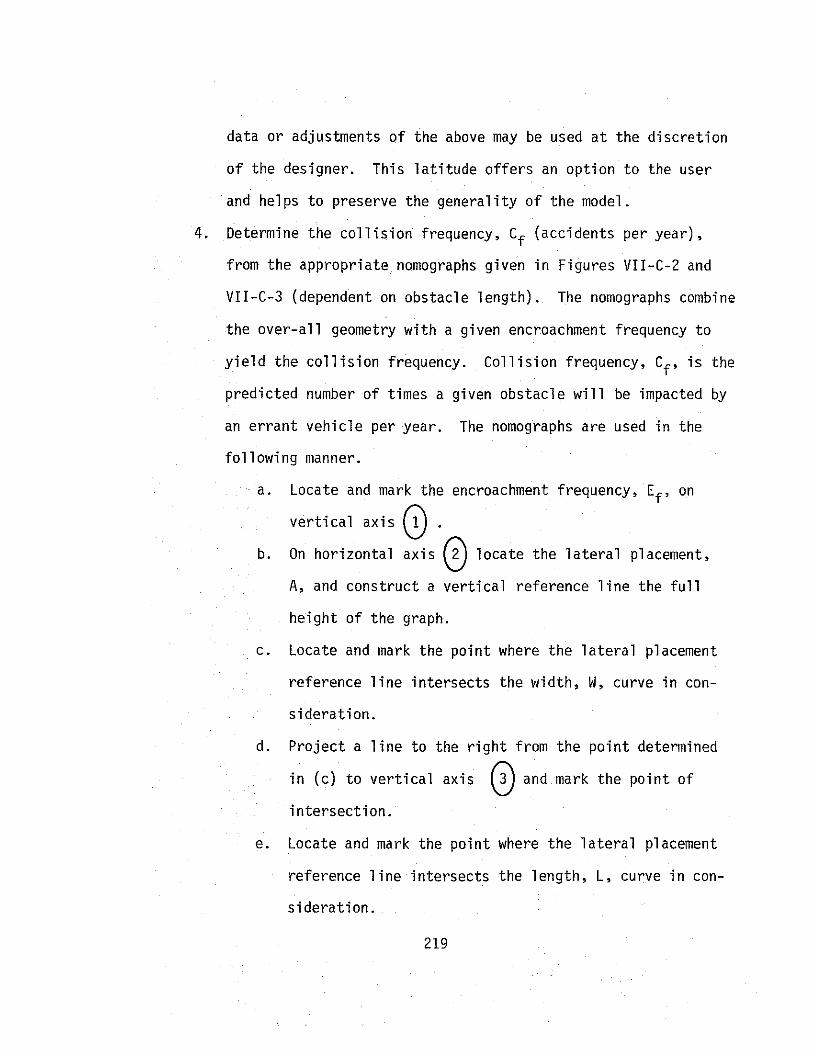
data or adjustments of the above may be used at the discretion
of the designer. This latitude offers an option to the user
and helps to preserve the generality of the model.
4. Determine the collision frequency, Cf (accidents per year),
from the appropriate nomographs given in Figures VII-C-2 and
VII-C-3 (dependent on obstacle length). The nomographs combine
the over-all geometry with a given encroachment frequency to
yield the collision frequency. Collision frequency, Cf, is the
predicted number of times a given obstacle will be impacted by
an errant vehicle per year. The nomographs are used in the
following manner.
a. Locate and mark the encroachment frequency, Ef, on
vertical axis ~ . b. On horizontal axis~ locate the lateral placement,
A, and construct a vertical reference line the full
height of the graph.
c. Locate and mark the point where the lateral placement
reference line intersects the width, W, curve in con-
sideration.
d. Project a line to the right from the point determined
in (c) to vertical axis ~ and mark the point of
intersection.
e. Locate and mark the point where the lateral placement
reference line intersects the length, L, curve in con
sideration.
219

220
+' QJ QJ
lJ._
0 0 N
0
E e 4-
·~ </)
·~
N I
u I ~
~
> QJ s.. :::l 0">
lJ._
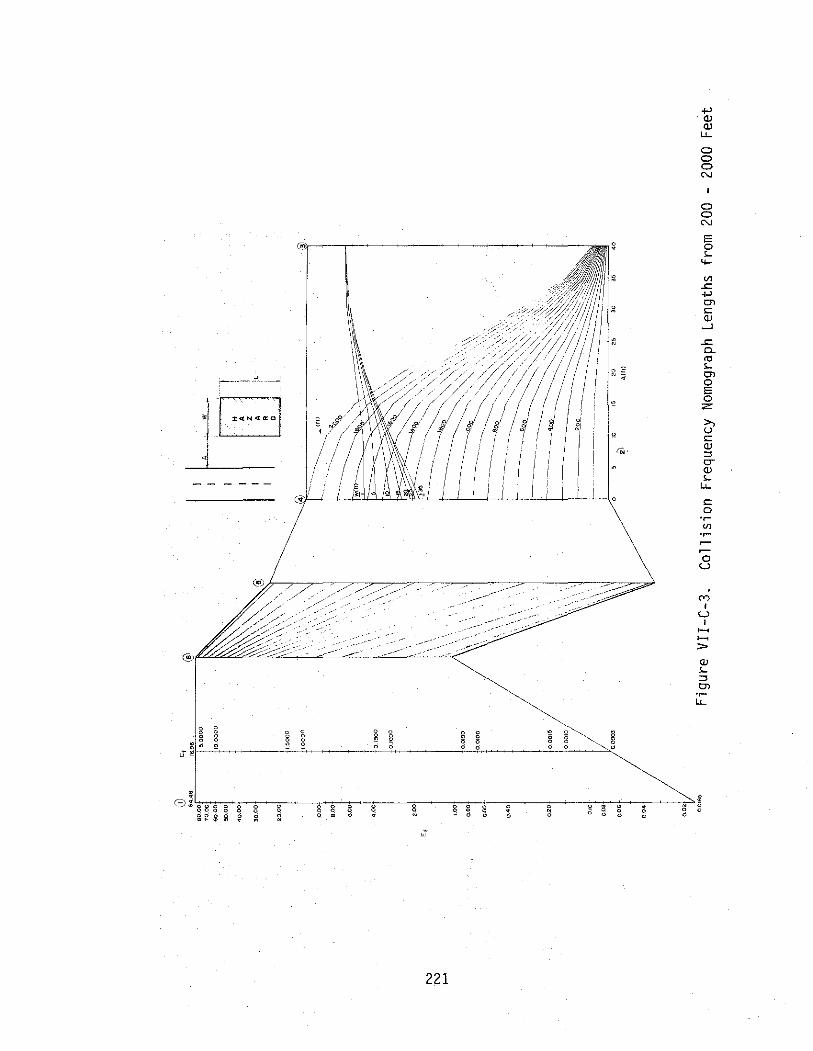
221
+' QJ QJ u.. C) C) C) N
C) C) N
E 0 r... 4-
"' .r:: +' en <= QJ -l
.r:: D..
"' '-en 0 E 0 z
i:? <= QJ :::! CT QJ
'u.. <= 0
·~
0 u
('") I
u I ~
~
> QJ r... :::! en ·~ LL.
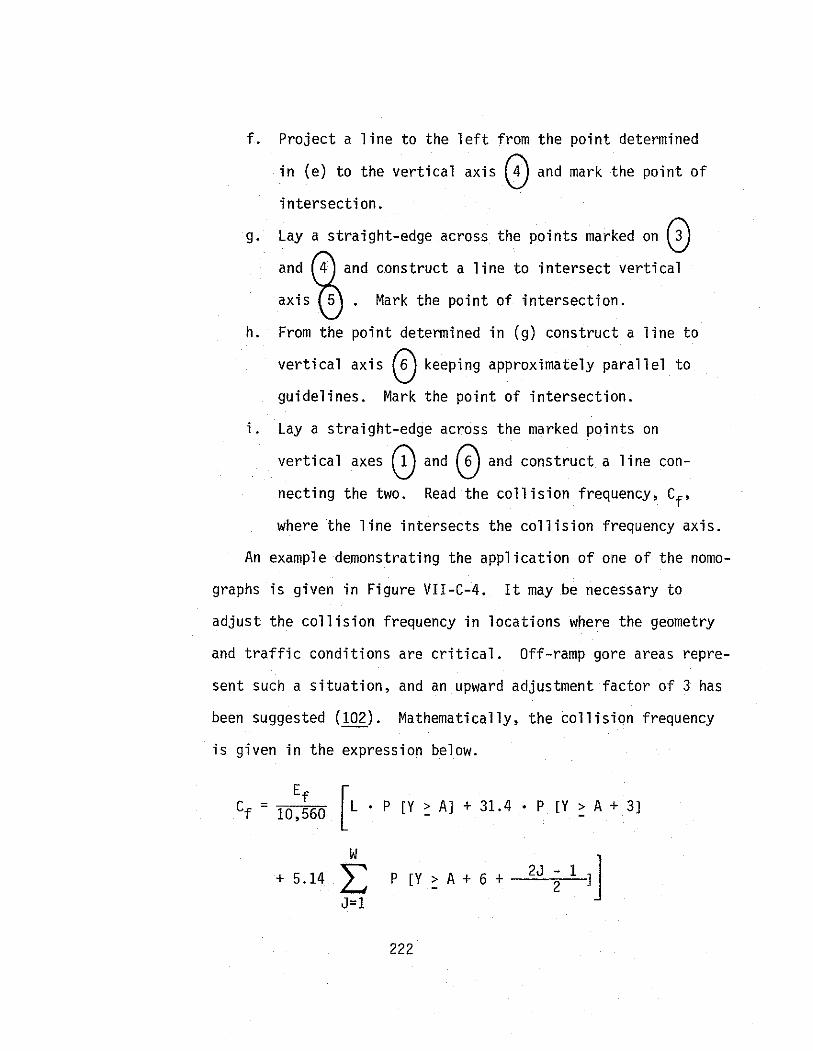
f. Project a line to the left from the point determined
in (e) to the vertical axis ~ and mark the point of
intersection.
g. Lay a straight-edge across the points marked on ~ and~ and construct a line to intersect vertical
axis ~ . Mark the point of intersection.
h. From the point determined in (g) construct a line to
vertical axis ~ keeping approximately parallel to
guidelines. Mark the point of intersection.
i. Lay a straight-edge across the marked points on
vertical axes ~ and ~ and construct a line con
necting the two. Read the collision frequency, Cf'
where the line intersects the collision frequency axis.
An example demonstrating the application of one of the noma
graphs is given in Figure VII-C-4. It may be necessary to
adjust the collision frequency in locations where the geometry
and traffic conditions are critical. Off-ramp gore areas repre-
sent such a situation, and an upward adjustment factor of 3 has
been suggested (102). Mathematically, the collision frequency
is given in the expression below.
Ef [ Cf = 10, 560 L • p [ y :: A l + 31. 4 • p [ y :: A + 3]
w + 5.14 ~ P [Y > A + 6 +
J=1
222
2J 2 1 l J
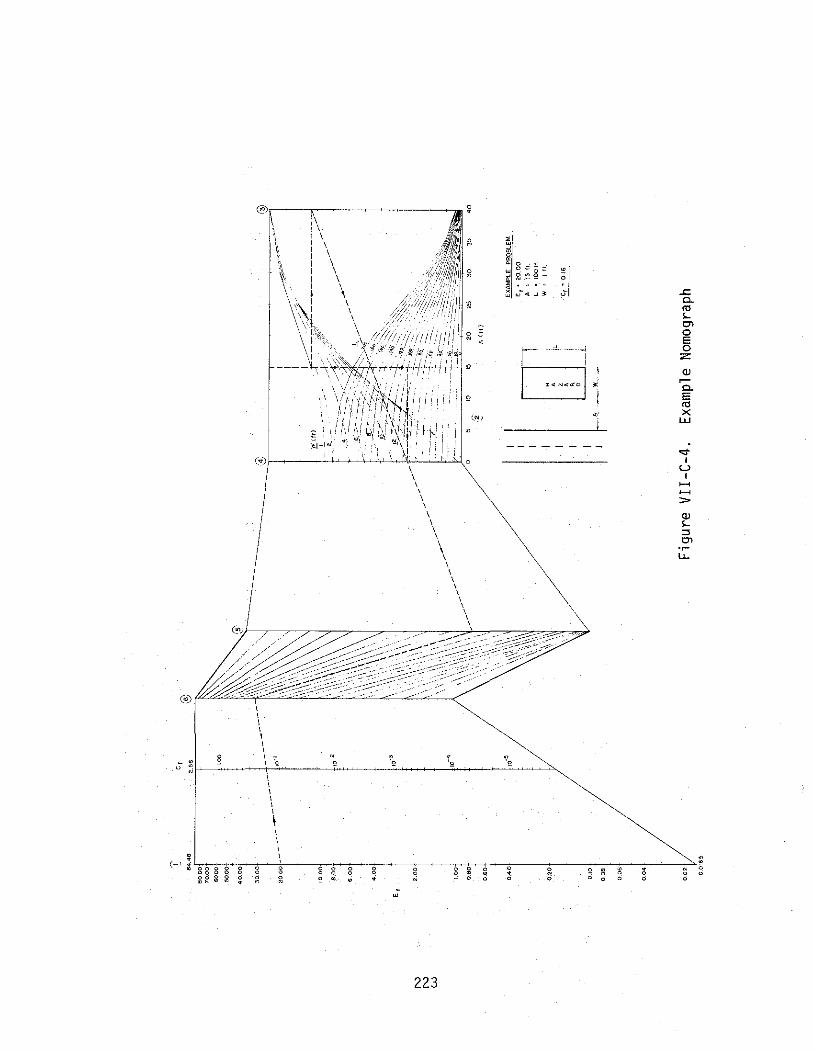
~ 8
~
"
\ \
' \ \ \ \ \ \
\
223
\ \ \ \ \
\
g
' '
~ 0 ' " 8 0
0
0 0
~ 0 0 • : 0
g 0
<:!" I
'-' I ~
~
> Q) S:::5 0>
LL.
where,
the variables A, L, W and Ef are as previously defined
and,
Y = the lateral displacement, in feet, of the encroaching
vehicle, measured from the edge of the traveled way to the
longitudinal face of the roadside obstacle;
P [Y: ... )=probability of a vehicle lateral displacement
greater than some value. These probabilities may be taken
from Figure VII-C-5 (102); and
J = the number of obstacle-width increments used in the
summation.
This equation may be implemented directly into the cost
analysis or used as a double-check for the collision frequency
nomographs.
5. Assign a severity index to the obstacle of concern. It is
suggested that the index be chosen on a scale of 0 to 10 accord
ing to the criteria given in Table VII-C-1 (103). For example,
if it is estimated that an impact with the obstacle will result
in injuries or a fatality 60 percent of the time, select an
index of 7. Corresponding to the index is an estimated accident
cost, which includes those costs associated with vehicle damage
and occupant injuries and/or fatalities. Figure VII-C-6 is a
graphic representation of accident cost versus severity index.
Discretion is advised in assigning severity indices and the
designer is encouraged to exhaust all available objective data
before resorting to judgment. A set of indices for a number of
224
100 ~ ........___ -, ---
90 "' '\ ~ ~ 80 1.\.
>-"
[\
\ (!)
z 70 0 liJ liJ (.) X liJ 60 a: 0
\ \ ·--\
(!)
z ::i 50
\ <1: :::::1 0 liJ
I- 40 z liJ :::E
\ \
.
:X: u <1:
30 0
I \ a: u z liJ LL 20 0
>-I-
1\
\ \
...J iii 10 <1: ID 0
[\_
""" a: 1.\.
0 ~ -
0 10 20 30 40 50
LATERAL EXTENT OF MOVEMENT, Y (FEET)
Figure VII-C-5. Lateral Displacement Distribution
225
Severity Index
Q
1
2
3
4
5
6
7
8
9
1Q
Table VII-C-1. Severity Index and Accident Cost
% PDQ Accidents*
1QQ
85
7Q
55
4Q
3Q
2Q
1Q
Q
Q
Q
% Injury Accidents
Q
15
3Q
45
59
65
68
6Q
4Q
21
5
% Fatal Accidents
Q
Q
Q
Q
1
5
12
3Q
6Q
79
95
Total Accident
Cost
$ 7QQ
2,095
3,49Q
4,885
8,180
16 '710
3Q,940
66,Q7Q
124,QQQ
16Q,QQQ
19Q,OQO
*PDQ refers to those accidents where property damage only is involved.
226
N N -..!
0
ACCIDENT COST FOR I pEVERITY SHOWN
-------- f
I ASSUMPTIONS
SEVERITY % PDO %INJURY %FATAL ACC. INDEX ACC. ACC. ACC. COST
4 40 59 I 8180 5 30 65 5 16,710 -
/ 6 20 68 12 30,940 7 10 60 30 66,070 8 0 40 60 124,000 9 0 21 79 160,000
10 0 5 95 190,000
BASED ON
/ $ 200,000 per Fofoli!y
/ 10,000 per injury Accident
200 per PDO Accidenf
I I
2 4 6 8 10
SEVERITY INDEX
Figure Vll-C-6. Average Occupant Injury and Vehicle Damage Costs
I 200
I, 60
0 0 r r l> ::u
x; r c ITI
20 0 "T1
80
40
0
l> z l> () ()
0 ITI
~ ~
-{/)
)(
0 0 0 ~
roadside obstacles has been developed (103), see Tables E-1
and E-2 of Appendix E, and may be used for guidelines in the
absence of more definitive data.
6. Determine the intial cost of the obstacle, c1. If it is
already in place, its initial cost may be assumed to equal zero.
For example, if a group of median bridge piers had been in exis
tence for ten years, then the initial cost of a no improvement
alternative would be taken to be zero. On the other hand,
improvements to such a hazard would require initial expenditures
which should be so designated.
7. Determine the average damage cost to the obstacle per accident,
CD (present dollars).
8. Determine the average maintenance cost per year, CM' associated
with the upkeep of the obstacle (present dollars).
9. Determine the average occupant injury and vehicle damage cost
per accident, COVD' which would be expected as a result of a
collision (present dollars). Table VII-C-1 or Figure VII-C-6
may be used to determine COVD in the absence of more definitive
data.
10. Determine the useful life, T, of the obstacle (years).
11. Determine the economic present worth factors, KT and KJ' for
the useful life, T, and a current interest rate from Tables
VII-C-2 and VII-C-3.
12. Estimate the expected salvage value of the obstacle, c5 , at the
end of its useful life (future dollars).
228
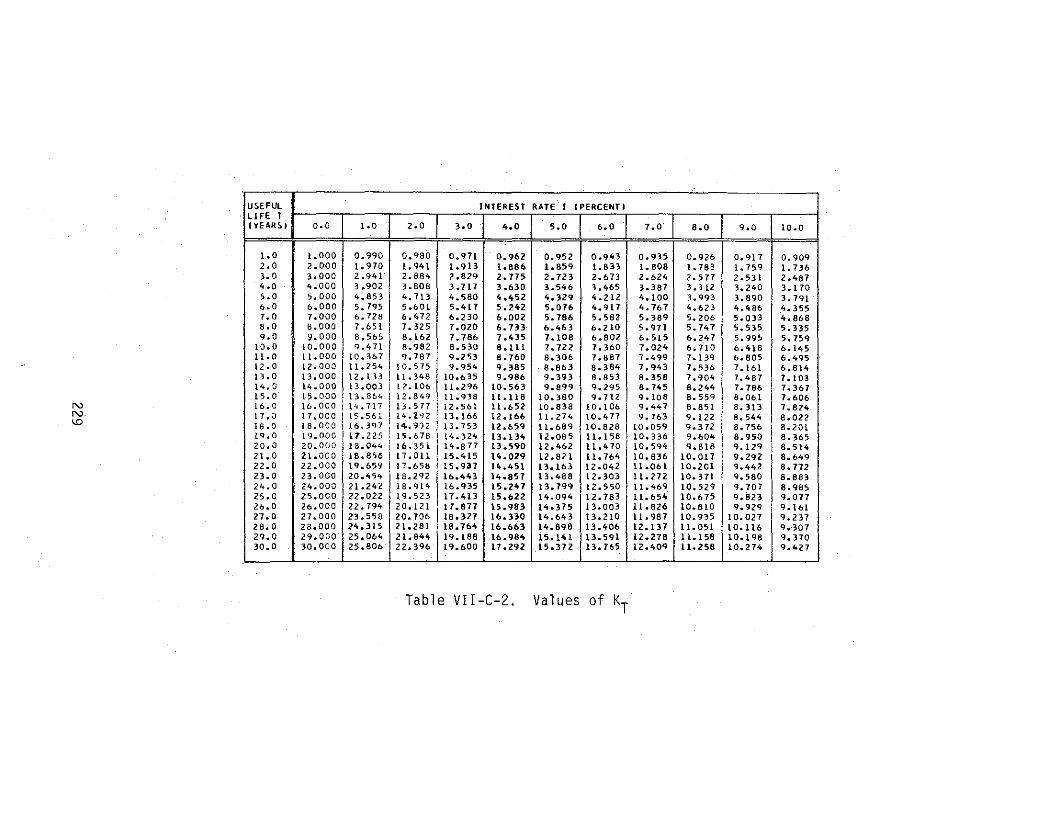
N N <.0
U!>EFUL LIFE T IY'EAR51
'· 0 2.0 3.0 4 .o s.o •• o 7.0 a.o 9.0
10.0 u.o 12 .a 13o0 14.0 15.0 16.0 17.0 18.0 19.0 20.0 21.0 22.0 23.0 24.0 25.0 26.0 27.0 28.0 29.0 30.0
L-
o.o loO
1.000 0.990 z.ooo 1. 970 3.000 2.941 4.000 3,.902 5,000 4.853 6.000 5.795 7.000 6.728 a.ooo 7.651 9.000 8.565
10.000 9.471 11.000 10.367 12.000 llo 254 l3o000 12.133 14. 000 13.003 l5o000! 13.864 }6.000 1 14.7}7 t7.ooc 1 15.561 18.000 i 16.397 19.000 j 17.225 20.000! 18.0.,4 21.000 j 1Bo856 zz.ooo 1'1.65'1 23.000 20.454 24.000 21.242 25.0CO 22.022 26.000 22.794 27.000 23.5'58 2s.ooo 24.315 29.000 25.064 30.000 25.806
INTEREST RATE I IPERCENTI
2.0 3.0 •• o s.o b.O
0,.980 o. 971 0.962 0,.952 0.943 1. 941 1.913 1.886 1.859 1. 833 2.884 2.829 2.775 2. 723 2.673 3.608 3.717 3.630 3.546 3.465 4, 713 4.580 4.452 4.329 4.212 5.601 5.417 5.242 5.076 4.917 6.472 6.230 6.002 5.786 5.582 7. 32 5 7.020 6.733 6.463 6.210 8.162 7. 786 7.435 7.108 6.802 8.982 a. 530 8.111 7. 722 7.360 9. 7871 9.253 8.760 a. 306 7.887
l0o575 9o954 9.385 8o863 8 .. 384 11.348 10.635 9.986 9.393 8.853 12.106 11.296 10.563 9.899 9.295 12.849 I 11.93a 11.118 10.380 9.712 13.sn 1 12.561 11.652 10.838 10o106 14.2"12. 13.166 12.166 11.274 10.477 14.992 j 13.753 12.659 11.689 10.828
!!:~~~ l ~z::~~ 13.134 12.085 11. 158 13.590 12.462 11.470
17.011 l5o415 14.029 12.821 11.764 17.658 15.937 l4o451 13.163 12o042 1a.2n 16.41t3 14.857 13.48 8 12.303 18.914 l6.'B5 15.247 13. 79q 12.550 19.523 17 ~ 413 15.622 14.094 12.783 20o121 17.877 1s.qa3 14.375 13o003 20.706 18.327 16.330 14.643 13.210 21.281 18.764 16.663 14.898 13.406 21.844 1 q. 188 16.984 15.141 13-591 22.396 19.600 17.292 15.372 13.765
Table Vll-C-2. Values of KT
7 .o a.o 9.0 10 .. 0
0.935 o.nb 0.917 0.909 1.808 1.783 1. 759 1. 736 2.624 z. 577 2.531 2.487 3.387 3 .3 12 3.240 3.170 4.100 3.993 3.890 3.791 4.767 4.623 4.486 4.355 5.389 5.206 5.033 4.868 5.971 s. 747 5.535 5.335 6.515 6.247 5.995 5.759 7.024 6. 710 6.-418 6.145 7o499 7.139 6.805 6.495 7.943 7.536 7. 161 6.814 8o358 7.904 7 0 487 7 0 103 a. 71!5 8.244 7.786 7.367 9.108 a. 559 8.061 7 0 606 9.447 8.851 a. 313 7.824 9.763 9.122 8o544 8.022
10.059 9.372 i a.756 I 8.201 10.336 9.604 1 8.950 8.365 10.594 ··""I 9.129 j 8.514 10.836 10.017 9.292 I 8.649 11.061 10.201 9.442 8.772 11.272 10.371 9.580 8.883 11.469 10.529 j 9o 101 j 8.qa5 11.65.4t 10.675 9.823 9.077 11.826 10.810 9o929 I 9.161 l1o987 10.935 10.027 9.237 12.137 11o051 10oll6 9.307 12.278 11.158 l0o198 9.370 12.409 ll-258 10.274 9.1t27
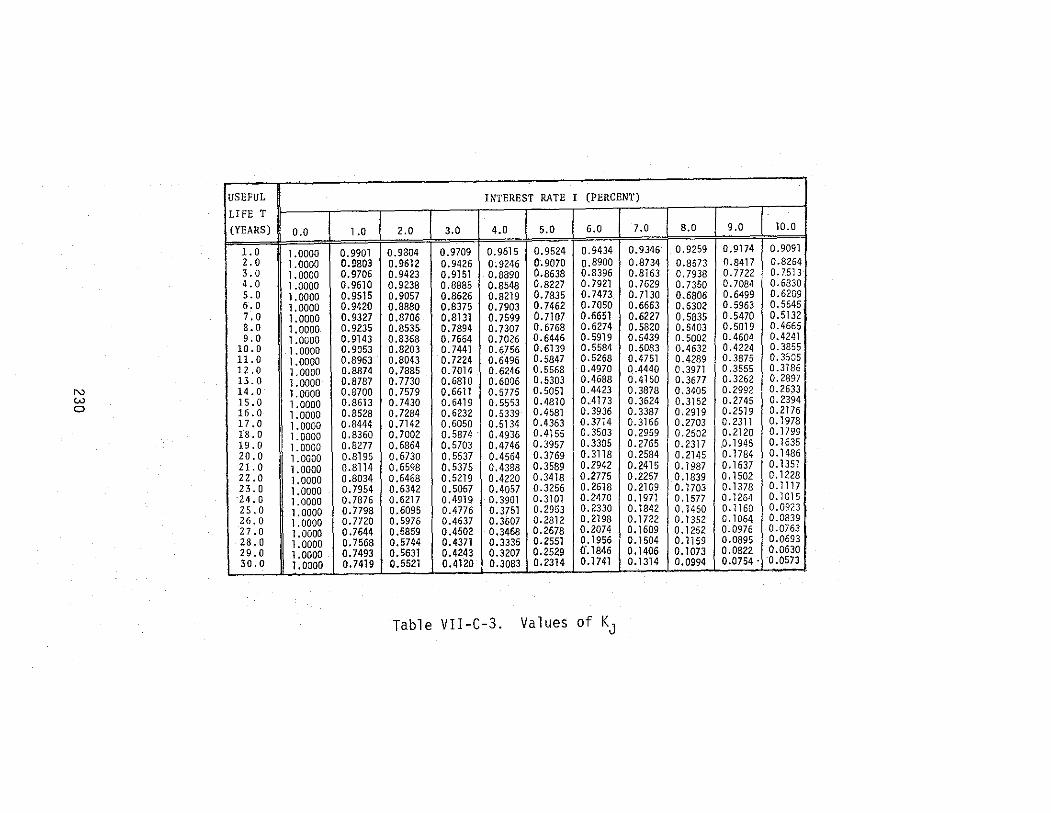
N w 0
USEFUL LIFE T (YEARS)
1.0 z.o 3.0 4.0 s.o 6.0 7.0 8.0 9.0
10.0 11.0 12 .0 13.0 14.0 15.0 16.0 17.0 18.0 19.0 20.0 21.0 22.0 23.0
"24. 0 25.0 26.0 2 7. 0 28.0 29.0 30.0
0.0 l.O
1.0000 0.9901 1.0000 0.9803 l. 0000 0.9706 1.0000 0.9610 1.0000 0.9515 l. 0000 0.9420 l. 0000 0.9327 l. 0000 0.9235 1.0000 0.9143 l. 0000 0.9053 1.0000 0.8963 1.0000 0.8874 1.0000 0.8787 l. 0000 0.8700 l. 0000 0.8613 l. 0000 0.8528 1.0000 0.8444 l. 0000 0.8360 1.0000 0.8277 l. 0000 0.8195 1.0000 0.8114 l. 0000 0.8034 1.0000 o. 7954 1.0000 0.7876 l. 0000 0.7798 l. 0000 0.7720 l. 0000 0.7644 1.0000 o. 7568 1.0000 0.7493 l. 0000 0.7419
INTEREST RATE I (PERCENT)
2.0 3.0 4.0 5.0 6.0 7.0 8.0 9.0 10.0
0.9804 0.9709 0.9615 0.9524 0.9434 0.9346 0.9259 0.9174 0.9091
0.9612 0.9426 0.9246 0'.9070 0.8900 0.8734 0.8573 0.8417 0.8264 0.9423 0.9151 0.8890 0.8638 0.8396 0.8163 0.7938 0. 7722 0.7513 0.9238 0.8885 0.8548 0.8227 o. 7921 0. 7629 0.7350 0. 7084 0. 6830 0.9057 0.8626 0.8219 0.7835 o. 7473 0. 7130 0.6806 0.6499 0.6209 0.8880 0.8375 0.7903 0.7462 0.7050 0.6663 0.6302 0.5963 0. 5645 0.8706 0.8131 0. 7599 0. 7107 0.6651 0.6227 0.5835 0.5470 0.5132 0.853> 0.7894 0. 7307 0. 6768 0.6274 0.5820 0.5403 0.5019 0.4665 0.8368 0.7664 0.7026 0.6446 0.5919 0.5439 0. 5002 0.4604 0.4241 0.8203 0.7441 0.6756 0.6139 0. 5584 0.5083 0.4632 0.4224 0.3855 0.8043 0.7224 0.6496 0.5847 0.5268 0.4751 0.4289 0.3875 0.3505 o. 7885 0. 7014 0.6246 0.5568 0.4970 0.4440 0.3971 0.3555 0.3186 0.7730 0.6810 0.6006 0.5303 0.4688 0.4150 0.3677 0.3262 0.2897 0.7579 0.6611 0.5775 0.5051 0.4423 0.3878 0. 3405 0.2992 0.2633 0. 7430 0.6419 0.5553 0.4810 0.4173 0.3624 0.3152 0.2745 0. 2394 0.7284 0. 6232 0.5339 0.4581 0. 3936 0.3387 0. 2919 0.2519 0.2176 0.7142 0.6050 0.5134 0.4363 0.3714 0.3166 0.2703 0. 2311 0.1978 0. 7002 0.5874 0.4936 0.4155 0. 3503 0.2959 0.2502 0.2120 0.1799 0.6864 0. 5703 0.4746 0.3957 0.3305 0.2765 0.2317 .0.1945 0.1635 0.6730 0.5537 0.4564 0.3769 0. 3118 0.2584 0.2145 0.1784 0.1486 0.6598 0.5375 0.4388 0.3589 0.2942 0.2415 0.1987 0.1637 0.1351 0.6468 0.5219 0.4220 0.3418 0.2775 0.2257 0.1839 0.1502 0.1228 0.6342 0.5067 0.4057 0.3256 0.2618 0.2109 0.1703 0.1378 0.1117 0.6217 0.4919 0.3901 0.3101 0.2470 0.1971 0.1577 0.1264 0.1015 0.6095 0.4776 0.3751 0.2953 0. 2330 0.1842 0.1460 0.1160 0.0923 0,5976 0.4637 0.3607 0.2812 0.2198 0.1722 0.1352 0.1064 0.0839 0.5859 0.4502 0.3468 0.2678 0.2074 0.1609 0.1252 0.0976 0.0763 0.5744 0.4371 0.3335 0.2551 0.1956 0.1504 0.1159 0.0895 0.0693 0.5631 0.4243 0.3207 0.2529 0'.1846 0.1406 0.1073 0.0822 0.0630 0.5521 0.4120 0.3083 0.2314 0.1741 0.1314 0.0994 0.0754. 0.0573
--
Table VII-C-3. Values of KJ
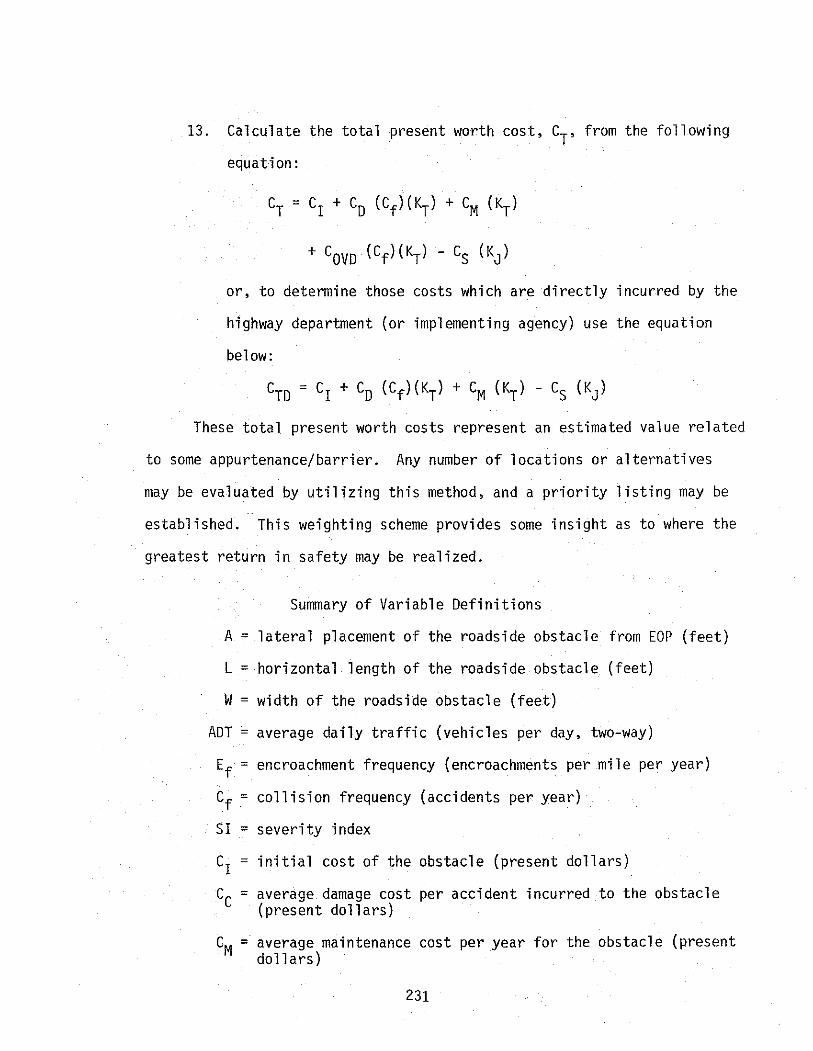
13. Calculate the total present worth cost, CT' from the following
equation:
or, to determine those costs which are directly incurred by the
highway department (or implementing agency) use the equation
below:
These total present worth costs represent an estimated value related
to some appurtenance/barrier. Any number of locations or alternatives
may be evaluated by utilizing this method, and a priority listing may be
established. This weighting scheme provides some insight as to where the
greatest return in safety may be realized.
Summary of Variable Definitions
A = lateral placement of the roadside obstacle from EOP (feet)
L = horizontal length of the roadside obstacle (feet)
W = width of the roadside obstacle (feet)
ADT = average daily traffic (vehicles per day, two-way)
Ef = encroachment frequency (encroachments per mile per year)
cf = collision frequency (accidents per year)
SI = severity index
c1 = initial cost of the obstacle (present dollars)
CC = average damage cost per accident incurred to the obstacle (present dollars)
CM = average maintenance cost per year for the obstacle (present dollars)
231

~ average occupant injury and vehicle damage cost per accident (present dollars)
CS ~ estimated salvage value of the obstacle (future dollars)
CT ~ total present worth cost associated with the obstacle
CTD ~ total present worth direct cost associated with the obstacle
T ~ useful life of the obstacle (years)
KT,KJ ~ economic factors for some current interest rate
VII-C-1. Example 1 - Roadside Slopes
In the first example, it is desired that criteria be established to
indicate when it is cost-effective, in terms of ADT and sideslope, to
shield an embankment. It is assumed that an operating speed of approxi
mately 60 mph (96.5 km/hr) exists. The general geometry of the roadside
is illustrated in Figure VII-C-7. For purposes of analysis, both the
average daily traffic, ADT, and the roadside slope will be considered as
variables. Values assigned to the other variables are assumed to fall
within a reasonable expected range. The following analysis will consider
shielding with a roadside barrier first and then the alternative of no
shielding.
Roadside Barrier
Before this alternative can be considered in the cost-effectiveness
procedure, the flared end-treatment geometry should be established by
implementing the barrier flare criteria set forth in Section III-E. By
making these calculations, the flared sections were found to exhibit the
following general geometry:
1. the average offset equals 15.115 ft (4.6 m),
2. the horizontal length of the flared sections equals 255.73 ft (78.0m), 232

N w w ~;~{~1i{~
METRIC CONVERSION:
If! " 0.305m
+ 1 30'
L12'Lo.J :J ~-w---0 AA.J.\a-\4'
!
t
t ADT
varies I
I -t-
1
~t};}/!.
1,000'
Figure VII-C-7. Roadside Slope Geometry

3. and the total rail length needed equals 256.53 ft (78.24 m).
These lengths represent the total length of need of the flared section
plus a breakaway cable terminal treatment.
In continuing, the roadside barrier cost-effectiveness analysis
now involves two independent geometries - one being that characteristic
of the flared rail sections, and the other being that characteristic of
the roadside barrier proper. Consequently, the total barrier cost will
be the sum of the costs determined in both calculations (see the following
procedure). During the cost determination, it should be kept in mind
that the steps given below follow the format previously. outlined.
Flared End Treatment
1. A = 15.115 ft or approximately 15 ft (4.6 m)
L = 255.73 ft or approximately 256ft (78.0 m)
W =1ft (.305m) (rail width)
2. ADT = 10,000 (assumed)
3. Ef = 5.5
4. cf = 0.13
5. Code 06~01-1-1; SI = 3.7
6. c1 = $13.00 (assumed) per foot at 256.53 ft (78.24 m) or approx
imately 257 ft (78.39 m)
c1 = $3,341
7. CD= $225
8. CM = $1.50 per foot per year (assumed) at 257ft (78.39 m); CM = $386
9. COVD = $7,192 at SI = 3.7
10. T = 15 years
11. KT = 8.559 } at an assumed interest rate of 8%
KJ = 0.3152
234
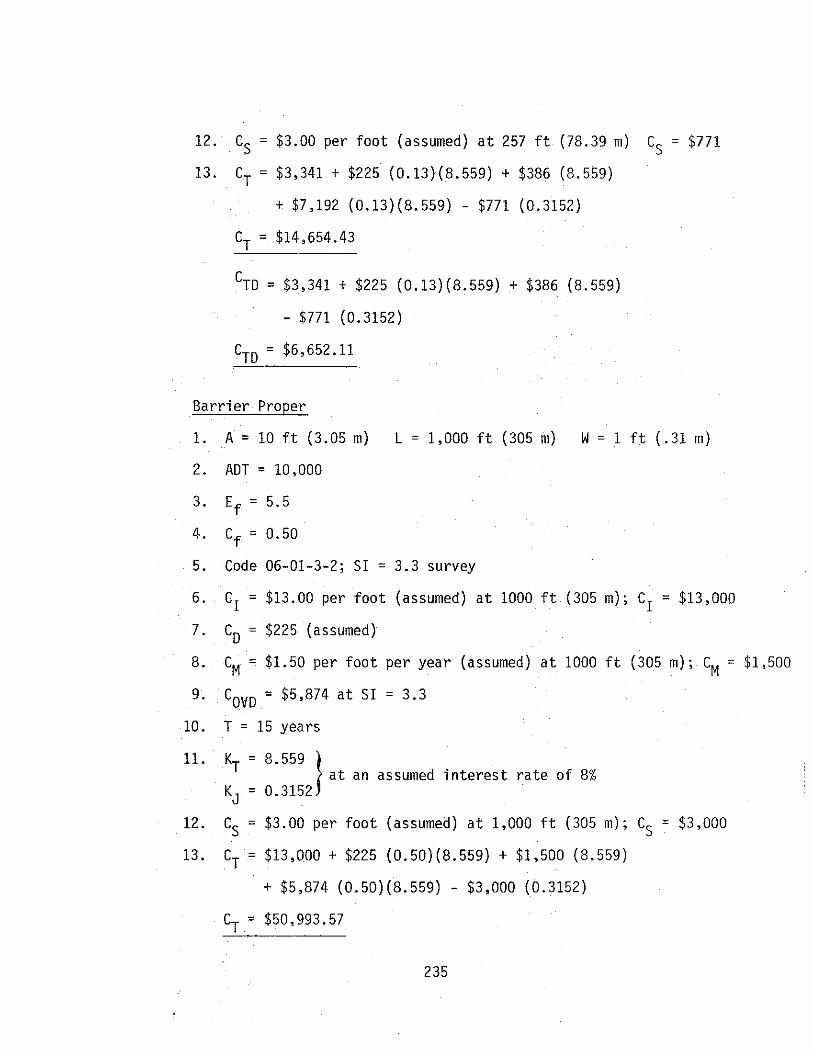
12. c5 = $3.00 per foot (assumed) at 257 ft (78.39 m) c5 = $771
13. CT = $3,341 + $225 (0.13)(8.559) + $38q (8.559)
+ $7,192 (0.13}(8.559) - $771 (0.3152)
CT = $14,654.43
CTD = $3,341 + $225 (0.13}(8.559) + $386 (8.559)
- $771 (0.3152)
CTD = $6,652.11
Barrier Proper
1. A= 10ft (3.05 m) L = 1,000 ft (305m) W =1ft (.31m)
2. ADT = 10,000
3. Ef = 5. 5
4. cf = o.5o
5. Code 06-01-3-2; SI = 3.3 survey
6. c1 = $13.00 per foot (assumed) at 1000 ft (305m); c1 = $13,000
7. c0 = $225 (assumed)
8. CM = $1.50 per foot per year (assumed) at 1000 ft (305 m); CM = $1,500
9. COVD = $5,874 at SI = 3.3
10. T = 15 years
11. KT = 8.559 } _ at an assumed interest rate of 8%
KJ - 0.3152
12. c5 = $3.00 per foot (assumed) at 1,000 ft (305m); c5 = $3,000
13. CT = $13,000 + $225 (0.50)(8.559) + $1,500 (8.559)
+ $5,874 (0.50)(8.559) - $3,000 (0.3152)
CT = $50,993.57
235
CTD = $13,000 + $225 (0.50}(8.559) + $1,500 (8.559)
- $3,000 (0.3152)
CTD = $25,855.79
Total CT = $50,993.57 + $14,654.43 = $65,648.00
Total CTD = $25,855.79 + $6,652.11 = $32,507.90
These two total costs represent values associated with an average daily
traffic equaling 10,000 vehicles per day. The above steps are repeated
for higher values of ADT until enough data points are determined to plot
CT versus ADT. Ultimately, the total barrier values as a function of
average daily traffic will be used in the alternative comparison.
Unprotected Slopes
Another alternative which should be considered involves no shielding
at all. This alternative requires no direct expenditures since it is
assumed that the problem involves existing roadways. Consequently, only
the total costs (to include occupant and vehicle damage} can significantly
indicate the benefits/disbenefits associated with no shielding of the
embankment.
For purposes of analysis, four slopes have been considered as
variables in addition to the average daily traffic control. These
slopes and their respective severities are as follows:
1. (3.5:1) slope - severity index equals 3.5,
2. ( 3: 1) slope - severity index equals 4.0,
3. (2.5:1) slope - severity index equals 4.5, and
4. ( 2: 1) slope - severity index equals 5.0
236
Although the slope severities are not specifically identified in the
hazard inventory information, a severity index is listed for a positive
slope. Assuming that this positive slope represents an average situation
and that a 4:1 slope is approximately average, then the severity index
of a 4:1 slope would be found to equal 3.0. Furthermore, since the
severity index of the roadside barrier is greater than that of the 4:1
slope, then in no way can the barrier be more cost-effective. By taking
the average slope as a base, the severities of the other gradients were
estimated, and occupant and vehicle damage costs were assigned. The
initial, damage, maintenance, and salvage costs were all taken to be zero
since it is assumed that the existing geometry requires no direct expen
ditures. By choosing the average daily traffic again to equal 10,000 ve
hicles per day and considering a 3.5:1 slope, the costs may be determined
by the following steps.
1. A = 10 ft (3.05 m) L = 1,000 ft (305 m) w = 30ft (9.15 m)
2. ADT = 10,000
3. Ef = 5.5
4. cf = 0.51
5. SI = 3.5
6. CI = $0
7. CD = $0
8. eM = $0
9. COVD = $6,533 at SI = 3.5
10. T = 15 years
237
11.
12.
13.
KT = 8. 559 .}
KJ = 0.3152
c = $0 s
at an assumed interest rate of 8%
CT = $0 + $0 (0.51)(8.559) + $0 (8.559) + $6,533 (0.51)
(8.559) - $0 (0.3152)
CT = $28,517.13
CTD = $ + $0 (0.51)(8.559) + $0 (8.559) - $0 (0.3152)
CTD = $0
Total costs for the four slopes and varying volumes are calculated in a
similar manner to provide the basis of comparison for the no protection
alternative.
Comparison
The various situations can best be compared by plotting curves of
total present cost versus average daily traffic. Such a set of curves
is shown in Figure VII-C-8. By interpreting the data the following con-
elusions may be drawn:
1. Unprotected slopes of 3:1 and flatter are more cost-effective
than the barrier for an average daily traffic up to and in
excess of 50,000 vehicles per day, i.e., the barrier is not
warranted;
2. the 2.5:1 slope, unprotected, becomes less cost-effective than
the barrier for an average daily traffic equal to or above 15,000
vehicles per day; and
3. the 2:1 slope, unprotected, becomes less cost-effective than the
barrier for an average daily traffic equal to or above 7,500
vehicles per day.
238
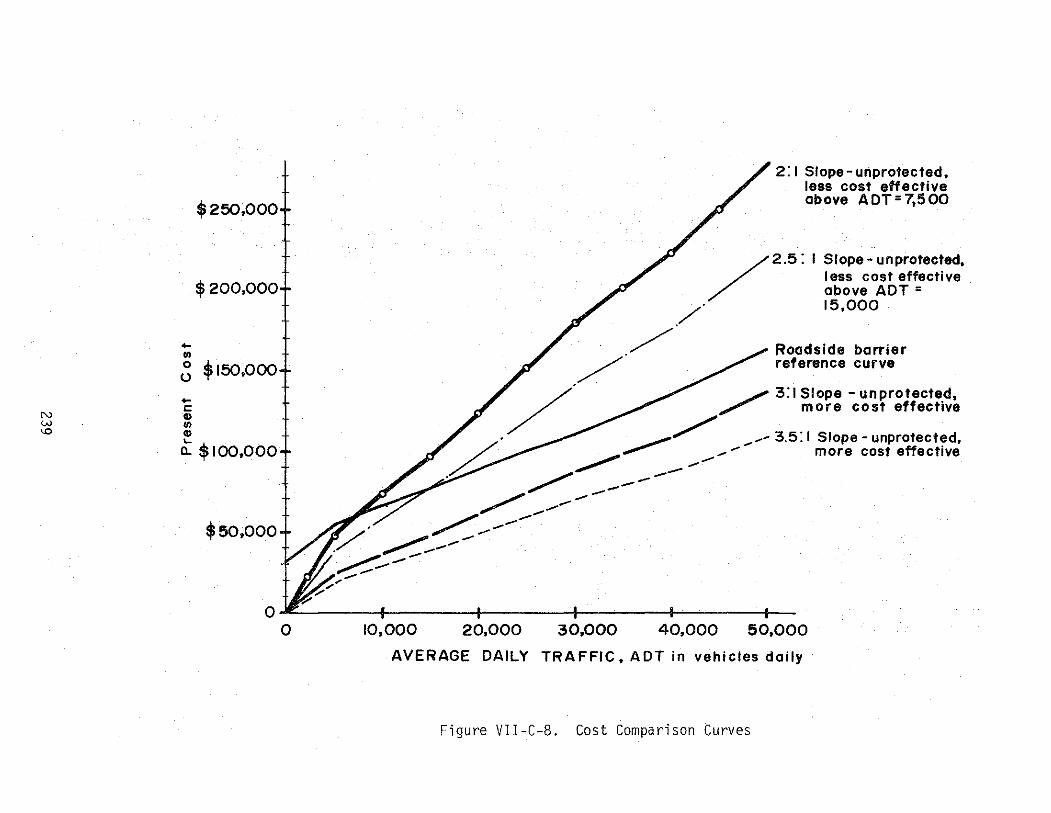
N w
"'
.... "'
$250,000
$200,000
~ $150,000
... t:: CD U> CD ...
Q.. $100,000
$50,000
0 ~
0
./ /
2: I Slope- unprotected, less cost effective above ADT=7,500
/2.5:1 S I ope - unprotected, I ess cost effective above ADT = 15,000
Roadside barrier reference curve
' ./ · / ../ 3:1 Slope- unprotecte.d, / . /" more cost effective
• /. ~/ _ _ / 3.5: I Slope- unprotected, ~ ~ _ ....... - more cost effective
. ~ -----~ ....... ---_.,..~ ....... ----~ ·' --....,.,. .- _.. _..
.. ~ ----__......._...__.--~/
. , """ ...
10,000 20,000 30,000 40,000 50,000
AVERAGE DAILY TRAFFIC, ADT in vehicles daily
Figure Vll-C-8. Cost Comparison Curves

This analysis serves to provide some insight as to where roadside barrier
protection of slopes may or may not be more cost-effective. General design
guidelines or policies may be established and more importantly justified
in terms of the highest returns in safety.
General Comments
1. The analysis, as presented in this problem, involves only those
costs associated with one side of the highway facility. If the
same conditions exist on the opposite side, then the total costs
for both sides would be double those previously determined.
2. The average daily traffic should represent the two-way volume
flow since the volume split is built into the analysis procedure.
This adjustment is effected by the collision frequency nomographs.
3. The useful life of a roadside slope is taken to be 15 years,
which is obviously not the real case. However, it is necessary
to consider an equal time span for each alternative in order to
make the comparison legitimate.
4. This example illustrates how the procedure can be used to deter
mine the cost-effectiveness of two basic options, i.e., barrier
shielding versus no shielding of slopes, for a given location.
Although not considered here, the next desirable step may be to
establish a priority or ranking system for reducing hazards within
a given roadway system. The objective would be to make improve
ments that offer the greatest return in terms of safety. The
following formula may be used for determining a ranking factor,
R:
240
where
R =
CT = total cost associated with the unshielded H hazard over the period T;
CT = total cost associated with the improvement over I the period T; and
CTD = total cost to the highway department or agency I associated with the improvement.
Improvements should be made to those hazards having the highest value
R first. Note that if the numerator is negative, the improvement would
not be cost-effective. In example 1, the ranking factor for placing a
roadside barrier to shield the 2:1 slope for an ADT of 10,000 would be
computed as follows:
thus
or
CT = $72,000 (Slope) (From Figure VII-C-8) H
CT = $65,648 (Barrier) (From Figure VII-C-8) I
CTD = $32,507 (From previous calculations) I
R = 72,000 - 65,648 32,507
R = 0.2
VII-C-2. Example 2 - Bridge Piers
Figure VII-C-9 shows a typical bridge pier hazard. Three alterna-
tives will be considered in the cost analysis as follows:
241

A v
v
I +
I %Mi}(\\,p 0
I !;~;~;~;:
+
I
:
3 I --1 \--.l • 32'
.J L23.5' ·
50'
/1
+ I
Figure VII-C-9. Bridge Pier Hazard
242
v
ADT= 75,000 (total)
24'
A v
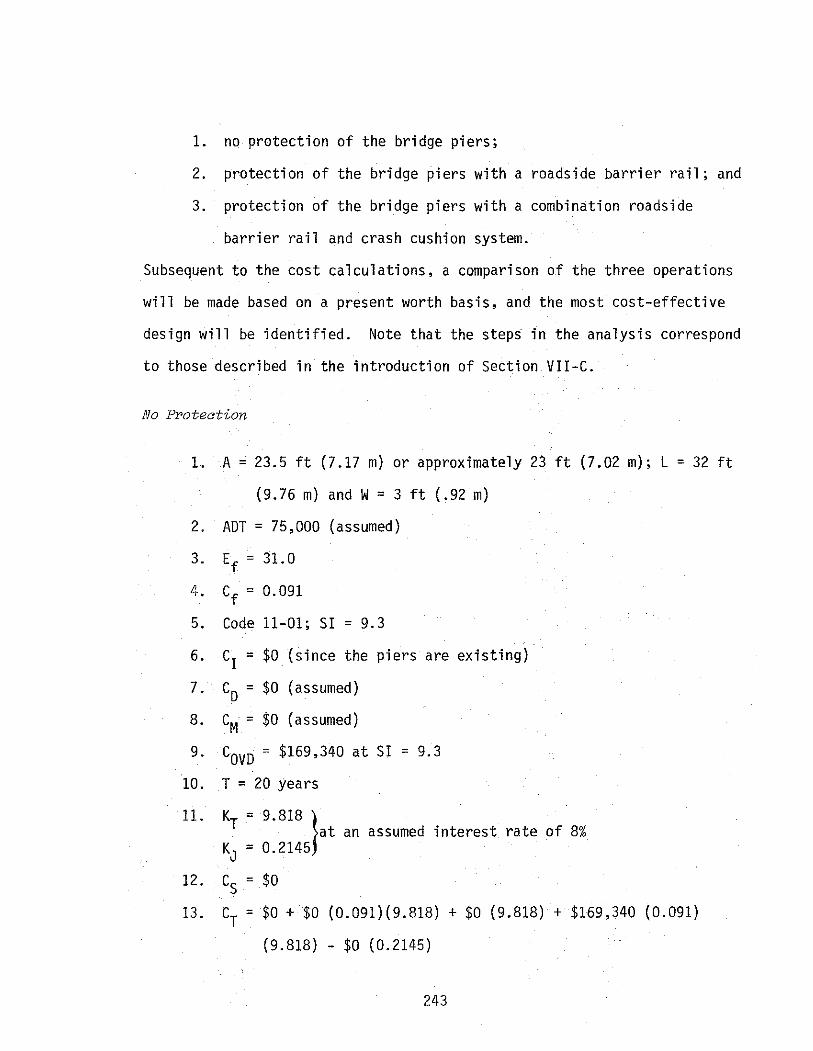
1. no protection of the bridge piers;
2. protection of the bridge piers with a roadside barrier rail; and
3. protection of the bridge piers with a combination roadside
barrier rail and crash cushion system.
Subsequent to the cost calculations, a comparison of the three operations
will be made based on a present worth basis, and the most cost-effective
design will be identified. Note that the steps in the analysis correspond
to those described in the introduction of Section VII-C.
No Protection
1. A= 23.5 ft (7.17 m) or approximately 23ft (7.02 m}; L =32ft
(9.76 m) and W = 3 ft (.92 m)
2.
3.
5.
6.
7.
8.
9.
ADT = 75,000 (assumed)
Ef = 31.0
cf = o.091
Code 11-01; SI = 9.3
CI = $0 (since the piers are existing)
C = $0 (assumed) D
CM = $0 (assumed)
COVD = $169,340 at SI = 9.3
10. T = 20 years
11. KT = 9.818 } at an
KJ = 0.2145 assumed interest rate of 8%
12. c = $0 s 13. CT = $0 + $0 (0.091)(9.818) + $0 (9.818) + $169,340 (0.091)
(9.818) - $0 (0.2145)
243
CT = $151, 295
CTD = $0 + $0 (0.091)(9.818) + $0 (9.818) - $0 (0.2145)
CTD = $0
or considering collisions with both ends of the bridge pier hazard,
CT = $302,590 and CTD = $0
These figures represent the present costs associated with no pro
tection to the roadway hazard. The total cost, as would be expected,
is quite substantial due to the severity associated with impacting a
fixed bridge pier, while the total direct cost is zero since no improve
ments are involved. Although the existing geometry may not offer the
best alternative, it must be calculated for use as a basis in comparison.
Roadside Barrier
Before the cost analysis can be implemented for this option, speci
fic attention needs to be directed toward identifying the barrier flare
geometry. From the barrier flare criteria outlined in Section III-C,
the placement values to be used in the cost procedure were determined to
be the following:
1. the average offset for the flared sections equal 16.52 ft
(5.04 m),
2. the horizontal length of the barrier flare equals 150.94 ft
(46.04 m), and
3. the total length of need for the barrier flare equals 152.20 ft
(46.42 m).
In determining the total costs associated with roadside barrier protection,
two separate calculations will be made-- one considering collisions with
the barrier flare and the other involving impacts to the barrier proper.
244
The sum of these two costs will represent the total value associated
with the roadside barrier alternative. Note that costs for one direc-
tion of travel are computed, then doubled, to obtain costs for both
directions of travel. It is assumed that a crashworthy end-treatment
is used at the upstream terminal.
Barrier Flare
1. A= 16.52 ft (5.04 m) or approximately 16ft (4.88 m),
L = 150.94 ft (46.04 m) or approximately 151 ft (46.01 m), and
W = 1 ft (.31m)
2. ADT = 75,000
3. Ef = 31.0
4. cf = o.41
5. Code 06-01-1-3 SI = 3.6
6. c1 ~ $13.00 per foot (assumed) at 152.20 ft (52.37 m) or
approximately 153ft (46.67 m), thus
c1 = $1,989
7. c0 = $225 (assumed)
8. CM = $1.50 per foot per year (assumed) at 153 ft (46.67 m);
eM = $230
9. COVD = $6,862 at SI = 3.6
10. T = 20 years
11. KT = 9.818
KJ = 0.2145
at an assumed interest rate of 8%
12. c5 = $1.50 per foot (assumed) at 153 ft (46.67 m) c5 = $230
13. CT = $1,989 + $225 (0.41)(9.818) + $230 (9.818)
+ $6,862 (0.41)(9.818) - $230 (0.2145)
245
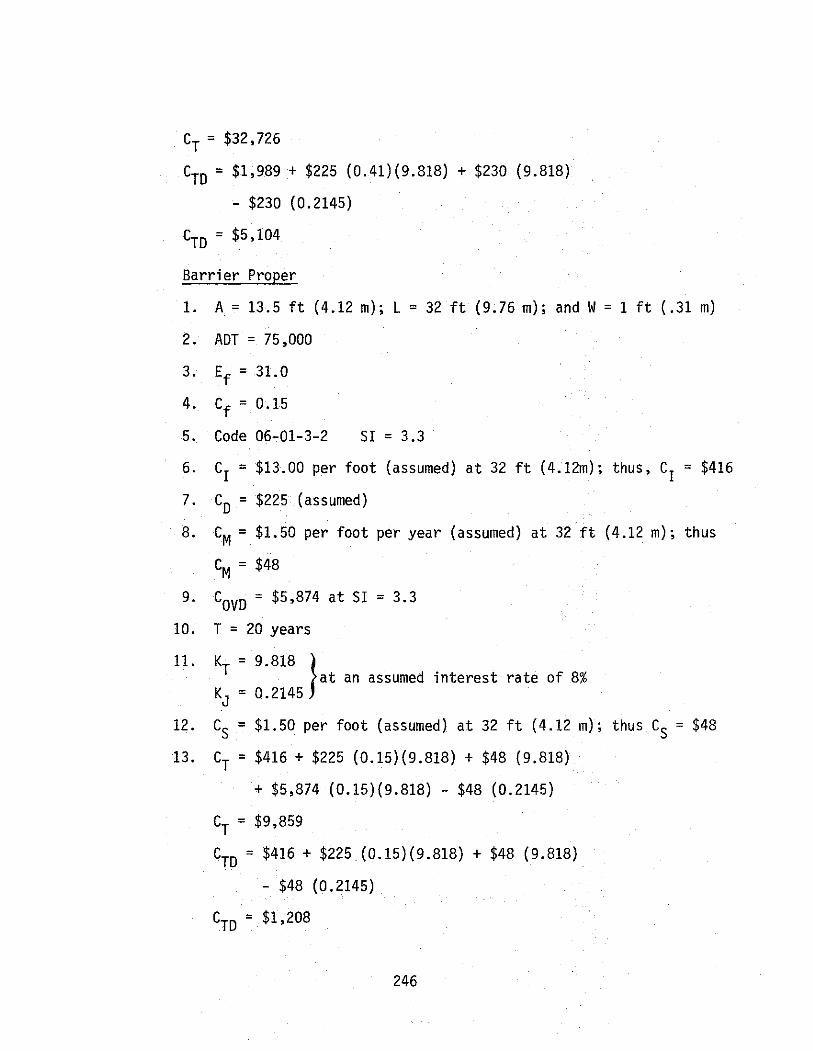
cr = $32,726
cro = $1,989 + $225 (0.41)(9.818) + $230 (9.818)
- $230 (0.2145)
CTD = $5,104
Barrier Proper
1. A= 13,5 ft (4.12 m); L =32ft (9.76 m); and W = 1ft (.31m)
2. ADT = 75,000
3. Ef = 31.0
4. cf = 0.15
5. Code 06~01-3-2 SI = 3.3
6. c1 = $13.00 per foot (assumed) at 32ft (4.12m); thus, c1 = $416
7. c0 = $225 (assumed)
8. CM = $1.50 per foot per year (assumed) at 32 ft (4.12 m); thus
eM = $48
9. COVD = $5,874 at SI = 3.3
10. T = 20 years
11. KT = 9.818 } _ at an assumed interest rate of 8%
KJ - 0.2145
12. c5 = $1.50 per foot (assumed) at 32ft (4.12 m); thus c5 = $48
13. CT = $416 + $225 (0.15)(9.818) + $48 (9.818)
+ $5,874 (0.15)(9.818) - $48 (0.2145)
CT = $9,859
CTD = $416 + $225.(0.15)(9.818) + $48 (9.818)
- $48 (0.2145)
CTD = $1,208
246
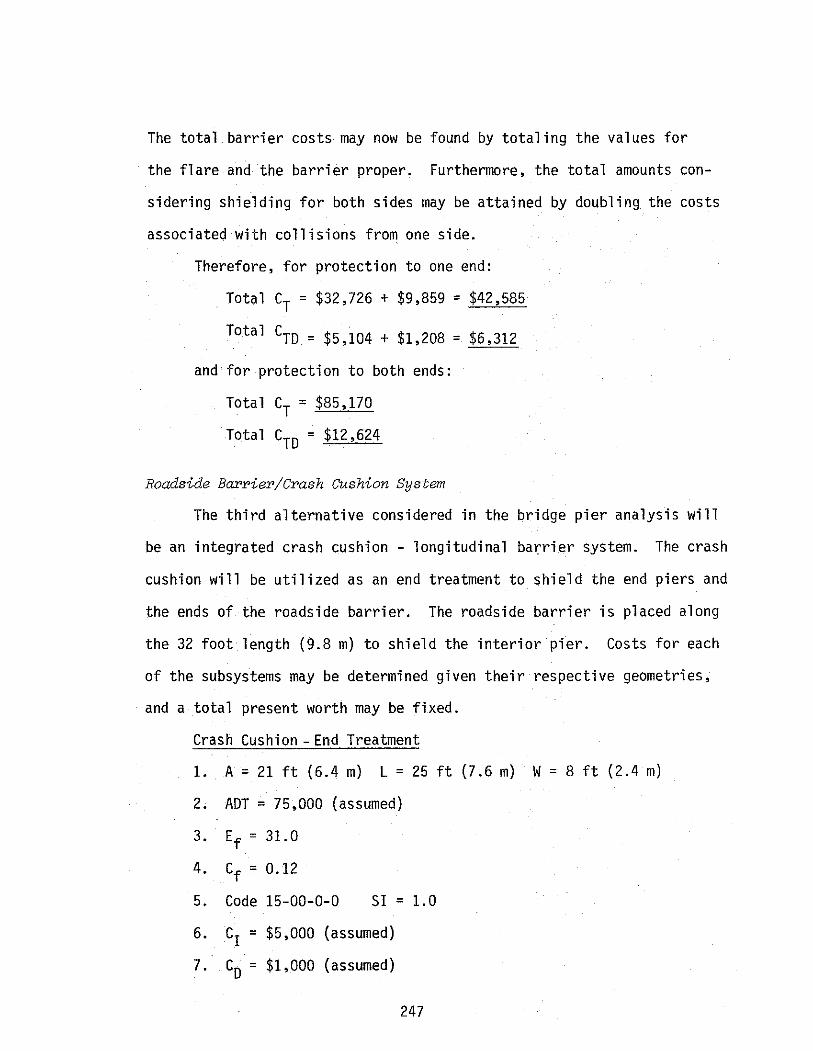
The total barrier costs may now be found by totaling the values for
the flare and the barrier proper. Furthermore, the total amounts con
sidering shielding for both sides may be attained by doubling the costs
associated with collisions from one side.
Therefore, for protection to one end:
Total CT = $32,726 + $9,859 = $42,585
Total CTD = $5,104 + $1,208 = $6,312
and for protection to both ends:
Total CT = $85,170
Total CTD = $12,624
Roadside Barrier/Crash Cushion System
The third alternative considered in the bridge pier analysis will
be an integrated crash cushion - longitudinal barrier system. The crash
cushion will be utilized as an end treatment to shield the end piers and
the ends of the roadside barrier. The roadside barrier is placed along
the 32 foot length (9.8 m) to shield the interior pier. Costs for each
of the subsystems may be determined given their respective geometries,
and a total present worth may be fixed.
Crash Cushion -End Treatment
1. A= 21ft (6.4 m) L =25ft (7.6 m) W =8ft (2.4 m)
2. ADT = 75,000 (assumed)
3. Ef = 31.0
4. cf = 0.12
5. Code 15-00-0-0 SI = 1.0
6. c1 = $5,000 (assumed)
7. c0 = $1,000 (assumed)
247
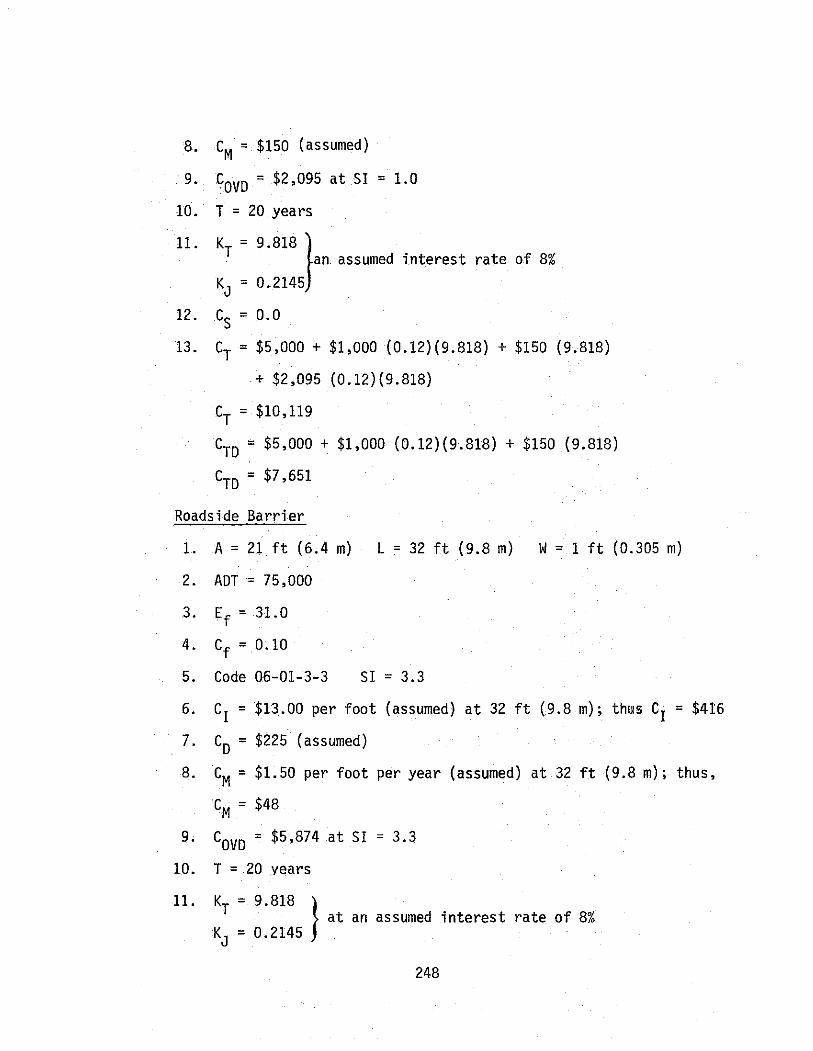
8. CM = $150 (assumed)
9. COVD = $2,095 at SI = 1.0
10. T = 20 years
11. KT = 9.818} _ an assumed interest rate of 8%
KJ - 0.2145
12. c5 = o.o 13. CT = $5,000 + $1,000 (0.12)(9.818) + $150 (9.818)
+ $2,095 (0.12)(9.818)
CT = $10,119
CTD = $5,000 + $1,000 (0.12)(9.818) + $150 (9.818)
CTD = $7,651
Roadside Barrier
1. A= 21 ft (6.4 m) L = 32 ft (9.8 m) W = 1 ft (0.305 m)
2. ADT = 75,000
3. Ef = 31.0
4. Cf=0.10
5. Code 06-01-3-3 SI = 3.3
6. c1 = $13.00 per foot (assumed) at 32ft (9.8 m); thlliS c1 = $416
7. c0 = $225 (assumed)
8. CM = $1.50 per foot per year (assumed) at 32ft (9.8 m); thus,
eM = $48
9. COVD = $5,874 at SI = 3.3
10. T = 20 years
11. KT = 9.818 } _ at an assumed
KJ - 0.2145 interest rate of 8%
248
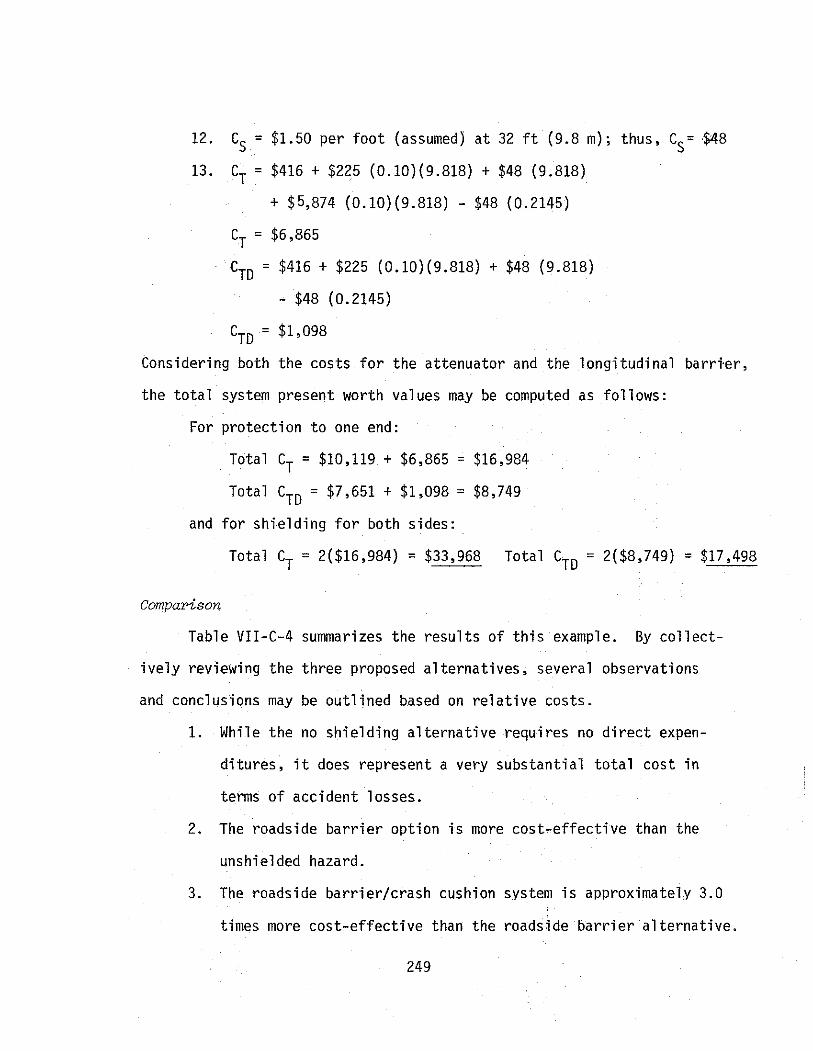
12. c5 = $1.50 per foot (assumed) at 32 ft (9.8 m); thus, c5= $48
13. CT = $416 + $225 (0.10)(9.818) + $48 (9.818)
+ $5,874 (0.10)(9.818) - $48 (0.2145)
CT = $6,865
CTD = $416 + $225 (0.10)(9.818) + $48 (9.818)
- $48 (0.2145)
CTD = $1,098
Considering both the costs for the attenuator and the longitudinal barri·er,
the total system present worth values may be computed as follows:
For protection to one end:
Total CT = $10,119 + $6,865 = $16,984
Total CTD = $7,651 + $1,098 = $8,749
and for shi.elding for both sides:
Total CT = 2($16,984) = $33,968 Total CTD = 2($8,749) = $17,498
Comparison
Table VII-C-4 summarizes the results of this example. By collect-
ively reviewing the three proposed alternatives, several observations
and conclusions may be outlined based on relative costs.
1. While the no shielding alternative requires no direct expen
ditures, it does represent a very substantial total cost in
terms of accident losses.
2. The roadside barrier option is more cost-effective than the
unshielded hazard.
3. The roadside barrier/crash cushion system is approximately 3.0
times more cost-effective than the roadside barrier alternative.
249
"' "' 0
Table VII-C-4. Example and Comparison
Direct Total
OPTION Cost, CTD
{$) Cost, CT
($)
1. · No Shielding 0 151,295
2. Shielding by Roadside Barrier 12,624 85,170
3. Shielding by Crash Cushion/ Roadside Barrier 17,498 33,968
----
1See item 4 in summary of Section VII-C-1 for definition.
Ranking Factor, R1
.· --
5.2
6.7
However, it does require a somewhat higher direct expenditure.
4. The ranking factor indicates that of the two improvements,
the crash cushion/roadside barrier combination would provide
the greatest return per dollar spent.
These findings, based on relative costs, provide the means for
justifying a decision regarding whether or not shielding is necessary
and which alternative is most desirable. Obviously, the roadside barrier/
crash cushion system offers the best choice for the given conditions;
however, it should not be construed that this analysis in itself justi
fies a certain improvement because of the fact that other locations may
be even more critical. Whatever the case, the most cost-effective design
with regards to this problem is the roadside barrier/crash cushion system.
General Comments
1. Practically speaking, the main interest in comparing alterna
tives two and three is to objectively decide whether the shorter,
more expensive and less severe crash cushion would/would not
enjoy an advantage over the longer, lower cost and higher
severity barrier rail.
2. The main purpose of this example is to demonstrate the use
of the cost-effectiveness approach in weighing several alterna
tive solutions for one problem location. Other roadside hazard
locations may be evaluated in a similar manner to organize a
complete facility inventory and a set of ranking factors.
251

VII-C-3. Example 3 - Elevated Gore Abutment
In this example, an elevated gore abutment has been chosen for
analysis, and both costs for the hazard and an improvement will be
determined. By referencing the layout shown in Figure VII-C-10. those
inputs necessary for the calculations may be obtained. and the procedure
may be initiated. Also. higher than normal encroachments that are com-
man to such a location will be considered in the analysis, and adjust-
ments will be made accordingly. Furthermore, the evaluation will con-
si der only calli sions with the exposed gore and the crash cushion,
whichever the case may be. Also the equation for Cf will be applied
in lieu of the nomographs to demonstrate its use.
Existing Hazard
1. A= 19ft (5.8 m); L =1ft (.305m); and W =4ft (1.2 m)
2. ADT = 80,000
3. Ef = 33.5
4. Cf by using equation may be determined as below:
5.
6.
cf = 1~:sio [1 (0.730) + 31.4 (0.617) +
5.14 (0.455 + 0.405 + 0.360 + 0.325)]
Cf = .0809 and by applying an adjustment factor of 3.0
for higher than normal encroachments (assumed),
cf (adjusted) = 3 (0.089) = 0.267
Code 12-06-0-0 SI = 9.3
c = $0 I
252
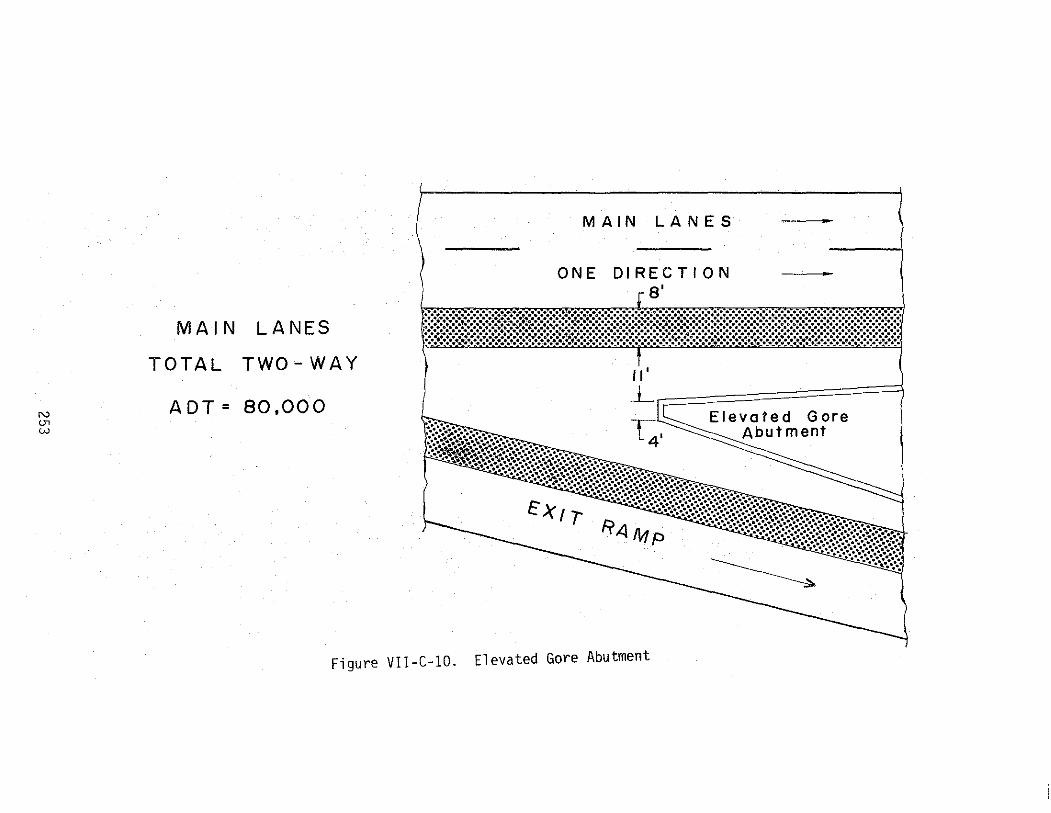
N
"' w
MAIN LANES
TOTAL TWO-WAY
ADT= 80,000
MAIN LANES
ONE DIRECTION 8'
Elevated Gore Abutment
~~=~~1f~ ······ .. ····=·=·:=:=:.::::::~.::~.:-·.::::.::::::~.:.::~::::::;:::::::.:::::::~:::·::,.~.:"f:'.:.'::~:~::;•"'
c:- X ... ........ ·.·.·:·:······=·=········.·:········=.·:······.·:·:··· c I I R 4 l'v! p .... ·········:··.::::-:.· .. :.·.···. . .
Figure VII-C-10. Elevated Gore Abutment

7. CD= $0 (assumed}
8. CM = $0 (assumed)
9. COVD = $169,412 at SI = 9.3
10. T = 15 years
11. KT = 8.061 }
KJ = 0.2745 at an assumed interest rate of 8%
12. cs = $0
13. CT = $0 + $0 (0.267)(8.061) + $0 {8.061) + $169,412
(0.267}(8.061) - $0 (0.2745)
CT = $364,623
CTD = $Q
Crash Cushion Improvement
1. A= 17ft (5.2 m}; L =25ft (7.6 m}; and W =8ft (2.4 m)
2. ADT = 80,000
3. Ef = 33.5
4. Cf by using the equation may be determined as below:
cf = 1 ~~5~o [ 25 (0.790) + 31.4 (0.695) + 5.14 (0.55o + o.5o5
. + 0.455 + 0.405 + 0.360 + 0.320 + 0.290 + 0.260) J Cf = 0.183 and by applying an adjustment factor of 3.0 for
higher than normal encroachments (assumed}
cf (adjusted) = 3 (0.183} = 0.549
5. Code 15-00-0-0 SI = 1.0
6. c1 = $5,000 (assumed)
7. CD= $1,000 (assumed)
8. CM = $200 (assumed)
9. COVD = $2,095 at SI = 1.0
254
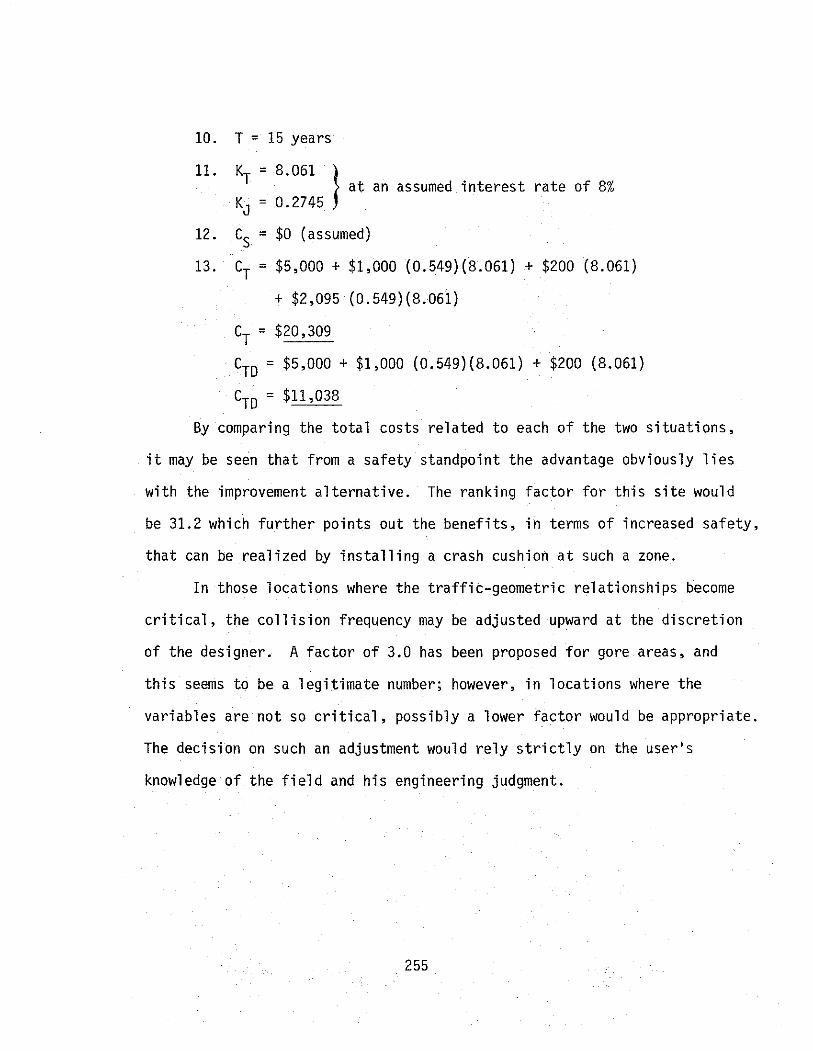
10. T = 15 years
11. KT = 8.061 } at an assumed interest rate of 8%
KJ = 0.2745
12. c5 = $0 (assumed)
13. CT = $5,000 + $1,000 (0.549)(8.061) + $200 (8.061)
+ $2,095 (0.549)(8.061)
CT = $20,309
CTD = $5,000 + $1,000 (0.549)(8.061) + $200 (8.061)
CTD = $11,038
By comparing the total costs related to each of the two situations,
it may be seen that from a safety standpoint the advantage obviously lies
with the improvement alternative. The ranking factor for this site would
be 31.2 which further points out the benefits, in terms of increased safety,
that can be realized by installing a crash cushion at such a zone.
In those locations where the traffic-geometric relationships become
critical, the collision frequency may be adjusted upward at the discretion
of the designer. A factor of 3.0 has been proposed for gore areas, and
this seems to be a legitimate number; however, in locations where the
variables are not so critical, possibly a lower factor would be appropriate.
The decision on such an adjustment would rely strictly on the user's
knowledge of the field and his engineering judgment.
255

REFERENCES
1. Michie, J. D., and Bronstad, M. E., ''Location, Selection, and Maintenance of Highway Traffic Barriers," National Cooperative Highway Research Program Report 118, Highway Research Board, 1971.
2. Michie, J. D., and Calcote, L. R., ''Location, Selection and Maintenance of Highway Guardrails and Median Barriers," National Cooperative Research Program Report 54, Highway Research Board, 1968.
3. Michaels, R. M., and Cozan, L. W., "Perceptual and Field Factors Causing Lateral Displacement," Public Roads, Vol. 32, No. 11, December, 1963.
4. Bronstad, M. E., and Michie, J. D., "Recommended Procedures for Vehicle Crash Testing of Highway Appurtenances," National Cooperative Highway Research Program Report 153, Transportation Research Board, 1974.
5. "Highway Guardrail: Determination of Need and Geometric Requirements, with Particular Reference to Beam-Typ.e Guardrail," Highway Research Board Special Report 81, 1964.
6. DeLeys, N. J. and McHenry, R. R., "Highway Guardrails - A Review of Current Practice," NCHRP Report No. 36, 1967.
7. Skeels, P. C., "The Role of the Highway in a Safe Transportation System," presented at the 65th Annual Convention, American Road Builders Association, 1968.
8. Ross, H. E., Post, E. R., Nixon, J. F., Hustace, D., and Kristaponis, E. V., "Warrants for Guardrai 1 on Embankments," Highway Research Record 460, Highway Research Board, 1973, pp. 85-96.
9. Glennon, .J. D., and Tamburri, T. N. , "Objective Criteria for Guardrail Installation," Highway Research Record 174, Highway Research Board, 1967, pp. 184-206.
10. Ross, H. E., and Post, E. R., "Comparisons of Full-Scale Embankment Tests with Computer Simulations," Research Report 140-7, Texas Transportation Institute, Texas A&M University, 1972.
11. DeLeys, N. J., "Safety Aspects of Roadside Cross Section Design," Report No. FHWA-RD-75-41, Calspan Corporation, February 1, 1975.
256
12. Hirsch, T. J., Marquis, E. L., and Kappel, R. A., "Earth Berm Vehicle Deflector," Report No. 20-7-3-1, National Cooperative Highway Research Program Project 20-7, Task 3, 1971.
13. "Crash Cushions - Selection and Design Criteria," pub 1 i shed by Office of Engineering, Federa 1 Highway Administration, Washington, D.C., 1975.
14. Nordlin, E. F., and Field, R. N., "Dynamic Tests of the Stee 1 Box Beam and Concrete Median Barriers," Highway Research Record 222, Highway Research Board, 1968, pp. 53-88.
15. "Standard Specifications for Structural Supports for Highway Signs, Luminaires and Traffic Signals," Ameri.can Association of State Highway and Transportation Officials, 1975.
16. Hutchinson, J. W. , and Kennedy, T. W. , "Medians of Divided Highways - Frequency and Nature of Vehicle Encroachments," Bulletin 487, University of Illinois Engineering Experiment Station, 1966.
17. Graham, M. D., Burnett, W. C., Gibson, J. L., and Freer, R. H., "New Highway Barriers: The Practical Application of Theoretical Design," Highway Research Record 174, Highway Research Board, 1967, pp. 88-183.
18. Michie, J. D., Calcote, L. R., and Bronstad, M. E., "Guardrail Performance and Design," National Cooperative Highway Research Program Report 115, Highway Research Board, 1971 .
19. Stoughton, R. L., Stocker, J. R., and Nordlin, E. F., "Dynamic Tests of Metal Beam Guardrail," Paper presented at the 54th Annual Transportation Research Board Meeting, Washington, D.C., 1975.
20. Bronstad, M. E., and Kimball, C. E., "Crash Test Evaluation of Guardrail Systems Utilizing the New Charley Post," Final Report on Project 03-3658, Southwest Research Institute, 1974.
21. Bronstad, M. E., Michie, J. D., Viner, J. G., and Behm, W. E., "Crash Test Evaluation of the Thrie Beam Traffic Barrier," Paper prepared for the 53rd Annual Highway Research Board Meeting, Washington, D.C., 1974.
257
22. "A Guide to Standardize Highway Barrier Rail Hardware," American Association of State Highway Officials and American Road Builder's Association, 1971.
23. "A Supplement to A Guide to Standardize Highway Barrier Rail Hardware," American Association of State Highway Officials and American Road Builder's Association, 1973.
24. Nordlin, E. F., Hackett, R. P., and Folsom, J. J., "Dynamic Tests of California Type 9 Bridge Barrier Rail and Type 8 Bridge Approach Guardrail," Highway Research Record 302, Highway Research Board, 1970, pp. l-20.
25. Michie, J. D., and Bronstad, M. E., "Development of Approach Rail-Bridge Rail Transition Using Aluminum Balanced System," Transportation Research Record 488, Transportation Research Board, 1974, pp. 49-52.
26. Bronstad, M. E., and Michie, J. D., "Development and Crash Test Evaluation of Traffic Barrier Terminals," Final Report on Project 03-3799, Southwest Research Institute, 1975.
27. Bronstad, M. E., and Michie, J. E., "Development and Crash Test Evaluation of Traffic Barrier Terminals, "Final Report on Project 03-3291, Southwest Research Institute, 1973.
28. Graf, V. D., and Wingerd, N. C., "Median Barrier Warrants," Traffic Department of the state of California, 1968.
29. Ross, H. E., "Warrants for Median Barriers in Texas," Research Report 140-8, Texas Transportation Institute, Texas A&M University, 1974.
30. Task Force for Traffic Barrier Systems, American Association of State Highway and Transportation Officials, Operating Subcommittee on Design, Washington, D.C., 1974.
31. Hirsch, T. J., Post, E. R., and Hayes, G. G., ''Vehicle Crash Test and Evaluation of Median Barriers for Texas Highways," Research Report 146-4, Texas Transportation Institute, Texas A&M University, 1972.
32. Ross, H. E. , and Nixon, J. F. , "Impact Performance and An Evaluation Criteria for Median Barriers," paper presented at the 54th Annual Transportation Research Baord Meeting, Washington, D.C., 1975.
33. Nordlin, E. F., Juergens, W. R., Tye, E. J., Stoker, J. R., Stroughton, R. L. , and Parks, D. M. , "Dynamic Test of a Slipformed Concrete Barrier Type 50 Placed Over Lowered Existing Cable Barrier," Final Report CA-DOT-TL-6696-1-74-36, California Department of Transportation, 1974.
258
34. "Guardrail Energy Absorbing Terminal (G.R.E.A.T.)," a publication from the Energy Absorption Corporation, 1974.
35. Olson, R. M., Post; E. R., and McFarland, W. R., "Tentative Service Requirements for Bridge Rail Sys terns," National Cooperative Highway Research Program Report 86, Highway Research Board, 1970.
36. Olson, R. M., Ivey, D. L., Post, E. R., Gunderson, R. H., and Cetiner, A., "Bridge Rail Design: Factors, Trends, and Guidelines," National Cooperative Highway Research Program Report 149, Transportation Research Board, 1974.
37. Deleys, N. J., and Segal, D. J., "Vehicle Redirection Effectiveness of Median Berms and Curb," Final Report on Contract No. DOT-FH-11-7913, Calspan Corporation, 1973.
38. Nordlin, E. F., Stoker, J. R., Hackett, R. P., and Doty, R. N., "Dynamic Tests of the California Type 15 Bridge Barrier Rail," Highway Research Record 386, Highway Research Board, 1972, pp. 88-100.
39. Michie, J. D., and Bronstad, M. E., "Guardrail Crash Test Evaluation - New Concepts and End Designs," National Cooperative Highway Research Program Report 129, Highway Research Board, 1972.
40. U.S. Department of Transportation, Federal Highway Administration Instructional ~1emorandum 40-1-72, Subject: Use of Crash Cushions on Federal-aid Highways, November, 1972.
41. Tutt, P. R., and Nixon, J. F., "Roadside Design Guidelines," Special Report 107, Highway Research Board, pp. 119-132, 1970.
42. "Test and Evaluation of Vehicle Arresting, Energy Absorbing, and Impact Attenuation Systems," Final Report on DOT-FHWA Contract No. CPR-11-5851, Texas Transportation Institute, Texas A&M University, 1971.
43. Nordlin, E. F., Woodstrom, J. H., and Doty, R.N., "Dynamic Tests of an Energy-Absorbing Barrier Employing Water-Filled Cells," Highway Research Record 343, Highway Research Board, 1971, pp. 100-122.
44. Nordlin, E. F., Stoker, J. R., and Doty, R. N., "Dynamic Tests of an Energy-Absorbing Barrier Employing Sand-Filled Plastic Barrels," Highway Research Record 386, Highway Research Board, 1972, pp. 28-51.
259

45. Young, B. 0., "Crash Test of the Energite Module Inertial Barrier," Energy Absorption Corporation, October 18, 1974.
46. Walker, G. W., Young, B. 0., and Warner, C. Y., "Crash Tests of an Articulated Energy-Absorbing Gore Barrier Employing Lightweight Concrete Cartridges," Highway Research Record 386, Highway Research Board, 1972, pp. 19-27.
47. Walker, G. W., Warner, C. Y., and Young, B. 0., "Angle and Small-Car Impact Tests of an Articulated Gore Barrier EmPloying Lightweight Concrete Energy-Absorbing Cartridges," Transportation Research Record 488, Transportation Research Board, 1974, pp. l-10.
48. Warner, C. Y., and Walker, G. W., "Crash Test Performance of a Prototype Lightweight Concrete Energy-Absorbing Guardrail System," Highway Research Record 343, Highway Research Board, 1971, pp. 13-18.
49. Post, E. R., and Buth, C. E., "Head-On Test of Cable Guardrail," Report No. RF3012, Texas Transportation Institute, Texas A&M University, 1973.
50. Bronstad, M. E., and Burket, R. B., "Evaluation of Timber Weak-Post Guardrail Systems," Highway Research Record 343, Highway Research Board, 1971, pp. 34-56.
51. Hirsch, T. J., and Marquis, E. L., "Crash Test and Evaluation of a Precast Concrete Median Barrier," Research Report 223-l, Texas Transportation Institute, Texas A&M University, 1975.
52. Nordlin, E. F., Juergens, W. R. Stoker, J. R., Stoughton, R. L., and Doty, R. N., "Dynamic Test of Prestress Concrete Median Barrier Type 50 Series XXVI," Research Report CA-HY-MR-6588-l-73-06, California Division of Highways, 1973.
53. Bronstad, M. E., and Kimball, C. E., "Crash Test Evaluation of Precast Interlocked Median Barrier," Report on Project 03-3777-002, Southwest Research Institute, 1974.
54. White, M. C., and Hirsch, T. J., "f~olded Fiberglass Median Barrier," Report No. 3 on Contract No. DOT -FH-ll-7840, Task Order l, Texas Transportation Institute, Texas A&M University, 1973.
55. Marquis, E. L., and Hirsch, T. J., ''Test and Evaluation of Earth Berm Median Barrier," Report on Contract No. DOT~FH-ll-7840, Task No. 2, Texas Transportation Institute, Texas A&M University, 1973.
260
56. Data sent to Hayes E. Ross, Texas Transportation Institute, Texas A&M University, from Mort Oscard, Federal Highway Administration, September 1975.
57. Bronstad, M. E., "Concrete Median Barrier Research," Quarterly Report No. 8, Attachment A, on Contract No. DOT-FH-8130, Southwest Research Institute, 1975.
58. Nordlin, E. F., Woodstrom, J. H., Hackett, R. P., and Folsom, J. J., "Dynamic Tests of the California Type 20 Bridge Barrier Rail," Highway Research Record 343, Highway Research Board, 1971, pp. 57-74.
59. Kimball, C. E., Bronstad, M. E., Michie, J.D., Wentworth, J. A., and Viner, J. G., "Development of a Collapsing Ring Bridge Railing System," Final Report on FHWA Contract DOT-FH-11-7985, Southwest Research Institute, 1975.
60. DeLeys, N. J., "Investigation of a Torsion Post-Beam Rail Type of Bridge Railing," Report No. CAL-VJ-2363-V-1, Cornell Aeronautical Laboratory, 1972.
61. Hirsch, T. J., and Buth, C. E., ''Testing and Evaluation of Bridge Rail Concept," Project Report No. RF3053-1, Texas Transportation Institute, Texas A&M University, 1975.
62. Kimball, C. E., Wiles, E. 0., and Michie, J. D., ''Test Evaluation of Tubular Thrie Beam for Upgrading Concrete Bridge Railing," paper prepared for the 55th Annua 1 Transportation Research Board ~1eeti ng in Washington, D. C., 1975.
63. Marquis, E. L., Hirsch, T. J., and Buth, C. E., "Development of Impact Attenuators Utilizing Waste Materials: Phase III-Tire-Sand Inertia Barrier and Tire-Beverage Can Crash Cushion," Report No. 846-3, Texas Transportation Institute, Texas A&M University, 1973.
64. White, M. C., and Hirsch, T. J., "Corrugated Steel Pipe Crash Cushion: Crash Test and Evaluation," Report No. 1 on Contract No. DOT-FH-11-7840, Task Order No. 1, Texas Transportation Institute, Texas A&M University, 1964.
65. Marquis, E. L., Hayes, G. G., and Hirsch, T. J., "Vehicle-Arresting System Using Chain-Link Fence," Transportation Research Record 488, Transportation Research Board, 1974.
261

66. Marquis, E. L., and Hirsch, T. J., ''Development of Impact Attenuators Utilizing Waste Materials: Phase !-Used-Tire Crash Cushion," Report No. 846-1, Texas Transportation Institute, Texas A&M University, 1973.
67. California Department of Transportation, Memo to File, File No. PWO 636392, Subject: Energy Absorbing Devices, Minnesota Bullnose Attenuator, February 20, 1974.
68. California Department of Transportation, Memo to File, i'ile No. PWO 636392, Subject: . Energy Absorbing Devices, Minnesota Bullnose Attenuator, June 19, 1974.
69. Laker, I. B., "Vehicle Deceleration in Beds of Loose Gravel," Report No. 19, Ministry of Transport, Harmondsworth Road Research Laboratory, England, 1966.
70. Walker, G. W., and Warner, C. Y., "Crash Test Evaluation of Strong Post, Energy-Absorbing Guardrail Using a Lapped WBeam for Transitions and Median Barriers," Highway Research Record 386, Highway Research Board, 1972, pp. 78-87.
71. Marquis, E. L., and Hirsch, T. J., "Crash Test and Evaluation of a Stiffened Metal Beam Guard Fence Median Barrier for Use Around Luminai re Supports," Research Report 146-13F, Texas Transportation Institute, Texas A&M University, 1975.
72. Nordlin, E. F., Field, R. N., and Folsom, J. J., "Dynamic Tests of Short Sections of Corrugated Metal Beam Guardrail," Highway Research Record 259, Highway Research Board, 1969, pp. 35-50.
73. Hirsch, T. J., and Post, E. R., ''Truck Tests on Texas Concrete Median Barrier," Research Report 146-7, Texas Transportation Institute, Texas A&M University, 1972.
74. Brons tad, M. E., "Concrete Median Barrier Research," Quarterly Report No. 3 on Contract No. DOT-FH-ll-8130, Southwest Research Institute, 1974.
75. Bronstad, M. E., "Concrete Median Barrier Research," Interim Report, on Contract No. DOT-FH-8130, Southwest Research Institute, 1974.
76. Kimball, C. E., Bronstad, M. E., Michie, J. D., Wentworth, J. A., and Viner, J. G., "Full-Scale Tests of a Modified Collapsing Ring Bridge Rail System," paper prepared for the 55th Annual Transportation Research Board Meeting in Washington, D.C., 1975.
262
77. Nordlin, E. F., Woodstrom, J. H., and Doty, R.N., "Dynamic Tests of an Energy-Absorbing Barrier Employing Steel Drums," Highway Research Record 343, Highway Research Board, 1971, pp. 123-141.
78. Hirsch, T. J., Ivey, D. L.-, and White, M. C., "The Modular Crash Cushion- Research Findings and Field Experience," Highway Research Board Special Report 107, Highway Research Board, 1970, pp. 140-148.
79. Hayes, G. G., Ivey, D. L., and Hirsch, T. J., "Performance of the Hi-dro Cushion Cell Barrier Vehicle-Impact Attenua tor," Highway Research Record 343, Highway Research Board, 1971, pp. 93-99. ·
80. Mileti, R. A., "Results of Full-Scale Crash Test Program," Technical Report No. 75-01, FIBCO, Incorporated, 1974.
ST. Young, B. 0., "Crash Test Evaluation of Energite Module Inertial Barrier," Energy Absorption Corporation, July 24, 1974.
82. Button, J. W., Buth, C. E., and Olson, R. M., "Crash Tests of Five-Foot Radius Plate Beam Guardrail," report prepared for the Minnesota Department of Highways, Texas Transportation Institute, Texas A&M University, 1975.
83. Letter to F. W. Thorstenson, Assistant Commissioner, Research and Standards, Minnesota Department of HighWC!YS, from E. F. Nordlin, Chief, Structural Materials Section of the California Department of Transportation, February 23, 1974.
84. Letter to Hayes E. Ross, Texas Transportation Institute, Texas A&M University; from E. F. Nordlin, Chief, Structural Materials Section of the California Department of Transportation, September 4, 1975.
85. Post, E. R., Hirsch, T. J., and Nixon, J. F., "Truck Tests on Texas Concrete Median Barrier," Highway Research Record 460, Highway Research Board, 1973, pp. 73-81.
86. "Standard Specifications for Highway Bridges" AASHO, Eleventh Edition, 1973.
87. "Interim Specifications - Bridges," AASHTO, 1975.
88. Michie, J. D., and Bronstad, M. E., "Upgrading Safety Performance in Retrofitting Traffic Railing Systems," Phase I Report Draft, Contract DOT-FH-11-8100, Southwest Research Institute, September, 1974.
263

89. Beaton, J. L., and Peterson, H. A., "Road Barrier Curb Investigation," State of California Research Report, December, 1953.
90. Beaton, J. L., and Field, R. N., "Final Report of FullScale Tests of Bridge Curbs and Rails," State of California Research Report, August, 1957.
91. Nordlin, E. F., Field, R. N., and Johnson, M. H., "Dynamic Full-Scale Impact Tests of Cable-Type Median Barriers, Test Series IX," State of California Research Report, June, 1965.
92. Olson, R. M., Weaver, G. D., Ross, H. f., Jr., and Post, E. R., "Effect of Curb Geometry and Location on Vehicle Behavior," National Coo erative Hi hwa Research Pro ram Report 150 1974 , 88 pp.
93. Ross, H. E., Jr., and Post, E. R., "Dynamic Behavior of an Automobile Traversing Selected Curbs and Medians," Research Report 140-6, Texas Transportation Institute and Texas Highway Department, January, 1975.
94. Dunlap, D. F., "Barrier-Curb Redirection Effectiveness," Highway Research Record No. 460 (1973), pp. 1-10.
95. Dunlap, D. F., "Curb-Guardrail Vaulting Evaluation," Highway Research Record No. 460 (1973), pp. 10-20.
96. Ross, H. E., Jr., and Post, E. R., "Criteria for Guardrail Need and Location on Embankments," Research Report 140-4, Texas Transportation Institute and Texas Highway Department, April , 1972.
97. U.S. Department of Transportation, Federal Highway Administration Notice N 5040.8, June 11, 1975.
98. Marquis, E.L., Hirsch, T.J., and Nixon, J.N., "Texas CrashCushion Trailer to Protect Highway Maintenance Vehicles", Highway Research Record 460, Highway Research Board, 1973, pp. 30-39.
99. Hirsch, T.J., Nixon, J.F., Hustace, D. and Marquis, E.L., "Summary of Crash Cushion Experience in Texas - Four Hundred Collisions in Seven Years on One Hundred Thirty Five Installations", Research Report 223-2F, Texas Transportation Institute and Texas Highway Department, November, 1975 (Pending review and a pprova 1 ) .
264

100. Energy Absorption Systems, Inc., One IBM Plaza, Chicago, Illinois, 60611.
101. FIBCO, Inc., One Boston Place, Boston, Mass., 02108.
1 02. Glen non, J. C. , "Roadside Safety Improvement Programs on Freeways - A Cost Effectiveness Priority Approach," National Cooperative Highway Research Program Report 148, ( 19 7 4) , 64 pp.
103. Weaver, G. D., Post, E. R., and French, D. D., "CostEffectiveness Program for Roadside Safety Improvements on Texas Highways - Volume 2: Computer Program Documentation Manual," Research Report 15-1, Texas Transportation Institute and Texas Highway Department, February, 1975.
104. Lampela, A.A., and Yang, A.H., "Analysis of Guardrail Accidents in Michigan," Report TSD-243-74, State of Michgan, Department of State Highways, 1974.
105. Elliot, A.L., "Field Evaluation of Vehicle Barrier Systems," Final Report, NCHRP Project 22-3A, December, 1974.
106. Wilson, W.A., "Accidents Involving Only Collisions with the 1 New Jersey 1 Type Median in North Caro 1 ina," North Caro 1 ina State Highway Commission, 1973.
107. Goodge, M. J., "Expressway Median Barrier Rails," State of Connecticut, Bureau of Highways, Traffic, November., 1969.
108. Tye, E.J., "Median Barriers in California," State of California, Department of Transportation, Division of Maintenance and Operations, March, 1975.
109. Tye, E. J., "Ca 1 iforni a 1 s Median Barrier Experience," Traffic Department, State of California, Division of Highways, June, 1973.
llO. Bronstad, M.E., "Concrete Median Barrier Research," Quarterly Report No. 5, Southwest Research Institute Project 03-3716, 1974.
lll . Burnett, W. C., "In Service Performance of Highway Barriers," Final Report, Project 15-4, Engineering Research and Development Bureau, New York State Department of Transportation (Estimated publication date is mid-1976).
112. Burnett, W.C., "Performance of Safety Devices," Final Report, Project 101, Engineering Research and Development Bureau, New York State Department of Transportation (To be published -date unknown).
265
113. Garrett, J.W., De Leys, N.J., Anderson, T.E., "Field Evaluation of VehiCle-Barrier Systems," Final Report, NCHRP Project 22-3, Calspan Corporation, February, 1975.
114. Evans, J.S., "Guard Railing Performance Study," Final Report, California Department of Transportation, Traffic Branch, District 7, December, 1973.
115. Viner, J.G., and Boyer, C.M., "Accident Experience with Impact Attenuating Devices," Report No. FHWA-RD-73-71, Federal Highway Administration, Office of Research and Development, April, 1973.
116. Walters, W.C., and Bokun, S.G., "Performance Report of the Hidro Cushion Crash Attenuation Devices,'' Highway Research Report, Louisiana Department of Highways, Research and Development Section, September, 1970.
117. Letter to H.E. Ross, Jr., Texas Transportation Institute, Texas A & M University, from J.F. Roberts, Division Engineer, Survey and Plans, Missouri State Highway Commission, Jefferson City, Missouri, November 22, 1974.
118. "California Attenuator Experience as of 12/31/74," transmitted to H.E. Ross, Jr., Texas Transportation Institute, Texas A & M University, from E.J. Tye, Traffic Engineer, State of California, Department of Transportation.
119. Zavoral, J.R., "Progress Report on Impact Attenuation Devices Accident Experience," Wisconsin Di vision, Federa 1 Highway Administration, Department of Transportation, October, 1974.
120. Letter to W.J. Wilkes, Director, Offic of Engineering, DOT, FHWA, from C. C. Halter, Senior Vice-President, FIBCO, Inc., June 6, 1975, concerning accident data on crash cushions on Illinois Toll Roads.
121. Letter to H.E. Ross, Jr., Texas Transportation Institute, Texas A&M University, from C.C. Walter, Senior Vice-President, FIBCO, Inc., June 9, 1975, concerning accident data on crash cushions in New York City.
122. Same as reference 121, concerning accident data on crash cushions in Massachusetts.
123. Same as reference 121, concerning accident data on crash cushions in Connecticut.
124. Same as reference 122, concerning accident data on crash cushions in Toronto, Canada area.
266
125. Versteeg, J.H., "Impact Attenuator Experience in Oregon, Oregon State Highway Division, 1973.
126. Jain, R., and Kudzia, W.J., "Crash Barriers Save Lives in Connecticut," C. E .. Report No. 72-46, Schoo 1 of Engineering, University of Connecticut.
127. Snyder, R.A., "Federal-Aid Research Project D-4-108, Monitoring Field Installations of Impact Energy Attenuators by Videotape," State of California Department of Transportation, Traffic Branch, Los.Angeles-District 07, March 1974.
128. Galati, J.V., "Study of Box-Beam Median Barrier Accidents," Special Report 107, Highway Research Board, 1970, 133-139.
129. Lokken, E. C., "Concrete Safety Barrier Design," Transportation Engineering Journal, Vol. 100, TE 1, A.S.C.E., Feb., 1974, pp. 151-168.
130. Tye, E.J., "California Criteria for the Selection of Crash Cushions," Traffic Bulletin No. 21, State of California Department of Transportation, Department of Highways, September 20, 1974.
131. Letter to H.E. Ross, Jr., Texas Transportation Institute, Texas A&M University, from J.H. Kindsvater, Jr., Director of Marketing, Energy Absorption Systems, Inc., October 29, 1975, concerning accident data on crash cushions in Michigan.
132. Same as reference 131, concerning accident data on crash cushions in Ohio.
133. Pigman, J.G., Seymour, W.M., and Cornett, D.L., "Experimental Installations of Impact-Attenuating Devices," Final Report, KYHPR-70-64, Kentucky Department of Highways, February, 1973.
134. Marquis, E.L., "Highway Safety Structures," A dissertation, submitted to Texas A&M University in partial fulfillment of the requirements for the degree of Doctor of Philosophy, December, 197 4.
135. White, M.C., Marquis, E.L., and Hirsch, T.J., "The Modular Crash Cushion: Design Fabrication, Installation," A Report for U.S. Steel Corporation, Texas Transportation Institute, Texas A&M University, September, 1970.
136. French, D.D., and Woods, D.L., "Design of Inertia Barrier Systems," Traffic Engineering, Vol. 44, No. 13, October, 1974, pp. 23-29.
267
137. Graham, M. D., "Progress Report on New York State's Highway Barrier Research Program," Presented to the AASHO Design Committee, October 29, 1969, Philadelphia, Pennsylvania.
139. Field, R. N., "Dynamic Full-Scale Impact Tests of Cable-Type Median Barriers -Series VII," California Division of Highways, March, 1964.
139. Beaton, J. L., and Field, R. N., "Dynamic Full-Scale Tests of Median Barriers," HRB Bulletin 266, 1960, pp. 78-125.
140. Field, R. N., and Prysock, R. H., "Dynamic Full-Scale Impact Tests of Double Block-Out Metal Beam Barriers and Metal Beam Guard Railing-Series X," California Division of Highways, February, 1965.
141. Weaver, G. D., and Woods, D. L., "Cost-Effectiveness Analysis of Roadside Safety Improvements," TRB Record 543, 1975, pp. 1-16.
142. Glennon, J. C., and Wilton, C. J., "Roadside Encroachment Parameters for Non freeway Facilities," Paper presented at 55th Annua 1 TRB Meeting, Washington, D.C., January, 1976.
143. Hatton, J. H., Jr., "A Roadside Design Procedure," Office of Engineering, Federal Highway Administration, Washington, D.C., January, 1974.
144. Weaver, G. D., Marquis, E. L., and Olson, R. M., "The Relation of Side Slope Design to Highway Safety," NCHRP Report 158, 1975.
268