detailed california-modified greet pathway for · pdf filedetailed california-modified greet...
TRANSCRIPT
PRELIMINARY DRAFT – FOR PUBLIC COMMENTS
Detailed California-Modified GREET Pathway for Sorghum Ethanol
Stationary Source Division Release Date: December 14, 2010
Version 1.0

DRAFT – FOR REVIEW
Preliminary draft version developed by Alternative Fuels Section of the California Air Resources Board for the Low Carbon Fuel
Standard Methods 2A-2B Process
When reviewing this document, please submit comments directly to:
Alan Glabe: [email protected] Chan Pham: [email protected]
Manisha Singh: [email protected] Wes Ingram: [email protected] Mark Sippola: [email protected]
These comments will be compiled, reviewed, and posted to the LCFS
website in a timely manner.

DRAFT – FOR REVIEW
i
TABLE OF CONTENTS Table of Contents ............................................................................................................. i List of Figures ................................................................................................................... i List of Tables .................................................................................................................... i SUMMARY ...................................................................................................................... 1 APPENDIX A ................................................................................................................. 10
Section 1. SORGHUM FARMING.............................................................................. 10 1.1 Energy Use for Sorghum Farming .................................................................... 10 1.2 GHG Emissions from Sorghum Farming .......................................................... 14
Section 2. CHEMICAL INPUTS FOR AGRICULTURAL CHEMICALS ...................... 18 2.1 Energy Calculations for Production of Chemical Inputs ................................... 18 2.2 GHG Calculation for Production of Chemical Inputs ........................................ 19
Section 3. SORGHUM TRANSPORT ........................................................................ 24 3.1 Energy for Sorghum Transportation ................................................................. 24 3.2 GHG Emissions Calculations from Sorghum Transportation ........................... 25
Section 4. ETHANOL PRODUCTION ........................................................................ 28 4.1 Ethanol Production ........................................................................................... 28 4.2 GHG Emissions from Ethanol Production ........................................................ 29
Section 5. ETHANOL TRANSPORT AND DISTRIBUTION ....................................... 36 5.1 Energy for Ethanol Transportation and Distribution .......................................... 36 5.2 GHG Calculations from Ethanol Transportation and Distribution ..................... 38
Section 6. CO-PRODUCTS CREDITS ...................................................................... 40 6.1 Energy Credit for Ethanol Co-Products ............................................................ 40 6.2 Co-product Emissions Credits .......................................................................... 42
APPENDIX B ................................................................................................................. 44 Ethanol Pathway Input Values ................................................................................... 44
REFERENCES .............................................................................................................. 47
LIST OF FIGURES Figure 1. WTT Components for Ethanol Transported to California ................................. 2
LIST OF TABLES
Table 1. Energy Use SuMMary for Dry Mill, DDGS Sorghum Ethanol ................................................................................................. 3 Table 2. GHG Emissions SuMMary for Dry Mill, DDGS Sorghum Ethanol ................................................................................................. 4 Table 3. Total Well-to-Wheel GHG Emissions According to Co-product Produced ......... 4 Table 4. Total Energy Input by Fuel for Sorghum Cultivation .......................................... 5 Table 5. GHG Emissions from Sorghum Farming ........................................................... 5 Table 6. Energy Inputs for the Production of Agricultural Chemicals Used in Sorghum Farming ............................................................................. 6 Table 7. GHG Emissions from Production and Use of Agricultural Chemicals ................ 6 Table 8. Energy for Sorghum Transport .......................................................................... 7

DRAFT – FOR REVIEW
ii
Table 9. GHG Emissions from Sorghum Transport ......................................................... 7 Table 10. Energy for Ethanol Production ......................................................................... 7 Table 11. GHG Emissions for Ethanol Production .......................................................... 8 Table 12. Energy Use for Ethanol Transport and Distribution (T&D) ............................... 8 Table 13. GHG Emissions from Ethanol Transport and Distribution (T&D) ..................... 8 Table 14. Sorghum Ethanol Co-Product Energy Credits ................................................. 9 Table15. Dry Mill Co-Product GHG Emission Credits ..................................................... 9 Table A-1. Direct Energy Input by Fuel Type for Sorghum Farming .............................. 10 Table A-2. Calculating Total Energy Input by Fuel Type for Sorghum Farming ............ 11 Table A-3. Values of Coefficients Used in Table A-2..................................................... 12 Table A-4. Energy Consumption in the WTT Process and Specific Energy ................. 13 Table A-5. Global Warming Potentials for Gasesa ........................................................ 14 Table A-6. CO2 Emission Calculated – WTT of All Fuels ............................................. 14 Table A-7. CA-GREET Calculations for CO2 Emissions from Sorghum Farminga ........ 15 Table A-8. Description and Values of Factors Used in Table A-7a,b ............................. 16 Table A-9. GHG Emissions from Sorghum Farming ..................................................... 17 Table A-10 Sorghum Farming Chemical Input, Product Input Energy, and WTT Energy Per Bushel (BTU/bu) and BTU/MMBTU Anhydrous Ethanol ......................................... 19 Table A-11. Calculated GHG Emissions Associated with the Production of Agricultural Chemicals ............................................................... 20 Table A-12. Calculated CO2 Emission Factors Associated with Production of Agricultural Chemicals ..................................................................... 20 Table A-13. Description and Values of Factors Used in Table A-12 ............................ 21 Table A-14. Calculated GHG Emissions from Production of Agricultural Chemicals .... 22 Table A-15. Inputs and Calculated Emissions for Soil N2O from Sorghum Farming .... 22 Table A-16. Total GHG Emissions from Agricultural Chemical Use in Dry Mill Sorghum Ethanol Production (g CO2e/MJ) ................................................................................... 23 Table A-17. Assumptions for Calculating Energy Use for Sorghum Transport .............. 24 Table A-18. Calculated Sorghum Transport Energy ..................................................... 25 Table A-19. Assumptions for Calculating GHG Emissions from Sorghum Transport ... 25 Table A-20. Calculated GHG Emissions from Sorghum Transport .............................. 26 Table A-21. Non-CO2 GHG Emissions from Sorghum Transport ................................. 26 Table A-22. Non-CO2 GHG Emissions from Sorghum Transport ................................. 27 Table A-23. Share of Fuel and Primary Energy Input by Fuel Type for Dry Mill Sorghum Ethanol Production ................................................. 28 Table A-24. Calculation of Total Energy Input for Dry Mill Sorghum Ethanol Production ...................................................................................................................................... 29 Table A-25. Process Shares and GHG Emission Factors (EF) For Dry Mill Sorghum Ethanol Production Equipment ................................................... 30 Table A-26. Calculated GHG Emissions for Dry Mill Sorghum Ethanol Production ...... 31 Table A-27. Calculated GHG Emissions from Ethanol Plants Producing 100% Dry DGS and 100% Wet DGS ........................................................... 32 Table A-28. Details of GHG Emission Factors for Natural Gas and Electricity Presented in Table A-25 .................................................... 32 Table A-29. Detailed CO2 Emissions from Feedstock Consumption Contributions for Electricity Shown in Tables A-29 and A-32 ................................................................... 33

DRAFT – FOR REVIEW
iii
Table A-30. Calculations of Direct Energy Inputs of Fuels for Electricity Generation ... 33 Table A-31. Descriptions and Values of Factors Presented in Table A-29 ................... 34 Table A-32. Detailed CO2 Emissions from Fuel Consumption Contributions for Electricity Generation Shown in Table A-29a ................................................................. 35 Table A-33. Power Plant Equipment Used in Table A-32 ............................................. 35 Table A-34. Inputs and Calculated Fuel Cycle Energy Requirements for Ethanol Transport to Bulk Terminals .......................................................................................... 37 Table A-35. CA-GREET Calculations for Ethanol Transport Energy (BTU/MMBTU Anhydrous Ethanol) by Transport Modea ...................................................................... 37 Table A-36 Key Assumptions in Calculating GHG Emissions from EtOH Transportation for Dry and Wet Mills a ................................................................................................... 38 Table A-37. EtOH Transport - CO2e Emissions in g/MMBTU for Dry and Wet Mill ...... 39 Table A-38. Co-Products Generated for Sorghum Ethanol Production ........................ 40 Table A-39. CA-GREET Input Parameters, Formulas and Values for Dry Mill Sorghum Ethanol Co-Products a ................................................................................................... 41 Table A-40. Sorghum Ethanol Co-Product Energy Credit Calculations and Values ..... 42 Table A-41. Dry Mill Co-Product Emission Credits Based on Parameters Presented in Section 6.1 ............................................................ 43
PRELIMINARY DRAFT – FOR PUBLIC COMMENTS
DRAFT
1
SUMMARY
CA-GREET Model Pathway for Anhydrous Sorghum Ethanol A Well-To-Tank (WTT) Life Cycle Analysis of a fuel (or fuel blendstock) pathway includes all steps from feedstock production to final finished product. For this analysis, the system boundary begins with the cultivation of sorghum and ends with the combustion of an ethanol/CARBOB blend in a motor vehicle. Finished ethanol is assumed to be shipped to California where it is blended with CARBOB. Tank-To-Wheel (TTW) analysis includes actual combustion of fuel in a motor vehicle for motive power. WTT and TTW analyses are combined to provide a total Well-To-Wheel (WTW) analysis. A Life Cycle Analysis Model called the Greenhouse gases, Regulated Emissions, and Energy use in Transportation (GREET)1 model developed by Argonne National Laboratory was modified by Life Cycle Associates to create a GREET model called CA-GREET. For this analysis, the CA-GREET model was utilized to develop a WTW analysis of the conversion of sorghum into ethanol. The CA-GREET model and pathway documents published by ARB staff are available from the Low Carbon Fuel Standard (LCFS) website at www.arb.ca.gov/fuels/lcfs/lcfs.htm. This document estimates the life cycle GHG emissions from the production of ethanol at Midwestern dry mill plants that use sorghum as a feedstock. These estimates are based on the energy use and chemical inputs required in the production process which are also estimated in this analysis. All values are calculated on an anhydrous ethanol basis (anhydrous ethanol is ethanol containing less than 1% water). The WTT components include sorghum farming, production and use of agricultural chemicals, feedstock transport, ethanol production, and transportation and distribution (T&D) of finished fuel. Figure 1 outlines the discrete components included in the sorghum ethanol system boundary. Included in this pathway is the addition of a denaturant which is required before ethanol can be transported from a production facility to a blending station for use as a transportation fuel. Details of the blending and denaturant use are provided in a document for California Reformulated Gasoline, also available from the LCFS website.
1 GREET Model: Argonne National Laboratory: http://www.transportation.anl.gov/modeling_simulation/GREET/index.html

DRAFT – FOR REVIEW
DRAFT 11/30/2010
2
Figure 1. WTT Components for Ethanol Transported to California Indirect land use change (ILUC) impacts have not been included in this document. ILUC inputs will be estimated separately and appended to the life cycle carbon intensity (CI) estimate from this analysis. Tailpipe emissions factors attributable to ethanol in CaRFG are not provided in this document. These will be made available in an addendum on the LCFS website. This addendum will contain carbon intensities for this analysis and will include impacts from land use change (if any) and contributions from tailpipe CH4 and N2O emissions. The analysis that follows uses conventions and technical terms with specific meanings that are defined here: • CA-GREET calculates energy consumption and GHG emissions recursively:
calculated results are often used in subsequent calculation. For example, natural gas (NG) is used as a process fuel to recover natural gas. The total natural gas recovery energy consumption includes the direct natural gas consumption AND the energy associated with recovering that natural gas (which is the value being calculated).
• “Direct” energy use and GHG emissions refer to the energy released and the GHG
emissions resulting from the use of fuel. • “Upstream” energy use and GHG emissions refer to the energy required for, and the
GHG emissions produced from, the production of fuel feedstocks and the production of fuel from those feedstocks.
• BTU/MMBTU is the energy input in BTU required to produce one million BTU of a
finished (or intermediate) product. This unit is used consistently in CA-GREET for all energy calculations.
• gCO2e/MJ is the unit used to express greenhouse gas emissions on a CO2
equivalent per unit of energy (MJ) basis for a given fuel. International Panel on Climate Change (IPCC) coefficients are used to convert the non-CO2 GHGs, nitrous
Ethanol production
Crop Cultivation
Sorghum Transport
Ethanol Transport & Storage
Chemical Inputs
Denaturant

DRAFT – FOR REVIEW
DRAFT 11/30/2010
3
oxide and methane, to a CO2-equivalent value. For nitrous oxide and methane, these coefficients are 298 gCO2-equivalents/gNO and 25 gCO2-equivalents/gCH4, respectively.
• CA-GREET assumes that VOC and CO are converted to CO2 in the atmosphere and
CO2-equivalent emissions are calculated using ratios that reflect the relative molecular weights of these GHGs.
• Process Efficiency throughout CA-GREET is defined as:
Efficiency = energy output / (energy output + energy consumed) • Rounding of values has not been performed in several tables in this document. This
allows stakeholders executing runs with the CA-GREET model to compare actual output values with the values appearing in those tables.
Table 1 summarizes the fuel cycle energy inputs by stage (BTU/MMBTU) and Table 2 summarizes the major GHG emission categories and intensities (gCO2e/MJ) by stage. The Tables present energy and emission results relative to the energy content lower heating value (LHV) of anhydrous ethanol. The results are provided for dry mill plants producing 100% dry distiller’s grain solubles (DDGS). Details of all energy inputs and GHG emissions are provided in Appendix A. A list of all inputs is provided in Appendix B.
Table 1. Energy Use Summary for Dry Mill, DDGS Sorghum Ethanol
Sorghum Ethanol Fuel Cycle
Components
Energy*
(BTU/MMBTU) % Energy
Contribution Well-to-tank
Sorghum Farming 30,864 Energy Inputs for Ag
Chemicals 153,436 Sorghum
Transportation 28,814 Ethanol Production 1,434,648
Ethanol T&D 34,667 Co-products -154,548
Total well-to-tank 1,527,881 60.44% Total tank-to-wheel 1,000,000 39.56%
Tank-to-wheel Total well-to-wheel 2,527,881 100%

DRAFT – FOR REVIEW
DRAFT 11/30/2010
4
Table 2. GHG Emissions Summary for Dry Mill,
DDGS Sorghum Ethanol Sorghum Ethanol
Fuel Cycle Components
GHG (gCO2e/MJ)
GHG Contribution(%)
Well-to-tank Sorghum Farming 3.49
Ag Chemicals Production and Use 27.06
Sorghum Transportation 2.22
Ethanol Production 38.33 Ethanol T&D 2.63 Co-Products -11.51
Total well-to-tank 62.22 100% Carbon in fuel 0 0
Total Tank-to-wheel 0 0 Total well-to-wheel 62.22 100%
The ethanol production GHG emission values listed in Table 1 are for plants producing 100% DDGS. Plants producing wet distiller’s grain solubles (WDGS) will use less energy and produce less GHG emissions per unit of product. Table 3 lists GHG emissions for plants producing 100% DDGS or 100% WDGS.
Table 3. Total Well-to-Wheel GHG Emissions According to Co-product Produced 100% DDGS 100% WDGS
Ethanol Production gCO2e/MJ 38.33 30.47
Total well –to-wheel (gCO2e/MJ) 62.22 54.36
Agricultural chemical production and use (27.06 gCO2e/MJ) and ethanol production (38.33 gCO2e/MJ) are the major contributors to GHG emissions for the sorghum ethanol pathway. Details of all energy inputs and GHG emissions for the dry mill, DDGS pathway are provided in Appendix A. SORGHUM FARMING Table 4 breaks down energy input by fuel type used in sorghum farming activities. Table 5 summarizes GHG emissions resulting from the energy use described in Table 4. Details of these calculations are provided in Appendix A.

DRAFT – FOR REVIEW
DRAFT 11/30/2010
5
Table 4. Total Energy Input by Fuel for Sorghum Cultivation
Fuel Type Total Energy
Diesel fuel (BTU/bu) 11,667 Gasoline (BTU/bu) 6,187
NG (BTU/bu) 12,925 Electricity (BTU/bu) 65
Dry mill ethanol (BTU/MMBTU, anhydrous basis) 30,864
Table 5. GHG Emissions from Sorghum Farming
Sorghum Farming
Emission Species GHG
VOC (gCO2e/MMBTU) 46 CO (gCO2e/MMBTU) 636 CH4 (gCO2e/MMBTU) 388
N2O (gCO2e/MMBTU) 14
CO2 (gCO2e/MMBTU) 2,601 Total GHG (gCO2e/MMBTU) 3,684
Total GHG (gCO2e/MJ) 3.49
DRAFT – FOR REVIEW
DRAFT 11/30/2010
6
CHEMICAL INPUTS FOR AGRICULTURAL CHEMICALS
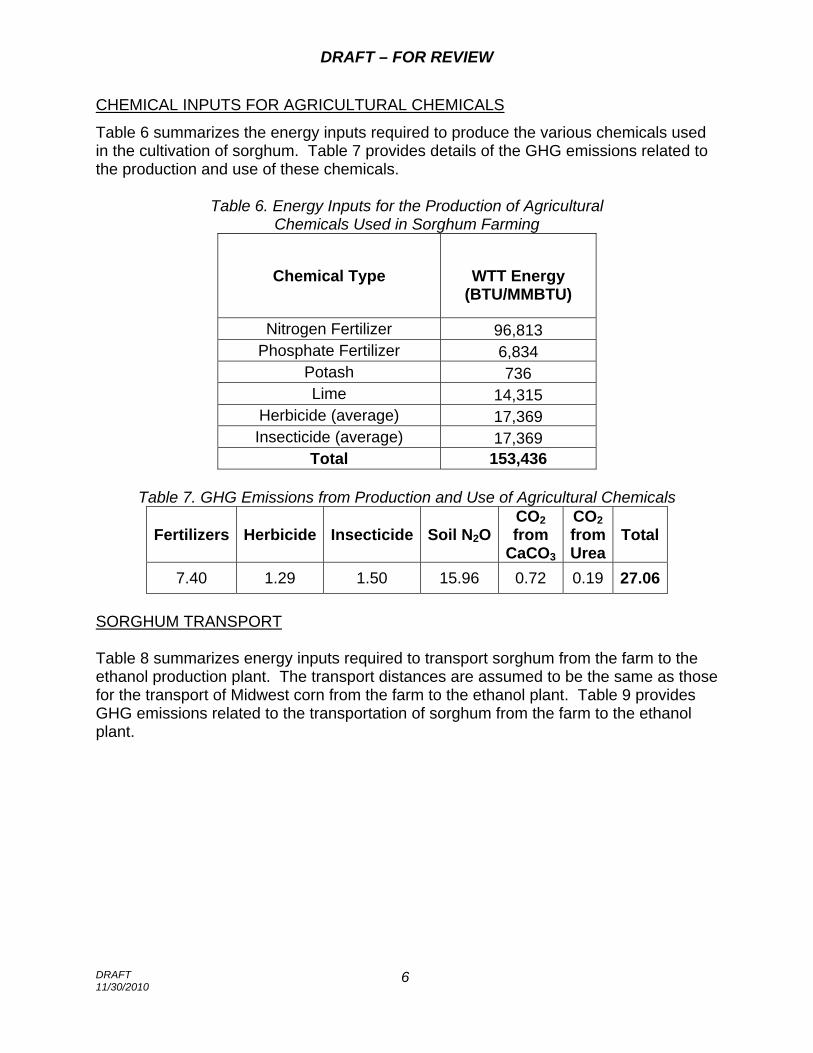
Table 6 summarizes the energy inputs required to produce the various chemicals used in the cultivation of sorghum. Table 7 provides details of the GHG emissions related to the production and use of these chemicals.
Table 6. Energy Inputs for the Production of Agricultural Chemicals Used in Sorghum Farming
Chemical Type
WTT Energy (BTU/MMBTU)
Nitrogen Fertilizer 96,813 Phosphate Fertilizer 6,834
Potash 736 Lime 14,315
Herbicide (average) 17,369 Insecticide (average) 17,369
Total 153,436
Table 7. GHG Emissions from Production and Use of Agricultural Chemicals
Fertilizers Herbicide Insecticide Soil N2OCO2 from
CaCO3
CO2 from Urea
Total
7.40 1.29 1.50 15.96 0.72 0.19 27.06 SORGHUM TRANSPORT Table 8 summarizes energy inputs required to transport sorghum from the farm to the ethanol production plant. The transport distances are assumed to be the same as those for the transport of Midwest corn from the farm to the ethanol plant. Table 9 provides GHG emissions related to the transportation of sorghum from the farm to the ethanol plant.

DRAFT – FOR REVIEW
DRAFT 11/30/2010
7
Table 8. Energy for Sorghum Transport
Transport Mode Energy Consumption
Sorghum to Stack by Medium Duty Truck (BTU/bu) 1,454
Stack to Ethanol Plant by Heavy Duty Truck (BTU/bu) 4,528
Total (BTU/bu) 5,982
Total (dry mill) (BTU/MMBTU) 28,814
Table 9. GHG Emissions from Sorghum Transport
Transport Mode GHG Emissions (gCO2e/MJ)
Sorghum to Stack by Medium Duty Truck 0.54
Stack to Ethanol Plant by Heavy Duty Truck 1.68
Total 2.22 ETHANOL PRODUCTION Table 10 summarizes the energy inputs required to produce ethanol from sorghum. Table 11 presents GHG emissions related to the production of ethanol from sorghum.
Table 10. Energy for Ethanol Production
Fuel Type Energy
Natural Gas (BTU/gal) 34,598 Electricity (BTU/gal) 10,926
Energy from EtOH (BTU/gal) 63,983 Total energy input for ethanol production
(BTU/gal) 109,507
Total energy input for ethanol production (BTU/MMBTU) 1,434,648

DRAFT – FOR REVIEW
DRAFT 11/30/2010
8
Table 11. GHG Emissions for Ethanol Production
GHG Species GHG Emissions
CO2 (gCO2e/MMBTU) 38,471 VOC (gCO2e/MMBTU) 14 CO (gCO2e/MMBTU) 39 CH4 (gCO2e/MMBTU) 1,758 N2O (gCO2e/MMBTU) 100
Total GHGs (gCO2e/MMBTU) 40,383 Total GHGs (gCO2e/MJ) 38.33
ETHANOL TRANSPORT AND DISTRIBUTION
Transport from the ethanol plant to the bulk terminal or storage facility is accomplished primarily by rail with short truck delivery to the terminal or storage facility. Ethanol is transported by truck to a gasoline blending terminal where it is blended with gasoline to produce RFG. Table 12 presents energy inputs required for ethanol transport and distribution. Table 13 presents GHG emissions related to ethanol transport and distribution.
Table 12. Energy Use for Ethanol Transport and Distribution (T&D) Transport Mode BTU/MMBTU
Heavy Duty Truck 4,201 Rail 26,474 Total 29,415 Distribution by Truck 5,252 Total Energy for Transportation & Distribution 34,667
Table 13. GHG Emissions from Ethanol Transport and Distribution (T&D)
Transport Mode
CO2 (g/MMBTU)
CH4 (g/MMBTU )
N2O (g/MMBTU )
CO2e (g/MMBTU )
CO2e (gCO2e/MJ)
Rail 2,074 2.33 0.048 2,147 2.01
Medium Duty Truck 231 0.25 0.006 239 0.22
Heavy Duty Truck 412 0.45 0.01 427 0.40
Total 2717 3.03 .0064 2813 2.63

DRAFT – FOR REVIEW
DRAFT 11/30/2010
9
CO-PRODUCT CREDITS
The dry mill process generates DDGS which can replace corn as animal feed. Table 14 provides a summary of energy credits generated by assigning credits for DDGS. GHG emission credits corresponding to the energy credits are provided in Table 15 for the dry mill process. Details of the co-product analysis are provided in Appendix A.
Table 14. Sorghum Ethanol Co-Product Energy Credits Ethanol
Production Type
Displaced Product Energy Credit (BTU/gal)
Energy Credit (BTU/MMBTU anhydrous)
Dry Mill Feed corn -6,230 -81,617
Total co-product credit -6,230 -81,617
Wet Mill
Feed corn -6,764 -88,610
Nitrogen in urea -2,024 -26,510
Soybean oil -3,009 -39,427
Total co-product credit -11,797 -154,548
Table15. Dry Mill Co-Product GHG Emission Credits
Displaced GHG Feed corn
VOC (g/gal anhydrous) -0.555 CO (g/gal anhydrous) -5.007 CH4 (g/gal anhydrous) -0.575 N2O (g/gal anhydrous) -1.381 CO2 (g/gal anhydrous) -492
GHGs (g/gal anhydrous) -927 GHG (gCO2e/MMBTU
anhydrous) -12,145
GHG (g/CO2e/MJ) -11.51

DRAFT – FOR REVIEW
DRAFT 11/30/2010
10
APPENDIX A
SECTION 1. SORGHUM FARMING
1.1 Energy Use for Sorghum Farming This section presents the direct farming energy inputs for sorghum cultivation. Instead of using energy efficiencies as it does for petroleum pathways, the CA-GREET model calculates energy input and GHG emissions based on the energy content of consumed fuel and chemicals used per quantity of product for sorghum farming. For the mix of fuel types shown in Table A-1, the total direct input energy for farming per bushel of sorghum is 27,257 BTU. The energy input is based on USDA data2 for sorghum producing states in the Central Plains (Nebraska, Kansas, and Missouri) and Southern Plains (Texas, Oklahoma, and Arkansas).
Table A-1. Direct Energy Input by Fuel Type for Sorghum Farming
Fuel Type Fuel Share (%) Calculation Direct Energy Input (BTU/bu)
Diesel fuel 36.7 0.367*27,257 10,006 Gasoline 18.8 0.188*27,257 5,132 Natural gas 44.4 0.444*27,257 12,097 Electricity 0.1 0.1*27,257 22 Total 100 - 27,257
2 Economic Research Service, U.S. Department of Agriculture, February 1997, FBEI 97-1.

DRAFT – FOR REVIEW
DRAFT 11/30/2010
11
The energy inputs in Table A-1are direct inputs and are not the total energy required. CA-GREET accounts for the ‘upstream’ energy associated with fuels by using the formulas shown in Table A-2. Values for the coefficients used to calculate total energy in Table A-2 are shown in Table A-3. Table A-4 provides additional details for about the factors presented in Table A-3.
Table A-2. Calculating Total Energy Input by Fuel Type for Sorghum Farming
Fuel Type Formula Total
Energy (BTU/bu)
Diesel fuel A*[1+((B*C+D)/106)] 11,667 Gasoline E*[1+((B*F+G)/106)] 6,187 Natural gas H*(1+I/106) 12,925 Electricity J*(K+L)/106 65
Total (dry mill, anhydrous basis)a - 30,864 a Anhydrous ethanol is “neat” fuel, typically 99.6% pure ethanol. The energy use for anhydrous ethanol is calculated by the following equation: Energy use = (Energy for sorghum farming (BTU/bu) / (Ethanol Yield (gal/bu) * LHV of Anhydrous Ethanol (BTU/gal)))*106. The LHV of anhydrous ethanol is 76,330 BTU/gal. Ethanol yields for dry mill sorghum ethanol are assumed to be 2.72 gal/bu in CA-GREET.

DRAFT – FOR REVIEW
DRAFT 11/30/2010
12
Table A-3. Values of Coefficients Used in Table A-2 Factor Description Value Reference
A Direct Diesel input 10,006 BTU/bu calculated in Table A-1
B Crude energy 40,630 BTU/MMBTU
CA-GREET calculated (cell B183, Petroleum Tab)
C Diesel loss factor 1.0000 CA-GREET default value
D Diesel energy 125,344 BTU/MMBTU
CA-GREET calculated (cell K183, Petroleum Tab)
E Direct Gasoline input 5,132BTU/bu calculated in Table A-1
F Gasoline loss factor 1.0008 CA-GREET default
G Gasoline energy 164,956 BTU/MMBTU
CA-GREET calculated (cell D183, Petroleum Tab)
H Direct NG input 12,097BTU/bu calculated in Table A-1
I NG stationary energy 70,079 BTU/MMBTU
CA-GREET calculated (cell B124, NG Tab)
J Direct electricity input 22 BTU/bu calculated in Table A-1
K Stationary electricity feedstock production
99,790 BTU/MMBTU
CA-GREET calculated (cell B84, Electric Tab)
L Stationary electricity fuel consumption
2,877,173 BTU/MMBTU
CA-GREET calculated (cell C84, Electric Tab)
The factors listed in Table A-3 are derived from the energy contributions of all other fuels that were used to produce ethanol. Those fuels are shown in Table A-4 in two components: WTT energy (E) and Specific Energy (S) for each fuel type.

DRAFT – FOR REVIEW
DRAFT 11/30/2010
13
Table A-4. Energy Consumption in the WTT Process and Specific Energy WTT Energy
(BTU input/MMBTU product) Specific Energy
(BTU input/MMBTU product)
Crude WTTCrude Recovery = 44,499 (CA-GREET calculated)a SCrude Recovery = 1 + WTTCrude Recovery / 106 = 1.045
B WTTCrude = WTTCrude Recovery * LFT&D + WTTCrude T&D + WTTCrude Storage = 44,499 * 1.0001 + 11,059 = 55,560
LFT&D = Loss Factor for Transport and Distribution = 1.0001 (CA-GREET default) WTTCrude T&D = 11,059 (CA-GREET calculated) WTTCrude Storage = 0.0 (CA-GREET default)
D WTTDiesel = 124,812 (CA-GREET calculated)
SDiesel = 1 + (WTTCrude * LFDiesel + WTTDiesel) / 106 = 1.180 LFDiesel = 1.0000 (CA-GREET default).
G WTTGasoline= 164,227 (CA-GREET calculated)
SGasoline = 1+ (WTTCrude * LFGasoline + WTTGasoline) / 106 = 1.220 LFGasoline = 1.0008 (CA-GREET default)
I
WTTNG = (WTTNG Recovery * LFProcessing + WTTNG Processing) * LFT&D + WTTT&D = (31,250 * 1.001 + 32,196) * 1.001 + 6,499 = 69,664 (CA-GREET calculated)
SNG = 1 + WTTNG / 106 = 1.070 WTTNG includes WTTNG Recovery = 31,207, WTTNG Processing = 31,862, and WTTNG T&D = 6,499. (all CA-GREET calculated)
Electricity SElectricity = (WTTFeedstock Production + WTTFuel Consumption) / 106 = 2.649
K WTTFeedstock Production = 87,341 (CA-GREET calculated)
L WTTFeedstock Consumption = 2,561,534 (CA-GREET calculated)
a WTTCrudeRecovery: WTT energy for Crude Oil Recovery, or use of crude oil at the well, does not include T&D.

DRAFT – FOR REVIEW
DRAFT 11/30/2010
14
1.2 GHG Emissions from Sorghum Farming
CA-GREET calculates carbon dioxide (CO2), methane (CH4) and nitrous oxide (N2O) emissions for each component of the pathway and uses IPCC Global Warming Potentials (GWP) to calculate CO2 equivalent emissions for methane and nitrous oxide. The IPCC GWP values for CH4 and N2O are given in Table A-5. CA-GREET uses a carbon ratio of 3.1 for volatile organic compounds (VOC) and a carbon ratio of 1.6 for carbon monoxide (CO) to calculate CO2 equivalent emissions for these species. These carbon ratios are based on the complete oxidation of VOC and CO to CO2 in the atmosphere. The GHG emissions resulting from fuel use in the ethanol production process are shown in Table A-6. All emission factors listed are CA-GREET default values.
Table A-5. Global Warming Potentials for Gasesa GHG Species GWP (relative to CO2)
CO2 1 CH4 25 N2O 298
a Conversions from MMBTU to MJ have been calculated using the factor 1 MMBTU = 1055 MJ
Table A-6. CO2 Emission Calculated – WTT of All Fuels Fuel WTT CO2e Emissions
(gCO2e/MMBTU fuel output) Specific Emissions
(gCO2e/MMBTU fuel output)
Crude
ECrude = ECrude Recovery * LFT&D + ECrude T&D + ECrude Storage + (VOC and CO conversion) = 4,310 * 1.0000 * 1.0000 + 885 + 34 = 5,230
SECrude Recovery = 1+ EFCrude Rrecovery
Residual Oil (RO) ERO = 5,623 SERO = 1 + (EFCrude * LFCrude+ EFRO)
Conventional Diesel EDiesel = 9,395 SEDiesel = 1 + (EFCrude * L FDiesel + EFDiesel)
Conventional Gasoline EGasoline = 12,131 SEGasoline = 1 + (EF Crude * LFGasoline +
EFGasoline)
Natural Gas (NG)
ENG= (E NG Recovery * LFProcessing + ENG Processing + EFT&D) * LFT&D + ET&D + ENon-combustion + (VOC and CO conversion) = 5,214
SENG = 1+EFNG
E NG Recovery = 1,722, ENG Processing = 1,859, ENG T&D = 352, ENG non-combustion = 1,237, LFT&D = 1.0008
Electricity E Feedstock + EFuel = (6,980 + 213,458) = 220,437 SEElectricity = (EFefeedstock + EF efuel)
The greenhouse gas emissions for farm energy use are determined separately for CO2, CH4 and N2O in CA-GREET using the direct energy inputs presented in Section 1.1 (BTU/bushel) and the combustion and upstream emissions for the energy input. The CA-GREET model calculates emissions for each fuel input by multiplying fuel input (BTU/bushel) by the total emission factors for combustion, crude production and fuel

DRAFT – FOR REVIEW
DRAFT 11/30/2010
15
production. The electricity emissions are calculated by multiplying the electricity input (BTU/bushel) by the total (feedstock plus fuel) emission factor associated with the chosen electricity mix (from the Electricity Tab in CA-GREET). For this pathway, sorghum farming uses Midwest electricity. Table A-7 below shows formulas and calculated CO2 emissions by fuel type for sorghum farming. The same method is used to calculate CO2 equivalent emissions associated with releases of CH4 and N2O, but these calculations are not presented.. Table A-8 provides values for parameters used in the formulas in Table A-7.
Table A-7. CA-GREET Calculations for CO2 Emissions from Sorghum Farminga
Fuel Formula CO2 Emissions
Diesel [(A)*[(B)*(C) + (D)*(E)+(F)*(G)+ (H)*(I)+(J)*(K)+(L)]]/106 135 g/bu
Gasoline [(M)*[(N)+ (J)*(O)+(P)]]/106 337 g/bu
Natural gas [(Q)*[(R)*(S) + (T)*(U)+(V) *(W)+(X)*(Y)+(Z)]]/106 63 g/bu
Electricity [(AA)*[(BB)+(CC)]]/106 5 g/bu
Total - 540 gu
Total (dry mill, anhydrous basis) - 2,601 g/MMBTU
a The calculations for CH4 and N2O are analogous. Relevant parameters here are calculated values in CA-GREET, except for technology shares, which are direct inputs. To convert emissions from (g/bu) to (g/MMBTU), multiply the emissions in (g/bu) by the following factor: 106 / [Ethanol Yield * LHV of Anhydrous Ethanol ] where the LHV of Anhydrous Ethanol is 76,330 BTU/gal and the Ethanol Yield is assumed to be 2.72 gal/bu for dry mill ethanol.

DRAFT – FOR REVIEW
DRAFT 11/30/2010
16
Table A-8. Description and Values of Factors Used in Table A-7a,b Fuel Relevant Parameters* Reference
A = Direct Diesel input = 10,006 BTU/bushel (table A-3) CA-GREET default B = % Fuel share diesel boiler = 0% CA-GREET default C = Boiler CO2 emissions = 78,167 g/MMBTU CA-GREET default D = % Fuel share diesel stationary engine = 20% CA-GREET default E = IC Engine CO2 Emissions =77,349 g/MMBTU CA-GREET default F = % Fuel share diesel turbine = 0% CA-GREET default G = Turbine CO2 emissions 78,179 g/MMBTU CA-GREET default
H = % Fuel share diesel tractor = 80% CA-GREET default
I = Tractor CO2 emissions = 77,204 g/MMBTU CA-GREET default
J = Crude production CO2 emissions = 3,956 g/MMBTU CA-GREET calculation
K = Diesel loss factor = 1.0000 CA-GREET default
L = Diesel production CO2 emissions = 9,480 g/MMBTU CA-GREET calculation
M = Direct Gasoline input = 5,132 (table A-3) CA-GREET default
N = Farming tractor CO2 emission factor = 49,494 g/MMBTU CA-GREET default
O = Gasoline loss factor = 1.0008 CA-GREET default
P = Gasoline production CO2 emissions = 12,243 g/MMBTU
CA-GREET Calculation
Q = Direct NG input = 12,097 BTU/bushel (table A-3) CA-GREET default
R = % Fuel share NG engine = 100% CA-GREET default
S = Engine CO2 emission factor = 56,551 g/MMBTU CA-GREET default
T = % Fuel share NG large turbine = 0% CA-GREET default
U = Turbine CO2 emission factor = 58,179 g/MMBTU CA-GREET default
V = % Fuel share NG Large Boiler = 0% CA-GREET default
W = Large boiler CO2 emission factor = 58,198 g/MMBTU CA-GREET default
X = % Fuel share small NG boiler = 0% CA-GREET default
Y = Small boiler CO2 emission factor = 58,176 g/MMBTU CA-GREET default
Z = WTT stationary NG CO2 emissions = 5,214 g/MMBTU CA-GREET Calculation
AA = Direct Electricity input = 22 BTU/bu (table A-3) CA-GREET default
BB = Electricity feedstock CO2 emissions = 7,755 g/MMBTU CA-GREET Calc

DRAFT – FOR REVIEW
DRAFT 11/30/2010
17
Fuel Relevant Parameters* Reference
CC = Electricity fuel CO2 emissions = 233,154 g/MMBTU CA-GREET Calculation
a The calculations for CH4 and N2O are analogous. b Parameters presented here are calculated in CA-GREET, except for fuel shares, which are direct inputs. VOC, CO, CH4, and N2O emissions are calculated with the same formulas, energy input, and loss factors as CO2 emissions calculations shown in Table A-7, but with different VOC, CO, CH4, and N2O emission factors. Table A-9 presents the calculated CO2-equivalent GHG emissions from VOC, CO, CH4, and N2O in associated with sorghum farming. The sorghum farming emissions are shown on an energy (LHV anhydrous ethanol) basis for dry mill sorghum ethanol production.
Table A-9. GHG Emissions from Sorghum Farming GHG
Species Emissions
(g/bu) Emissions
(gCO2e/MMBTU)a VOC 3.03 46 CO 84.04 636 CH4 3.22 388
N2O 0.01 14
CO2 540 2,601
Total - 3,685 Total GHG (gCO2e/MMBTU) 3,684
Total GHG (gCO2e/MJ) 3.49 a To convert CO2 emissions from (g/bu) to (g/MMBTU), multiply the emissions in (g/bu) by the following factor: 106 / (Ethanol Yield * LHV of Anhydrous Ethanol) where the LHV of Anhydrous Ethanol is 76,330 BTU/gal and the Ethanol Yield is assumed to be 2.72 gal/bu for dry mill ethanol. To convert VOC and CO emissions from (g/bu) to (gCO2e/MMBTU), multiply the emissions in (g/bu) by the following factor: (106 * Carbon Ratio) / (Ethanol Yield * LHV of Anhydrous Ethanol) where the Carbon Ratio is 3.1 for VOC and 1.6 for CO and other terms are the same as above. To convert CH4 and N2O emissions from (g/bu) to (gCO2e/MMBTU), multiply the emissions in (g/bu) by the following factor: (106 * GWP) / (Ethanol Yield * LHV of Anhydrous Ethanol) where GWP is the appropriate Global Warming Potential from Table A.5 and other terms are the same as above.

DRAFT – FOR REVIEW
DRAFT 11/30/2010
18
SECTION 2. CHEMICAL INPUTS FOR AGRICULTURAL CHEMICALS
2.1 Energy Calculations for Production of Chemical Inputs
Chemical inputs, including fertilizer, herbicide and insecticide, are input to CA_GREET on a g-nutrient/bushel basis for fertilizer and a g-product/bushel basis for herbicide and pesticide. Table A-10 presents the USDA3 chemical inputs per bushel of sorghum, the total energy required to produce the chemical product and the calculated upstream energy required to produce a bushel of sorghum using these inputs. Both chemical input values and product energy values are CA-GREET defaults.
3 USDA, 2003, http://www.ers.usda.gov/data/arms/cropoverview.htm.

DRAFT – FOR REVIEW
DRAFT 11/30/2010
19
Table A-10 Sorghum Farming Chemical Input, Product Input Energy, and WTT Energy Per Bushel (BTU/bu) and BTU/MMBTU Anhydrous Ethanol
Chemical Type Chemical
Usage (g/bu)
Input Energy(BTU/g)
WTT Energy
(BTU/bu)a
Dry Mill WTT Energy
(BTU/MMBTU)b
Nitrogen fertilizer 433.1 46.41 20,100 96,813 Phosphate fertilizer 102.3 13.87 1,419 6,834 Potash 16.95 9.02 153 736 Lime 357.6 8.31 2,972 14,315 Herbicide (average) 13.1 275.27 3,606 17,369 Insecticide (average) 13.1 275.27 3,606 17,369 Total 153,436
a WTT Energy = (Chemical Input) * (Product Input Energy). Both are CA-GREET defaults. b Dry Mill WTT Energy = (WTT Energy * 106) / (Ethanol Yield * LHV of Anhydrous Ethanol]) where the LHV of Anhydrous Ethanol is 76,330 BTU/gal and the Ethanol Yield is assumed to be 2.72 gal/bu for dry mill ethanol. CA-GREET treats nitrogen fertilizer as a weighted average of ammonia (70.7%), urea (21.1%) and ammonium nitrate (8.2%) fertilizers. As Table A-10 shows, nitrogen fertilizer input accounts for more than half of total chemical energy input. The input energy for herbicide is a weighted average of four types of commonly used herbicides: atrazine (31.2% usage), metolachlor (28.1%), acetochlor (23.6%) and cyanazine (17.1%). For insecticide, the input energy represents the energy for a hypothetical average insecticide, rather than a calculated weighted average of energy input for specific insecticides. Because the energy required to produce nitrogen fertilizers, herbicides or insecticides does not vary significantly by category, the use of average energy inputs is deemed appropriate. 2.2 GHG Calculation for Production of Chemical Inputs
This calculation accounts for all upstream GHG emissions related to manufacturing agricultural chemical products. Upstream GHG emissions, which includes emissions from the production, processing and transport of product, are calculated in units of grams per ton of product in the Ag Inputs sheet of CA-GREET. These emissions are converted to units of grams per ton of nutrient by dividing by the ratio of nutrient to product. The final calculation step converts energy units to BTU and emissions units to g GHG/ g nutrient for fertilizer and g GHG/g product for herbicide and insecticide. Upstream GHG emissions for nitrogen fertilizer are modeled as a weighted average of emissions from three fertilizers. Average upstream GHG emissions for herbicide are calculated using a weighted average of emissions from four herbicides, and GHG emissions from insecticide production are based on a single insecticide. Table A-11 shows the upstream GHG emissions for agricultural chemicals. The formulas are complex and not shown here since agricultural inputs apply to large variety of crop cultivation and are not specific to sorghum cultivation.

DRAFT – FOR REVIEW
DRAFT 11/30/2010
20
Table A-11. Calculated GHG Emissions Associated
with the Production of Agricultural Chemicals
GHG Species
Nitrogen fertilizera P2O5 K2O CaCO3 Herbicideb Pesticide
g/g nutrient g/g product CH4 0.0021 0.0014 0.0009 0.0008 0.03 0.0307 N2O 0.0016 0 0 0 0 0.0002 CO2 2.3944 0.9864 0.6645 0.6062 20.84 24.1752 Total
(gCO2e/g) 2.9 1.0 0.7 0.6 21.6 25.0 a Upstream GHG emissions for nitrogen fertilizer are modeled as a weighted average of emissions from three nitrogen fertilizers. b Upstream GHG emissions for herbicide are calculated using a weighted average of emissions from four herbicides. In the CA-GREET model, the GHG emission factors of agricultural inputs are multiplied by chemical input factors (in the Ethanol sheet) and a loss factor (from the Ag Inputs sheet) to yield GHG emissions in g/bu of sorghum. Table A-12 shows the calculations for CO2-equivalent emissions associated with the use of chemical inputs. The method for calculating CO2-equivalent GHG emissions from VOC, CO, CH4 and N2O emissions during chemical production is the same as presented above and is not shown. Table A-13 presents values of the factors used in Table A-12.
Table A-12. Calculated CO2 Emission Factors Associated with Production of Agricultural Chemicals
Chemical Product Formula CO2e Emissions
g/bu Dry Mill (g/MMBTU)
Nitrogen fertilizer (A)*(B)*(C) 1,037 4,998 P2O5 (D)*(E)*(F) 101 486 K2O (G)*(H)*(I) 11 54
CaCO3 (J)*(K)*(K) 217 1,045 Herbicide (M)*(N)*(O) 273 1,314 Insecticide (P)*(Q)*(R) 317 1,527
Total - 1,956 9,424 Total (gCO2e/MJ) 8.93

DRAFT – FOR REVIEW
DRAFT 11/30/2010
21
Table A-13. Description and Values of Factors Used in Table A-12 Chemical Product Relevant Parameters Reference
A = Nitrogen input = 433.1 g/bu CA-GREET default
B = Nitrogen chemical cycle emissions = 2.3944 g/g
CA-GREET calculation
C = Nitrogen loss factor = 1.0000a CA-GREET defaultD = P2O5 input = 102.3 g/bu CA-GREET default
E = P2O5 chemical cycle emissions = 0.9864 g/g CA-GREET calculation
F = P2O5 loss factor = 1.0000 a CA-GREET defaultG = K2O input = 17.0 g/bu CA-GREET default
H = K2O chemical cycle emissions = 0.6645 g/g CA-GREET calculation
I = K2O loss factor = 1.0000 a CA-GREET defaultJ = CaCO3 input = 357.6 g/bu CA-GREET default
K = CaCO3 chemical cycle emissions = 0.6062 g/g
CA-GREET calculation
L = CaCO3 loss factor = 1.0000 a CA-GREET defaultM = Herbicide input = 13.12 g/bu CA-GREET default
N = Herbicide chemical cycle emissions = 20.84 g/g
CA-GREET calculation
O = Herbicide loss factor = 1.0 a CA-GREET defaultP = Insecticide input = 13.12 g/bu CA-GREET default
Q = Insecticide chemical cycle emissions = 24.1752 g/g
CA-GREET calculation
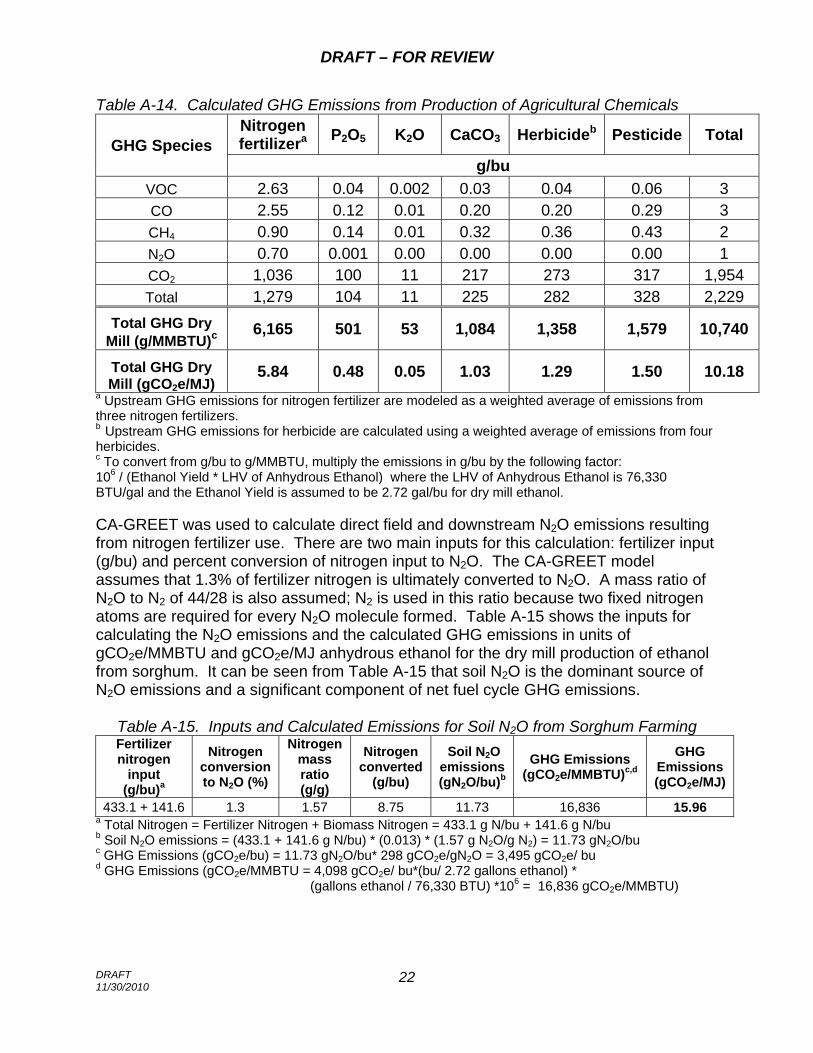
R = Insecticide loss factor = 1.0000 CA-GREET defaulta Loss occurs during transportation due to evaporation, venting, etc. Table A-14 shows the GHG emissions from the production of chemicals used in sorghum farming based on the calculations shown in Table A-12. The upstream GHG emissions associated with the release of VOC, CO, CH4 and N2O during chemical production that are shown in Table A-14 are calculated with the same formula as CO2 emission calculations, except the CO2 emission factor is replaced by an appropriate emission factor. Table A-14 also shows the WTT GHG emissions for dry mill sorghum ethanol.
DRAFT – FOR REVIEW
DRAFT 11/30/2010
22
Table A-14. Calculated GHG Emissions from Production of Agricultural Chemicals
GHG Species Nitrogen fertilizera P2O5 K2O CaCO3 Herbicideb Pesticide Total
g/bu VOC 2.63 0.04 0.002 0.03 0.04 0.06 3 CO 2.55 0.12 0.01 0.20 0.20 0.29 3 CH4 0.90 0.14 0.01 0.32 0.36 0.43 2 N2O 0.70 0.001 0.00 0.00 0.00 0.00 1 CO2 1,036 100 11 217 273 317 1,954 Total 1,279 104 11 225 282 328 2,229
Total GHG Dry Mill (g/MMBTU)c
6,165 501 53 1,084 1,358 1,579 10,740
Total GHG Dry Mill (gCO2e/MJ)
5.84 0.48 0.05 1.03 1.29 1.50 10.18 a Upstream GHG emissions for nitrogen fertilizer are modeled as a weighted average of emissions from three nitrogen fertilizers. b Upstream GHG emissions for herbicide are calculated using a weighted average of emissions from four herbicides. c To convert from g/bu to g/MMBTU, multiply the emissions in g/bu by the following factor: 106 / (Ethanol Yield * LHV of Anhydrous Ethanol) where the LHV of Anhydrous Ethanol is 76,330 BTU/gal and the Ethanol Yield is assumed to be 2.72 gal/bu for dry mill ethanol. CA-GREET was used to calculate direct field and downstream N2O emissions resulting from nitrogen fertilizer use. There are two main inputs for this calculation: fertilizer input (g/bu) and percent conversion of nitrogen input to N2O. The CA-GREET model assumes that 1.3% of fertilizer nitrogen is ultimately converted to N2O. A mass ratio of N2O to N2 of 44/28 is also assumed; N2 is used in this ratio because two fixed nitrogen atoms are required for every N2O molecule formed. Table A-15 shows the inputs for calculating the N2O emissions and the calculated GHG emissions in units of gCO2e/MMBTU and gCO2e/MJ anhydrous ethanol for the dry mill production of ethanol from sorghum. It can be seen from Table A-15 that soil N2O is the dominant source of N2O emissions and a significant component of net fuel cycle GHG emissions.
Table A-15. Inputs and Calculated Emissions for Soil N2O from Sorghum Farming Fertilizer nitrogen
input (g/bu)a
Nitrogen conversion to N2O (%)
Nitrogen mass ratio (g/g)
Nitrogen converted
(g/bu)
Soil N2O emissions(gN2O/bu)b
GHG Emissions (gCO2e/MMBTU)c,d
GHG Emissions(gCO2e/MJ)
433.1 + 141.6 1.3 1.57 8.75 11.73 16,836 15.96 a Total Nitrogen = Fertilizer Nitrogen + Biomass Nitrogen = 433.1 g N/bu + 141.6 g N/bu b Soil N2O emissions = (433.1 + 141.6 g N/bu) * (0.013) * (1.57 g N2O/g N2) = 11.73 gN2O/bu c GHG Emissions (gCO2e/bu) = 11.73 gN2O/bu* 298 gCO2e/gN2O = 3,495 gCO2e/ bu d GHG Emissions (gCO2e/MMBTU = 4,098 gCO2e/ bu*(bu/ 2.72 gallons ethanol) * (gallons ethanol / 76,330 BTU) *106 = 16,836 gCO2e/MMBTU)

DRAFT – FOR REVIEW
DRAFT 11/30/2010
23
The CA-GREET model assumes that all carbon in added lime is fully oxidized to CO2 and that 357.6 g of lime is required for each bushel of sorghum produced. GHG emissions from lime application in sorghum farming are calculated as follows: CO2 emissions = (357.6 gCaCO3/bu) * (44 g CO2/100 g CaCO3) = 157.3 gCO2/bu After converting units, the calculated CO2 emissions of 157.3 gCO2/bu can be shown to equal to 0.72 gCO2e/MJ. The total GHG emissions from agricultural chemical use in dry mill sorghum ethanol production are presented in Table A-16. Emissions from fertilizer, herbicide and pesticide usage from Table A-14 and emissions from soil N2O from Table A-15 are combined with CO2 emissions associated with lime application to yield the total GHG emissions from agricultural chemical use in sorghum farming in Table A-16. Table A-16. Total GHG Emissions from Agricultural Chemical Use in Dry Mill Sorghum
Ethanol Production (g CO2e/MJ)
Fertilizer Herbicide Pesticide Soil N2O CaCO3 Urea Total
GHG Emissions 7.40 1.29 1.50 15.96 0.72 0.19 27.06

DRAFT – FOR REVIEW
DRAFT 11/30/2010
24
SECTION 3. SORGHUM TRANSPORT
3.1 Energy for Sorghum Transportation
Transport of sorghum from the field to stack and from the stack to the ethanol plant is accomplished entirely by diesel trucks. To calculate the total energy needed to transport sorghum, the CA-GREET model assumes that medium duty trucks are used for transport from the field to the sorghum stack and that heavy duty trucks are used for transport from the stack to the fuel production facility using heavy duty trucks. The assumed sorghum transportation distance and energy inputs are provided in Table A-17; all values are CA-GREET defaults. Capacities of medium and heavy duty trucks are assumed to be 8 tons and 15 tons, respectively. The default transport distance from the field to the stack is assumed to be 10 miles and the distance from the stack to the ethanol plant is assumed to be 40 miles. CA-GREET calculates the diesel energy per ton-mile based on the cargo capacity of the truck and the truck’s fuel economy. It is also assumed that empty trucks returning from delivery use the same energy as loaded trucks.
Table A-17. Assumptions for Calculating Energy Use for Sorghum Transport
Transport Mode Energy
intensity (BTU/ton-mile)
Distance (mi)
Truck capacity
(tons)
Fuel economy (mi/gal)
Energy consumption
of Truck (BTU/mi)
Diesel fuel
fraction (%)
Field to stack by medium duty truck 2,199 10 8 7.3 17,596 100
Stack to plant by heavy duty truck 1,713 40 15 5 25,690 100
The calculated sorghum transport energy on a BTU per ton and BTU per bushel of sorghum basis is shown in Table A-18.

DRAFT – FOR REVIEW
DRAFT 11/30/2010
25
Table A-18. Calculated Sorghum Transport Energy
Transport Mode Transport
energy (BTU/ton)
Transport energy (BTU/bu)a
Field to stack by medium duty truck 51,924b (51,924 BTU/ton)* (56 lbs/bu) / (2,000 lbs/ton) = 1,454
Stack to plant by heavy duty truck 161,727c (161,727 BTU/ton) * (56 lbs/bu) / (2,000 lbs/ton) = 4,528
Total 213,651 5,982
Total - 28,814 BTU/MMBTUd a One bushel of sorghum weighs 56 pounds. b For medium duty truck: (10 miles one-way distance) * (2,199 BTU/ton-mile origin to destination + 2,199 BTU/ton-mile return trip) * (Diesel share 100%) * (1 + Diesel WTT Energy 0.180 BTU/BTU) = 51,924 BTU/ton c For heavy duty truck: (40 miles one-way distance) * (1,713 BTU/ton-mile origin to destination + 1,713 BTU/ton-mile return trip) * (Diesel share 100%) * (1 + Diesel WTT Energy 0.180 BTU/BTU) = 161,727 BTU/ton d (5,982 BTU/bu) * (bu / 2.72 gal) * (gal / 76,330 BTU) *106 = 28,814 BTU/MMBTU 3.2 GHG Emissions Calculations from Sorghum Transportation
GHG emissions from sorghum transportation are calculated using the same assumptions about transportation mode, distance traveled, truck capacity, truck fuel economy and fuel type presented in Table A-17. Again, all values used in these calculations are CA-GREET default values. Table A-19 present the assumptions used to calculate GHG emissions from sorghum transport to dry mills and calculated GHG emissions from sorghum transport are presented in Table A-20.
Table A-19. Assumptions for Calculating GHG Emissions from Sorghum Transport
Transport mode
Energy Intensity
(BTU/ton-mile) Distance
(mi)
CO2 Emission Factors of
Truck (g/mi)
CO2 Emission Factors of
Diesel used as transportation fuel (g/MMBTU)
CO2 Emission Factors of
Diesel Combustion(g/MMBTU)
Field to stack by medium duty truck
2,199 10 1,371 14,625 77,912 (77,890) a
Stack to plant by heavy duty truck
1,713 40 1,999 (2,002)a 14,625 77,809
(77,912) a
a Values in parentheses are for return trips.

DRAFT – FOR REVIEW
DRAFT 11/30/2010
26
Table A-20. Calculated GHG Emissions from Sorghum Transport
Transport Mode CO2 Emissions(g/ton)
CO2 Emissions(g/bu)
CO2 Emissions(g/MMBTU)
Field to stack by medium duty truck 4,070a 114 549b Stack to plant by heavy duty truck 12,672 355 1,709
Total 16,742 469 2,258
Total (gCO2/MJ) - - 2.14
aExample calculation of CO2 emissions from medium duty truck: Departing trip: [((77,912 gCO2/MMBTU) + (14,625 gCO2/MMBTU) * (100% diesel used)) * 2,199 (BTU/ton- mile)] *10 miles / (106 MMBTU/BTU) = 2035 gCO2/ton For Returning trip: [((77,890 g/MMBTU) + (14,625 g/MMBTU) * (100% diesel used)) * 2,199 (BTU/ton-mile)] *10 miles / (106 MMBTU/BTU) = 2035 gCO2/ton Medium duty truck total: =(2035 gCO2/ton) + (2035 gCO2/ton) = 4,070 gCO2/ton b(4,070 g/ton / 2,000 lbs/ton) * (56 lbs/bushel) = 114 g/bushel [(114 g/bushel) / ((2.72 gal/bushel) * (76,330 BTU/gal))] * (106 MMBTU/BTU) = 549 g/MMBTU
Emissions of CH4, N2O, VOC, and CO are calculated using the same methods and assumptions as the CO2 emissions calculations, but with different emission factors for each species. These calculated non-CO2 GHG emissions are shown in Table A-21. Table A-22 presents these emissions as CO2-equivalent GHG emissions after the application of appropriate global warming potentials and carbon ratios.
Table A-21. Non-CO2 GHG Emissions from Sorghum Transport
Transport Mode CH4 (g/MMBTU)
N2O (g/MMBTU)
VOC (g/MMBTU)
CO (g/MMBTU)
Field to stack by medium duty truck 0.60 0.02 0.26 0.80
Stack to plant by heavy duty truck 1.87 0.04 0.71 3.18
Total 2.47 0.06 0.97 3.97

DRAFT – FOR REVIEW
DRAFT 11/30/2010
27
Table A-22. Non-CO2 GHG Emissions from Sorghum Transport
Transport Mode CH4 N2O VOC
and CO CO2 Total GHG
Total GHG
(gCO2e/MMBTU) (g CO2e/MJ)Field to stack by medium duty truck 15.05 5.41 2.07 549 571 0.54
Stack to plant by heavy duty truck 46.78 12.47 7.20 1,709 1,775 1.68
Total 61.83 17.87 9.27 2,258 2,347 2.22

DRAFT – FOR REVIEW
DRAFT 11/30/2010
28
SECTION 4. ETHANOL PRODUCTION
4.1 Ethanol Production
As for the sorghum farming energy calculations, CA-GREET uses energy input values and fuel shares to calculate direct energy input for for dry mill sorghum ethanol in BTU/gallon of anhydrous ethanol and uses fuel shares to allocate this direct energy input to process fuels. For this document, the energy used and the GHG emissions emitted from the production of sorghum-derived ethanol are assumed to be equal to those for producing corn-derived ethanol4. For the fuels used in dry mill ethanol production, Table A-23 shows the share of each fuel used and the energy input per gallon of anhydrous ethanol product. For dry mill ethanol production, electricity consumption is 1.08 kWh/gal (3,670 BTU/gal). Wet mill ethanol plants that produce WDGS as the co-product require less energy and have lower GHG emissions per gallon of product.
Table A-23. Share of Fuel and Primary Energy Input by Fuel Type for Dry Mill Sorghum Ethanol Production
Fuel Fuel share (%)
Primary energy input (BTU/gal)
Natural gas 89.8 32,330 Electricity 10.2 3,670
Total 100 36,000
CA-GREET uses the direct, primary energy inputs for ethanol production to calculate the total energy required to deliver each primary energy input. Table A-24 shows the CA-GREET formulas and parameters used to calculate energy usage by fuel type for dry mill sorghum ethanol production. The energy per gallon of ethanol produced for each fuel type is also presented in this table.
4 See LCFS corn ethanol pathway document at www.arb.ca.gov/fuels/lcfs/022709lcfs_cornetoh.pdf

DRAFT – FOR REVIEW
DRAFT 11/30/2010
29
Table A-24. Calculation of Total Energy Input for Dry Mill Sorghum Ethanol Production
Fuel Type Formula Relevant Parameters Energy Input
(BTU/gal)
Natural gas (Direct NG input)* (1+ (NG Stationary energy) / 106)
Direct NG input = 32,330 BTU/gal NG Stationary energy = 70,154 MMBTU
34,598
Electricity
(Direct electricity input)*((Stationary electricity feedstock stage energy)*(Stationary electricity fuel stage energy))/106
Direct electricity input = 3,670 BTU/gal Stationary electricity feedstock stage energy = 99,970 BTU/MMBTU Stationary electricity fuel stage energy = 2,887,173 BTU/MMBTU
10,926
Ethanol 76,330 * (1 / 0.524 - 1) - 63,983
Total - - 109,507
Total (BTU/MMBTU) - - 1,434,648a
a (109,507 BTU/gal) / (76,330 BTU/gal ) * 106 = 1,434,648 BTU/MMBTU 4.2 GHG Emissions from Ethanol Production
GHG emissions from dry mill ethanol production are calculated using the assumptions presented in Table A-25; the values in this table are CA-GREET defaults. In the Midwest, natural gas is commonly used as the fuel for both large and small boilers during dry mill ethanol production from sorghum. These boilers use 89.8% of the total plant energy. Electricity is used for all other the processes and contributes about 10.2% of the total input energy. The direct energy input for each fuel used is calculated by multiplying the total process input energy of 36,000 BTU/gal by the fractional fuel share.

DRAFT – FOR REVIEW
DRAFT 11/30/2010
30
Table A-25. Process Shares and GHG Emission Factors (EF) For Dry Mill Sorghum Ethanol Production Equipment
Production Equipment and
Fuel Used
Equipment usage
(%) CO2 EF
(g/MMBTU) VOC EF CO EF CH4
EF Fuel
share (%)
Energy input
(BTU/gal)
Natural gas large industrial boiler (>100 MMBTU/hr )
50 58,198 1.557 16.419 1.1
89.8 32,330 Natural gas small industrial boiler (10-100 MMBTU/hr)
50 58,176 2.417 28.822 1.1
Electricity at user sites (as Feedstock) 7,755
10.2 3,670 Electricity (as Fuels) 233,154 Calculated GHG emissions from ethanol production are shown in Table A-26. These emissions include direct CO2 emissions from natural gas combustion in boilers, natural gas WTT GHG emissions, and fuel cycle electricity GHG emissions assuming a Midwest electricity generation mix. All values are CA-GREET defaults unless explicitly indicated.

DRAFT – FOR REVIEW
DRAFT 11/30/2010
31
Table A-26. Calculated GHG Emissions for Dry Mill Sorghum Ethanol Production
Calculations CO2 in g/gal a Conversion to CO2e g/MMBTU Results
Natural Gas large industrial boiler
32,330*50%*58,198/106 = 940.7
2,051
(2,051 g/gal) /(76,330 BTU/gal)*106 *1.001 = 26,892 (where 1.001 is loss factor of ethanol)
26,880 small industrial boiler
32,330*50%*58,176/106 = 940.4
WTT NG 32,330*5,245/106 = 170.0
Electricity As feedstock 3,670*7,794/106 = 29
884 (884 g/gal) /(76,330 BTU/gal)*106 *1.001 = 11,591
11,591 As fuel 3,670*233,154/106 =
856
VOCa (Direct Energy use of NG and electricity)* VOC EF
0.354 (0.354 g/gal)* (0.85/0.27)/77,254*106*1.001
14
COa (Direct Energy Use of NG and electricity)* CO EF
1.908 (1.908 g/gal)* (0.43/0.27)/77,254*106 *1.001
39
CH4a
(Direct Energy Use of NG and electricity)* CH4 EF
5.366 (5.366 g/gal)*25 /77,254*106 1,758
N2Oa (Direct Energy Use of NG and electricity)* N2O EF
0.026 (0.026 g/gal)*298 /77,254*106 100
Total GHGs (gCO2e/MMBTU) 40,383 Total GHGs (gCO2e/MJ) 38.33
a Similar calculations for these emissions are shown in this example: VOC from NG boilers: 32,330*50%*(1.557+2.417+6.284) = 0.354 g/gal Direct NG input: 32,330 (table 4.01) % shares of each boiler: 50% (table 4.03) VOC EF of two kinds of boilers (table 4.03): 1.557 and 2.417 g/MMBTU VOC EF of NG as stationary fuel: 6.284 g/MMBTU Ethanol plants that sell their DGS co-product in the wet form use less natural gas per gallon of ethanol produced than those that dry their DGS co-products using natural gas. The total natural gas energy required for ethanol production is 22,430 BTU/gal for wet DGS producing plants compared to 32,330 BTU/gal for dry DGS producing plants. Using this lower natural gas energy value and the same value as dry DGS producing plants for electricity usage (3,670 BTU/gal), total GHG emissions for plants producing 100% wet DGS are calculated to be 30.47 gCO2e/MJ. GHG emissions from plants producing 100% dry DGS and 100% wet DGS are compared in Table A-27.

DRAFT – FOR REVIEW
DRAFT 11/30/2010
32
Table A-27. Calculated GHG Emissions from Ethanol Plants
Producing 100% Dry DGS and 100% Wet DGS Type of Ethanol Plant
GHG Emissions (g CO2e/MJ)
100% Dry DGS 38.33 100% Wet DGS 30.47
Detailed descriptions of GHG emission facvtors associated with natural gas and coal use are shown in Tables A-28 through A-33.
Table A-28. Details of GHG Emission Factors for Natural Gas and Electricity Presented in Table A-25
Fuel Formulas Calculations Result (g/MMBTU)
NG
(NG Density/(NG LHV) * (106
*Carbon ratio of NG) - (VOC Emission Factor of the large boiler * Carbon ratio of VOC) +(CO Emission Factor of the large boiler*Carbon Ratio of CO) +CH4 Emission Factor of the large boiler * Carbon Ratio of CH4 )] / Carbon ration of CO2
[((20.4 g/SCF) / (930 BTU/SCF)) * (106 * 0.724) – ((1.757 * 0.85) + (16.419 * 0.43) + (1.1 * 0.75))] / 0.27
58,198
(NG Density / (NG LHV) */(106
*Carbon ratio of NG) -[(VOC Emission Factor of the small boiler * Carbon ratio of VOC) + (CO Emission Factor of the small boiler * Carbon Ratio of CO) + (CH4 Emission Factor of the small boiler * Carbon Ratio of CH4 )] / Carbon ratio of CO2
[((20.4 g/SCF) / (930 BTU/SCF)) * (106 * 0.724) – ((2.417 * 0.85) + (28.822 * 0.43) + (1.1 * 0.75))] / 0.27
58,176
Electricity As Feedstock (for details, see Table A-31) 7,755
As Fuel (See Table A-32) (for details, see Table A-34) 233,154

DRAFT – FOR REVIEW
DRAFT 11/30/2010
33
Table A-29. Detailed CO2 Emissions from Feedstock Consumption Contributions for Electricity Shown in Tables A-29 and A-32
Feedstock As Fuel
Direct Input from fuels
(UNITS) Calculation
GHG Emissions
(gCO2/MMBTU) Natural gas 935,557 935,557 * (D) / 106 4,820 Coal 1,646,650 1,646,650 * (E) / 106 2,404
Biomass (farmed trees) 195,568
195,568 * (F + G + H + I + J + K + L + M) / N *
100% 483
VOC conversion a 18.9 18.9 * 0.85 / 0.27 59 CO conversion a 17.7 17.7 * 0.23 / 0.27 28 Total - - 7,755
a See Table A-5 for VOC and CO conversion factors. Table A-30. Calculations of Direct Energy Inputs of Fuels for Electricity Generation
Fuel Fuel
share (%)
Formula for Plant Efficiencya
Calculation
Direct Energy Input
(BTU/MMBTU)
Natural gas 33.5
106 / (Residual NG Power Plant Efficiency) / (1-Transmission Loss) * (Fuel Share for Stationary Applications)
106 / 0.39 / (1 – 0.081) * 0.335
935,557
Coal 51.6
106 / (Residual Coal Power Plant Efficiency) / (1-Transmission Loss) * (Fuel Share for Stationary Applications)
106 / 0.341 / (1 - 0.081) * 0.516
1,646,650
Biomass 1.3
106 / (Residual Biomass Power Plant Efficiency) / (1-Transmission Loss) * (Fuel Share for Stationary Applications)
106 / 0.321 / (1 – 0.081) * 0.013
195,568
Others 9.1
106 / (Residual Power Plant Efficiency) / (1-Transmission Loss) * (Fuel Share for Stationary Applications)
106/100%/(1-8.1%)* 9.1%
99,397
a Process Efficiency in CA-GREET is defined as: (Energy in output product) / [(Energy of input material + Energy consumed to produce product)]

DRAFT – FOR REVIEW
DRAFT 11/30/2010
34
Table A-31. Descriptions and Values of Factors Presented in Table A-29 Factor Value Description
A 5,445 CO2 from crude consumed (g/MMBTU), see Table A-6) B 1.0000 Loss factor of crude used, CA-GREET default) C 5,678 CO2 from residual oil consumed (g/MMBTU), see Table A-6
D 5,153 CO2 from natural gas consumed for power generation (g/MMBTU), CA-GREET calculation
E 1,460 CO2 from coal consumed for power generation (g/MMBTU), CA-GREET calculation
F 23,628 CO2 from farmed trees (g/dry ton), CA-GREET calculation
G 1,957 CO2 from nitrogen used for tree fertilizer (g/dry ton), CA-GREET calculation
H 193 CO2 from P2O5 used for tree fertilizer (g/dry ton), CA-GREET calculation
I 232 CO2 from K2O used for tree fertilizer (g/dry ton) CA-GREET calculation
J 516 CO2 from herbicide (g/dry ton), CA-GREET calculation K 50 CO2 from insecticide (g/dry ton), CA-GREET calculation
L 14,957 CO2 from farmed tree transportation (g/dry ton), CA-GREET calculation
M 0 CO2 from farmed tree farming land use change (g/dry ton) N 1,681,100 Farmed tree LHV (BTU/ton)

DRAFT – FOR REVIEW
DRAFT 11/30/2010
35
Table A-32. Detailed CO2 Emissions from Fuel Consumption Contributions for Electricity Generation Shown in Table A-29a
Power Plants Types
CA-GREET calculated CO2
EF of Stationary Use
Power Plant Emissions (g/KWh)
Calculations Conversion to
CO2e gCO2/MMBT
U
Biomass-Fired
(1,087 – 1,087) * 5.8% = 0
730/(1-8.1%) = 794 (794*106/3412) 232,824
NG-Fired 510*33.5% = 171
Coal-Fired 1084*51.6%= 559.3
Total 730
VOC 0.02/(1-8.1%) = 0.02
(0.02*106/3412)*0.85/0.27 14.7
CO 0.63/(1-8.1%) = 0.68
(0.63*106/3412)*0.23/0.27 315.2
Total 233,154 aTo calculate CO2 emissions: CO2 emission from power plant + VOC and CO emissions conversion from power plant, where: CO2 from power plant = (Specific Power Plant Emission Factor)* % of generation mix/(1- % assumed loss in transmission)/106, then convert from g/kWh to gCO2e/MMBTU by multiplying g/kWhr by (106/3412). Biomass has zero net CO2 emissions because all CO2 emissions are biogenic and climate neutral.
Table A-33. Power Plant Equipment Used in Table A-32
Description Combustion Shares
Power Plant Energy
Conversion Efficiencies by
CA-GREET default
Emission Factor
(gCO2/MMBTU) by CA-GREET
default
g/kWh
Natural Gas, large turbinea 20% 34.8% 58,198 114
Natural Gas, simple-cycle gas turbineb 36% 31.5% 58,179 227
Natural Gas, combined-cycle gas turbinec 44% 51.8% 58,171 172
Coal, utility Boilerd 100% 34.1% 137,356 697 Biomass, utility boilere 100% 32.1% 102,224 1,087
a NG large turbine: (20%*58,198/34.8%)/106*3412 = 114 g/KWh b NGsimple-cycle gas turbine: (36%*58,179/31.5%)/106*3412 = 227 g/KWh c NGcombined-cycle gas turbine: (44%*58,171/51.8%)/106*3412 = 172 g/KWh d Coal-fired Plant: (100%*137,356/34.1%)/106*3412 = 697 g/KWh e Biomass Plant: (100%*102,224/32.1%)/106*3412 = 1,087 g/KWh

DRAFT – FOR REVIEW
DRAFT 11/30/2010
36
SECTION 5. ETHANOL TRANSPORT AND DISTRIBUTION
5.1 Energy for Ethanol Transportation and Distribution
Once ethanol is produced, it is transported to California where it is blended with gasoline to make reformulated gasoline (RFG). The RFG is then delivered to local fueling stations for use in passenger vehicles. Transport of ethanol from the production plant to a California blending terminal is accomplished primarily by rail, with some transport by heavy duty diesel truck. Transport of RFG from a blending terminal to a fueling station is accomplished by heavy duty diesel truck. Based on AB1007 analyses, the distance for ethanol transport by rail is typically 1,400 miles and the total distance for ethanol transport by heavy duty truck is 40 miles. The estimated distance for trucking RFG to a fueling station is 50 miles. Instead of calculating the WTT values on a per ton basis as for the sorghum transport component, CA-GREET calculates WTT energy required per MMBTU of fuel (anhydrous ethanol) transported. Table A-34 below shows the major inputs used in calculating transport energy and Table A-35 presents the CA-GREET formulas used to calculate the ethanol transport energy for each transport mode.

DRAFT – FOR REVIEW
DRAFT 11/30/2010
37
Table A-34. Inputs and Calculated Fuel Cycle Energy Requirements for Ethanol Transport to Bulk Terminals
Transport Mode
Energy Intensity
(BTU/ton-mile) Distance
(mi) Truck
Capacity (tons)
Fuel Economy(mi/gal)
Energy Used by
Truck (BTU/mi)
Diesel share
(%)
Fuel Transported
(%)
Plant to blending terminal by heavy duty Truck
1,028 40 25 5.0 25,690 100 70
Plant to blending terminal by rail 370 1,400 n/a n/a n/a 100 100
Blending terminal to fueling station by heavy duty truck
1,028 50 25 5.0 25,690 100 100
Table A-35. CA-GREET Calculations for Ethanol Transport Energy (BTU/MMBTU Anhydrous Ethanol) by Transport Modea Transport
Mode CA-GREET Formula Relevant Parameters BTU/MMBTU
Transport By HDD Truck
[(106/76,330)*(2,988/(454*2000)))*(40*1028*2)*(100%)*(1+0.185) b
76,330 BTU/gal = Ethanol Low Heating Value 2,988 g/gal= Ethanol density 40 = Miles traveled for ethanol transportation Energy intensity = 2*(1,028 BTU/ton-mile) both ways 100% = %Diesel Share 0.185 BTU/BTU = Diesel energy
4,201
Transport Rail
[(106/76330)*(2,988/(454*2000)))*(1400*370)*(100%)*(1+0.185)
1,400= Miles traveled 370 BTU/ton-mile = rail energy intensity =
26,474
Transport Total
(70%)(4,201 BTU/MMBTU) +(100%)(26,474 BTU/MMBTU)
70% = % Fuel transported by truck 100% = % Fuel transported by rail
29,415
Distribution By HDD truck
[(106/76330)*(2,988/(454*2000)))*(50*1028*2)*(100%)*(1+0.185) b
50 = Miles traveled for ethanol distribution
5,252
T&D Total (BTU/MMBTU) 34,667 a Well-to-tank T&D energy on an anhydrous ethanol basis. b Note that the energy intensity for heavy duty trucks is multiplied by 2 to account for return trip.

DRAFT – FOR REVIEW
DRAFT 11/30/2010
38
5.2 GHG Calculations from Ethanol Transportation and Distribution
Similar to sorghum T&D, ethanol T&D to bulk terminal is assumed in CA-GREET by rail cars and then to destination by truck. All the key assumptions are the same as for sorghum T&D and are shown in Table A-35. Table A-36 Key Assumptions in Calculating GHG Emissions from EtOH Transportation for Dry and Wet Mills a
Transport Mode 1-way Energy Intensity (BTU/ton-mile)
Distance from Origin to Destination (mi)
CO2 Emission Factors (g/mi)
CO2 Emission Factors of Diesel used as transportation fuel (g/MMBTU)
CO2 Emission Factors of Diesel Combustion (g/MMBTU)
100% Rail 370 1,400 14,931 77,664
70% Heavy Duty Truck 1,713 40 1,999 14,931 77,809
100% Heavy Duty Truck 1,713 50 1,999 14,931 77,809
a Assumed all locomotives use diesel The results are shown in Table A-36. The WTT emissions shown in the Table for each GHG species is calculated in the T&D tab of CA-GREET. The equation for CO2 from rail is shown below and the calculations for the other transport modes and GHG gases are done similarly. Only one-way rail emissions are counted, whereas an extra term exists in the calculation for truck transport to account for the return truck trip; emissions from the return trip are assumed to be equal to emissions for the trip from the origin to destination.

DRAFT – FOR REVIEW
DRAFT 11/30/2010
39
Table A-37. EtOH Transport - CO2e Emissions in g/MMBTU for Dry and Wet Mill
Transport Mode
CO2 Emission (g/MMBTU anhydrous)
CH4 to CO2e
(g/MMBTU anhydrous)
N2O to CO2e
(g/MMBTU anhydrous)
CO2e (g/MMBTU anhydrous)
Transported by Rail 2,068 a 2.33 58.3 0.048 14.5 2,141
Transported by Heavy Duty Truck
230 0.25 6.3 0.006 1.7 238
Distributed by Heavy Duty Truck
411 0.45 11.3 0.01 3.0 425
Total 2,709 76 19 2,804 VOC and CO Emissions (gCO2e/MJ) 0.01 Total (gCO2e/MJ) 2.63
a Rail CO2 emissions = (Ethanol density 2,988 g/gal)/(Ethanol LHV 76,330 BTU/gal)/[(454 g/lb)*(2,000 lbs/ton)]*[(Diesel emission factor 77,664 g/BTU)+(Diesel WTT emissions 14,931 g/MMBTU)]*(370 BTU/ton-mile) = 2,068 g/MMBTU ethanol.

DRAFT – FOR REVIEW
DRAFT 11/30/2010
40
SECTION 6. CO-PRODUCTS CREDITS
6.1 Energy Credit for Ethanol Co-Products
Ethanol production pathways result in a variety of co-products. In general, all fermentation approaches result in solids from spent yeast organisms and unfermentable solids. In addition, sorghum ethanol and other starch-based crops contain a significant oil and protein fraction, which are converted to a variety of food and animal feed products. The typical co-products for sorghum ethanol are shown below in Table A-38. Ethanol produced using the dry-milling process results in solid and liquid co-products—distillers grains and thin stillage—which are generally mixed together and sold as animal feed, most commonly without drying the mixture to produce WDGS.
Table A-38. Co-Products Generated for Sorghum Ethanol Production Process Feedstock Co-Products
Dry mill Sorghum Wet or dry distillers grains and solubles (DGS) The default CA-GREET configuration uses the displacement method to calculate energy and emission credits based on co-product displacement ratios. For this document, a 1 lb of DDGS (or WDGS) replacing 1 lb of feed corn has been used for dry mill co-product. This is to be consistent with an analysis being conducted for Land Use Change using the GTAP model from Purdue5. This treatment is different from the Argonne model which provides some credit to other products being replaced. Table A-39 shows the important parameters, formulas and values for dry mill co-products. 5 https://www.gtap.agecon.purdue.edu/

DRAFT – FOR REVIEW
DRAFT 11/30/2010
41
Table A-39. CA-GREET Input Parameters, Formulas and Values for Dry Mill Sorghum Ethanol Co-Products a
Parameter Formula Parameters Value Reference
DGS yield (dry lbs/gal anhydrous EtOH)
(44.658-11.083*2.72)/2.72
44.658 lbs/bu EtOH 11.08 lbs/gal DGS 2.72 gal.bu EtOH yield
5.34 (CA-GREET default)
CA-GREET Default
Total feed corn displaced (lb/gal an. EtOH)1
(DGS yield lbs/gal)*(1.0)
DGS yield = 5.34 lbs/gal (CA-GREET default)
5.34
CA-GREET Default
Existing feed corn displacement (excludes new markets) (lb/gal an. EtOH)
(Total feed corn displaced lbs/gal)*(1-(% Co-products for new demand))
Total feed corn displaced = 5.34 lbs/gal % Co-products for new demand = 0.0%
-5.335 CA-GREET Calculation
N in urea displacement (lb/gal)
((CGM yield lbs/gal)*(CGM/nitrogen in urea displacement ratio lb/lb)+(CGF yield lbs/gal)*(CGF/nitrogen in urea displacement ratio lb/lb))*(1-(% Co-products for new demand))
CGM yield = 0.992 lbs/gal CGM/nitrogen in urea displacement ratio = 0.023 lb/lb CGF yield = 4.275 lbs/gal CGF/nitrogen in urea displacement ratio = 0.015 lb/lb % Co-products for new demand = 0%
-0.088
Soy Oil displacement (lb/gal)
(Sorghum Oil Yield lb/gal) Sorghum oil yield = 0.794 lb/gal -0.794
a All values and formula are CA-GREET default The parameters in the previous table are used to calculate the energy and emission credits on a BTU/gal and g/gal basis, respectively. The co-product energy credit calculations are shown below in Table A-40.
DRAFT – FOR REVIEW
DRAFT 11/30/2010
42
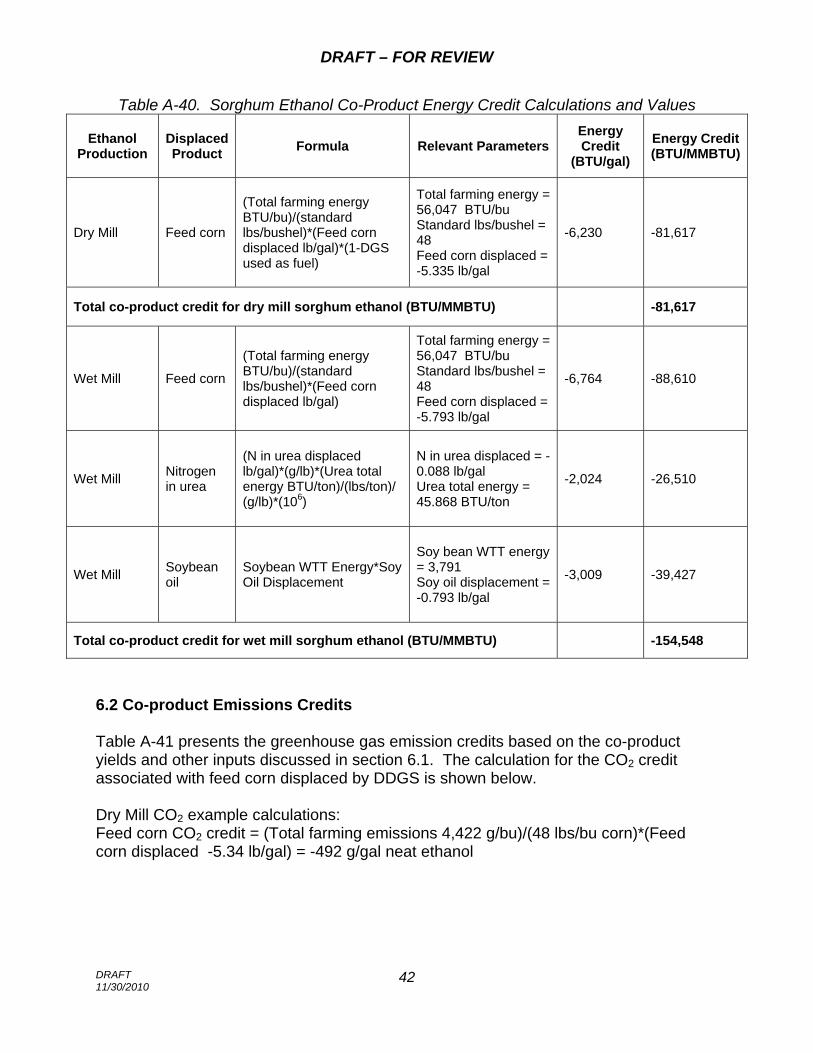
Table A-40. Sorghum Ethanol Co-Product Energy Credit Calculations and Values
Ethanol Production
Displaced Product Formula Relevant Parameters
Energy Credit
(BTU/gal) Energy Credit (BTU/MMBTU)
Dry Mill Feed corn
(Total farming energy BTU/bu)/(standard lbs/bushel)*(Feed corn displaced lb/gal)*(1-DGS used as fuel)
Total farming energy = 56,047 BTU/bu Standard lbs/bushel = 48 Feed corn displaced = -5.335 lb/gal
-6,230 -81,617
Total co-product credit for dry mill sorghum ethanol (BTU/MMBTU) -81,617
Wet Mill Feed corn
(Total farming energy BTU/bu)/(standard lbs/bushel)*(Feed corn displaced lb/gal)
Total farming energy = 56,047 BTU/bu Standard lbs/bushel = 48 Feed corn displaced = -5.793 lb/gal
-6,764 -88,610
Wet Mill Nitrogen in urea
(N in urea displaced lb/gal)*(g/lb)*(Urea total energy BTU/ton)/(lbs/ton)/ (g/lb)*(106)
N in urea displaced = -0.088 lb/gal Urea total energy = 45.868 BTU/ton
-2,024 -26,510
Wet Mill Soybean oil
Soybean WTT Energy*Soy Oil Displacement
Soy bean WTT energy = 3,791 Soy oil displacement = -0.793 lb/gal
-3,009 -39,427
Total co-product credit for wet mill sorghum ethanol (BTU/MMBTU) -154,548
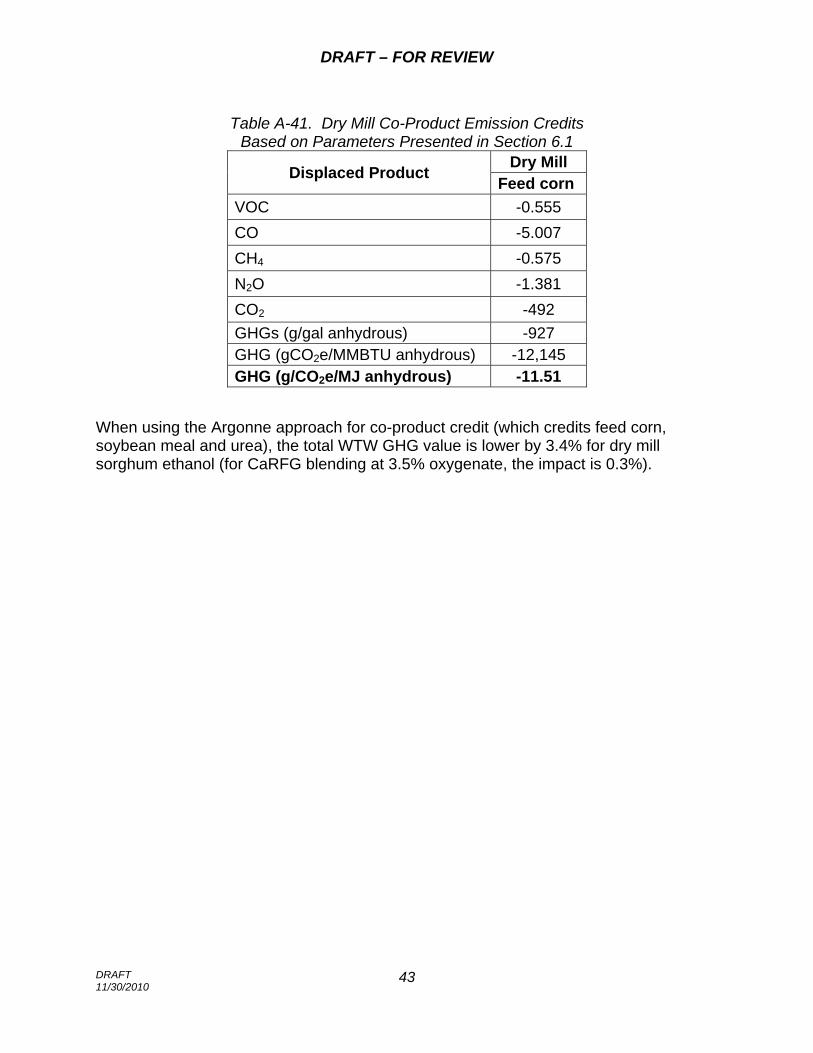
6.2 Co-product Emissions Credits
Table A-41 presents the greenhouse gas emission credits based on the co-product yields and other inputs discussed in section 6.1. The calculation for the CO2 credit associated with feed corn displaced by DDGS is shown below. Dry Mill CO2 example calculations: Feed corn CO2 credit = (Total farming emissions 4,422 g/bu)/(48 lbs/bu corn)*(Feed corn displaced -5.34 lb/gal) = -492 g/gal neat ethanol
DRAFT – FOR REVIEW
DRAFT 11/30/2010
43
Table A-41. Dry Mill Co-Product Emission Credits
Based on Parameters Presented in Section 6.1
Displaced Product Dry Mill Feed corn
VOC -0.555 CO -5.007 CH4 -0.575 N2O -1.381 CO2 -492 GHGs (g/gal anhydrous) -927 GHG (gCO2e/MMBTU anhydrous) -12,145 GHG (g/CO2e/MJ anhydrous) -11.51
When using the Argonne approach for co-product credit (which credits feed corn, soybean meal and urea), the total WTW GHG value is lower by 3.4% for dry mill sorghum ethanol (for CaRFG blending at 3.5% oxygenate, the impact is 0.3%).

DRAFT – FOR REVIEW
DRAFT 11/30/2010
44
APPENDIX B
ETHANOL PATHWAY INPUT VALUES (FROM MIDWEST SORGHUM)

DRAFT – FOR REVIEW
DRAFT 11/30/2010
45
Ethanol made in Midwest from Midwest sorghum and transported to California for blending
Parameters Units Values Note
GHG Equivalent CO2 1 CH4 25 N2O 298 VOC 3.1 CO 1.6 Sorghum Farming Fuel Use Shares Diesel 45.2% Gasoline 18.2% Natural Gas 14.5% LPG 16.8% Electricity 5.3% Cultivation Equipment Shares Diesel Farming Tractor 80% CO2 Emission Factor g/MMBTU 77,204 Diesel Engine 20% CO2 Emission Factor g/MMBTU 77,349 Gasoline Farming Tractor 80% CO2 Emission Factor g/MMBTU 49,494 NG Engine 100% CO2 Emission Factor g/MMBTU 56,551 LPG Commercial Boiler 100% CO2 Emission Factor g/MMBTU 68,036 Sorghum Farming Sorghum energy use BTU/bu 12,635 Sorghum harvest lbs/bu 56 Shelled Sorghum bu/acre 158 Land Use from Sorghum farming g/bu 195 Sorghum T&D Transported from Sorghum Field to Stack by medium truck miles 10 2,199 BTU/mile-ton Energy Intensity fuel consumption mi/gal 7.3 capacity 8 tons/trip CO2 emission factor g/mi 1,369 Transported from Stack to EtOH Plant by heavy duty diesel truck miles 40 1,713 BTU/mile-ton Energy Intensity fuel consumption mi/gal 5 capacity 15 tons/trip CO2 emission factor g/mi 1,999 Chemicals Inputs Nitrogen g/bu 531.4 NH3 Production Efficiency 82.4% Shares in Nitrogen Production 70.7% CO2 Emission Factor g/g 2.475 Urea Production Efficiency 46.7%

DRAFT – FOR REVIEW
DRAFT 11/30/2010
46
Parameters Units Values Note
Shares in Nitrogen Production 21.1% Ammonium Nitrate Production Efficiency 35% Shares in Nitrogen Production 8% P2O5 g/bu 209.9 H3PO4 Feedstock input tons n/a H2SO4 Feedstock input tons 2.674 Phosphor Rock Feedstock input tons 3.525 K2O g/bu 177 CaCO3 g/bu 357.6 Herbicide g/bu 13.1 Pesticide g/bu 13.1 Land Use g/bu 529 CO2 from CaCO3 use Co-Product Credit Sorghum Gluten Meal Yield gal/bu 2.6 Sorghum Gluten Feed Yield lb/bu 11.2 Soy Oil Yield lb/bu 2.08 EtOH Production Dry mill (shares of total) 80% Dry EtOH Yield gal/bu 2.8 Energy use for Dry Mill EtOH BTU/gal 36,000 NG used for dry mill 92.7% Large NG Boiler g/MMBTU 58,198 50% usage Small NG Boiler g/MMBTU 58,176 50% usage Electricity used for dry mill 7.3% Wet mill (shares of total) 20% Wet EtOH Yield gal/bu 2.62 Energy use for Wet Mill EtOH 45,970 NG used for wet mill 60% Large NG Boiler g/MMBTU 58,198 50% usage Small NG Boiler g/MMBTU 58,176 50% usage Coal used for wet mill 40% Coal Boiler g/MMBTU 137,383 EtOH T&D Transported by rail miles 1,400 370 BTU/mile-ton Energy Intensity Transported by HHD truck miles 40 1,028 BTU/mile-ton Energy Intensity both ways Distributed by HHD truck miles 50 1,028 BTU/mile-ton Energy Intensity both ways
Fuels Properties LHV (BTU/gal) Density (g/gal)
Crude 129,670 3,205 Residual Oil 140,353 3,752 Conventional Diesel 128,450 3,167 Conventional Gasoline 116,090 2,819 CaRFG 111,289 2,828 CARBOB 113,300 2,767 Natural Gas 83,868 2,651 As liquid EtOH 76,330 2,988 Anhydrous ethanol (neat) EtOH 77,254 2,983 Denatured ethanol Still Gas 128,590

DRAFT – FOR REVIEW
DRAFT 11/30/2010
47
REFERENCES
Detailed California-Modified GREET Pathway for Corn Ethanol document at www.arb.ca.gov/fuels/lcfs/022709lcfs_cornetoh.pdf Economic Research Service, U.S. Department of Agriculture, February 1997, FBEI 97-1 GTAP at www.gtap.agecon.purdue.edu/ GREET Model: Argonne National Laboratory: www.transportation.anl.gov/modeling_simulation/GREET/index.html