report: 2009-01-12: detailed california-modified … california-modified greet pathway for brazilian...
TRANSCRIPT

Detailed California-Modified GREET Pathway for Brazilian Sugar Cane Ethanol
Stationary Source Division Release Date: January 12, 2009
Version 2.0

The Staff of the Air Resources Board developed this preliminary draft version as part of the Low Carbon Fuel Standard Regulatory Process
The ARB acknowledges contributions from the California Energy
Commission, TIAX, and Life Cycle Associates during the development of this document
When reviewing this document, please submit comments directly to: Anil Prabhu: [email protected] Chan Pham: [email protected] Alan Glabe: [email protected]
These comments will be compiled, reviewed, and posted to the LCFS website in a timely manner.
DRAFT – FOR REVIEW
i
TABLE OF CONTENTS Table of Contents............................................................................................................. i List of Figures...................................................................................................................ii List of Tables...................................................................................................................iii SUMMARY...................................................................................................................... 1
CA-GREET Model Pathway for Brazil Sugar Cane Ethanol..................................... 2 WTT Details ............................................................................................................. 7 TTW Details ........................................................................................................... 12
APPENDIX A................................................................................................................. 13 Section 1. SUGAR CANE FARMING......................................................................... 15
1.1 Energy Use for Sugar Cane Farming .......................................................... 16 1.2 GHG Emissions from Sugar Cane Farming ..................................................... 19 1.3 GHG Emissions from Straw Burning in Field.................................................... 22
Section 2. CHEMICAL INPUTS FOR AGRICULTURAL CHEMICALS ...................... 25 2.1 Energy Calculations for Production of Chemical Inputs ................................... 26 2.2 GHG Calculation from Production and Use of Agricultural Chemicals ............. 27
Section 3. SUGAR CANE TRANSPORT ................................................................. 32 3.1 Energy for Sugar Cane Transportation............................................................. 33 3.2 GHG Calculations from Sugar Cane Transportation ........................................ 33
Section 4. ETHANOL PRODUCTION........................................................................ 35 4.1 Ethanol Production........................................................................................... 36 4.2 GHG Emissions from Ethanol Production ........................................................ 37
Section 5. ETHANOL TRANSPORT AND DISTRIBUTION ...................................... 40 5.1 Energy for Ethanol Transportation and Distribution.......................................... 41 5.2 GHG Calculations from Ethanol Transportation and Distribution ..................... 43
APPENDIX B................................................................................................................. 46 Ethanol Pathway Input Values................................................................................... 46

DRAFT – FOR REVIEW
ii
LIST OF FIGURES Figure 1. WTW Components for Sugar Cane Ethanol Produced in Brazil and Transported for Use in CA............................................................................................... 3 Figure 2. Percent Energy Contribution from WTW for Sugar Cane Ethanol.................... 5 Figure 3. Percent GHG Contributions from WTW for Sugar Cane Ethanol ..................... 6
DRAFT – FOR REVIEW
iii
LIST OF TABLES Table A. Sugar Cane Ethanol Energy Use ...................................................................... 5 Table B. GHG Emissions Summary for Sugar Cane Ethanol.......................................... 6 Table C. Total Energy Input by Fuel Use for Sugar Cane Farming ................................. 7 Table D. GHG Emissions from Sugar Cane Farming and Straw Burning........................ 7 Table E. Energy Inputs for Agricultural Chemicals for Sugar Cane Farming................... 8 Table F. Total GHG Emissions from Agricultural Chemical Use .................................... 8 Table G. Sugar Cane Transport Energy......................................................................... 9 Table H. Sugar Cane Transport – Total GHG Emissions ............................................... 9 Table I. Ethanol Production Energy Use ...................................................................... 10 Table J. GHG Emissions for Ethanol Production........................................................... 10 Table K. Energy Use for Ethanol Transport and Distribution (T&D) .............................. 11 Table L. GHG Emissions Related to Ethanol Transport ................................................ 11 Table 1.01. Primary Energy Inputs by Fuel/Energy Input Type for Farm Operations .... 16 Table 1.02. Primary Energy Inputs by Fuel/Energy Input Type for Farm Operations .... 17 Table 1.03. Calculating Total Energy Input by Fuel for Sugar Cane Cultivation............ 17 Table 1.04. Values Used in Table 1.03 ......................................................................... 18 Table 1.05. Energy Consumption in the WTT Process and Specific Energy................. 19 Table 1.06. Global Warming Potentials for Gases ........................................................ 19 Table 1.07. GREET Calculations for CO2 Emissions from Sugar Cane Farming .......... 20 Table 1.08. Input Values for Calculations in Table 1.06 ................................................ 21 Note: The calculations for CH4 and N2O are analogous................................................ 21 Table 1.09. GHG Emissions from Sugar Cane Farming................................................ 22 Table 1.10 Inputs for Calculating Field Burning Emissions ........................................... 22 Table 1.11 Sugar Cane Straw Burning Emission Factors ............................................. 22 The same notes under Table 1.09 apply for this table................................................... 23 Table 1.12 Sugar Cane Straw Burning Emissions…………………………………………23 Table 2.01. Sugar Cane Farming Chemical Inputs ....................................................... 26 Table 2.02. Calculated GHG Emissions (g/g) Associated with Production of Agricultural Chemicals ..................................................................................................................... 27 Table 2.03. Calculated CO2 Emissions Associated with Production of Agricultural Chemicals ..................................................................................................................... 28 Table 2.04. Calculated GHG Emissions (g/g) Associated with Production of Agricultural Chemicals ..................................................................................................................... 28 Table 2.05. Calculated GHG Emissions from Production of Agricultural Chemicals ..... 29 Table 2.06. Inputs and Calculated Emissions for Soil NO and N2O from Sugar Cane Farming ......................................................................................................................... 29 Table 2.07. Total GHG Emissions from Agricultural Chemical Use for Sugar Cane Ethanol .......................................................................................................................... 30 Table 3.01. Sugar cane Transport Inputs ...................................................................... 33 Table 3.02. Sugar Cane Transport Energy.................................................................... 33 Table 3.03. Key Assumptions in Calculating GHG Emissions from Sugar Cane........... 34 Table 3.04. Sugar Cane Transport - CO2 Emissions in g/mmBtu.................................. 34 Table 3.05. Sugar Cane Transport – Other GHG Emissions......................................... 34
DRAFT – FOR REVIEW
iv
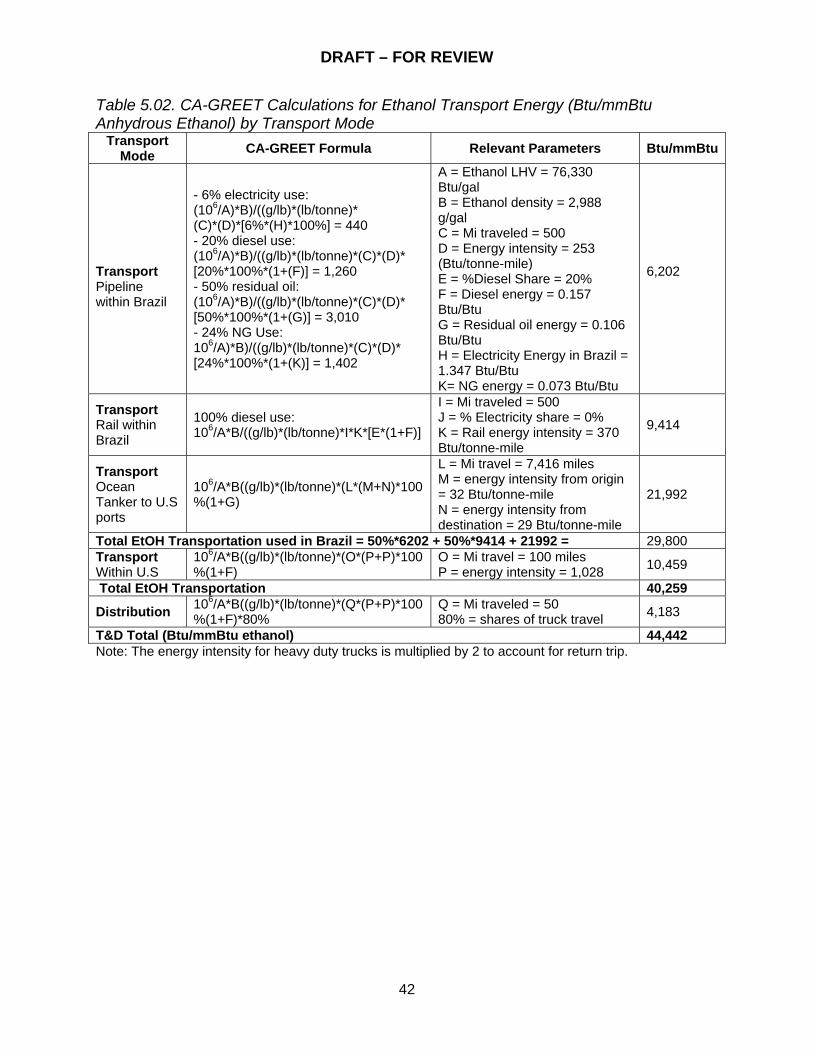
Table 4.01. Sugar Cane Ethanol Fuel Shares and Primary Energy Inputs (Btu/gallon Anhydrous Ethanol)....................................................................................................... 36 Table 4.02. Sugar Cane Ethanol Formulas, Parameters and Total Energy................... 37 Table 4.03. Process Shares and Emission Factors (EF) of Ethanol Production............ 37 Table 4.04. Calculated GHG Emissions for Ethanol Production Using CO2 Factors from Table 4.03 ..................................................................................................................... 38 Table 5.01. Inputs and Calculated Energy Requirements for Ethanol Transport to Bulk Terminals ...................................................................................................................... 41 Table 5.02. GREET Calculations for Ethanol Transport Energy (Btu/mmBtu Anhydrous Ethanol) by Transport Mode.......................................................................................... 42 Table 5.03. Key Assumptions in Calculating GHG Emissions from EtOH Transportation...................................................................................................................................... 43 Table 5.04. EtOH Transport and Distribution - CO2e Emissions in g/mmBtu ................ 44

DRAFT – FOR REVIEW
1
SUMMARY

DRAFT – FOR REVIEW
2
CA-GREET Model Pathway for Brazil Sugar Cane Ethanol
A Well-To-Tank (WTT) life cycle analysis of a fuel (or blending component of fuel) pathway includes all steps from feedstock production to final finished product. Tank-To-Wheel (TTW) analysis includes actual combustion of fuel in a motor vehicle for motive power. Together WTT and TTW analysis are combined together to provide a total Well-To-Wheel (WTW) analysis. A life cycle analysis model called the Greenhouse gases, Regulated Emissions, and Energy use in Transportation (GREET)1 developed by Argonne National Laboratory has been used to estimate the energy use and greenhouse gas (GHG) emissions associated with the production of ethanol from Brazilian sugar cane. The ethanol is then transported via ocean tanker to a California port and transported to a blending terminal for use in a light-duty vehicle. The values, assumptions, and equations used in this document are from the GREET 1.8b model (released December 2008), which has been modified to reflect California specific values. This model labeled “the CA-GREET model v1.8b” is available for download from the Low Carbon Fuel Standard website at http://www.arb.ca.gov/fuels/lcfs/lcfs.htm. The values shown in this document are preliminary draft values and staff is in the process of evaluating them. The areas that staff may revise include emission factors, energy intensity factors, percent fuel shares, transport modes and their shares, agricultural chemical use factors, etc. Note: At this time, analysis of land use change for sugarcane based ethanol has not been completed and results presented here do not include any potential land use change impacts. These impacts will be considered when the analysis for land use change is completed.
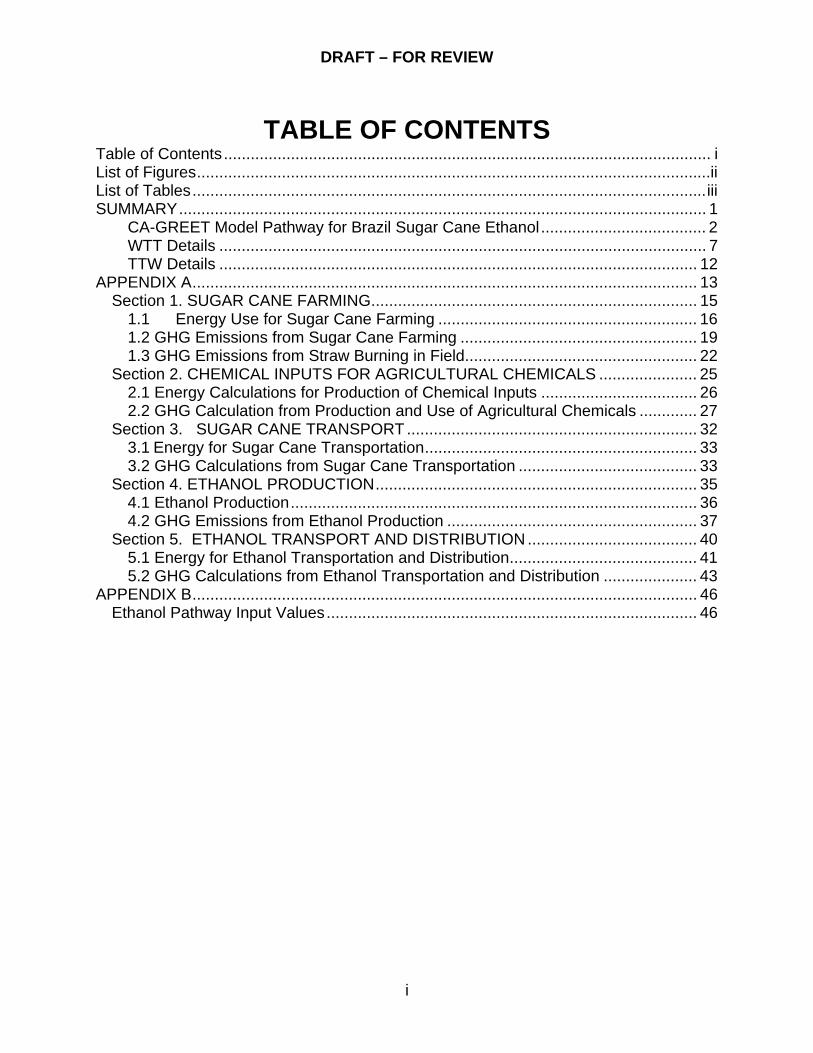
Figure 1 below outlines the discrete components that comprise the sugar cane ethanol pathway. 1 http://www.transportation.anl.gov/software/GREET/
DRAFT – FOR REVIEW
3
Figure 1. WTW Components for Sugar Cane Ethanol Produced in Brazil and Transported for Use in CA Several general descriptions and clarification of terminology used throughout this document are: • CA-GREET employs a recursive methodology to calculate energy consumption and
emissions. To calculate WTT energy and emissions, the values being calculated are often utilized in the calculation. For example, crude oil is used as a process fuel to recover crude oil. The total crude oil recovery energy consumption includes the direct crude oil consumption AND the energy associated with crude recovery (which is the value being calculated).
• Btu/mmBtu is the energy input necessary in Btu to produce one million Btu of a
finished (or intermediate) product. This description is used consistently in CA-GREET for all energy calculations.
• gCO2e/MJ provides the total greenhouse gas emissions on a CO2 equivalent basis
per unit of energy (MJ) for a given fuel. Methane (CH4) and nitrous oxide (N2O) are converted to a CO2 equivalent basis using IPCC Global Warming Potential (GWP) values and included in the total.
• CA-GREET assumes that VOC and CO are converted to CO2 in the atmosphere and
includes these pollutants in the total CO2 value using ratios of the appropriate molecular weights. This method is also used by the IPCC.
Crop Cultivation
Transport
Ethanol Production
Ethanol Transport and Storage
Chemical Inputs
Vehicle Combustion

DRAFT – FOR REVIEW
4
• Process Efficiency for any step in CA-GREET is defined as:
Efficiency = energy output / (energy output + energy consumed) • Note that rounding of values has not been performed in several tables in this
document. This is to allow stakeholders executing runs with the GREET model to compare actual output values from the CA-modified model with values in this document.
Table A below summarizes the fuel cycle energy inputs by stage (Btu/mmBtu) and Table B summarizes the major GHG emission categories and intensities (gCO2e/MJ). The tables present energy and emission results relative to the energy content (LHV) of anhydrous ethanol (see Appendix A for greater detail about energy and emissions). Figure 2 shows the percentage energy contributions from the various components of the ethanol pathway. From an energy viewpoint, ethanol production (48.6%) and carbon in fuel (44.4%) components dominate the sugarcane ethanol pathway. Figure 3 shows the GHG contributions from the various components of this pathway. From a GHG viewpoint, sugarcane farming impacts (37.2%) and production and use of agricultural chemicals (32.7%) components are the major contributors to the sugarcane ethanol pathway. Complete details of all energy inputs and GHG emissions are provided in Appendix A. A list of all inputs is provided in Appendix B. Note: Since all the ethanol is produced from sugar cane which consists of CO2 fixed via photosynthesis, the tailpipe emissions from combustion of ethanol is considered to be zero. This is since the CO2 release from combustion was actually removed from the atmosphere by the feedstock. The addition of denaturant however does lead to contributions to CO2 during combustion which is proportional to the amount of denaturant added to anhydrous ethanol. This value is not shown below in Table B under TTW category since the values are shown for anhydrous ethanol. The discussion and calculations are presented in Appendix A under TTW section. Since the use of anhydrous ethanol as a stand alone fuel is not permitted in CA, this document does not include tailpipe emissions of CH4 and N2O. An accompanying document for CaRFG (containing ethanol as an oxygenate in CARBOB) provides combined effects including tailpipe emissions of using reformulated gasoline in a light-duty vehicle.

DRAFT – FOR REVIEW
5
Table A. Sugar Cane Ethanol Energy Use
Sugar Cane Ethanol Components
Energy* (Btu/mmBtu) (Anhydrous)
% Energy Contribution
Sugar Cane Farming 26,407 1.2% Energy Inputs for Ag
Chemicals 59,616 2.7%
Sugar Cane Transportation 25,722 1.1%
Ethanol Production 1,093,376 48.6% Ethanol T&D 44,442 2%
Total Well-to-Tank 1,249,563 55.6%
Carbon in Fuel 1,000,000 44.4% Total Tank-to-wheel 1,000,000 44.4%
Total Well-to-Wheel 2,249,563 100%
Carbon in Fuel, 44.45%
Ethanol T&D, 1.98%
Sugar Cane Transportation,
1.14%
Ethanol Production 48.6%
Sugar Cane Farming, 1.17%
Energy Inputs for Ag Chemicals,
2.65%
Figure 2. Percent Energy Contribution from WTW for Sugar Cane Ethanol
DRAFT – FOR REVIEW
6
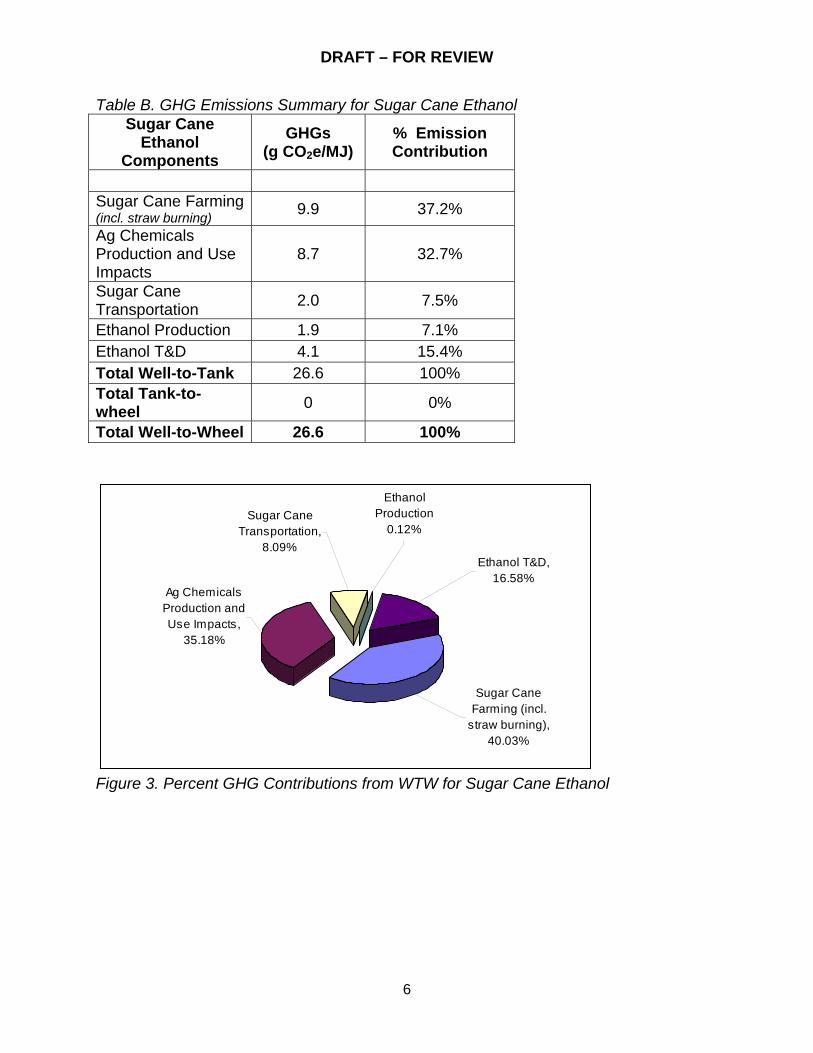
Table B. GHG Emissions Summary for Sugar Cane Ethanol Sugar Cane
Ethanol Components
GHGs (g CO2e/MJ)
% Emission Contribution
Sugar Cane Farming (incl. straw burning) 9.9 37.2%
Ag Chemicals Production and Use Impacts
8.7 32.7%
Sugar Cane Transportation 2.0 7.5%
Ethanol Production 1.9 7.1% Ethanol T&D 4.1 15.4% Total Well-to-Tank 26.6 100% Total Tank-to-wheel 0 0%
Total Well-to-Wheel 26.6 100%
Ag Chemicals Production and Use Impacts,
35.18%
Sugar Cane Farming (incl.
straw burning), 40.03%
Ethanol Production
0.12%Sugar Cane
Transportation, 8.09%
Ethanol T&D, 16.58%
Figure 3. Percent GHG Contributions from WTW for Sugar Cane Ethanol
DRAFT – FOR REVIEW
7
WTT Details
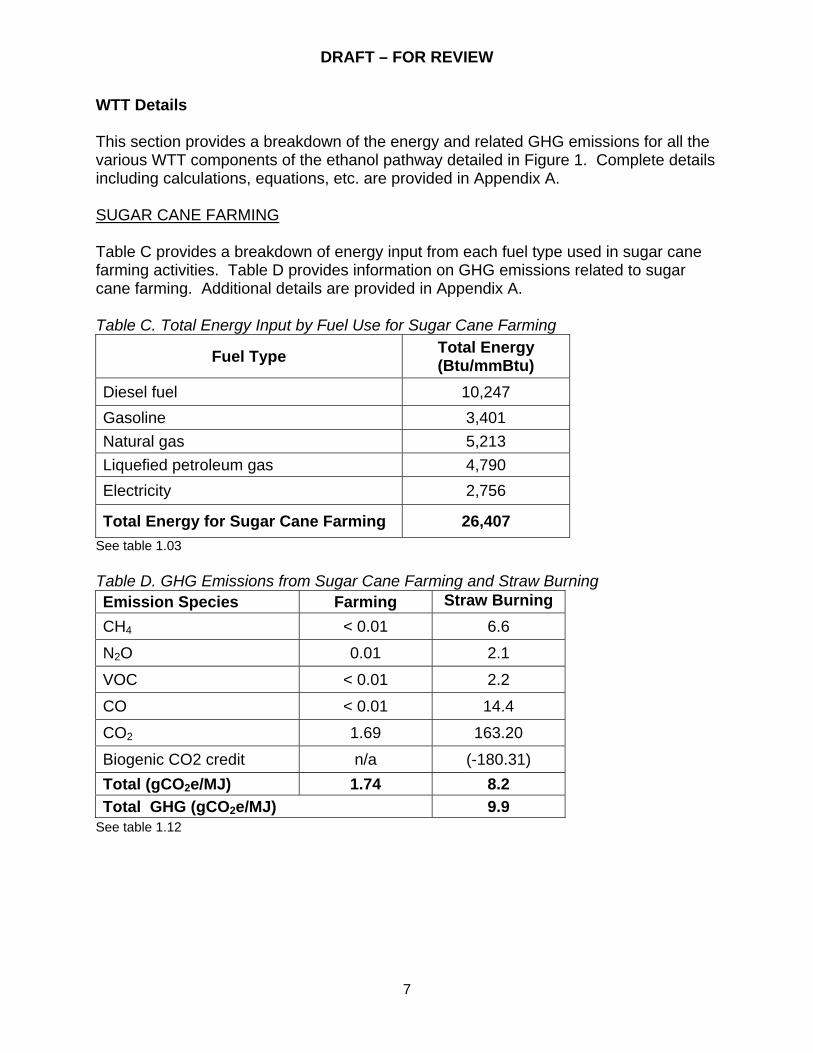
This section provides a breakdown of the energy and related GHG emissions for all the various WTT components of the ethanol pathway detailed in Figure 1. Complete details including calculations, equations, etc. are provided in Appendix A. SUGAR CANE FARMING Table C provides a breakdown of energy input from each fuel type used in sugar cane farming activities. Table D provides information on GHG emissions related to sugar cane farming. Additional details are provided in Appendix A. Table C. Total Energy Input by Fuel Use for Sugar Cane Farming
Fuel Type Total Energy (Btu/mmBtu)
Diesel fuel 10,247 Gasoline 3,401 Natural gas 5,213 Liquefied petroleum gas 4,790 Electricity 2,756
Total Energy for Sugar Cane Farming 26,407 See table 1.03 Table D. GHG Emissions from Sugar Cane Farming and Straw Burning
See table 1.12
Emission Species Farming Straw Burning CH4 < 0.01 6.6
N2O 0.01 2.1
VOC < 0.01 2.2
CO < 0.01 14.4
CO2 1.69 163.20
Biogenic CO2 credit n/a (-180.31) Total (gCO2e/MJ) 1.74 8.2 Total GHG (gCO2e/MJ) 9.9

DRAFT – FOR REVIEW
8
CHEMICAL INPUTS FOR AGRICULTURAL CHEMICALS Table E provides details the energy inputs required to produce chemicals used in agricultural operations related to sugar cane farming. This includes fertilizers such as nitrogen, phophorus, potassium (potash), and calcium carbonate (lime) as well as herbicides and insecticides. Table F provides details of the associated GHG emissions related to the production of these chemicals as well as their use in sugar cane farming. N2O and CO2 emissions from the soil are based on the amount of fertilizer and lime applied respectively. Complete details are provided in Appendix A. Table E. Energy Inputs for Agricultural Chemicals for Sugar Cane Farming
Chemical Type Energy Use, (Btu/mmBtu)
Nitrogen Fertilizer 31,054 Phosphate Fertilizer 880 Potash 885 Lime 22,354 Herbicide 3,853 Insecticide 375 Total 59,616 See table 2.01 Table F. Total GHG Emissions from Agricultural Chemical Use
Agricultural Chemicals
Ethanol Pathway
Fertilizers Herbicide Pesticide
Soil N2O and NO
CO2 from Application
of Lime Total
GHGs (gCO2e/MJ) 3.7 0.3 0.03 3.5 1.2 8.7
See tables 2.03, 2.05, 2.06 and 2.07 SUGAR CANE TRANSPORT Table G details the energy inputs required to transport sugar cane from the farm to the ethanol production plant using heavy duty trucks. Table H provides details of the associated GHG emissions related to transportation of sugar cane from the farm to the ethanol plant. Complete details are provided in Appendix A.

DRAFT – FOR REVIEW
9
Table G. Sugar Cane Transport Energy
Transport Mode Energy Consumption
(Btu/mmBtu)
Total Energy for Sugarcane Transport 25,722
See table 3.02 Table H. Sugar Cane Transport – Total GHG Emissions
Transport Mode GHG Emissions (gCO2e/MJ)
VOC < 0.01
CH4 < 0.01
N2O < 0.01
CO < 0.01
CO2 2.0
Total GHGs 2.0
See table 3.04 ETHANOL PRODUCTION Table I details the energy inputs required to produce ethanol from sugar cane. Table J provides details of the associated GHG emissions related to production of ethanol. Credit from bagasse is also shown in this table. Complete details are provided in Appendix A.

DRAFT – FOR REVIEW
10
Table I. Ethanol Production Energy Use
Fuel Type Total Energy
From Residual Oil (Btu/gal) 284 From Bagasse (Btu/gal) 83,132 Total Energy Input for Ethanol Production (Btu/gal) 83,415
Total Energy Input for Ethanol Production (Btu/mmBtu) 1,093,743
See table 4.02 Table J. GHG Emissions for Ethanol Production
GHG Species (gCO2e/MJ) CO2 from Residual Oil 0.03 CO2 from Bagasse Burning 124.9 CO2 credit for Bagasse -122.97 CH4 < 0.01 N2O < 0.01 VOC from Residual Oil < 0.01 VOC from Bagasse Burning 0.02 VOC from non-combustion source 0.09 CO from Residual Oil < 0.01 CO from Bagasse Burning 0.12 Total GHGs 1.9 See table 4.04
ETHANOL TRANSPORT AND DISTRIBUTION
Ethanol is transported within Brazil by rail or pipeline. It is then shipped to the US by ocean tanker. Several different denaturant blending options can apply to Brazilian ethanol. A significant fraction of ethanol imported to the U.S. is processed as hydrated ethanol (5% water) in the Caribbean where denaturant is also added. This delivery mode is not modeled in CA-GREET so the pathway based on delivering anhydrous ethanol to California is shown here. Once in CA, it is blended with CAROB and transported and distributed by heavy duty trucks. Table K details the energy inputs required to transport ethanol. Table L provides details of the associated GHG emissions related to ethanol transport and distribution. Additional details are provided in Appendix A.
DRAFT – FOR REVIEW
11
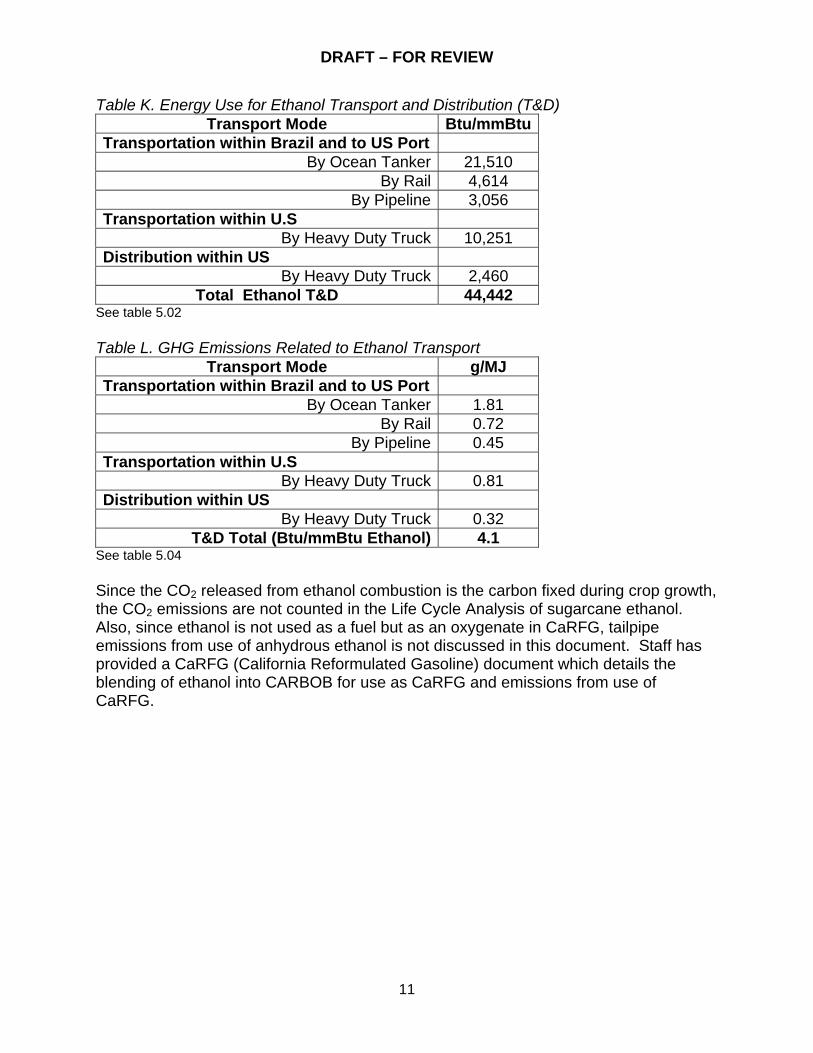
Table K. Energy Use for Ethanol Transport and Distribution (T&D) Transport Mode Btu/mmBtu
Transportation within Brazil and to US Port By Ocean Tanker 21,510
By Rail 4,614 By Pipeline 3,056
Transportation within U.S By Heavy Duty Truck 10,251
Distribution within US By Heavy Duty Truck 2,460
Total Ethanol T&D 44,442 See table 5.02 Table L. GHG Emissions Related to Ethanol Transport
Transport Mode g/MJ Transportation within Brazil and to US Port
By Ocean Tanker 1.81 By Rail 0.72
By Pipeline 0.45 Transportation within U.S
By Heavy Duty Truck 0.81 Distribution within US
By Heavy Duty Truck 0.32 T&D Total (Btu/mmBtu Ethanol) 4.1
See table 5.04 Since the CO2 released from ethanol combustion is the carbon fixed during crop growth, the CO2 emissions are not counted in the Life Cycle Analysis of sugarcane ethanol. Also, since ethanol is not used as a fuel but as an oxygenate in CaRFG, tailpipe emissions from use of anhydrous ethanol is not discussed in this document. Staff has provided a CaRFG (California Reformulated Gasoline) document which details the blending of ethanol into CARBOB for use as CaRFG and emissions from use of CaRFG.

DRAFT – FOR REVIEW
12
(This page intentionally left blank.)

DRAFT – FOR REVIEW
13
APPENDIX A

DRAFT – FOR REVIEW
14
(This page intentionally left blank.)

DRAFT – FOR REVIEW
15
SECTION 1. SUGAR CANE FARMING

DRAFT – FOR REVIEW
16
1.1 Energy Use for Sugar Cane Farming This section presents the direct farming energy inputs for sugar cane farming. For farming, the CA-GREET model calculates energy and emissions based on the quantity of fuel (Btu) and chemicals used per bushel of sugar cane, rather than using energy efficiencies, as the petroleum pathways do in CA-GREET. The total input energy per tonne of sugar cane is 41,592 Btu (CA-GREET default) using a mix of fuel types shown in Table 1.01. The Brazilian sugar cane ethanol pathway uses three different electricity mixes: Brazilian average, Brazilian marginal and U.S. average mix. The electricity mix used for sugar cane farming is the Brazilian average mix, and U.S. electricity is the assumed input for fertilizer production (see Sections 2.1 and 2.2). Marginal Brazilian electricity (natural gas) is the assumed electricity mix displaced by bagasse-fired exported electricity produced at the ethanol plant. Table 1.02 below shows generation shares of the three electricity mixes used in this fuel pathway. Table 1.01. Primary Energy Inputs by Fuel/Energy Input Type for Farm Operations
Fuel Type Fuel Share Formula
Primary Energy Input
(Btu/tonne)
Primary Energy Input
(Btu/mmBtu) Diesel Fuel 38.3% 41,592*38.3% 15,930 9,858 Gasoline 12.3% 41,592*12.3% 5,116 3,166 Natural Gas 21.5% 41,592*21.5% 8,942 5,534 Liquefied Petroleum Gas 18.8% 41,592*18.8% 7,819 4,839
Electricity 9% 41,592*9% 3,743 2,316 Direct Energy Consumption for Sugar Cane Cultivation
(unadjusted) 41,550 22,681 To convert Btu/tonne into the standard units of Btu/mmBtu, we use the following convention for anhydrous ethanol: 41,550 (Btu/tonne)/(24 (gallons/tonne)*76,330 Btu/gal) * 106 where : 41,550 is a calculated value in Table 1.01 24 (gallons/tonne) = sugar cane EtOH yield (CA-GREET default) 76,330 Btu/gal = Low Heating Value of anhydrous ethanol (CA-GREET default)
DRAFT – FOR REVIEW
17
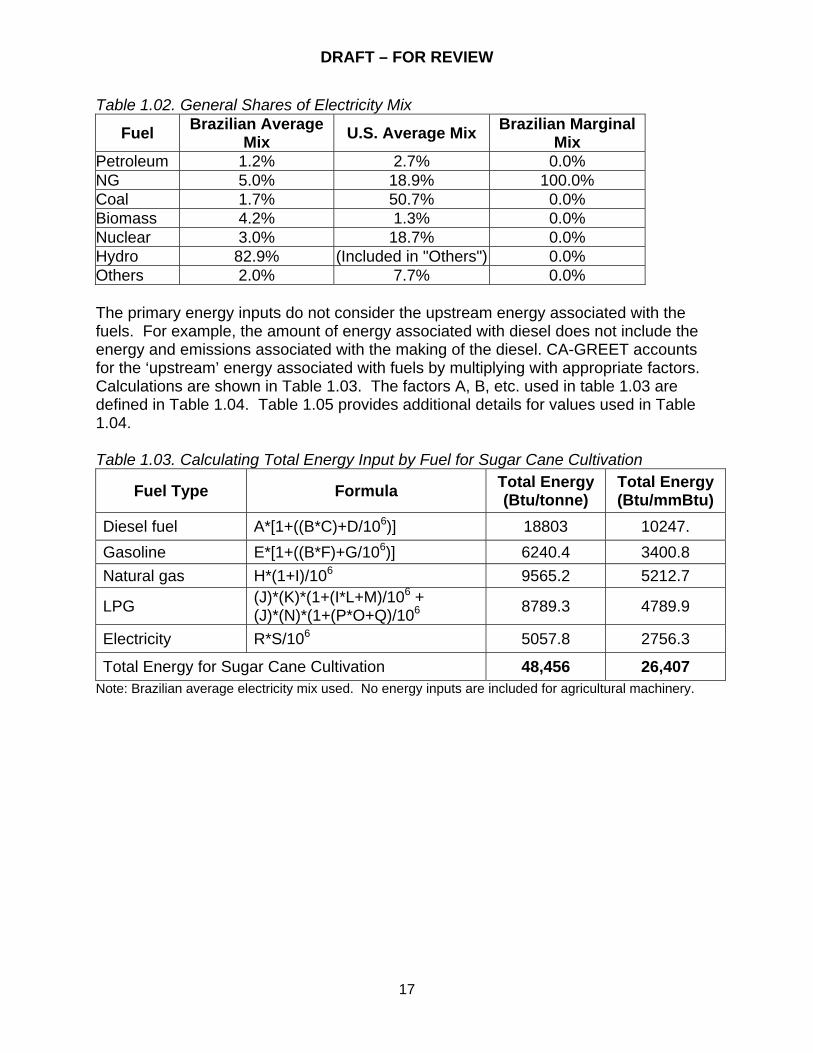
Table 1.02. General Shares of Electricity Mix
Fuel Brazilian Average Mix U.S. Average Mix Brazilian Marginal
Mix Petroleum 1.2% 2.7% 0.0% NG 5.0% 18.9% 100.0% Coal 1.7% 50.7% 0.0% Biomass 4.2% 1.3% 0.0% Nuclear 3.0% 18.7% 0.0% Hydro 82.9% (Included in "Others") 0.0% Others 2.0% 7.7% 0.0% The primary energy inputs do not consider the upstream energy associated with the fuels. For example, the amount of energy associated with diesel does not include the energy and emissions associated with the making of the diesel. CA-GREET accounts for the ‘upstream’ energy associated with fuels by multiplying with appropriate factors. Calculations are shown in Table 1.03. The factors A, B, etc. used in table 1.03 are defined in Table 1.04. Table 1.05 provides additional details for values used in Table 1.04. Table 1.03. Calculating Total Energy Input by Fuel for Sugar Cane Cultivation
Fuel Type Formula Total Energy (Btu/tonne)
Total Energy (Btu/mmBtu)
Diesel fuel A*[1+((B*C)+D/106)] 18803 10247. Gasoline E*[1+((B*F)+G/106)] 6240.4 3400.8 Natural gas H*(1+I)/106 9565.2 5212.7
LPG (J)*(K)*(1+(I*L+M)/106 + (J)*(N)*(1+(P*O+Q)/106 8789.3 4789.9
Electricity R*S/106 5057.8 2756.3
Total Energy for Sugar Cane Cultivation 48,456 26,407 Note: Brazilian average electricity mix used. No energy inputs are included for agricultural machinery.
DRAFT – FOR REVIEW
18
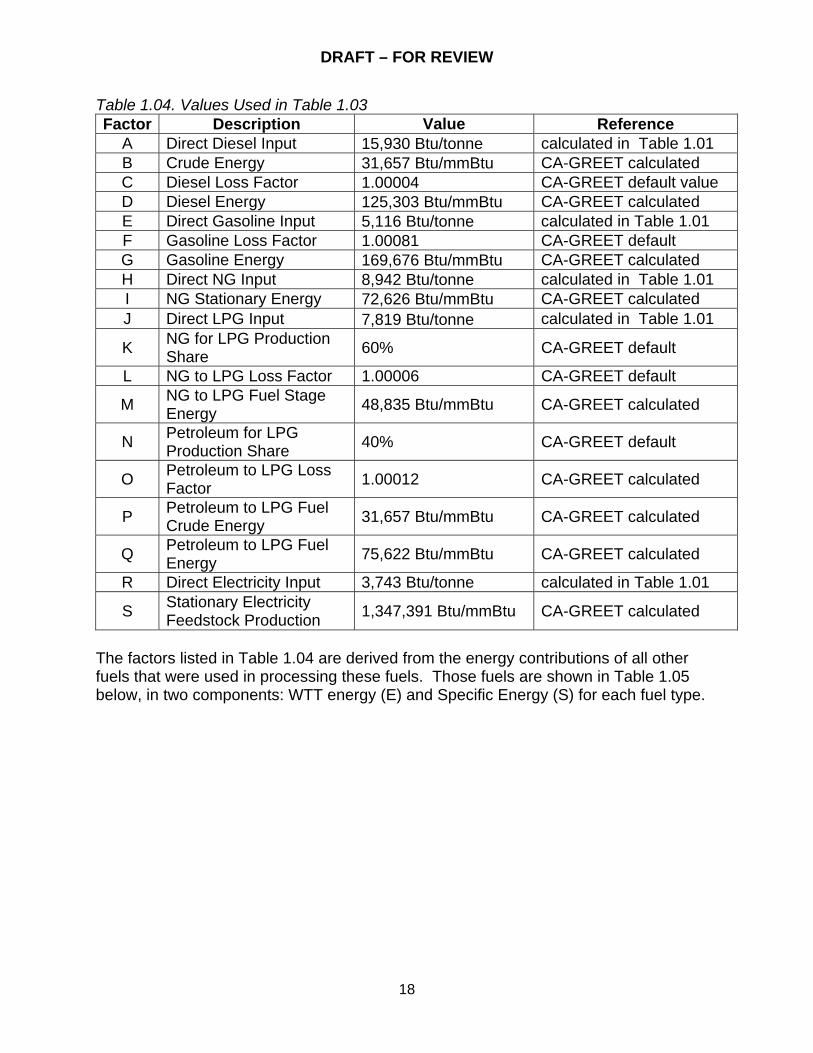
Table 1.04. Values Used in Table 1.03 Factor Description Value Reference
A Direct Diesel Input 15,930 Btu/tonne calculated in Table 1.01 B Crude Energy 31,657 Btu/mmBtu CA-GREET calculated C Diesel Loss Factor 1.00004 CA-GREET default value D Diesel Energy 125,303 Btu/mmBtu CA-GREET calculated E Direct Gasoline Input 5,116 Btu/tonne calculated in Table 1.01 F Gasoline Loss Factor 1.00081 CA-GREET default G Gasoline Energy 169,676 Btu/mmBtu CA-GREET calculated H Direct NG Input 8,942 Btu/tonne calculated in Table 1.01 I NG Stationary Energy 72,626 Btu/mmBtu CA-GREET calculated J Direct LPG Input 7,819 Btu/tonne calculated in Table 1.01
K NG for LPG Production Share 60% CA-GREET default
L NG to LPG Loss Factor 1.00006 CA-GREET default
M NG to LPG Fuel Stage Energy 48,835 Btu/mmBtu CA-GREET calculated
N Petroleum for LPG Production Share 40% CA-GREET default
O Petroleum to LPG Loss Factor 1.00012 CA-GREET calculated
P Petroleum to LPG Fuel Crude Energy 31,657 Btu/mmBtu CA-GREET calculated
Q Petroleum to LPG Fuel Energy 75,622 Btu/mmBtu CA-GREET calculated
R Direct Electricity Input 3,743 Btu/tonne calculated in Table 1.01
S Stationary Electricity Feedstock Production 1,347,391 Btu/mmBtu CA-GREET calculated
The factors listed in Table 1.04 are derived from the energy contributions of all other fuels that were used in processing these fuels. Those fuels are shown in Table 1.05 below, in two components: WTT energy (E) and Specific Energy (S) for each fuel type.

DRAFT – FOR REVIEW
19
Table 1.05. Energy Consumption in the WTT Process and Specific Energy WTT energy
(Btu input/mmBtu product) S: Specific Energy
(Btu input/Btu product) Crude Recovery
WTTCrude Recovery = 44,499 (CA-GREET calculated) S Crude Recovery = 1+WTT Crude Recovery/106 = 1.028
B WTTCrude = WTTCrude Recovery*LFT&D + WTTCrude T&D + WTTCrude Storage= 28,249*1.00006 +3,406 = 31,657
LFT&D = Loss Factor for Transport and Distribution = 1.00006 (CA-GREET default) WTTCrude T&D= 3,406 (CA-GREET calculated) WTTCrude Storage = 0.0 (CA-GREET default)
Residual Oil WTT Res Oil = 55,561 (CA-GREET calculated)
S Res Oil = 1+(WTT Crude*LF Crude+ WTT Res Oil) /106 = 1.106 LFCrude = 1.00000 (CA-GREET default)
D WTT diesel = 124,812 (CA-GREET calculated)
S diesel = 1+(WTTCrude*LFdiesel + WTT diesel)/ 106 = 1.157. LFdiesel = 1.00004 (CA-GREET default).
G WTT gasoline= 164,227 (CA-GREET calculated)
S gasoline = 1+(WTTCrude*Loss Factor gasoline + WTT gasoline)/ 106 = 1.201 LFgasoline = 1.00081 (CA-GREET default)
I
WTT NG=(WTTNG Recovery* LFprocessing + WTTNG Process) * LFT&D + WTTT&D = 69,664 (CA-GREET calculated)
SNG = 1+WTT NG/106 = 1.073 Natural Gas recovery, Process and T&D includes WTT NG Recovery = 31,125, WTT NG Process = 31,843, LFProcessing = 1.00148 and WTT NG T&D = 9,381. LFT&D = 1.00367 (all CA-GREET calculated)
S WTTelectricity = 1,347,391 S Electricity = (WTT feedstock + WTT fuel)/ 106 = 2.347 Note: WTTCrude Recovery: WTT energy for crude oil recovery, of self use of crude oil at the well, not include T&D. WTTCrude Storage: WTT energy of crude storage
1.2 GHG Emissions from Sugar Cane Farming
CA-GREET calculates carbon dioxide (CO2), methane (CH4) and nitrous oxide (N2O) emissions for each component of the pathway and uses IPCC Global Warming Potentials (GWP) to calculate CO2 equivalent values for CH4 and N2O (see Table 1.06). For VOC and CO, CA-GREET uses a carbon ratio to calculate CO2 equivalent values which are detailed in a note below Table 1.06. These are based on the oxidation of CO and VOC to CO2 in the atmosphere. Note that CA-GREET v1.8b has updated GWPs for CH4 and N2O compared to CA-GREET v1.7b. The earlier GWPs of 23 and 296 for CH4 and N2O have been changed to 25 and 298 respectively in the current version of CA-GREET. This is to reflect updated IPCC values for these GHG species. Table 1.06. Global Warming Potentials for Gases
GHG Species GWP (relative to CO2) CO2 1 CH4 25 N2O 298 VOC 3.1 CO 1.6
Carbon ratio of VOC = 0.85 grams CO2/MJ ; grams VOC*(0.85)*(44/12) = 3.1 Carbon ratio of CO = 0.43 grams CO2/MJ ; grams CO/mmBtu*(0.43)*(44/12) = 1.6

DRAFT – FOR REVIEW
20
The GHG emissions for farm energy use are determined separately for CO2, CH4 and N2O in CA-GREET using the direct energy inputs presented in Section 1.1 (Btu/tonne) and the combustion and upstream emissions for the energy inputs. CA-GREET calculates the emissions for each fossil fuel input by multiplying fuel input (Btu/tonne) by the total emissions from combustion, crude production and fuel production. The electricity emissions are calculated by multiplying the electricity input (Btu/tonne) by the total (feedstock plus fuel) emissions associated with the chosen electricity mix (from the Electricity Tab in CA-GREET). Note that U. S. average emission factors are used for Brazilian fuel use and electricity generation. Table 1.07 below shows equations and calculated values by fuel type for sugar cane farming CO2 emissions. Equations and values for CH4 and N2O are not shown, but use the same structure. Table 1.08 provides values for parameters used in equations shown in Table 1.07. Table 1.07. CA-GREET Calculations for CO2 Emissions from Sugar Cane Farming
Fuel Formula CO2
Emissions (g/tonne)
CO2 Emissions (g/mmBtu)
Diesel [(A)*[(B)*(C) + (D)*(E)+(F)*(G)+ (H)*(I)+(J)*(K)+(L)]]/106 1,435 782
Gasoline [(M)*[(N)+ (J)*(O)+(P)]]/106 466 254
Natural Gas
[(Q)*[(R)*(S) + (T)*(U)+(V) *(W)+(X)*(Y)+(Z)]]/106 552 301
LPG [(AA)*[(BB)+((J)*(CC)+(DD)+(EE)*(FF)+(GG))/2]]/106 599 326
Electricity [(HH)*(II)]/106 69 38
Total CO2 Emissions 3,120 1,701 To convert from g/tonne to g/mmBtu use: 3,120 (g/tonne)/(24 (gallons/tonne)*76,330 Btu/gal) * 106 where : 24 (gallons/tonne) = sugar cane EtOH yield (CA-GREET default) 76,330 Btu/gal = Low Heating Value of anhydrous ethanol (CA-GREET default) 106 is to convert to mmBtu

DRAFT – FOR REVIEW
21
Table 1.08. Input Values for Calculations in Table 1.06 Variable Relevant Parameters* Reference
A = Diesel input = 15,930 Btu/tonne Table 1.01 B = % Fuel share diesel boiler = 0% CA-GREET default C = Boiler CO2 emissions = 78,167 g/mmBtu CA-GREET default D = % Fuel share diesel stationary engine = 0% CA-GREET default E = IC Engine CO2 Emissions =77,401 g/mmBtu CA-GREET default F = % Fuel share diesel turbine = 0% CA-GREET default G = Turbine CO2 emissions 78,179 g/mmBtu CA-GREET default H = % Fuel share diesel tractor = 100% CA-GREET default I = Tractor CO2 emissions = 77,411 g/mmBtu CA-GREET default J = Crude production CO2 emissions = 3,260 g/mmBtu CA-GREET calculation K = Diesel loss factor = 1.00004 CA-GREET default L = Diesel production CO2 emissions = 9,387 g/mmBtu CA-GREET default M = Gasoline input = 5,116 Btu/tonne Table 1.01 N = Farming tractor CO2 emission factor = 75,645 g/mmBtu CA-GREET default O = Gasoline loss factor = 1.00081 CA-GREET default P = Gasoline production CO2 emissions = 12,122 g/mmBtu CA-GREET calculation Q = NG input = 8,942 Btu/tonne Table 1.01 R = % Fuel share NG engine = 100% CA-GREET default S = Engine CO2 emission factor = 56,551 g/mmBtu CA-GREET default T = % Fuel share NG large turbine = 0% CA-GREET default U = Turbine CO2 emission factor = 58,179 g/mmBtu CA-GREET default V = % Fuel share NG large boiler = 0% CA-GREET default W = Large boiler CO2 emission factor = 58,198 g/mmBtu CA-GREET default X = % Fuel share small NG boiler = 0% CA-GREET default Y = Small boiler CO2 emission factor = 58,176 g/mmBtu CA-GREET default Z = WTT stationary NG CO2 emissions = 5,218 g/mmBtu CA-GREET calculation
AA = LPG input = 7,819 Btu/tonne Table 1.01 BB = Commercial boiler CO2 emission factor = 68,036 g/mmBtu CA-GREET default CC = LPG loss factor = 1.00012 CA-GREET default DD = LPG production CO2 emissions = 5,708 g/mmBtu CA-GREET calculation EE = LNG feedstock CO2 emissions = 4,882 g/mmBtu CA-GREET calculation FF = NG to LPG loss factor = 1.00006 CA-GREET default GG = NG to LPG fuel CO2 emissions = 3,162 g/mmBtu CA-GREET calculation HH = Electricity input = 3,743 Btu/tonne Table 1.01 II = Electricity CO2 emissions = 18,504 g/mmBtu CA-GREET calculation
Note: The calculations for CH4 and N2O are analogous. *Relevant parameters here are calculated values in GREET, except for technology shares, which are direct inputs. Other GHGs, including VOC, CO, CH4, and N2O emissions are calculated with the same equations, energy input, and loss factors as CO2 emissions calculations shown in Tables 1.07 and 1.08, but with different VOC, CO, CH4, and N2O emission factors. Table 1.09 shows the results of the calculations of VOC, CO, CH4, and N2O in (g/tonne) then converted to g/mmBtu. The conversion is performed as shown in the note below Table 1.07.
DRAFT – FOR REVIEW
22
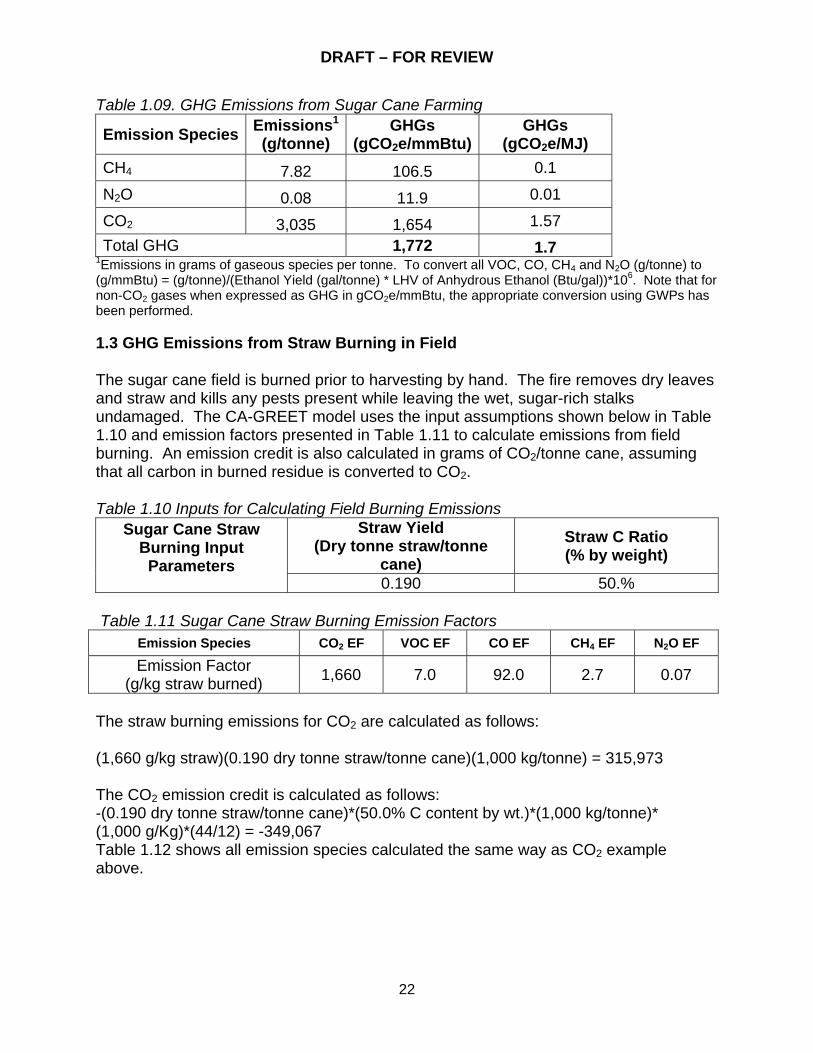
Table 1.09. GHG Emissions from Sugar Cane Farming
Emission Species Emissions1
(g/tonne) GHGs
(gCO2e/mmBtu)GHGs
(gCO2e/MJ) CH4 7.82 106.5 0.1
N2O 0.08 11.9 0.01
CO2 3,035 1,654 1.57 Total GHG 1,772 1.7
1Emissions in grams of gaseous species per tonne. To convert all VOC, CO, CH4 and N2O (g/tonne) to (g/mmBtu) = (g/tonne)/(Ethanol Yield (gal/tonne) * LHV of Anhydrous Ethanol (Btu/gal))*106. Note that for non-CO2 gases when expressed as GHG in gCO2e/mmBtu, the appropriate conversion using GWPs has been performed. 1.3 GHG Emissions from Straw Burning in Field
The sugar cane field is burned prior to harvesting by hand. The fire removes dry leaves and straw and kills any pests present while leaving the wet, sugar-rich stalks undamaged. The CA-GREET model uses the input assumptions shown below in Table 1.10 and emission factors presented in Table 1.11 to calculate emissions from field burning. An emission credit is also calculated in grams of CO2/tonne cane, assuming that all carbon in burned residue is converted to CO2.
Table 1.10 Inputs for Calculating Field Burning Emissions Straw Yield
(Dry tonne straw/tonne cane)
Straw C Ratio (% by weight)
Sugar Cane Straw Burning Input Parameters
0.190 50.% Table 1.11 Sugar Cane Straw Burning Emission Factors
Emission Species CO2 EF VOC EF CO EF CH4 EF N2O EF
Emission Factor (g/kg straw burned) 1,660 7.0 92.0 2.7 0.07
The straw burning emissions for CO2 are calculated as follows: (1,660 g/kg straw)(0.190 dry tonne straw/tonne cane)(1,000 kg/tonne) = 315,973 The CO2 emission credit is calculated as follows: -(0.190 dry tonne straw/tonne cane)*(50.0% C content by wt.)*(1,000 kg/tonne)* (1,000 g/Kg)*(44/12) = -349,067 Table 1.12 shows all emission species calculated the same way as CO2 example above.

DRAFT – FOR REVIEW
23
Table 1.12 Sugar Cane Straw Burning Emissions
Emissions GHG GHG Emission Species (g/tonne
Cane) (gCO2e/mmBtu
EtOH) (gCO2e/MJ
EtOH) VOC 1,332.80 2,287 2.2 CO 17,516.80 15,204 14.4 CH4 514.1 7,003.90 6.6
N2O 13.3 2,164.50 2.1
CO2 315,973 172,195 163.2
Biogenic CO2 Credit -349,067 -190,230 -180.3 Total GHG 23,226
GHG (gCO2e/MJ) 8.2 The same notes under Table 1.09 apply for this table. Total GHG emissions from sugarcane farming and straw burning is therefore 1.74 + 8.2 = 9.9 gCO2/MJ.

DRAFT – FOR REVIEW
24
(This page was intentionally left blank.)
DRAFT – FOR REVIEW
25
SECTION 2. CHEMICAL INPUTS FOR AGRICULTURAL
CHEMICALS
DRAFT – FOR REVIEW
26
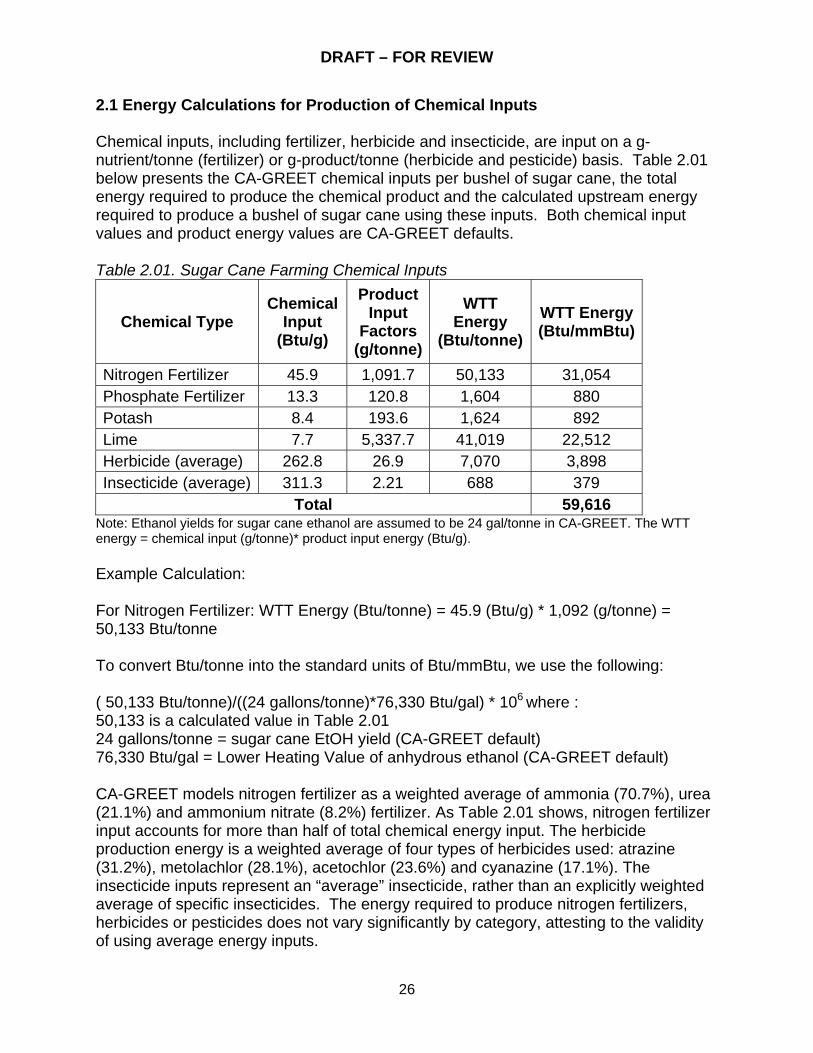
2.1 Energy Calculations for Production of Chemical Inputs
Chemical inputs, including fertilizer, herbicide and insecticide, are input on a g-nutrient/tonne (fertilizer) or g-product/tonne (herbicide and pesticide) basis. Table 2.01 below presents the CA-GREET chemical inputs per bushel of sugar cane, the total energy required to produce the chemical product and the calculated upstream energy required to produce a bushel of sugar cane using these inputs. Both chemical input values and product energy values are CA-GREET defaults. Table 2.01. Sugar Cane Farming Chemical Inputs
Chemical Type Chemical
Input (Btu/g)
Product Input
Factors (g/tonne)
WTT Energy
(Btu/tonne)WTT Energy (Btu/mmBtu)
Nitrogen Fertilizer 45.9 1,091.7 50,133 31,054 Phosphate Fertilizer 13.3 120.8 1,604 880 Potash 8.4 193.6 1,624 892 Lime 7.7 5,337.7 41,019 22,512 Herbicide (average) 262.8 26.9 7,070 3,898 Insecticide (average) 311.3 2.21 688 379
Total 59,616 Note: Ethanol yields for sugar cane ethanol are assumed to be 24 gal/tonne in CA-GREET. The WTT energy = chemical input (g/tonne)* product input energy (Btu/g). Example Calculation: For Nitrogen Fertilizer: WTT Energy (Btu/tonne) = 45.9 (Btu/g) * 1,092 (g/tonne) = 50,133 Btu/tonne To convert Btu/tonne into the standard units of Btu/mmBtu, we use the following: ( 50,133 Btu/tonne)/((24 gallons/tonne)*76,330 Btu/gal) * 106 where : 50,133 is a calculated value in Table 2.01 24 gallons/tonne = sugar cane EtOH yield (CA-GREET default) 76,330 Btu/gal = Lower Heating Value of anhydrous ethanol (CA-GREET default) CA-GREET models nitrogen fertilizer as a weighted average of ammonia (70.7%), urea (21.1%) and ammonium nitrate (8.2%) fertilizer. As Table 2.01 shows, nitrogen fertilizer input accounts for more than half of total chemical energy input. The herbicide production energy is a weighted average of four types of herbicides used: atrazine (31.2%), metolachlor (28.1%), acetochlor (23.6%) and cyanazine (17.1%). The insecticide inputs represent an “average” insecticide, rather than an explicitly weighted average of specific insecticides. The energy required to produce nitrogen fertilizers, herbicides or pesticides does not vary significantly by category, attesting to the validity of using average energy inputs.
DRAFT – FOR REVIEW
27
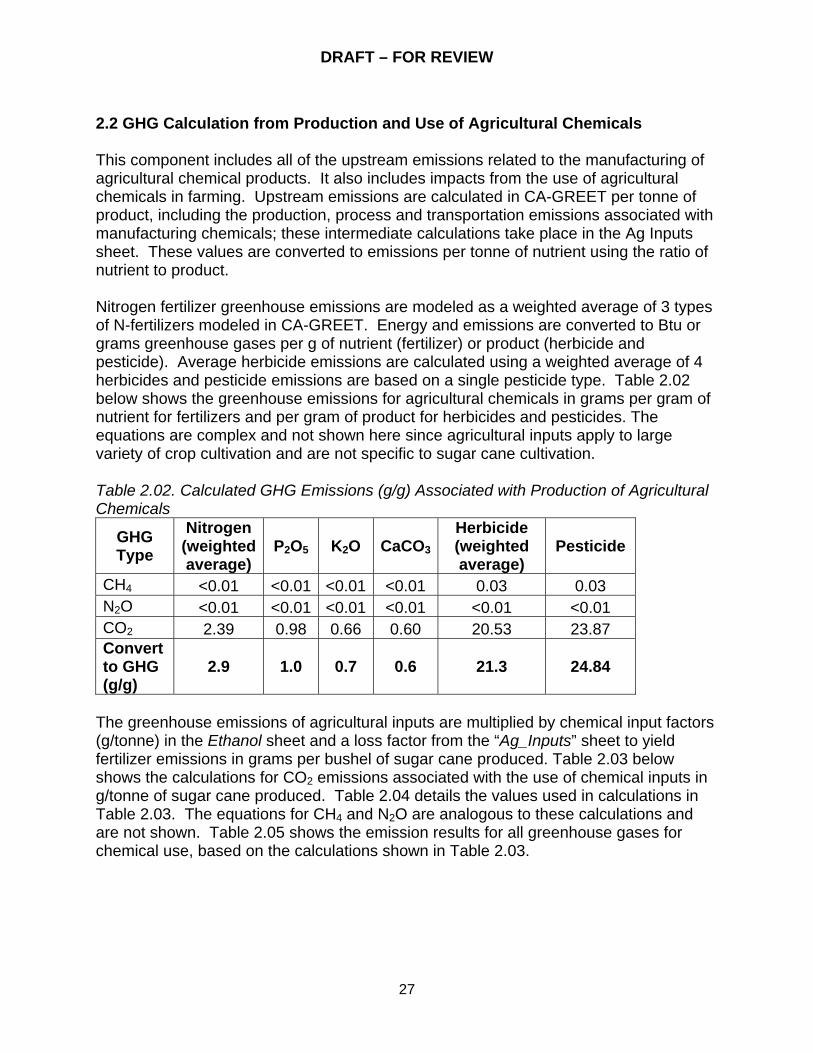
2.2 GHG Calculation from Production and Use of Agricultural Chemicals
This component includes all of the upstream emissions related to the manufacturing of agricultural chemical products. It also includes impacts from the use of agricultural chemicals in farming. Upstream emissions are calculated in CA-GREET per tonne of product, including the production, process and transportation emissions associated with manufacturing chemicals; these intermediate calculations take place in the Ag Inputs sheet. These values are converted to emissions per tonne of nutrient using the ratio of nutrient to product. Nitrogen fertilizer greenhouse emissions are modeled as a weighted average of 3 types of N-fertilizers modeled in CA-GREET. Energy and emissions are converted to Btu or grams greenhouse gases per g of nutrient (fertilizer) or product (herbicide and pesticide). Average herbicide emissions are calculated using a weighted average of 4 herbicides and pesticide emissions are based on a single pesticide type. Table 2.02 below shows the greenhouse emissions for agricultural chemicals in grams per gram of nutrient for fertilizers and per gram of product for herbicides and pesticides. The equations are complex and not shown here since agricultural inputs apply to large variety of crop cultivation and are not specific to sugar cane cultivation. Table 2.02. Calculated GHG Emissions (g/g) Associated with Production of Agricultural Chemicals
GHG Type
Nitrogen (weighted average)
P2O5 K2O CaCO3
Herbicide (weighted average)
Pesticide
CH4 <0.01 <0.01 <0.01 <0.01 0.03 0.03 N2O <0.01 <0.01 <0.01 <0.01 <0.01 <0.01 CO2 2.39 0.98 0.66 0.60 20.53 23.87 Convert to GHG (g/g)
2.9 1.0 0.7 0.6 21.3 24.84
The greenhouse emissions of agricultural inputs are multiplied by chemical input factors (g/tonne) in the Ethanol sheet and a loss factor from the “Ag_Inputs” sheet to yield fertilizer emissions in grams per bushel of sugar cane produced. Table 2.03 below shows the calculations for CO2 emissions associated with the use of chemical inputs in g/tonne of sugar cane produced. Table 2.04 details the values used in calculations in Table 2.03. The equations for CH4 and N2O are analogous to these calculations and are not shown. Table 2.05 shows the emission results for all greenhouse gases for chemical use, based on the calculations shown in Table 2.03.

DRAFT – FOR REVIEW
28
Table 2.03. Calculated CO2 Emissions Associated with Production of Agricultural Chemicals
CO2 Emissions Chemical Product Formula
(g/tonne) (g/mmBtu) (gCO2/MJ)
Nitrogen (weighted average)
(A)*(B)*(C) 2,971 1,619
P2O5 (D)*(E)*(F) 118 64 K2O (G)*(H)*(I) 127 69 CaCO3 (J)*(K)*(L) 3,210 1,749 Herbicide (M)*(N)*(O) 552 301 Pesticide (P)*(Q)*(R) 53 29 Total CO2 emissions 7,031 3,832 3.63
Table 2.04. Calculated GHG Emissions (g/g) Associated with Production of Agricultural Chemicals
Variable Relevant Parameters Reference
A = Nitrogen input = 1,091.7 g/tonne CA-GREET default
B = Nitrogen chemical cycle emissions = 2.39 g/g Table 2.02
C = Nitrogen loss factor = 1.0 CA-GREET default
D = P2O5 input = 120.8 g/tonne CA-GREET default
E = P2O5 chemical cycle emissions = 0.98 g/g Table 2.02
F = P2O5 loss factor = 1.0 CA-GREET default
G = K2O input = 193.6 g/tonne CA-GREET default
H = K2O chemical cycle emissions = 0.66 g/g Table 2.02
I = K2O loss factor = 1.0 CA-GREET default
J = CaCO3 input = 5,337.7 g/tonne CA-GREET default
K = CaCO3 chemical cycle emissions = 0.60 g/g Table 2.02
L = CaCO3 loss factor = 1.0 CA-GREET default
M = Herbicide input = 26.9 g/tonne CA-GREET default
N = Herbicide chemical cycle emissions = 20.53 g/g Table 2.02
O = Herbicide loss factor = 1.0 CA-GREET default
P = Pesticide input = 2.21 g/tonne CA-GREET default
Q = Pesticide chemical cycle emissions = 23.87 g/g Table 2.02
R = Pesticide loss factor = 1.0 CA-GREET default Note: Loss Factor occurs during transportation due to evaporation, venting, etc.

DRAFT – FOR REVIEW
29
Table 2.05 shows the emission results (g/tonne) for all GHG emissions for production of chemicals used in agriculture based on the calculations shown in Table 2.03. The CH4 and N2O emissions results shown in Table 2.05 are calculated with the same equations as CO2 emission calculations, except that CO2 emission factors are replaced by CH4 and N2O emission factors. Table 2.05 also shows the WTT emissions on an energy basis. Note that converting from g/tonne to g/mmBtu is shown in a note below Table 2.05. To convert from g/mmBtu to gCO2e/mmBtu, non-CO2 gasses are adjusted using their respective GWPs. For CO and VOC, see note below Table 1.08. Table 2.05. Calculated GHG Emissions from Production of Agricultural Chemicals
GHG Type Nitrogen (weighted average)
P2O5 K2O CaCO3 Total
Fertilizer Herbicide (weighted average)
Pesticide Total
CH4 (g/tonne) 3.1 0.2 0.2 4.9 0.8 0.1 9.3 N2O (g/tonne) 1.8 <0.01 <0.01 0.05 <0.01 <0.01 1.8 CO2 (g/tonne) 2,971 118 127 3,210 552 53 6,743.4 GHGs (g/tonne) 3,579 124 133 3,344 574 55 7524.2 GHGs (g/mmBtu) 1,951 68 72 1,822 3,913 313 30 4,256
GHGs (g/MJ) 1.85 0.06 0.07 1.73 3.70 0.30 0.03 4
Note: To convert (g/tonne) to (g/mmBtu) = (g/tonne)/(Ethanol Yield (gal/tonne) * LHV of Anhydrous Ethanol (Btu/gal))*106. LHV of denatured ethanol is 76,330 Btu/gal and ethanol yield is assumed to be 24 gal/tonne. Impact of soil N2O emissions resulting from nitrogen fertilizer use on WTT GHG emissions CA-GREET also calculates direct field and downstream N2O emissions resulting from nitrogen fertilizer input. Table 2.06 below shows the two main inputs: fertilizer input (g/tonne) and percent conversion of N-input to N2O. The Table shows the N2O emissions on an energy basis. CA-GREET v1.8b assumes 2.0% of fertilizer-N is ultimately converted to N2O. The calculation also uses the mass ratio of N2O to N2 (44/28). N2 is used rather than N because two fixed N atoms are required for every N2O molecule formed. Table 2.06 provides total GHG impacts from soil N2O emissions. Table 2.06. Inputs and Calculated Emissions for Soil NO and N2O from Sugar Cane Farming
Fertilizer N
input (g/tonne)
Percent conversion
to N2O-N
N2O formed/ N2O-N (g/g)
N Converted(g/tonne)
N2O or NO Emissions(g/tonne)
GHG Emissions (g/mmBtu)
GHG Emissions
(gCO2e/MJ) N2O 1,091.7 1.3% 44/28 14.5 22.7 3,691 3.5 Total 3.5
Note: Soil N2O emissions = (1,091.8 g N/tonne)(1.3%)(44 g N2O/28 g N2) = 22.7 g N2O/tonne N2O Emissions: N in N2O as % of N in N fertilizer and biomass: CA-GREET default of 1.3%
DRAFT – FOR REVIEW
30
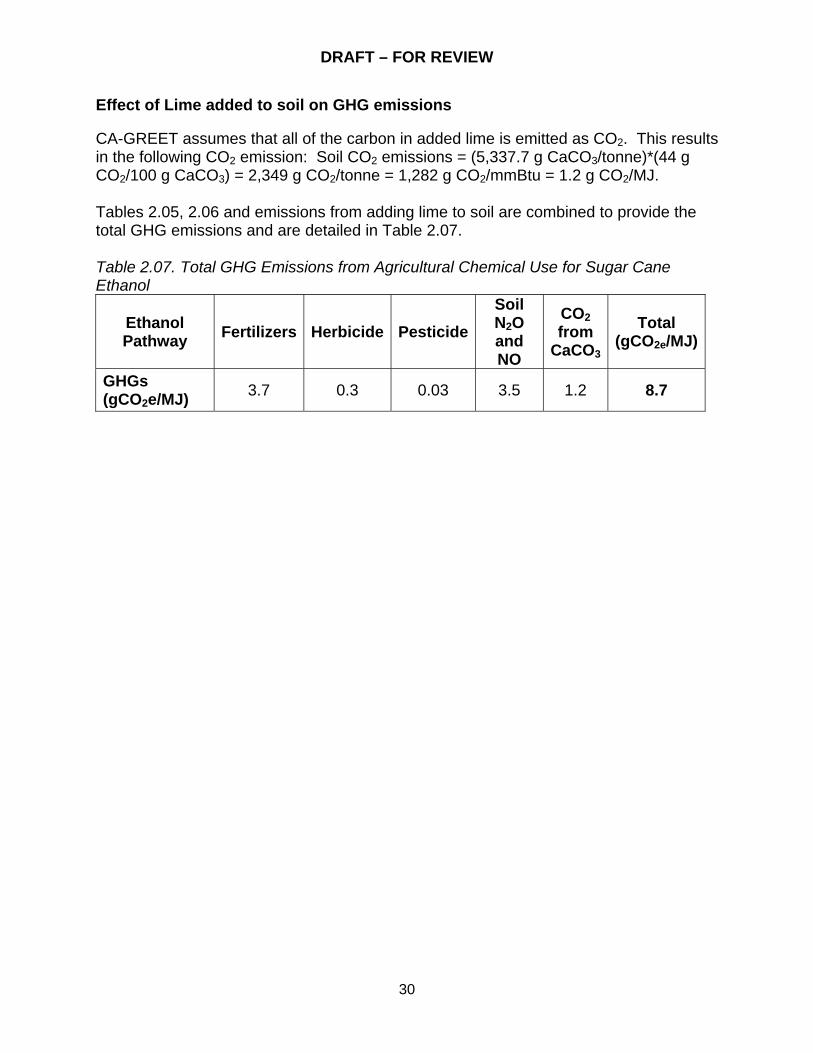
Effect of Lime added to soil on GHG emissions CA-GREET assumes that all of the carbon in added lime is emitted as CO2. This results in the following CO2 emission: Soil CO2 emissions = (5,337.7 g CaCO3/tonne)*(44 g CO2/100 g CaCO3) = 2,349 g CO2/tonne = 1,282 g CO2/mmBtu = 1.2 g CO2/MJ. Tables 2.05, 2.06 and emissions from adding lime to soil are combined to provide the total GHG emissions and are detailed in Table 2.07. Table 2.07. Total GHG Emissions from Agricultural Chemical Use for Sugar Cane Ethanol
Ethanol Pathway Fertilizers Herbicide Pesticide
Soil N2O and NO
CO2 from
CaCO3 Total
(gCO2e/MJ)
GHGs (gCO2e/MJ) 3.7 0.3 0.03 3.5 1.2 8.7

DRAFT – FOR REVIEW
31
(This page intentionally left blank.)

DRAFT – FOR REVIEW
32
SECTION 3. SUGAR CANE TRANSPORT

DRAFT – FOR REVIEW
33
3.1 Energy for Sugar Cane Transportation
CA-GREET calculates the total energy needed (Btu/tonne) to transport sugar cane from the field to the ethanol production facility using heavy duty trucks. Table 3.01 below shows the sugar cane transportation distance and energy inputs. The calculations are based on heavy duty truck capacities of 17 tonnes. The default transport distance is 12 miles. CA-GREET calculates the diesel energy per tonne mile based cargo capacity of the truck and its fuel economy and assumes that truck trips carrying sugar cane and returning empty use the same energy. All values are CA-GREET default values. Table 3.01. Sugar cane Transport Inputs
Transport Mode
Energy Intensity
(Btu/tonne-mile)
Distance from Origin
to Destination
(mi)
Capacity (tonnes)
Fuel Consumption
(mi/gal)
Energy Consumption
of Truck (Btu/mi)
Shares of Diesel
Used
Field to Ethanol Plant 1,511 12 17 5 25,690 100%
The calculated sugar cane transport energy on a Btu per tonne of sugar cane basis is shown below in Table 3.02 using the values in Table 3.01. Table 3.02. Sugar Cane Transport Energy
Transport Mode Energy Consumption (Btu/ton)
Field to Ethanol Plant
(12 miles one-way distance)*(1,511 Btu/ton-mile origin to destination + 1,511 Btu/ton-mile back-haul)*(Diesel share 100%)*(1+Diesel WTT Energy 0.157 Btu/Btu) /0.907 (tones/ton)= 47,200 Btu/ton
Total 47,200 (Btu/ton)
Total (anhydrous ethanol) 25,722 (Btu/mmBtu)
Note: To convert (Btu/ton) to (Btu/mmBtu) = (Btu/ton)/(0.907 tonnes/ton)/(Ethanol Yield (gal/tonne) * LHV of Anhydrous Ethanol (Btu/gal))*106. Diesel WTT energy is a CA-GREET calculation 3.2 GHG Calculations from Sugar Cane Transportation
GHG from sugar cane transportation are calculated from section 3.1 above with the same transportation mode, miles traveled, etc. as indicated by Table 3.01 above. Tables 3.03 below detail key assumptions of calculating GHG from sugar cane transportation. All values used in calculations are CA-GREET default values.

DRAFT – FOR REVIEW
34
Table 3.03. Key Assumptions in Calculating GHG Emissions from Sugar Cane
Transport Mode Energy
Intensity (Btu/tonne
-mile)
Distance from Origin to
Destination (mi)
CO2 Emission Factors of
Truck (g/mi)
WTT Transport Diesel Emissions
(g/mmBtu)
CO2 Emission Factors of
Diesel Combustion (g/mmBtu)
Sugar cane to plant by heavy duty truck
1,511 12 1999 (2,002)* 12,647 77809
(77,913)* Note: *values in parenthesis are for the return trips. Sugarcane transport emissions is first calculated on a g/ton basis and then finally converted to g/mmBtu and is shown in Table 3.04 below. Table 3.04. Sugar Cane Transport - CO2 Emissions in g/mmBtu
Transport Mode CO2 Emission (g/tonne)
CO2 Emission (g/mmBtu)
Sugar Cane to Ethanol Plant by Heavy Duty Truck 3,701 2,017
Total (gCO2/MJ anhydrous) 2.0 Note: Example formula to calculate CO2 emission of Heavy Duty Truck above: [((77,809 g/mmBtu)+(12,647 g/mmBtu)*(100% diesel used))*1,511 (Btu/ton-mile)+ ((77,913 g/mmBtu)+(12,647 g/mmBtu)*(100% diesel used))*1,511 Btu/ton-mile]*12 miles/0.907 ton/tonne/(106 mmBtu/Btu) = 3,710 g/tonne. To convert (g/tonne) to (g/mmBtu) = (g/tonne)/(Ethanol Yield (gal/tonne) * LHV of Anhydrous Ethanol (Btu/gal))*106. Similarly, CH4, N2O, VOC, and CO are calculated the same way (with different emission factors for each species) and shown in Table 3.05. Then all emissions are converted to CO2 equivalent are also shown. The emissions are shown on an anhydrous ethanol basis. Table 3.05. Sugar Cane Transport – Other GHG Emissions
Emissions Units CH4 N2O VOC CO CO2 GHG
(gCO2e/MJ) anhydrous
(g/tonne) 4.078 0.088 1.493 6.553 3,701
(g/mmBtu) 2.222 0.048 0.814 3.571 2,017 2,087
(g/MJ) <0.01 <0.01 <0.01 <0.01 2.0 2.0

DRAFT – FOR REVIEW
35
SECTION 4. ETHANOL PRODUCTION
DRAFT – FOR REVIEW
36
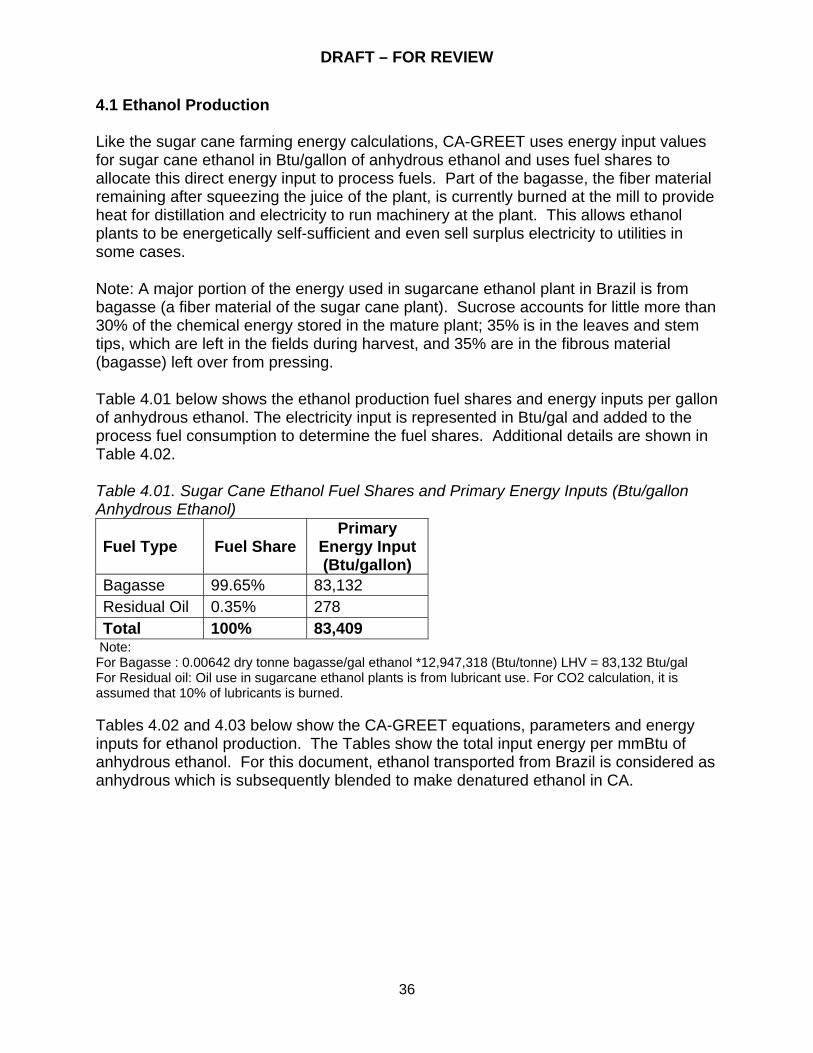
4.1 Ethanol Production
Like the sugar cane farming energy calculations, CA-GREET uses energy input values for sugar cane ethanol in Btu/gallon of anhydrous ethanol and uses fuel shares to allocate this direct energy input to process fuels. Part of the bagasse, the fiber material remaining after squeezing the juice of the plant, is currently burned at the mill to provide heat for distillation and electricity to run machinery at the plant. This allows ethanol plants to be energetically self-sufficient and even sell surplus electricity to utilities in some cases.
Note: A major portion of the energy used in sugarcane ethanol plant in Brazil is from bagasse (a fiber material of the sugar cane plant). Sucrose accounts for little more than 30% of the chemical energy stored in the mature plant; 35% is in the leaves and stem tips, which are left in the fields during harvest, and 35% are in the fibrous material (bagasse) left over from pressing.
Table 4.01 below shows the ethanol production fuel shares and energy inputs per gallon of anhydrous ethanol. The electricity input is represented in Btu/gal and added to the process fuel consumption to determine the fuel shares. Additional details are shown in Table 4.02. Table 4.01. Sugar Cane Ethanol Fuel Shares and Primary Energy Inputs (Btu/gallon Anhydrous Ethanol)
Fuel Type Fuel Share Primary
Energy Input(Btu/gallon)
Bagasse 99.65% 83,132 Residual Oil 0.35% 278 Total 100% 83,409
Note: For Bagasse : 0.00642 dry tonne bagasse/gal ethanol *12,947,318 (Btu/tonne) LHV = 83,132 Btu/gal For Residual oil: Oil use in sugarcane ethanol plants is from lubricant use. For CO2 calculation, it is assumed that 10% of lubricants is burned. Tables 4.02 and 4.03 below show the CA-GREET equations, parameters and energy inputs for ethanol production. The Tables show the total input energy per mmBtu of anhydrous ethanol. For this document, ethanol transported from Brazil is considered as anhydrous which is subsequently blended to make denatured ethanol in CA.

DRAFT – FOR REVIEW
37
Table 4.02. Sugar Cane Ethanol Formulas, Parameters and Total Energy
Fuel Type Formula Relevant Parameters Total Energy
Dry tonne bagasse/gal ethanol = 0.00642 tonne/gal
Bagasse Dry tonne bagasse/gal ethanol *Bagasse LHV Bagasse LHV = 12,947,318
Btu/tonne (CA-GREET default)
83,132 (Btu/gal)
Direct residual oil input = 251 Btu/gal WTT crude oil energy = 31,657 Btu/mmBtu Loss Factor = 1
Residual Oil
(Direct Residual Oil Input)* (1+(WTT Crude Oil Energy*Loss Factor + WTT of residual oil)/106) WTT of residual oil =
74,001Btu/mmBtu
284 (Btu/gal)
Total energy input for ethanol production (Btu/gal) 83,415 (Btu/gal)
Total energy input for ethanol production (Btu/mmBtu anhydrous ethanol)
83,415 Btu/gal / (76,330 Btu/gal) *106*1.001
Btu/mmBtu 1,093,376(Btu/mmBtu)
Note: 1.001 is the loss factor by CA-GREET default 4.2 GHG Emissions from Ethanol Production
Sugar cane mill ethanol production in Brazil is assumed here to use dry bagasse as fuel for small boilers (99.65%). A relatively small amount of residual oil is also utilized in the process (about 0.35%). GHG from ethanol production by burning bagasse is calculated based on the assumptions in Table 4.03 below and the results are shown in Table 4.04. The CO2 emissions shown in Table 4.03 include the direct boiler emissions (118,834 g/mmBtu) of bagasse; residual oil emissions include emissions from an industrial boiler (85,045 g/mmBtu) and direct WTT residual oil use in the boiler. CO2 is credited to the ethanol production process resulting from biomass (bagasse) burning. Table 4.03. Process Shares and Emission Factors (EF) of Ethanol Production
EtOH Production Equipment and
Fuel Used
% Shares
of Equip. Usage
CO2 EF (g/mmBtu
of fuel burned)
VOC EF
CO EF
CH4 EF
N2O EF
Assumed % of Fuels used at the EtOH Plant
Direct Energy
Use (Btu/gal)
Small industrial boiler (10-100mmBtu/hr input) to burn bagasse
100% 118,834 5.34 76.8 31.6 4.2 99.65% 83,132
Residual oil industrial boiler 10% 85,045 0.9 15.8 3.2 0.4 0.35% 284

DRAFT – FOR REVIEW
38
Table 4.04. Calculated GHG Emissions for Ethanol Production Using CO2 Factors from Table 4.03
Calculations CO2 in g/gal Conversion to g/mmBtu
Results g- CO2e/mmBtu
Bagasse burning in EtOH Production
CO2 Small industrial boiler
(Direct energy use of bagasse, Btu/gal) *(118,834 g/mmBtu)*1.001/106
9,881 9,881 g/gal/(76,330 Btu/gal)*106 129,519
CO2 credit from bagasse burning
Bagasse burning = -(0.00642 tonne/gal *46.3% carbon content *2000lbs/tonne*454 g/lbs)*44/12
-9,897 -9,897 g/gal/(76,330 Btu/gal)*106 -129,732
EtOH Production
CH4 34.52 963.5
N2O 4.6 1,395
Total GHG EtOH Production (g CO2e/mmBtu) (after converting CO and VOC to GHG) 2,021
Residual Oil
CO2 of small industrial boiler
(Direct energy use of residual oil, Btu/gal) *10%* (85,045 g/mmBtu) /106
2.1 (2.1 g/gal) /(76,330 Btu/gal)*106 28.0
CO2 for WTT of crude oil
(Direct energy use of residual oil, Btu/gal) *10%* (3,260 g/mmBtu)*1/106
0.1 (0.1 g/gal) /(76,330 Btu/gal)*106 1.1
CO2 for WTT of residual oil
(Direct energy use of residual oil, Btu/gal) *10%* (5,607 g/mmBtu)/106
0.1 (0.16 g/gal) /(76,330 Btu/gal)*106 1.8
VOC (Direct energy use of residual oil, Btu/gal)*(0.9 g/mmBtu) /106
<0.01 (<0.01 g/gal)/ (76,330 Btu/gal)*(3.1)*106 <0.01
CO (Direct energy use of residual oil, Btu/gal) * (15.8 g/mmBtu) /106
<0.01 (<0.01 g/gal)/ (76,330 Btu/gal)*(1.6)*106 0.08
Total GHGs for Residual Oil (gCO2e/mmBtu) 31.0 Total GHGs for ethanol production (gCO2e/mmBtu) 2,021 Total GHGs for ethanol production (gCO2e/MJ) 1.9
Note: Feed Loss Factor is assumed at 1. Small amounts of CH4 and N2O are negligible. Carbon ratio of bagasse is 46.3% by CA-GREET default. The 10% allocation of residual oil to ethanol is a CA-GREET default value. The 10% is to account for lubricating oil that is used not as a combustion source but is lost during the operation of the machinery involved in ethanol production. For this document, the lubricating oil is modeled as residual oil and its WTT emissions are used as a surrogate for lubricating oil.

DRAFT – FOR REVIEW
39
(This page intentionally left blank.)
DRAFT – FOR REVIEW
40
SECTION 5. ETHANOL TRANSPORT AND DISTRIBUTION

DRAFT – FOR REVIEW
41
5.1 Energy for Ethanol Transportation and Distribution
For CA-GREET pathway, the default sugarcane ethanol transport and distribution (T&D) from Brazil to the U.S is divided as follows:
• From ethanol plant in Brazil to U.S ports: o Inside Brazil: 50% by rail (500 miles) and 50% by pipeline (500 miles) o From Brazilian ports to U.S ports by ocean tanker (7,416 miles)
• From U.S ports to distribution centers inside U.S o 100% by Heavy Duty Truck (100 miles)
• For distribution within U.S o 80% by truck (50 miles) o 20% directly from ports to blending terminals
Instead of calculating the WTT values on a per tonne basis as CA-GREET does for the sugar cane transport component, CA-GREET calculates WTT energy required per mmBtu of fuel (anhydrous ethanol) transported. Table 5.01 below shows the major inputs used in calculating transport energy and Table 5.02 presents the CA-GREET formulas used to calculate the ethanol transport energy for each transport mode. Table 5.01. Inputs and Calculated Energy Requirements for Ethanol Transport to Bulk Terminals
Transport Mode Energy
Intensity (Btu/tonn
e-mile)
Distance from Origin
to Destination
(mi)
Capacity (tonnes)
Fuel Used (mi/gal)
Energy Used (Btu/mi for
truck) (Btu/hp hr for ship)
Shares of Diesel
Used
% Fuel Transported
by Mode
Pipeline 253 500 110 n/a n/a 20% 50% Brazil Plant to Brazil port Rail 370 500 n/a n/a n/a 100% 50%
32 7,416 150,000 19 4,620 100% 100% Brazil port to U.S port
Ocean Tanker 29 7,416 150,000 19 4,691 100% 100%
U.S port to distribution center inside U.S
Heavy Duty Truck
1,028 100 33 5 25,690 100% 100%
Distribution to blending terminal inside U.S
Heavy Duty Truck
1,028 50 33 5 25,690 100% 80%
Note: Pipeline use 20% diesel, 6% electricity, 24% natural gas, the remaining 50% is residual oil. Ocean tanker travel from origin and back has different energy consumption. For ethanol distributed in the U.S, 20% ethanol is directly transported to blending terminal by CA-GREET default.
DRAFT – FOR REVIEW
42
Table 5.02. CA-GREET Calculations for Ethanol Transport Energy (Btu/mmBtu Anhydrous Ethanol) by Transport Mode
Transport Mode CA-GREET Formula Relevant Parameters Btu/mmBtu
Transport Pipeline within Brazil
- 6% electricity use: (106/A)*B)/((g/lb)*(lb/tonne)* (C)*(D)*[6%*(H)*100%] = 440 - 20% diesel use: (106/A)*B)/((g/lb)*(lb/tonne)*(C)*(D)* [20%*100%*(1+(F)] = 1,260 - 50% residual oil: (106/A)*B)/((g/lb)*(lb/tonne)*(C)*(D)* [50%*100%*(1+(G)] = 3,010 - 24% NG Use: 106/A)*B)/((g/lb)*(lb/tonne)*(C)*(D)* [24%*100%*(1+(K)] = 1,402
A = Ethanol LHV = 76,330 Btu/gal B = Ethanol density = 2,988 g/gal C = Mi traveled = 500 D = Energy intensity = 253 (Btu/tonne-mile) E = %Diesel Share = 20% F = Diesel energy = 0.157 Btu/Btu G = Residual oil energy = 0.106 Btu/Btu H = Electricity Energy in Brazil = 1.347 Btu/Btu K= NG energy = 0.073 Btu/Btu
6,202
Transport Rail within Brazil
100% diesel use: 106/A*B/((g/lb)*(lb/tonne)*I*K*[E*(1+F)]
I = Mi traveled = 500 J = % Electricity share = 0% K = Rail energy intensity = 370 Btu/tonne-mile
9,414
Transport Ocean Tanker to U.S ports
106/A*B((g/lb)*(lb/tonne)*(L*(M+N)*100%(1+G)
L = Mi travel = 7,416 miles M = energy intensity from origin = 32 Btu/tonne-mile N = energy intensity from destination = 29 Btu/tonne-mile
21,992
Total EtOH Transportation used in Brazil = 50%*6202 + 50%*9414 + 21992 = 29,800 Transport Within U.S
106/A*B((g/lb)*(lb/tonne)*(O*(P+P)*100%(1+F)
O = Mi travel = 100 miles P = energy intensity = 1,028 10,459
Total EtOH Transportation 40,259
Distribution 106/A*B((g/lb)*(lb/tonne)*(Q*(P+P)*100%(1+F)*80%
Q = Mi traveled = 50 80% = shares of truck travel 4,183
T&D Total (Btu/mmBtu ethanol) 44,442 Note: The energy intensity for heavy duty trucks is multiplied by 2 to account for return trip.

DRAFT – FOR REVIEW
43
5.2 GHG Calculations from Ethanol Transportation and Distribution
Similar to sugar cane T&D, ethanol T&D to bulk terminal is assumed in CA-GREET model by rail and pipeline inside Brazil, then ocean tanker from Brazilian ports to U.S ports, and finally from trucks to terminal within U.S. All the key assumptions are the same as sugar cane T&D’s and are shown in Table 5.03. The values in this table do not reflect the mode shares. Table 5.03. Key Assumptions in Calculating GHG Emissions from EtOH Transportation
Transport Mode Transport Fuel
1-way Energy Intensity
(Btu/tonne-mile) (Values
in parenthesis for return trip)
Distance from Origin to
Destination(mi)
WTT Fuel CO2 Emissions of transportation
fuels (g/mmBtu)
CO2 Emission Factors of Diesel
Combustion (g/mmBtu)
50% Rail Diesel 370 500 12,647 77,623
Electricity 18,504 -
Diesel 12,647 Turbine: 78,179 Reciprocating
Engine: 77,337
Residual Oil 8,867
Turbine: 85,061 Reciprocating
Engine: 84,219
50% Pipeline
Natural Gas
253 500
5,218 Turbine: 58,044 Reciprocating
Engine: 56,013 100% Ocean Tanker
Residual Oil
32 (29) 7,416 8,867 84,102
100% Heavy Duty Truck
Diesel 1,713 100 12,647 77,809 (77,913)
80% Heavy Duty Truck Diesel 1,713 30 12,647 77,809
(77,913) Note: It is assumed that all locomotives use diesel. Values in parenthesis are for the return trips The results are shown below in Table 5.04. The WTT emissions shown in the Table for each GHG species is calculated in the T&D tab of CA-GREET. The equation for CO2 from rail is shown below and the calculations for the other transport modes and GHG gases are done similarly. VOC and CO emissions are not shown in Table 5.04, which contribute 8.7 g/mmBtu and 18.6 g/mmBtu (on a CO2-equivalent basis), respectively. CA-GREET also includes 19.7 g/mmBtu VOC fugitive emissions (62 g/mmBtu CO2-

DRAFT – FOR REVIEW
44
equivalent). Note that only one-way rail emissions are counted, whereas an extra term exists in the calculation for truck transport to account for the return truck trip; emissions from the return trip are assumed to be equal to emissions for the trip from the origin to destination. Sample Calculation: Rail CO2 emissions = (Ethanol density 2,988 g/gal)/(Ethanol LHV 76,330 Btu/gal)/[(454 g/lb)*(2,000 lbs/tonne)]*[(Diesel emission factor 77,623 g/Btu)+(Diesel WTT emissions 12,647 g/mmBtu)]*(370 Btu/tonne-mile)*(500 miles)*(50% mode share) = 360 g/mmBtu anhydrous ethanol (see Table 5.04). Table 5.04. EtOH Transport and Distribution - CO2e Emissions in g/mmBtu
CH4 Emissions (g/mmBtu)
N2O Emissions
(g/mmBtu)
CO2e (g/mmBtu)
Transport Mode
CO2 Emissions, Excluding VOC and
CO (g/mmBtu) actual as CO2e actual as CO2e
Transported by Pipeline 449 0.77 0.77*25=19 0.01 0.01*298=
3 471
Transported by Rail 737 0.83 0.83*25=21 0.02 0.02*298=
6 764
Transported by Ocean Tanker
1,856 1.97 1.97*25=49 0.04 0.04*298= 12 1,917
2,449* 3,152 Transported by Heavy Duty Truck
820 0.9 23 0.02 6 859
Distributed by Heavy Duty Truck
328 0.2 5 0.00 1 334
Total 3,597 3.9 98 0.1 24 4,345 Total (gCO2e/MJ, anhydrous ethanol) 4.1
Note: *In Brazil, assumed 50% EtOH transportation travel by rail and 50% by truck

DRAFT – FOR REVIEW
45
(This page intentionally left blank.)
DRAFT – FOR REVIEW
46
APPENDIX B
ETHANOL PATHWAY INPUT VALUES (FROM BRAZIL SUGAR CANE)

DRAFT – FOR REVIEW
47
Scenario: Ethanol made in Brazil from Brazil sugar cane and transported to California.
Parameters Units Values Note
GHG Equivalent CO2 1 CH4 25 N2O 298 VOC 3.1 CO 1.6
Sugar Cane Cultivation Fuel Use Shares Diesel 38.3% Gasoline 12.3% Natural Gas 21.5% LPG 18.8% Electricity 9% Cultivation Equipment Shares Diesel Farming Tractor 80%
CO2 Emission Factor g/mmBtu 77,411 Diesel Engine 20%
CO2 Emission Factor g/mmBtu 77,349 Gasoline Farming Tractor 80%
CO2 Emission Factor g/mmBtu 75,645 NG Engine 100%
CO2 Emission Factor g/mmBtu 57,732 LPG Commercial Boiler 100%
CO2 Emission Factor g/mmBtu 68,036 Sugar Cane Farming Sugar Cane energy use Btu/tonne 41,592 Sugar Cane harvest yield lbs/tonne tonne/acre Land Use from Sugar cane farming g/tonne 195 Sugar cane T&D Transported from Sugar Cane Field to Stack by medium truck miles 10 2,199 Btu/mile-tonne Energy Intensity fuel consumption mi/gal 7.3 capacity 8 tonnes/trip CO2 emission factor g/mi 1,369 Transported from Stack to EtOH Plant by heavy duty diesel truck miles 40 1,713 Btu/mile-tonne Energy Intensity fuel consumption mi/gal 5 capacity 15 tonnes/trip CO2 emission factor g/mi 1,999 Chemicals Inputs Nitrogen g/tonne 1,092 NH3 Production Efficiency 82.4% Shares in Nitrogen Production 70.7% CO2 Emission Factor g/g 2.475 Urea

DRAFT – FOR REVIEW
48
Parameters Units Values Note Production Efficiency 46.7% Shares in Nitrogen Production 21.1% Ammonium Nitrate Production Efficiency 35% Shares in Nitrogen Production 8% P2O5 g/tonne 149 H3PO4 Feedstock input tonnes n/a H2SO4 Feedstock input tonnes 2.674 Phosphor Rock Feedstock input tonnes 3.525 K2O g/tonne 193.6 CaCO3 g/tonne 5,337.7 Herbicide g/tonne 8.1 Pesticide g/tonne 2.21 CO2 from CaCO3 use g/tonne 2,349 Sugar Can Straw Burning Credit g/tonne -349,067
EtOH Production Yield EtOH Yiel gal/wet tonne 24
Sugar Cane Straw Yield Dry tonne/tonne sugar cane
0.19 CA-GREET Default
Bagasse Burning/gal EtOH Yield Dry tonne/gal 0.00642 CA-GREET Default Production Energy use for Sugar Cane Mill EtOH Btu/gal 251 CA-GREET Default From Residual Oil 0.3% Residual Oil Industrial Boiler g/mmBtu 85,045 CA-GREET Default From Bagasse burning 99.7% Bagasse –burned, small Industrial Boiler g/mmBtu 118,834 CA-GREET Default EtOH T&D Transported by rail – inside Brazil miles 500 370 Btu/mile-tonne Energy Intensity Transported by pipeline – inside Brazil miles 500 253 Btu/mile-tonne Energy Intensity Transported by Ocean Tanker to U.S. miles 7,416 26 Btu/mile-tonne Energy Intensity from original From U.S. back to Brazil miles 7,416 39 Btu/mile-tonne Energy Intensity from destination Transported by HHD truck to distribution center miles 100 1,028 Btu/mile-tonne Energy Intensity both ways Transpoted by HHD truck to blending terminal Miles 50 1,028 Btu/mile-tonne Energy Intensity both ways Fuels Properties LHV (Btu/gal) Density (g/gal) Crude 129,670 3,205 CA-GREET Default Residual Oil 140,353 3,752 CA-GREET Default Conventional Diesel 128,450 3,167 CA-GREET Default Conventional Gasoline 116,090 2,819 CA-GREET Default CaRFG 111,289 2,828 CA-GREET Default CARBOB 113,300 2,767 CA-GREET Default Natural Gas 83,868 2,651 As liquid EtOH 76,330 2,988 Anhydrous ethanol (neat) EtOH 77,254 2,983 Denatured ethanol (2.5% by volume) Bagasse (Btu/dry tonne) 12,947,318 n/a CA-GREET Default