detection of ac machines insulation health state based on ... · pdf filecurrent sensors and...
TRANSCRIPT

Detection of AC Machines Insulation Health State based on Evaluation of Switching Transients using Two
Current Sensors and Eigenanalysis-based Parameter Estimation
C. Zoeller, Th. Winter, Th. M. Wolbank Institute of Energy Systems and Electrical Drives
Vienna University of Technology Vienna, Austria
M.A.Vogelsberger GSC/PPC-Drives VI
Bombardier Transportation Austria GmbH Vienna, Austria
Abstract—Application of monitoring systems is growing in modern drive applications to ensure continuous operability. Insulation health state can be examined offline by evaluating the transient reaction to a voltage step excitation. Using the inverter as a source of excitation, it is possible to perform an insulation test by evaluating the resulting transient current sensor signals available in modern drives. The trace of the machine’s transient current reaction is influenced by parameters like the parasitic winding capacitances. Due to degradation of the winding insulation these parasitic parameters change and as a consequence also the shape of the transient current signal is changed. As the degradation induced changes in the signal are no very prominent, measurement procedure and signal processing play an important role in the estimation of the insulation health state. In the following, a method is presented to derive an insulation health state indicator based on the availability of two phase current sensors only and using eigenanalysis of the transient signal frequencies. The performance of the health state indicator derived is verified on a 1.4MW induction machine with preformed stator coils equipped with additional tapings.
I. INTRODUCTION The demand for monitoring systems to prevent
breakdowns of modern drive systems is continuously increasing. Adjustable speed drives offer high dynamic performance and are used for example in safety-critical applications as well as in public and cargo transportation systems. In both fields the breakdown of a drive is linked with high economic costs as well as significant loss of image. With a probability of 35%, stator related faults are the second most common faults, causing a machine outage, as described in [1] and [2]. Thereof, about 70% are based on failure of the stator insulation system. The need for monitoring systems and a review on diagnostics methods is
also given in [3]. To ensure the demanded reliable and safe operation over a long period without high maintenance costs, fault diagnosis focusing on the condition of the stator insulation system, seems to be a good approach. It is desirable that a decrease in the strength of the insulation system, resulting in severe failures and breakdown, is identified in an early stage. The requirements for such a monitoring system are the possibility to work with minimum number of components. The slow proceeding degradation of insulation systems, sometimes even over decades, affects the high frequency behavior of the machine. According to [4] and [5] the parasitic components of a winding system, e.g. turn to turn, winding to ground capacities, change after high number of thermal- or mechanical aging cycles are applied. The capacitance in all cases is usually considered as the dominant parameter for insulation health state evaluation. Different stresses like electrical, thermal, thermo-mechanical, mechanical and environmental are given as main causes for a reduced insulation lifetime [6]. A degraded insulation at first leads to a turn to turn fault and finally to severe ground faults as described in [7]. With inverter-fed operation the insulation additionally suffers from steep voltage changes with switching times in the range of hundred ns. In combination with the improper terminated transmission lines from the inverter to the machine, transient overvoltage occurs on the end of the line, which can reach 2-4 times of the DC-link voltage, as investigated in [8] and [9] for instance, and accelerate the degradation. The degradation will cause changes in the transient part of the current response after step excitation.
An approach for monitoring the condition of the stator insulation for failure-prone inverter-fed machines is given in
The work to this investigation was supported by the Austrian ResearchPromotion Agency (FFG) under project number 83 84 78.
978-1-4799-5776-7/14/$31.00 ©2014 IEEE 3111

[10]. The main concept of the proposed technique is to apply a DC and/or variable frequency AC test voltage to the stator insulation using the inverter, to perform standard off-line insulation tests whenever the motor is not operating. Through detecting changes in the leakage current of the system the groundwall insulation state is analyzed. In [11] fault diagnosis of electric machines using frequency domain techniques are described, especially ones based on fast Fourier transforms (FFT). For instance, analyses of the line current harmonics, generally known as motor current signature analysis (MCSA), are applied to detect possible stator inter-turn faults. This approach aims to detect a fault, which is already present. The detection of stator faults with analyzing the terminal voltage harmonics requires additional voltage sensors, often not available in modern drives.
An overview about the technical details and structure of stator insulations is described in [6]. Regarding the basic larger machines with nominal power of few MW, the stator insulation system mainly consists of the components strand, turn and groundwall insulation. At machines with a random-wound insulation system, the strand insulation can function as the turn insulation and only in key areas additional insulation exists. As an alternative, offline insulation monitoring methods which are often described in the context of insulation degradation are e.g. polarization index (PI [12] – the ratio of two measured insulation resistance values after different time periods), dissipation factor tan δ, partial discharge (PD) [13] tests or capacitance tests using a capacitance bridge or a vector network analyzer.
In [14] insulation condition monitoring based on the evaluation of the current response signal using three current sensors signals is shown. The method is based on analysis of the transient part of the current sensor signals immediately after voltage step excitation. Each single phase insulation condition is analyzed with the corresponding current sensor. In most modern drives, only two phase current sensors are available due to economic reasons. The reconstruction of the missing phase current signal using the summation of the other two sensors is only applicable in the frequency range of the machines fundamental frequency. In the following, a procedure is proposed that is able to monitor the insulation health state despite the reduced number of sensors based on the combination and comparison of different excitation step voltages. In addition, a new signal processing method is proposed using eigenanalysis-based parameter estimation of the transient signal part. The advantage of the method proposed in this paper is the applicability of the monitoring system as an online, noninvasive insulation monitoring.
II. BASIC PRINCIPLE OF INSULATION HEALTH STATE MONITORING
The basic idea of the monitoring method is to detect changes in the parasitic capacitance caused by insulation degradation by measuring the system reaction to a voltage step excitation using the inverter as well as the current sensors available. The capacitance change in this
investigation is realized by placing small capacitors parallel to parts of the phase or coils using the tapings of the machine windings. Due to the fact that an aged insulation would lead to a changed parasitic capacitance, the approach of placing a capacitor as a fault component is chosen to emulate the insulation deterioration. The capacitive change is in accordance to the investigations in [4]-[5]. The severity of the insulation degradation is defined by the value of the placed capacitor. The influence of such an induced change in parasitic capacitance is shown in Fig. 1.The dashed red trace shows the voltage step (2.8kV DC-link voltage) realized by the inverter, applied to the non-magnetized test machine. The blue trace depicts the resulting current response for the ‘healthy’ winding without additional parasitic capacitance. When stimulating a change in the parasitic capacitance by placing a capacitor of 15nF parallel to the first coil a changed current response (green trace) is obtained. The current sensors are standard industrial current transformers with a bandwidth of 150 kHz and a di/dt of 50A/µs and are also used for the control of the machine.
Fig. 1 Resulting phase current signal to voltage step excitation in corresponding phase
As the frequency range of interest is outside the specification of the sensors their signal accuracy is clearly reduced, however their transfer functions are still reproducible. Thus changes in the step response can detected with sufficient accuracy. A deviation of the current response from the ‘healthy’ configuration (blue) can thus be interpreted as change in the parasitic parameters and thus deterioration of the insulation system. For analyses of the deviation of the signal response (from healthy machine condition), frequency domain representation is preferred to time domain representation. The whole signal processing chain starts with the accurate detection of the actual switching instant that differs from the instant of the switching command Fig. 2 (0µs). The actual switching instant is detected with an averaging and exponential smoothing algorithm. The focus at this approach lies on the implementation on an FGPA and the sufficient real-time applicability. The weight factors and thresholds for the exponential weighted moving average have to be defined before the algorithm is applied. This is followed by a removal of the mean current derivative (green dotted line) resulting from the low frequency machine properties, as well
3112
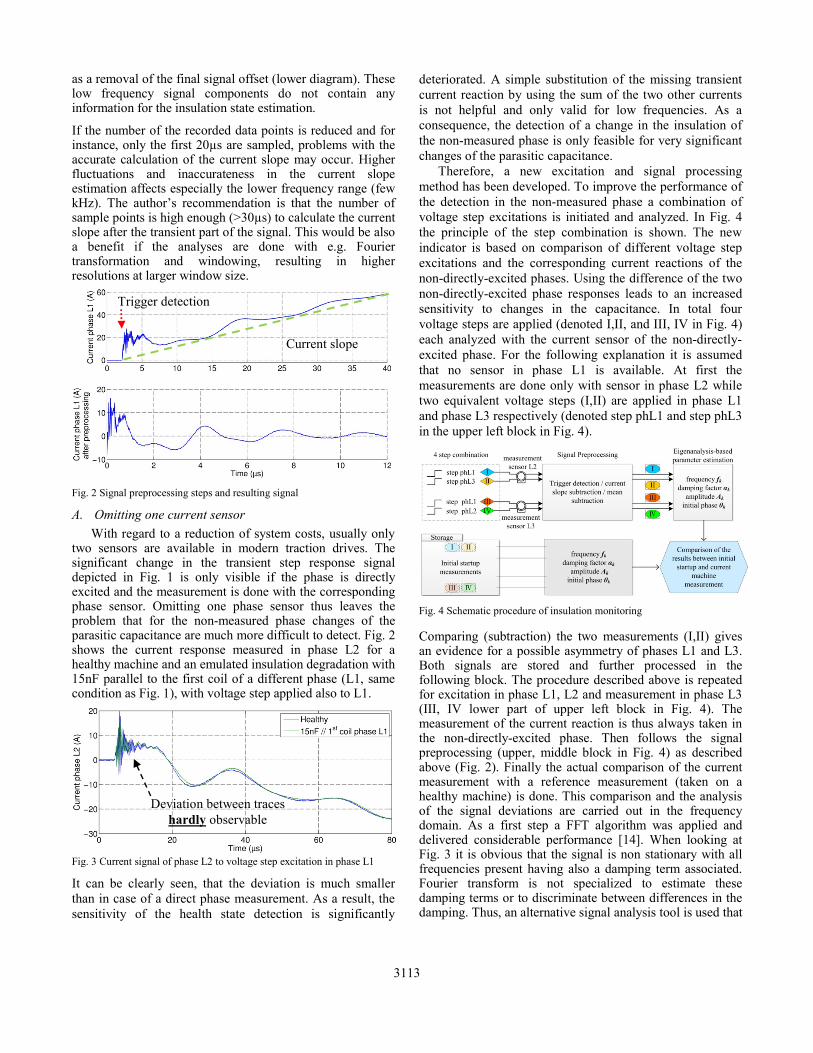
as a removal of the final signal offset (lower diagram). These low frequency signal components do not contain any information for the insulation state estimation.
If the number of the recorded data points is reduced and for instance, only the first 20µs are sampled, problems with the accurate calculation of the current slope may occur. Higher fluctuations and inaccurateness in the current slope estimation affects especially the lower frequency range (few kHz). The author’s recommendation is that the number of sample points is high enough (>30µs) to calculate the current slope after the transient part of the signal. This would be also a benefit if the analyses are done with e.g. Fourier transformation and windowing, resulting in higher resolutions at larger window size.
Fig. 2 Signal preprocessing steps and resulting signal
A. Omitting one current sensor With regard to a reduction of system costs, usually only
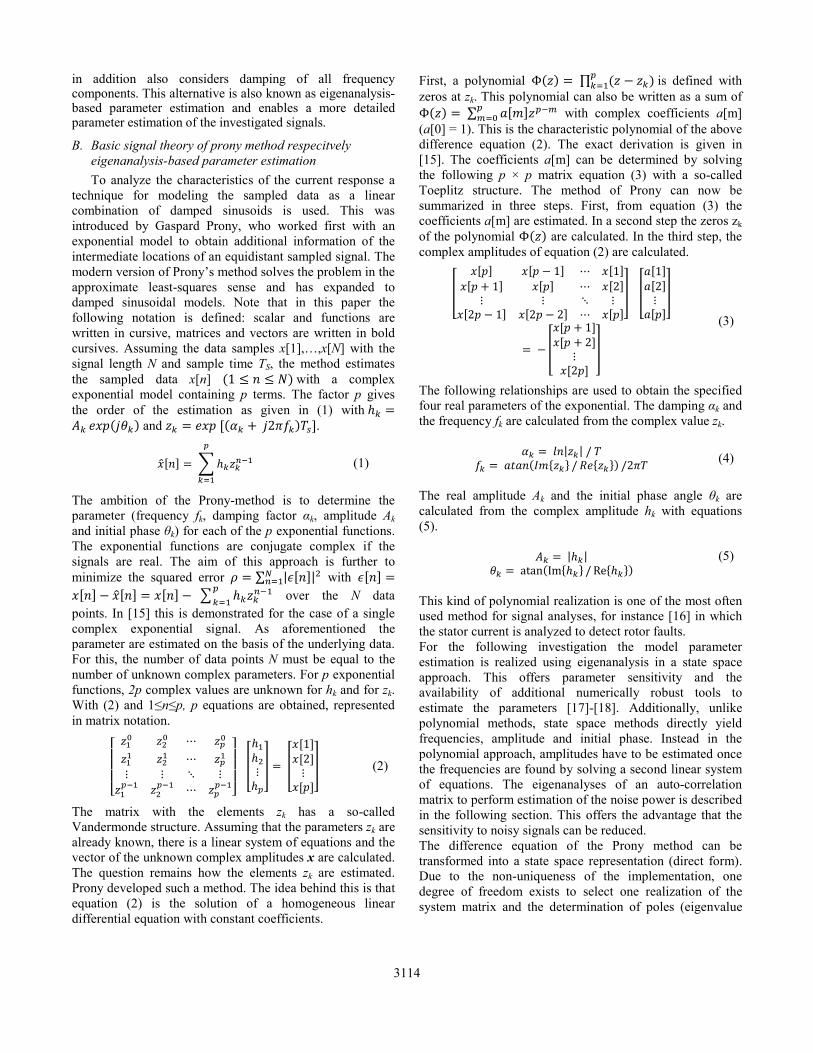
two sensors are available in modern traction drives. The significant change in the transient step response signal depicted in Fig. 1 is only visible if the phase is directly excited and the measurement is done with the corresponding phase sensor. Omitting one phase sensor thus leaves the problem that for the non-measured phase changes of the parasitic capacitance are much more difficult to detect. Fig. 2 shows the current response measured in phase L2 for a healthy machine and an emulated insulation degradation with 15nF parallel to the first coil of a different phase (L1, same condition as Fig. 1), with voltage step applied also to L1.
Fig. 3 Current signal of phase L2 to voltage step excitation in phase L1
It can be clearly seen, that the deviation is much smaller than in case of a direct phase measurement. As a result, the sensitivity of the health state detection is significantly
deteriorated. A simple substitution of the missing transient current reaction by using the sum of the two other currents is not helpful and only valid for low frequencies. As a consequence, the detection of a change in the insulation of the non-measured phase is only feasible for very significant changes of the parasitic capacitance.
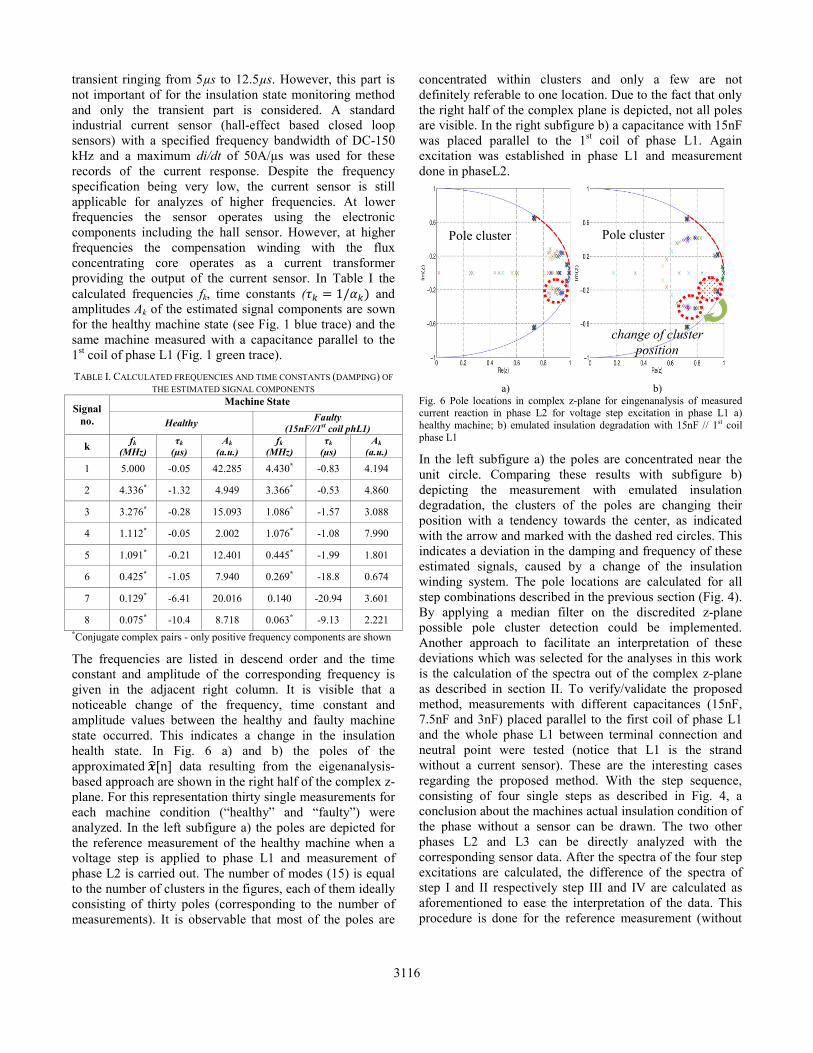
Therefore, a new excitation and signal processing method has been developed. To improve the performance of the detection in the non-measured phase a combination of voltage step excitations is initiated and analyzed. In Fig. 4 the principle of the step combination is shown. The new indicator is based on comparison of different voltage step excitations and the corresponding current reactions of the non-directly-excited phases. Using the difference of the two non-directly-excited phase responses leads to an increased sensitivity to changes in the capacitance. In total four voltage steps are applied (denoted I,II, and III, IV in Fig. 4) each analyzed with the current sensor of the non-directly-excited phase. For the following explanation it is assumed that no sensor in phase L1 is available. At first the measurements are done only with sensor in phase L2 while two equivalent voltage steps (I,II) are applied in phase L1 and phase L3 respectively (denoted step phL1 and step phL3 in the upper left block in Fig. 4).
Fig. 4 Schematic procedure of insulation monitoring
Comparing (subtraction) the two measurements (I,II) gives an evidence for a possible asymmetry of phases L1 and L3. Both signals are stored and further processed in the following block. The procedure described above is repeated for excitation in phase L1, L2 and measurement in phase L3 (III, IV lower part of upper left block in Fig. 4). The measurement of the current reaction is thus always taken in the non-directly-excited phase. Then follows the signal preprocessing (upper, middle block in Fig. 4) as described above (Fig. 2). Finally the actual comparison of the current measurement with a reference measurement (taken on a healthy machine) is done. This comparison and the analysis of the signal deviations are carried out in the frequency domain. As a first step a FFT algorithm was applied and delivered considerable performance [14]. When looking at Fig. 3 it is obvious that the signal is non stationary with all frequencies present having also a damping term associated. Fourier transform is not specialized to estimate these damping terms or to discriminate between differences in the damping. Thus, an alternative signal analysis tool is used that
Deviation between traces hardly observable
Current slope
Trigger detection
3113
in addition also considers damping of all frequency components. This alternative is also known as eigenanalysis-based parameter estimation and enables a more detailed parameter estimation of the investigated signals.
B. Basic signal theory of prony method respecitvely eigenanalysis-based parameter estimation To analyze the characteristics of the current response a
technique for modeling the sampled data as a linear combination of damped sinusoids is used. This was introduced by Gaspard Prony, who worked first with an exponential model to obtain additional information of the intermediate locations of an equidistant sampled signal. The modern version of Prony’s method solves the problem in the approximate least-squares sense and has expanded to damped sinusoidal models. Note that in this paper the following notation is defined: scalar and functions are written in cursive, matrices and vectors are written in bold cursives. Assuming the data samples x[1],…,x[N] with the signal length N and sample time TS, the method estimates the sampled data x[n] 1 with a complex exponential model containing p terms. The factor p gives the order of the estimation as given in (1) with
and 2 .
(1)
The ambition of the Prony-method is to determine the parameter (frequency fk, damping factor αk, amplitude Ak and initial phase θk) for each of the p exponential functions. The exponential functions are conjugate complex if the signals are real. The aim of this approach is further to minimize the squared error ∑ | | with over the N data points. In [15] this is demonstrated for the case of a single complex exponential signal. As aforementioned the parameter are estimated on the basis of the underlying data. For this, the number of data points N must be equal to the number of unknown complex parameters. For p exponential functions, 2p complex values are unknown for hk and for zk. With (2) and 1≤n≤p, p equations are obtained, represented in matrix notation.
12 (2)
The matrix with the elements zk has a so-called Vandermonde structure. Assuming that the parameters zk are already known, there is a linear system of equations and the vector of the unknown complex amplitudes x are calculated. The question remains how the elements zk are estimated. Prony developed such a method. The idea behind this is that equation (2) is the solution of a homogeneous linear differential equation with constant coefficients.
First, a polynomial Φ ∏ is defined with zeros at zk. This polynomial can also be written as a sum of Φ ∑ with complex coefficients a[m] (a[0] = 1). This is the characteristic polynomial of the above difference equation (2). The exact derivation is given in [15]. The coefficients a[m] can be determined by solving the following p × p matrix equation (3) with a so-called Toeplitz structure. The method of Prony can now be summarized in three steps. First, from equation (3) the coefficients a[m] are estimated. In a second step the zeros zk of the polynomial Φ are calculated. In the third step, the complex amplitudes of equation (2) are calculated. 1 11 22 1 2 2 12
122
(3)
The following relationships are used to obtain the specified four real parameters of the exponential. The damping αk and the frequency fk are calculated from the complex value zk. | | / / /2 (4)
The real amplitude Ak and the initial phase angle θk are calculated from the complex amplitude hk with equations (5). | | atan Im / Re
(5)
This kind of polynomial realization is one of the most often used method for signal analyses, for instance [16] in which the stator current is analyzed to detect rotor faults. For the following investigation the model parameter estimation is realized using eigenanalysis in a state space approach. This offers parameter sensitivity and the availability of additional numerically robust tools to estimate the parameters [17]-[18]. Additionally, unlike polynomial methods, state space methods directly yield frequencies, amplitude and initial phase. Instead in the polynomial approach, amplitudes have to be estimated once the frequencies are found by solving a second linear system of equations. The eigenanalyses of an auto-correlation matrix to perform estimation of the noise power is described in the following section. This offers the advantage that the sensitivity to noisy signals can be reduced. The difference equation of the Prony method can be transformed into a state space representation (direct form). Due to the non-uniqueness of the implementation, one degree of freedom exists to select one realization of the system matrix and the determination of poles (eigenvalue
3114

analysis) that leads to reliable results. The state space representation is given with equation (6) 1
(6)
with the state matrix X, the output vector h and the system matrix F. The system has no input. The output signal y[n] is the result of an initial state X[0]. If the covariances are defined by the time average as in equation (7)
lim 1 1 (7)
it can be shown that , 0 (8)
(the superscript H stands for Hermitian transpose, the entries are transposed and complex conjugated). With P the state covariance matrix as described in equation (9).
1 1 (9)
It can be shown that the Toeplitz covariance matrix R of equation (10)
0 1 2 …1 0 1 … 12 1 0 … 21 2 … 0 (10)
can be factored as shown in equation (11).
…
(11)
Both sub-matrices θ and Γ have full rank and thus the rank of R is equal to the model order p, which corresponds to the number of complex exponential functions. The following relationship (12) applies if the matrix θ is formed out of the two matrices … and … .
. (12)
With the eigenvalue analysis of the matrix F the signal poles z1...zp are given. The complex amplitudes h1...hp are calculated with equation (2) as described with the Prony method. The eigenanalysis procedure normally terminates with the estimated parameters. A comparison between the parameters of a healthy machine measured after the initial operation of the drive and under identical conditions after a long operation time gives evidence about the state of the insulation.
It is possible to enhance the process with a further step to yield a spectrum to ease the interpretation of the estimated values. This spectrum is defined in terms of the approximation n , rather than in terms of the original sampled data x[n]. With the z-transform of equation (1) described in (13) the spectra is calculated, with 2 / , the sampling frequency and the selected frequency limit (for 0 ).
X z h1 (13)
The analysis of the deviation between healthy and degraded insulation is finally done amongst others based on the amplitude spectrum of the parameters.
III. EXPERIMENTAL RESULTS To verify the proposed method, measurements were
performed on a 1.4MW squirrel cage induction machine. In Fig. 5 the measured current response of phase L1 after step excitation of the same phase is depicted (blue trace) and the green trace representing the estimated signal after the eigenanalysis-based parameter estimation is applied. The model order p is selected with 80 and the number of used modes is limited with 15. It is assumed that only fifteen modes are necessary to adequately reconstruct the original data (see Fig. 5). These assumptions results from the analyses of the calculated eigenvalues. The magnitudes of all calculated eigenvalues are compared in descended order and a threshold is set to define the noise level. All eigenvalues below this threshold are classified as noise components and are neglected. It has been found that a reduction of the system order (p<80) and signal modes (<15) are not recommended, because high approximation errors occur. These errors can lead to misinterpretation of the signal estimation.
Fig. 5 Comparison of the measured signal of sensor L1 (blue) after step excitation in phase L1 and the estimated signal (green) with model order p=80 and the limited number of 15 signal modes
The composite of all resulting signals (green trace) shows hardly any deviation from the trace of the original measured signal (blue trace) with exception of the last part after the
3115
transient ringing from 5µs to 12.5µs. However, this part is not important of for the insulation state monitoring method and only the transient part is considered. A standard industrial current sensor (hall-effect based closed loop sensors) with a specified frequency bandwidth of DC-150 kHz and a maximum di/dt of 50A/µs was used for these records of the current response. Despite the frequency specification being very low, the current sensor is still applicable for analyzes of higher frequencies. At lower frequencies the sensor operates using the electronic components including the hall sensor. However, at higher frequencies the compensation winding with the flux concentrating core operates as a current transformer providing the output of the current sensor. In Table I the calculated frequencies fk, time constants ( 1/ and amplitudes Ak of the estimated signal components are sown for the healthy machine state (see Fig. 1 blue trace) and the same machine measured with a capacitance parallel to the 1st coil of phase L1 (Fig. 1 green trace). TABLE I. CALCULATED FREQUENCIES AND TIME CONSTANTS (DAMPING) OF
THE ESTIMATED SIGNAL COMPONENTS
Signal no.
Machine State
Healthy Faulty (15nF//1st coil phL1)
k fk (MHz)
τk (µs)
Ak (a.u.)
fk (MHz)
τk (µs)
Ak (a.u.)
1 5.000 -0.05 42.285 4.430* -0.83 4.194
2 4.336* -1.32 4.949 3.366* -0.53 4.860
3 3.276* -0.28 15.093 1.086* -1.57 3.088
4 1.112* -0.05 2.002 1.076* -1.08 7.990
5 1.091* -0.21 12.401 0.445* -1.99 1.801
6 0.425* -1.05 7.940 0.269* -18.8 0.674
7 0.129* -6.41 20.016 0.140 -20.94 3.601
8 0.075* -10.4 8.718 0.063* -9.13 2.221 *Conjugate complex pairs - only positive frequency components are shown
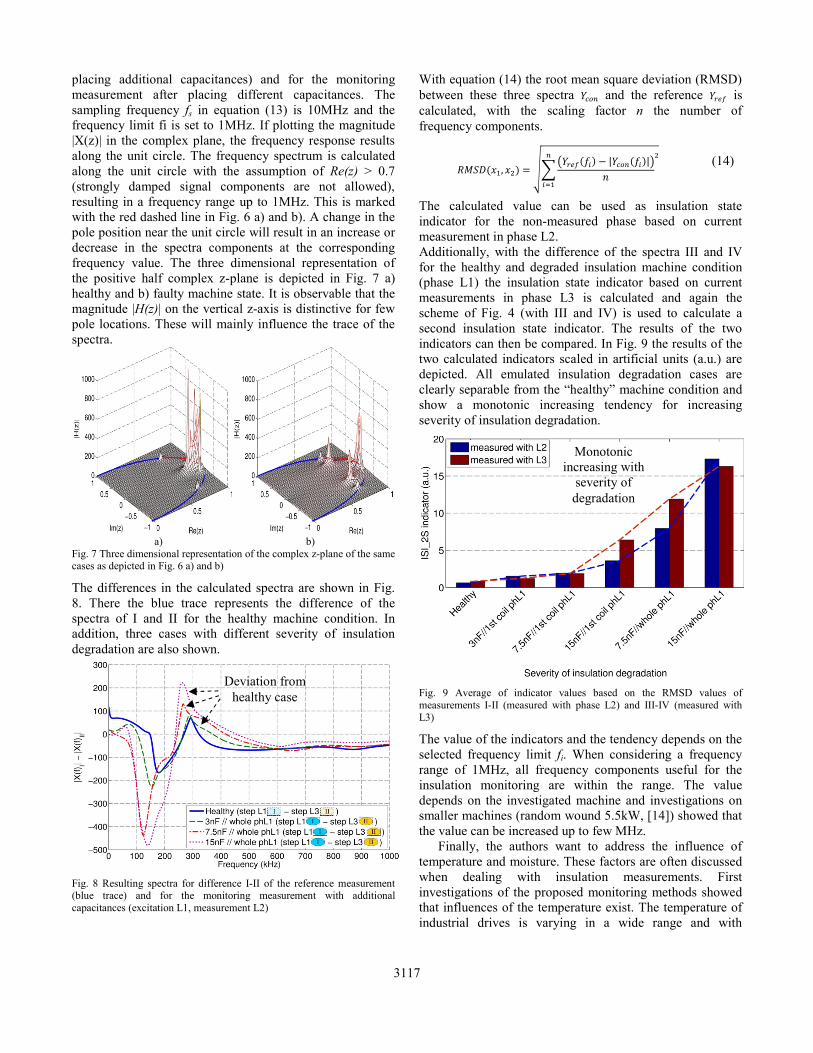
The frequencies are listed in descend order and the time constant and amplitude of the corresponding frequency is given in the adjacent right column. It is visible that a noticeable change of the frequency, time constant and amplitude values between the healthy and faulty machine state occurred. This indicates a change in the insulation health state. In Fig. 6 a) and b) the poles of the approximated n data resulting from the eigenanalysis-based approach are shown in the right half of the complex z-plane. For this representation thirty single measurements for each machine condition (“healthy” and “faulty”) were analyzed. In the left subfigure a) the poles are depicted for the reference measurement of the healthy machine when a voltage step is applied to phase L1 and measurement of phase L2 is carried out. The number of modes (15) is equal to the number of clusters in the figures, each of them ideally consisting of thirty poles (corresponding to the number of measurements). It is observable that most of the poles are
concentrated within clusters and only a few are not definitely referable to one location. Due to the fact that only the right half of the complex plane is depicted, not all poles are visible. In the right subfigure b) a capacitance with 15nF was placed parallel to the 1st coil of phase L1. Again excitation was established in phase L1 and measurement done in phaseL2.
a) b)
Fig. 6 Pole locations in complex z-plane for eingenanalysis of measured current reaction in phase L2 for voltage step excitation in phase L1 a) healthy machine; b) emulated insulation degradation with 15nF // 1st coil phase L1
In the left subfigure a) the poles are concentrated near the unit circle. Comparing these results with subfigure b) depicting the measurement with emulated insulation degradation, the clusters of the poles are changing their position with a tendency towards the center, as indicated with the arrow and marked with the dashed red circles. This indicates a deviation in the damping and frequency of these estimated signals, caused by a change of the insulation winding system. The pole locations are calculated for all step combinations described in the previous section (Fig. 4). By applying a median filter on the discredited z-plane possible pole cluster detection could be implemented. Another approach to facilitate an interpretation of these deviations which was selected for the analyses in this work is the calculation of the spectra out of the complex z-plane as described in section II. To verify/validate the proposed method, measurements with different capacitances (15nF, 7.5nF and 3nF) placed parallel to the first coil of phase L1 and the whole phase L1 between terminal connection and neutral point were tested (notice that L1 is the strand without a current sensor). These are the interesting cases regarding the proposed method. With the step sequence, consisting of four single steps as described in Fig. 4, a conclusion about the machines actual insulation condition of the phase without a sensor can be drawn. The two other phases L2 and L3 can be directly analyzed with the corresponding sensor data. After the spectra of the four step excitations are calculated, the difference of the spectra of step I and II respectively step III and IV are calculated as aforementioned to ease the interpretation of the data. This procedure is done for the reference measurement (without
Pole cluster
change of cluster position
Pole cluster
3116
placing additional capacitances) and for the monitoring measurement after placing different capacitances. The sampling frequency fs in equation (13) is 10MHz and the frequency limit fi is set to 1MHz. If plotting the magnitude |X(z)| in the complex plane, the frequency response results along the unit circle. The frequency spectrum is calculated along the unit circle with the assumption of Re(z) > 0.7 (strongly damped signal components are not allowed), resulting in a frequency range up to 1MHz. This is marked with the red dashed line in Fig. 6 a) and b). A change in the pole position near the unit circle will result in an increase or decrease in the spectra components at the corresponding frequency value. The three dimensional representation of the positive half complex z-plane is depicted in Fig. 7 a) healthy and b) faulty machine state. It is observable that the magnitude |H(z)| on the vertical z-axis is distinctive for few pole locations. These will mainly influence the trace of the spectra.
a) b)
Fig. 7 Three dimensional representation of the complex z-plane of the same cases as depicted in Fig. 6 a) and b)
The differences in the calculated spectra are shown in Fig. 8. There the blue trace represents the difference of the spectra of I and II for the healthy machine condition. In addition, three cases with different severity of insulation degradation are also shown.
Fig. 8 Resulting spectra for difference I-II of the reference measurement (blue trace) and for the monitoring measurement with additional capacitances (excitation L1, measurement L2)
With equation (14) the root mean square deviation (RMSD) between these three spectra and the reference is calculated, with the scaling factor n the number of frequency components.
, | |
(14)
The calculated value can be used as insulation state indicator for the non-measured phase based on current measurement in phase L2. Additionally, with the difference of the spectra III and IV for the healthy and degraded insulation machine condition (phase L1) the insulation state indicator based on current measurements in phase L3 is calculated and again the scheme of Fig. 4 (with III and IV) is used to calculate a second insulation state indicator. The results of the two indicators can then be compared. In Fig. 9 the results of the two calculated indicators scaled in artificial units (a.u.) are depicted. All emulated insulation degradation cases are clearly separable from the “healthy” machine condition and show a monotonic increasing tendency for increasing severity of insulation degradation.
Fig. 9 Average of indicator values based on the RMSD values of measurements I-II (measured with phase L2) and III-IV (measured with L3)
The value of the indicators and the tendency depends on the selected frequency limit fi. When considering a frequency range of 1MHz, all frequency components useful for the insulation monitoring are within the range. The value depends on the investigated machine and investigations on smaller machines (random wound 5.5kW, [14]) showed that the value can be increased up to few MHz.
Finally, the authors want to address the influence of temperature and moisture. These factors are often discussed when dealing with insulation measurements. First investigations of the proposed monitoring methods showed that influences of the temperature exist. The temperature of industrial drives is varying in a wide range and with
Deviation from healthy case
Monotonic increasing with
severity of degradation
3117

temperature sensor available, comparison and calculation of the fault indicator are done at similar temperature level (with a deviation of less than ±10°C). Thus the influence of temperature is hardly noticeable. The influence of moisture was negligible at investigations on the test machine, as also described in [18].
It has to be stressed that the presented two-sensor-method is an extension to a method already published (AT511807 B1).
I. CONCLUSION A method to detect insulation degradation based only on
the information of two current sensors has been presented. The proposed technique is based on excitation of the machine by voltage steps initiated by the inverter and evaluating the resulting transients of the current sensors. These transients are mainly influenced by the drive’s parasitic capacitive components. Insulation degradation is always linked with a change of this capacitance that is considered as one of the dominant parameters for insulation health state evaluation. A new fault indicator based only on measurement of two current sensors was derived and its sensitivity to capacitive changes verified. A combination of four different voltage steps and measurement sequences enables the monitoring of the non-measured phase. Compared to direct phase current measurement there is no significant deterioration of sensitivity if one single phase current sensor is omitted. The time signals of the current responses are transferred into frequency domain with the eigenanalysis-based parameter estimation. Based on the calculation of a root mean square deviation between reference measurements and measurements with emulated insulation degradation, information about the insulation condition is obtained. Measurements performed on a 1.4MW induction machine with different emulated insulation state conditions verify the applicability of the proposed method.
ACKNOWLEDGEMENT The work to this investigation was funded by the
Austrian Research Promotion Agency (FFG) under project number 838478. The authors want to thank Bombardier Transportation Switzerland (GSC/PPC-CoE2 head M. Jörg, and Peter Nussbaumer). Further the authors want to thank Product Development GSC/PPC Drives (M. Bazant) for PDev funding, feedback as well as for the great support. Thanks also goes to LEM -Company (especially Mr. W. Teppan) and National Instruments Austria (Mr. G. Stefan) for the cooperation and the generous support.
REFERENCES [1] IEEE Committee Report, “Report of large motor reliability survey of
industrial and commercial installation, Part I,” IEEE Transactions on Industry Applications, vol.21, no.4, pp.853–864, 1985
[2] IEEE Committee Report, “Report of large motor reliability survey of industrial and commercial installation, Part II,” IEEE Transactions on Industry Applications, vol.21, no.4, pp.865–872, 1985
[3] Grubic, S.; Aller, J.M.; Bin Lu; Habetler, T.G., "A Survey on Testing and Monitoring Methods for Stator Insulation Systems of Low-Voltage Induction Machines Focusing on Turn Insulation Problems," Industrial Electronics, IEEE Transactions on , vol.55, no.12, pp.4127,4136, Dec. 2008
[4] Farahani, M.; Gockenbach, E.; Borsi, H.; Scha�fer, K.; Kaufhold, M., “Behavior of machine insulation systems subjected to accelerated thermal aging test,” IEEE Transactions on Dielectrics and Electrical Insulation, vol.17, no.5, pp.1364-1372, 2010
[5] Perisse, F.; Werynski, P.; Roger, D., “A New Method for AC Machine Turn Insulation Diagnostic Based on High Frequency Resonances,” Dielectrics and Electrical Insulation, IEEE Transactions on, vol.14, no.5, pp.1308,1315, October 2007
[6] G. C. Stone, E. E. Boulter, I. Culbert, and H. Dhirani, “Electrical Insulation for Rotating Machines”, IEEE Press, 2004
[7] Kim, H.D.; Yang, J; Cho, J.; Lee, S.B.; Yoo, J.-Y., “An Advanced Stator Winding Insulation Quality Assessment Technique for Inverter-Fed Machines,” IEEE Trans. on Ind. Appl, vol.44, no.2, pp.555-564, March-april 2008
[8] Peroutka, Z., “Requirements for insulation system of motors fed by modern voltage source converters,” Power Electronics Specialists Conference, 2004. PESC 04. 2004 IEEE 35th Annual, vol.6, no., pp.4383,4389 Vol.6, 20-25 June 2004
[9] Persson, E., “Transient effects in application of PWM inverters to induction motors,” Industry Applications, IEEE Transactions on, vol.28, no.5, pp.1095,1101, Sep/Oct 1992
[10] Jinkyu Yang; Jintae Cho; Sang-Bin Lee; Ji-Yoon Yoo, "An Advanced Stator Winding Insulation Quality Assessment Technique for Inverter-fed Machines," Industry Applications Conference, 2006. 41st IAS Annual Meeting. Conference Record of the 2006 IEEE , vol.3, no., pp.1562,1569, 8-12 Oct. 2006
[11] Toliyat, Hamid A., et al. “Electric Machines: Modeling, Condition Monitoring, and Fault Diagnosis”. CRC Press, 2012
[12] IEEE Recommended Practice for Testing Insulation Resistance of Electric Machinery - Redline," IEEE Std 43-2013 (Revision of IEEE Std 43-2000) - Redline , vol., no., pp.1,75, March 6 2014
[13] IEEE Recommended Practice for Measurement of Power Factor Tip-Up of Electric Machinery Stator Coil Insulation," IEEE Std 286-2000 , vol., no., pp.i,29, 2001
[14] Nussbaumer, P.; Santin, C.; Wolbank, T.M.; “Analysis of current reaction on inverter-switching to detect changes in electrical machine's high-frequency behavior,” 38th Annual Conference on IEEE Industrial Electronics Society, IECON pp.1678-1683, 2012
[15] S.L.Marple, “Digital Spectral Analysis with Applications”, Englewood Cliffs, Prentice-Hall, 1988.
[16] Costa, F.F.; De Almeida, L. A L; Wegelin, E.A.; Da Costa, E.G., "Recursive Prony's Method for Improving the Monitoring of Electrical Machines," Instrumentation and Measurement Technology Conference, 2005. IMTC 2005. Proceedings of the IEEE , vol.2, no., pp.1498,1502, 16-19 May 2005
[17] Rao, B.D.; Arun, K.S., “Model based processing of signals: a state space approach,” Proceedings of the IEEE, vol.80, no.2, pp.283,309, Feb 1992
[18] Kumaresan, R.; Tufts, D.W., "Estimating the parameters of exponentially damped sinusoids and pole-zero modeling in noise," Acoustics, Speech and Signal Processing, IEEE Transactions on , vol.30, no.6, pp.833,840, Dec 1982
[19] Zoeller, C.; Vogelsberger, M.A.; Nussbaumer, P.; Wolbank, T.M.; “Insulation monitoring of three phase inverter-fed ac machines based on two current sensors only“ 21st International Conference on electrical machines ICEM 2014, unpublished
3118