detection of dehydration by using volume kinetics
TRANSCRIPT

Detection of Dehydration by Using Volume
Kinetics
Joachim Zdolsek, Yuhong Li and Robert Hahn
Linköping University Post Print
N.B.: When citing this work, cite the original article.
Original Publication:
Joachim Zdolsek, Yuhong Li and Robert Hahn, Detection of Dehydration by Using Volume
Kinetics, 2012, Anesthesia and Analgesia, (115), 4, 814-822.
http://dx.doi.org/10.1213/ANE.0b013e318261f6ba
Copyright: Lippincott, Williams & Wilkins
http://www.lww.com/
Postprint available at: Linköping University Electronic Press
http://urn.kb.se/resolve?urn=urn:nbn:se:liu:diva-85198

Detection of Mild Dehydration in Volunteers
by Using Volume Kinetics
Joachim Zdolsek, Yuhong Li, and Robert G. Hahn
Department of Anesthesia, Faculty of Health Sciences,
Linköping University, Linköping, Sweden
Secondary address for Dr. Li: Department of Anesthesia,
First Affiliated Hospital, College of Medicine,
Zhejiang University, Hangzhou, People’s Republic of China
Corresponding author:
Robert Hahn MD, PhD
Department of Anesthesia
Linköping University Hospital
585 85 Linköping, Sweden
Phone: +46739660972
Fax: +46855024671
E-mail: [email protected]
Running head: Kinetic analysis of dehydration
Author’s contributions: Zdolsek planned and organized the experiments. Li conducted
the experiments. Hahn made the study design, completed the data analysis, and wrote the
manuscript.
Implications statement: A study of volunteers shows that dehydration of 2% of body
weight can be detected from the dilution of the blood hemoglobin concentration following
an infusion of only 5 ml/kg of Ringer’s solution.

Abstract
Background: Patients admitted to surgery may be dehydrated, which is difficult
to diagnose except when it is severe (>5% of the body weight). This study hypothesizes
that modest dehydration can be detected by kinetic analysis of the blood hemoglobin (Hgb)
concentration following a bolus infusion of crystalloid fluid.
Methods: Four series of experiments were performed on 10 conscious, healthy
male volunteers. Separated by at least two days, they received 5 ml/kg or 10 ml/kg of
acetated Ringer’s over 15 min. Before starting half of the intravenous infusions, volume
depletion amounting to 1.5–2.0 L (approximately 2% of body weight) was induced with
furosemide. The elimination clearance and the half-life of the infused fluid were
calculated based on blood Hgb over 120 min. The perfusion index and the pleth variability
index were monitored by pulse oximetry following a change of body position.
Results and Discussion: Dehydration decreased the elimination clearance of
acetated Ringer´s [median (25th
-75th
percentile)] from 1.84 (1.23-2.57) to 0.53 (0.41-0.79)
ml/kg/min (Wilcoxon´s matched-pair test P< 0.001) and increased the half-life from 23
(12-37) to 76 (57-101) minutes (P< 0.001). The smaller infusion, 5 ml/kg, fully
discriminated between experiments performed in the euhydrated and dehydrated states,
whereas the urinary excretion provided a less reliable indication of hydration status.
Dehydration decreased the perfusion index but did not affect the pleth variability index.
Conclusion: Dehydration amounting to 2% of the body weight could be detected
from the elimination clearance and the half-life of an infusion of 5 ml/kg of Ringer’s
solution.
Word count: 3,974
Keywords: blood hemoglobin, pharmacokinetics model, dehydration, fluids, IV
Introduction
To maintain hydration status in balance is a key challenge in the treatment of
diseases that involve excessive fluid loss. Normal hydration is also important in patients
scheduled for anesthesia and surgery. Serious dehydration, particularly if dominated by
volume losses from the extracellular fluid (ECF) space, can result in increased
hemodynamic effects of anesthetic drugs, poor tissue perfusion, and oliguria. The
consequences of moderate dehydration are less well known, although the administration
of approximately 2 L more or less of crystalloid fluid during abdominal surgery affects the
incidence of postoperative complications.1
The judgment of whether dehydration is present is usually based on physical
inspection of skin turgor. A rise in the blood hemoglobin (Hgb) or serum creatinine
concentration is consistent with dehydration, but a recent control measurement might not
be available. Clinical methods, such as skin turgor, may disclose dehydration amounting
to 5%–10% of the body weight, but it is unlikely that they can reliably detect smaller
variations in fluid balance in preoperative surgical patients.
The primary hypothesis of the present exploratory study was that volume kinetic
analysis of a small amount of crystalloid fluid could be used to detect fluid losses
amounting to 2% of body weight. The kinetic analysis used serial analyses of the blood
Hgb concentration to quantify the distribution and elimination of the infused fluid.2-8
A secondary hypothesis was that dehydration could be indicated by non-invasive
monitoring of the pleth variability index (PVI) using pulse oximetry upon a change of
body position.9-12
For this purpose, conscious volunteers were studied both when being
normo-hydrated and when dehydration had been induced by intravenous furosemide.

Subjects and Methods
Forty experiments were performed on 10 male volunteers with a mean age of 22
years (range 19–37), a body weight of 80 kg (range 75–100), and a body mass index of
24.9 kg/m2 (range 21.8–28.4). None of the subjects had any disease or took daily
medication. The Ethics Committee of Linköping University approved the protocol (Ref.
M114-09, ClinicalTrials.gov Identifier NCT01062776). Each volunteer gave his consent
for participation after being informed about the study both orally and in writing.
Procedure
Table 1shows a flow diagram for the study. On the day of the experiment, the
volunteers had fasted since midnight and then imbibed 800 ml (approximately 10 ml/kg)
of water at 6:00 a.m. The purpose of the fluid intake was to correct any pre-existing
dehydration while allowing the body time to void and to arrive at its desired degree of
hydration two hours later. The experiments started at 8:00 a.m. in a single room at the
Department of Intensive Care at Linköping University Hospital. To achieve maximum
comfort, an OPN Thermal Ceiling radiant warmer (Aragona Medical, River Vale, NJ) had
been placed about 1m above the bed.
Fluid infusions. A cannula was placed in the cubital vein of one arm to infuse
fluid and another cannula was inserted in the other arm for sampling blood. Plasma
volume expansion was then induced by administering acetated Ringer’s solution (Baxter
Medical AB, Kista, Sweden) intravenously over 15 min by using an infusion pump
(Volumat MC Agilia, Fresenius Kabi, Bad Homburg, Germany).
All 10 volunteers underwent four experiments in a random order determined by
the sealed envelope method, and separated by at least two days. The experiments were
designed as follows:
(1) Infusion of 5 ml/kg of acetated Ringer’s solution in the euhydrated state,
(2) Infusion of 10 ml/kg of acetated Ringer’s solution in the euhydrated state,
(3) Infusion of 5 ml/kg of acetated Ringer’s solution in the dehydrated state, and
(4) Infusion of 10 ml/kg of acetated Ringer’s solution in the dehydrated state.
The Ringer’s solution had the following ionic content: sodium 130, chloride 110,
acetate 30, potassium 4, calcium 2, and magnesium 1 mmol/L.
The fluid bag was kept on the radiant warmer above the bed to maintain a
temperature of 27°C–30°C when entering the volunteer.
Dehydration procedure. Volume depletion was induced by repeated small
intravenous doses of 5 mg of furosemide (Furix 10 mg/ml, Nycomed, Stockholm, Sweden)
provided every 10-30 min until the urinary excretion amounted to between 1.5 and 2.0 L.
Sixty minutes elapsed between the last dose of furosemide (total dose 25 mg, range 15–35)
and the infusion of Ringer’s.
The volunteers were weighed to the nearest 0.01 kg on an electronic scale (Vetek
AB, Väddo, Sweden) just before, and at the end of, the dehydration period.
Fluid recruitment maneuver. To examine whether pulse oximetry could be used
to detect dehydration, three pulse oximeter variables were recorded every 5 min before
and after a change in body position from semi-standing (0–10 min) to the recumbent
position (11–25 min), a maneuver that relieves hypovolemia by recruiting interstitial fluid
from the legs to increase the plasma volume by approximately 6% within 30 min.13
The test was performed as the first part of each experiment and, in Experiments 2
and 4, after dehydration when the volunteer awaited an infusion of Ringer’s solution
(Table 1). “Semi-standing” meant that the volunteer was standing up but leaning against
the bed, a position chosen to safeguard against fainting in the presence of dehydration.
Measurements
Blood sampling. During the fluid infusion experiments, venous blood (4 ml) was
withdrawn to measure the Hgb concentration and the hematocrit on a CELL-DYN
Sapphire (Abbott Diagnostics, Abbott Park, IL). Sampling was performed every 5 min

during the first 50 min, and then at 60, 70, 90, 105, and 120 min. The baseline sample was
drawn in duplicate, and the mean of the two concentrations was used in subsequent
calculations. The differences between the two baseline samples for all 40 experiments
were used to calculate the coefficient of variation (precision) for the Hgb measurement,
which was 0.8%.14
A total of 17 samples were taken. A small discard volume of blood was
drawn before each blood collection to preclude an admixture of rinsing solution, and 2 ml
of 0.9% saline was then injected to prevent clotting.
Urine collection. The subjects voided when they entered the study room and this
urine was discarded. They voided freely in the lying position throughout the experiments.
The total volume was recorded when the volunteers emptied their bladders completely at
the end of the dehydration period and at the end of the infusion experiment.
Pulse oximetry. A Radical-7™
pulse oximeter (Masimo Corp., Irvine, CA) was
applied to the index or middle finger of one hand and it was left in the same place
throughout the experiment (software version SET V7.4.0.9, Handheld R.7.7.1.0 and
D-station R5.1.2.7). A repeated-use probe with a programmed obsolescence of 60 hours
was used. This apparatus measured the perfusion index (PI), venous Hgb concentration,
and the pleth variability index (PVI). The display was set to average the data every six
seconds.
PI represents the pulse amplitude. PVI is the breath-induced variation in PI and is
calculated as (PImax-PImin)/PImax over several respiratory cycles.9 Upon inclusion in the
study, the volunteers were tested to meet a minimum requirement of PI>2 (maximum
value 14) as peripheral vasoconstriction distorts the non-invasive Hgb analysis.
Pulse oximetry data are given for the fluid recruitment maneuver only. The
relationship between the invasive and non-invasive Hgb analyses obtained during the
infusion experiments have been reported previously and were found to be inadequate for
use in volume kinetic analysis.15

Kinetic analysis
Volume kinetic analyses were performed according to one-volume and
two-volume models (Fig. 1). In the first one, the infusion of fluid at the rate Ro expanded
the functional body fluid volume Vc to vc. Removal of the fluid occurred by means of
baseline fluid losses (Clo) that were pre-set to 0.4 ml/min, and by a dilution-dependent
elimination clearance mechanism (Cl).2 The differential equation for the model is:
dvc
dtRo Clo Cl
vc(t ) Vc
Vc
The two-volume model added a peripheral compartment Vp that expanded to vp by
exchanging fluid with vc at a rate governed by a distribution clearance, Cld. The
differential equations for this model are:
dvc
dtRo Clo Cl
(vc(t ) Vc)
Vc Cld
(vc(t ) Vc)
Vc
(vp(t ) Vp)
Vp
dvp
dtCld
(vc(t ) Vc)
Vc
(vp(t ) Vp)
Vp
The Hgb-derived fractional plasma dilution was used as the input Hgb (t) at time t:
vc(t ) Vc
Vc
Hgb
Hgb(t )±1
1Hct
where Hgb and Hct are the blood Hgb concentration and the hematocrit at baseline,
respectively. A correction for the loss of sampled Hgb was applied.7 Previous work has
defined these models2 and given analytical
3 and matrix solutions
4 to the equations used.
Curve-fitting was performed by least-squares regression, based on the analytical
solutions to the differential equations, and programmed into the computer program Matlab
4.2 (Math Works Inc., Natick, MA). No weights were used because the analyses were
based blood Hgb changes of between 0 and 7–8% in which span the analytical precision of
the Hgb assay was practically identical.

Three approaches were used for the presentation: (1) all curves analyzed by the
one-volume model based on all 16 data points, (2) all curves analyzed by the optimal
model, being either the one- or two-volume model as determined by the F test2-4
, and (3)
the one-volume model based on 4 data points only.
For the one-volume model, the output was the optimal estimates of Vc and Cl. The
elimination half-life of infused fluid (T1/2) was calculated as 0.693 V / Cl. For the
two-volume model, the output parameters were Vc, Vp, Cl, and Cld. The elimination T1/2
was 0.693 Vc / Cl.
The renal clearance (Clr) of the infused fluid was obtained as the urine volume
excreted during the two-hour infusion experiment divided by the area under the plasma
dilution-time curve (AUC).2,4
The Clr was calculated for only 38 experiments since two
volunteers were unable to void at the end of the 10 ml/kg infusions during euhydration.
Hence, there were four clearances to consider. Clo and Clr were model-independent
while there was one elimination Cl in the one-volume model and another in the
two-volume model. The former Cl is higher as the one-volume model is expected to be
statistically justified when elimination is efficient (resulting in high urinary excretion).
The elimination Cl might also be higher in the one-volume model because some fluid has
distributed to a peripheral compartment (by the mechanism Cld) although not in enough
amounts to change the slope of the dilution-time curve markedly. If the urine collection is
complete, Clr is close to the Cl of the optimal model16
except during surgery when
extravascular retention of fluid might occur so that Clr < Cl.7
The result of the very first experiment in the series deviated markedly from the
others, showing a very low fluid clearance despite euhydration. The volunteer had been up
all night before this experiment session and had been fasting for a period; both factors
were unknown to us at the time. Therefore, this experiment was repeated several months
later when the volunteer followed the instructions for normal sleep and food intake.
Statistics

The results are given as the mean (SD), except when there is a skewed distribution
when data is reported as the median (25th
–75th
percentiles).
Two-way ANOVA was used to examine whether the kinetic parameters differed
depending on the infused fluid volume or dehydration. Logarithm-transformed (Cl, Clr
and T1/2) or square root-transformed data (urine and ratio urine/infused fluid) were applied
if the distribution of the data were skewed. After transformation the distribution was close
to normal.
Changes were reported as the median and the 95% confidence interval (CI) for the
difference between paired data.
Differences between paired and unpaired samples were examined by the Wilcoxon
matched-pair test and the Mann-Whitney U test, respectively.
Logistic regression was used to select the probability range where sensitivity and
specificity of various kinetic parameters to indicate dehydration were as similar as
possible. The middle of this range was selected as cut-off point, which was then used to
calculate the 95% CI for the sensitivity and specificity in question.
The study was powered (90%) based on retrospective data17
in which the blood
Hgb was 96.9% (SD 2.9) of baseline 30 minutes after the end of the 30-minute infusion of
Ringer´s solution in euhydrated volunteers. The corresponding Hgb level was 91.4% (3.1)
when the same volunteers underwent the infusion experiment again after an overnight fast.
The current study strived to detect a difference of 5% in Hgb levels, depending on the
hydration status at 60 min, with a power of 90% and P< 0.05.
The F test determined whether the one-volume or two-volume kinetic model was
statistically justified.2-4
P<0.05 was considered statistically significant.

Results
Dehydration
Furosemide promoted urinary excretion amounting to 1.71 (0.26) L (range 1.38–
2.43 L), which represented 2.1 (0.4) % of the body weight (range 1.5–3.0).
The body weight decreased by 2.0 (0.4) kg (range 1.5–3.0) from the dehydration
procedure. The difference between measured weight loss and measured urine excretion is
due to evaporation and metabolism (Clo).
The Hgb concentration increased by 7.9% (SD 2.1, range 2.1-11.5) during the
dehydration procedure. Assuming that the blood volume amounts to 7.5% of the body
weight, this Hgb change corresponds to a reduction of the blood volume by 0.50 (0.13) L.
Hence, 30 (9) % of the voided volume was derived from the blood. There were no
differences between the 5 ml/kg and 10 ml/kg experiments with respect to these data.
One-volume model
Dehydration reduced the elimination Cl by more than half (median ratio 0.36; 95%
CI 0.25-0.40) and more than doubled T1/2 (mean 3.3, 95% CI 2.5-6.2).
T1/2 was 23 minutes in euhydration and 76 minutes in dehydration (Wilcoxon´s
matched-pair test P< 0.001; Table 2).
Two-way ANOVA showed that dehydration (P<0.001), but not the infused volume
(being 5 or 10 ml/kg), had a statistically significant influence on Cl and T1/2. Contrast
estimates yielded that dehydration decreased Cl by 1.49 (95% CI 0.90-2.08) ml/min/kg
and increased T1/2 by 67 (38-96) minutes. The non-significant effect of the larger fluid
volume consisted in a decrease of Cl by 0.15 ([-0.44]-0.75) ml/min/kg and of T1/2 by 10
([-19]-40) minutes.
The best capacity to distinguish dehydrated from euhydrated volunteers was

obtained when parameters were derived from the 5 ml/kg experiments (Figs. 2A, B). With
optimal cut-off points, there was complete separation between the data on Cl and T1/2
depending on the state of hydration (Table 3). The sensitivity and specificity were at least
10% lower with the infusion of 10 ml/kg.
Optimal kinetic model
The two-volume kinetic model was statistically justified (by the F test) in 22 of the
40 experiments (one in Group 1, five in Group 2, and eight each in Groups 3 and 4). The
one-volume model was appropriate in the other 18 experiments (Table 2).
Dehydration (P<0.001), but not the volume of infused fluid (P=0.45-0.82), had a
statistically significant influence on Cl and T1/2 when the data from the optimal model in
each experiment were pooled (two-way ANOVA; Figs. 3, 4).
Using a cut-off point of 40 min, the T1/2 of the pooled optimal model fully
discriminated between euhydration and dehydration when 5 ml/kg had been infused (Fig.
2C). For the infusion of 10 ml/kg, the sensitivity and specificity were only 83% and 80%,
respectively.
Urine-derived parameters
The renal clearance (Clr) and the excreted/infused fluid ratio were both lower in
the presence of dehydration (P<0.0001 and P<0.03) and with the larger fluid volume
infusion (P<0.003 and P<0.01; two-way ANOVA; Table 2).
Clr readily distinguished between euhydration and dehydration (Table 3), while
the excreted urine volume alone showed sensitivity and specificity of only 60%–70%.
Four-point analysis
Comparisons of the plasma dilution in euhydration and dehydration suggest that
the fractional plasma dilution values are separated by the greatest amount about 60 min

following the completion of the 15-min fluid infusion (Fig. 4C and D). The Hgb
concentration was then 98.2% (mean) of baseline in euhydration and 95.8% in
dehydration (Wilcoxon matched-pair test, P<0.001).
The one-volume kinetic analysis was then repeated but based on only the four
points in time when the within-series and between-series differences in Hgb concentration
were greatest (0, 15, 60, and 70 min). Here, V and Cl attained 9% and 18% lower values
than in the 16-point analysis, but the capacity of the kinetic model to identify dehydration
of approximately 2% was largely retained (Table 3).
The difference between the blood Hgb level at 60–70 min and the baseline value
could identify dehydration as well as the four-point kinetic analysis (Table 3).
Pulse oximetry
A comparison between the pulse oximetry variables obtained at baseline of the
fluid recruitment maneuver performed before and after dehydration (in Experiments 3 and
4) showed that the dehydration procedure decreased the PI while the Hgb increased (both
P<0.01); the PVI was unchanged.
The non-invasive PI, Hgb, and PVI showed the same pattern upon change of body
position regardless of hydration status. The only consistent change afterward was a
progressive decrease of the Hgb concentration that eventually reached 5%–6%
(repeated-measures ANOVA P<0.001; Fig. 5).

Discussion
The results showed that kinetic analysis of a small bolus infusion of Ringer’s
solution could be used to disclose that a healthy volunteer was volume depleted by an
average of 2.1% of the body weight. Cl and T1/2 discriminated well between the fluid
infusions that were performed in the euhydrated and dehydrated states. The smaller
infusion (5 ml/kg) yielded a more reliable discrimination than the larger one (10 ml/kg).
This novel approach is based on the belief that the volume status can be
determined by studying how the body handles a fluid challenge.17
Euhydration results in
an effort to regain the pre-infusion hydration level. In dehydration, the body retains
infused fluid, which lowers Cl and prolongs T1/2 for acetated Ringer’s.
Previous work has suggested this to be the case. The T1/2 of crystalloid fluid was
only half as long in semi-fasting volunteers18
and laparoscopic patients19
when volume
depletion was prevented by a previous infusion of the same fluid (15 versus 28 min and 19
versus 38 min, respectively). In fasting volunteers subjected to hemorrhage, the T1/2 of
acetated Ringer´s solution increased from 22 min (no hemorrhage) to 45 min (500 ml) and
62 min (900 ml).5 However, the administered fluid volumes in those studies were 2-5
times larger than in the present study.
Tracer methods for measuring body fluid volumes, such as deuterium and
bromide, have a precision of 1%–2% if carried out carefully20
but they involve expensive
analytical procedures and may require very long mixing times. Moreover, they do not
provide information about the hydration level the body strives to maintain. Clinical
methods, such as assessment of skin turgor and measurement of serum osmolality, are not
sensitive enough to detect minor deficits in body fluid volume.
The dehydration test presented here overcomes most of these problems, which
makes our approach of interest for research. Less frequent blood sampling than the 16
points used in this exploratory study would be desirable to reach clinical efficacy.
Interestingly, useful results seem to have been obtained from only four samples, and two

samples indicating a shift of the Hgb baseline may suffice to detect dehydration (Table 3).
However, with fewer samples, the results will be more sensitive to occasional errors in
sampling technique and analysis of the relatively minor changes in Hgb concentration
studied here. On the other hand, the relatively long period of time (60 minutes) between
the first and the second blood sample cannot be significantly shortened (Fig. 4C, D).
The choice of dehydration method and kinetic model deserves a comment.
Between 50% and 70% of patients require blood volume optimization before surgery,
regardless of whether they fast overnight or ingest fluid preoperatively;21-23
and the blood
volume is greatly affected by changes in the ECF volume.24
This explains our use of a
better method of inducing dehydration than fasting overnight. Euhydration at baseline was
ensured by letting each volunteer drink 800 ml of tap water and giving him 2 hours to
excrete any excess fluid; controlled dehydration was induced by furosemide. As the
plasma constitutes 1/3 of the expandable ECF volume,2 the rise in Hgb concentration
during the dehydration procedure confirms that furosemide primarily reduced the ECF
volume. Hence, the type of dehydration studied here better reflects fluid losses by
vomiting and diarrhea (volume depletion) than by evaporation alone.
The one-volume model offers simplicity and stability, and therefore, clinical
applicability. The kinetics may also be handled by adding a second compartment to the
model. The bi-exponential form of the plasma dilution-time curve is typical of fluid
retention and can be expected in hypovolemia,5 anesthesia,
8 and in anesthesia and
surgery.7 Several of the present experiments with 10 ml/kg showed the bi-exponential
form, as did most curves collected during dehydration.
The present work reports the ability of both the one-volume and the statistically
justified (optimal) model to detect dehydration. The two-volume model, which overall
proved to be optimal in more than half of the experiments, yielded 15% longer elimination
T1/2 for acetated Ringer’s solution than the one-volume model did. As the two-volume
model was most common in dehydration, the difference in T1/2 between eu- and
dehydration increased when also considering the two-volume model. Although the

statistical comparison between the pooled Cl and T1/2 can be questioned on theoretical
grounds, the data disclose the marked differences in kinetic parameter values that will be
found when studying the hydration status of a volunteer by using the optimal model. They
also illustrate that the T1/2 of Ringer’s exceeding 40 min serves well as a cut-off point
between euhydration and dehydration, regardless of the choice of volume kinetic model.
Even the model-independent Clr solved the task well while the urinary excretion alone was
hardly useful. Table 3 shows future investigators the sensitivity and specificity of kinetic
parameters that are capable of detecting dehydration.
Infusing a large fluid volume causes greater depression of the Hgb level but does
not seem to improve the usefulness of the dehydration test.17
The reason might be efficient
elimination of small volumes of fluid in euhydrated volunteers. The urinary excretion
even slightly exceeded the infused volume after 2 hours of the experiment with 5 ml/kg
(data not shown), which resulted in a high elimination Cl. Here, there was a marked
predominance of the one-volume model over the two-volume model (relationship 9/1),
which makes peripheral accumulation of fluid less likely. Dehydration-induced renal
conservation of fluid apparently contrasted very well and consistently against
high-elimination Cl.
The secondary hypothesis was that pulse oximetry could serve as a tool to reveal
dehydration. This was not possible with the approaches used here. Reduction of body
water changed the baseline for PI and Hgb, but the values differed too much between
individuals to be useful as a test of dehydration (Fig. 5).
The fluid recruitment maneuver, which consisted in a change of body position
from semi-standing to lying down, was designed to disclose relative differences in the
degree of capillary refill depending on hydration. The similar Hgb responses to this
maneuver are consistent with the expectation that furosemide would dehydrate the plasma
and the interstitial fluid volumes to a similar degree. An extension of the follow-up time
after the change in body position could possibly have shown a dehydration-dependent
difference in Hgb concentration, just as it did after the fluid infusion. On the other hand,

the non-invasive Hgb technology – in contrast to invasive laboratory analysis of Hgb –
does not yet offer the precision required to capture small Hgb differences in individuals.15
Interest has been focused on the PVI as an index of fluid responsiveness during
mechanical ventilation,9,10
and although the PVI is a less precise measure, it seems to
work in the conscious state as well.11,12
However, we found no difference in the baseline
PVI and no difference in the PVI response to the fluid recruitment maneuver that
depended on the state of hydration.
The present study has a proof-on-concept design and challenges whether volume
kinetics can detect dehydration and, if so, how much infusion fluid would be needed to
find out. The size of the body fluid space(s) expanded by an infusion can apparently not
detect dehydration, but elimination parameters can. Moreover, only a small volume of
fluid needs to be infused. Future studies with other designs are needed to examine whether
volume kinetics can discriminate between variable degrees of dehydration. The test also
needs careful validation in patients with vascular or renal disease.
Limitations include the necessity for blood sampling to distinguish safely
dehydrated from euhydrated volunteers. Infusions made in the euhydrated state began at
8:30 a.m., and in the presence of dehydration, they began at 11:00 a.m. A bladder catheter
was not used, which could have improved the quality of the urine data. The repeated
experiment shows that aberrant results could be produced by an abnormal diurnal rhythm
or lifestyle. Drobin´s single-volume model25
was first fitted to the data but required
stabilization from the urinary excretion values to work when based on only 16 samples.
The perceived role of the dehydration test is in the preoperative setting. In adults
awaiting hernia surgery after an overnight fast, half of the patients had a T1/2 of Ringer’s
exceeding 40 min,26
which is a likely incidence. The test is unsuitable for application
during general anesthesia and surgery as other mechanisms greatly prolong the T1/2 of
acetated Ringer’s under those conditions.2,7,8,27
Moreover, the fluid chosen for the test
must be retained if the kidneys sense dehydration but excreted if they do not. Therefore,
colloid fluids, or blood, are not viable options.
If the test shows that a patient is dehydrated the rational treatment is to replace the
missing volume by oral or intravenous fluid before anesthesia is induced. Alternatively,
those who are dehydrated may be given more fluid perioperatively to maintain organ
perfusion. In contrast, patients who are euhydrated should receive relatively less fluid to
avoid tissue edema, as the body´s capacity to excrete a surplus of crystalloid fluid is very
poor during anesthesia and surgery.2 The dehydration test could provide the
anesthesiologist with the information needed to individualize the fluid therapy in this way.
However, it is unclear at present whether such strategy would help to reduce the
complication rate or hospital time. The requirement for invasive sampling also contributes
to our belief that the dehydration test will primarily be used for research.
In conclusion, the half-life of a small volume of crystalloid fluid (5 ml/kg)
discriminated between eu- and dehydration in healthy volunteers. This finding opens a
possibility to disclose moderate degrees of dehydration and/or volume depletion that
previously have been difficult to explore. The prevalence and pathophysiological role of
such dehydration in the preoperative setting is currently unclear. Further studies are
needed to investigate whether the Hgb response to a preoperative fluid challenge can be
used to refine and individualize perioperative fluid therapy.
Acknowledgements: Nurses Susanne Öster and Helén Didriksson assisted during the
experiments. Statistician Elisabeth Berg, Karolinska Institutet, performed many of the
data analyses. The European Society of Anesthesiology supported the project.
References
1. Nisanevich V, Felsenstein I, Almogy G, Weissman C, Einav S, Matot I. Effect of
intraoperative fluid management on outcome after intraabdominal surgery.

Anesthesiology 2005; 103: 25-32
2. Hahn RG. Volume kinetics for infusion fluids (review). Anesthesiology 2010; 113:
470-81
3. Ståhle L, Nilsson A, Hahn RG. Modelling the volume of expandable body fluid
spaces during i.v. fluid therapy. Br J Anaesth 1997: 78: 138-43
4. Hahn RG, Drobin D. Urinary excretion as an input variable in volume kinetic
analysis of Ringer´s solution. Br J Anaesth 1998: 80: 183-8.
5. Drobin D, Hahn RG. Volume kinetics of Ringer’s solution in hypovolemic
volunteers. Anesthesiology 1999; 90: 81-91
6. Drobin D, Hahn RG. Kinetics of isotonic and hypertonic plasma volume expanders.
Anesthesiology 2002: 96: 1371-80
7. Ewaldsson C-A, Hahn RG. Kinetics and extravascular retention of acetated
Ringer’s solution during isoflurane and propofol anesthesia for thyroid surgery.
Anesthesiology 2005: 103: 460-9
8. Norberg Å, Hahn RG, Li H, Olsson J, Prough DS, Börsheim E, Wolf S, Minton R,
Svensén CH. Population volume kinetics predicts retention of 0.9% saline infused
in awake and isoflurane-anesthetized volunteers. Anesthesiology 2007; 107:
24-32
9. Cannesson M, Desebbe O, Rosamel P, Delannoy B, Robin J, Bastien O, Lehot J-J.
Pleth variability index to monitor the respiratory variations in the pulse oximeter
plethysmographic waveform amplitude and predict the fluid responsiveness in the
operating theatre. Br J Anaesth 2008; 101: 200-6
10. Forget P, Lois F, de Kock M. Goal-directed fluid management based on the pulse
oximeter-derived pleth variability index reduces lactate levels and improves fluid
management. Anesth Analg 2010; 111: 910-4
11. Soubrier S, Saulnier F, Hubert H, Delour P, Lenci H, Onimus T, Nseir S,
Durochner A. Can dynamic indicators help the prediction of fluid responsiveness
in spontaneously breathing critically ill patients? Intensive Care Med 2007; 33:

1117-24
12. Keller G, Cassar E, Desebbe O, Lehot JJ, Cannesson M. Ability of pleth variability
index to detect hemodynamic changes induced by passive leg raising in
spontaneously breathing volunteers. Critical Care 2008: 12: R37
13. El-Sayed MS, Ali N, Omar AA. Effects of posture and ergometer-specific exercise
modality on plasma viscosity and plasma fibrinogen: the role of plasma volume
changes. Clin Hemorheol Microcirc 2011; 47: 219-28
14. Armitage P, Berry G, Matthews JNS. Statistical Methods in Medical Research.
Oxford, Blackwell Science Ltd., 2001; pp. 40-4
15. Hahn RG, Li Y, Zdolsek J. Non-invasive monitoring of blood haemoglobin for
analysis of fluid volume kinetics. Acta Anaesthesiol Scand 2010; 54: 1233-40
16. Drobin D, Lindahl C, Hahn RG. Volume kinetics of acetated Ringer´s solution
during experimental spinal anesthesia. Acta Anaesthesiol Scand 2011; 55: 987-94
17. Hahn RG, Andrijauskas A, Drobin D, Svensen C, Ivaskevicius J. A volume loading
test for the detection of dehydration. Medicina 2008; 44: 953-9
18. Svensén C, Drobin D, Olsson, J, Hahn RG. Stability of the interstitial matrix after
crystalloid fluid loading studied by volume kinetic analysis. Br J Anaesth 1999; 82:
496-502
19. Holte K, Hahn RG, Ravn L, Bertelsen KG, Hansen S, Kehlet H. The influence of
liberal vs. restrictive fluid management on the elimination of a postoperative
intravenous fluid load. Anesthesiology 2007; 106: 75-9
20. Norberg A. Measurement of body fluids in vivo. In: Hahn RG, Prough DS,
Svensen CH, eds: Perioperative Fluid Therapy. New York, Informa Healthcare,
2007: 1- 11
21. Svensén CH, Olsson J, Hahn RG. Intravascular fluid administration and
hemodynamic performance during open abdominal surgery. Anesth Analg 2006:
103: 671-676.
22. Bundgaard-Nielsen M, Jorgensen CC, Secher NH, Kehlet H. Functional

intravascular volume deficit in patients before surgery. Acta Anaesthesiol Scand
2010; 54: 464-9
23. Broch O, Bein B, Grunewald M, Höcker J, Schöttler J, Meybohm P, Steinfath M,
Renner J. Accuracy of the pleth variability index to predict fluid responsiveness
depends on the perfusion index. Acta Anaesthesiol Scand 2011: 55: 686-93.
24. Guyton AC, Hall JE. Textbook of Medical Physiology, 9th
Edition. Philadelphia,
WB Saunders Company, 1996; p. 370
25. Drobin D. A single-model solution for volume kinetic analysis of isotonic fluid
infusions. Acta Anaesthesiol Scand 2006; 50:1074-80
26. Li Y, Hahn RG, Hu Y, Xiang Y, Zhu S. Plasma and renal clearances of lactated
Ringer’s solution in pediatric and adult patients just before anesthesia is induced.
Pediatric Anesthesia 2009: 19: 682-7
27. Li Y, Zhu HB, Zheng X, Chen HJ, Shao L, Hahn RG. Low doses of esmolol and
phenylephrine act as diuretics during intravenous anesthesia. Crit Care 2012; 16:
R18

Table 1. Flow diagram for Experiments (1) to (4) performed in 10 volunteers.
Measurements are marked in blue.
(1)
Drink 800 ml
tap water, free
voiding
Fluid
recruit-
ment
test (pulse
oximetry)
Infusion 5 ml/kg (Invasive Hb)
(2)
Infusion 10 ml/kg
(Invasive Hb)
(3)
Dehydration
Fluid
re-cruitment
Test (pulse oximetry)
Infusion 5 ml/kg (Invasive Hb)
(4)
Infusion 10 ml/kg (Invasive Hb)
6 7 8 9 10 11 12 13
Hour of the day
Experiment

Table 2
Optimal estimates of the kinetic parameters when the one-volume model was used
to analyze all data, when the statistically justified volume kinetic model (one- or
two-volume model) according to the F test was applied, and when the collected
urine was used, depending on whether or not the experiment was preceded by a
dehydration procedure. Symbols are defined in Fig. 1 and the data are the median
(25th
-75th
percentiles) for the group.
* Wilcoxon´s matched-pair test when the number of patients in the groups are equal,
else the Mann-Whitney´s test.
Euhydration
Dehydration
Statistics*
One-volume model only n=20 n=20 Vc (ml/kg) 60 (45-70) 62 (55-72)
Cl (ml/min/kg) 1.84 (1.23-2.57) 0.53 (0.41-0.79) P< 0.001
T ½ (minutes) 23 (12-37) 76 (57-101) P< 0.001
Optimal model One-volume
n=14
n=4
Vc (ml/kg) 56 (43-69) 62 (54-72)
Cl (ml/min/kg) 2.21 (1.33-2.80) 0.54 (0.45-0.70) P=0.044
Two-volume n=6
n=16
Vc (ml/kg) 35 (30-49) 36 (31-44)
Vp (ml/kg) 49 (38-59) 48 (38-69)
Cl (ml/min/kg) 0.83 (0.63-1.13) 0.23 (0.03-0.41) P< 0.001
Cld (ml/min/kg) 3.6 (2.9-5.4) 2.7 (1.7-3.4)
Pooled optimal
n=20
n=20
Cl (ml/min/kg) 1.65 (1.01-2.57) 0.32 (0.09-0.45) P< 0.001
T ½ (min) 21 (13-33) 82 (70-135) P< 0.001
P< 0
Urine-based kinetics n=18 n=20
Clr (ml/min/kg) 1.67 (1.11-3.10) 0.42 (0.27-0.82) P < 0.001
Excreted/Infused (percent) 73 (52-129) 49 (36-82) P = 0.037
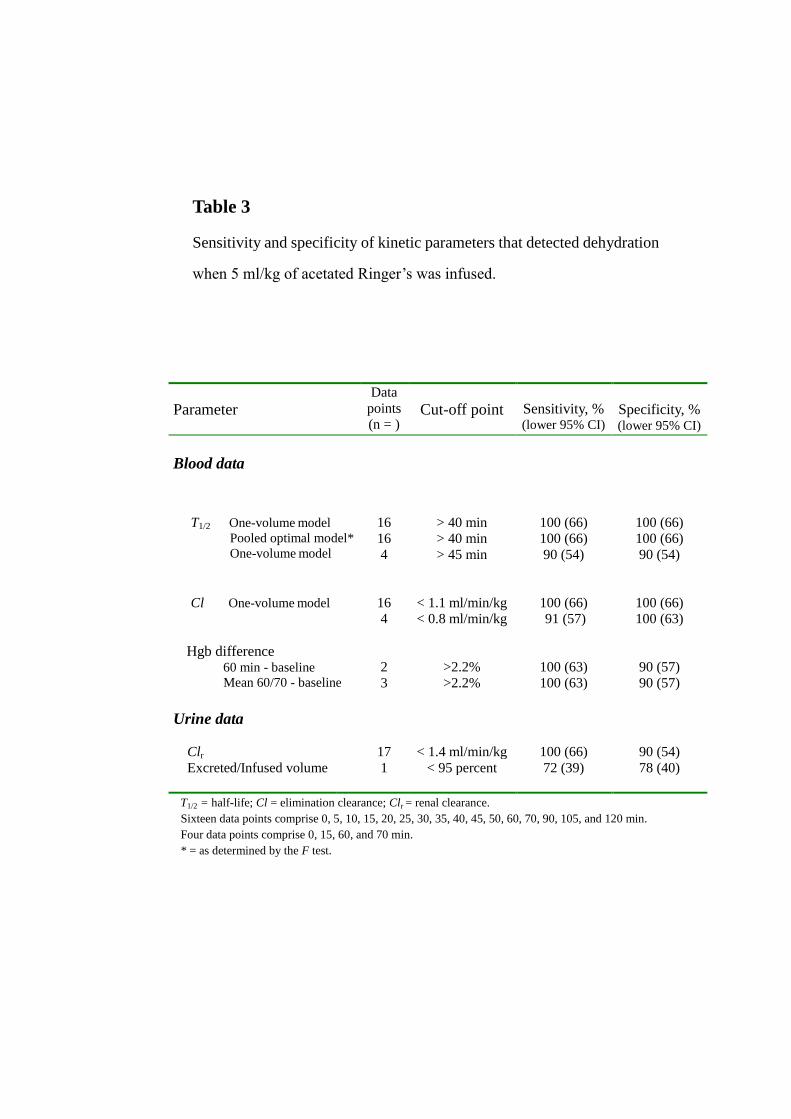
Table 3
Sensitivity and specificity of kinetic parameters that detected dehydration
when 5 ml/kg of acetated Ringer’s was infused.
Parameter
Data
points
(n = )
Cut-off point
Sensitivity, % (lower 95% CI)
Specificity, % (lower 95% CI)
Blood data
T1/2 One-volume model
Pooled optimal model*
One-volume model
16
16
4
> 40 min
> 40 min
> 45 min
100 (66)
100 (66)
90 (54)
100 (66)
100 (66)
90 (54)
Cl One-volume model
16
4
< 1.1 ml/min/kg
< 0.8 ml/min/kg
100 (66)
91 (57)
100 (66)
100 (63)
Hgb difference 60 min - baseline
Mean 60/70 - baseline
2
3
>2.2%
>2.2%
100 (63)
100 (63)
90 (57)
90 (57)
Urine data
Clr
17
< 1.4 ml/min/kg
100 (66)
90 (54)
Excreted/Infused volume 1 < 95 percent 72 (39) 78 (40)
T1/2 = half-life; Cl = elimination clearance; Clr = renal clearance.
Sixteen data points comprise 0, 5, 10, 15, 20, 25, 30, 35, 40, 45, 50, 60, 70, 90, 105, and 120 min.
Four data points comprise 0, 15, 60, and 70 min.
* = as determined by the F test.

Legends to figures
Fig. 1. The one- and two-volume kinetic models used to analyze the data (top) and the
definitions and units of the input and output variables and parameters (bottom). Flow
parameters are shown in blue and volumes in red.
Fig. 2. Parameters that distinguish between euhydration and dehydration. The 5 ml/kg
volume of Ringer´s solution (blue symbols) offered the best separation, as marked by the
green line. Each point is one experiment, arranged from lowest to highest value,
depending on whether the kinetics were analyzed according to the one-volume model (A
and B) or with the optimal model (C). Half-lives ≥175 min were represented on the graph
by that value.
Fig. 3. The fractional dilution of venous plasma during and after infusion of 5 ml/kg (A
and B) and 10 ml/kg (C and D) of acetated Ringer’s solution during 15 min in 10
volunteers in the euhydrated (A and C) and dehydrated (B and D) state. Green lines
indicate individual experiments where the fractional plasma dilution was calculated as
[(Hgb/Hgb(t))-1]/(1-Hct); Hgb and Hct are the hemoglobin concentration and the
hematocrit at baseline, respectively, and Hgb(t) is the hemoglobin concentration at a later
time (t). The thick blue line is the modeled curve based on the kinetic parameters for the
statistically justified (optimal) model, as shown in Table 2.
Fig. 4. Predicted dilution of venous plasma over time based on the kinetic parameters for
the statistically justified kinetic model in each one of 40 experiments in which 10
volunteers received either 5 ml/kg (A) or 10 ml/kg (B) over 15 min when being in the
euhydrated and dehydrated state. The greatest difference in plasma dilution between the
dehydrated and euhydrated state was reached after approximately 60–70 min (C and D).

Fig. 5. Pulse oximeter indices during the fluid recruitment maneuver involving a change
of body position from semi-standing to lying down at 10 min. Mean (SD) values
comprising (A) the perfusion index, (B) Hgb concentration, and (C) the pleth variability
index (PVI) from 40 tests. Half of the tests were performed shortly after dehydration of 1.7
L (mean) with furosemide. Open squares=euhydration, filled circles=dehydration.

Fig. 1
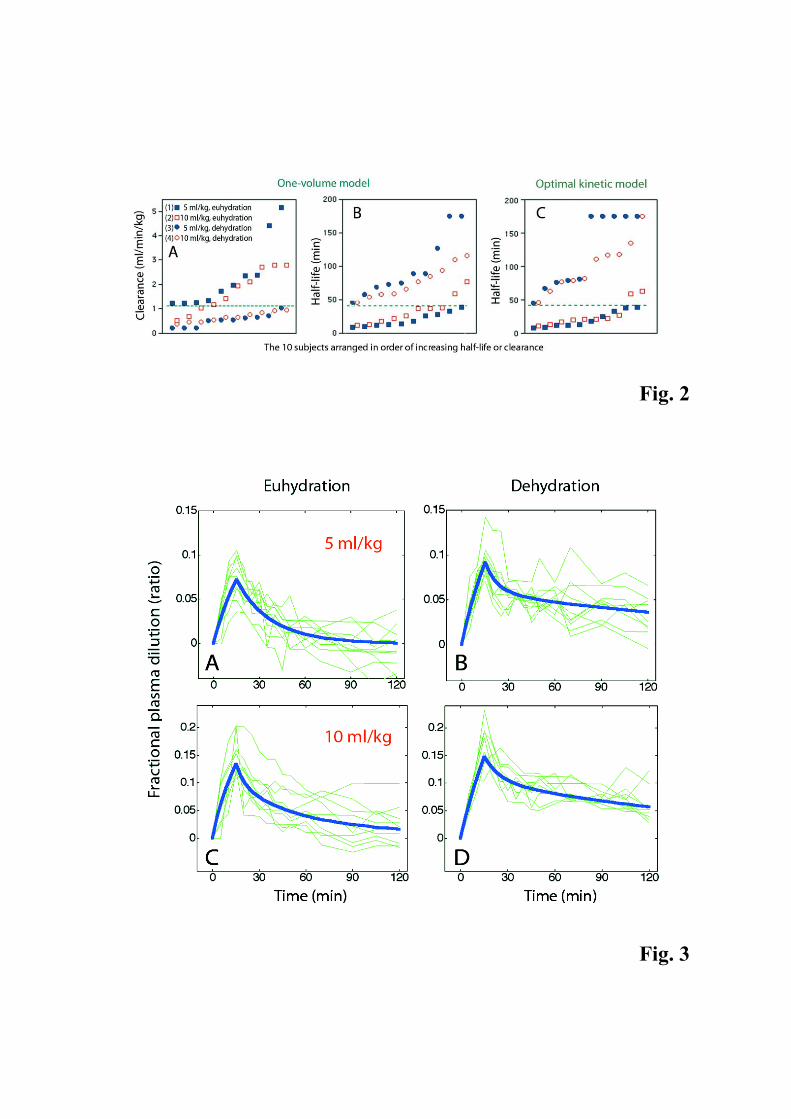
Fig. 2
Fig. 3

Fig. 4

Fig. 5