detection of selection signatures on the x chromosome in
TRANSCRIPT

Int. J. Mol. Sci. 2015, 16, 20360-20374; doi:10.3390/ijms160920360
International Journal of
Molecular Sciences ISSN 1422-0067
www.mdpi.com/journal/ijms Article
Detection of Selection Signatures on the X Chromosome in Three Sheep Breeds
Caiye Zhu 1,2, Hongying Fan 1,3, Zehu Yuan 1, Shijin Hu 1, Li Zhang 1, Caihong Wei 1,
Qin Zhang 2, Fuping Zhao 1,* and Lixin Du 1,*
1 National Center for Molecular Genetics and Breeding of Animal, Institute of Animal Sciences,
Chinese Academy of Agricultural Sciences, No. 2 Yuanmingyuan West Rd., Haidian,
Beijing 100193, China; E-Mails: [email protected] (C.Z.); [email protected] (H.F.);
[email protected] (Z.Y.); [email protected] (S.H.); [email protected] (L.Z.);
[email protected] (C.W.) 2 College of Animal Science and Technology, China Agricultural University, Beijing 100193, China;
E-Mail: [email protected] 3 College of Animal Science and Technology, Gansu Agricultural University, Lanzhou 730070, China;
* Authors to whom correspondence should be addressed;
E-Mails: [email protected] (F.Z.); [email protected] (L.D.); Tel./Fax: +86-10-6281-8815 (F.Z.).
Academic Editor: Izuho Hatada
Received: 29 June 2015 / Accepted: 19 August 2015 / Published: 28 August 2015
Abstract: Artificial selection has played a critical role in animal breeding. Detection of
artificial selection footprints in genomic regions can provide insights for understanding the
function of specific phenotypic traits and better guide animal breeding. To more fully
understand the relationship between genomic composition and phenotypic diversity arising
from breed development, a genome-wide scan was conducted using an OvineSNP50
BeadChip and integrated haplotype score and fixation index analyses to detect selection
signatures on the X chromosome in three sheep breeds. We identified 49, 34, and 55 candidate
selection regions with lengths of 27.49, 16.47, and 25.42 Mb in German Mutton, Dorper, and
Sunit sheep, respectively. Bioinformatics analysis showed that some of the genes in these
regions with selection signatures, such as BMP15, were relevant to reproduction. We also
identified some selection regions harboring genes that had human orthologs, including BKT,
CENPI, GUCY2F, MSN, PCDH11X, PLP1, VSIG4, PAK3, WAS, PCDH19, PDHA1, and
SRPX2. The VSIG4 and PCDH11X genes are associated with the immune system and disease,
PDHA1 is associated with biosynthetic related pathways, and PCDH19 is expressed in the
nervous system and skin. These genes may be useful as candidate genes for molecular breeding.
OPEN ACCESS

Int. J. Mol. Sci. 2015, 16 20361
Keywords: selection signature; X chromosome; sheep
1. Introduction
Artificial selection has played a significant role in the domestication of livestock. Approximately
11,000 years ago, domesticated animals began to appear in the Fertile Crescent [1]. Sheep, the first
livestock known to be domesticated, were initially reared for their meat before their breeding became
specialized for secondary products, such as wool, which occurred between 4000 and 5000 years ago [2].
Domestication reshaped the behavior, morphology, and genetics of the involved livestock. For example,
two studies found that artificial selection changed sheep coat pigmentation, horn morphology and
growth developmental traits [3,4] using a genome scan of recent positive selection signatures in three
sheep populations.
Selection has many effects on the genome. Positive selection can improve advantageous allele
frequencies and fix them within a population [5]. As a result, polymorphism at a selection site is reduced
in the population. With the development of high-density single nucleotide polymorphism (SNP) chips
and high-throughput genotyping technology, a number of statistics have been used to explore selection
signatures on genes and the genome [6]. For instance, signatures indicating diversified selection among
breeds are found in genomic regions associated with traits related to the standard criteria for breeds,
such as coat color and ear morphology. Other selection signals are found in genomic regions such as
quantitative trait loci and genes associated with production traits, including reproduction, growth, and
fat deposition. Some selection signatures in sheep are associated with regions showing evidence of
introgression from Asian breeds. When European sheep breeds were compared with the wild boar,
genomic regions with high levels of differentiation were found to harbor genes related to bone formation,
growth, and fat deposition [7].
Selection signatures can be detected through the variation of allele frequency and decay of linkage
disequilibrium. To date, some related methods have been put forward and can be classified into
categories of linkage disequilibrium and site-frequency spectrum [8]. The integrated haplotype score
(iHS) [9] and F-statistics (FST) [10] are extensively used in identifying selection signatures. The iHS has
been used mainly to reveal the selection signatures (within-population methods) using information from
a single population, whereas FST has been used primarily to detect selection signatures between
populations. The iHS is based on linkage disequilibrium theory and can detect regions with a rapidly
increased frequency of the derived allele at selected sites [9]. The FST, first used to evaluate population
variation through the DNA polymorphism of a population, is currently based on a Bayesian hierarchical
model [11]. McRae et al. [12] used FST to identify 14 novel regions associated with resistance or
susceptibility to gastrointestinal nematodes in sheep.
The X chromosome has a high density of genes and thus may be a good target for detecting selection
signatures. Rubin et al. [13] pointed out that the X chromosome should be solely analyzed for the
identification of selection signatures, and only sows should be used because sex chromosomes and
autosomes, even between genders, are subjected to different selective pressures and have different
effective population sizes. The X chromosome undergoes more drift than autosomes, as its effective

Int. J. Mol. Sci. 2015, 16 20362
population size is three-quarters that of autosomes [14]. The X chromosome is more specialized than an
autosome and plays an important role in evolution of human and animals. Studies have shown that
selection on the X chromosome reduces the genomic diversity to a greater extent than that on autosomes
(19%–26%) [15]. Ma et al. [6] studied selection footprints on the X chromosome in pigs and determined
that genes relevant to meat quality, reproduction, and the immune system were found in potential
selection regions. Moradi et al. [16] used the OvineSNP50 BeadChip to scan selective sweeps in thin
and fat tail sheep and found increased homozygosity in selection regions in favor of fat tail breeds on
chromosomes 5 and X. Taking into account the sex-specific dosage compensation, the selection pressure
on the X chromosome is higher than that on the autosomes, indicating that genes on the X chromosome
are under more direct and effective selection [17,18]. The X chromosome in sheep contains several genes
relevant to desirable breeding traits, including those related to tail fat deposition [19], further indicating
that this is a good target chromosome for examining selection signatures in sheep.
Therefore, in the present study, within-population (iHS) and between-population (FST) methods were
used to search the whole X chromosome in three breeds of sheep for signatures of positive selection
using the OvineSNP50 BeadChip array, followed by candidate gene enrichment analysis and gene
annotation to elucidate the biological functions of the selection signature.
2. Results
2.1. Markers and Core Haplotypes
After quality control and PCA analyses (Figure 1), 89 German Mutton, 47 Dorper, and 12 Sunit ewes
were used in the final analyses. A total of 1226 SNPs were obtained per breed. The average distance
between two SNPs was 110.11 kb.
Figure 1. Animal clusters based on principal component analysis (PCA) using individuals.
Plots for the first (PCA1) and second (PCA2) components reveal the clustering of
148 animals from German Mutton, Dorper and Sunit.

Int. J. Mol. Sci. 2015, 16 20363
2.2. Empirical Distribution of Test Statistics
The empirical distributions of the two test statistics for each breed and breed pair were clearly
observed. Figure 2 shows the distributions of the iHS and FST values on the X chromosome of German
Mutton sheep and pairwise for German Mutton, Dorper, or Sunit. Tables S1–S4 show the true values for
each SNP in every breed. The standardized iHS and FST values approximately followed a standard
normal distribution, as pointed out by Sabeti et al. [20]. Moreover, the distributions of the iHS test
statistics indicated that the other individual breeds and the comparison of breed pairs with one another
showed similar results.
Figure 2. Cont.

Int. J. Mol. Sci. 2015, 16 20364
Figure 2. Empirical distribution of test statistics within the three individual populations (iHS)
and between (FST) the German Mutton, Dorper and Sunit ewe populations.
2.3. Identification of Recent Selection Signatures on the X Chromosome
The scanning of the X chromosome for selection signatures in the three sheep breeds was conducted
using between- and within-population methods. First, the within-population method iHS was used to
look for selection signatures in the three breeds. The iHS scores were computed at each SNP over the
whole genome using haplotypes. Figure 3 depicts the distribution of the PiHS value on the X chromosome
to visualize the distribution of the selection signatures. As shown in Table 1, there were 51, 21, and
46 outliers identified in German Mutton, Dorper, and Sunit, respectively.
Figure 3. The X chromosome distribution of PiHS values in the three breeds. The dotted line
was denoted as the threshold, indicating significant regions.
Int. J. Mol. Sci. 2015, 16 20365
Table 1. Summary of selection signatures detected using iHS and FST in three sheep breeds.
Items iHS FST
G M D S G M-D-S G M-D S-G M S-D
Number of SNPs 51 21 46 12 12 12 12 Number of regions 35 17 37 10 9 11 9
Average length (Mb) 0.43 0.44 0.43 0.43 0.43 0.40 0.45 Total length (Mb) 14.78 7.59 15.93 4.35 3.89 4.44 40.3
(G M represents German Mutton; D represents Dorper; S represents Sunit).
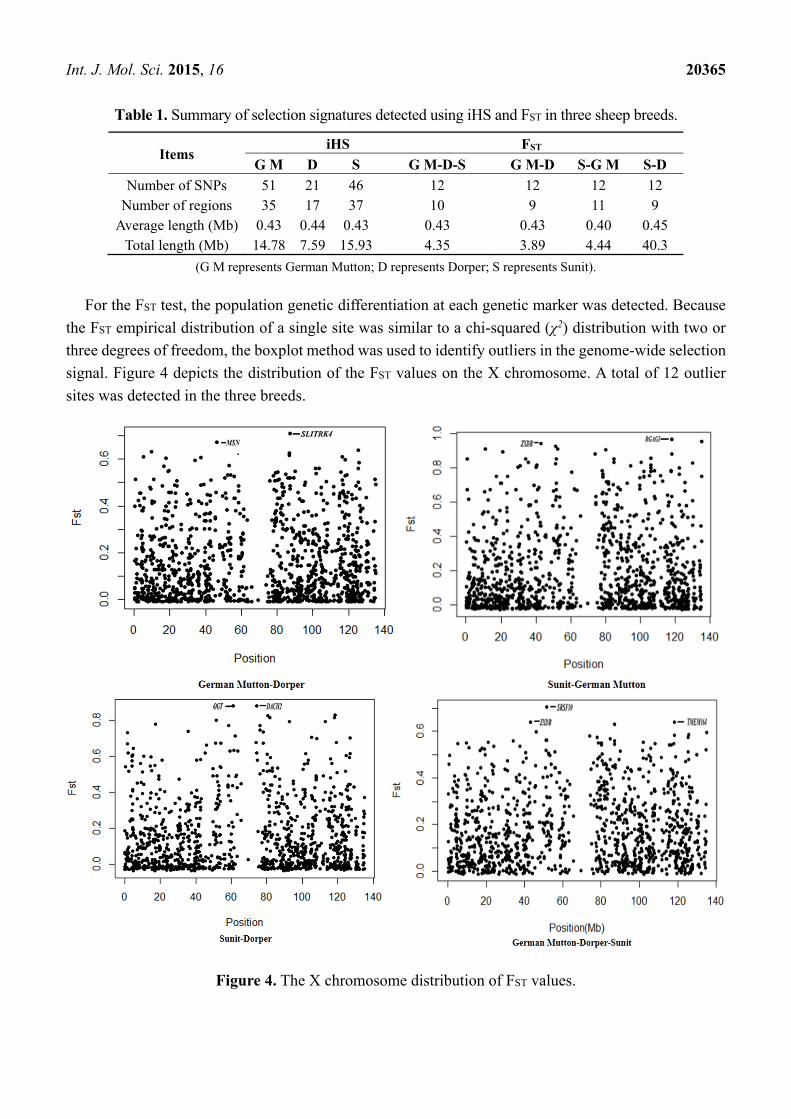
For the FST test, the population genetic differentiation at each genetic marker was detected. Because
the FST empirical distribution of a single site was similar to a chi-squared (χ2) distribution with two or
three degrees of freedom, the boxplot method was used to identify outliers in the genome-wide selection
signal. Figure 4 depicts the distribution of the FST values on the X chromosome. A total of 12 outlier
sites was detected in the three breeds.
Figure 4. The X chromosome distribution of FST values.

Int. J. Mol. Sci. 2015, 16 20366
2.4. Candidate Selection Regions
A region on the X chromosome having a false discovery rate (FDR) less than 0.1 for both methods,
or an FDR less than 0.05 for one method, was considered a candidate selection region. As shown in
Table 1, using the iHS test, 35, 17, and 37 candidate selection regions with lengths of 14.78, 7.59, and
15.93 Mb were identified in German Mutton, Dorper, and Sunit, respectively. As shown in Table 1,
using the FST test, 10 candidate selection regions with lengths of 4.35 Mb were identified for German
Mutton-Dorper-Sunit. Overall, approximately 19.33, 11.82, and 20.10 Mb selection regions were
detected in German Mutton, Dorper, and Sunit. The Sunit, a representative Chinese indigenous breed,
shared approximately 5.46 Mb candidate selection regions with German Mutton. This was less than the
overlapping regions between Sunit and Dorper. In addition, there were approximately 7.29 Mb candidate
selection regions shared by German Mutton and Dorper, with an overlapping length longer than that
shared by Sunit and German Mutton or by Sunit and Dorper.
2.5. Identification of Candidate Genes in Selection Regions and Functional Analysis
The genes in the selection regions were identified using the Ovis_aries_3.1 database. After a
comparison analysis, 102, 76, 102 genes were detected within regions positive for selection signatures
in German Mutton, Dorper, and Sunit, respectively. Table 2 summarizes the genes in regions with the
top five significant |iHS| values on the X chromosomes of the three breeds.
Table 2. Selection regions on the X chromosome and corresponding genes for the top five
significant iHS values in each sheep breed.
Breed Region (Mb) |iHS| Gene
German Mutton
122.16–122.56 5.85 TCEAL4, TCEAL1, MORF4L2, GLRA4, PLP1, RAB9B, TMSB15B, CYSLTR1
118.98–119.38 5.07 NXT2 19.83–20.23 4.80 - 40.51–40.91 4.39 FAM192A 3.77–4.17 3.66 -
Dorper
30.58–30.98 6.63 LAMP1 41.36–41.76 4.12 EFHC2 23.67–24.07 3.72 - 134.90–135.30 3.56 PABPC5 31.27–31.67 3.29 -
Sunit
103.45–103.85 3.63 TEX13A 31.98–32.38 3.44 TMEM47 40.13–40.53 3.32 - 116.80–117.2 3.30 TRPC5, ALG13 94.82–95.22 3.25 -
The locus with the greatest FST value (0.705) was within the DNA region of the SRSF10 gene.
The genes that overlapped with three other FST peaks were TMEM164, ZXDB, and SLITRK2. Twelve
other SNPs with significant FST values also existed within selection regions. The genes harbored in the
selection regions are shown in Table 3.

Int. J. Mol. Sci. 2015, 16 20367
Table 3. Selection and candidate genes detected by FST among the three breeds.
Breed Pair Position (Mb) FST Value Gene Name
German
Mutton-
Dorper-Sunit
51.51–51.91 0.71 SRSF10, DGKK, CCNB3
117.91–118.31 0.64 TMEM164
42.80–43.21 0.64 ZXDB
86.91–87.31 0.63 SLITRK2
45.82–46.22 0.59 MSN, MMD, VSIG4, HEPH
134.78–135.18 0.59 PCDH11X, ZGC:112234, PABPC5
125.43–125.83 0.58 TIMM8A, BTK, RPL36A, GLA, HNRNPH2, ARMCX4, CSNK1A1,
ARMCX1, ARMCX6, ARMCX3, ARMCX2
117.84–118.24 0.58 RGAG1, AMMECR1
73.69–74.09 0.57 CHM, DACH2
77.77–78.17 0.57 FAM58A, ATP2B3, BGN, HAUS7, TREX2, ZNF275, KIR3DL1
125.15–125.55 0.57 XKRX, ARL13A, TRMT2B, TMEM35, CENPI, DRP2, TAF7L
84.41–84.81 0.56 SLITRK2, SLITRK4
German
Mutton-Dorper
86.65–87.30 0.71 SLITRK4
45.82–46.22 0.67 MSN, MMD, VSIG4, HEPH
125.15–125.55 0.64 XKRX, ARL13A, TRMT2B, TMEM35, CENPI, DRP2, TAF7L
9.35–9.75 0.63 -
4.85–5.25 0.61 PNPLA4
116.23–116.63 0.61 -
37.26–37.66 0.61 BCOR, DUT
17.56–17.96 0.60 RPS6KA3
117.84–118.24 0.59 RGAG1, AMMECR1
Sunit-German
Mutton
117.91–118.31 0.97 RGAG1, AMMECR1, TMEM164
134.78–135.18 0.95 PCDH11X, ZGC:112234, PABPC5
42.80–43.20 0.94 ZXDB
51.17–51.61 0.93 SHROOM4, SRSF10
10.63–11.03 0.91 EGFL6, RAD51L3
52.36–52.76 0.91 USP27X, SUMO2, PPP1R3F, FOXP3, CCDCC22, CACNA1F, SYP,
PRICKLE3, PLP2, MAGIX, GPKOW, RPL36, WDR45, PRAF2
79.89–80.29 0.90 CD99L2, MTMR1, MTM1, MAMLD1
20.82–21.22 0.89 PRDX4, ACOT9, SAT1
73.69–74.09 0.88 CHM, DACH2
117.91–118.31 0.88 RGAG1, AMMECR1, TMEM164
Sunit-Dorper
60.80–61.20 0.87 OGT, ACRC, CXCR3, DMRTC2
74.29–74.69 0.87 DACH2
118.09–118.49 0.82 AMMECR1, TMEM164
80.30–80.76 0.82 MAMLD1
117.72–118.12 0.81 CHRDL1, RGAG1
81.49–81.89 0.81 AFF2
51.51–51.91 0.80 SRSF10, DGKK, CCNB3
112.66–113.06 0.79 PLS3
92.61–93.01 0.79 -
17.08–17.48 0.77 MAP3K15, RPL17, SH3KBP1, CXORF23

Int. J. Mol. Sci. 2015, 16 20368
DAVID v2.1 was used to conduct the GO and KEGG pathway enrichment analyses to investigate the
functions of the candidate genes. After this enrichment analysis, followed by the Benjamini correction
procedure, there were almost no significant functional terms.
The genes were found to be involved in metabolism, muscle development, and reproduction based
on information in the NCBI gene database, although some genes were not entirely harbored within the
potential selection regions. Among them, BMP15, identified by iHS, overlapped with the potential
selection region of 51.07–51.91 Mb and functions in reproduction [21].
3. Discussion
In recent years, extensive research using SNP chip array data to detect positive selection signatures
has made considerable progress [9,22–25]. During this same time, a number of statistical methods have
been developed to identify selection regions in the genome. To increase the accuracy of detection,
we used two methods in the present study to detect selection regions on the X chromosome: iHS and FST
approaches. The iHS relies on the EHH statistic, providing a more powerful approach to identify
selection footprints at loci that are fixed or probably fixed [26]. The iHS test is based on linkage
disequilibrium and is dependent on SNP spacing and frequency because it is a multi-marker test [16].
On the X chromosome, 1226 SNPs may not affect the accuracy of the iHS. Additionally, the power of
the iHS method also relies on ancestral allele information, which is available for only a portion of the
SNPs on the ovine chip [16]. However, Zhao et al. [27] used iHS and FST to successfully identify
selection signatures in dairy and beef cattle .The FST measures population differentiation by detecting
allele frequencies at a locus using a between-population method [28]. Detecting recent positive selection
with FST is complicated because the distribution of the genetic variation due to selection can be difficult
to distinguish from that which arises after certain demographic events [15]. However, ascertainment bias
and demographic events would be expected to change patterns of FST in the same way genome-wide,
whereas FST values only in selected and nearby loci would be altered by selection events [29–32].
In this study, the results obtained using the iHS method followed strict distributions. By contrast,
the results obtained using the FST approach did not follow strict distributions, but followed an
approximately normal distribution. This difference indicates that the risk of false positives when using
the traditional significance test remains high because of the uncertainty in the null distribution for the
test statistic [6]. For this reason, a boxplot strategy was used to determine the upper and lower threshold
values, confirming the outliers for the FST values at each SNP locus. Thus, the results of the methods
used to detect selection signatures on the X chromosome were subjected to strict criteria to prevent the
occurrence of false positives. As stated, for the FST statistic, the boxplot strategy [29] was adopted to
define upper and lower threshold FST values for each SNP locus to determine outliers. We first calculated
the distribution of the X chromosome FST interquartile range; then, FST values greater than the upper
threshold or less than the lower threshold values were defined as outliers.
In this study, 49, 34, and 55 selection regions were detected in German Mutton, Dorper, and Sunit
breeds, respectively. German Mutton sheep were imported into China from Germany at the end of
20th century, and Dorper sheep from Australia in 2001 [30]. As these livestock populations migrated
across the globe, they encountered numerous environments, each with unique ecological conditions.
The populations were exposed to artificial selection through breeding programs. Hence, their genomes

Int. J. Mol. Sci. 2015, 16 20369
would be expected to be marked with many signals of positive selection. Sunit sheep are indigenous to
northern China and are used for both their meat and fat in the Inner Mongolia Autonomous Region of
China. Sunit sheep have adapted to the natural conditions of the Gobi Desert after approximately 800 years
of natural and artificial selection. German Mutton shared approximately 7.29 Mb candidate selection
regions with Dorper. This is a longer overlapping length than that shared by Sunit and German Mutton,
which shared 5.46 Mb, or Dorper and Sunit, which shared approximately 5.90 Mb selection regions. This
result suggests that selection intensity may be greater for German Mutton and Dorper than for Sunit sheep.
Following the Benjamini correction for the enrichment analysis of the genes located in candidate
selection regions, no significant functional terms were detected. However, some GO terms with p values
less than 0.05 were related to biological process, molecular functions, and cellular components,
indicating that some traits may have undergone selection during the domestication of these sheep.
We also detected some genes associated with the immune system on the X chromosome in sheep,
consistent with the identification of selection footprints on the X chromosome in pigs [6].
Among our candidate genes, VSIG4 was identified and characterized by Helmy et al. [31] to be a
complement receptor in the immunoglobulin superfamily, binding complement fragments C3b and iC3b
to remove pathogenic microorganisms. The PCDH19 gene was another candidate gene for selection
detected in our study, and it is expressed in the nervous system and skin and its derivative tissues [32]. The
BTK gene is known to function in adaptive immunity, mainly in B cell signaling pathways, playing a key
role in B cell proliferation, development, differentiation, survival, and apoptosis [33,34]. Demars et al. [35]
identified two novel BMP15 mutations responsible for an atypical hyperprolificacy phenotype in sheep.
To date, a number of studies have identified selection signatures in sheep [36,37], but these studies
focused on autosomal genes. Amaral et al. [38] used sequencing of pooled DNA to detect selection
signatures genome-wide, but found it was difficult to analyze the isolated X chromosome. Rubin et al. [13]
proposed that the X chromosome should be separately analyzed to detect selection signatures,
as we did in this study. Thus, using iHS and FST, we detected 222 genes on the X chromosome in sheep
with signatures indicating that they had undergone selection during domestication. These genes can be
used as molecular markers in future sheep breeding.
4. Experimental Section
4.1. Experimental Animals and DNA Samples
The sheep population initially consisted of 161 (71 males and 90 females) German Mutton, 99 (49 males
and 50 females) Dorper, and 69 (57 males and 12 females) Sunit. After a principal component analysis
(PCA) was performed to identify population structure and the relatedness of animals, 148 females,
including 89 German Mutton, 47 Dorper, and 12 Sunit, were finally chosen for selection signature
identification on the X chromosome.
Blood samples were collected from six-month-old lambs using standard methods. Whole genomic
DNA was extracted from blood samples using a TIANamp Blood DNA kit (Tiangen Biotech Co., Ltd.,
Beijing, China).

Int. J. Mol. Sci. 2015, 16 20370
4.2. Genotyping and Quality Control
Genomic DNA was genotyped using the Illumina OvineSNP50 BeadChip containing 54,241 SNPs
with an average gap spacing distance of 50.9 kb. The genotyping platform used was the Infinium II
Multi-Sample Assay (Illumina, Inc., San Diego, CA, USA). The SNP chips were scanned using iScan,
and the data were analyzed using GenomeStudio software (Illumina).
PLINK software (v1.07; http://pngu.mgh.harvard.edu/purcell/plink) was used to control the quality
of the X chromosome genotype data. An individual was removed if the call rate was less than 90% or
the sample was a duplicate. A SNP locus was excluded if (1) the SNP call rate was less than 90%;
(2) its minor allele frequency was less than 0.05; or (3) it did not obey Hardy-Weinberg equilibrium
(p value < 10−6). After quality control, BEAGLE software [39] was used to impute the missing genotypes
and infer haplotypes.
4.3. Analyses Integrated Haplotype Score
The iHS, calculated as described by Voight et al. [9], was defined as the log of the ratio of the
integrated extended haplotype homozygosity (EHH) score for haplotypes centering the ancestral allele
to the integrated EHH score for haplotypes centering the derived allele. The iHS score was computed at
X chromosome SNPs for each breed using the R package “rehh” [40]. The formula for the standardized
iHS is as follows:
=
D
A
D
A
D
A
iHH
iHHSD
iHH
iHHE
iHH
iHH
iHS
ln
ln-ln
(1)
where iHHA and iHHD represent the integrated EHH score for ancestral and derived core alleles, respectively.
4.4. Population Differentiation Index
The classic measure of population genetic differentiation, FST, was used to detect signatures of
diversifying selection, based on genetic polymorphism data. Here, FST was calculated as described by
MacEachern et al. [41]:
STT S
T
H HF
H
−= (2)
where HT represents the expected heterozygosity for the overall total population such that
( )2 2T 1H p q= − − (3)
where p and q denote the frequency of alleles A1 and A2 over the total population.
In Equation (2), HS represents the expected heterozygosities in subpopulations and is calculated as follows:
exp1S
Total
i
n
iiH n
HN
=×
= (4)
with Hexpi denoting expected heterozygosity and ni denoting the sample size in subpopulation i.

Int. J. Mol. Sci. 2015, 16 20371
4.5. Identifying the Region in the X Chromosome under Selection
For FST, A boxplot strategy was used to determine the upper and lower threshold values to confirm
outliers of the FST values for each SNP locus.
First, the interquartile range (Q) of the FST empirical distribution on X chromosome was calculated as LU FFQ += (5)
with FU and FL representing the upper and lower interquartile ranges, respectively. The upper (UL)
and lower (LL) threshold values were then calculated as follows:
QFUL U 5.1+= (6)
QFLL L 5.1−= (7)
All values greater than the upper threshold or less than the lower threshold values were defined
as outliers.
For iHS, the thresholds of empirical cutoffs for the X chromosome were based on the autosomal
cutoffs. The threshold of |iHS| on the X chromosome was |iHS| > 2.
4.6. Enrichment Analysis
Kyoto Encyclopedia of Genes and Genomes (KEGG) pathway mapping, molecular function, cellular
components, and biological process were determined for the candidate selection regions. An abundant
database of human genomic information was referred to identify genes on the sheep genome using the
many available annotations on the sheep genome. The program Database for Annotation, Visualization
and Integrated Discovery (DAVID) 6.7 (http://david.abcc.ncifcrf.gov/) [42] was used to generate the
homology gene set and gene enrichment analysis.
4.7. Gene Annotation
In the selection region, the outlier or selection footprint was extended approximately 100 kb in the
upstream and downstream directions. The National Center for Biotechnology Information
(http://www.ncbi.nlm.nih.gov/gene/) database and the most recent sheep genome Ovis_aries_v3.1 [43]
(http://www.livestockgenomics.csiro.au/sheep/oar3.1.php) were used to identify the biological function
of genes in the selection regions. In addition, the genomic information of other species, including human,
mouse, and bovine, were used to predict gene function.
5. Conclusions
In this study, we were able to identify many novel regions and genes on X chromosome by different methods, we demonstrated that X chromosome has undergo selection in the process of sheep domesticated.
Supplementary Materials
Supplementary materials can be found at http://www.mdpi.com/1422-0067/16/09/20360/s1.

Int. J. Mol. Sci. 2015, 16 20372
Acknowledgments
This work was supported by the Agricultural Science and Technology Innovation Program
(No. ASTIP-IAS-TS-6), National Natural Science Foundations of China (No. 31200927), and the National
Modern Agricultural Industry Technology Fund for Scientists in Sheep Industry System (No. CARS-39-04B).
Author Contributions
Fuping Zhao and Lixin Du conceived and designed the experiments; Caiye Zhu performed the
experiments; Caiye Zhu and Zehu Yuan analyzed the data; Hongying Fan, Shijin Hu, Li Zhang,
Caihong Wei, and Qin Zhang contributed reagents/materials/analysis tools; Caiye Zhu wrote the paper.
All authors read and approved the final manuscript.
Conflicts of Interest
The authors declare no conflict of interest.
References
1. Zeder, M.A. Domestication and early agriculture in the Mediterranean Basin: Origins, diffusion,
and impact. Proc. Natl. Acad. Sci. USA 2008, 105, 11597–11604.
2. Chessa, B.; Pereira, F.; Arnaud, F.; Amorim, A.; Goyache, F.; Mainland, I.; Kao, R.R.; Pemberton, J.M.;
Beraldi, D.; Stear, M.J. Revealing the history of sheep domestication using retrovirus integrations.
Science 2009, 324, 532–536.
3. Kijas, J.W.; Lenstra, J.A.; Hayes, B.; Boitard, S.; Neto, L.P.; Cristobal, M.S.; Servin, B.;
McCulloch, R.; Whan, V.; Gietzen, K.; et al. Genome-wide analysis of the world’s sheep
breeds reveals high levels of historic mixture and strong recent selection. PLoS Biol. 2012, 10,
doi:10.1371/journal.pbio.1001258.
4. Zhao, F.; Wei, C.; Zhang, L.; Liu, J.; Wang, G.; Zeng, T.; Du, L. A genome scan of recent positive
selection signatures in three sheep populations. J. Integr. Agric. 2015, 15, doi:10.1016/S2095-
3119(15)61080-2.
5. Stainton, J.J.; Haley, C.S.; Charlesworth, B.; Kranis, A.; Watson, K.; Wiener, P. Detecting signatures
of selection in nine distinct lines of broiler chickens. Anim. Genet. 2014, 46, 37–49.
6. Ma, Y.; Zhang, H.; Zhang, Q.; Ding, X. Identification of Selection Footprints on the X Chromosome
in Pig. PLoS ONE 2014, 9, e94911.
7. Wilkinson, S.; Lu, Z.H.; Megens, H.J.; Archibald, A.L.; Haley, C.; Jackson, I.J.; Groenen, M.A.;
Crooijmans, R.P.; Ogden, R.; Wiener, P. Signatures of diversifying selection in European pig breeds.
PLoS Genet. 2013, 9, e1003453.
8. Suzuki, Y. Statistical methods for detecting natural selection from genomic data. Genes Genet. Syst.
2010, 85, 359–376.
9. Voight, B.F.; Kudaravalli, S.; Wen, X.; Pritchard, J.K. A map of recent positive selection in the
human genome. PLoS Biol. 2006, 4, e72.
10. Weir, B.S.; Cockerham, C.C. Estimating F-statistics for the analysis of population structure.
Evolution 1984, 38, 1358–1370.

Int. J. Mol. Sci. 2015, 16 20373
11. Riebler, A.; Held, L.; Stephan, W. Bayesian variable selection for detecting adaptive genomic
differences among populations. Genetics 2008, 178, 1817–1829.
12. Mcrae, K.M.; Mcewan, J.C.; Dodds, K.G.; Gemmell, N.J. Signatures of selection in sheep bred for
resistance or susceptibility to gastrointestinal nematodes. BMC Geno 2014, 15, 637–637.
13. Rubina, C.J.; Megensb, H.-J.; Barrioa, A.M.; Maqboolc, K.; Sayyabc, S.; Schwochowc, D.;
Wang, C.; Örjan, C.; Jerna, P.; Jørgensen, C.B.; et al. Strong signatures of selection in the domestic
pig genome. Proc. Natl. Acad. Sci. USA 2012, 109, doi:10.1073/pnas.1217149109.
14. Heyer, E.; Segurel, L. Looking for signatures of sex-specific demography and local adaptation on
the X chromosome. Genome Biol. 2010, 11, doi:10.1186/gb-2010-11-1-203.
15. McVicker, G.; Gordon, D.; Davis, C.; Green, P. Widespread genomic signatures of natural selection
in hominid evolution. PLoS Genet. 2009, 5, e1000471.
16. Moradi, M.H.; Nejati-Javaremi, A.; Moradi-Shahrbabak, M.; Dodds, K.G.; Mcewan, J.C. Genomic
scan of selective sweeps in thin and fat tail sheep breeds for identifying of candidate regions
associated with fat deposition. BMC Genet. 2012, 13, doi:10.1186/1471-2156-13-10.
17. Disteche, C.M. Dosage compensation of the active X chromosome in mammals. Nat. Genet. 2006,
38, 47–53.
18. Graves, J.A.M. Sex chromosome specialization and degeneration in mammals. Cell 2006, 124,
901–914.
19. Zhang, W.; Shen, M.; Li, H.; Gao, L.; Liang, Y.; Yang, J.; Liu, S.; Wang, X.; Gan, S. Detection and
analysis of polymorphisms of 59571364 and 59912586 loci on X chromosome in fat-tail and
thin-tail sheep flocks (In Chinses). Yi Chuan = Hereditas/Zhongguo Yi Chuan Xue Hui Bian Ji 2013,
35, 1384–1390.
20. Sabeti, P.C.; Patrick, V.; Ben, F.; Jason, L.; Elizabeth, H.; Chris, C.; Xiaohui, X.; Byrne, E.H.;
Mccarroll, S.A.; Rachelle, G. Genome-wide detection and characterization of positive selection in
human populations. Nature 2007, 449, 913–918.
21. Wang, W.; Liu, S.; Li, F.; Pan, X.; Li, C.; Zhang, X.; Ma, Y.; La, Y.; Xi, R.; Li, T. Polymorphisms
of the Ovine BMPR-IB, BMP-15 and FSHR and Their Associations with Litter Size in Two Chinese
Indigenous Sheep Breeds. Int. J. Mol. Sci. 2015, 16, 11385–11397.
22. Doerks, T.; Copley, R.R.; Schultz, J.; Ponting, C.P.; Bork, P. Systematic identification of novel
protein domain families associated with nuclear functions. Genome Res. 2002, 12, 47–56.
23. Kelley, J.L.; Madeoy, J.; Calhoun, J.C.; Swanson, W.; Akey, J.M. Genomic signatures of positive
selection in humans and the limits of outlier approaches. Genome Res. 2006, 16, 980–989.
24. Wang, E.T.; Kodama, G.; Baldi, P.; Moyzis, R.K. Global landscape of recent inferred Darwinian
selection for Homo sapiens. Proc. Natl. Acad. Sci. USA 2006, 103, 135–140.
25. Zhang, C.; Bailey, D.K.; Awad, T.; Liu, G.; Xing, G.; Cao, M.; Valmeekam, V.; Retief, J.;
Matsuzaki, H.; Taub, M.; et.al. A whole genome long-range haplotype (WGLRH) test for detecting
imprints of positive selection in human populations. Bioinformatics 2006, 22, 2122–2128.
26. Tang, K.; Thornton, K.R.; Stoneking, M. A new approach for using genome scans to detect recent
positive selection in the human genome. PLoS Biol. 2007, 5, e171.
27. Zhao, F.; McParland, S.; Kearney, F.; Du, L.; Berry, D.P. Detection of selection signatures in dairy
and beef cattle using high-density genomic information. Genet. Sel. Evol. 2015, 47, 1–12.
28. Wright, S. The genetical structure of populations. Ann. Eugen. 1949, 15, 323–354.

Int. J. Mol. Sci. 2015, 16 20374
29. McGill, R.; Tukey, J.W.; Larsen, W.A. Variations of box plots. Am. Stat. 1978, 32, 12–16.
30. China National Commission of Animal Genetic Resources: 2012. Animal genetic resource in
China-Sheep and Goats; China Agriculture Press: Beijing, China, 2012.
31. Helmy, K.Y.; Katschke, K.J., Jr.; Gorgani, N.N.; Kljavin, N.M.; Elliott, J.M.; Diehl, L.;
Scales, S.J.; Ghilardi, N.; van Lookeren Campagne, M. CRIg: A macrophage complement receptor
required for phagocytosis of circulating pathogens. Cell 2006, 124, 915–927.
32. Liu, Q.; Chen, Y.; Kubota, F.; Pan, J.J.; Murakami, T. Expression of protocadherin-19 in the nervous
system of the embryonic zebrafish. Int. J. Dev. Biol. 2010, 54, doi:10.1387/ijdb.092882ql.
33. Satterthwaite, A. B.; Li, Z.; Witte, O.N. Btk function in B cell development and response
Semi Immunol.1998, 10, 309–316
34. Gauld, S.B.; Porto, J.M.D.; Cambier, J.C.B. Cell Antigen Receptor Signaling: Roles in Cell
Development and Disease. Science 2002, 296, 1641–1642.
35. Demars, J.; Fabre, S.; Sarry, J.; Rossetti, R.; Gilbert, H.; Persani, L.; Tosser-Klopp, G.; Mulsant, P.;
Nowak, Z.; Drobik, W. Genome-Wide Association Studies Identify Two Novel BMP15 Mutations
Responsible for an Atypical Hyperprolificacy Phenotype in Sheep. PLoS Genet. 2013, 9, 269–271.
36. Worley, K.; Carey, J.; Veitch, A.; Coltman, D.W. Detecting the signature of selection on immune
genes in highly structured populations of wild sheep (Ovis dalli). Mol. Ecol. 2006, 15, 623–637.
37. Kijas, J.W. Haplotype-based analysis of selective sweeps in sheep. Genome 2014, 57, 433–437.
38. Amaral, A.J.; Ferretti, L.; Megens, H.-J.; Crooijmans, R.P.; Nie, H.; Ramos-Onsins, S.E.;
Perez-Enciso, M.; Schook, L.B.; Groenen, M.A. Genome-wide footprints of pig domestication and
selection revealed through massive parallel sequencing of pooled DNA. PLoS ONE 2011, 6, e14782.
39. Browning, B.L.; Browning, S.R. A unified approach to genotype imputation and haplotype-phase
inference for large data sets of trios and unrelated individuals. Am. J. Hum. Genet. 2009, 84, 210–223.
40. Gautier, M.; Vitalis, R. Rehh: An R package to detect footprints of selection in genome-wide SNP
data from haplotype structure. Bioinformatics 2012, 28, 1176–1177.
41. MacEachern, S.; Hayes, B.; McEwan, J.; Goddard, M. An examination of positive selection and
changing effective population size in Angus and Holstein cattle populations (Bos taurus) using a
high density SNP genotyping platform and the contribution of ancient polymorphism to genomic
diversity in Domestic cattle. BMC Genom. 2009, 10, doi:10.1186/1471-2164-10-181.
42. Huang, D.W.; Sherman, B.T.; Lempicki, R.A. Systematic and integrative analysis of large gene lists
using DAVID bioinformatics resources. Nat. Protoc. 2009, 4, 44–57.
43. Jiang, Y.; Xie, M.; Chen, W.; Talbot, R.; Maddox, J.F.; Faraut, T.; Wu, C.; Muzny, D.M.; Li, Y.;
Zhang, W. The sheep genome illuminates biology of the rumen and lipid metabolism. Science 2014,
344, 1168–1173.
© 2015 by the authors; licensee MDPI, Basel, Switzerland. This article is an open access article
distributed under the terms and conditions of the Creative Commons Attribution license
(http://creativecommons.org/licenses/by/4.0/).