detection of structuralchanges in data streams -...
TRANSCRIPT

Detection of Structural Changes in Data Streams
Ross Callister Mihai Lazarescu Duc-Son Pham
1 Department of ComputingCurtin University,
Kent St, Bentley WA 6102,Email: [email protected]
Abstract
We propose new methods for detecting structuralchanges in data streams. Significant changes withindata streams, due to their often highly dynamic na-ture, are the main cause in performance degradationof many algorithms. The primary difference to previ-ous works related to change detection in data streamsis our usage of an algorithmic process to define thechanges. We focus on RepStream, a powerful graphbased clustering algorithm, which has been shown toperform well in a stream clustering context. Rep-Stream, like many other algorithms, operates accord-ing to parameters which are set by the user. Pri-marily, RepStream uses the K value to determinethe degree of connectivity in its K Nearest Neigh-bour graph structure. RepStream requires that its Kvalue be set suitably in order to achieve optimal clus-tering performance, which we measure in terms of F-Measure. Since real-world data streams are dynamic,with classes appearing and disappearing, and movingand shifting, this requires the K value to be variedaccording to the current state of the stream. How-ever, such a problem in a data stream mining contextis largely unexplored. We first consider this challengeby addressing the research question: when K needs tobe changed. From a change detection perspective, ourproposed method measures the structural variation ofthe underlying data stream using five different statis-tical and geometrical features which can be extractedwhilst RepStream performs its clustering. We showthat combining these features into a detection methodgives promising results in regards to early detection ofstructural changes in data streams. We use the wellknown KDD Cup 1999 intrusion detection benchmarkdataset, and show that our proposed method was ableto identify many of the changes within the stream.
Keywords: Concept Drift, Change Detection, StreamDetection, Anomaly Detection,
1 Introduction
In this paper we propose a new method of detect-ing changes in a data stream by analysing featuresextracted from the memory contents of the graph-based stream clustering algorithm, RepStream. Datastreams can vary greatly over time. This can reflectanything from a shift in customer buying habits, to
Copyright c©2015, Australian Computer Society, Inc. Thispaper appeared at the Thirteenth Australasian Data MiningConference, Sydney, Australia. Conferences in Research andPractice in Information Technology, Vol. 168. Md Zahidul Is-lam, Ling Chen, Kok-Leong Ong, Yanchang Zhao, Richi Nayak,Paul Kennedy, Ed. Reproduction for academic, not-for profitpurposes permitted provided this text is included.
anomalies in a sensor network, to attacks on a net-work which is being monitored (Kifer et al. 2004, Silvaet al. 2013).
Given the nonstationary and complex nature ofdata streams, clustering them effectively has been thesubject of much research recently. A major prob-lem that this paper concentrates on is detecting whenchange occurs in the stream. Knowing when changeoccurs can be incredibly valuable information as itcan be used to inform a stream clustering algorithm,for example, when to adjust its operating parametersto maintain optimal clustering, or when to drop pre-vious data from memory in order to adjust to newpatterns faster.
Our approach uses RepStream(Luhr & Lazarescu2009) as a basis for our analysis as it is a graph-based clustering algorithm. RepStream constructs adirected K- nearest neighbour graph, which it usedfor clustering. The K-nearest neighbour graph struc-ture has been used in other works previously as amethod of clustering. It produces a graph in whichvertexes which are close together (according to thechosen distance measure) are more likely to be con-nected than those which are further apart. This K-nearest neighbour system reflects the shape, and na-ture of the data, as represented in a multi-dimensionalspace. As such we can take advantage of this intrinsicarrangement of the data, and analyse features relatedto it to gain information about the dataset.
The most important operating parameter of Rep-Stream is the number of outgoing edges each vertexhas, which is often denoted as K. This K value deter-mines total connectivity: a higher K produces moretotal edges in the graph and vice versa. Since Rep-Stream uses connectivity as a fundamental part of itsclustering process this results in the situation wherea higher K value results in fewer, more connectedclusters, while a lower K value results in more, lessconnected clusters.
In practice, it is often not trivial to determine anoptimal value for K. This matter is further compli-cated by the dynamic nature of data streams. Clus-ters in a data stream may appear, disappear, merge,or split over time, their shapes may change, they maybecome more or less dense, or shift (in the sense ofdata points being represented by points in some n-dimensional space), as well as other sorts of changes.Due to the unpredictable and sometimes dramaticchanges in data streams a single static K value is notalways guaranteed to produce optimal clustering re-sults. Ideally, the K value should be varied to matchchanges in the stream, as well as other possible adap-tations - like increasing or decreasing the number ofdata points which are being stored in memory to, re-spectively, allow the algorithm to form a better modelin the case of a stable period in the stream, or allow
Proceedings of the 13-th Australasian Data Mining Conference (AusDM 2015), Sydney, Australia
79
the algorithm to adapt more quickly to changes in thecase of a rapidly changing stream. This has applica-tions in the real world as it would allow an algorithmto dynamically adjust to a data stream that shiftsover time.
In a practical sense our research will allow us tolocate points in a data stream that correspond tochanges in the underlying distribution which directlymap to the performance of RepStream. This is im-portant to our goal of determining when parametersmust be varied to maintain optimal clustering per-formance. Having parameters set sub-optimally candramatically affect even the most recent state-of-the-art algorithms. Our goal is to make this a non-issue,initially by determining when to change the parame-ters, and then in future work, to address the problemof selecting the correct values of the parameters atthese change points. While this work concentrates onRepStream, the concept of extracting and examiningfeatures for use in change detection can be applied toother algorithms as well.
In this work, we first address the research questionof when K needs to be varied in order for RepStreamto be more optimally tuned to the structural changesin the underlying data stream. Unlike most previousworks on change detection which are totally limited tothe statistical nature of the data stream, our criticalargument here is that the parameters of the cluster-ing algorithm should only be varied if that brings inconsiderable clustering benefits. Thus, the notion ofchanges in this work not only means the shifts in thestatistical properties of the stream, but also dependson the specific algorithm being considered. Our con-tributions in this work include
• A novel perspective on structural changes thatare algorithm specific, opening up future researchdirections for many stream clustering algorithms;
• A novel detection scheme consisting of five graph-based features and a window-based decision al-gorithm;
• A comprehensive analysis on the KDD Cup 1999intrusion detection dataset.
The paper is organized as follows. Section 2 re-views related stream clustering algorithms and otherchange detection methods in the literature. Section3 details our proposed method. Section 4 explainsthe measures used to evaluate our method. Sec-tion 5 gives a comprehensive analysis of the proposedmethod on the KDD Cup 1999 dataset (Stolfo et al.2000). Finally, Section 6 concludes.
2 Related Works
There are many approaches to clustering datastreams. To face the specific challenges of handlingevolving data streams various approaches have beenproposed. For example, by using micro clusters torecord statistics about recent points, which can beclustered according to specified time-windows (Ag-garwal et al. 2003, Kranen et al. 2011). Or by usingsubcluster structures which fade over time to makenew data more relevant (Aggarwal et al. 2004, Zhouet al. 2008). Yet other approaches use grid based den-sity structures, which decay to keep up with the newdata arriving in the stream (Chen & Tu 2007).
Unfortunately, despite some novel and effec-tive methods for handling streaming contexts, moststream clustering algorithms do not have mechanismsor methods for detecting change. Instead they often
use sliding windows, where older data is discardedonce it has become too old (Silva et al. 2013).
However, change in distributions of data streamsover time has been a topic of research for some time.One approach maintains a reference window, and asliding window, and compares the two using a distri-bution similarity function (Kifer et al. 2004). Slidingwindows do ensure that newer data is used to makeclustering decisions over older data, as older data maycontain patterns that are no longer representative ofthe stream’s distribution if it changes. However, slid-ing windows can not solve all the challenges that adata stream can present.
Another approach to change detection in a datastream uses a minimum description length to gener-ate code tables which ‘compress’ the distribution of astream. When the stream is no longer optimally com-pressed by the code table then this marks a changein the stream (Van Leeuwen & Siebes 2008).
Yet another approach proposes a method for de-tecting the appearance of new classes in a data streamclustering context by deferring classification of out-liers and placing them in a buffer, then analysing thepoints in the buffer for cohesion representing a novelclass (Masud et al. 2011). Along a similar vein (Bhat-nagar et al. 2014) proposes the algorithm ExCC, agrid based method. New points added to ExCC whichdo not fit into already populated cells in the grid areadded to a hold queue, and when a sufficient amountpoints are outside expected regions then a ‘change’in the cluster distribution is recorded, and the gridis updated. This is an example where there is a sortof change detection in the operation of the algorithm.Unfortunately it can only detect changes related tothe movement of cluster boundaries.
Other topics related to change detection in datastreams include recording and tracking change overtime for the identification of temporal change (Hah-sler & Dunham 2011), or tracking change in a noisystream through cluster density analysis(Nasraoui &Rojas 2006). The field of anomaly detection in datastreams is also related, for example a paper by (Phamet al. 2014) which uses residual subspace analysis todetect anomalies in a compressed form of the datastream. Such anomaly detection is a form of changedetection in a context where training data can bemade available to determine a ‘normal’ stream state.Our approach, however, can not make assumptionsabout the normal state of a stream as it is likely tobe unknown.
Other algorithms mention evolution in streams asa major issue (Bhatnagar et al. 2014, Forestiero et al.2013), but as far as we are aware there are no existingalgorithms that attempt to specifically locate when adata stream changes in a way that significantly affectsthe performance of a given clustering algorithm. Ourapproach differs from existing methods in that it seeksto detect arbitrary change in a data stream by us-ing geometric features present within the K-Nearestneighbour graph structure of RepStream. That is,our approach seeks to detect locations in the streamwhich are likely to negatively impact the performanceof clustering, and which are candidate locations forparameter adjustment.
Our approach differs from existing methods in thatit seeks to detect arbitrary change by using geomet-ric features present within the K-Nearest neighbourgraph structure of RepStream.
CRPIT Volume 168 - Data Mining and Analytics 2015
80
3 Proposed Method
We propose that by extracting features from the dataas it is processed by our chosen algorithm - Rep-Stream - we can learn about when there are shiftsin the underlying dataset. That is, by looking forchanges in these fundamental features, we know whento expect the dataset to have shifted. By know-ing when the distribution and nature of the datasetchanges we can use this information to improve ourclustering results.
RepStream was selected because it has beendemonstrated to outperform other stream clusteringapproaches. Additionally, it uses both K-nearestneighbour arrangements of the data, and also the rela-tive density of points when making its decisions. Thishybrid method allows a wider range of the stream’sproperties to be captured.
3.1 The RepStream Clustering Algorithm
RepStream uses a combination of graph based anddensity based approaches to clustering (Luhr &Lazarescu 2009). It constructs a directed K-nearestneighbour graph, adding each data point it receivesfrom the data stream one at a time. Due to memorylimitations - one can not expect an algorithm to main-tain every data point from a continuous data streamin memory simultaneously - thus it uses a first-in-first-out window, maintaining only the most recent pointsin its K nearest neighbour graph.
The K-nearest neighbour graph is a directedgraph, in which each vertex has K outgoing edges tothe K nearest other vertices in the graph. Two ver-tices in the graph are considered to be reciprocallyconnected if each vertex has an outgoing edge thatconnects to the other vertex.
When a new data point is inserted as a vertex intoRepStream’s K-nearest neighbour graph and it doesnot have a reciprocal connection to an already exist-ing representative point, then that vertex becomes anew Representative point. Representative points, astheir name suggests, act like representatives for othernearby vertexes. The closest Representative pointthat a vertex has a reciprocal connection to is theRepresentative point which represents that vertex. Avertex will be a member of the cluster that its Rep-resentative point is a member of.
Clustering in RepStream is done using representa-tive points. RepStream maintains a second K nearestneighbour graph, which only its representative pointsare a member of. Two Representative points belongto the same cluster if they have a reciprocal connec-tion in the representativeK nearest neighbour graph,and are also density related to each other.
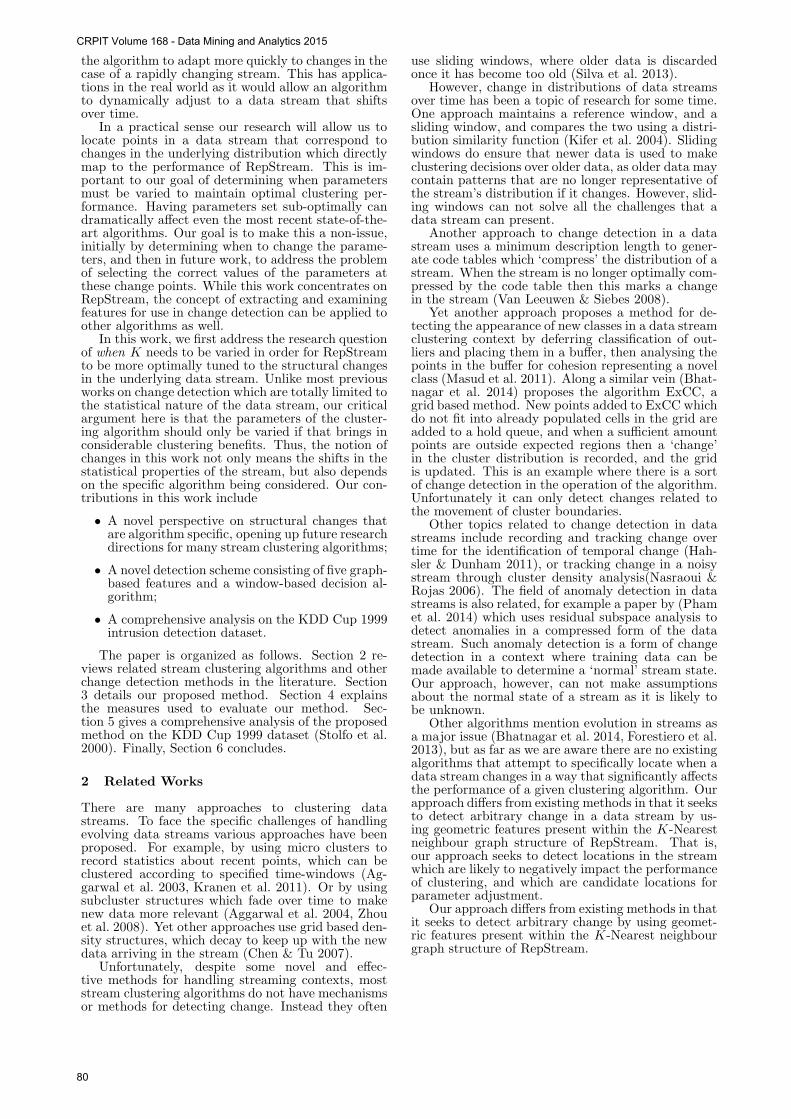
Density in RepStream is not absolute, it is ratherthe relative density that is used to determine clus-tering. The density relation radius of a representa-tive point is equal to α×AvgDist where AvgDist isthe average distance to its K nearest neighbours, asshown in Figure 1. The parameter α is set by theuser, and has the value of 1.5 in our experiments inthis paper, as suggested by RepStream’s original pa-per.
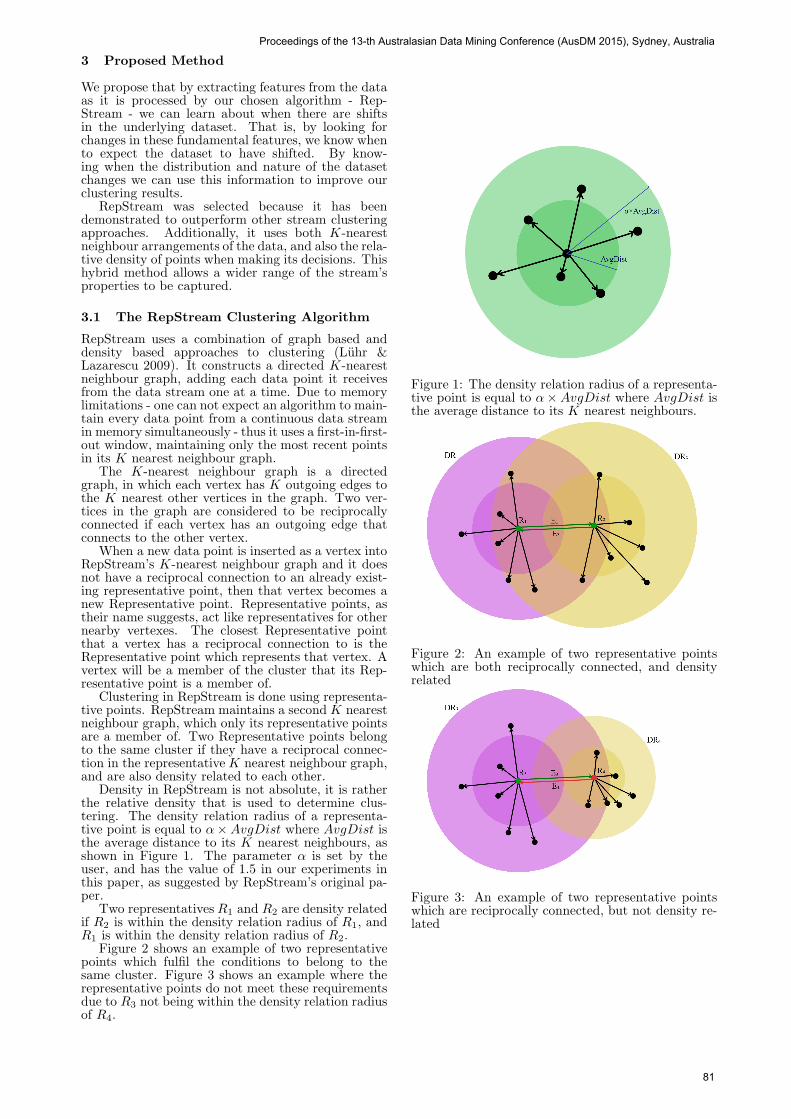
Two representatives R1 and R2 are density relatedif R2 is within the density relation radius of R1, andR1 is within the density relation radius of R2.
Figure 2 shows an example of two representativepoints which fulfil the conditions to belong to thesame cluster. Figure 3 shows an example where therepresentative points do not meet these requirementsdue to R3 not being within the density relation radiusof R4.
Figure 1: The density relation radius of a representa-tive point is equal to α×AvgDist where AvgDist isthe average distance to its K nearest neighbours.
Figure 2: An example of two representative pointswhich are both reciprocally connected, and densityrelated
Figure 3: An example of two representative pointswhich are reciprocally connected, but not density re-lated
Proceedings of the 13-th Australasian Data Mining Conference (AusDM 2015), Sydney, Australia
81

3.2 Structural Changes
First, we define a stream clustering algorithm as beingstable if its clustering performance (which is measuredin terms of F-Measure in this work) varies little asa number of samples arriving from a stationary datastream is sufficiently large. Then, we define structuralchanges associated with a stable clustering algorithmas statistical or geometrical changes in the data thatlead to a significant deviation in clustering outputs.In the case of RepStream, our hypothesis is that it isreflected in the structure of the data points, specifi-cally in regards to their geometric properties withinthe k-NN graph of RepStream. We note the following:
• From the definition, it follows that structuralchanges may correlate strongly with distribu-tional or statistical changes in the data stream.A data stream represents samples taken from adistribution of data over time. This distributionmay change as the stream progresses, in a waysuch that the structure of the data also changes,for example concept drift (Tsymbal 2004). Itcan refer to new parts in the data distributionappearing, or disappearing, or the changing ofexisting parts of the distribution.
• Structural changes depend on the specific algo-rithm and its sensitivity against the changes inthe data stream. This is an important aspect be-cause change detection would not be useful if itdoes not lead to a need to adjust the underlyingclustering algorithm.
3.3 Features Extraction
We have examined various intrinsic features withinRepStream’s graph based clustering approach to de-termine whether they can be used to identify changesin the underlying data stream. The features we haveconcentrated on are: the cluster count over time, thenumber of edges created and removed over time, thenumber of cluster merges and splits over time, andthe variation in the length of the edges over time. Wenote important that in order to extract these features,we need an active instance of RepStream with somevalue of K, which may not be optimal. This valueof K is a proxy for the detection only. This proxyK value is desirably small as it leads to more efficientRepStream computation. Each of the features are ex-tracted periodically, in our case after every 100 pointsprocessed by RepStream.
The following features are each extracted fromRepStream as we believe there to be a correlationbetween them and the structural properties of thedataset.
Cluster Count Extracting the cluster count iscomputationally efficient. Since RepStream producesa clustering result for every data point inserted intothe algorithm, this feature is simply the number ofclusters that RepStream locates at each time step.However, it is important to note that this feature isdependant on theK value used. A higherK value willtypically result in a lower number of clusters found bythe algorithm, due to the higher connectivity of thek-NN graph. We found that lower values of K – ap-proximately K = 10 – are more sensitive to changesin the data stream. This is possibly because higherK values are likely to have many strong connections,and be more stable than the lower K values. ClusterCount, as well as being relevant to the clustering re-sult, also correlates to the stability of the stream, as
the number of clusters changes less when the streamis relatively stable.
Edge Change Count The number of edges cre-ated and removed at the representative layer overtime - the K-nearest neighbour change count - waschosen as a feature due to its ability to reflect thedegree of change that the graph requires when datapoints are inserted. The idea is that when the datastream is stable then the representative points willalso remain stable. Thus, the amount of changes atthe representative level will be stable. On the otherhand, when the data stream is shifting then it is ex-pected that the number of edges that need to be up-dated at the representative level will vary, due to rep-resentatives needing to be created or destroyed. Forexample a graph vertex that is inserted outside exist-ing clusters will be more likely to become a represen-tative point, and need to cause updates in other rep-resentative points. On the contrary, a vertex insertedamong a group of existing vertices can often be rep-resented by an existing representative point, thus itdoes not cause any representative edge changes. Thisfeature is extracted by counting the number of edgeupdates which are on representative points since thelast measurement. In our experiments, it is every 500points, or half the sliding window size.
Cluster Merges and Splits Counting the clustermerges and splits over time is used as a feature be-cause it is likely to correlate with the stability of thedata. RepStream creates clusters by considering theconnectivity of representative points, as well as the lo-cal density of each representative point. Due to nodesbeing inserted, the density or connectivity of repre-sentative points may change and this results in theclusters splitting apart or merging together. Whenthe dataset is stable, inserting new points is less likelyto result in such changes. However, it may becomemore likely when the dataset shifts then points oc-curring in new locations, and being removed due tothe first-in-first-out window. Based on this observa-tion, we have selected the combined number of clus-ter merges and splits as a feature to examine whensearching for change in the dataset. Similar to the k-NN change count, this feature can also be efficientlyextracted by counting the number of times clustersmerge and split since the last measurement.
Cluster Merges and Splits occur more rapidlywhen the structure of the stream changes due to datapoint distributions shifting outside established clus-ter boundaries. This causes the clusters to becomeunstable and causes splits and merges to occur untilthe algorithm can arrange the datapoints into a stableconfiguration
Edge Length Variation Edge length variation ismeasured as follows. Each vertex in RepStream’sgraph maintains outgoing connections to its K near-est neighbours. The standard deviation of the lengthof these outgoing edges is calculated for each vertex.The standard deviations are then added together anddivided by the total number of points in the K-NNgraph to find the average standard deviation over ev-ery point in memory. The idea behind this featureis that one would expect a relatively consistent edgelength variation when the dataset is stable. If newclusters were to form outside existing clusters the edgelength might increase since longer edges would needto be formed to maintain the K-NN graph. If thedensity of an existing cluster were to increase then
CRPIT Volume 168 - Data Mining and Analytics 2015
82

the total edge lengths might decrease, which wouldsimilarly lead to an increase in the standard devia-tion in the edge lengths. This feature, therefore, isselected as a candidate for tracking changes in thedataset.
History Count History count represents the num-ber of times a point returns to a previous cluster. Asthe stream progresses individual data points changecluster membership. Even adding a single point canresult in many points changing from one cluster toanother. We keep track of the number of times eachpoint in the first-in-first-out queue has returned to acluster that it was previously in. Our hypothesis isthat when structural changes are taking place withinthe dataset the clustering results will be unstable.This instability leads to a higher rate of individualpoints jumping between clusters over time. Whenthe dataset is stable, on the other hand, the rate ofchange in cluster membership will be lower, due tonew points not changing the dataset’s structure sig-nificantly.
3.4 Detection Scheme
We propose a simple scheme using the extracted fea-tures to determine whether a change has occurred ornot. Each individual feature is examined separatelyusing a time-series change detection algorithm. Thealgorithm is shown as Algorithm 1. The inputs arelisted and given as (feature,M,H, λ). feature rep-resents the given feature as a time series. The pa-rameter M is a multiplier which affects how sensitivethe algorithm is to change; a higher value will causethe algorithm to require a larger shift in the time se-ries before a change is detected. The parameter His the number of previous points over which to tracka moving average. The parameter λ is a parameterthat determines how quickly the algorithm updatesto match newer observations. The algorithm returnschanges which contains a list of time indexes wherechanges have occurred in the time series feature.
Data: (feature,M,H, λ)Result: Changes: a list of indexes where
changes have been detectedchanges = ∅;X = mean(feature(i−M : M));σ = standardDeviation(feature(i−M : M));for i = M : size(feature) do
ma = mean(feature(i−M : M));s = standardDeviation(feature(i−M :M));if abs(ma−X) > M × σ then
changes = changes+ {i};X = ma;σ = s;
elseX = (1− λ) ×X + λ×ma;σ = (1− λ) ×X + λ× s;
endend
Algorithm 1: Algorithm for feature change detec-tion
While this algorithm is written for a batch datasetrather than a stream, it can easily be modified foruse in a stream since it only requires the past m datapoints to be stored in memory, as a sliding window.
0 0.5 1 1.5 2 2.5 3 3.5 4 4.5 5
x 105
0
100
200
300
400
500
600
700
800
900
1000
Num
ber
of E
dges
Bei
ng U
pdat
ed
Figure 4: Number of edge changes (Change Count)over time for the KDD dataset at K = 10
0 0.5 1 1.5 2 2.5 3 3.5 4 4.5 5
x 105
0
50
100
150
200
250
300
350
400
Clu
ster
Cou
nt
Figure 5: Number of clusters present over time forthe KDD dataset at K = 10
0 0.5 1 1.5 2 2.5 3 3.5 4 4.5 5
x 105
0
10
20
30
40
50
60
70
Mer
ges+
Spl
its
Figure 6: Number of cluster merges and splits overtime for the KDD dataset at K = 10
0 0.5 1 1.5 2 2.5 3 3.5 4 4.5 5
x 105
0
0.005
0.01
0.015
0.02
0.025
0.03
0.035
0.04
Var
ianc
e in
Edg
e Le
ngth
Figure 7: Variation in the edge lengths over time forthe KDD dataset at K = 10
0 0.5 1 1.5 2 2.5 3 3.5 4 4.5 5
x 105
0
5000
10000
15000
His
tory
Cou
nt
Figure 8: ‘History Count’ for the KDD Dataset atK = 10
Proceedings of the 13-th Australasian Data Mining Conference (AusDM 2015), Sydney, Australia
83

Time
K v
alue
KDD F−Measure Heatmap
0 0.5 1 1.5 2 2.5 3 3.5 4 4.5
x 105
5
10
15
20
25
30
Optimal K Value
Figure 9: The optimal K value over time produced by RepStream with respect to F-Measure over time for theKDD dataset. Best viewed in colour.
Since there are 5 features that we are testing weuse a system where multiple features must agree be-fore a structural change is detected. At least Nfeatures must agree that there has been a changewithin the last T samples for the algorithm to detecta ‘change’. Where N is greater than half the numberof features then it is simply majority voting.
Figure 10 shows where the changes are detectedin the case of the Edge Change Count feature, whereM = 1 H = 20 and λ = 0. Edge Change Count wasselected for illustrative purposes as it gives a clearidea of what varying the parameters does. The redshows the raw value of the feature, which varies signif-icantly from point to point, blue shows the X valueover time, as well as X ± σ, and green shows ex-actly where the change points are detected. Figure11 shows the same feature, but the M value has beenchanged to 30, while Figure 12 has the λ = 0.001, sothat the X and σ values slowly adjust over time.
4 Algorithm Evaluation
In this paper we use an evaluation measure known asMTR - Mean Time Ratio (Bifet et al. 2013).
MTR is a combination of several important met-rics, and is meant to evaluate a change detection al-gorithm in a single number. It is a combination ofseveral important metrics. The formula for MTR is:
MTR = MTFA
MTD× (1−MDR).
Where MTFA is the mean time between falsealarms, MTD is the mean time to detection, andMDR is the missed detection rate. A higher MTRis desirable, and this measure can be used to directlycompare two change detection results.
MTR is chosen as our evaluation metric becauseof its specific design for use with change detection al-gorithms. Looking simply at the number of successfuldetections or the number of false alarms does not givea clear picture of how well an algorithm performs, be-cause it is trivial to maximise either of those scores
individually. Typically compromising between a highrate of detection, and a low rate of false alarms is de-sirable in practice. Mean Time Ratio takes both thefalse alarms and detection rate into account, and isideal for evaluating the differences between detectionresults.
Also included in our evaluations are the individualvalues for Mean Time Between False Alarms (MTFA),Mean Time to Detection (MTD), and Missed Detec-tion Rate (MDR). These measures indicate, respec-tively, the rate of false alarms, the time taken to de-tect changes, and the detection rate.
5 Experiments
5.1 KDD Cup 1999 Dataset
We select the well known KDD Cup 1999 intrusiondetection dataset (Stolfo et al. 2000) to demonstratethe proposed method. It is made up of data extractedfrom a computer network being monitored during var-ious simulated and controlled network attacks. Weuse the availably subsampled version of the datasetwhich contains approximately 500,000 data points, aswell as ground truth class labels for evaluation pur-poses.
The KDD data contains data which represents nor-mal traffic as well as data points representing 22 dif-ferent types of attacks with varying durations fromfew to hundreds of thousands of points.
KDD has been used previously as an example of areal-world data stream used in evaluating stream clus-tering algorithms(Luhr & Lazarescu 2009)(Cao et al.2006)(Ruiz et al. 2009). The varied attacks over timesimulate the dynamic and unpredictable nature of adata stream, making it ideal to test our change de-tection methods on. Unfortunately, however, thereremain very few real world benchmark datasets avail-able for evaluation purposes. A recent survey by(Kaur et al. 2015) indicates that a major issue instream clustering literature is the lack of availabil-ity of benchmark datasets. As such, KDD remainsperhaps the only publicly available real-world stream
CRPIT Volume 168 - Data Mining and Analytics 2015
84

Figure 13: Presence of classes during the KDD data stream. Type 1 attacks are prolonged single classes, type2 are quick single attacks interspersed by normal, and type 3 are rapid clusters of attacks.
dataset which has the necessary traits to evaluate ourmethods.
Classes in KDD Figure 13 shows the class pres-ence for the KDD dataset (we note that all figures arebest viewed in colour). For each class in the dataseta line was plotted. The value of the line is the classlabel if that class is present during that time duringthe stream, and zero otherwise. Class 1 is the ‘nor-mal’ traffic, and every other class represents differentattacks. The spikes in Figure 13 correspond to whenattacks occur, and the plateaus represent prolongeddenial-of-service (DOS) attacks. The most importantpart of this is when attacks occur, i.e. - the spikes andbeginnings and ends of the DOS attacks in the classpresence plot - as this tells us when the data streamchanges due to an attack occurring.
Figure 13 also shows examples of the various typesof attacks. The attacks labelled with type 1 are pro-longed attacks made up of only a single class. Thoughthe actual data contained within each successive datapoint may vary all the instances belong to the sameclass. There are the relatively rare instances of type2, which contain very short attacks from a single classinterspersed with data from the normal class. Thenthere are type 3 attacks, which are occurrences wheremany types of attacks occur in rapid succession, in-terspersed with the normal.
Optimal RepStream K Value Figure 9 showsthe K value which produces the highest F-Measurescore over time, in blue, superimposed over the F-Measure of eachK value. In the background is a grey-scale collection of cells, which we call a ‘heatmap’. Ateach time step (along the X axis) the K value is rep-resented along the Y axis, and the brightness of thatindividual cell represents the F-Measure score at thattime with that K value. That is, the brightness isbetween 0 (black) and 1 (white), and matches the F-Measure of that K value at that time step. The rangeofK values is betweenK = 5 andK = 30. This figureshows that the K value which produces the optimalclustering results (the brightest cell at a given timestep) may vary considerably over the course of thestream. Therefore, the best performance can not beachieved by using a single K value.
Furthermore, Figure 9 also shows that at some
times the range ofK values which produce F-Measureresults near the optimal is very large - when the brightregions are large vertically, and at other times the Kvalue is optimal within a very specific range - whenthe bright regions are more constrained. This fig-ure, when combined with the information in Figure13, shows that when attacks occur in the data set,and when the classes shift, the optimal K value doeschange in response to the stream, and that to get op-timal performance the stream must be monitored forsuch changes, and adapted to when they occur.
Ground Truth Change Points The class pres-ence is what we use as the ground truth for evalua-tion of our technique. Whenever a class appears ordisappears we define a ground truth change point.These change points are weighted according to howmuch they affect the clustering performance of Rep-Stream. Where the distribution of F-Measure valueschanges significantly the ground truth is more heav-ily weighted than if the distribution changes less. TheBhattacharyya distance between the distributions isused to weight the ground truth, and any below athreshold are omitted for the sake of clarity.
The heatmap is important because it shows atwhich points during the data stream the RepStreamalgorithm performs well, and when it performs poorly.This gives an idea of when changes occur in the dis-tribution data points over time. It is intuitive to seewhere major changes occur, thus it is used as as thebackground to give context to the results.
5.2 Results
Figure 1 shows a table of the results for our detec-tion algorithm. It contains values for the Mean Timebetween False Alarms (MTFA), Mean Time to Detec-tion (MTD), the Missed Detection Rate (MDR), andthe Mean Time Ratio (MTR).
Figure 14 shows a visual representation of the de-tection rate for our algorithm when optimised to givethe highest possible MTR value. The parameters usedwere M = 1.4, H = 15 and λ = 0.001, and the MTRwas 39.46, mostly due to the low rate of false alarms.
Figure 15 has the parameters optimised for ahigher detection rate. The inputs were M = 1.2,H = 9 and λ = 0.001, which gives a lower MTR
Proceedings of the 13-th Australasian Data Mining Conference (AusDM 2015), Sydney, Australia
85

0 500 1000 1500 2000 2500 3000 3500 4000 4500 50000
100
200
300
400
500
600
700
800
900
1000M=1, H=20, λ=0
Detected ChangesEdge Change CountXX±σ
Figure 10: Detection on the single feature EdgeChange Count, with M = 1, H = 20, and λ = 0
0 500 1000 1500 2000 2500 3000 3500 4000 4500 50000
100
200
300
400
500
600
700
800
900
1000
Time
M=1, H=30, λ=0
Detected ChangesEdge Change CountXX±σ
Figure 11: Detection on the single feature EdgeChange Count, with M = 1, H = 30, and λ = 0
0 500 1000 1500 2000 2500 3000 3500 4000 4500 50000
100
200
300
400
500
600
700
800
900
1000
Time
M=1, H=30, λ=0.001
Detected ChangesEdge Change CountXX±σ
Figure 12: Detection on the single feature EdgeChange Count, with M = 1, H = 30, and λ = 0.001
value of 9.16, but a higher rate of detection, at theexpense of a higher rate of false alarms.
MTFA MTD MDR MTR
Moving AverageDetection optimisedfor MTR
803.3 5.42 0.73 39.46
Moving AverageDetecion optimisedfor lower MDR
219.0 19.13 0.20 9.16
OSVM detectionoptimised for MTR
186.2 12.64 0.50 7.36
Table 1: Results of our experiments on KDD withthe Mean Time between False Alarms, Mean Time toDetection, Missed Detection Rate, and Mean TimeRatio
5.3 Comparison To OSVM ClassificationMethod
We also tested the features using a different detectionschema, for the sake of comparison. Using a SupportVector Machine we performed the detection as a sim-ple two-class classification. Using a sliding we traineda One-class SVM with H datapoints, where the data-points were simply 5 dimensional vectors representingeach of our 5 features at a given time step. The nextH
2datapoints were then classified using the OSVM,
and if at least half of them were not classified into theOSVM’s trained class then it would mark a change atthat point.
Figure 16 shows the results of our test using theOne-class SVM detection approach. Optimising thealgorithm to give the highest MTR resulted in a MTRvalue of 7.36, and had a much higher rate of falsealarms compared to our proposed approach.
The SVM detection method results in a largernumber of correctly detected changes, as evident fromthe lower MDR value, however this is at the expenseof far more false alarms, with the relatively low valueot 186.15 as the MTFA. This combination results in alower MTR score compared to our proposed detectionmethod.
Our method when optimised for MTR yields a sig-nificantly higher total MTR score, as well as compara-tively fewer false alarms. A different optimisation forour proposed method optimises to reduce the MissedDetection Rate as much as possible while retaininga comparable MTR (Figure 15). The lower MDR of0.20 means that 80% of changes are successfully de-tected, with the drawback of a higher rate of falsealarms, leading to a decreased MTFA score for thismethod.
5.4 Results Discussion
Our algorithm detects points where the featureschange, as in Figures 10-12. When all features arecombined into a single detection method they pro-duce the change points, marked in green on Figures14 and 15. Both of these methods are optimised dif-ferently.
Our method of evaluation is limited in the sensethat ground truth changes only take into accountwhen classes appear and disappear. This is a limi-tation of the dataset used,
Whilst our proposed algorithm performs well, itstill has problems, notably in the form of false alarmsand changes which are not detected. For examplethe false alarms at around T ime = 1.85e + 05 andT ime = 1.92e + 05. At these times there are noground truth changes, as it is during a time wherethere is only a single class present (shown in Figure13). However, at that time the performance of Rep-Stream does change, so it could be explained by achange in the distribution of that single class at thattime.
Despite the false alarms our algorithm detects ahigh amount of the ground truth changes (Table 1).Many of the changes that are not detected, too, aremissed due to the close proximity of the changes.Our algorithm is limited in the case where dramaticchanges happen very rapidly.
6 Conclusion
There are significant challenges in detecting changesin a dataset, particularly when the dimensionality is
CRPIT Volume 168 - Data Mining and Analytics 2015
86

high. By extracting features of the data from a K-nearest neighbour graph we reduce the problem todetecting changes in a smaller number of time series,representing structural properties of the data.
We have presented a novel method of detectingconcept changes in data streams by examining struc-tural properties of graph based arrangements of thedata. This approach has been shown to work evenin high dimensional data, as with KDD which wastreated as a 34 dimensional dataset. We take fea-tures in RepStream’s K-nearest neighbour structureand use a time-series change detection algorithm withthe goal of identifying when major changes in the un-derlying dataset have occurred.
Our detection algorithm outperforms a similar ap-proach using OSVM techniques with respect to MTRon the well known KDD intrusion detection dataset.The KDD dataset was selected due to its use as abenchmark in prior literature, as well as the fact thatit mirrors a real-world application of change detec-tion.
Whilst the approach does have limitations, par-ticularly when the changes occur rapidly, and whenthe changes are very subtle, it produces good resultswhen tested on a real world dataset.
References
Aggarwal, C. C., Han, J., Wang, J. & Yu, P. S. (2003),A framework for clustering evolving data streams,in ‘Proceedings of the 29th International Confer-ence on Very Large Data Bases’, VLDB Endow-ment, pp. 81–92.
Aggarwal, C. C., Han, J., Wang, J. & Yu, P. S.(2004), A framework for projected clustering ofhigh dimensional data streams, in ‘Proceedings ofthe 30th International Conference on Very LargeData Bases’, VLDB Endowment, pp. 852–863.
Bhatnagar, V., Kaur, S. & Chakravarthy, S.(2014), ‘Clustering data streams using grid-basedsynopsis’, Knowledge and information systems41(1), 127–152.
Bifet, A., Read, J., Pfahringer, B., Holmes, G. & li-obait, I. (2013), Cd-moa: Change detection frame-work for massive online analysis, in ‘Proceedingsof the 12th International Symposium, IDA 2013’,pp. 92–103.
Cao, F., Ester, M., Qian, W. & Zhou, A. (2006),Density-based clustering over an evolving datastream with noise., in ‘Proceedings of the SIAMConference on Data Mining 2006’, SIAM, pp. 326–337.
Chen, Y. & Tu, L. (2007), Density-based clusteringfor real-time stream data, in ‘Proceedings of the13th ACM SIGKDD International Conference onKnowledge Discovery and Data Mining’, KDD ’07,ACM, New York, NY, USA, pp. 133–142.
Forestiero, A., Pizzuti, C. & Spezzano, G. (2013), ‘Asingle pass algorithm for clustering evolving datastreams based on swarm intelligence’, Data Miningand Knowledge Discovery 26(1), 1–26.
Hahsler, M. & Dunham, M. H. (2011), Tempo-ral structure learning for clustering massive datastreams in real-time., in ‘Proceedings of the 2011SIAM International Conference on Data Mining’,SIAM, pp. 664–675.
Kaur, S., Bhatnagar, V. & Chakravarthy, S. (2015),Stream clustering algorithms: A primer, in ‘BigData in Complex Systems’, Springer, pp. 105–145.
KDD Cup 1999 Dataset (n.d.).URL: https://archive.ics.uci.edu/ml/machine-learning-databases/kddcup99-mld/kddcup99.html
Kifer, D., Ben-David, S. & Gehrke, J. (2004), Detect-ing change in data streams, in ‘Proceedings of the13th International Conference on Very Large DataBases’, VLDB Endowment, pp. 180–191.
Kranen, P., Assent, I., Baldauf, C. & Seidl, T. (2011),‘The clustree: indexing micro-clusters for anytimestream mining’, Knowledge and information sys-tems 29(2), 249–272.
Luhr, S. & Lazarescu, M. (2009), ‘Incremental clus-tering of dynamic data streams using connectiv-ity based representative points’, Data & KnowledgeEngineering 68(1), 1–27.
Masud, M., Gao, J., Khan, L., Han, J. & Thuraising-ham, B. (2011), ‘Classification and novel class de-tection in concept-drifting data streams under timeconstraints’, IEEE Transactions on Knowledge andData Engineering 23, 859–874.
Nasraoui, O. & Rojas, C. (2006), Robust Clusteringfor Tracking Noisy Evolving Data Streams, chap-ter 72, pp. 619–623.
Pham, D.-S., Venkatesh, S., Lazarescu, M. & Budha-ditya, S. (2014), ‘Anomaly detection in large-scaledata stream networks’, Data Mining and Knowl-edge Discovery 28(1), 145–189.
Ruiz, C., Menasalvas, E. & Spiliopoulou, M. (2009),C-denstream: Using domain knowledge on adata stream, in ‘Procedings of the 12th Interna-tional Conference on Discovery Science’, Springer,pp. 287–301.
Silva, J. A., Faria, E. R., Barros, R. C., Hruschka,E. R., de Carvalho, A. C. & Gama, J. (2013),‘Data stream clustering: A survey’, ACM Comput-ing Surveys (CSUR) 46(1), 13.
Stolfo, S. J., Fan, W., Lee, W., Prodromidis, A.& Chan, P. K. (2000), Cost-based modeling forfraud and intrusion detection: Results from thejam project, in ‘Proceedings of the DARPA In-formation Survivability Conference and Exposition,2000’, Vol. 2, IEEE, pp. 130–144.
Tsymbal, A. (2004), ‘The problem of concept drift:definitions and related work’, Technical Reportfrom the Computer Science Department, TrinityCollege Dublin .
Van Leeuwen, M. & Siebes, A. (2008), Streamkrimp:Detecting change in data streams, in ‘MachineLearning and Knowledge Discovery in Databases’,Springer, pp. 672–687.
Zhou, A., Cao, F., Qian, W. & Jin, C. (2008), ‘Track-ing clusters in evolving data streams over slid-ing windows’, Knowledge and Information Systems15(2), 181–214.
Proceedings of the 13-th Australasian Data Mining Conference (AusDM 2015), Sydney, Australia
87

Moving Average Detection M=1.4, H=15, λ=0.001
Time
0 0.5 1 1.5 2 2.5 3 3.5 4 4.5
x 105
False AlarmsTrue DetectionsGround TruthChanges (weighted)
Figure 14: Our moving average detection algorithm on the KDD dataset, with parameters optimised for thehighest MTR value
Moving Average Detection M=1.2, H=9, λ=0.001
Time
0 0.5 1 1.5 2 2.5 3 3.5 4 4.5
x 105
False AlarmsTrue DetectionsGround TruthChanges (weighted)
Figure 15: Our moving average detection algorithm on the KDD dataset, with parameters optimised for lowerMissed Detection Rate
SVM Detection optimised for MTR
Time
0 0.5 1 1.5 2 2.5 3 3.5 4 4.5
x 105
False AlarmsTrue DetectionsGround TruthChanges (weighted)
Figure 16: The OSVM comparison algorithm on the KDD dataset with parameters optimised for the highestMTR value
CRPIT Volume 168 - Data Mining and Analytics 2015
88