detection, resolution, and imaging beyond abbe’s ... · detection, resolution, and imaging beyond...
TRANSCRIPT

Detection, Resolution, and Imaging Beyond Abbe’s Diffraction Limit
Ric Villani Senior Biosystems Application Manager
Nikon Instruments Inc. February 22nd, 2016

Imaging at various lengths
PET
MRI
CT
Light Microscopy
EM, SPM
X-ray crystallography, NMR

3
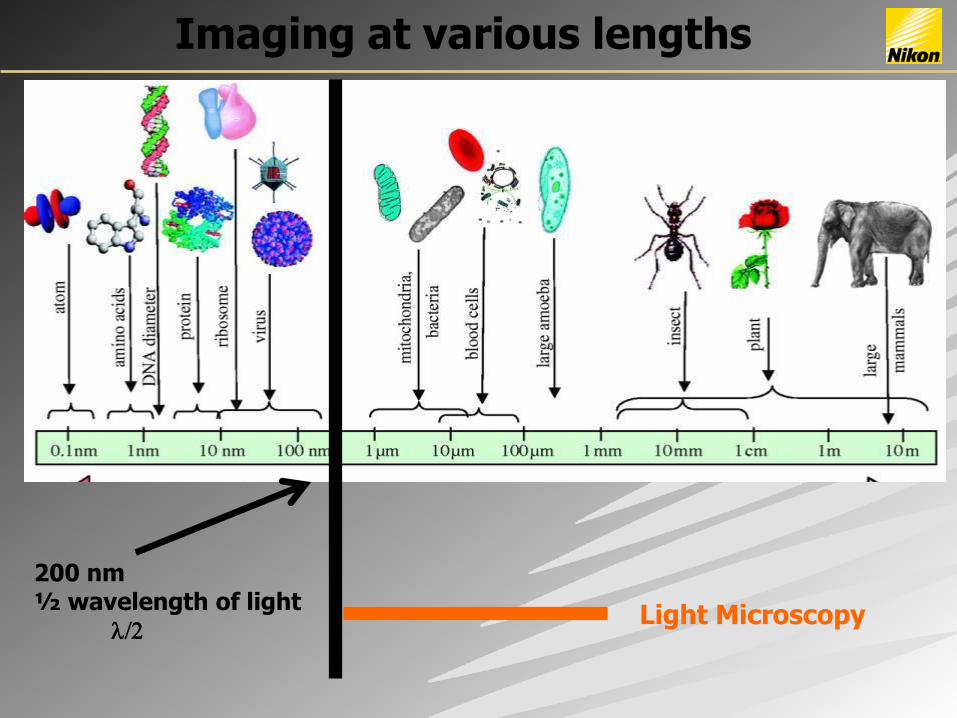
Imaging at various lengths
Light Microscopy
200 nm ½ wavelength of light l/2

5
l LENS
500-800 nm
200 nm
Verdet (1869) Abbe (1873) Helmholtz (1874) Rayleigh (1874)
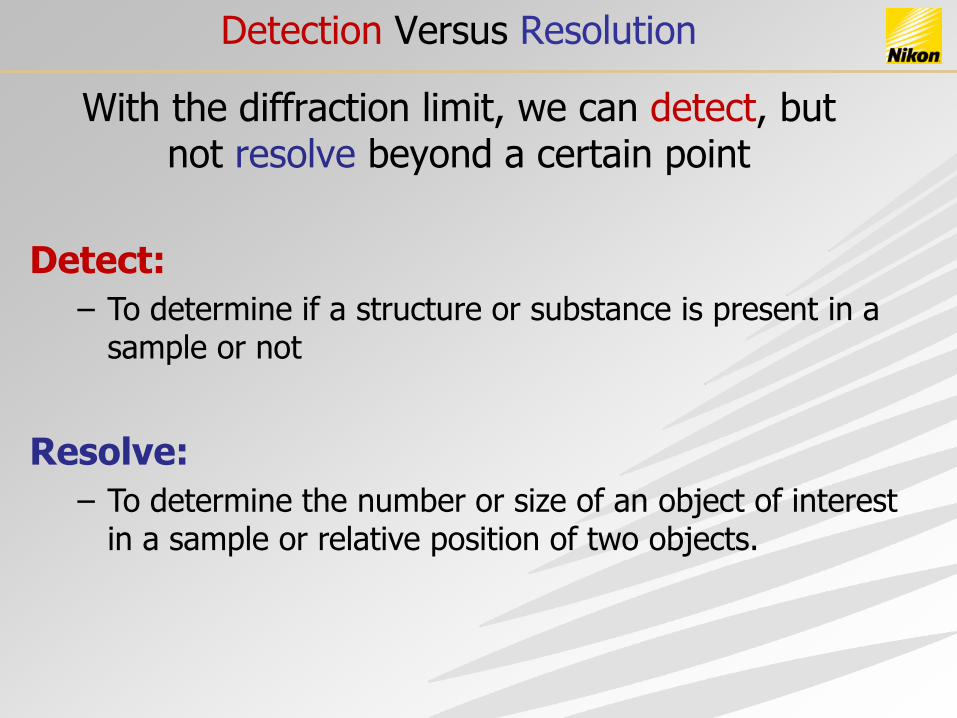
Detect:
– To determine if a structure or substance is present in a sample or not
Resolve:
– To determine the number or size of an object of interest in a sample or relative position of two objects.
Detection Versus Resolution
With the diffraction limit, we can detect, but not resolve beyond a certain point

Detection Versus Resolution
Sub-resolution light sources are “convolved” by the microscope appearing
as “diffraction limited” Airy Disks.
50nm100nm 200nm
240nm
85
0n
m
Resolution is a function of Airy Disks separation.
Detection is a function of total brightness of the diffraction volume.
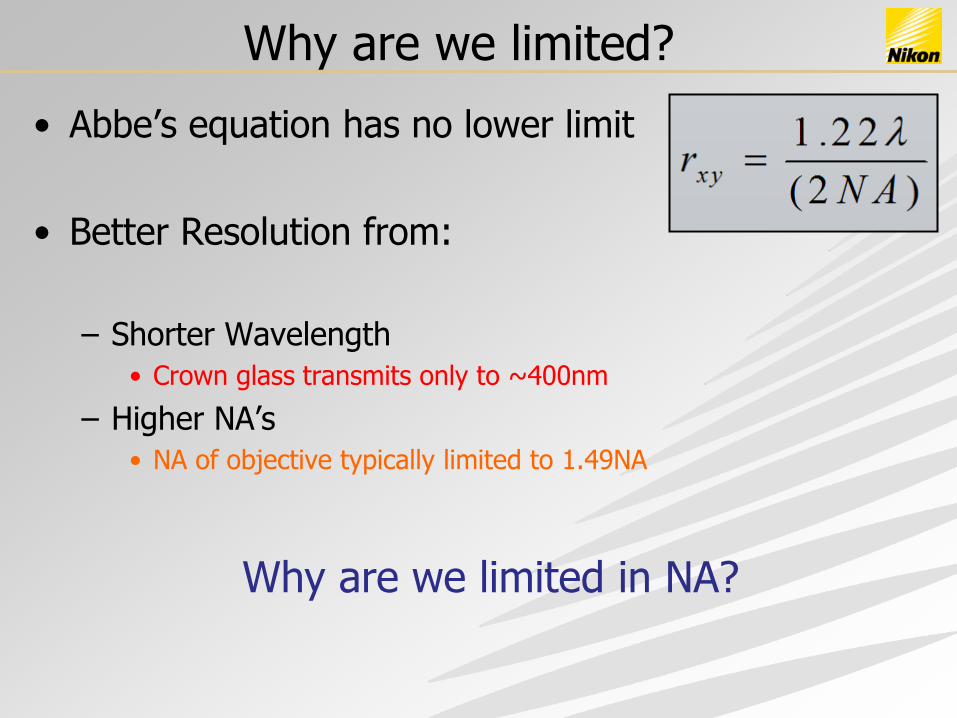
Why are we limited?
• Abbe’s equation has no lower limit
• Better Resolution from:
– Shorter Wavelength
• Crown glass transmits only to ~400nm
– Higher NA’s
• NA of objective typically limited to 1.49NA
Why are we limited in NA?

The Other Side
Images From - Mats Gustafsson - UCSF
0 NA 1.4 NA
1.4 NA 0 NA
Field Space
Aperture Space
Biggest Objects Smallest Objects

Approaching the Limit
• The diffraction limit is for a single point in space
• Samples have signal above and below
• Imaging the diffraction volume is obscured.
Confocal: Emission Restriction
MP: Excitation Restriction
TIRF: Sub-Diffraction Excitation
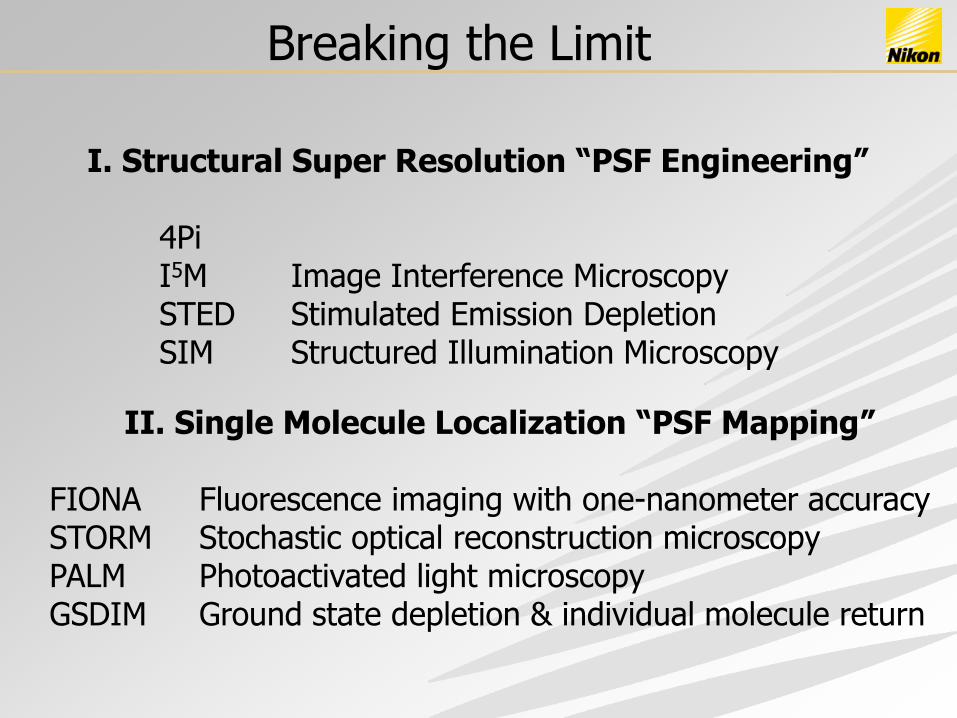
Breaking the Limit
I. Structural Super Resolution “PSF Engineering”
4Pi I5M Image Interference Microscopy STED Stimulated Emission Depletion SIM Structured Illumination Microscopy
II. Single Molecule Localization “PSF Mapping”
FIONA Fluorescence imaging with one-nanometer accuracy STORM Stochastic optical reconstruction microscopy PALM Photoactivated light microscopy GSDIM Ground state depletion & individual molecule return
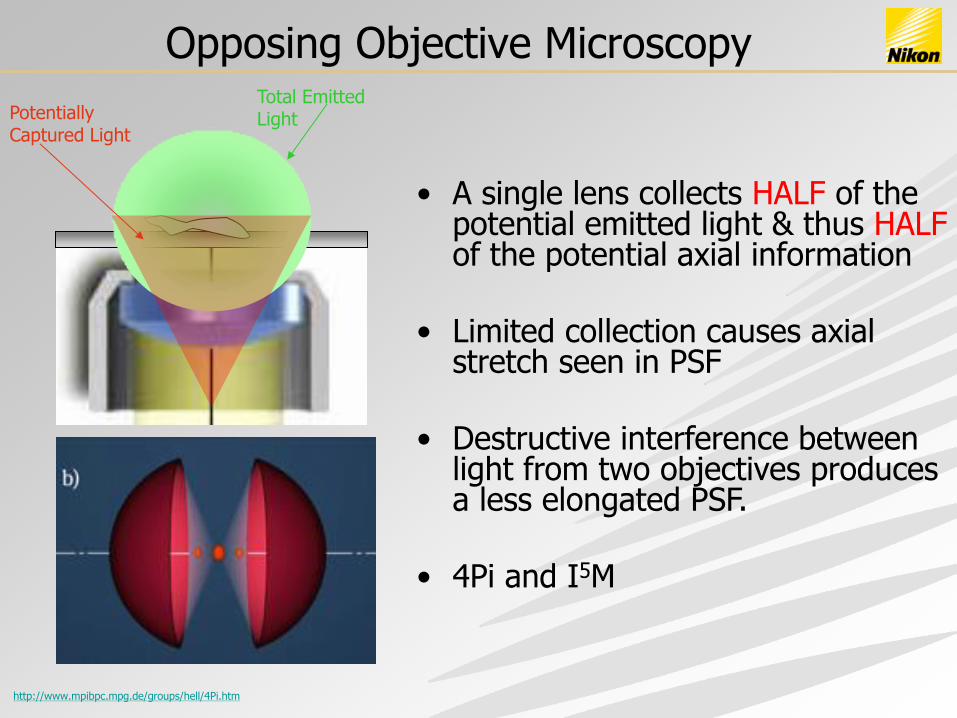
Opposing Objective Microscopy
• A single lens collects HALF of the potential emitted light & thus HALF of the potential axial information
• Limited collection causes axial stretch seen in PSF
• Destructive interference between light from two objectives produces a less elongated PSF.
• 4Pi and I5M
Total Emitted Light Potentially
Captured Light
http://www.mpibpc.mpg.de/groups/hell/4Pi.htm
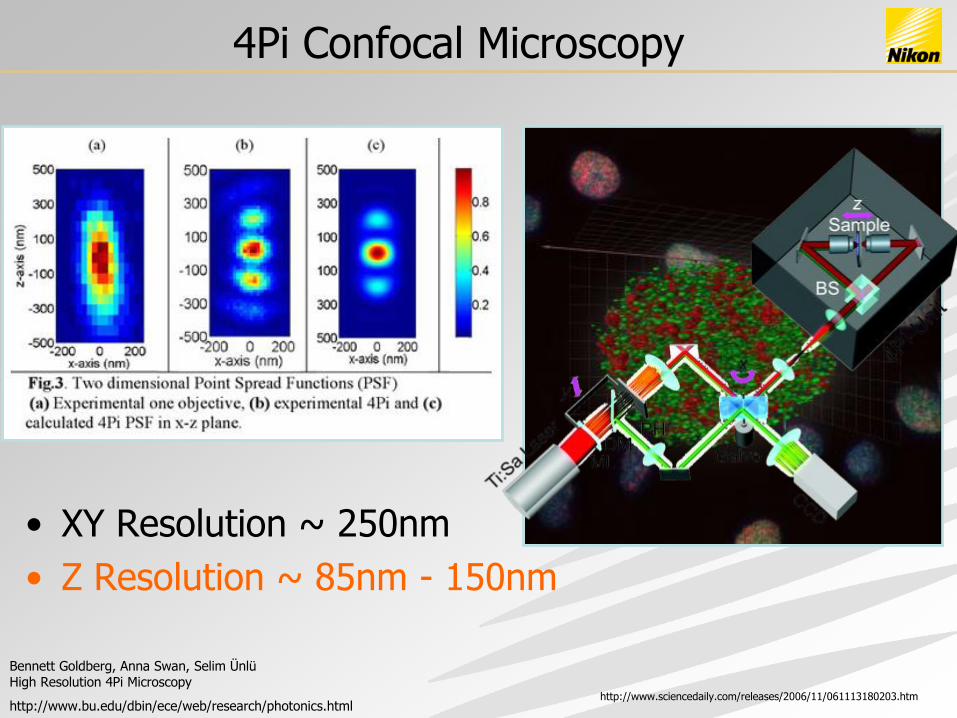
4Pi Confocal Microscopy
Bennett Goldberg, Anna Swan, Selim Ünlü High Resolution 4Pi Microscopy
http://www.bu.edu/dbin/ece/web/research/photonics.html
• XY Resolution ~ 250nm
• Z Resolution ~ 85nm - 150nm
http://www.sciencedaily.com/releases/2006/11/061113180203.htm

Image Interference Microscopy
• Image Interference Microscopy is a widefield version of 4Pi.
• This method utilizes full field illumination as opposed to confocal scanning to produce an image.
C
Incoherent light Source
CCD Detector
Prisms
Sample
Generalized Diagram of
I2M, I3M, & I5M
• XY Resolution: ~250nm
• Z Resolution: ~85nm – 150nm

Opposing Objective Methods
• Systems can yield a 5-9 fold increase in Z resolution
• No resolution benefit in XY
• Require extremely accurate microscope alignment
• Require mathematical image processing to remove axial “lobes” from the PSF
• Commercially challenging

Sub-Diffraction Fluorescence Excitation
• Traditional confocals use the objective to form a diffraction-limited excitation spot
• Excitation with a sub-diffraction spot would produce sub-diffraction emission
• Emission produced could be localized to a smaller volume, increasing resolution
Diffraction Limited Illumination Spot Emission Depletion
Source
Spot radius
reduced
85 nm
24
0 n
m

Emission Depletion
• Normal fluorescence excitation
• Emission depletion doughnut – 200 pico-second pulses of light
– Close to probe’s emission
• Emission light donut causes probe to return to ground state without photon emission
• The only emitted photons come from probes illuminated in the donut hole
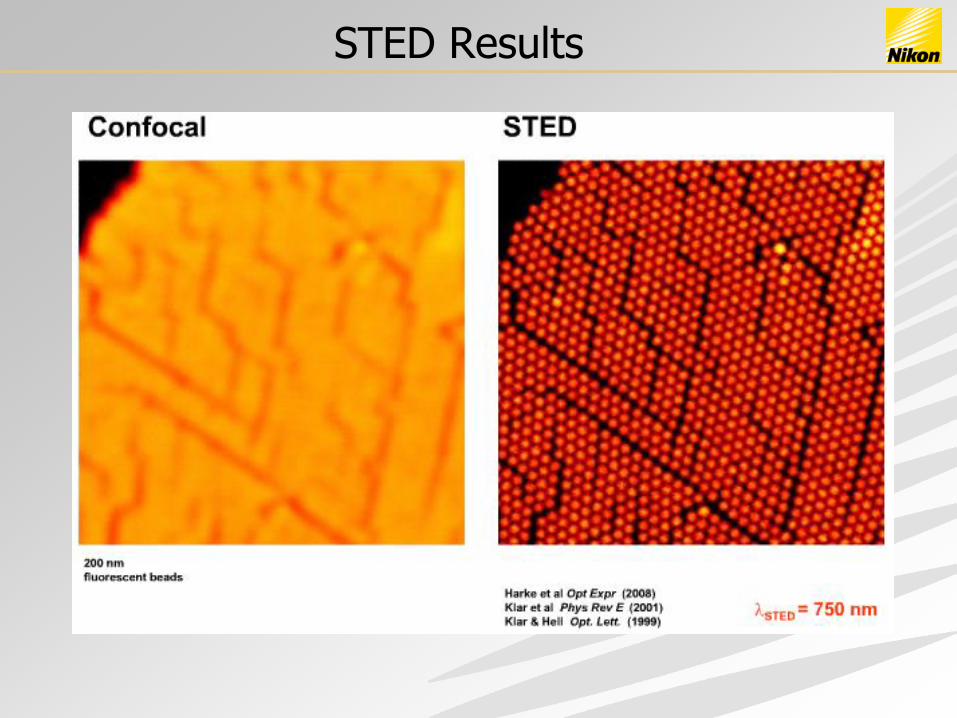
STED Results

STED Results
Nanoscale resolution in GFP-based microscopy Katrin I Willig, Robert R Kellner, Rebecca Medda, Birka Hein, Stefan Jakobs & Stefan W Hell
NATURE METHODS VOL.3 NO.9 |SEPTEMBER 2006
• Z Resolution ~ 100nm
• XY Resolution ~100nm
• High photobleaching
• High phototoxicity

Extending Fourier Space
Images From - Mats Gustafsson - UCSF
1.4 NA 0 NA
Field Space
Aperture Space
Biggest Objects Smallest Objects
• Resolution is limited by NA
• More back aperture = more NA

SIM Principle
Unknown Sample Structure

SIM Principle
Unknown Sample Structure
+ Known Illumination Pattern

SIM Principle
Unknown Sample Structure
+ Known Illumination Pattern
Moiré Fringes (Known Structure)
NA of Moire = NA of Sample – NA of Pattern

Phase Shifts
Moire Fringes generated at diffraction limit
High spatial frequency (smallest) objects affected most by shift
Low spatial frequency (largest) objects affected least by shift
Orientations of pattern and objects matters!

Mats Gustafsson - UCSF

Mats Gustafsson - UCSF
This is a single SIM iteration. One angle, 3 phases
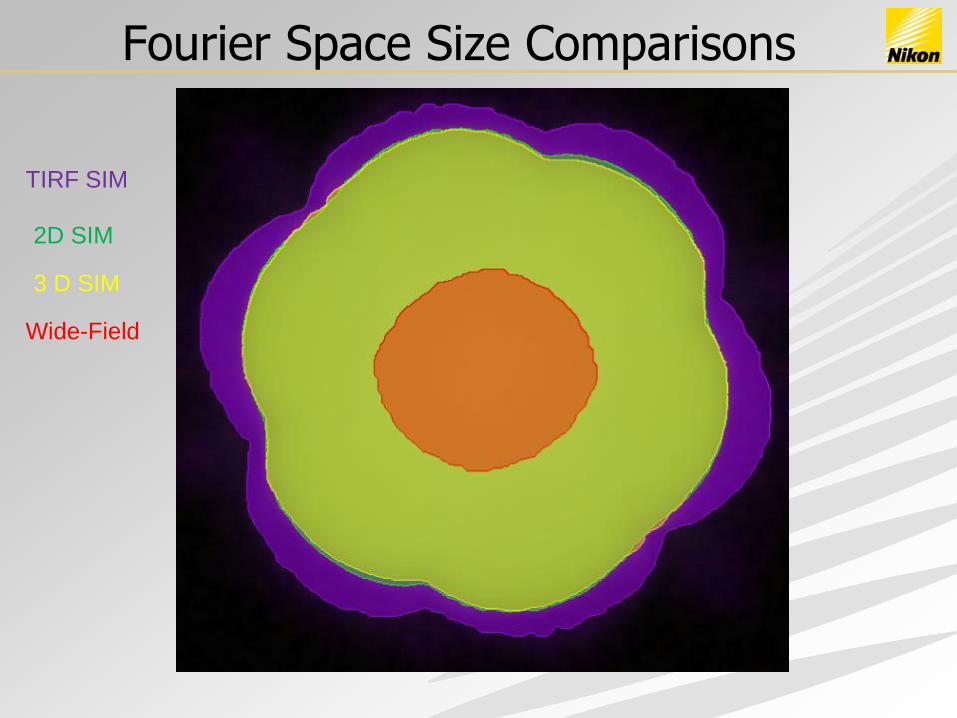
Fourier Space Size Comparisons
TIRF SIM
2D SIM
3 D SIM
Wide-Field
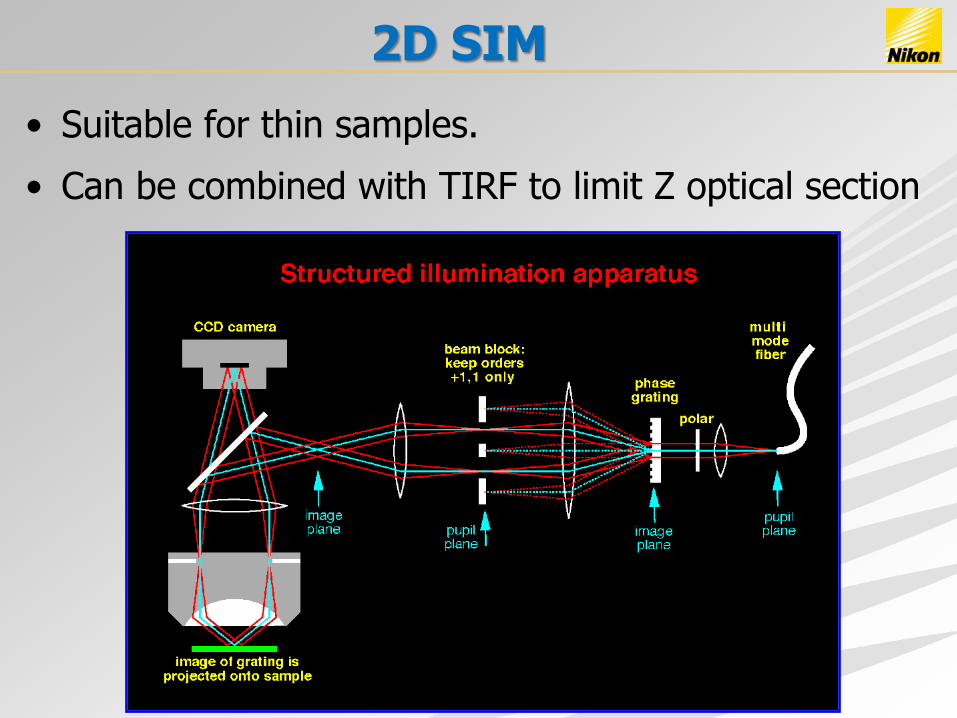
2D SIM
• Suitable for thin samples.
• Can be combined with TIRF to limit Z optical section

• 200nm beads 488nm
• 2D SIM vs Wide-field
2D SIM Results
170 nm
Images From - Mats Gustafsson - UCSF

3D SIM
• Similarly, light can be patterned in three dimensions for 3D SIM
• Yields maximum axial information. • Single Z Plane of 3 grid angles x 5 grid phases
(15 images)
x
z
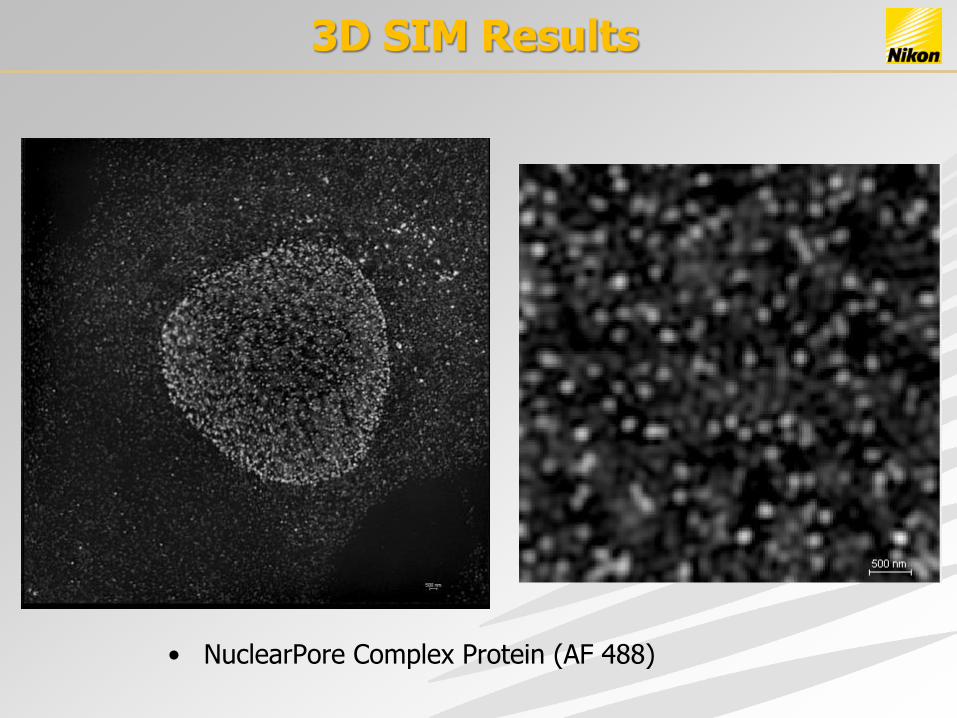
• NuclearPore Complex Protein (AF 488)
3D SIM Results
32
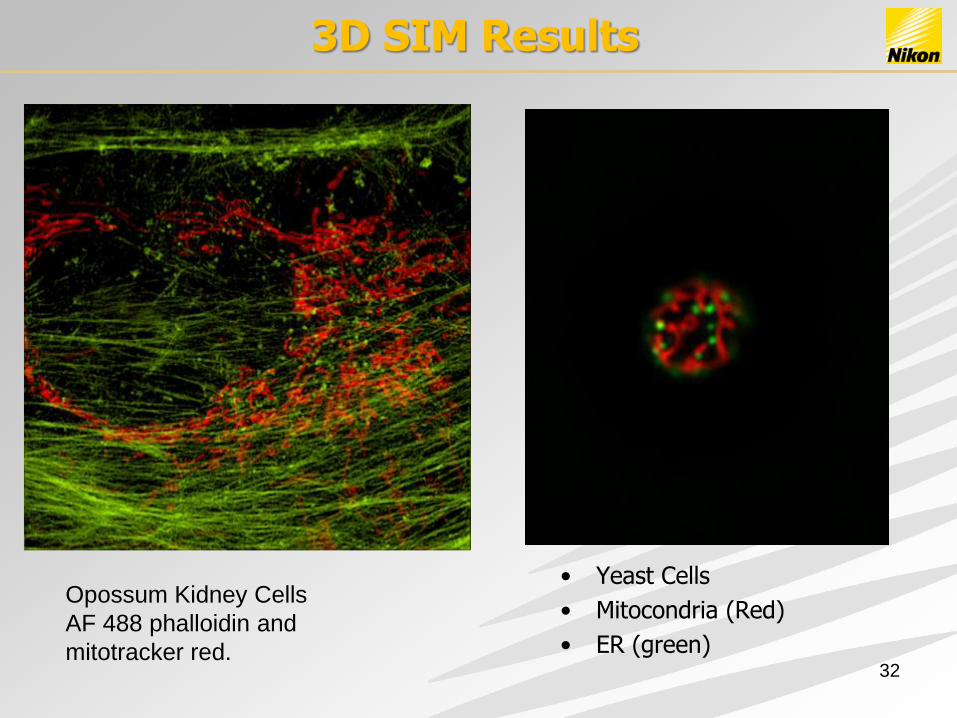
Opossum Kidney Cells
AF 488 phalloidin and
mitotracker red.
3D SIM Results
• Yeast Cells
• Mitocondria (Red)
• ER (green)
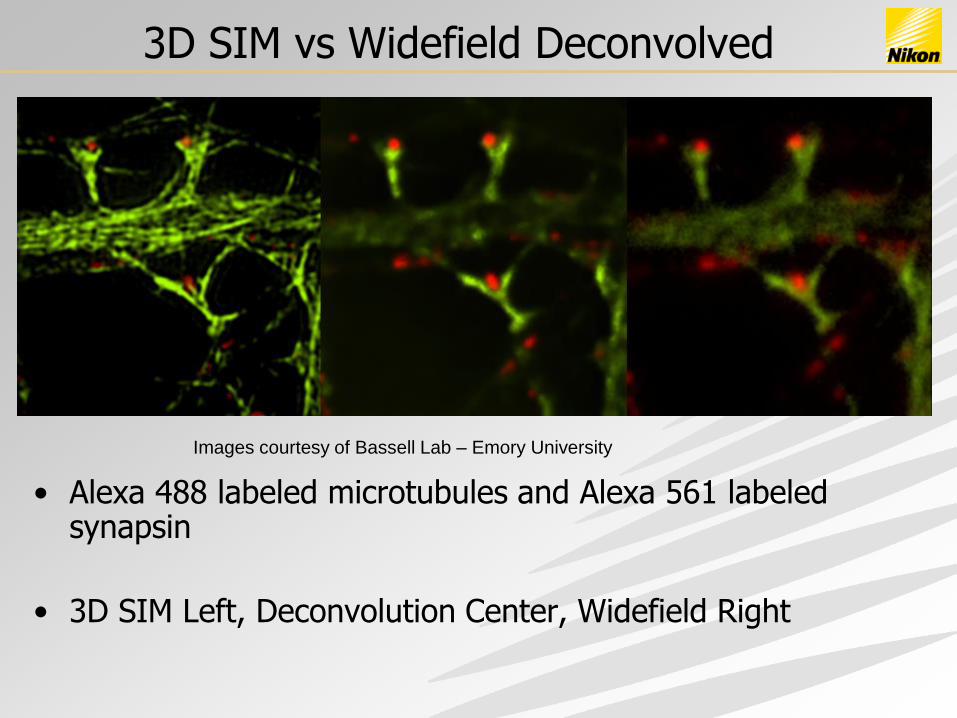
3D SIM vs Widefield Deconvolved
• Alexa 488 labeled microtubules and Alexa 561 labeled synapsin
• 3D SIM Left, Deconvolution Center, Widefield Right
Images courtesy of Bassell Lab – Emory University

Applications of N-SIM: Live Cell Imaging
Sample thickness up to 20µm
Mitochondrial cristae are now visible
Conventional N-SIM
Live Cell - NIH3T3 Mitochondria -MitoTracker Red-Timelapse
Exposure: 64ms,15 images. Total acq. time: 1.8s. 5-cycle timelapse, 1s interval
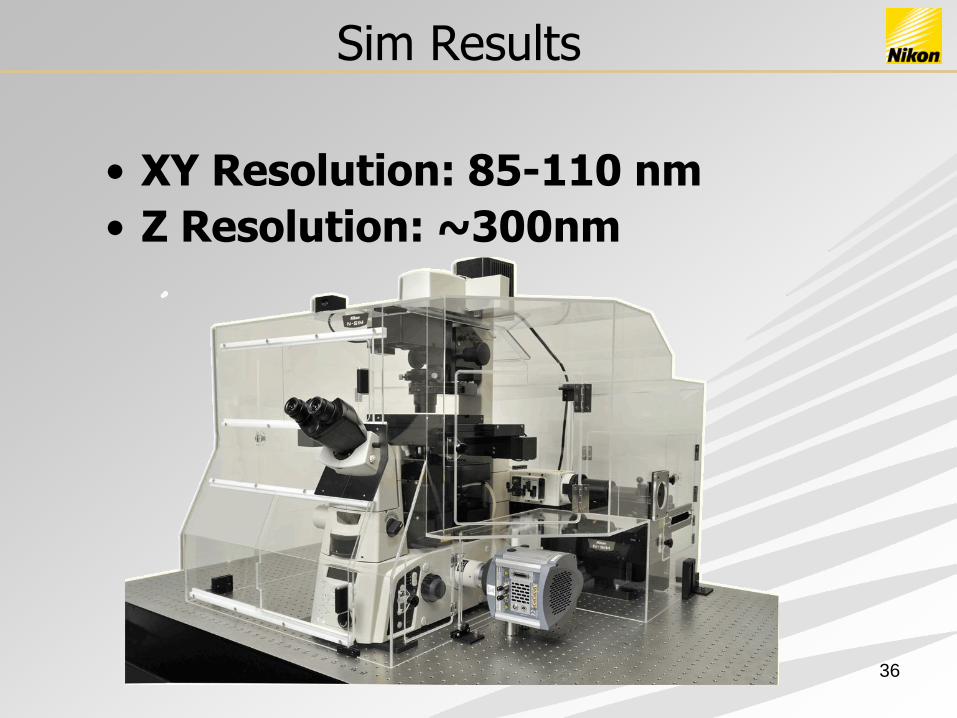
Sim Results
36
• XY Resolution: 85-110 nm
• Z Resolution: ~300nm

Breaking the Limit
I. Structural Super Resolution “PSF Engineering”
4Pi I5M Image Interference Microscopy STED Stimulated Emission Depletion SIM Structured Illumination Microscopy
II. Single Molecule Localization “PSF Mapping”
FIONA Fluorescence imaging with one-nanometer accuracy STORM Stochastic optical reconstruction microscopy PALM Photoactivated light microscopy GSDIM Ground state depletion & individual molecule return

FIONA: Breaking the Limit
• Less then 1.5 nm (XY) molecular localization
• 0.5s temporal resolution

FIONA
39
𝑑𝑦
𝑑𝑥
S/N (Center) = width/ 𝑵
N= number of Photons

Accuracy of Localization
The Gaussian fit is a probability as to where the single molecule is located.
The greater the number of photons the more accurate the localization

Localization Microscopy Principle
Conventional
Fluorescence
Emitter
Isolation

Super-Resolution by Localization
Raw images Conventional fluorescence STORM Image
2x real time
Activation Localization Deactivation
Rust, Bates & Zhuang, Nat. Methods, 2006 Bates, Huang, Dempsey & Zhuang, Science, 2007
Stochastic Optical Reconstruction Microscopy = STORM
Photo-switchable probes are capable of moving from a “dark state” to an emitting state through the
use of high energy light sources.
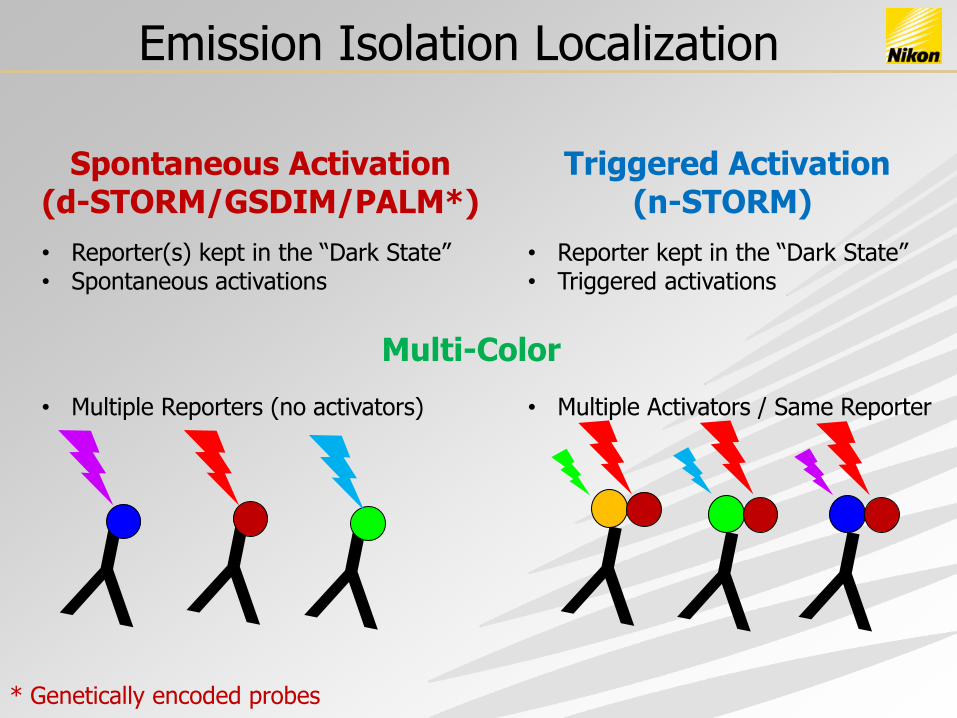
Emission Isolation Localization
Spontaneous Activation (d-STORM/GSDIM/PALM*)
Triggered Activation (n-STORM)
• Reporter(s) kept in the “Dark State” • Spontaneous activations
• Reporter kept in the “Dark State” • Triggered activations
• Multiple Reporters (no activators) • Multiple Activators / Same Reporter
Multi-Color
* Genetically encoded probes

Localization Microscopy
500 nm
B-SC-1 cell, anti-β tubulin, Alexa 647
5 μm

Multiple Color n-STORM
Bates, Huang, Dempsey, Zhuang Science (2007)

Multiple Reporters
2-color d-STORM : Michael Davidson, Florida State University 2-color GSDIM: Stephan Hell, Max-Planck Institute for Biophysical Chemistry, Germany

In a 2D world…
Satellite image of ???
Google maps

Huang, Zhuang et al, Science
(2008)
3D STORM
DU-897 EMCCD
2γ
(x, y, z)
400
200
0
-200
-400
z (nm)
In
Focus
Above
Focus
Below
Focus
Tube Lens
Cylindrical Lens
In
Focus
Above
Focus
Below
Focus
Molecules localized in Z
•Molecules above focus maintain symmetry in Y
•Molecules below focus maintain symmetry in X
•Fitted to Gaussians similar to XY

5 μm
Huang, Wang, Bates and Zhuang, Science, 2008
Scale bar: 200 nm
3D Imaging of the Microtubule Network
z (nm)
300
0
600

2 Color 3D STORM
• Clathrin (Green)
• FBP17 – Formin (Red)
• Showing Clathrin’s function in endocytosis
Images Courtesy of Dr. Bo Huang - UCSF

Localization Probes

STORM Results
52
• XY Resolution: 20-30 nm
• Z Resolution: ~50-60 nm

Do Dyes Matter?!
Dempsey et al, Nature Methods, 2011
Alexa 647 Atto 655 Cy5.5
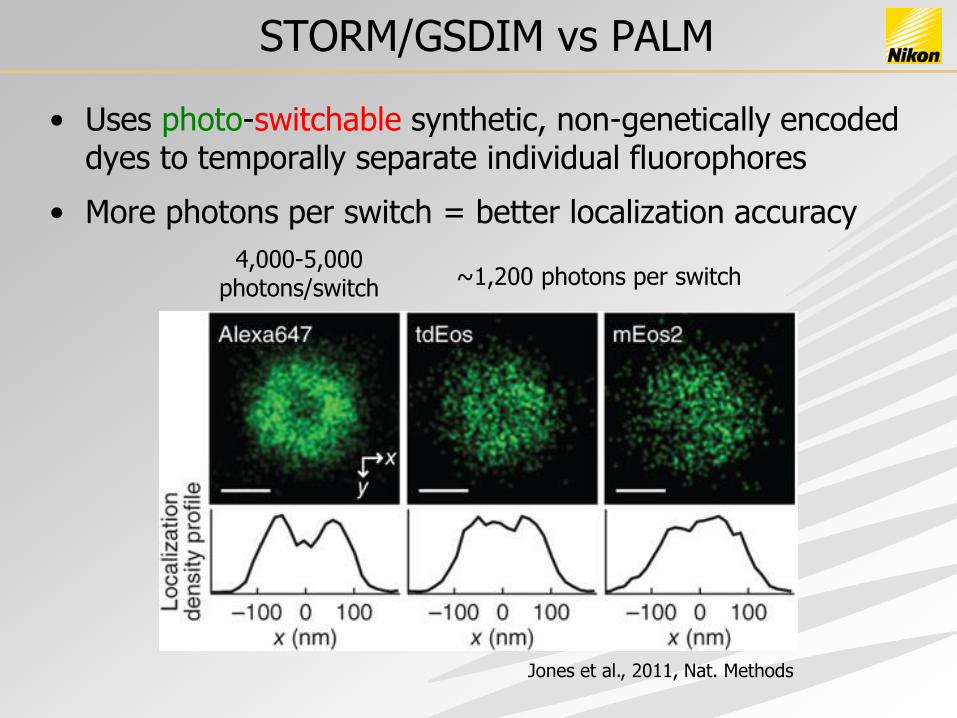
STORM/GSDIM vs PALM
• Uses photo-switchable synthetic, non-genetically encoded dyes to temporally separate individual fluorophores
• More photons per switch = better localization accuracy
Jones et al., 2011, Nat. Methods
4,000-5,000 photons/switch ~1,200 photons per switch

iPALM
• Interferomety Photo-activation Localization Microscopy
– Uses 2 opposing objective and 3 cameras simultaneously with interferomety principles to achieve high accuracy Z localization
Dr. Harold Hess
HHMI – Janelia Farm
http://www.hhmi.org/news/hess20090202.html
Resolution Achieved: XY ~10-20nm Z ~10-20nm

80
01
00
30
0
225
60
04
00
20
0
20
85 25 25 15225
Volumetric comparison
Axia
l Reso
lutio
n, Z
(nm
)
Lateral Resolution, XY (nm)
Diffraction Limited (Confocal)
4π
STED or SIM
PALM
3D STORM iPALM

One Last Thought?
57

Thank You