determinants of job search intensity – some evidence from the nordic countries
TRANSCRIPT
185DETERMINANTSOF JOB SEARCH
INTENSITY –SOME EVIDENCE
FROMTHE NORDICCOUNTRIES
Tor ErikssonReija LiljaHege Torp

1
PALKANSAAJIEN TUTKIMUSLAITOS •• T Y Ö P A P E R E I T ALABOUR INSTITUTE FOR ECONOMIC RESEARCH •• DISCUSSION PAPERS
*Aarhus School of Business, Aarhus [[email protected]]**Labour Institute for Economic Research, Helsinki [[email protected]]
***Institute for Social Research, Oslo [[email protected]]
Acknowledgements: This research has been financed by the Nordic Council of Ministers andthe Joint committee of the Nordic Research Councils for the Social Research. Valuablecomments from Knut Roed are much appreciated. We also thank Jesper Bagger and Eija Savajafor research assistance.
Helsinki 2002
185DETERMINANTSOF JOB SEARCHINTENSITY –SOME EVIDENCEFROM THENORDICCOUNTRIES
Tor Eriksson*, Reija Lilja**,Hege Torp***

2
ISBN 952–5071–74–XISSN 1457–2923

3
ABSTRACT
This paper examines the determinants of the job search intensity of unemployed jobseekers in three Nordic countries: Denmark, Finland and Norway. For this purpose weuse data from a survey carried out in the three countries in 1998 by means of a commonquestionnaire. For each country we study two samples; a stock sample consisting ofindividuals still unemployed at the time they were interviewed and a flow sample includingthe job seekers who had left unemployment when interviewed. The analysis concerns twodecisions: i) whether or not to search, and ii) given positive search, the magnitude of thesearch effort. In addition to individual characteristics, the explanatory variables areparticipation in labour market programmes, unemployment benefits, attitudes to work,individual consequences of unemployment and the demand situation in the local labourmarket. We find rather big differences between the countries with respect to the relativeimportance of the determinants of job search intensity. Some common features are:Positive work attitudes are positively related to job search. Those reporting economicproblems as a consequence of their unemployment search more intensively than others. InFinland and Norway, unemployment benefit recipients are more likely to search activelythan non-claimants, whereas in Denmark the groups do not differ. A positive impact isconsistent with non-claimants being less attached to the labour market.
Keywords: Unemployment, Job search intensity, Economic incentives, Work valuesJEL classification: J64, J65
TIIVISTELMÄ
Tässä työssä tutkitaan työttömien työnhakijoiden työn etsinnän intensiivisyyteenvaikuttavia tekijöitä kolmessa pohjoismaassa: Ruotsissa, Suomessa ja Tanskassa.Tutkimuksessa hyödynnetään kaikissa kolmessa maassa vuonna 1998 kerättyä samanlaistakyselyaineistoa. Kustakin maasta on kerätty kaksi otosta; ns. varanto-otos, joka on otostiettynä ajankohtana olleista työttömistä ja ns. virtaotos, jossa on mukana tiettynäajankohtana työllistyneet tai työvoiman ulkopuolelle siirtyneet. Analyyseissä tarkastellaankahta päätöstä; i) etsiäkö työtä vai ei, ja ii) jos työtä on etsitty, kuinka paljon voimavarojatyön etsintään on käytetty. Yksilötekijöiden lisäksi työn etsintää selittävinä tekijöinä onkäytetty työvoimapoliittisiin toimenpiteisiin osallistumista, työttömyysturvaa, asennettatyöhön, työttömyyden seuraamuksia yksilötasolla ja paikallisten työmarkkinoidenkysyntätilannetta. Tutkittujen maiden välillä on melko suuria eroja siinä, mitkä tekijätselittivät työn etsintää. Myös joitakin yhteisiä tekijöitä löytyi: Myönteinen asenne työhönlisäsi työn etsintää. Ne, joilla työttömyys aiheutti kielteisiä seuraamuksia, etsivät muitaahkerammin töitä. Suomessa ja Norjassa työttömyysturvan piirissä olevilla oli muitasuurempi todennäköisyys etsiä töitä kun taas Tanskassa näiden ryhmien välillä ei olluteroja. Työttömyysturvan myönteinen vaikutus työn etsintään on yhdenmukainen senajatuksen kanssa, että työttömyysturvaa saavat ovat muita sitoutuneempia työmarkkinoille.
Aivansanat: Työttömyys, työn etsinnän intensiteetti, taloudelliset kannustimet, työnarvostaminenJEL luokitus: J64, J65

4
1. INTRODUCTION
Following the seminal paper by Mortensen (1977), the bulk of the literature on the
determinants of job search, and search duration in particular, has predominantly been
concerned with the economic incentives for individuals to accept job offers. Considerable
less attention has been paid to the factors influencing the intensity with which job seekers
search for job vacancies. Apart from a number of rather descriptive analyses of job
seekers’ use of different channels of search – see e.g. Rosenfeld (1977) and Moylan et al.
(1982) – relatively few empirical studies attempt to explain differences in individuals’
search effort. Some notable exceptions are Barron and Mellow (1979), Barron and Gilley
(1979), (1981), Chirinko (1982), Holzer (1988), Albrecht, Holmlund and Lang (1989),
Wadsworth (1990), Lindeboom and Theeuwes (1993). For two recent and
comprehensive reviews; see Devine and Kiefer (1991), Pedersen and Westergård-Nielsen
(1998).
The key dependent variable in job search analyses has been unemployment duration. In
most studies the outcome variable is specified as a hazard rate, the probability of exiting
unemployment, or as a transition from unemployment to employment. Such a transition is
the product of the search intensity (and thus the probability of locating a job offer) and
the probability that the offer is accepted. A main purpose of this paper is to focus on the
first of these components, the search intensity and its determinants. A novelty of our
analysis is that we decompose the search strategy into two components: whether the
individual searches at all, and if so, how much or how intense.
Another distinguishing feature of the paper is that it uses data from three different
countries: Denmark, Finland and Norway. These data sets were collected by means of a
survey questionnaire, which asks the same questions in all three countries. For each
country we construct two samples on the basis of the status of the respondents at the time
they were interviewed. Those still unemployed constitute the stock sample and those who
had left unemployment are in the flow sample.1
1 In fact, the same questionnaire survey was also carried out in Sweden, too. However, the Swedish data arenot included in the analysis in this paper.

5
As is well-known, long-term unemployment spells are over-represented in stock samples
(Salant (1977)). By comparing the results for stock and flow samples we are able to check
if the sampling procedure – and thus a possible impact of unemployment duration – is
reflected in the analyses of job search behaviour.
The three countries have in common some features of Nordic labour market institutions,
but differ in other respects. For instance, the demand conditions in the labour market
during the time of the study were quite different. Norway had a strong labour demand and
consequently a low unemployment rate, Denmark experienced falling unemployment for
the fifth year in a row, and finally Finland had high but decreasing unemployment during
her recovery from the severe economic crisis of the early nineties. They also differ
regarding the generosity and other aspects of the unemployment benefit system. In
Denmark and Finland membership in the income related unemployment insurance system
is voluntary, whereas in Norway it is compulsory. In Denmark the replacement ratio may
be as high as 90 per cent for low paid workers and the job seeker must have had a job for
at least twelve months to be eligible. In Norway the replacement ratio is 63 per cent at
maximum, and eligibility depends on previous annual earnings; 2.5 months of
employment is sufficient in most cases.
We find that the three countries also differ with respect to average levels of job search
effort. Thus, for example a considerably larger share of the Danish and Finnish
respondents does not search at all. Conditional on searching, also the level of search
intensity is higher among Norwegian respondents. A second aim of the analysis is to
contribute to the understanding of these differences in job search strategies and hence also
to what extent such differences may explain the differences in unemployment rates.
Finally, the third aim of the paper is to shed additional light on how search intensity
differs between those eligible and not eligible for unemployment benefits, respectively and
between the genders, age groups and individuals with differing breadwinner status. The
question concerning the impact of unemployment benefit receipt is important, since if this
effect is positive, it works against the negative reservation wage effect.
The remainder of the paper is organised as follows. Next we briefly sketch the theoretical
framework underlying our empirical analysis. Section 3 gives a description of some of the
key characteristics of the labour markets and labour market institutions in the three

6
countries under study. The fourth section presents the data sets used and the fifth section
contains the empirical model. Estimation results are presented in the sixth section. Section
7 concludes. More details are found in Appendix A and B.
2. THEORETICAL CONSIDERATIONS
Next we discuss the job search behaviour by unemployed within a simple framework. We
assume the probability of employment for an unemployed job seeker (pe) is the product of
the probability that he or she will receive a job offer (po) and the probability (pa) that the
offer is accepted:2
(1) pe = po pa.
The probability of acceptance can be written as follows:
(2) pa = (1-F(wR))
where wR is the reservation wage (minimum acceptable wage offer), and F(w) is the
cumulative distribution of possible job offers, assumed to be independent on the job
search strategy. Thus (1-F(wR)) is the probability of getting an acceptable job offer.
Further, the job offer probability po depends on the level of demand in the labour market
(d) and the intensity of search activity undertaken by the job seeker (s):
(3) po = po(d, s), assuming po to be increasing in both d and s.3
Search effort provides information on job offers. The amount of information and the
probability of contacting a job offer are positively related to search effort:
(4) s = s(t, z), assuming s to be increasing in both t and z.
2 See e.g. Barron (1975), Lynch (1983) and Wadsworth (1990).3 As emphasised by Barron (1975), in addition to an increase in the arrival rate of job offers, an increase indemand may also lead to searchers becoming more choosy, that is, their acceptance probability is lowered.Consequently, the effect of demand on the probability of employment is a priori ambiguous.

7
where t represents time (and other resources) devoted to search activity, and z represents
the influence of individual (and other) background exogenous characteristics. Both the
reservation wage and the search effort are results of optimal behaviour. We assume the job
seeker maximises the welfare given by the present value of expected future net income. As
employed net income is given by the value of the wage contract. For an interest rate r, the
present value of an indefinite wage contract w is given by
(5) V(w) = w/r
Disregarding the possibility of loosing the job and becoming unemployed, the expected
value of an acceptable contract is depending on the reservation wage and is given by
(6) x = E(w| w> wR ) = (1 /pa ) � wR w f(w) dw
The present value of such an acceptable and indefinite wage contract is:
(7) V(x) = x/r
As unemployed net income is given by non-labour income y, and unemployment benefits
b, minus the job search costs. Assume there is a fixed cost per time unit of search, e. Then
the net income per period is given by (y + b - et). Starting as unemployed the present
value of expected net income in the future is:
(8) U = (y+b-et)/(1+r) + pe V(x)/(1+r) + (1- pe ) U/(1+r)
Accounting for (7) and solving for U yields:
(9) U = { r(y+b-et) + pe x } / r(r + pe )
Maximising (9) with respect to search effort and taking (1)-(4) into consideration gives
an interior solution t=t*>0. The corresponding present value of expected net income for
all future is given by U=U*. It is, however, optimal to search for a job only if the value of
U* is larger than the present value of expected net income value for t=0, U=U0. If Ut* is
less than U0 the optimal behaviour is not to search at all, but to choose t=0. (Even without
searching, an acceptable offer may arrive.)

8
For any given value of search effort t, the reservation wage wR is determined by the
equality of V(wR ) = U, i.e. for a job offer w = wR the job seeker is indifferent between
staying unemployed or accepting the job. Thus, we obtain
(10) wR = (y+b–et) + (po /r) � wR (1 - F(w)) dw
The value of search is a function of the reservation wage and job offer probability. Both
are influenced by job search effort, which in turn is a function of general demand factors
and individual characteristics.
The above framework suggests that the decision to search actively is basically composed of
two parts. First, the job seeker decides whether or not to search at all. Second, if it is
optimal to search, the job seeker decides on how intensively or on how many hours to
search. In particular, if the decision process for searching-or-not is different from that for
hours of search, it is important to model search behaviour as two separate decisions.4 If
these decisions are driven by different mechanisms analysing search activity and its
determinants as a single decision may lead to misleading (policy) conclusions.
3. KEY FEATURES IN THE NORDIC LABOUR MARKETS
A common notion is that the Nordic labour markets are very similar. Although these
markets do indeed have many features in common, there are also significant differences
regarding both labour market regulations and policies that have been less emphasised in
public discussions. Furthermore, the performance of the Nordic labour markets has
historically been quite different.
From Figure 1, which compares the unemployment rates in four Nordic countries and the
EU average, it can be seen that the labour market tightness has varied considerably over
time and between countries.5 Denmark has a longer history of high unemployment than
the other Nordic countries. Today, however, unemployment is a lesser problem in the
4 The labour supply literature emphasizes the importance of distinguishing between the decisions whether ornot to work and of the number of hours of work supplied; see e.g. Killingsworth (1983).

9
Danish labour market than in most other European countries. Finland had a good track
record in the 1980s, but the exceptionally deep recession in the early 1990s completely
changed the situation. Despite a long period of economic growth the Finnish labour
market still struggles with high unemployment rates.
Unemployment in Norway has remained at relatively low levels, although Norway like
many other countries, experienced a rise in unemployment in the late 1980s and early
1990s. In 1993, the Norwegian unemployment rate reached its peak at a level of 6.1 per
cent only. Until the beginning of nineties, Sweden was admired for her excellent labour
market performance until the beginning of the 1990s. Thus, in the 1980s and early 1990s
unemployment rates stayed around or below three per cent. In 1993 the unemployment
rate rose sharply to 9.1 per cent and has since then remained at relatively high levels.
5 For a more detailed discussion, see Björklund and Eriksson (1996).
Figure 1. Unemployment 1980-2000Nordic countries and EU
Per cent of labour force
0
2
4
6
8
10
12
14
16
18
1980 1982 1984 1986 1988 1990 1992 1994 1996 1998 2000
DenmarkFinlandNorwaySwedenEU

10
As for the unemployment benefit system there are marked differences both in terms of
coverage and benefits between the Nordic countries. Table 1 describes the basic features
of the unemployment insurance system in the Nordic countries.6 In Denmark
participating in the UI-system is voluntary (through membership of unemployment
insurance funds) whereas in Norway insurance is public and compulsory. In 1998 as
many as 83 per cent of the labour force was covered by the UI-system in Denmark. In
Finland and Sweden the UI-system is voluntary as in Denmark but unlike Danish and
Norwegian benefit systems it is complemented by two other systems; a basic
unemployment assistance system and a means tested labour market subsidy.
In order to be eligible for UI-benefit one must fulfil either employment or earnings
condition. In Denmark the unemployed job seeker must have been employd for at least 12
months during last three years to be eligible for the benefit. In Finland (Sweden) 10 (6)
months of employment during two previous years is required for eligibility.7 In Norway a
minimum level of earnings is required which is calculated either from last year (NOK
56,712) or from the previous 3 years (NOK 136,110). A person with average earnings
would need to work for 2.5 months to fulfil the earnings condition in Norway. These
eligibility rules imply that an unemployed job seeker in order to receive UI-benefits has to
a certain extent have been attached to the labour market prior to becoming unemployed.
Due to the relatively strict eligibility rules for UI-benefits, there are members of the UI-
system who do not receive benefits. Among unemployed job seekers about 71–80 per cent
in Sweden, 68–78 per cent in Denmark, 53–73 per cent in Norway, and 45–55 per cent
in Finland receive UI-benefits. In Denmark, Finland, and Sweden these figures also reflect
the fact that not all job seekers are members of the UI-system. In Finland most of those
who are not eligible for UI-benefits can apply for either basic unemployment allowance or
labour market subsidy. In Sweden basic support is an alternative option for the unemployed
6 The year for comparison is chosen to be 1998, which is the year when the survey data for subsequentempirical analyses were collected.7 The employment condition was lifted from 26 to 43 weeks in 1997 to make it more difficult to fulfil it merelythrough participation in labour market programmes. In Finland, basic unemployment allowance has the sameemployment condition for eligibility as the UI-benefit system. If the employment condition is not fulfilled thejob seeker can apply for means-tested labour market subsidy.

11
job seekers. In Denmark and Norway it is the social insurance system that mainly provides
for those not covered by the UI-system.
Table 1. Major features in the unemployment insurance (UI) system, 1998
Denmark Finland Norway SwedenInstitutions Several independent
unemploymentinsurance funds(mostly run by thetrade unions)
Several independentunemploymentinsurance funds(mostly run by thetrade unions)
One public, SocialInsurance Scheme
Several independentunemploymentinsurance funds(mostly run by thetrade unions)
MembershipPer cent of labourforce
Voluntary83 %
Voluntary77 %
Compulsory100 % (of allemployees)
Voluntary90 %
Employment/earnings conditions foreligibility
Employed at least12 months in last 3years
Employed at least10 months, 18hours per week, inlast 2 years
Earnings last yearat least NOK 56712, or NOK 136110 in last 3 years
Employed at least 6months, 70 hoursper month, in lastyear
Coverage amongunemployed (fromlast 5 years)
68–78 % 45–55 % 53–73 % 71–80 %
Waiting days 0 waiting days 7 waiting days 3 waiting days 5 waiting daysLength of benefitperiod
260 weeks 100 weeks 156 weeks 60 weeks(renewable)
Benefit base (R) Average dailyearnings from last12 weeks
Average dailyearnings =0.95*(monthlyearnings) / 21.5,average monthlyearnings from last43 weeks
Annual earningsfrom last year (oraverage last 3years)
Average dailyearnings in last 52weeks
UI-compensationper day (full rate)
90 per cent of R 120 FIM + 42 percent of (R-120FIM)
0,24 per cent of R(compensation rate= 62,4 per cent)
80 per cent of R
Minimum level ofUI
DK 441 FIM 120 -- --
Maximum level ofUI
DK 538 -- NOK 653 SEK 580
Child support No Yes Yes NoSupplementarybenefits
No BasicunemploymentallowanceLabour marketsubsidy
Basic support
Special regulationsfor older jobseekers
From 50+ years ofage UI runs until60.
From 57+ years ofage UI runs until60. Unemploymentpension from 60years onwards. Oldage pension at 65.
From 64+ years ofage UI runs until67.Old age pension at65.
From 57+ years ofage benefit period90 weeks.Old age pension at65.
Notes: Denmark: Regulations refer to January 1998. Employment condition: 52 weeks for full-time insured,34 weeks for part-time insured. Benefit period: Total of 5 years of which maximum 3 years in labour marketprogrammes. Finland: Maximum level of UI: for earnings exceeding FIM 10,800 the compensation is 20 percent. Norway: Regulations refer to May 1998. Benefit period: 78 weeks for those in part-time jobs (annualearnings less than NOK 90,740). Sweden: For further details, see Regnér and Wadensjö (1999). Source:TemaNord (1999).

12
The period for paying UI-benefits is longest in Denmark (260 weeks) and shortest in
Sweden (60 weeks). However, in Sweden attending a labour market programme qualifies
the person to a new benefit period. The Finnish unemployment benefit system is a kind of
a two-tier system due to supplementary benefits available to job seekers. When the UI-
benefit period of 100 weeks has elapsed, the unemployed job seeker can apply for means
tested labour market subsidy, which, if granted, provides a lower benefit level than the
earnings related UI-benefit system but has no time limit.8
The gross replacement ratio is highest in Denmark and lowest in Finland. In Denmark the
basic rule is that UI-benefits equal 90 per cent of previous earnings. Due to the upper
limit of DK 538 per day for the UI-benefit the 90 per cent rule does not, however, apply
for higher earnings; see Figure 2. In Norway the basic rule is that UI-benefits correspond
to 62.4 per cent of previous average earnings, but as in the Danish case, the upper limit of
NOK 653 per day means that this level is not reached by those with higher earnings. The
same is true for the Swedish 80 per cent replacement that only those job seekers with
relatively low earnings receive in full amount. In Finland the replacement ratios are lower;
even at relatively low earnings levels the replacement ratio rarely exceeds 60 per cent.
Figure 2 shows the linkage between previous earnings and UI-benefits (gross replacement
ratios). However, other economic support is also available to unemployed job seekers. In
addition to the UI-benefits family, housing and child-care benefits can be paid to the
unemployed job seekers affecting their incentives to search for a job. The net replacement
rates for families with 2 children vary between 85–95 per cent in Denmark, Finland and
Sweden and in Norway between 73–77 per cent.9 In all four countries the economic
incentives for job search are lowest among the low-income families with children. This
feature is shared with most OECD benefit systems.
8 There are special regulations for ageing unemployed job seekers in all Nordic countries, which make itpossible for them to prolong the UI-benefit period from those mentioned above. Due to these regulationseconomic incentives for job search are not very strong among older job seekers.9 See OECD (1998).

13
The role of labour market policy authorities is crucial in mitigating potential disincentive
effects for job search that the benefit systems may create.10 In the Nordic countries public
employment offices play an integral part in this respect as they administer benefit systems,
inform job seekers about vacant jobs, and choose participants to labour market
programmes. The fact that the administration effectively monitors job search (and there
are sanctions related to the refusal to search for a job) can have substantial incentive
effects on job search among the unemployed. Regular interventions during the
unemployment spell, such as job-search monitoring, intensive interviews, and referrals to
vacant jobs can be regarded as an "activation" strategy that aims at raising the employment
probability of a job seeker. In this respect these measures are complementary to active
labour market programmes.
In the 1990s, new instruments of active job search were introduced and penalties related
to job rejections became tougher in Finland. Job seekers rights and duties were clearly
specified. All job seekers are to be interviewed and individual job search plans should be
10 Holmlund (1998).
Figure 2. Unemployment benefitsCompensation ratios by level of income
Nordic countries, 1998
0
0,1
0,2
0,3
0,4
0,5
0,6
0,7
0,8
0,9
170 75 80 85 90 95 10
0
105
110
115
120
125
130
135
140
145
150
155
160
165
170
175
Daily wage, Euro
Com
pens
atio
n ra
tio
DenmarkFinlandNorwaySweden

14
made at the latest when the unemployment spell is approaching 12 months.11 Job seekers
can loose their benefits for relatively long periods (up to 3 months) if they refuse a job
offer.12
In Norway job seekers will not receive UI-benefits for 8 weeks if they leave their job
voluntary or refuse a job offer or to take part in a labour market programme, or don't
show up for a planned meeting at the employment office. If the rules are broken several
times the sanction may last for up to 26 weeks. The length of the corresponding sanction
period in Denmark is 5 weeks.
The role of labour market policy programmes differs markedly among Nordic countries.
Historically, the total spending on these programmes as of GDP has been highest in
Denmark, where in 1993 it was as high as 7 per cent.13 This is true even today despite the
fact that the unemployment rate in Finland far exceeds the Danish rate. In Sweden total
spending has been at an average EU-level except in the high unemployment year 1993.
Due to the low unemployment, total spending on labour market programmes in Norway
has been lower than EU average (2.5 per cent in 2000).
The importance of active labour market programmes relative to passive measures as
unemployment benefits – measured by the share of active spending of total spending –
varies considerably between the four countries. The share of active spending was relatively
low in Denmark in the 1980s and early 1990s (between 21-25 per cent). In 2000 this
share had risen to 34 per cent. In Sweden active spending peaked in the 1980s reaching
over 70 per cent. In the 1990s with the risen unemployment rates this share fell to 50 per
cent, which was still a high level compared with other countries. In Norway, where the
labour market situation has been rather good, active spending has been at a relatively high
level: in the 1980s around 44–56 per cent and in 2000 as high as 67 per cent. In Finland,
in the 1980s when the labour market situation was good, the share of active spending was
40–46 per cent of the total spending. In early 1990s when the situation deteriorated
dramatically, it was as low as 26 per cent but has increased since then to about a third.
11 For younger job seekers this time limit was six months.12 See Lilja and Savaja (1999).13 See e.g. Martin & Grubb (2001).

15
4. THE SURVEY DATA
The subsequent empirical analysis is based on data from a comprehensive and with only a
few exceptions, identical surveys directed at job seekers in Denmark, Finland and Norway
in 1998. The original samples were drawn randomly from the national unemployment
registers and were subsequently interviewed. The surveys were administered as telephone
interviews. Obtaining a reasonably high response rate may sometimes be a problem in
studies with this type of design. For Finland we were quite successful with a response rate
of 61 per cent. The response rates for Denmark and Norway were 47 and 29, respectively.
The latter is clearly rather low.
The respondents were asked several questions regarding different aspects of their job
search behaviour (JSB), and in particular concerning JSB during the preceding four
weeks. Those no longer unemployed at the time of the interview were asked retrospective
questions about their JSB during the last four weeks of their unemployment period. In
addition the respondents were interviewed about their work values and attitudes, their
experiences regarding the consequences of being unemployed, as well as about
conventional human capital characteristics. The survey also asked about the respondent’s
receipt of unemployment benefits. Further details about the survey and the key findings
for each of the four countries are found in TemaNord (1999).
For each country two separate samples were selected. The stock sample includes persons
who were either openly unemployed14 or in active labour market programmes at the time
of sampling. The flow sample contains those who left the unemployment register during
the period of sampling and interviewing either to begin a job or to exit the labour force. As
long-term unemployment spells are over-represented in stock samples, comparing the two
kind of samples enables us to examine the extent to which the sampling procedure
adopted affects the results of the analysis of job search behaviour. In order to preserve the
14 Note that since the survey did not ask the respondents whether they were temporarily laid off by theirprevious employer, this category cannot be excluded from the two samples.

16
flow samples as real outflow samples, the persons who had re-entered unemployment at
the time of the interview are excluded from the sample.15
St Louis et al. (1986) argue that the choice of sampling design is of utmost importance
when it comes to the analysis of possibly incentive effects of unemployment benefits (UB).
According to them analyses based on data sets including re-employed workers (as we
typically find in our flow samples) will indicate that receiving UB is positively correlated
with job search intensity. In studies based on samples of unemployed only, UB are either
negatively correlated or uncorrelated with job search intensity.16 As we have access both
kinds of samples, we are able to study this design effect.
Job search behaviour
The survey is rich on information concerning different channels of job search, the amount
of job contacts and the time devoted to job search. In the empirical analysis we will – in
addition to job search as such – focus on two measures on job search intensity. The first
one is a job search intensity index, taking on values from 0 to 9 and which aims at
capturing the intensity of search both by the multiple use of job search channels and by
the time input used for job search during the last four weeks. The second measure is
reported hours spent searching (during the same four weeks period), which has also been
used in earlier job search studies; see e.g. Wadsworth (1990) and Barron & Mellow
(1979). The data set enables us to distinguish between two stages in the job seekers'
decision process. In the first stage we assume the job seeker decides whether or not to
search at all. Then conditional on the outcome of this decision, she decides on the
intensity of job search. The construction of the job search indicators is described in
Appendix A. Table 2 presents some key figures on job search behaviour.
15 From the original samples we excluded 25 per cent in Denmark, 13 per cent in Finland and 22 per cent inNorway.16 St. Louis et al. (1986) are also very critical about the use of reported (versus actual) job search among UIrecipients. Their results suggest that UI recipients may engage in substantial over-reporting of their actualsearch efforts when active job search is required for UI benefit eligibility. In the case of the Nordic data sets,this over-reporting could manifest in the stock sample, which includes unemployed job seekers, but not in theflow sample, which includes those who already got a job or exited from the labour market.
17
As can be seen from Table 2 most unemployed search for a job, the proportion is higher in
Norway than in Denmark and Finland, and higher in flow samples than stock samples
(except in Norway). The same pattern can also be seen for the number of search hours
and the search index.
In the survey the respondents were also asked whether they currently were searching
more, less, or with the same intensity as in the beginning of their unemployment spell: see
TemaNord (1999). As is described in Eriksson et al. (1999), 22 to 32 per cent of the
stock samples and 14 to 22 per cent of the flow samples said they were searching less than
before. The corresponding shares for those searching more were 18 top 28 and 19 to 23
per cent for the stock and flow samples, respectively. Clearly the differences in the shares
between the stock and the flow samples are most likely reflecting differences in
unemployment durations. Thus the higher share reporting falling search intensity in the
stock sample may be due to increasing discouragement with increasing duration of
unemployment. In the following empirical analyses we have, unlike for example
Wadsworth (1990), not included the duration of the individual’s unemployment spell as
an explanatory variable since this is obviously not exogenous and we are unable to find an
instrumental variable to help solving the simultaneity problem.
Work values and unemployment experience
The survey has some questions related to general attitudes towards work and the mental
and economic consequences from unemployment. In the empirical analyses we assume
that general attitudes towards work influences the job seeker’s decision whether or not to
search for a job, whereas her intensity of job search is influenced by experienced
consequences from unemployment. This makes it possible to identify subsequent
empirical model specifications for the determinants of job search and job search intensity.
As policy variables we include information on present and former participation in active
labour market programmes and receipt of unemployment benefits. Table A1 in Appendix
A presents some descriptive statistics for the explanatory variables.

18
Table 2. Job search behaviour. Nordic survey 1998. Stock and flow samples. Per centand average values
Denmark Finland Norway
Job search activities, 4weeks period
Stock(N=641)
Flow(n=631)
Stock(n=749)
Flow(n=715)
Stock(n=845)
Flow(n=677)
Search for a job (percent)
62 84 63 89 95.3 92.8
Average hours ofsearch (if hours >0) 10.1 12.8 7.1 10.4 14.0 18.4
Index (0–9 points),average (if search)
3.5 3.8 4.1 4.2 4.6 4.8
Note: The index is defined in Appendix A.
Economic incentives
The economic incentives to search for a job are represented by dummy variables based on
self- reported information regarding whether the individual (1) receives (has received)
unemployment benefits17 – the whole or part of the (present) period of unemployment,
and (2) has experienced economic problems as unemployed. The last indicator is based on
a affirmative answer to the question: “As unemployed, is it / was it a problem to meet an
unexpected bill of an amount equivalent to about 250 Euro?” Those who receive (or
received) unemployment benefits were asked how much they actually receive(d).
The majority of persons in the stock samples were unemployed at the time of the
interview. They were asked about their minimum acceptable wage offer, that is, their
reservation wage. For this subsample we have estimated a wage equation correcting for
selection bias. Next, we predicted the reservation wage for the whole stock sample. The
predicted log reservation wage is used as an explanatory variable in analyses of the stock
samples.
At the time of the interview, most individuals in the flow samples were employed. They
were asked about their wage in their current job. Again, for all individuals in the flow
samples we predict their wages by means of an estimated wage equation in a simultaneous
17 In Denmark and Norway unemployment benefits includes only income related insurance benefits. InFinland it includes both income related benefits, unemployment assistance and labour market subsidy.

19
model correcting for selection bias. The predicted values of the wage are then used as an
explanatory variable in analysis of the flow samples.
To construct a measure of the replacement ratio we use information about individuals’
unemployment benefits, reservation wages and actual wages. For individuals in the stock
sample with UB we define the replacement ratio as reported benefits divided by predicted
reservation wage. For those in the flow sample who received UB while unemployed we
define the replacement ratio as reported benefits divided by predicted wage. For those not
receiving UB the replacement ratio equals zero. The effects of unemployment benefits on
job search intensity may go two ways. On the one hand, search intensity increases because
providing the searcher with benefits subsidizes search effort. On the other hand, the
additional income can also be spent on more leisure. The net effect is of key importance
since if this is positive, this means that possible negative effects of unemployment benefits
on becoming employed via the reservation wage are mitigated.
5. THE EMPIRICAL MODELS
In the theoretical section it was assumed that the job seeker first makes a choice whether
or not to search for a job, and conditional on that choice, she decides upon the intensity of
her job search. In the empirical model for job search, let us first assume that there is a
latent, continuous variable Si* (for person i) that reflects the basic thrift to search for a
job. The model for job search can thus be written as:
(11) Si* = β1’ x i1 + ε i1 ; where ε i1 ~ N (0,1),
where β1 is a parameter vector, xi1 is a vector of explanatory variables for person i and ε i1 is
a normally distributed error term with zero mean and unit variance.
A dichotomous indicator variable Si related to observed job search is defined as:
(12) Si = 1 iff Si*>0 (person i is observed to search for a job);0 otherwise

20
Equations (11) and (12) define a probit model for the dichotomous choice to search for a
job. The intensity of job search is modelled separately from the overall decision to search
for a job.
Let Ii* be a latent variable related to job search intensity. This variable is not directly
observable. Instead an observable job search intensity index Ii is defined.18 This is ordinal
and hence, the values of Ii represent only a ranking order (below from 0 to J), where there
is no significance to the unit distance between these values. Therefore, it is natural to
model the job search intensity as an ordered probit:19
(13) Ii* = β2’ x i2 + ε i2 ; where ε i2 ~ N (0,1)Ii = 0, if Ii* ≤ µ0
1, if µ0 < Ii* ≤ µ1 …
J, if Ii*> µJ-1, where µj ’s are the free parameters to be estimated.
When (Ii, x i2) is estimated conditional on Si =1, it is assumed that [ε i1 , ε i2 ] ~ BVN
[0,0,1,1,ρ12], where ρ12 is the correlation coefficient between ε i1 and ε i2.
Under these conditions this likelihood function provides unbiased and efficient estimators
for the ordered probit model.
Let us next specify an alternative model for job search intensity using hours of search Hi..
As was the case for Si*, a latent, continuous variable Pi* defines the thrift to use positive
hours for job search:
(14) Pi* = β3’ x i3 + ε i3 , where ε i3 ~ N (0, σ32 )
We observe positive hours of search Hi > 0 only if Pi* > 0. When Pi* < 0, Hi = 0 is
observed.
A log-linear regression model for hours of job search, Hi can be defined as follows:
(15) ln Hi = β4’ x i4 + ε i4 , where ε i4 ~ N (0,σ42 )
18 See section 4 and Appendix A for a more detailed description of this index.19 See Greene (2000), pp. 875–879 or McCullagh (1980).

21
When (lnHi, x i4) is estimated conditional on Pi*>0, it is assumed that [ε i3 , ε i4 ] ~ BVN
[0,0,σ3,σ4,ρ34], where ρ34 is the correlation coefficient between ε i3 and ε i4. Under the
condition that Pi* > 0, the expected value of log hours can be written as follows
(16) E [ ln Hi | x i4 , Pi* > 0 ] = E [ln Hi | x i4 , β3’ x i3 + ε i3 > 0 ] =β4’ x i4 + E [ε i4 | ε i3 > - β3’ x i3 ] =β4’ x i4 + ρ34 σ3σ4 {N(β3’ x i3) / M(β3’ x i3)}
where N is the standard normal density function and M the corresponding CDF. The log-
likelihood function for this model can be written as follows:
(17) Ln L =Σ ln M [-β3’ x i3 ] +Hi=0
Σ { -½ln2π - ln σ4-½[(ln Hi - β4’ x i4)/ σ4]2 +Hi>0
ln M [(-β3’ x i3 + (ρ34 /σ4)( ln Hi - β4’ x i4))/(1- ρ34 2)1/2] }
We have assumed that the decision on spending any time at all to search may be different
from – but correlated with – the decision on how many hours to spend. Hence, the hours-
and the selection equations should be estimated simultaneously.
6. ESTIMATION RESULTS
Basic model estimations
To begin with we look at the determinants of the decision to search for a job or not. Table
3 contains estimation results from a probit model including five groups of explanatory
variables: individual characteristics, participation in labour market programmes,
unemployment related factors, attitudes to work, and local labour market indicators.
According to the estimates individual traits have a relatively weak impact on the decision
to search for a job. Gender is a case in point. In Finland and Norway older workers are
less likely to search actively for new employment. This may reflect discouragement and/or
the availability of early retirement options for this group. In the main, the job seeker’s
family status affects her decision to search for a job very little. For Denmark and Finland

22
is there some evidence that job seekers with small children are more inclined not to
search. The magnitude of the marginal effect is not strong, however.
Labour market policy has both a positive and a negative effect on job search. Participating
in a labour market programme while unemployed significantly reduces the propensity to
search for a job both in Denmark and Finland. This is consistent with some earlier
findings that labour market programme participation does not enhance the transition to
employment. On the other hand, previous participation in a labour market programme
appears to have a positive impact on job search later, in particular for the flow sample in
which long-term unemployment spells are relatively rare.20 Thus, labour market
programmes may promote subsequent employment via greater search effort. This
potentially important impact is usually ignored in evaluation studies of labour market
programmes that typically focus exclusively on the short-term impact of programme
participation.
Receipt of unemployment benefits has no influence on Danish job seekers' job search
decision. On the other hand, for the Finnish and Norwegian stock samples we find that
receiving benefits promotes job search.21 This result may be the consequence of at least
two different mechanisms. First, due to the employment condition related to the eligibility
of unemployment benefits people on benefits are on average more attached to the labour
market than those who are not on benefits. Therefore, they also have a higher than
average probability of searching for a job, see e.g. Wadsworth (1990).
20 For the flow sample, which did not include job seekers who were presently in labour market programmes,we used only previous participation in the labour market programmes to measure the programme effects. Theestimated impact is positive in all but one case and significant in two cases. It seems reasonable to interpretthis as a causal relationship.21 In Finland unemployment benefit includes unemployment insurance benefits, unemployment assistance andlabour market subsidy. The results did not change even if we used an indicator of unemployment benefits thatincluded only unemployment insurance benefits.

23
Table 3. Propensity to search for a job – probit estimates
Denmark Finland NorwayExplanatory variablesStock
N=641Flow
N=631Stock
N=749Flow
N=715Stock
N=845Flow
N=N677Individual characteristicsIntercept -0.6423*
(0.3475)1.0746**(0.4238)
-0.8829**
(0.3500)
0.47716(0.4295)
0.6709(0.8114)
-0.4131(0.7329)
Woman -0.2164*(0.1140)
0.2107*(0.1258)
-0.0841(0.1043)
-0.2143(0.1377)
0.3851**(0.1854)
0.0553(0.1654)
Age < 25 -0.0275(0.1782)
0.2640(0.2409)
-0.2523*(0.1460)
-- 0.3545(0.2883)
0.3759(0.4783)
Age > 50 -0.0810(0.2256)
-0.6305(0.1734)
-0.5691***(0.1358)
0.0955(0.2331)
-0.5167**(0.2446)
-0.2091(0.2323)
Basic education only 0.1803(0.2256)
-0.2920(0.3058)
0.0705(0.1149)
-0.0073(0.1642)
-0.2815(0.1982)
-0.5254***(0.1761)
University leveleducation
0.4968**(0.2241)
-0.1224(0.2974)
0.1468(0.1831)
-0.1093(0.1865)
-0.1662(0.2502)
0.2664(0.2617)
Partner 0.1999*(0.1198)
-0.1946(0.1560)
0.0855(0.1113)
0.1828(0.1677)
-0.2914(0.1968)
0.0680(0.1837)
Children -0.2284*(0.1340)
0.0860(0.1514)
-0.0678(0.1564)
-0.2894*(0.1578)
0.0766(0.2360)
0.0478(0.1768)
Labour market programme
Attends now -0.9133***(0.1700)
-- -0.4950***(0.1534)
-- -0.0025(0.2731)
--
Attended previously -0.1462(0.1199)
0.3500**(0.1547)
0.1868(0.1237)
0.1866(0.1646)
0.2912(0.2265)
0.4225*(0.2384)
Unemployment related variables
Receivesunemployment benefit
0.0642(0.1918)
-0.0941(0.1777)
0.2793*(0.1679)
0.1344(0.1835)
0.5832***(0.1933)
0.1223(0.1726)
Have had economicproblems related tounemployment
0.2076*(0.1130)
0.0872(0.1303)
0.2271**(0.1117)
0.1330(0.1427)
0.1444(0.1823)
0.2657*(0.1629)
Was unemployedbefore
0.0740(0.1130)
-0.1263(0.1421)
0.1348(0.1168)
0.2700*(0.1573)
n.a. n.a.
General attitude towards work
It is very important forme to have a job
0.6221***(0.1739)
-0.1994(0.2543)
0.9162***(0.1735)
0.9371***(0.2378)
0.8303***(0.2744)
0.8087**(0.3522)
Even if I won a largesum of money, Iwould continueworking
0.1075(0.1431)
0.3924**(0.1593)
0.1471(0.1200)
0.1954(0.1567)
0.2509(0.2377)
0.3662(0.2640)
Regional indicators No No Yes Yes Yes Yes
Log-likelihoodfunction
-389.19 -267.35 -413.70 -214.89 -125.40 -149.63
P2 74.33*** 26.89** 156.33*** 63.01*** 71.32*** 52.44***
Standard errors are in parentheses. Significance: ***= at 1 %, **=at 5 %, and *=at 10 % significancelevel.

24
Secondly, if active search is a prerequisite for unemployment benefit, and if employment
offices closely monitor job seekers' behaviour, job seekers on benefits may be induced to
over-report their actual search effort when interviewed (St. Louis et al., 1986). The fact
that the positive correlation between unemployment benefit and job search is found only in
the stock sample, and not in the flow sample, supports the latter interpretation. In Finland
and Norway employment offices monitor job seekers quite closely, which may partly
explain country differences in this respect. Job seekers with economic problems due to
unemployment are pushed harder to find a job in all three countries, whereas previous
unemployment experience seems to be of less importance in job search.
In all three countries, the most important single factor affecting the decision to search for
a job is the person’s attitude towards work. Those interviewees for whom "It is very
important for me to have a job" are more likely than others to search for a job. The
marginal effect of this variable is quite strong. Policy implications from this are less
straightforward. Anyway, the result points out that the policy makers cannot ignore the
general attitude towards work in the society.
Search intensity index analysis
Given a positive decision to search for a job, the job seeker next decides on different
methods of search as well as on the intensity of search. In this study a job search index
and hours spent on job search are used as alternative measures for job search intensity.22
The job search index takes on higher values the more channels and the more time job
seeker has used on job search.
Table 4 reports results from the ordered probit model for job search intensity. This is
estimated conditional on job search. It turns out that individual background factors have a
slightly stronger influence on the job search intensity than on the choice of whether to
search at all. In Finland and Norway women search less intensively than men for a job. In
Norway, women had a higher general propensity than men to search for a job.
22 See section 4 of the paper for a further discussion on these measures.

25
In Norway and Denmark job seekers aged over 50 years of age search for a job less
intensively than others. In Finland age appears to have no effect job search effort. This
result should be interpreted against the existing unemployment pension system in Finland.
It seems that institutional arrangements, which allow job seekers to exit from the labour
force, influence the choice of whether or not to search at all. However, once this choice
has been made, they do not appear to have an effect on job search intensity among those
who do search for a job.
Education plays a greater role in the determination of job search intensity than in the
decision to search for a job in the first place. Job seekers with a basic education, even
when active, search less intensively than other educational groups. This effect can be
detected in all three countries. University level education increases job search intensity in
all countries except in Denmark.23
Family circumstances have only a minor impact on job search intensity. The negative
effect of children remains for job search activity in Finland. In Denmark the individual’s
marital status and small children loose their importance as compared to their influence on
decision to search for a job or not. So, it seems that also in the case of family policy, the
major policy challenge is to prevent job seekers with children to stop searching for a job
rather than trying to get them search more intensively.
Labour market programme participation has a positive and significant influence on
contemporaneous job search intensity in Finland only.
In all three countries job seekers who have previously participated in labour market
programmes search more intensively for a job than others. Thus, although a person
participating in labour market programmes does not immediately become a more active
job seeker, the programme induces her later to search more intensively for a job.
Consequently, programme participation appears to keep job seekers more attached to the
labour market.
23 When job search intensity is measured by log hours also in the Danish case university level education has apositive impact on job search.

26
Table 4. Job search intensity index – ordered probit estimates
Denmark Finland NorwayExplanatoryvariables Stock
N=396Flow
N=528Stock
N=749Flow
N=715Stock
N=805Flow
N=628Individual characteristicsWoman 0.0441
(0.1265)0.0934
(0.1104)-0.0936(0.1049)
-0.1598*(0.0939)
-0.3963***(0.0825)
-0.1820*(0.0862)
Age < 25 -0.0422(0.1767)
0.1356(0.1699)
0.0981(0.1439)
-- 0.0077(0.1038)
0.0086(0.1948)
Age > 50 -0.1682(0.1391)
-0.4558***(0.1427)
-0.1053(0.1622)
-0.1478(0.1481)
-0.2257*(0.1380)
-0.2126(0.1420)
Basic education only -0.6589**(0.2602)
-0.2816(0.2136)
-0.2102*(0.1126)
-0.2656**(0.1051)
-0.2109**(0.0929)
0.1031(0.1286)
University leveleducation
-0.4588(0.2831)
-0.0632(0.1874)
0.3061*(0.1737)
0.1564(0.1239)
0.2826**(0.1134)
0.4381***(0.1174)
Partner -0.1088(0.1292)
0.0102(0.1190)
0.0839(0.1139)
-0.0030(0.1111)
0.2004**(0.0827)
0.0591(0.0929)
Children 0.1221(0.1445)
-0.0962(0.1141)
-0.1147(0.1369)
-0.2815***(0.0988)
-0.0099(0.0901)
-0.0627(0.0901)
Labour market programmeAttends now 0.4938
(0.3333)-- 0.4042**
(0.1692)-- -0.0647
(0.1152)--
Attended previously 0.0899(0.1220)
0.3045**(0.1369)
0.2193*(0.1132)
0.4372***(0.1052)
-0.0487(0.0865)
0.1810*(0.1075)
Unemployment experience related variablesReceivesunemploymentbenefit
0.1308(0.1935)
0.3973***(0.1329)
-0.1116(0.1701)
-0.3713***(0.1206)
-0.0910(0.0935)
-0.0386(0.0944)
Have had economicproblems related tounemployment
0.0310(0.1224)
-0.0031(0.1012)
0.0436(0.1134)
0.2078**(0.0904)
0.0510(0.0779)
0.0843(0.0910)
Was unemployedbefore
-0.1935(0.1113)
-0.3475***(0.1069)
-0.0437(0.1170)
-0.0698(0.1006)
n.a. n.a.
Consequences from unemploymentSuffered fromloosing contact withprevious colleagues
0.3374***(0.1062)
0.2518***(0.0941)
0.1311(0.1075)
0.1928**(0.0884)
0.2887***(0.0766)
0.4608***(0.0863)
Got health problems 0.0819(0.1667)
0.2687(0.1462)
-0.0892(0.1283)
0.1374(0.1327)
0.0563(0.0886)
0.2803**(0.1135)
Enjoyed freedom -0.3295**(0.1337)
0.1394(0.1082)
-0.3240***(0.1240)
-0.1191(0.1100)
-0.0426(0.1007)
-0.2675**(0.1245)
Sample selectionterm
-0.9892**(0.4803)
0.6199(0.8235)
-0.6225***(0.1826)
-0.6173***(0.2270)
-2.0859***(0.5578)
-1.5624***(0.5744)
Regional indicators No No Yes Yes Yes Yes
Log-likelihoodfunction
-742.90 -999.72 -1266.13 -1416.85 -1597.46 -1242.03
P2 45.79*** 59.48*** 4.70** 5.19** 108.69*** 118.16***
Standard errors in parentheses. Significance: ***= at 1 %, **=at 5 %, and *=at 10 % significance level.

27
In Denmark those on unemployment benefits search more intensively for a job than
others. Unemployment benefits did not have any effect on the decision whether or not to
search at all suggesting that the monitoring system related to unemployment benefits does
not produce over-reporting of job search in Denmark. Therefore, one could argue that
receiving unemployment compensation is more or less related to a higher than average
labour market attachment in Denmark. This is then reflected in higher than average job
search intensity.
In Finland, on the other hand, the share of those reporting that they had searched for a
job was higher than average among currently unemployed job seekers (stock sample) who
received unemployment benefits. Table 4 shows that among those job seekers, who had
completed their unemployment spells (flow sample), receiving unemployment benefits
reduces job search intensity. These differences emphasise the point made by St. Louis et
al. (1986) about the importance of the sample design. Over-reporting of job search may
occur if unemployed job seekers are monitored closely by labour authorities. However,
those who have completed their unemployment spells have no incentives to over-report.
The Finnish results suggest that unemployment benefits have negative incentive effects for
active job search but these effects seem to be restricted to those job seekers that still
actively search for a job.
Some earlier studies have looked into how previous unemployment experience, and the
duration thereof, affect current duration; see e.g. Corak (1993). It is, therefore, of some
interest to examine whether job search intensity is affected too, as this is one mechanism
that might generate occurrence and duration dependence. Another mechanism is
stigmatisation, which for a given search intensity leads to a lower job offer probability. We
find that prior unemployment experience and economic problems during unemployment
are not particularly important factors for job search intensity.24 In contrast, job search
intensity is strongly influenced by different consequences from unemployment. Our results
suggest that persons, who consider the lost contacts with previous colleagues as a major
problem, put forth more search effort to find a new job than those who do not feel this way.
24 The significant and negative coefficient to previous unemployment in the Danish flow sample may be due tothe fairly high proportion of temporary lay-offs among the Danish unemployed; see Jensen and Westergård-Nielsen (1990). Temporarily laid off workers, especially if they have experienced it before, are for obviousreasons less inclined to search.

28
Not surprisingly, those who expressed that they enjoyed their increased freedom while
unemployed, search less intensively for employment than others. Health problems related to
unemployment spell do not have a strong impact on the search behaviour. Only in Norway
do those who experienced health problems search more actively for a job than others.
An interesting finding related to the correlation between unobservable factors affecting the
decision to search for a job and job search intensity is given by the sample selection term.25
At first glance the results look surprising as they suggest that a job seeker who decides to
search for a job searches less intensively than a job seeker drawn at random would have
searched. One possible explanation to this result may be that job seekers, for whom it is
easy to signal about their unobservable abilities to potential employers, are more likely to
search for a job. At the same time they do not need to search as intensively as those who
have difficulties in this respect. Thus, if a person has qualities that make her more likely to
search for a job, in order to search successfully, she does not need to put forth as much
effort as others.
Search hours analysis
When job search intensity is measured by the logarithm of the hours of search, the
estimates, which are set out in Table 5, remain largely the same as above. This reflects the
fact the variation in the job search index is largely driven by variation in the number of
search hours and that individuals that make use of several methods of search of course
also spend relatively more time searching. The only notable differences in the estimates
refer to education. According to Table 4, persons with a basic education only have lower
job search intensity scores than other job seekers. When the intensity is measured by
hours spent searching, the differences are, however, smaller. This is probably due to less
educated persons using fewer channels in their job search.
25 For Finland the sample selection term is the correlation coefficient between the error terms in the probitequation for job search and in the ordered probit equation, which were estimated simultaneously. ForDenmark and Norway the sample selection term is the inverse of Mills ratio calculated first from the probitequation for job search and added then as an additional variable in the ordered probit equation.

29
The sample selection term in each case refers to the correlation coefficient between the
error terms in the selection equation for positive hours of search and in the log-hours
equation. However, there were only a few observations for zero hours in the Danish and
Norwegian samples and this may explain why the sample selection terms for Norway
attached an estimate close to one and for Denmark the estimates equalled one, and hence
the model was re-estimated without correcting for selection.
Alternative measures for the impact of unemployment benefits on job search
Next we briefly discuss some results from estimations using other measures for the impact
of unemployment benefits than the binary indicator used above. Firstly, the unemployment
benefit indicator is interacted with dummy variables for whether the job seeker is a
woman, is over 50 years of age, and has a university level education. It is possible that the
incentive effects of unemployment benefits for both women, who have greater care
responsibilities in the household, and older job seekers, who have the option of early
retirement, differ from those of the other job searchers. It has also been argued that
persons with higher earnings power (with a university education) have different search
behaviour than others; see Hughes, Peoples and Perlman (1996).
Secondly, the replacement ratio is entered as an additional explanatory variable.26
However, as was shown in section 3 above, in the Nordic countries the variation in
unemployment benefits are strongly correlated with variation in previous income, and
hence, so is the variation in replacement ratios, too. Consequently, we have distinguished
between the effect of wages and unemployment benefits by estimating the model with
log(wages) and log(benefits) as separate regressors.
26 For a description of how the replacement ratios are constructed, see section 4 above.

30
Table 5. Job search intensity measured by log(hours)
Denmark Finland NorwayExplanatory variablesStock
N=641Flow
N=631Stock
N=749Flow
N=715Stock
N=845Flow
N=677Individual characteristicsIntercept 0.5028*
(0.2624)1.1144***(0.3112)
1.9081***(0.4999)
3.2695***(0.3703)
3.5406***(0.4556)
3.0163***(0.5951)
Woman -0.2250*(0.1150)
0.0550(0.1148)
-0.2160*(0.1157)
-0.1732(0.1238)
-0.2670**(0.1048)
-0.4440***(0.1466)
Age < 25 0.2376(0.1905)
0.0113(0.1960)
0.0586(0.1624)
-- -0.1500(0.1363)
0.1903(0.3316)
Age > 50 -0.2301(0.1396)
-0.4120**(0.1642)
-0.1775(0.1906)
-0.1581(0.2073)
0.1080(0.1833)
-0.2952(0.2406)
Basic education only -0.0967(0.3124)
-0.2224(0.2510)
0.0161(0.1221)
-0.2461*(0.1449)
-0.0425(0.1379)
-0.4412**(0.1844)
University leveleducation
0.2270*(0.1160)
-0.0257(0.2390)
0.5946***(0.1718)
0.1709(0.1587)
0.3225(0.1462)
0.8373***(0.1920)
Partner 0.1238(0.1235)
0.0196(0.1441)
-0.0693(0.1296)
-0.0173(0.1362)
-0.0426(0.1093)
0.0874(0.1581)
Children 0.1222(0.1373)
-0.1553(0.1366)
0.0163(0.1703)
-0.0515(0.1509)
-0.1513(0.1248)
-0.1489(0.1524)
Labour market programmeAttends now -0.0607
(0.1739)-- 0.2805
(0.1909)-- -0.0691
(0.1492)--
Attended previously 0.2386*(0.1123)
0.3889***(0.1215)
0.3005**(0.1265)
0.4182***(0.1475)
0.1138(0.1106)
0.4831***(0.1700)
Unemployment experience related variablesReceives unemploymentbenefit
0.6334***(0.1976)
0.5884***(0.1620)
0.0606(0.2022)
-0.3043**(0.1424)
-0.0138(0.1122)
0.1730(0.1583)
Have had economicproblems related tounemployment
0.2474**(0.1131)
-0.0090(0.1200)
-0.0389(0.1474)
0.1054(0.1286)
0.1528(0.1008)
0.3965***(0.1406)
Was unemployed before -0.0006(0.1180)
-0.3633***(0.1259)
-0.1197(0.1270)
-0.1910(0.1434)
n.a. n.a.
Consequences from unemploymentSuffered from loosingcontact with previouscolleagues
0.1045**(0.0511)
0.0781(0.1171)
0.3640***(0.1241)
0.0808(0.1161)
0.2183 **(0.0996)
0.2930***(0.1090)
Got health problems -- -- -0.0491(0.1643)
0.0506(0.1773)
0.1583(0.1159)
0.2789**(0.1434)
Enjoyed freedom -0.3581***(0.2661)
-- -0.2804*(0.1683)
-0.0251(0.1670)
-0.1881(0.1303)
-0.2837**(0.1465)
Sample selection term, n.c. n.c. -0.1097(0.3689)
-0.2293(0.4139)
-0.3240(0.2327)
0.9770***(0.0174)
Regional indicators No No Yes Yes Yes Yes
Log-likelihood function -1073.55 -1074.23 -1031.05 -1167.91 -1374.91 -1143.46
P2 42.27*** 44.76*** n.a. n.a. 59.36*** 96.03***
Standard errors in parentheses. Significance: ***= at 1 %, **=at 5 %, and *=at 10 % significance level.

31
Table 6. Effects of unemployment benefits on job search. Alternative probit modelspecifications. Selected results
Denmark Finland Norway Model Stock Flow Stock Flow Stock Flow1. Binary indicator forunemployment benefitplus interaction terms
N=641 N=631 N=749 N=715 N=845 N=677
Receives unemploymentbenefit(UB)
-0.0242(0.4440)
-0.3382(0.3568)
0.4822**(0.2459)
-0.1840(0.3042)
0.5778*(0.3025)
0.3740(0.2673)
Woman -0.2798(0.4047)
0.9804***(0.3740)
0.4680(0.3126)
-0.2436(0.3074)
-0.0150(0.2674)
0.2058(0.2872)
Age > 50 0.0803(0.4403)
-0.3491(0.4325)
-1.1234*(0.6642)
-0.3379(0.4385)
0.1525(0.4339)
0.1715(0.4738)
University level education 0.3341(0.4500)
-0.8553*(0.4539)
-0.3977(0.5598)
-0.6485**(0.3276)
0.1083(0.4134)
0.7539(0.5478)
UB* Woman 0.0647(0.4228)
-0.8775**(0.3961)
-0.6193*(0.3277)
0.0225(0.3440)
0.8668**(0.3964)
-0.2177(0.3465)
UB* Age > 50 -0.1722(0.4228)
0.3767(0.4617)
0.5878(0.6694)
0.6058(0.5130)
-0.9191*(0.4744)
-0.5097(0.5269)
UB* University leveleducation
0.1751(0.4224)
0.8533**(0.4042)
0.6199(0.5860)
0.7903**(0.3944)
-0.3676(0.5106)
-0.6781(0.6081)
2. Binary UB-indicatorand replacement ratio
N=287 N=499 N=534 N=544 N=845 N=677
Receives unemploymentbenefit (UB)
0.0988(0.0775)
-0.0056(0.3348)
-- -- 0.7415***(0.2683)
-0.0522(0.2122)
Replacement ratio 0.1122(0.2443)
0.2246(0.5673)
0.1336(0.3840)
0.2538(0.5625)
-0.5069(0.5731)
0.4688(0.3504)
3. Binary UB-indicator,log(wages) andlog(benefits)
N=641 N=631 N=749 N=715 N=845 N=677
Receives unemploymentbenefit (UB)
0.1867(0.1104)
-0.0107(0.5456)
-0.0176(0.0656)
0.2284(0.2979)
1.7362*(1.0370)
-0.0300(0.2698)
Log(wages) -0.3382(0.7763)
0.3128(0.6583)
-0.1317(0.2650)
-0.7851*(0.4370)
-1.4773(1.0558)
2.1867(1.4978)
Log(benefits) -0.2111(0.5739)
0.0230(0.0888)
0.0193***(0.0072)
-0.0114(0.0329)
-0.1486(0.1285)
0.0195(0.0325)
Standard errors in parentheses. Significance: ***= at 1 %, **=at 5 %, and *=at 10 % significance level.
All three models presented in the table include the same other explanatory variables as the modelpresented in Table 3.
Table 6 gives estimation results for the probit model for whether the individual searches or
not. Only estimates related to unemployment benefit variables and the main effects are
presented. The results differ considerably across the countries. A common feature is that
unemployment benefit receipt tends to increase the propensity to search, but the effects
vary somewhat across countries and worker groups. Thus, for instance Finnish women
receiving unemployment benefits are less likely to search, whereas Norwegian women are
more inclined to search. The probability that a jobseeker with a university education is
actively searching is higher if she receives unemployment benefits. In general the main

32
effects are unchanged as compared to the results in Table 3. Consequently, it seems that
using different measures for unemployment benefits that take into account the level of
benefits do not add much to the picture already obtained.
Table 7. Effects of unemployment benefits on job search intensity measured by anindex. Alternative ordered probit models with correction for selection. Selected results
Denmark Finland NorwayModel Stock Flow Stock Flow Stock Flow1. Binary indicator forunemployment benefitplus interaction terms
N=396 N=631 N=749 N=715 N=805 N=628
Receives unemploymentbenefit (UB)
0.1546(0.0898)
0.2434**(0.1143)
-0.3693(0.2317)
-0.2251(0.1917)
0.0819(0.1273)
0.0220(0.1649)
Woman 0.0768(0.2100)
0.1328(0.1993)
-0.6313*(0.3490)
-0.0622(0.2248)
-0.2546**(0.1250)
-0.0646(0.1630)
Age > 50 -0.1654(0.1445)
-0.2776**(0.1350)
-0.1263(0.1644)
-0.2297(0.4133)
-0.4301*(0.2515)
-0.4008(0.2674)
University level education -0.4455*(0.2398)
0.1124(0.1896)
0.8536(0.6548)
0.5157*(0.2937)
0.6317***(0.1996)
0.3726*(0.2159)
UB* Woman 0.3660(0.4453)
0.2164(0.3275)
0.5801(0.3602)
-0.1129(0.2400)
-0.2159(0.1575)
-0.1631(0.1904)
UB* Age > 50 0.0984(0.1286)
0.08863(0.1357)
-- 0.0771(0.4539)
0.1904(0.2708)
0.2365(0.3130)
UB* University leveleducation
0.6548*(0.3317)
0.3427(0.1889)
-0.5828(0.6627)
-0.4590(0.3185)
-0.5228**(0.2708)
0.0978(0.2476)
2. Binary UB indicatorand replacement ratio
N=287 N=499 N=534 N=544 N=805 N=628
Receives unemploymentbenefit (UB)
0.0994(0.2037)
0.3348**(0.1488)
-- -- -0.1686(0.1182)
-0.1328(0.1073)
Replacement ratio 0.2239(0.2785)
0.0982(0.1642)
0.0601(0.2721)
0.2573(0.3355)
0.2692(0.2411)
0.2345*(0.1266)
3. binary UB indicator,log(wages) andlog(benefits)
N=396 N=631 N=749 N=715 N=805 N=628
Receives unemploymentbenefit (UB)
1.4536(1.629)
-1.629(1.163)
-0.0491(0.2127)
-0.3750**(0.1871)
-0.3917**(0.1859)
-0.2326(0.1511)
Log(wages) 0.2991*(0.15992)
0.490(4.515)
-0.0200(0.8143)
-1.2174***(0.2888)
0.6272(0.6340)
0.2140(0.8165)
Log(benefits) -0.1476(0.1875)
0.214*(0.123)
-0.0121(0.0252)
0.0013(0.0196)
0.0387*(0.0216)
0.0287(0.0179)
Standard errors in parentheses. Significance: ***= at 1 %, **=at 5 %, and *=at 10 % significance level.All three models presented in the table include the same other explanatory variables as the modelpresented in Table 3.

33
Tables 7 and 8 contain corresponding estimates for the job search intensity index and the
number of search hours, respectively. In the main the story line does not change:
measuring unemployment benefits in different ways do not change the picture given
earlier regarding the incentive effects of unemployment benefits in the three countries. For
the job search index the main effect for gender now becomes more pronouncedly negative.
This is to be expected as female workers entitled to unemployment benefits have a
stronger attachment to the labour market. Otherwise most of the interactions or variable
decompositions produce insignificant estimates. So, there is not much worth airing here.
Table 8. The effect of unemployment benefits on the log(hours) of job search.Alternative OLS models with correction for selection. Selected results
Denmark Finland NorwayModel
Stock Flow Stock Flow Stock Flow1. Binary indicator forunemployment benefit plusinteraction term
N=641 N=631 N=749 N=715 N=845 N=677
Receives unemploymentbenefit (UB)
0.1396(0.2114)
0.2243*(0.1217)
-0.14201(0.2732)
-0.0865(0.2271)
0.0924(0.1630)
0.5029*(0.2624)
Woman -0.1669(0.2437)
0.0554(0.5447)
-0.5320(0.4446)
0.0840(0.2853)
-0.2638(0.1695)
-0.0512(0.2705)
Age > 50 -0.0898(0.1432)
-0.1002(0.3986)
-0.1771(0.1882)
-0.5215(0.4992)
0.3855(0.3892)
-0.1897(0.4596)
University level education 0.1226(0.2372)
0.0065(0.2178)
0.4828(0.5939)
0.5562*(0.3446)
0.7326***(0.2531)
0.8119**(0.3495)
UB* Woman 0.2764(0.1400)
0.2008(0.3363)
0.3482(0.4704)
-0.3053(0.3044)
-0.0049(0.2026)
-0.5533*(0.3177)
UB* Age > 50 0.06549(0.1273)
0.1298(0.4334)
-- 0.3867(0.5200)
-0.3298(0.4120)
-0.1700(0.5288)
UB* University level education 0.1841(0.4539)
0.0777(0.2439)
0.1184(0.6158)
-0.4874(0.3910)
-0.5813**(0.2957)
0.0373(0.4065)
2.Bbinary UB-indicator andreplacement ratio
N=287 N=499 N=534 N=544 N=845 N=677
Receives unemploymentbenefit (UB)
0.2242*(0.1213)
0.1279(0.1454)
-- -- -0.0563(0.1428)
0.0165(0.1452)
Replacement ratio 0.0876(0.2393)
-0.1998(0.4584)
0.0141(0.3043)
-0.3713(0.3876)
0.1505(0.3173)
0.1800(0.1940)
3. Binary UB-indicator,log(wages) and log(benefits)
N=641 N=631 N=749 N=715 N=845 N=677
Receives unemploymentbenefit (UB)
-0.1177(0.3219)
-0.0962(0.3233)
-0.2475(0.2108)
-0.08463(0.2865)
-0.1159(0.2395)
-0.2263(0.2213)
Log(wages) 1.0047(1.9654)
-0.1667(0.4499)
-1.1133(0.9101)
-0.2946(0.5493)
2.3054***(0.8548)
0.7636(1.2148)
Log(benefits) 0.0099(0.2065)
0.0663(0.2278)
0.0646***(0.0241)
-0.0312(0.0335)
0.0092(0.0298)
0.0452*(0.0275)
Standard errors in parentheses. Significance: ***= at 1 %, **=at 5 %, and *=at 10 % significance level.All three models presented in the table include the same other explanatory variables as the modelpresented in Table 3.

34
7. CONCLUSIONS
In summary, the main findings of our study are that:
(i) There are rather big differences between the three countries with respect to therelative importance of the determinants of job search intensity. This may tosome extent reflect the different levels of demand during the late nineties inthe countries studied.
(ii) Unemployment benefit recipients are more likely to search actively in Finlandand Norway. This is consistent with non-claimants being less attached to thelabour market. On the other hand, given positive search unemploymentbenefits do not seem to affect the extent the workers searches; neither thenumber of channels used nor the time spent on job search. So, there is nosupport for neither the view that unemployment benefits subsidise searcheffort, nor that the additional income is spent on leisure in stead of search.
(iii) As for individual characteristics, there is evidence of gender and agedifferences: women spend less time on job search and elderly workers are lesslikely to search and when they do, they use fewer channels of and less time onsearch.
(iv) Marital status and the presence of dependents have only small effects onsearch intensity. Having small children is associated with a lower probabilitythat the person searches at all. But among those who search, the intensity isunaffected by marital status and having small children. Thus, there is littlesupport for the notion of breadwinners having stronger incentives to search.
(v) Regarding labour market policy programmes we find that participation doesdecrease the probability of job search – but not the job search intensity.However, previous programme participation does increase the likelihood ofactive job search as well as its intensity. This is especially true for the flowsamples.
(vi) Not surprisingly, general positive attitudes to work are positively related to jobsearch. The economic and other consequences of joblessness affect theintensity of search, too. Thus, those who miss having work colleagues searchmore actively than others. Likewise those who report having economicproblems as a consequence of their unemployment also spend more time onand use more channels for their job search.
(vii) The replacement ratio of unemployment benefits and its components do notseem to influence the intensity of individuals’ search. Interestingly, these twolatter findings suggest that the replacement ratio may not be a good measureof the economic hardship individuals are suffering as a consequence ofunemployment.

35
REFERENCES
Albrecht, J., B. Holmlund and H. Lang (1989), Job Search and Youth Unemployment: Analysis ofSwedish Data, European Economic Review, Papers and Proceedings.
Barron, J. and O. Gilley (1979), The Effect of unemployment Insurance on the Search Process,Industrial and Labor Relations Review, 32, 363–366.
Barron, J. aqnd O. Gilley (1981), Job Search and Vacancy Contacts: Note, American EconomicReview, 71, 747–752.
Barron, J. and Mellow, W. (1979), Search effort in the labour market, Journal of HumanResources, 14, 389–404.
Barron, J. and Mellow, W. (1981), Change in the labour force status among the unemployed,Journal of Human Resources, 16, 427–441.
Ben-Harim, M. and Zuckerman, D. (1987), The effect of unemployment insurance onunemployment duration, Journal of Labour Economics, 5, 386–390.
Björklund, A. and T. Eriksson (1996), Unemployment in Nordic Countries: Introduction andSummary, in Eskil Wadensjö (ed.), The Nordic Labour Markets in the 1990's, Part 1, Amsterdam,North-Holland, pp. 3–16.
Chirinko, R. (1982), An Empirical Investigation of the Returns to Job Search, American EconomicReview, 72, 498–501.
Corak, M. (1993), Is Unemployment-Insurance Addictive – Evidence from the Benefit Durationsof Repeat Users, Industrial and Labor Relations Review, 47, 62–72.
Devine, T. & N. Kiefer (1991), Empirical Labor Economics. The Search Approach. OxfordUniversity Press.
Eriksson, T., Jensen, P. and Pedersen, P. (1999), Søgeadfœrd og søgestrategier i de nordiskelande, in TemaNord (1999), Dagpengesystemene i Norden og tilpasning på arbeidsmarkedet,TemaNord 1999:572, Copenhagen: Nordisk ministerråd, pp. 117–146.
Greene, W. H (2000), Econometric Analysis, Fourth Edition, Prentice Hall, New Jersey.
Holmlund, B. (1998), Unemployment Insurance in Theory and Practice, Scandinavian Journal ofEconomics, 100, 113–141.
Holzer, H. (1988), Search Method Use by Unemployed Youth, Journal of Labor Economics, 6, 1–20.
Hughes, J.J., J. Peoples and R. Perlman (1996), The differential impact of unemploymentinsurance on unemployment duration by income level, International Journal of Manpower, 17, 18–33.
Jensen, P. and N. Westergård-Nielsen (1990), Temporary Layoffs, in: J. Hartog, G. Ridder and J.Theeuwes (eds.), Panel Data and Labor Market Studies. North-Holland, Amsterdam
Killingsworth (1983), Labor Supply. Cambridge University Press, Cambridge
36
Lilja, R. and E. Savaja (1999), Översikt över systemet för arbetslöshetsskydd i Finland (Anoverview of the unemployment benefit system in Finland), The Research Institute of the FinnishEconomy ETLA, Discussion Papers, No. 680.
Lindeboom, M. and J. Theeuwes (1993), Search, Benefits and Entitlement, Economica, 60, 327–346
Lynch, L. (1983), Job Search and Youth Unemployment, Oxford Economic Papers, 35, 271–282
Martin, P.J. and D. Grubb (2001), What works and for whom: A review of OECD countries'experiences with active labour market policies, Paper presented at the IFAU conference "What arethe effects of active labour market policy", October 8, 2001, Stockholm.
McCullagh, P. (1980), Regression Models for Ordinal Data, Journal of Royal Statistical Society, B,42, 109–142.
Mortensen, D.T. (1977), ”Unemployment and Job Search Decisions.” Industrial and LaborRelations Review, 30, 505–17.
Moylan, S., J. Millar and R. Davies (1982), Unemployment – Ten Year After, Employment Gazette,90, 334–340.
OECD (1998), Benefit Systems and Work Incentives, OECD Publications, Paris.
Pedersen, P.J. & N. Westergård-Nielsen (1998), Unemployment: What do we know fromlongitudinal data? In: T. Lange (ed.) Unemployment in theory and practice.. Cheltenham: EdwardElgar
Regnér, H. and Wadensjö, E. (1999), Arbetsmarknadens funktionssätt i Sverige. En beskrivningbaserad på nya intervjudata. Institutet för social forskning, Stockholm
Rosenfeld, C. (1977), Job Search of the Unemployed, Monthly Labor Review, 90, 1187–1211.
Salant, S. (1977), Search Theory and Duration Data, Quarterly Journal of Economics
St Louis, R., Burgess, P. and Kingston, J. (1986), Reported vs. actual job search by unemploymentinsurance claimants, Journal of Human Resources, 21, 92–117.
Tannery, F. (1983), Search effort and unemployment insurance reconsidered, Journal of HumanResources, 18, 432–440.
TemaNord (1999), Dagpengesystemene i Norden og tilpasning på arbeidsmarkedet, NordiskMinisterråd, TemaNord 1999:572, Copenhagen.
Wadsworth, J. (1990), Unemployment Benefits and Search Effort in the UK Labour Market,Economica, 58, 17–34.

37
APPENDIX A
Indicators of JSB
Three indicators of job search behaviour are used; one for “searching or not” and two for
search intensity:
(a) Search: a dummy variable indicating whether or not the unemployed person didsearch for a job during the last 4 weeks (of the unemployment period).
(b) Hours: the number of hours spent on job search during the last 4 weeks (of theunemployment period).
(c) Index: a measure of search intensity taking on values 0,1,2 … 8,9, based on searchactivities and time spent on searching during the last 4 weeks (of the unemploymentperiod). The index is defined as follows:
Activity/channel:
- has read advertisements- has responded to (answered) advertisements- has contacted the public employment service- has contacted potential employers- has contacted temporary employment agencies etc.- has asked friends, colleagues etc for a job- time used for job search:1–5 hours6–20 hours more than 20 hours
Points
111111
123
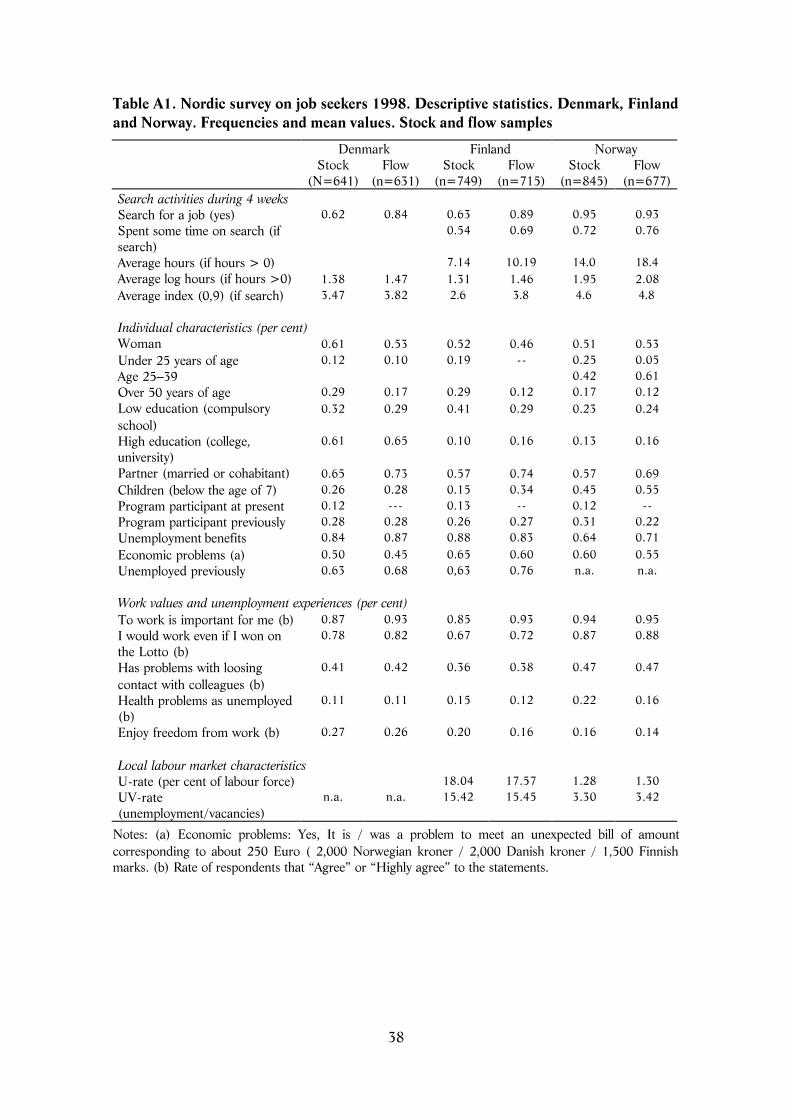
38
Table A1. Nordic survey on job seekers 1998. Descriptive statistics. Denmark, Finlandand Norway. Frequencies and mean values. Stock and flow samples
Denmark Finland NorwayStock
(N=641)Flow
(n=631)Stock
(n=749)Flow
(n=715)Stock
(n=845)Flow
(n=677)Search activities during 4 weeksSearch for a job (yes) 0.62 0.84 0.63 0.89 0.95 0.93Spent some time on search (ifsearch)
0.54 0.69 0.72 0.76
Average hours (if hours > 0) 7.14 10.19 14.0 18.4Average log hours (if hours >0) 1.38 1.47 1.31 1.46 1.95 2.08Average index (0,9) (if search) 3.47 3.82 2.6 3.8 4.6 4.8
Individual characteristics (per cent)Woman 0.61 0.53 0.52 0.46 0.51 0.53Under 25 years of age 0.12 0.10 0.19 -- 0.25 0.05Age 25–39 0.42 0.61Over 50 years of age 0.29 0.17 0.29 0.12 0.17 0.12Low education (compulsoryschool)
0.32 0.29 0.41 0.29 0.23 0.24
High education (college,university)
0.61 0.65 0.10 0.16 0.13 0.16
Partner (married or cohabitant) 0.65 0.73 0.57 0.74 0.57 0.69Children (below the age of 7) 0.26 0.28 0.15 0.34 0.45 0.55Program participant at present 0.12 --- 0.13 -- 0.12 --Program participant previously 0.28 0.28 0.26 0.27 0.31 0.22Unemployment benefits 0.84 0.87 0.88 0.83 0.64 0.71Economic problems (a) 0.50 0.45 0.65 0.60 0.60 0.55Unemployed previously 0.63 0.68 0,63 0.76 n.a. n.a.
Work values and unemployment experiences (per cent)To work is important for me (b) 0.87 0.93 0.85 0.93 0.94 0.95I would work even if I won onthe Lotto (b)
0.78 0.82 0.67 0.72 0.87 0.88
Has problems with loosingcontact with colleagues (b)
0.41 0.42 0.36 0.38 0.47 0.47
Health problems as unemployed(b)
0.11 0.11 0.15 0.12 0.22 0.16
Enjoy freedom from work (b) 0.27 0.26 0.20 0.16 0.16 0.14
Local labour market characteristicsU-rate (per cent of labour force) 18.04 17.57 1.28 1.30UV-rate(unemployment/vacancies)
n.a. n.a. 15.42 15.45 3.30 3.42
Notes: (a) Economic problems: Yes, It is / was a problem to meet an unexpected bill of amountcorresponding to about 250 Euro ( 2,000 Norwegian kroner / 2,000 Danish kroner / 1,500 Finnishmarks. (b) Rate of respondents that “Agree” or “Highly agree” to the statements.