determining a wacc estimate for port of melbourne
TRANSCRIPT

Determining a WACC estimate for Port of Melbourne
A report prepared in context of the Pricing Order for the 2019-20 Tariff Compliance Statement
May 2019
Synergies Economic Consulting Pty Ltd www.synergies.com.au

Disclaimer
Synergies Economic Consulting (Synergies) has prepared this report exclusively for the use of the
party or parties specified in the report (the client) for the purposes specified in the report
(Purpose). The report must not be used by any person other than the client or a person authorised
by the client or for any purpose other than the Purpose for which it was prepared.
The report is supplied in good faith and reflects the knowledge, expertise and experience of the
consultants involved at the time of providing the report.
The matters dealt with in this report are limited to those requested by the client and those matters
considered by Synergies to be relevant for the Purpose.
The information, data, opinions, evaluations, assessments and analysis referred to in, or relied
upon in the preparation of, this report have been obtained from and are based on sources believed
by us to be reliable and up to date, but no responsibility will be accepted for any error of fact or
opinion.
To the extent permitted by law, the opinions, recommendations, assessments and conclusions
contained in this report are expressed without any warranties of any kind, express or implied.
Synergies does not accept liability for any loss or damage including without limitation,
compensatory, direct, indirect or consequential damages and claims of third parties, that may be
caused directly or indirectly through the use of, reliance upon or interpretation of, the contents
of the report.

DETERMINING A WACC ESTIMATE FOR PORT OF MELBOURNE 31/05/2019 12:05:00 Page 3 of 296
Snapshot
The table below provides a short summary of the reasons for the difference between the
weighted average cost of capital estimate Synergies has calculated for the 2019-20 Tariff
Compliance Statement (TCS) compared to the estimate calculated for the 2018-19 TCS.
One significant departure from the approach adopted in the 2018-19 TCS is the adoption
of a WACC range.
Chapter Element 2018-19 TCS 2019-20 TCS
WACC estimate
11.52% Point estimate of 10.46% from a range of 10.07% to 10.92%. We have adopted a range based on variations in the MRP and asset beta.
2 WACC formulation
Pre-tax nominal as required by the Pricing Order
No change
3 One or a combination of well-accepted approaches
In the 2018-19 TCS, this section considered and responded to the guidance provided by the ESC in the Statement of Regulatory Approach (SoRA) regarding the requirements of the Pricing Order on well-accepted.
No change to approach.
4 Benchmark efficient entity (BEE)
51 entities across (i) Marine and Ports Services (28), (ii) Railroads (10) and (iii) Airports (13) GICS classifications. 6 additional entities compared to 2017-18 as a result of removing the US$100m market capitalisation threshold in response to the ESC’s commentary.
19 entities with FTSE Developed classification across (i) Marine and Ports Services (11), (ii) Railroads (8). We do not apply a market capitalisation threshold.
5 Capital Structure
30%
Represented the mid-point (rounded to the nearest 5%) of the gearing ratios for the 17 investment-grade listed benchmark efficient entities of 22% and the gearing ratios for the 3 privatised Australian ports of 42%
30%
No change to approach. Reflects the midpoint of updated median gearing ratio for the 10 investment-grade listed benchmark efficient entities (21%) and the average acquisition gearing of new Australian port privatisations (42%) and is consistent with the average gearing of our comparator set.
6 Cost of equity approaches
In the absence of any substantive grounds to favour one over the other, an equal weighting of the SL CAPM, Black CAPM and FFM estimation methods
90% weighting on the SL CAPM, 5% weighting on the Black CAPM, 5% weighting on the FFM.
7.4 Risk-free rate
2.74%
20-day average of the 10-year Australian Government bond yield to 30 March 2018
1.96%
No change to approach. Updated to reflect the 20-day period to 29 March 2019 (being the last business day of March 2019)
7.8 Market risk premium
7.71%
In the absence of any substantive grounds to favour one over the other, a 50:50 weighting of the Ibbotson and Wright MRP methodologies
Point estimate of 7.77% with a lower range value of 7.34%.
MRP is now based on a 50% weighting to the Ibbotson MRP, a 25% weighting to the Wright MRP, and a 25% weighting to Dividend Discount Models (DDMs). The lower end of the range is driven by a higher weighting to Ibbotson (66.7%) and corresponding lower weightings to Wright and DDM (16.7% respectively)

DETERMINING A WACC ESTIMATE FOR PORT OF MELBOURNE 31/05/2019 12:05:00 Page 4 of 296
Chapter Element 2018-19 TCS 2019-20 TCS
8.2 Beta 0.70
Based on the median (0.69) and average (0.72) 5-year asset betas for the 51 comparator benchmark efficient entities (rounded to the nearest 0.05). Also supported by the 10-year asset beta median and average of 0.75.
0.70 (low and point estimate) – 0.75 (high)
No change to approach, but comparator set now consists of 19 entities.
8.3 SL CAPM 13.48% Point estimate of 12.55% from a range of 12.00% to 13.27%
No change to SL CAPM methodology, but we have defined a range for the MRP and asset beta inputs into the SL CAPM formula.
9 Black CAPM 13.48% Point estimate of 12.55% from a range of 12.00% to 12.96%
No change to approach. Estimate is identical to SL CAPM estimate when equity beta is 1.00.
Zero beta premium
3.34%
SFG Consulting (2014). Cost of equity in the Black Capital Asset Pricing Model, 22 May
3.36%
Based on updated Synergies estimate to the end of 2018.
10 Fama-French Model
15.51%
Marginally higher than the 2017-18 estimate. A decrease in the HML beta was offset by increases in the MRP and SMB betas. We made a slight adjustment to our methodology to improve the robustness of the estimates for companies from countries without country-specific factors.
14.77% (low) - 15.37% (Point estimate and high) depending on MRP
Estimate has been affected by a lower risk-free rate and a refined comparator set underpinning the FFM beta estimates.
Market excess returns
1.06 equity beta and 7.71% risk factor premium
1.07 equity beta and 7.34%-7.77% risk factor premium
Calculation of risk factor premium follows updated MRP methodology.
High-minus-low factor
0.11 equity beta and 6.10% risk factor premium
0.17 equity beta and 5.74% risk factor premium
Calculation of risk factor premium is unchanged. Updated data
Small-minus-big factor
0.23 equity beta and 1.93% risk factor premium
0.32 equity beta and 2.04% risk factor premium
Calculation of risk factor premium is unchanged. Updated data
11 Return on debt
5.37%
90% weighting to the 2017-18 ‘on-the-day’ cost of 5.45% and 10% weighting to the 2018-19 ‘on-the-day’ cost of 4.58%, as weightings are adjusted 10% each year towards a 10-year trailing average approach
5.24%
80% weighting to the 2017-18 ‘on-the-day’ cost of 5.45%, 10% weighting to the 2018-19 ‘on-the-day’ cost of 4.58%, and 10% weighting to the 2019-20 ‘on-the-day’ cost of 4.21%. Weightings will continue to be adjusted 10% each year towards a 10-year trailing average approach
11.4 Notional credit rating
BBB No change
11.7 Debt risk premium
2.53%
Based on the trailing average return on debt of 5.37%, a risk-free rate of 2.74%, and debt raising costs of 0.10%
3.18%
Based on the trailing average return on debt of 5.24%, a risk-free rate of 1.96%, and debt raising costs of 0.10%

DETERMINING A WACC ESTIMATE FOR PORT OF MELBOURNE 31/05/2019 12:05:00 Page 5 of 296
Chapter Element 2018-19 TCS 2019-20 TCS
11.8 Debt raising costs
0.10%
PwC (2013), p.6
0.10%
No change
12 Gamma 0.25
In the absence of any substantive grounds to favour one approach over another, an equal weighting (rounded to the nearest 0.05) of the gamma value implied by finance theory (zero), the equity ownership approach (0.45) and market valuation studies (0.25)
No change in overall estimate. Equity ownership approach estimate has been updated to 0.50 to reflect recent decisions.

DETERMINING A WACC ESTIMATE FOR PORT OF MELBOURNE 31/05/2019 12:05:00 Page 6 of 296
Executive Summary
The purpose of this report is to provide an estimate of the return on capital for the Port
of Melbourne (PoM) for its third regulatory year under the regulatory framework
established by the Port Management Act (Vic) 1995 and Pricing Order.
To determine an estimate of the return on capital that is consistent with the Pricing
Order, the key requirement is that the Port Licence Holder (PoM) must use one or a
combination of well-accepted approaches that distinguish the cost of equity and debt
and so derive a weighted average cost of capital (WACC).
This requirement reflects the unique nature of the Pricing Order, which establishes a set
of processes for PoM to follow in setting prices for its Prescribed Services that must
provide it with a reasonable opportunity to recover revenue in the range of efficient
costs. The Pricing Order therefore places the initial onus on PoM to interpret the meaning
of the Pricing Order, including the meaning of the phrase “well-accepted” in the context
of deriving a WACC estimate.
The discretions afforded to PoM under the Pricing Order in the context of the global
markets in which it operates are important in the context of estimating WACC given the
inherent imprecision that is involved. These discretions allow PoM to present a position
on WACC that is compliant with the Pricing Order and to allow PoM to achieve the
objectives of the PMA.
Estimating WACC is an inherently imprecise exercise, in particular for determining the
cost of equity. Unlike, for example, the cost of debt, where there are observable
benchmarks, the cost of equity can only be inferred. Not only is there controversy over
the most appropriate model to apply to infer the cost of equity, but there is also
controversy over parameter values in respect of each model. This lack of observability
and lack of universal consensus amongst finance practitioners, academics and even
regulators means that estimation of the cost of equity is imprecise, and there is a range
of outcomes possible that would be compliant with the Pricing Order.
Since the 2018-19 TCS submission, the ESC has provided feedback to PoM through its
2018 Interim Commentary. We respond to the ESC’s Interim Commentary throughout
the report.
WACC formulation
The Pricing Order requires that the WACC must be calculated on a pre-tax nominal
basis. The pre-tax nominal formulation adjusts for taxation and dividend imputation in
the WACC formula rather than the cash flows of the business and is expressed as
follows:

DETERMINING A WACC ESTIMATE FOR PORT OF MELBOURNE 31/05/2019 12:05:00 Page 7 of 296
( ) DE
DR
DE
E
t
Rd
c
e
++
+−−*
11
Where:
Re = post-tax return on equity
Rd = pre-tax return on debt
D = proportion of debt within the assumed capital structure
E = proportion of equity within the assumed capital structure
t = corporate tax rate
= gamma (value of imputation credits)
Benchmark Efficient Entity
In compliance with the Pricing Order, we have identified a benchmark efficient entity
(BEE) for POM that is assumed to be in the same industry with the same risk profile as
PoM in its provision of Prescribed Services.
The ESC has maintained its view that, for the purposes of defining the BEE, the
Prescribed Services are provided by a port in Australia. However, in practice, we have
found there are insufficient comparable businesses listed in Australia that have similar
risks to this assumed BEE. Consequently, it has been necessary for us to follow a well-
accepted alternative for such situations that is used by Australian economic regulators
(as well as finance practitioners and academics) and supplement our sample of
comparable Australian listed entities with international listed entities with comparable
risks. An element of judgement is required in this task.
To this end, we expanded the port and marine services comparator sample to include
listed railroads based on a first principles analysis of the typical systematic risks of these
businesses and their similarities (in aggregate) to the BEE. We then reviewed the
business description for each listed company in our international sample and eliminated
companies whose systematic risks did not appear comparable to the BEE.
In the SoRA, the ESC identified differences between the BEE definitions put forward by
the ESC and PoM, respectively, which we address in Chapter 4. These positions differ
mainly on two issues. First, the ESC considers that airports should not be included in the
comparator set. We have excluded airports from the comparator set in response to the
ESC’s commentary. The second issue concerns whether the availability of listed
comparators should be reflected in the BEE definition, or whether this should be

DETERMINING A WACC ESTIMATE FOR PORT OF MELBOURNE 31/05/2019 12:05:00 Page 8 of 296
addressed later in the comparator entity filtering process. The resulting comparator set
is likely to be similar under both definitions.
Capital Structure
To inform PoM’s benchmark capital structure, we have had regard to the listed
comparator set from a first principles analysis perspective, as well as recent Australian
port acquisition comparators, including major landlord ports in Australia comparable to
PoM.
Our benchmark capital structure range extends from 21% (based on the median of
investment-grade listed comparators) to 42% (average and median of the acquisition
comparators). We have chosen the mid-point of this range which is 30% (rounded down
from 32%) consistent with our approach to deriving a point estimate from other
estimated ranges.
Combination of well-accepted cost of equity approaches
The ESC has proposed that at a minimum, for an approach to be well-accepted, it must
be used by (or recently used by):
(a) at least one economic regulator to determine the rate of return for the purpose of
calculating the ARR using an accrual building block methodology or;
(b) a review body overseeing decisions by economic regulators.
The ESC further clarifies in relation to (a) above that in certain circumstances, for an
approach to be well-accepted by regulators, it may be that acceptance by one regulator
is enough, but a case by case assessment is required.1
However, it is not evident that the Pricing Order restricts the definition of well-accepted
in this manner. Moreover, this definition precludes the consideration of important
evidence from financial practice and academia.
Based on academic recognition and empirical fit analysis, well-established market
practice in the finance industry as well as by Australian and international regulators, we
consider there are a range of cost of equity models that are well-accepted within relevant
spheres (regulators, finance practitioners and academics) and, in turn, the meaning of
the Pricing Order for estimating the cost of equity.
1 Feedback on consultation and other matters: Statement of Regulatory Approach version 1.0 (December 2017) p 41

DETERMINING A WACC ESTIMATE FOR PORT OF MELBOURNE 31/05/2019 12:05:00 Page 9 of 296
We have determined the cost of equity estimate for the BEE for PoM using a combination
of the following models:
• Sharpe-Lintner Capital Asset Pricing Model (SL CAPM)
• Black CAPM
• Fama-French Model (FFM)
As we document in Chapter 6, the SL CAPM’s theoretical foundations are attractive but
its empirical performance is poor. Accordingly, we consider exclusive reliance upon the
SL CAPM is inappropriate given the asymmetric consequences of regulatory error. The
theoretical foundations of the SL CAPM do not offset the poor explanatory power of that
model in terms of predicting actual returns. Moreover, if the SL CAPM had a proven
track record of accurately matching observed returns, there would have been little
reason for the FFM to have been developed in the first instance. On the other hand, we
acknowledge that other well-accepted models are not without their limitations - there
are issues sourcing country-specific FFM factors for some of the countries in PoM’s
comparator set, and the zero-beta premium for the Black CAPM remains statistically
insignificant at the 5% level, even with updated data.
In this context of providing the BEE with a return necessary to compensate for the risks
involved in providing Prescribed Services, a more pertinent consideration is whether the
requirements of the Pricing Order and the statutory objectives can be met by the SL
CAPM alone or whether those requirements and objectives are better met by combining
the SL CAPM with other well-accepted approaches, such as the Black CAPM and the
FFM.
Accordingly, we have placed a 90% weighting on the SL CAPM, and a 5% weighting on
each of the Black CAPM and FFM. In our view, PoM could revisit the weights given to
the Black CAPM and FFM if these data challenges are rectified in the future.
Estimation of cost of equity
SL CAPM
The SL CAPM is expressed as follows:
Re = Rf + e * [E(Rm) - Rf]
Where:
Rf = the risk-free rate of return

DETERMINING A WACC ESTIMATE FOR PORT OF MELBOURNE 31/05/2019 12:05:00 Page 10 of 296
E(Rm) = the expected return on the market
[E(Rm) – Rf] = the market risk premium
e = equity beta (measures systematic risk)
Our approach to estimating the above parameters is summarised below.
Total market return
Given the inherent volatility in the risk-free rate over time, it is informative to evaluate
the expected value of the total market return outcome (which in the formula above is
expressed as E(Rm) and measured as the risk-free rate plus the MRP). This is because
evidence from market practitioners indicates that the required return on capital does not
necessarily change one-for-one with observed government bond yields, especially when
yields are low (as they are at present). This ensures that the approach to PoM’s return on
equity is consistent with the pricing principles and capable of achieving the regulatory
objectives. Due to PoM’s point estimate equity beta of 1.0, the total market return
coincides with PoM’s point estimate post-tax return on equity under the SL CAPM and
Black CAPM.
For the risk-free rate, the Commonwealth Government bond yield is most commonly
used as a proxy by academics, regulators (including by the ESC) and finance
practitioners. We have assumed a ten-year term to maturity, balancing the liquidity of
available long-term bond instruments in the Australian market, and the long-term
nature of the PoM investment.
In general, a commonly used approach to estimate the risk-free rate is to use short
averaging periods close to the commencement of each regulatory period. Consistent
with this well-accepted approach, our estimates are produced over a twenty-day period
to 29 March 2019. As the quoted rates are semi-annual, we have converted them to
annual effective rates.2 The resulting estimate is 1.96%.
The market risk premium (MRP) is a function of the difference between the expected
equity market return and the risk-free rate of return. It is an inherently forward-looking
parameter, which is therefore not directly observable and is difficult to estimate. In
previous submissions, we have relied upon historical data using a simple average of:
• the Ibbotson approach, which calculates the MRP by taking the difference between
the long-term observed average return on market and the risk-free rate. This
method assumes that the market risk premium remains stable over time, and the
2 Annual effective rate = (1+ semi-annual rate/2)^2 -1

DETERMINING A WACC ESTIMATE FOR PORT OF MELBOURNE 31/05/2019 12:05:00 Page 11 of 296
overall return on market will fluctuate largely in-step with the risk-free rate of
return; and
• the Wright approach, which calculates the MRP by taking the difference between
the long term observed average return on market and the current risk-free rate of
return. This method assumes that the overall return on equity remains stable over
time, and does not fluctuate in-step with the risk-free rate of return.
We maintain that this represents a well accepted approach to the estimation of the MRP.
However, we are mindful of the ESC’s commentary on this issue and have adjusted our
approach to reduce the weighting to the Wright approach and include a weighting for a
forward looking approach.
Dividend Discount Models (DDMs) are forward looking approaches which estimate the
market risk premium by reference to dividend yields, long-term expected dividend
growth and a transitional path between these values. In previous reports for PoM, we
have observed that relying on the DDM to derive a cost of equity for the BEE (as opposed
to a MRP) was difficult due to the limited number of relevant domestic comparators.
There are also judgements that must be made about each of the components that
underpin a DDM assessment, even on a market wide basis. Nevertheless, three
regulators (IPART, the QCA and the ERA) rely to varying extents on DDMs to inform
their MRP estimate, and we consider that there is merit to augment the MRP estimate
with a forward-looking component. We now give weight to DDMs in our MRP estimate
for PoM, rather than employing them only as a cross-check.
We provide evidence that all of these approaches are used by economic regulators in
Australia. For the 2019-20 point estimate of 7.77%, we have placed a 50% weighting on
the Ibbotson MRP (6.48%), a 25% weighting on the Wright MRP (9.54%), and a 25%
weighting on DDMs (8.56%). The lower end of the MRP range (7.34%) is informed by a
66.7% weighting on the Ibbotson MRP, a 16.7% weighting on the Wright MRP, and a
16.7% weighting on DDMs.
The resulting range for the total market return (risk free rate plus market risk premium)
is between 9.30% and 9.73%, which is well below the total market return of 10.45%
currently applied by IPART.3 Moreover, this range is also below the median total market
return applied by financial practitioners (10.0%, see Section 7.2), which is likely to
provide the strongest indication of outcomes in a workably competitive market.
3 IPART (2019). WACC biannual update – February 2019. IPART adopted a risk-free rate of 3.15% and an MRP of 7.3%.
The sum of these two values gives the (post-tax) total market return of 10.45%

DETERMINING A WACC ESTIMATE FOR PORT OF MELBOURNE 31/05/2019 12:05:00 Page 12 of 296
Beta
An asset beta of 0.70 has been estimated based on:
• the same set of comparable listed companies that underpinned our gearing
assessment (noting that a higher asset beta of 0.75 forms the upper range on the
basis of updated market data)
• rounding the median asset beta of this set of comparable companies.
Given the gearing estimate of 30%, this asset beta translates into an estimated equity beta
of 1.0 (upper limit of 1.07).
SL CAPM cost of equity
Our point estimate of the pre-tax cost of equity for the BEE based on the SL CAPM is
12.55% from a range of 12.00% (using an asset beta of 0.70 and the lower range MRP
estimate) to 13.27% (using the point estimate MRP with an asset beta of 0.75).
Black CAPM
The Black CAPM augments the SL CAPM by adding what is known as a zero-beta
premium to the risk-free rate to address the observed tendency of the SL CAPM to
understate asset returns for companies with betas less than one.
SFG Consulting has previously estimated the zero-beta premium to be 3.34%.4 We have
updated this estimate using data up until the end of 2018, resulting in an estimate of
3.36%. The zero-beta return is the sum of risk-free rate and the zero-beta premium.
Hence, our SL CAPM estimate can be combined with this zero-beta premium to estimate
the Black CAPM return on equity.
Our point estimate of the pre-tax return on equity for the BEE based on the Black CAPM
is also 12.55% from a range of 12.00% to 12.96% (note that the upper range estimate is
lower than the upper range SL CAPM estimate given that the equity beta is above 1 for
this calculation).
FFM
The FFM is based on the principle that the empirically observed excess returns to the
market can be assessed having regard to the following three explanatory factors:
• the returns on the market as a whole;
4 SFG Consulting (2014a). Cost of equity in the Black Capital Asset Pricing Model, 22 May.

DETERMINING A WACC ESTIMATE FOR PORT OF MELBOURNE 31/05/2019 12:05:00 Page 13 of 296
• HML (High Minus Low) is the average return on two ‘value’ portfolios minus the
average return on two ‘growth’ portfolios; and
• SMB (Small Minus Big) is the average return on three small listed entity portfolios
minus the average return on three big listed entity portfolios.
The risk-free rate and MRP under the FFM match the values used in the SL CAPM.
Table 1 presents our equity betas and associated risk premiums.
Table 1 FFM equity betas and risk factor premiums
Risk factors Estimated equity betas Risk factor premiums
Market risk premium 1.07 7.34%-7.77%
High minus low cap premium 0.17 5.74%
Small minus big premium 0.32 2.04%
Source: Synergies
Our estimated range of the pre-tax return on equity for the BEE based on the FFM is
14.77% to 15.37% depending on the MRP input.
Cost of equity estimates
Table 2 presents the cost of equity estimates from the three approaches.
Table 2 Cost of equity (pre-tax nominal) estimates by approach
Model SL CAPM Black CAPM FFM Cost of equity (weighted)
Lower range 12.00% 12.00% 14.77% 12.14%
Point estimate 12.55% 12.55% 15.37% 12.69%
Upper range 13.27% 12.96% 15.37% 13.36%
Weighting 90% 5% 5%
Source: Synergies
Previously, given that each approach has its own strengths and weaknesses, and in the
absence of any substantive grounds to favour one over the other, we adopted a simple
averaging of the three estimates. For the 2019-20 TCS, recognising feedback from the ESC
and data limitations with the Black CAPM and FFM, we have increased the weighting
on the SL CAPM to 90%, and decreased the weightings on the Black CAPM and FFM to
5% each. Applying these weightings to the estimates in Table 2 results in an estimated
nominal pre-tax cost of equity point estimate for the BEE of 12.69%, from a range of
12.14% to 13.36%. There may be scope to increase the weightings on the Black CAPM
and FFM if data improves in the future.

DETERMINING A WACC ESTIMATE FOR PORT OF MELBOURNE 31/05/2019 12:05:00 Page 14 of 296
Cost of debt
The cost of debt calculation is the sum of the risk-free rate and an estimate of the debt
risk premium consistent with the risk profile of the BEE.
This approach is well-accepted in financial markets and by economic regulators in
Australia and internationally, underpinned by the concept of credit spreads reflecting
different credit and liquidity risks associated with government and corporate bonds
respectively.
The return on debt calculation can be expressed as follows:
Rd = Rf + DRP + DRC
Where:
Rf = risk-free rate
DRP = debt risk premium
DRC = debt raising costs
We have used the same risk-free rate estimate as derived in our cost of equity calculation.
For the debt risk premium, we consider that both the Reserve Bank of Australia (RBA)
and Bloomberg data series represent an independent, credible and reliable data source
for return on debt estimation purposes. Consistent with our approach to estimating cost
of equity parameters, in the absence of any substantive grounds to favour one over the
other we have calculated a simple average of these comparable series.
An assumption of ten basis points has been used for debt raising costs based on
authoritative evidence gathered by PwC of debt raising costs for Australian corporates,
based on surveys and interviews with legal firms, banks and credit rating agencies that
are involved in the corporate bond raising process.5
Consistent with the approach applied under the Australian national energy framework,
we consider that the choice between the on-the-day and trailing average approach to
estimating the cost of debt is appropriately made by the regulated entity provided the
calculation reflects an efficient benchmark. Both the on-the-day and trailing average
approaches are in use by Australian regulators.
Last year, we commenced a trailing average approach, which is currently adopted by
several Australian regulators. This year, the trailing average calculation places an 80%
weighting on the 2017 return on debt estimate, a 10% weighting on the 2018 return on
debt estimate, and a 10% weighting on the 2019 return on debt estimate. With each
5 PwC (2013). Energy Networks Association: Debt financing costs, June.

DETERMINING A WACC ESTIMATE FOR PORT OF MELBOURNE 31/05/2019 12:05:00 Page 15 of 296
subsequent year, 10% of the 2017 weighting will be refreshed with the prevailing return
on debt estimate.
This approach was adopted last year on the basis of its lower volatility over time, and
because it is more consistent with the debt management practices of a benchmark
efficient entity. It is also in line with our approach to other WACC parameters, which,
where possible, are based on long-term averages. This methodology is also consistent
with the approach currently in use by the AER.
Table 3 shows our 2019 on-the-day cost of debt estimate for the BEE of 4.21%, to which
a 10% weighting is applied in the trailing average calculation.
Table 3 2019 on-the-day cost of debt estimate for BEE (assuming BBB credit rating)
Averaging period RBA Bloomberg Average
BBB DRP based on 20 days to 29 March 2019
2.37% 1.92% 2.15%
Risk-free rate based on 20 days to 29 March 2019
1.96% 1.96% 1.96%
Debt raising costs 0.10% 0.10% 0.10%
2019 on-the-day cost of debt
4.43% 3.98% 4.21%
Source: RBA, Bloomberg, Synergies calculations
This 2019 on-the-day cost of debt estimate is then used as an input in the trailing average
calculation, as displayed in Table 4. This results in a cost of debt estimate of 5.24%.
Table 4 Trailing average cost of debt calculation
Time period Estimate Weighting
2017 on-the-day cost of debt 5.45% 80%
2018 on-the-day cost of debt 4.58% 10%
2019 on-the-day cost of debt 4.21% 10%
Cost of debt 5.24%
Note: Assuming a risk-free rate of 1.96% and debt raising costs of 0.10%, this implies a DRP of 3.18%
Source: RBA, Bloomberg, Synergies calculations
Gamma
Gamma is a product of the following two inputs that must be estimated:
• the portion of franking credits distributed to investors (the distribution rate); and
• the utilisation value per dollar of franking credits distributed (also referred to as the
utilisation rate or ‘theta’).

DETERMINING A WACC ESTIMATE FOR PORT OF MELBOURNE 31/05/2019 12:05:00 Page 16 of 296
In attempting to identify a well-accepted approach to gamma, we have reviewed
academic literature, relevant finance industry evidence (particularly from independent
expert reports), as well as Australian regulatory practice.
The first well-accepted approach is adopted from the academic literature and indicates
that the gamma for a security where the marginal investor is foreign should be zero.
There is also substantial evidence that imputation credits are not considered by
independent experts in a valuation context. Australian economic policy makers have
also questioned the value of imputation credits in an economy that is small by
international standards and characterised by open capital markets.
In contrast to this reasonably consistent view, there are several approaches that have
been applied in Australian regulatory practice, where the value of theta continues to be
highly contentious and in broad terms can be estimated using the following approaches:
• the equity ownership approach, which is the proportion of Australian equity held
by Australian residents (given only domestic investors can utilise franking credits),
or alternative taxation approach using statistics drawn from the Australian Taxation
Office on the utilisation of franking credits – which forms our second well-accepted
approach; and
• market value studies, which seek to ascribe the value that investors place on theta
using techniques, including dividend ‘drop-off’ studies (i.e. analysing pre and post-
dividend share prices) - this forms our third well-accepted approach.
Each of these approaches establishes a broad range of theta values and in turn a gamma
value.
The equity ownership approach has been applied by some regulators, including the ESC.
It provides a theta value of around 0.6 to 0.7 resulting in a gamma value of 0.4 to 0.585
(which we have averaged at 0.50).
In contrast, the market value approach relies on a market value estimate of imputation
credits and the most authoritative study6 supports a theta value of 0.35. In turn, this
results in a gamma value of 0.25 (assuming a 70% distribution rate).
Accordingly, we consider these three broad approaches have been well-accepted in the
relevant communities of expertise and we have calculated a simple average of the three
values (zero if based on finance theory, 0.50 if based on a non-market equity ownership
approach and 0.25 if based on market valuation studies), resulting in a gamma estimate
of 0.25. This is the same as IPART’s current gamma estimate.
6 SFG Consulting (2014b). An appropriate regulatory estimate of gamma, 21 May.
DETERMINING A WACC ESTIMATE FOR PORT OF MELBOURNE 31/05/2019 12:05:00 Page 17 of 296
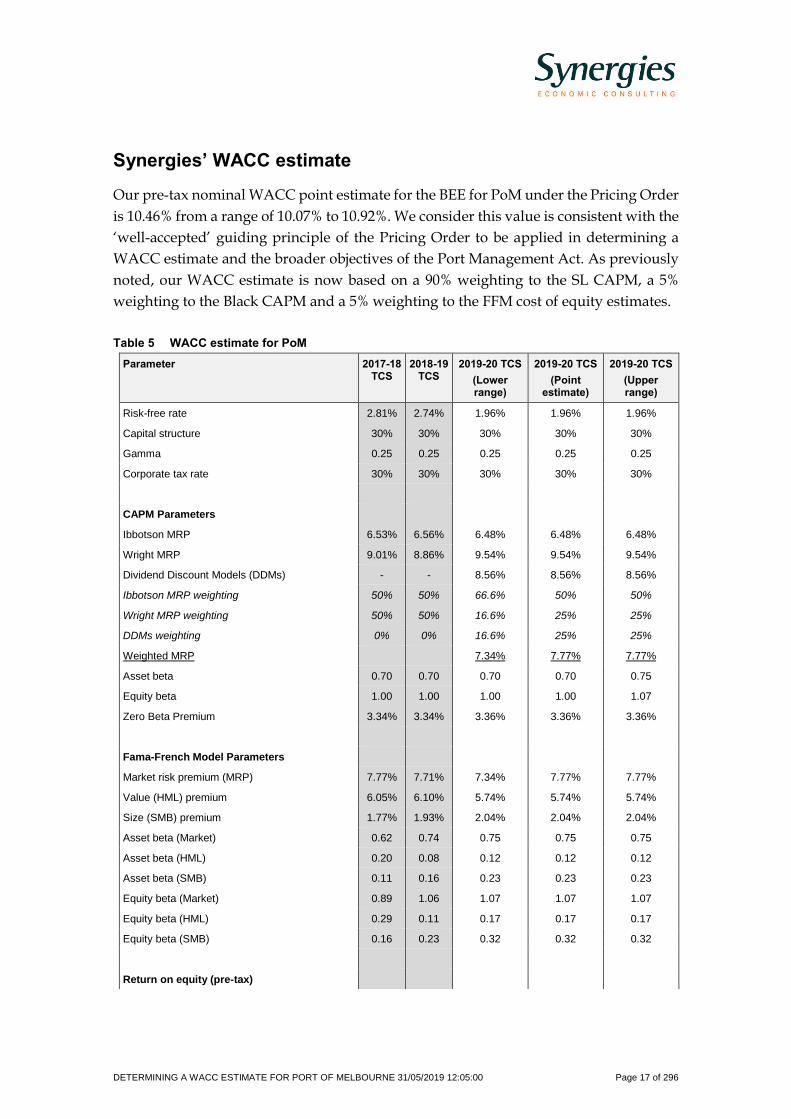
Synergies’ WACC estimate
Our pre-tax nominal WACC point estimate for the BEE for PoM under the Pricing Order
is 10.46% from a range of 10.07% to 10.92%. We consider this value is consistent with the
‘well-accepted’ guiding principle of the Pricing Order to be applied in determining a
WACC estimate and the broader objectives of the Port Management Act. As previously
noted, our WACC estimate is now based on a 90% weighting to the SL CAPM, a 5%
weighting to the Black CAPM and a 5% weighting to the FFM cost of equity estimates.
Table 5 WACC estimate for PoM
Parameter 2017-18 TCS
2018-19 TCS
2019-20 TCS
(Lower range)
2019-20 TCS
(Point estimate)
2019-20 TCS
(Upper range)
Risk-free rate 2.81% 2.74% 1.96% 1.96% 1.96%
Capital structure 30% 30% 30% 30% 30%
Gamma 0.25 0.25 0.25 0.25 0.25
Corporate tax rate 30% 30% 30% 30% 30%
CAPM Parameters
Ibbotson MRP 6.53% 6.56% 6.48% 6.48% 6.48%
Wright MRP 9.01% 8.86% 9.54% 9.54% 9.54%
Dividend Discount Models (DDMs) - - 8.56% 8.56% 8.56%
Ibbotson MRP weighting 50% 50% 66.6% 50% 50%
Wright MRP weighting 50% 50% 16.6% 25% 25%
DDMs weighting 0% 0% 16.6% 25% 25%
Weighted MRP 7.34% 7.77% 7.77%
Asset beta 0.70 0.70 0.70 0.70 0.75
Equity beta 1.00 1.00 1.00 1.00 1.07
Zero Beta Premium 3.34% 3.34% 3.36% 3.36% 3.36%
Fama-French Model Parameters
Market risk premium (MRP) 7.77% 7.71% 7.34% 7.77% 7.77%
Value (HML) premium 6.05% 6.10% 5.74% 5.74% 5.74%
Size (SMB) premium 1.77% 1.93% 2.04% 2.04% 2.04%
Asset beta (Market) 0.62 0.74 0.75 0.75 0.75
Asset beta (HML) 0.20 0.08 0.12 0.12 0.12
Asset beta (SMB) 0.11 0.16 0.23 0.23 0.23
Equity beta (Market) 0.89 1.06 1.07 1.07 1.07
Equity beta (HML) 0.29 0.11 0.17 0.17 0.17
Equity beta (SMB) 0.16 0.23 0.32 0.32 0.32
Return on equity (pre-tax)
DETERMINING A WACC ESTIMATE FOR PORT OF MELBOURNE 31/05/2019 12:05:00 Page 18 of 296
Parameter 2017-18 TCS
2018-19 TCS
2019-20 TCS
(Lower range)
2019-20 TCS
(Point estimate)
2019-20 TCS
(Upper range)
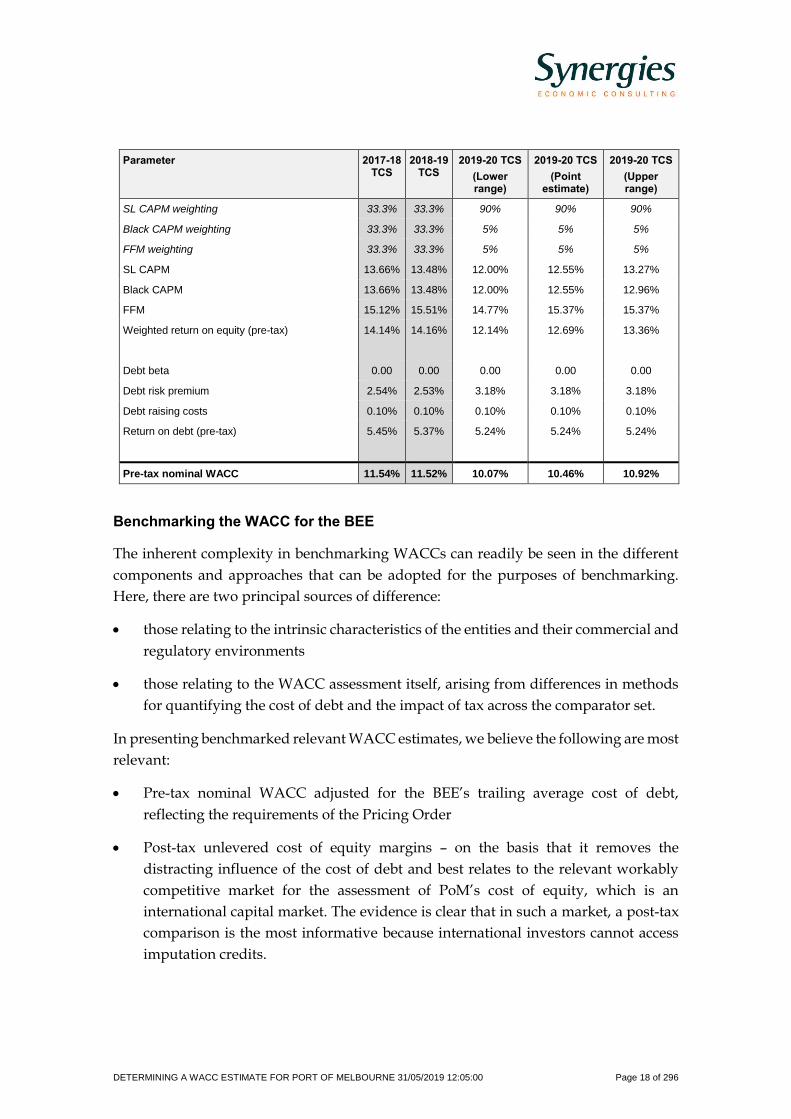
SL CAPM weighting 33.3% 33.3% 90% 90% 90%
Black CAPM weighting 33.3% 33.3% 5% 5% 5%
FFM weighting 33.3% 33.3% 5% 5% 5%
SL CAPM 13.66% 13.48% 12.00% 12.55% 13.27%
Black CAPM 13.66% 13.48% 12.00% 12.55% 12.96%
FFM 15.12% 15.51% 14.77% 15.37% 15.37%
Weighted return on equity (pre-tax) 14.14% 14.16% 12.14% 12.69% 13.36%
Debt beta 0.00 0.00 0.00 0.00 0.00
Debt risk premium 2.54% 2.53% 3.18% 3.18% 3.18%
Debt raising costs 0.10% 0.10% 0.10% 0.10% 0.10%
Return on debt (pre-tax) 5.45% 5.37% 5.24% 5.24% 5.24%
Pre-tax nominal WACC 11.54% 11.52% 10.07% 10.46% 10.92%
Benchmarking the WACC for the BEE
The inherent complexity in benchmarking WACCs can readily be seen in the different
components and approaches that can be adopted for the purposes of benchmarking.
Here, there are two principal sources of difference:
• those relating to the intrinsic characteristics of the entities and their commercial and
regulatory environments
• those relating to the WACC assessment itself, arising from differences in methods
for quantifying the cost of debt and the impact of tax across the comparator set.
In presenting benchmarked relevant WACC estimates, we believe the following are most
relevant:
• Pre-tax nominal WACC adjusted for the BEE’s trailing average cost of debt,
reflecting the requirements of the Pricing Order
• Post-tax unlevered cost of equity margins – on the basis that it removes the
distracting influence of the cost of debt and best relates to the relevant workably
competitive market for the assessment of PoM’s cost of equity, which is an
international capital market. The evidence is clear that in such a market, a post-tax
comparison is the most informative because international investors cannot access
imputation credits.

DETERMINING A WACC ESTIMATE FOR PORT OF MELBOURNE 31/05/2019 12:05:00 Page 19 of 296
The figure below depicts the pre-tax nominal WACC margin for the comparator set,
adjusted for the BEE’s trailing average cost of debt and shows:
• PoM’s pre-tax nominal WACC margin range is situated marginally above the range
of relevant Australian regulatory transport decisions. This is predominantly due to
changes the ERA has made to parameters that are not firm specific, which involved
a substantial decrease in the MRP along with an increase in gamma. Together, these
changes decrease the pre-tax nominal WACC for Pilbara railways by approximately
200 basis points.
• PoM’s pre-tax nominal WACC margin range is below the WACC margin range for
listed Class I railroads, and within the range of WACC margins for listed Marine
Ports and Services entities.
Pre-tax WACC margins adjusted for the BEE’s trailing average cost of debt
Note: The ERA and IPART decisions are at the draft stage. The ERA released its draft rail WACC decisions in May 2019, but the risk-free
rate it has applied are as at 30 June 2018. Both regulatory and listed WACC margins have been adjusted for the BEE’s trailing average
cost of debt.
Data source: Synergies calculations, various regulatory decisions, Bloomberg
The next figure depicts the post-tax unlevered cost of equity margins for the comparator
set and shows PoM’s post-tax unlevered cost of equity margin range is within the range
of comparable Australian regulatory transport decisions and is situated towards the

DETERMINING A WACC ESTIMATE FOR PORT OF MELBOURNE 31/05/2019 12:05:00 Page 20 of 296
lower end of cost of equity margins for Listed Marine Ports and Services and Class I
railroads.
Post-tax unlevered cost of equity margins
Note: The ERA and IPART decisions are at the draft stage. The ERA released its draft rail WACC decisions in May 2019, but the risk-free
rate it has applied are as at 30 June 2018.
Data source: Synergies calculations, various regulatory decisions, Bloomberg
This demonstrates that the proposed WACC estimate satisfies the requirements of the
Pricing Order.

DETERMINING A WACC ESTIMATE FOR PORT OF MELBOURNE Page 21 of 296
Contents
Snapshot 3
Executive Summary 6
WACC formulation 6
Benchmark Efficient Entity 7
Capital Structure 8
Combination of well-accepted cost of equity approaches 8
Estimation of cost of equity 9
Cost of debt 14
Gamma 15
Synergies’ WACC estimate 17
1 Introduction 28
2 WACC formulation 30
2.1 Introduction 30
2.2 Chosen WACC formulation 30
3 Use of one or a combination of well-accepted approaches 32
3.1 Requirements under the Pricing Order 32
3.2 Pricing Order provisions 32
3.3 Overview of ESC commentary 33
3.4 ESC 3-step process for assessing rate of return clauses 34
3.5 The relevant context 38
3.6 Determining one or a combination of approaches 54
4 Benchmark efficient entity (BEE) 58
4.1 Identifying a BEE 58
4.2 ESC definition of BEE 61
4.3 Defining the BEE for PoM 66
5 Capital structure 70
5.1 Introduction and background 70

DETERMINING A WACC ESTIMATE FOR PORT OF MELBOURNE Page 22 of 296
5.2 ESC commentary on proposed capital structure for BEE 70
5.3 Regulatory precedent 71
5.4 Metrics 73
5.5 Gearing range 73
5.6 Conclusion 75
6 Assessing alternative return on equity approaches 77
6.1 Introduction 77
6.2 Sharpe-Lintner CAPM 80
6.3 Black CAPM 94
6.4 Fama-French model 104
6.5 Dividend Discount Model 122
6.6 Choosing a well-accepted cost of equity approach 124
7 Total market return 126
7.1 Why focus on the total market return? 126
7.2 Evidence from independent experts 128
7.3 Regulatory approaches to the total market return 130
7.4 Regulatory approach to the risk-free rate 131
7.5 Regulatory decisions on the MRP 131
7.6 Australian regulatory estimates of market returns 133
7.7 Determining a total market return for PoM 136
7.8 Conclusion on the total market return 144
8 Estimating the return on equity using SL CAPM 146
8.1 Estimating the SL CAPM return on equity 146
8.2 Estimating beta 146
8.3 Estimating the return on equity using the SL CAPM 164
9 Estimating the return on equity using the Black CAPM 166
9.1 Post-tax return on equity 166
9.2 Pre-tax return on equity 167

DETERMINING A WACC ESTIMATE FOR PORT OF MELBOURNE Page 23 of 296
9.3 Black CAPM estimate 167
10 Estimating the return on equity using the Fama-French Model 168
10.1 Post-tax return on equity 169
10.2 Pre-tax return on equity 169
10.3 FFM estimate 170
11 Estimating the return on debt 171
11.1 Introduction and background 171
11.2 Well-accepted methodologies 173
11.3 Risk-free rate 176
11.4 Notional credit rating assumption 176
11.5 Term to maturity 176
11.6 Debt management approach 176
11.7 Debt risk premium (DRP) 177
11.8 Debt raising costs 179
11.9 Cost of debt estimates 181
12 Gamma 182
12.1 Introduction and background 182
12.2 Evidence on gamma from economic regulators 183
12.3 Finance theory and market evidence 189
12.4 Identifying a well-accepted gamma estimation approach 200
12.5 Conclusion 202
13 Proposed WACC estimate for BEE 204
13.1 Changes since 2018-19 TCS submission 204
13.2 Satisfying the ESC’s compliance assessment framework 206
13.3 Benchmarking the WACC for the BEE 207
13.4 Conclusion 215
A Gearing Ratios 217
B Beta diagnostics 221

DETERMINING A WACC ESTIMATE FOR PORT OF MELBOURNE Page 24 of 296
C Supplementary information on cost of equity methodologies 239
D Detailed responses to ESC commentary 245
E Australian regulatory precedent on beta determination 260
F Market risk premium – Supplementary information 272
G WACC benchmarking 281
H Background on risk-free rate 294
Figures and Tables
Figure 1 Comparison of risk-free rates with prevailing RBA risk-free rate 91
Figure 2 Comparison of WACC estimates with and without ad hoc adjustments
92
Figure 3 Post-tax total market returns implied by independent expert reports 93
Figure 4 Relationship between SL CAPM and Black CAPM 96
Figure 5 Earnings and sovereign bond yields 128
Figure 6 Post-tax total market returns implied by independent expert reports 130
Figure 7 Market returns applied by Australian regulators 134
Figure 8 Notional market returns at a risk-free rate of 5% 135
Figure 9 Visual representation of ATO tax flows, 2004-2012 186
Figure 10 KPMG Valuation Practices Survey, gamma 197
Figure 11 Pre-tax nominal WACC margins 211
Figure 12 Debt risk premia (DRP) 213
Figure 13 Pre-tax WACC margins adjusted for the BEE’s trailing average cost of
debt 214
Figure 14 Post-tax unlevered cost of equity margins 215
Figure 15 Developed, Advanced Emerging, Secondary Emerging and Frontier
classifications 222
Figure 16 FTSE Quality of Markets Matrix 223
Figure 17 ESC chart of betas and standard errors for included and excluded firms
228

DETERMINING A WACC ESTIMATE FOR PORT OF MELBOURNE Page 25 of 296
Figure 18 Revised graph of ESC analysis 230
Figure 19 Buy ranges of Fama French Benchmark portfolios 242
Figure 20 Regulatory and listed comparator pre-tax nominal WACC margins 283
Figure 21 Regulatory and listed comparator post-tax nominal WACC margins 284
Figure 22 Regulatory and listed comparator pre-tax cost of equity margins
(levered) 285
Figure 23 Regulatory and listed comparator pre-tax cost of equity margins
(unlevered) 286
Figure 24 Regulatory and listed comparator post-tax cost of equity margins
(levered) 287
Figure 25 Regulatory and listed comparator post-tax cost of equity margins
(unlevered) 288
Figure 26 Regulatory and listed comparator debt risk premia (DRP) 289
Figure 27 Pre-tax WACC margins adjusted for the BEE’s trailing average cost of
debt 290
Figure 28 Post-tax WACC margins adjusted for the BEE’s trailing average cost of
debt 291
Table 1 FFM equity betas and risk factor premiums 13
Table 2 Cost of equity (pre-tax nominal) estimates by approach 13
Table 3 2019 on-the-day cost of debt estimate for BEE (assuming BBB credit
rating) 15
Table 4 Trailing average cost of debt calculation 15
Table 5 WACC estimate for PoM 17
Table 6 Electricity transmission return on equity allowances (2000-present) 44
Table 7 Regulatory precedent for WACC proposal 46
Table 8 Application of IPART and AER criteria to PoM WACC submission 49
Table 9 Contrasting positions of Synergies and the ESC on the BEE 61
Table 10 Recent Australian regulatory gearing decisions for transport entities 71
Table 11 Companies in our sample with investment grade ratings 74
Table 12 Gearing averages and ranges by sector 74

DETERMINING A WACC ESTIMATE FOR PORT OF MELBOURNE Page 26 of 296
Table 13 Acquisition Gearing Ratios for Australian Ports 75
Table 14 Additional SL CAPM literature 85
Table 15 Application of IPART/AER criteria to SL CAPM 94
Table 16 Application of IPART/AER criteria to Black CAPM 104
Table 17 Application of IPART/AER criteria to FFM 121
Table 18 Most recent MRP estimates applied by Australian regulators 131
Table 19 DDM used by Australian economic regulators 143
Table 20 Forward looking MRP estimates based on DDM (based on a zero
gamma) 144
Table 21 MRP range 145
Table 22 Comparable companies’ asset beta summary (5-year period) 152
Table 23 Comparable companies’ asset beta summary (10-year period) 153
Table 24 Competitive pressures by cargo type 155
Table 25 SL CAPM post-tax cost of equity range 165
Table 26 Pre-tax return on equity range 165
Table 27 Post-tax return on equity range 166
Table 28 Pre-tax return on equity range 167
Table 29 FFM equity betas and risk factor premiums 168
Table 30 2019 on-the-day cost of debt calculation 181
Table 31 Trailing average cost of debt calculation 181
Table 32 Current Australian regulatory status of gamma 189
Table 33 Proportion of equity ownership – Institutions & Strategic Holders &
Individuals/Insiders 198
Table 34 Proportion of equity ownership – Unlisted infrastructure transactions
199
Table 35 WACC estimate for PoM 205
Table 36 Environmental benchmarking summary 208
Table 37 Gearing for full list of comparators (19 entities) 219
Table 38 Gearing by sector 220
Table 39 Beta Comparables over 5 and 10 year periods (19 entities) 225

DETERMINING A WACC ESTIMATE FOR PORT OF MELBOURNE Page 27 of 296
Table 40 Portfolio Asset Beta Estimates 227
Table 41 Beta estimates averaged across different starting days 227
Table 42 Marine Ports and Services comparators 231
Table 43 Railroad comparators 232
Table 44 Marine Ports and Services comparators excluded from sample 232
Table 45 Railroad comparators excluded from sample 237
Table 46 Fama-French asset beta estimates, by company 243
Table 47 Overview of ESC interim commentary on Black CAPM 245
Table 48 Overview of ESC commentary on the Fama-French model 246
Table 49 ESC interim commentary on the MRP 251
Table 50 ESC interim commentary on beta and gearing 253
Table 51 Overview of ESC interim commentary on gamma 257
Table 52 Comparison firms’ equity and asset beta estimates 261
Table 53 Comparator companies for Arc Infrastructure 264
Table 54 Comparator companies for TPI Network 266
Table 55 Comparator companies for PTA as returned by Bloomberg 268
Table 56 Relative asset and equity betas of US comparator firms 269
Table 57 Relative asset and equity betas of US comparator firms 269
Table 58 Relative asset and equity betas of Australian comparator transport sector
firms 269
Table 59 Relative asset and equity betas of New Zealand comparator transport
sector firms 269
Table 60 Equity beta estimation sample selection methodology 270
Table 61 North American Class I railroad WACC estimates 292
Table 62 Marine Ports and Services WACC estimates 292

DETERMINING A WACC ESTIMATE FOR PORT OF MELBOURNE Page 28 of 296
1 Introduction
Synergies has been engaged by Port of Melbourne (PoM) to provide an opinion on PoM’s
appropriate weighted average cost of capital (WACC) in accordance with the
requirements of the Pricing Order.
The WACC has been estimated in the context of PoM submitting its 2019-20 Tariff
Compliance Statement (TCS) to the Essential Services Commission (ESC) under the
Pricing Order. For ease of reference, each chapter of this report begins with a very brief
description of the relevant parameter values and identifies any changes to the 2018-19
TCS.
The Prescribed Services under the Pricing Order are the relevant services for the
assessment of the WACC.
This report is structured as follows:
• Chapter 2 – WACC formulation
• Chapter 3 – discusses the requirements of the Pricing Order and the use of
well-accepted approaches
• Chapter 4 – defines the benchmark efficient entity (BEE)
• Chapter 5 – assumed capital structure
• Chapter 6 – analyses alternative well-accepted return on equity models
• Chapter 7 – estimates the return on the market as a whole
• Chapter 8 – estimates the return on equity using the SL CAPM
• Chapter 9 – estimates the return on equity using the Black CAPM
• Chapter 10 – estimates the return on equity using the Fama-French Model
• Chapter 11 – estimates the return on debt
• Chapter 12 – estimates the value of gamma
• Chapter 13 – proposes a WACC estimate for the BEE
• Attachment A – presents gearing ratios for our comparable companies set
• Attachment B – presents our full list of asset beta estimates and beta diagnostics
• Attachment C – presents supplementary evidence on our well-accepted return on
equity approaches

DETERMINING A WACC ESTIMATE FOR PORT OF MELBOURNE Page 29 of 296
• Attachment D – presents detailed responses to issues raised in the ESC’s 2018
Interim Commentary
• Attachment E – summarises Australian regulatory precedent on beta determination
• Attachment F – presents supplementary information on market risk premium
estimates
• Attachment G – provides additional detail on the methodology for the listed
comparator WACC estimates calculated in Chapter 13.
• Attachment H – provides supplementary material on the risk-free rate

DETERMINING A WACC ESTIMATE FOR PORT OF MELBOURNE Page 30 of 296
2 WACC formulation
Chapter overview
This chapter sets out the pre-tax nominal WACC formulation that we have used as required by the Pricing Order. This formulation is unchanged from the 2018-19 submission.
2.1 Introduction
An infrastructure service provider, such as PoM, requires significant funding to invest
in and operate its capital-intensive business. These funds must be raised either from
PoM’s shareholders or lenders. The sum of the returns required by equity and debt
holders – weighted by the proportions of equity and debt used in the capital structure –
is often referred to as the weighted average cost of capital (WACC).
2.2 Chosen WACC formulation
2.2.1 Post tax nominal WACC
The approach most commonly applied to estimate WACC in Australian regulatory
regimes is the post-tax nominal ‘vanilla’ WACC. In other words, the rate of return
estimate is expressed as a weighted sum of the returns on equity and debt in inflation-
adjusted and after-tax terms. Under the post-tax nominal ‘vanilla’ WACC formula, tax
is modelled as a cost in the cash flows rather than forming part of the WACC calculation.
It is expressed as follows:
Nominal post-tax WACC =
Where:
Re = post-tax return on equity
Rd = pre-tax return on debt
D = proportion of debt (gearing) within the assumed capital structure
E = proportion of equity within the assumed capital structure
2.2.2 Pre-tax nominal WACC
In contrast, the Pricing Order requires the WACC formula to be expressed in pre-tax
nominal terms. The pre-tax nominal formulation adjusts for taxation and dividend
imputation in the WACC formula rather than the cash flows of the business. It is
expressed as follows:
DE
D
DE
ERR de +
++

DETERMINING A WACC ESTIMATE FOR PORT OF MELBOURNE Page 31 of 296
Nominal pre-tax WACC = ( ) DE
DR
DE
E
t
Rd
c
e
++
+−−*
11
Where:
Re = post-tax return on equity
Rd = pre-tax return on debt
D = level of debt within the capital structure
E = level of equity within the capital structure
t = corporate tax rate
= gamma (value of imputation credits)
An underlying assumption of the pre-tax nominal WACC formulation is that the BEE
will pay the Australian statutory corporate income tax rate of 30%. This is a standard
approach across the broader finance community, whether it be in academic literature,
the corporate finance industry or incentive-based regulatory frameworks, whereby the
cost of capital is established having regard to benchmark efficient costs rather than the
actual costs of the regulated entity. We will continue to monitor developments with the
corporate tax rate in future submissions.
In effect, the return required by equity investors is multiplied by this tax wedge, which
converts the post-tax return on equity to a pre-tax cost of equity. This value is assumed
to provide sufficient revenues to meet the BEE’s tax liabilities.

DETERMINING A WACC ESTIMATE FOR PORT OF MELBOURNE Page 32 of 296
3 Use of one or a combination of well-accepted approaches
Chapter overview
This chapter presents our views on the relevant considerations for well-accepted in the context of the Pricing Order.
3.1 Requirements under the Pricing Order
The key provisions in the Pricing Order in regards to the estimation of a WACC for the
port are Clauses 2.1., 4.1 and 4.3.
Clause 2.1
Prescribed Reference Tariffs must be set so as to allow the Port Licence Holder a
reasonable opportunity to recover the efficient cost of providing all Prescribed Services
determined by an application of an accrual building block methodology of the type
described in clause 4 of the Pricing Order (clause 2.1.1(a)).
Clause 4.1
Sub-clause 4.1.1 requires that for determining its Annual Revenue Requirement, the Port
Licence Holder must apply an accrual building block methodology that, amongst other
things, includes an allowance to recover a return on its capital base that is commensurate
with that which would be required by a BEE providing services with a similar degree of
risk as that which applies to the Port Licence Holder in respect of to the provision of
Prescribed Services (clause 4.1.1(a)).
Clause 4.3
In determining a rate of return on capital allowance for the purposes of clause 4.1.1(a),
the Port Licence Holder must use one or a combination of well-accepted approaches that
distinguish the cost of equity and debt, and so derive a weighted average cost of capital
(clause 4.3.1).
The rate of return is to be calculated on a pre-tax nominal basis.
3.2 Pricing Order provisions
The Pricing Order confers important discretions upon the Port Licence Holder in
determining the WACC and return on capital allowance.
The key guidance provided in the Pricing Order relates to:

DETERMINING A WACC ESTIMATE FOR PORT OF MELBOURNE Page 33 of 296
• The return on PoM’s capital base is to be commensurate with that which would be
required by the BEE providing services with a similar degree of risk as that which
applies to PoM in providing the Prescribed Services;
• the use of one or a combination of well-accepted approaches that distinguish the
cost of equity and debt to determine the WACC; and
• the WACC is to be calculated on a pre-tax nominal basis.
Under the Pricing Order, it is up to the Port Licence Holder to demonstrate how it
complies with the Pricing Order.
As such, the Pricing Order contrasts with the approach adopted in other regulated
processes in Australia, whereby the relevant regulator ultimately holds deterministic
responsibilities on the interpretation of the relevant requirements of the instrument and
the assessment of the appropriate parameter values and rate of return for that
determination.
Considering this guidance and the important discretions conferred upon the Port
Licence Holder, PoM, in determining its WACC, this report presents and substantiates
the estimation of a WACC having regard to relevant estimation methods, asset pricing
models, market data and regulatory precedent, having regard to the requirements of the
Pricing Order.
3.3 Overview of ESC commentary
Since PoM completed its 2017-18 TCS submission, the ESC has published a number of
commentary documents in relation to WACC. These include: Interim Commentary
(November 2017) and Statement of Regulatory Approach (SoRA) (December 2017).7
A key theme emerging from these two documents is the definition of ‘well-accepted’ in
the context of the Port Licence Holder using ‘one or a combination of well-accepted
approaches that distinguish the cost of equity and debt, and so derive a weighted
average cost of capital.’8
PoM has argued that any well-accepted approach must have regard to the terms and
context of the Pricing Order, including to allow PoM a ‘reasonable opportunity to
7 Additional detailed commentary was published by the ESC in 2018 which is addressed later in this report.
8 Port Management Act 1995 (Vic) Pricing Order, Clause 4.3.1.

DETERMINING A WACC ESTIMATE FOR PORT OF MELBOURNE Page 34 of 296
recover the efficient cost of providing all Prescribed Services’, as well as the objectives of
the regulatory regime set out in section 48 of the Port Management Act.9
The ESC disagreed with this interpretation, rather focussing narrowly on approaches
used by economic regulators determining inputs into an accrual building block
methodology.10
The ESC also queries aspects of PoM’s definition of the BEE to be used in the context of
the Port Licence Holder’s calculation of an allowance to recover a risk-weighted return
on its capital base.11
The ESC’s commentary on WACC estimation issues will be examined in the remainder
of this chapter.
3.4 ESC 3-step process for assessing rate of return clauses
The ESC indicated in its SoRA that it will adopt a three-step compliance assessment
framework to assess whether PoM has complied with the requirements of the Pricing
Order and the broader objectives of the Port Management Act.
The ESC’s 2018 Interim Commentary noted that Synergies had concluded that its WACC
estimate ‘satisfies the well-accepted and overall reasonableness stages of the ESC’s
compliance assessment framework, such that further detailed analysis of the proposed
estimate is not required’.12 ESC further goes on to clarify that the SoRA is intended to
guide the port and other stakeholders on how it would likely apply the Pricing Order at
the time of its five yearly compliance assessments under the Port Management Act 1995,
rather than being used to prepare its interim commentaries, which are of a more general
nature.13
We have sought to apply the ESC’s steps, noting the ESC’s commentary is in some cases
expressed in general rather than specific terms. Whilst we seek to apply the ESC’s steps,
our view is that in some cases the ESC commentary presents positions on the
interpretation of the Pricing Order that are at odds with our understanding of the
instrument. We set out our main areas of disagreement in the following sections.
9 Port of Melbourne (2018), 2018 - 2019 Tariff Compliance Statement, General Statement, Appendix I, May, pp 5-6
10 ESC did not provide any further commentary on its interpretation of the well-accepted test in the 2018 Interim Commentary.
11 Port Management Act 1995 (Vic) Pricing Order, Clause 4.1.1.
12 ESC (2018), Interim commentary - Port of Melbourne tariff compliance statement 2018-19, October, p 8
13 ESC (2018), p 8

DETERMINING A WACC ESTIMATE FOR PORT OF MELBOURNE Page 35 of 296
3.4.1 Step 1: Well-accepted test
The first step, “the well-accepted test,” relates to clause 4.3.1 and assesses whether the
approach or combination of approaches used by PoM to determine the allowed rate of
return are “well-accepted.”
Step 1 as applied by the ESC has a narrow focus on approaches accepted by regulators,
and the ESC intends for this to be a qualitative assessment only, with quantitative
evaluation to occur in later steps of the process.
The ESC says that at a minimum, for an approach to be well-accepted by economic
regulators, it must be used by at least one economic regulator to determine the rate of
return in calculating the annual revenue requirement under the building block
methodology. However, in our view, this operates as a constraint on the plain wording
of the Pricing Order and is not required by any of the regulatory objectives underpinning
the Pricing Order.
As we detail in the following sections, our view is that the Pricing Order permits
consideration of approaches that are well-accepted by regulators, by financial
practitioners and by academics.
3.4.2 Step 2: Benchmark efficient entity test
The second step, “the benchmark efficient entity test”, relates to clause 4.1.1 of the
Pricing Order. Accordingly, this step aims to verify whether the return on capital
outcome determined by PoM is commensurate with the required rate of return for the
BEE providing services with a similar degree of risk as that which applies to PoM in
respect of the Prescribed Services.
We expect this assessment will be quantitative with an emphasis on the quantum of the
WACC estimate and its reasonableness. To this end we envisage this step would likely
entail two components.
First, high level cross-checks will be required in order to assess if the overall return is
likely to be commensurate with the returns that would be required by the BEE. Such
cross-checks may involve an appraisal of relevant regulatory decisions, surveys,
valuation and broker reports, and other reference points, such as assessed rates of return
of unregulated comparator entities.
Comparator entities that are adopted must be “efficient” and unlikely to face significant
competition in all of its services and can include relevant Australian and international
regulated and non-regulated entities.

DETERMINING A WACC ESTIMATE FOR PORT OF MELBOURNE Page 36 of 296
Whilst regulatory precedent is clearly relevant, the BEE is not necessarily a regulated
entity. Moreover, relying upon regulatory decisions as benchmarks to assess PoM’s
compliance under the Pricing Order can be problematic.
Regulators are afforded different discretions under different statutory schemes.
Consider, for example, a situation where a regulator is empowered to impose its own
view of a WACC value or approach on a regulated business in preference to an
alternative position put forward by the regulated business that was also consistent with
the relevant statutory tests. The fact that the position put forward by the regulated
business could be accepted will not be relevant to the regulatory outcome in such a case
if the regulator decided to impose a different value or approach. So long as the
regulator’s use of discretion is authorised by the statute that decision will be validly
made. However, it does not necessarily invalidate any position put by the regulated
business.14
Conversely, the Pricing Order confers upon PoM the opportunity to put forward a
position which, if compliant, will not be subject to the regulator imposing an alternative
compliant position. As such, the differing tests become a relevant consideration to the
benchmarking process itself. Regulators assess rates of return under varying legislative
instruments that confer differing degrees of regulatory discretion. A WACC outcome
under a regime that gives the regulator significant regulatory discretion should not set
a cap for PoM under a different regime (such as the Pricing Order) that limits the
regulator’s discretion.
As such, consideration of regulatory benchmarks alone cannot determine PoM’s
compliance with the Pricing Order. Moreover, the WACCs of unregulated businesses
can also be relevant.
At this stage, we consider PoM would be considered in compliance with the Pricing
Order if these cross-checks confirm that the submitted rate of return is consistent with
that required by the BEE providing services with a similar degree of risk as that which
applies to PoM in respect of the Prescribed Services.
However, if the cross-checks suggest the return on capital is not commensurate with that
required by the BEE, then we expect the ESC would seek to identify which specific
components of the WACC are of concern, for further investigation. This could involve a
closer examination of individual parameter estimates, or the way in which individual
14 See, for example, the Australian Competition Tribunal, Application by DBNGP (WA) Transmission Pty Ltd [2018]
ACompT1, July 2018, esp 286-292. Similarly, the recent agreement reached between Aurizon and its coal customers involving a higher cost of capital highlights that regulatory decisions do not reflect the only acceptable value for a rate of return assessment.
DETERMINING A WACC ESTIMATE FOR PORT OF MELBOURNE Page 37 of 296
estimates have been combined to calculate the overall WACC. This is the focus of Step 3.
discussed further below.
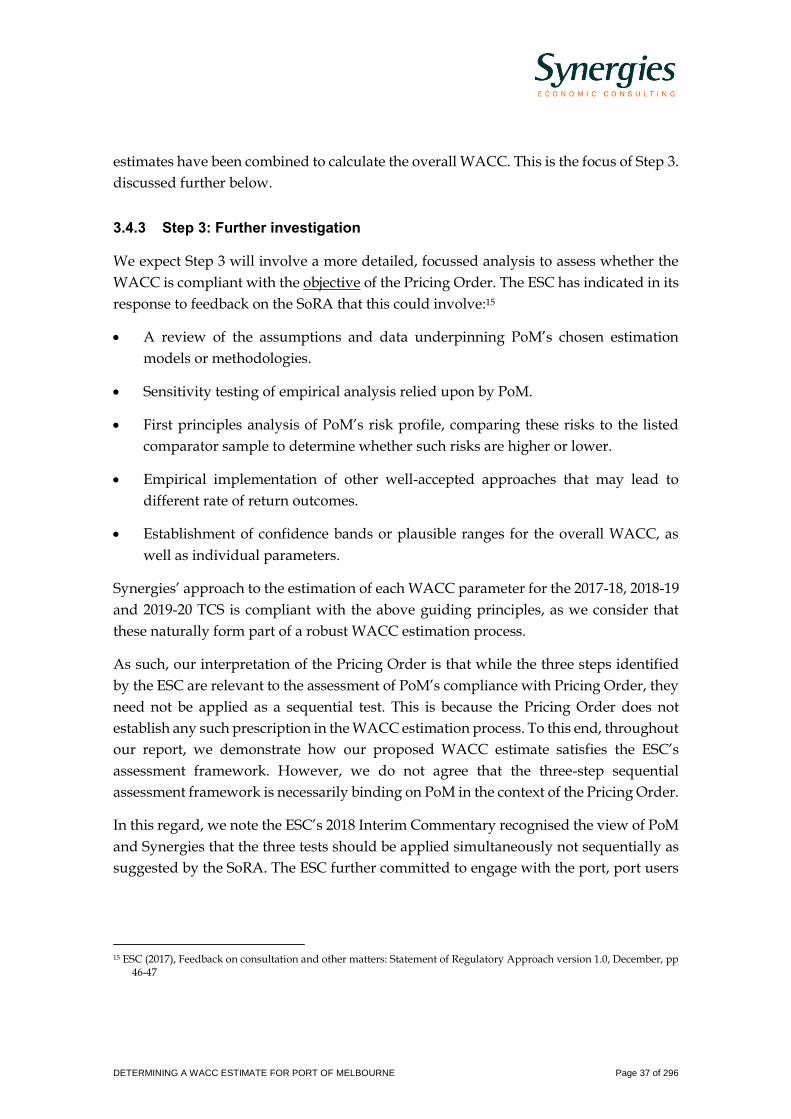
3.4.3 Step 3: Further investigation
We expect Step 3 will involve a more detailed, focussed analysis to assess whether the
WACC is compliant with the objective of the Pricing Order. The ESC has indicated in its
response to feedback on the SoRA that this could involve:15
• A review of the assumptions and data underpinning PoM’s chosen estimation
models or methodologies.
• Sensitivity testing of empirical analysis relied upon by PoM.
• First principles analysis of PoM’s risk profile, comparing these risks to the listed
comparator sample to determine whether such risks are higher or lower.
• Empirical implementation of other well-accepted approaches that may lead to
different rate of return outcomes.
• Establishment of confidence bands or plausible ranges for the overall WACC, as
well as individual parameters.
Synergies’ approach to the estimation of each WACC parameter for the 2017-18, 2018-19
and 2019-20 TCS is compliant with the above guiding principles, as we consider that
these naturally form part of a robust WACC estimation process.
As such, our interpretation of the Pricing Order is that while the three steps identified
by the ESC are relevant to the assessment of PoM’s compliance with Pricing Order, they
need not be applied as a sequential test. This is because the Pricing Order does not
establish any such prescription in the WACC estimation process. To this end, throughout
our report, we demonstrate how our proposed WACC estimate satisfies the ESC’s
assessment framework. However, we do not agree that the three-step sequential
assessment framework is necessarily binding on PoM in the context of the Pricing Order.
In this regard, we note the ESC’s 2018 Interim Commentary recognised the view of PoM
and Synergies that the three tests should be applied simultaneously not sequentially as
suggested by the SoRA. The ESC further committed to engage with the port, port users
15 ESC (2017), Feedback on consultation and other matters: Statement of Regulatory Approach version 1.0, December, pp
46-47

DETERMINING A WACC ESTIMATE FOR PORT OF MELBOURNE Page 38 of 296
and other interested stakeholders on its approach to the interpretation of Pricing Order
provisions and may consider via potential revisions to the SoRA.16
3.5 The relevant context
As noted above, the ESC has proposed in the SoRA that, at a minimum, for an approach
to be well-accepted by economic regulators, it must be used by (or recently used by):
(a) at least one economic regulator to determine the rate of return for the purpose of
calculating the ARR using a building block methodology or;
(b) a review body overseeing decisions by economic regulators.
The ESC further clarifies in relation to (a) above that in certain circumstances, for an
approach to be well-accepted by regulators, it may be that acceptance by one regulator
is enough, but a case by case assessment is required.17
The ESC has also posited that the application of academic and financial market
approaches may disregard the regulatory context in which the allowable rate of return
is being set. This is possible but can be addressed by applying criteria used by regulators
to ensure approaches are compatible with a regulatory environment. For approaches
that can be compatible with a regulatory environment, the key issue relates to PoM’s
compliance with the Pricing Order and, in turn, the relevant statutory objectives.
We set out in the following sections what we consider to be relevant context regarding
interpretation of a well-accepted approach.
3.5.1 Port Management Act 1995 objectives
We consider the ESC’s view regarding the basis upon which an approach can be
considered well-accepted by regulators, operates as a constraint on the plain wording of
the Pricing Order and is not required by any of the regulatory objectives underpinning
the Pricing Order
The Pricing Order is a regulatory instrument made under section 49A of the Port
Management Act 1995 (the PMA).
Part 3 of the PMA establishes the framework for the regulation of port services, including
the objectives to guide interpretation of the Pricing Order. The objectives of most
relevance to the estimation of PoM’s cost of capital are the following:
16 ESC (2018), Interim commentary, p 14
17 Feedback on consultation and other matters: Statement of Regulatory Approach version 1.0 (December 2017) p 41

DETERMINING A WACC ESTIMATE FOR PORT OF MELBOURNE Page 39 of 296
• to promote efficient use of, and investment in, the provision of prescribed services
for the long-term interests of users and Victorian consumers (s48(1)(a));
• to protect the interests of users of prescribed services by ensuring that prescribed
prices are fair and reasonable whilst having regard to the level of competition in,
and efficiency of, the regulated industry (s48(1)(b)); and
• to allow a provider of Prescribed Services a reasonable opportunity to recover the
efficient costs of providing Prescribed Services, including a return commensurate
with the risks involved (s48(1)(c)).
Further, the Pricing Order provides for the Port Licence Holder to be allowed a
reasonable opportunity to recover the efficient cost of providing all Prescribed Services
determined by application of an accrual building block methodology.
These objectives reflect the intention of all Australian economic regulatory regimes to
ensure that efficient outcomes consistent with those found in a workably competitive
market are achieved. That is, the Pricing Order is intended to operate as “a surrogate for
the rewards and disciplines normally provided by a competitive market.”18 In applying
the Pricing Order, the ESC must have regard to its objectives in the Essential Service
Commission Act to promote the long-term interests of Victorian consumers. In
performing its functions and exercising its powers, the ESC must also have regard to the
price, quality and reliability of essential services. In seeking to achieve the objective, it
must also have regard to, amongst other things, efficiency in the relevant industry,
incentives for long term investment and the benefits and costs of regulation for
consumers and regulated entities.19 The following discussion is relevant to the
application of the PMA and ESC Act objectives.
The inherent imprecision of the process for estimating the cost of equity (particularly)
has been well documented. Unlike, for example, the cost of debt, where there are
observable benchmarks, the cost of equity can only be inferred. Not only is there
controversy over the most appropriate model to apply to infer the cost of equity, there
is also controversy over parameter values in respect of each model. This lack of
observability means that the estimation of the cost of equity is imprecise. This creates a
challenge for regulatory processes, where estimating the cost of capital is a key
parameter in an accrual building block model.
These considerations inform the Pricing Order. It is for the Port Licence Holder to
present a position to the ESC and to demonstrate compliance with the Pricing Order,
18 East Australian Pipeline v Australian Competition and Consumer Commission (2007) 233 CLR 229, para. 81.
19 Essential Services Commission Act 2001 (Vic), sections 8 ad 8A

DETERMINING A WACC ESTIMATE FOR PORT OF MELBOURNE Page 40 of 296
rather than the ESC determining through the exercise of regulatory discretion its
preferred position which is then applied. This “compliance” approach in the Pricing
Order represents an important means of minimising perceived regulatory risk. The
regulatory risk associated with the inherent imprecision of the WACC is ameliorated in
a compliance framework, as compared to a determination framework.
This in turn can be expected to enhance the Port Licence Holder’s confidence in the
regulatory arrangements and provide a vehicle for greater stability in returns. This is an
important consideration for the Port Licence Holder and Victorian consumers alike,
largely because of the asymmetric consequences of regulatory error as it affects
establishing cost of capital estimates.
Asymmetric consequences of regulatory error
Regulatory processes that ascribe an unrealistic degree of precision to the calculation of
the rate of return, particularly in estimating the return on equity (which is unobservable),
create a heightened risk of regulatory error.
We consider that the Pricing Order’s requirements regarding the use of one or a
combination of well-accepted approaches that distinguish the cost of equity and debt is
directed to mitigating the potential for regulatory error in estimation of the cost of
capital, given it will be the primary driver of PoM’s ongoing incentive to invest over the
lease term.
In a general sense, the application of economic regulation affects a very high proportion
of a regulated service provider‘s cash flows in relation to the regulated services given
the generally large fixed capital nature of regulated service provision. This is true for
PoM and its provision of Prescribed Services. Accordingly, it could reasonably be
expected that the ESC’s decisions on PoM’s proposed the cost of capital on its existing
capital base will exert a considerable influence on PoM’s future investment plans.
In contrast, even though users of Prescribed Services are more numerous, they are
considerably less exposed to the ESC’s decisions under the Pricing Order, particularly in
the short term. For example, it is atypical for any customer of a regulated entity to have
more than 10 per cent of its costs affected by a regulated service.
Hence, from an economic perspective, the adverse impact of prices of regulated service
being marginally higher than the economic regulator believes is optimal (allocative
inefficiency) in the short term are generally not large relative to the long-term costs
associated with under-pricing of infrastructure assets and the consequential under-
investment in those assets over time (dynamic inefficiency). Understanding this
asymmetry is important in resolving the tension that arises from the inherent
imprecision of regulatory parameters, including the cost of capital.

DETERMINING A WACC ESTIMATE FOR PORT OF MELBOURNE Page 41 of 296
The Productivity Commission has characterised the issue of asymmetric consequences
of regulatory error as follows:20
…. the Commission does not subscribe to the view that, in a regulated environment,
the community faces a choice between incurring the allocative efficiency costs of over-
compensation and (more serious) dynamic costs of under-compensation. Both types
of error are likely to influence investment outcomes and therefore have dynamic
efficiency implications.
Nonetheless, the Commission accepts that there is a potential asymmetry in effects:
• Over-compensation may sometimes result in inefficiencies in the timing of
new investment in essential infrastructure (with flow-ons to investment in
related markets), and occasionally lead to inefficient investment to by-pass
parts of a network. However, it will never preclude socially worthwhile
investments from proceeding.
• On the other hand, if the truncation of balancing upside profits is expected to
be substantial, major investments of considerable benefit to the community
could be forgone, again with flow-on effects for investment in related
markets.
In the Commission’s view, the latter is likely to be a worse outcome. Accordingly, it
concurs with the argument that access regulators should be circumspect in their
attempts to remove monopoly rents perceived to attach to successful infrastructure
projects.
In practice, the full effects of regulatory errors associated with under-compensation for
regulated infrastructure investments are not realised until the long term, because it is in
the long-term that the effects of under-investment and the high costs associated with
remedying this outcome are understood. Potentially adverse consequences of PoM’s cost
of capital being set too low include:
• Future investment in the port to increase capacity being adversely affected (stifled,
delayed, distorted)
• inefficient use of Prescribed Services, including rationing of constrained available
capacity or users being forced to utilise surrounding ports that impose additional
transport costs and may not be as efficient;
20 Productivity Commission (2001). Review of the National Access Regime, Report No. 17, AusInfo, Canberra, p.83.

DETERMINING A WACC ESTIMATE FOR PORT OF MELBOURNE Page 42 of 296
• adverse consequence on efficiency of the transport supply chain servicing PoM
because required port infrastructure is not built in timely manner or at all; and
• more generally, the adverse flow-on economic impacts for the Victorian and
national economies given the economic value generated by the PoM supply chain.
Balancing long-term and short-term consumer interests
Recognising the importance of investment incentives in a regulatory context is not to say
that excessive compensation of an infrastructure owner (relative to the outcomes of a
workably competitive market) is benign – such an outcome will tend to harm consumers
in the short run (through higher than necessary charges) and in the long run (through
incentivising gold plating).21
In this regard, the impact of the Tariff Adjustment Limit (TAL) (which constrains PoM’s
price increases to a level below efficient cost recovery) means that even if the WACC is
excessive, these adverse incentives will not arise for the foreseeable future in relation to
the PoM. However, in the longer term the concerns remain relevant.
The Australian Energy Market Commission has characterised the balancing of short and
long-term considerations as it affects investors in regulated energy infrastructure and
users of the services of that infrastructure as follows:22
The concept of the 'long-term' recognises that there is an inherent trade-off between
consumers today, and consumers in the future. Changes that may be in consumers'
short-term interests may not be in their long-term interests if those changes
undermine incentives to make efficient investments and operational decisions over
time. Generally, making changes specifically to provide customers with short-term
price decreases at the expense of enabling investors to recover a return of and return
on efficient investment will not be in the long-term interests of consumers.
Similarly, the Productivity Commission has commented on balancing short-term and
long-term efficiency considerations in determining the cost of capital under the
Australian electricity regulatory framework:23
... while the allocative inefficiency effects of small price increases are modest in the
short term, they still matter in other respects, and the transfers to producers from
setting the WACC too high would potentially not be consistent with the National
21 Clause 4.2.1(c) of the Pricing Order requires capital expenditure be undertaken prudently and efficiently.
22 AEMC (2016), Applying the energy objectives, A guide for stakeholders, December, p 6
23 Productivity Commission (2013), Electricity Network Regulatory Frameworks, Volume 1, April, p 206

DETERMINING A WACC ESTIMATE FOR PORT OF MELBOURNE Page 43 of 296
Electricity Objective. On the other hand, while setting the regulatory WACC
[weighted average cost of capital] too low would lower prices to end users in the short
run, it might make it difficult for firms to recover their efficient costs in the long term.
This would contravene the revenue and pricing principles of the National Electricity
Law, and in any case would not be in the long-term interest of consumers.
The key issue is that any quest for unrealistic precision in the application of models to
estimate the WACC, including through a narrow interpretation of any such models that
are well-accepted, will not be in the long term interests of Victorian consumers if it
ultimately discourages future investment at the port such that Prescribed Service
provision is compromised. The potential for this situation to arise is exacerbated by the
cost of capital outcomes in recent Australian regulatory decisions.
Port charges represent a very small proportion of the total supply chain cost of any
product that is handled through the port (eg generally significantly less than 10% of the
cost of importing a container). The long term interests of Victorian consumers are likely
to be advanced by ensuring they secure the benefit of an efficient port that promotes
efficient supply chains at a sustainable price rather than through potentially
undermining investment incentives through commercially unsustainable WACC
outcomes that do not make due allowance for the imprecision of WACC parameters. The
risk of commercially unsustainable WACC outcomes that do not make due allowance
for the imprecision of parameters can be seen in recent regulatory decisions.
Impact of recent Australian WACC decisions
In recent years, infrastructure owners have seen their returns allowed by Australian
economic regulators drop significantly. First, and not unexpectedly, from lower risk-free
rates. Second, and more of concern, through a series of regulatory decisions where
parameter values have been varied to reduce the equity returns of regulated
infrastructure owners.
These changes have coincided with unprecedented political controversy over the cost of
living pressures associated with regulated infrastructure, particularly in the energy
sector. As an example, the effect of this political pressure has been reflected quite starkly
in the allowed return on equity for electricity transmission businesses since 200024.
Normalising the large reduction in the risk-free rate since the early 2002s, Table 6 shows
that the pre-tax return on equity margins above the risk free rate (whether pre or post
tax) have halved over the period (the pre-tax return on equity margin falling from 9.48%
in 2000 to 4.56% in 2018).
24 For illustrative purposes prior to the introduction of the National Electricity Rules and establishment of the AER, we
have used ACCC decisions in 2000 and 2005 for the NSW electricity transmission entity, TransGrid.

DETERMINING A WACC ESTIMATE FOR PORT OF MELBOURNE Page 44 of 296
Table 6 Electricity transmission return on equity allowances (2000-present)
ACCC 2000 TransGrid decision
ACCC 2005 Transgrid Decision
AER 2009 TNSP and DNSP decision
AER 2013 Rate of Return Guideline
AER 2018 Rate of Return
Instrument
Risk-free rate 6.81% 5.98% 5.68% 4.17% 2.70%
Equity beta 1.0 1.0 0.8 0.7 0.6
MRP 6.00% 6.00% 6.50% 6.50% 6.10%
Gamma 0.5 0.5 0.65 0.5 0.585
Post-tax return on equity 13.85%a 11.98% 10.88% 8.72% 6.36%
Margin above risk-free rate 7.04% 6.00% 5.20% 4.55% 3.66%
Pre-tax return on equity 16.29% 14.09% 12.16% 10.26% 7.26%
Margin above risk-free rate 9.48% 8.11% 6.48% 6.09% 4.56%
Total market return (post-tax) 12.81% 11.98% 12.18% 10.67% 8.80%
a The 2000 return on equity was selected using discretion from a range of 11.50%-14.45%.
Source: Synergies analysis of AER and ACCC decisions
In our view, this fall in the margin above the risk free rate over 20 years is unrelated to
the market risks facing investors in the Australian electricity transmission sector, nor has
this fall been substantiated by the AER on the basis of any such de-risking over time
(indeed, systematic risk for the sector is likely to have increased due, amongst other
things, to increased systematic regulatory and stranding risk). Rather, it appears that the
AER is now taking lower bound positions on all cost of equity parameters that, in
aggregate, have resulted in a sharply lower estimate of the margin above the risk free
rate in 2018.
Further, the impact of these regulatory WACC decisions has not been confined to energy
network businesses. Most recently, the WA Economic Regulation Authority’s decision
to reduce the MRP by 1.3% alone reduced the pre-tax nominal return of the Pilbara
railways by approximately 160 basis points (and by approximately 200 basis points
when combined with the impact of an increase in the value of gamma).
In our view, these changes have undermined the stability of WACC frameworks and, as
a consequence, reduced confidence in regulatory regimes amongst infrastructure
owners. This affects both the cost of debt25 and equity26.
25 Ratings agencies consider the stability and predictability of an entity’s regulatory environment in their ratings
assessments.
26 Antoniou, A., Pescotto, G. (1997). ‘The effect of regulatory announcements on the cost of capital of British Telecom’, Journal of Business, Finance & Accounting 24(1), 1-25.

DETERMINING A WACC ESTIMATE FOR PORT OF MELBOURNE Page 45 of 296
As previously discussed, whilst lower prices can be to customers’ benefit in the short
term, in the longer term their interests are best served by stable regulatory regimes that
instil confidence that efficient infrastructure owners can earn a return commensurate
with risk and thereby encourage efficient investment. This is because a regulatory
environment which minimises the perceived risk of investing in regulated
infrastructure, in turn, encourages efficient investment in that infrastructure at lower
long term cost to the consumer.
The long term impact of recent lower WACC decisions by regulators remains to be seen,
although it is entirely conceivable that they may increase the returns equity holders
demand to invest in infrastructure relative to an environment in which the regulated
rates of return is accepted as stable and sufficient for efficient infrastructure investment.
Implications for interpretation of the Pricing Order - balancing and reconciling objectives
Balancing the competing legislative objectives requires interpreting the Pricing Order
holistically. A key objective that arises when considering the rate of return is promoting
efficient use of, and investment in, the provision of Prescribed Services for the long-term
interests of users and Victorian consumers. The Pricing Order further provides for an
allowance to recover a return on PoM’s capital base which is commensurate with that
required by the BEE providing services with a similar degree of risk as that which applies
to the Port Licence Holder in respect of the provision of the Prescribed Services.
In practice, we consider that this means avoiding a rigid and narrow interpretation of
the Pricing Order that undermines the longer term stability of the WACC, particularly
in the context of the inherent imprecision involved in estimating the cost of capital.
Further, adopting such an approach will create a stable and consistent investment
environment for PoM in the long-term, which we consider is in accordance with the
intent of the Pricing Order and the achievement of the relevant statutory objectives. That
is, to provide confidence to PoM that compliant proposed positions on its estimated cost
of capital will not be rejected.
In contrast, pursuit of unattainable precision in setting the cost of capital is likely to
adversely affect PoM’s incentives to undertake efficient investment, which would be
contrary to the long-term interests of Victorian consumers. In this regard, the design of
the Pricing Order, including the discretions it confers upon the Port Licence Holder
regarding its application of well-accepted approaches to estimating its cost of capital,
recognised and sought to assuage the risks associated with regulatory decision making.

DETERMINING A WACC ESTIMATE FOR PORT OF MELBOURNE Page 46 of 296
Appropriateness of constraints on well-accepted approaches
In our view, it is not inconsistent with the Pricing Order and the PMA objectives to
permit a consideration of “well-accepted” approaches that includes the approaches
accepted by regulators (both Australian and international), as well as those approaches
adopted by the financial and academic communities.
All these communities ultimately seek to estimate or analyse efficient returns on capital
of entities from the perspective of a workably competitive market consistent with the
efficiency assumption of the BEE and the efficiency objectives of the PMA (both of which
are intended to reflect the out-workings of a workably competitive market in
remunerating and attracting capital investment on an efficient basis). It is therefore
inappropriate to limit the meaning of “well-accepted” to only those approaches adopted
by regulators or the more limited subset of Australian regulators.
Further, an economic regulator making decisions and exercising discretions under a
different regulatory framework to the Pricing Order should not have particular standing
or persuasive force in the context of PoM’s compliance with the Pricing Order. It also
highlights the risks of benchmarking cost of capital estimates developed under different
regulatory frameworks, particularly in the context of sharply declining allowed rates of
return by economic regulators as discussed above.
However, this is not to say that our proposed WACC methodology is inconsistent with
regulatory precedent. Table 7 outlines the evidence from economic regulators in support
of the approaches that we have used.
Table 7 Regulatory precedent for WACC proposal
WACC component Proposed approach Use by economic regulators
Risk-free rate 20-day average on 10-year Commonwealth Government bonds
Used by numerous Australian and international regulators
Capital structure Gearing based on median and average from sample of comparable listed and unlisted entities.
Gearing based on median or average of relevant comparator sample.
Return on equity
Multi-model approach, consisting of:
SL CAPM SL CAPM is widely used by regulators. It is also widely used by financial practitioners, albeit in conjunction with adjustments, as demonstrated by the evidence we have gathered.
Black CAPM The AER has endorsed the Black CAPM in its Rate of Return Guideline and uses it indirectly to inform the asset beta component of its cost of equity estimate. Also used in US and Canadian regulatory decisions.
Fama-French Model (FFM) IPART has announced that it will monitor the FFM over the next 5 years. Endorsement of FFM by NZ Commerce Commission, as well as regulatory use in the UK and US.
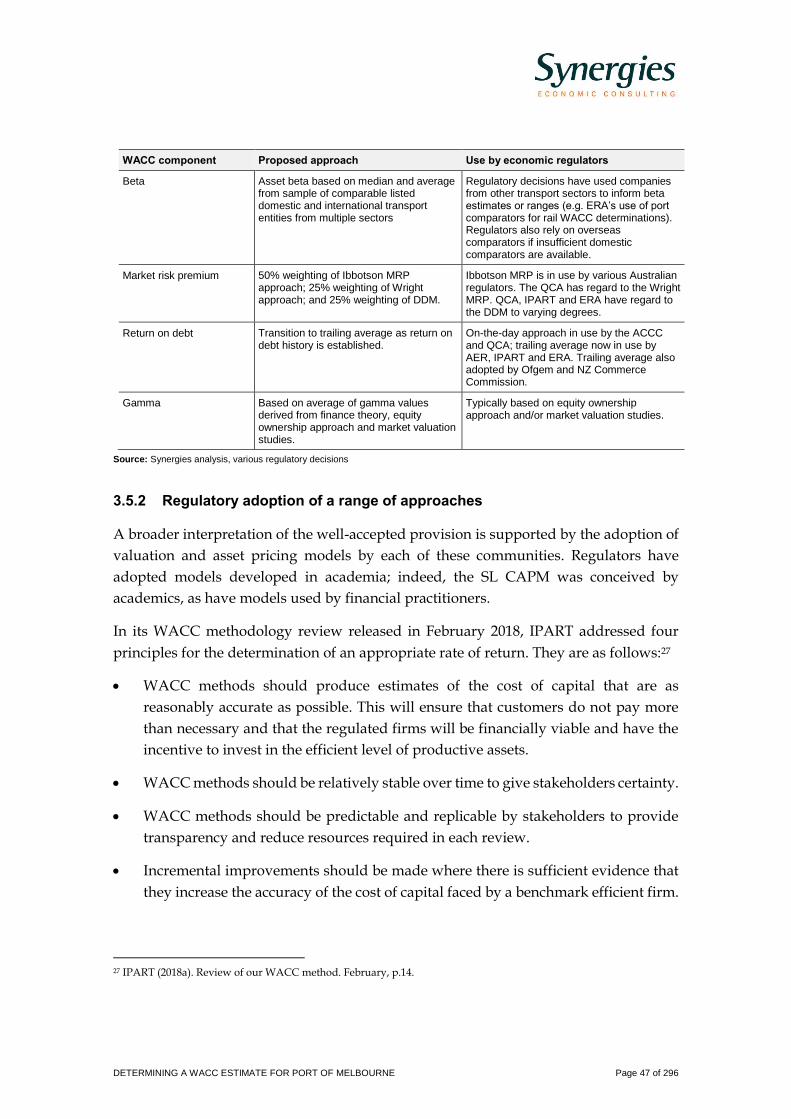
DETERMINING A WACC ESTIMATE FOR PORT OF MELBOURNE Page 47 of 296
WACC component Proposed approach Use by economic regulators
Beta Asset beta based on median and average from sample of comparable listed domestic and international transport entities from multiple sectors
Regulatory decisions have used companies from other transport sectors to inform beta estimates or ranges (e.g. ERA’s use of port comparators for rail WACC determinations). Regulators also rely on overseas comparators if insufficient domestic comparators are available.
Market risk premium 50% weighting of Ibbotson MRP approach; 25% weighting of Wright approach; and 25% weighting of DDM.
Ibbotson MRP is in use by various Australian regulators. The QCA has regard to the Wright MRP. QCA, IPART and ERA have regard to the DDM to varying degrees.
Return on debt Transition to trailing average as return on debt history is established.
On-the-day approach in use by the ACCC and QCA; trailing average now in use by AER, IPART and ERA. Trailing average also adopted by Ofgem and NZ Commerce Commission.
Gamma Based on average of gamma values derived from finance theory, equity ownership approach and market valuation studies.
Typically based on equity ownership approach and/or market valuation studies.
Source: Synergies analysis, various regulatory decisions
3.5.2 Regulatory adoption of a range of approaches
A broader interpretation of the well-accepted provision is supported by the adoption of
valuation and asset pricing models by each of these communities. Regulators have
adopted models developed in academia; indeed, the SL CAPM was conceived by
academics, as have models used by financial practitioners.
In its WACC methodology review released in February 2018, IPART addressed four
principles for the determination of an appropriate rate of return. They are as follows:27
• WACC methods should produce estimates of the cost of capital that are as
reasonably accurate as possible. This will ensure that customers do not pay more
than necessary and that the regulated firms will be financially viable and have the
incentive to invest in the efficient level of productive assets.
• WACC methods should be relatively stable over time to give stakeholders certainty.
• WACC methods should be predictable and replicable by stakeholders to provide
transparency and reduce resources required in each review.
• Incremental improvements should be made where there is sufficient evidence that
they increase the accuracy of the cost of capital faced by a benchmark efficient firm.
27 IPART (2018a). Review of our WACC method. February, p.14.

DETERMINING A WACC ESTIMATE FOR PORT OF MELBOURNE Page 48 of 296
Similarly, in its December 2013 Better Regulation – Rate of Return Guideline, the AER
considered that rate of return decisions should use “estimation methods, financial
models, market data and other evidence that are, where applicable, reflective of
economic and finance principles and market information.”28 Furthermore, such
approaches should be “informed by sound empirical analysis and robust data” and
should be “sufficiently flexible as to allow changing market conditions and new
information to be reflected in regulatory outcomes as appropriate.”
We consider a relevant WACC assessment approach should adhere closely to the
regulatory principles identified above (i.e. accuracy, stability, predictability,
replicability, transparency) rather than simply reducing to an assessment of whether an
aggregate WACC estimate or component parameter estimate is accepted by one or more
regulators. This is particularly the case due to the specific circumstances relevant to PoM
and the regulatory framework that is being applied to it, which differs in important
respects from the regulatory frameworks from which other regulatory decisions are
drawn.
Table 8 shows how we have applied these criteria to our proposed WACC submission
for PoM.
28 AER (2013a). Better regulation – rate of return guideline, December, p.6.

Table 8 Application of IPART and AER criteria to PoM WACC submission
Parameter Accuracy Stability and predictability
Transparency and replicability
Reflective of economic/financial principles
Flexibility with changing market conditions
Robust data
Risk-free rate 20-day average avoids one-off anomalies whilst capturing recent market conditions
Risk-free rate will change with market conditions, but 20-day average will be a stable estimator of current underlying conditions
RBA dataset is publicly available
10-year government bond corresponds to PoM’s long-term investment horizon
20-day average will incorporate changes in market conditions promptly
RBA is acknowledged as a reliable data source and is frequently used by regulators
Capital structure Observed gearing of listed firms is the best proxy for unobservable BEE, supplemented by privatisation evidence
5 and 10-year comparator averages less susceptible to short-term fluctuations
Gearing data from Bloomberg is publicly available
Firms with similar risk profiles to PoM will maintain similar capital structures
Changes in gearing will be incorporated into averages over time.
Bloomberg is a globally-recognised data source. Other relevant data sources verified.
SL CAPM Empirical shortcomings in SL CAPM imply that it may underestimate the return on equity, particularly for entities with equity betas less than 1
SL CAPM remains stable provided estimates of risk-free rate and MRP are responsive to changes in market conditions
Formula is easy to apply
SL CAPM empirical performance is poor
Changes in return on equity will be driven by changes in risk-free rate, beta and MRP
SL CAPM is a function of the risk-free rate, beta and MRP, all of which are based on robust data
Black CAPM Use of zero beta premium corrects for low-beta bias of SL CAPM
Relationship between SL CAPM and Black CAPM is well-defined
We have updated the zero-beta premium estimate to be 3.36%
Low-beta bias is empirically observed
Changes in return on equity will be driven by changes in risk-free rate, beta and MRP
Zero beta premium can be derived from market data
Fama-French Model FFM accounts for factors not captured by CAPM. Widely recognised
Averaging across all firms in the comparator set reduces the impact of outliers
We have provided an extensive description of our approach
Listed entity size and value premiums have been consistently observed around the world
FFM results in a more rigorous estimate of the return on equity
Professor French’s dataset is globally recognised
Beta Our use of different sectors establishes a reasonable range for PoM’s asset beta
Large number of comparator companies and 5/10-year averages/medians reduces impact of outliers
All beta estimates can be replicated via Bloomberg, and we have detailed our de-levering process
Companies with similar risk profiles will tend to share similar exposure to systematic risk
Long-term averages will gradually incorporate changes in companies’ exposure to systematic risk
Data on beta is based on observed security returns from Bloomberg, a globally recognised data source
Market risk premium (Ibbotson MRP)
Historical averages based on observed market returns.
Historical averages fluctuate less than forward-looking
We have detailed our approach to calculating the
Ibbotson MRP captures the stability of the MRP under conventional market
Ibbotson MRP does not adjust in response to risk-free rate – hence
Bloomberg is a globally recognised data source, and

Parameter Accuracy Stability and predictability
Transparency and replicability
Reflective of economic/financial principles
Flexibility with changing market conditions
Robust data
estimates. However, from a total market return perspective it is less stable than the Wright and DDM methodologies
Ibbotson MRP using publicly available data
conditions, but may be misrepresentative if the risk-free rate deviates from the same long-term average used for the market return calculation (i.e. the sum of the RFR and MRP do not equal the long-term Market Return)
our 50:25:25 weighting with the Wright MRP and DDM methodologies respectively
NERA MRP data is well recognised in Australia
Market risk premium (Wright MRP)
Historical averages based on observed market returns.
The historical average of total market return fluctuates less than forward-looking estimates i.e. whilst Wright can fluctuate due to changes in RFR, when combined with prevailing RFR it is relatively stable
We have detailed our approach to calculating the Wright MRP using publicly available data
Wright MRP reflects empirical tendency for return on equity to remain relatively stable over time
Wright MRP adjusts in response to risk-free rate
Bloomberg is a globally recognised data source, and NERA MRP data is well recognised in Australia
Dividend Discount Model (MRP)
Forward-looking estimate based on current dividend yields and assumed long-term dividend growth rate, but sensitive to these assumptions
Fluctuations in DDM estimates arise from changes in reported dividend yields reflecting changing market conditions. However, similar to Wright, since dividend yields are strongly correlated with changes in RFR, when observed from a total market return perspective, DDM is relatively stable
We have detailed our approach to calculating the MRP using publicly available data and three DDM models, allowing replicability of results.
DDM estimates are based on prevailing stock prices and dividend yields, so are more likely to provide a true forward-looking estimate than historical averages
By design, DDM adjusts in response to changing dividend yields reflecting prevailing market conditions
Bloomberg is a globally recognised data source, reported stock prices and dividends are reliable
Return on debt Short term averages from RBA and Bloomberg will reliably estimate the current return on debt, although the actual return on debt will vary over time with market conditions. A trailing average approach will more
Trailing average may offer more stability over the long run
RBA and Bloomberg data is publicly available, and we have detailed the adjustments we have made to the raw estimates
Trailing average may better reflect efficient debt management practices once return on debt history is established
Return on debt methodology will reflect changes in the risk premium attributable to a BBB credit rating over time. Trailing average may be more representative of actual
Historical evidence suggests that neither RBA nor Bloomberg approach has been systematically higher than the other

Parameter Accuracy Stability and predictability
Transparency and replicability
Reflective of economic/financial principles
Flexibility with changing market conditions
Robust data
accurately reflect the efficient cost of debt under the corresponding debt management strategy
debt management practices
Gamma Combination of well-accepted approaches avoids reliance on a single method that may promote over or underestimation of the parameter
Consecutive dividend drop-off studies indicate gamma value of 0.25. Foreign status of marginal investor unlikely to change over investment horizon, implying zero gamma value
Evidence on gamma is well-documented in financial practice and academic journals
Marginal investor is likely to be foreign in Australia given size of domestic market, meaning that imputation credits are valued well below face value
The estimate of gamma is less likely to vary than other parameters over time assuming investors’ required post-tax return on equity is stable
Dividend drop-off studies are based on observed market data
Source: Criteria are derived from IPART WACC Methodology (2018) and AER Better regulation – rate of return guideline (2013)

DETERMINING A WACC ESTIMATE FOR PORT OF MELBOURNE Page 52 of 296
Similar principles may also be found in financial or academic sectors. Like regulators,
financial practitioners have adopted and adapted models developed in academia,
including the SL CAPM. Similarly, in the regulatory sphere we have seen the
development of adaptations or new approaches for specific WACC input parameters for
use in the accrual building block methodology, including the recent introduction of the
trailing average cost of debt. This suggests that regulators themselves are borrowing
knowledge and learnings from these other communities to apply to the specific needs of
a regulatory framework.
A failure to consider these broader models may result in an estimate of required returns
that does not meet the requirements of clause 4.1.1(a) of the Pricing Order and fails to
achieve the objectives of the Port Management Act.
3.5.3 Inappropriate to unduly limit the discretion of PoM
In the Consultation Paper, the ESC describes the Pricing Order as a price compliance
regime, which it distinguishes as being lighter handed than a price determination
regime. The ESC describes the Pricing Order as: 29
a unique form of regulation best described as a price compliance regime. It represents
a more heavy-handed form of regulation than a typical price monitoring regime, but
is lighter handed than a price determination regime.
As a “price compliance regime,” the Pricing Order establishes a set of processes for PoM
to follow in setting prices for its Prescribed Services that must provide it with a
reasonable opportunity to recover efficient costs. This includes placing a CPI-based cap
on prescribed service tariff increases for the first 20 years of the lease term. It is an
important feature of the regime that it is for PoM to apply the Pricing Order, not for the
ESC to determine an outcome and impose it on PoM.
The PMA provides that, should PoM be unable to demonstrate compliance with the
Pricing Order and that non-compliance is properly found to be in a significant and
sustained manner, the form of regulation can change with a heavier-handed approach
implemented in place of the Pricing Order framework.
In our view, these features of the regulatory regime reflect the fact that the Victorian
Parliament intended there to be greater discretion afforded to PoM in applying the
Pricing Order when compared to the more constrained role it would have under a
conventional price determination regime. Indeed, it is likely that current prices for
29 ESC (2017a). Regulatory approach to the Pricing Order – a consultation paper, May, p.3.

DETERMINING A WACC ESTIMATE FOR PORT OF MELBOURNE Page 53 of 296
Prescribed Services would be significantly higher under a conventional price
determination regime given PoM’s current deferral of recovery of depreciation under
the TAL.
That is, PoM is conferred an important discretion in the first instance when establishing
the parameters of the building block model for the purposes of complying with the
Pricing Order. That discretion is not constrained by the issue of whether or not an
approach is well accepted by reference only to regulators.
The inevitable imprecision in estimating the cost of equity means that considerable
judgement is necessarily applied – not only in relation to a particular model or models
to apply, but also to the parameter values that are adopted in the application of any
model.
The discretion afforded to the Port Licence Holder must be considered in this context. It
is a discretion to utilise models that meet the threshold test of well accepted in the context
of the Pricing Order. It is not limited by approaches that have been adopted in regulatory
regimes that themselves involve significantly different tests and confer different
discretions on regulators and the businesses compared to the Pricing Order.
Interpreting well-accepted approaches broadly gives the regulatory regime the
flexibility necessary to quickly adjust to developments in knowledge and learning by
academia and the financial industry in relation to the weighted average cost of capital.
There is no reason to suggest that a breakthrough model developed and accepted in
academia, or by the financial community, should not be considered well-accepted for
the purposes of the Pricing Order simply because other regulators (operating with very
different tests and legislative approaches to those contained in the Pricing Order) are yet
to adopt it. That approach is too narrow. This can also be seen in the language of the
Pricing Order.
3.5.4 The Pricing Order is drafted in an open way
The language of the Pricing Order does not limit the meaning of the phrase “well-
accepted” other than that it should be interpreted in a manner consistent with its
purpose relating to clause 4.1.1(a). Accordingly, the phrase should be given its natural
meaning.
In our view, the natural meaning of the phrase “well-accepted” in clause 4.3.1 is not
“well-accepted by Australian regulators or regulators elsewhere”. The ESC’s approach
seeks to read words into clause 4.3.1 that do not exist. Indeed, if that was Parliament’s
intention clearer wording could easily have been incorporated into the Pricing Order.
As such, it is inappropriate for the ESC to interpret the Pricing Order so as to limit PoM’s

DETERMINING A WACC ESTIMATE FOR PORT OF MELBOURNE Page 54 of 296
discretion to determine a well-accepted approach to only those approaches accepted by
economic regulators. It is necessary to consider the context of the Pricing Order (and, in
turn, the statutory objectives in the Essential Services Commission Act and Port
Management Act).
As such, we accept that the well accepted approaches that we have identified as being
relevant must be appropriate for use in the context of the Pricing Order as opposed to
be currently in use by regulators.
In our view, clause 4.3.1 permits an approach well-accepted by global regulators, by the
financial community or by academia to be considered for being well-accepted for the
purposes of the Pricing Order. Such approaches clearly fall within the broad natural
meaning of the phrase “well-accepted” and are therefore contemplated as being able to
be used by PoM when determining the weighted average cost of capital.
The broad language incorporated into the Pricing Order, including the express reference
to “a combination of well-accepted approaches,” reflects recognition in other regulatory
regimes that a range of approaches can be used to inform an assessment of the
parameters for the weighted average cost of capital. For example, the AER and ERA were
directed to a broader consideration when determining the return on equity and the
return on debt for electricity networks and regulated gas pipelines in 2012 following a
rule change made by the AEMC. The Pricing Order has been drafted reflecting this trend.
However, the Pricing Order is different from the instruments governing the AER and
ERA processes in the sense that it confers the discretion on the Port Licence Holder so
long as the Port Licence Holder adopts one or a combination of well-accepted
approaches and otherwise demonstrates compliance with the Pricing Order. It is
therefore submitted that the ESC’s assessment of the Port Licence Holder’s compliance
with the Pricing Order should be applied in this context.
3.6 Determining one or a combination of approaches
In considering the component parts of PoM’s weighted average cost of capital, including
its cost of equity, cost of debt and individual WACC parameters, we have canvassed
what we believe to be well-accepted approaches. The Pricing Order is silent in terms of
how PoM should apply a combination of well-accepted approaches.
Each approach that is adopted for the assessment of the cost of capital reflects a model.
A model, is, by definition, an abstraction of reality. It would be surprising if a single
model was so superior to any other that it, and it alone, would be appropriate. As such,
a range of models, and the values that emerge from their application, can properly

DETERMINING A WACC ESTIMATE FOR PORT OF MELBOURNE Page 55 of 296
inform the assessment of the cost of capital under the Pricing Order. This seems to be
acknowledged by the Pricing Order itself.
In some cases, where we acknowledge concerns raised about particular approaches, we
have adjusted weightings relative to those used in previous years. Where we do not
identify strong, compelling arguments to give more weight to one well-accepted
approach over another, we have applied equal weightings.
We have taken this position because all well-accepted approaches have strengths and
weaknesses, such that exclusive reliance on a single well-accepted approach is unlikely
to provide the most reliable estimate of the cost of capital. Rather, our intent has been to
provide a transparent, unbiased weighted average cost of capital, which is stable over
time and is reflective of economic and finance principles and market information. Each
subsequent period, PoM will need to reassess this approach and the fundamental pros
and cons of well-accepted estimation methods to substantiate the weights applied based
on the evidence available at the time. For example, as data improves (deteriorates) for
an estimation method, the weight assigned to that method approaches might increase
(decrease), or new estimation might become well-accepted for the purposes of clause
4.3.1.
It is also important to highlight that the ‘well-accepted’ stipulation is used in reference
to the approaches used by PoM, whether alone or in combination, and not to the chosen
combination itself. In other words, PoM is required to adopt a ‘combination of well-
accepted approaches’ but not necessarily a ‘well-accepted combination of well-accepted
approaches.’ In determining a WACC estimate for PoM, where there is a lack of
regulatory or other practitioner guidance on the appropriate weighting for
combinations, we have substantiated our judgement in the weighting of these
approaches.
3.6.1 All approaches have practical difficulties
There is merit in the ESC’s observation that:30
Some approaches used in academia or by finance practitioners are not well-accepted
in Australian regulatory practice and their application can be difficult in practice due
to data quality and availability issues or methodological choices.
However, the ESC fails to recognise that data quality and availability, or methodological
choices, present challenges in the application of all approaches, particularly cost of
equity models, including those that are well-accepted in Australian regulatory practice.
30 ESC (2017a), p.41.

DETERMINING A WACC ESTIMATE FOR PORT OF MELBOURNE Page 56 of 296
Furthermore, the cost of equity approaches commonly used in Australian regulatory
practice have often been contentious in application, particularly following the Global
Financial Crisis. This has been reflected in contentious debate across Australian
regulated energy and transport sectors, including before the Australian Competition
Tribunal.
In the context of the highly contested area of cost of equity estimation under the national
energy regulatory framework, the Australian Competition Tribunal in its Public Interest
Advocacy Centre/Ausgrid appeal decision made what we consider to be important
comments regarding the availability and use of cost of equity models:31
650. It is apparent also that the AEMC [Australian Energy Market Commission] did
not consider the rate of return estimates should be driven by a single financial model,
whether the SL CAPM or another model, or by one estimation method. The available
relevant evidence should be considered. As the DNSPs [Distribution Network Service
Providers]and JGN [Jemena Gas Networks] pointed out, the AEMC recognised that,
in any event, other models may be useful as all have weaknesses to some degree,
including that they are all based on certain theoretical assumptions, so that no one
model can be said to provide the right answer.
651. Indeed, it is commonly accepted that the AEMC’s view (see the AEMC’s 2012,
Economic Regulation of Network Service Providers, and Price and Revenue Regulation of Gas
Services, Draft Rule Determinations, 23 August 2012, at p 48) that “estimates are more
robust and reliable if they are based on a range of estimation methods, financial
models, market data and other evidence” is a sensible one.
Further to the Tribunal’s commentary, we consider there may be a model that is superior
in terms of simplicity and theoretical appeal. However, to the extent that the theoretical
assumptions are inappropriate or the model abstracts from financial reality too heavily,
the accuracy of the model will suffer. Other, less theoretically elegant models, which
perform empirically better, in the sense that they more accurately predict the return
necessary to compensate PoM for the risks involved in providing Prescribed Services,
may better meet the statutory objectives. In this regard, for the reasons expressed above,
accuracy is an important consideration for the choice of model.
More specifically, we consider several well-accepted cost of equity models differ in
theoretical appeal, as well as empirical ‘fit’ with observed data, the latter issue being
directly relevant to the issue of reliability in informing the rate of return necessary to
compensate PoM for the provision of Prescribed Services having regard to the relevant
31 Australian Competition tribunal, Applications by Public Interest Advocacy Centre Ltd and Ausgrid [2016] ACompT
1

DETERMINING A WACC ESTIMATE FOR PORT OF MELBOURNE Page 57 of 296
risks. For example, we consider the theoretical attractiveness of the SL CAPM is
overshadowed by its poor empirical performance, such that if its empirical performance
was stronger, it is unlikely that other approaches would have emerged in finance
practice, such as the Black CAPM and FFM. While the Black CAPM and FFM also have
their limitations as theoretical cost of equity models, this in itself does not invalidate
their use, provided any such use is consistent with the open wording of clause 4.3.1 of
the Pricing Order, as well as the Port Management Act objectives. We discuss alternative
cost of equity models in detail in Chapter 6 of our report.
Hence, it does not follow based on available theoretical and empirical evidence that only
the approaches used by Australian regulators can be applied by PoM when determining
the weighted average cost of capital. Approaches may be well accepted in academia or
by financial practitioners even though they are not well-accepted in Australian
regulatory practice. Similarly, data quality issues do not provide a justification for
limiting the meaning of the phrase “well-accepted” approaches to only those approaches
accepted by Australian regulators (recognising a lesser weight can be applied in light of
data quality).
Finally, we consider that the practical difficulties in applying some of the approaches
used by the financial community and academia to determine the weighted average cost
of capital should not result in the exclusion of all approaches used by the financial
community and academia. Rather, PoM’s use of any of these approaches should have
regard to their limitations (eg through the extent to which reliance is placed upon them)
while recognising that the models used by Australian regulators also have important
limitations (particularly regarding accuracy). This confirms that a well-accepted
approach to determining the weighted average cost of capital cannot reasonably be
constrained to Australian regulatory practice having regard to the range of approaches
that could be adopted by PoM and that comply with the Pricing Order.
DETERMINING A WACC ESTIMATE FOR PORT OF MELBOURNE Page 58 of 296
4 Benchmark efficient entity (BEE)
Chapter overview
In response to the ESC’s commentary, we have removed the requirement that the BEE must have a market capitalisation of at least $US100 million. However, we have retained our classification of the BEE as a private sector entity that need not be domiciled in Australia, because public sector entities typically lack the market data required to facilitate WACC analysis and an Australian-domiciled BEE assumption unreasonably constrains the size of the comparator set required for robust asset beta estimation.
4.1 Identifying a BEE
Under incentive-based economic regulation, the WACC is set having regard to a BEE
with comparable risks to the regulated entity in providing the relevant services and that
is reflective of prevailing conditions in equity and debt markets.
4.1.1 Pricing Order requirements.
The Pricing Order is consistent with this approach by requiring that the rate of return
allowance be calculated commensurate with that which would be required by a
‘benchmark efficient entity’ providing services with a similar degree of risk to PoM in
its provision of Prescribed Services (which excludes property-related services). In other
words, the WACC estimate should not be based on PoM’s actual cost of capital
(assuming it were able to be directly observed).
There is no formal definition of the BEE in the Pricing Order. Consequently, there is a
need to identify the key characteristics of such an entity, including the services it
provides. This involves establishing a conceptual definition of the characteristics of the
BEE relevant to the WACC estimation. Once defined, it is necessary to gather evidence
from actual ‘comparator’ entities which best resemble the conceptual entity, as a means
to inform the benchmark parameters for the cost of equity and the cost of debt.
In its Consultation Paper, the ESC provided its view on the risk profile of PoM and the
factors that could be used to identify appropriate comparator entities which best
resemble the conceptual BEE.32
In terms of risk profile, the ESC notes the relevant risk characteristics of the services
provided by PoM include that the Prescribed Services:
• relate primarily to the provision of wharfage and channel access services;
• are provided by a port that predominantly derives revenue from services to
container cargo, with a smaller share of bulk and non-bulk cargoes; and
32 ESC (2017a).

DETERMINING A WACC ESTIMATE FOR PORT OF MELBOURNE Page 59 of 296
• are provided by a port in Australia.
In regards to comparator entities, the ESC recognises there are no publicly-listed ports
in Australia. Accordingly, it suggested the following methodology:33
Consequently, the port will have to determine a comparator set by considering other
characteristics of the port’s prescribed services, and by making trade-offs between
elements of comparability. For example, by including other firms (not ports) that
provide similarly risky services or to include overseas ports in the comparator set.
Whichever approach is adopted, it is important that a systematic approach to
comparator selection be used to avoid ‘cherry picking’ comparators in each
regulatory period.
4.1.2 Australian regulatory precedent
In terms of the conceptual efficient benchmark definition, the Western Australia
Economic Regulation Authority (ERA) has provided guidance on its regulatory
interpretation as follows:34
It is desirable that the benchmark not be hypothetical. This means that the benchmark
must, as far as possible, reflect achievable financing practices, which reflect the
practices of efficient firms exposed to a similar degree of risk as the regulated firm.
Importantly, by reflecting achievable efficient financing practices, the benchmark will
allow the service provider ‘reasonable opportunity’ to achieve the efficient
parameters determined for the benchmark entity.
Whilst the Pricing Order applies to only one entity (as opposed to a range of regulated
businesses as was the case for the ERA), the ERA’s approach is consistent with the
Pricing Order requirement that the Port Licence Holder be given a reasonable
opportunity to recover the efficient cost of providing all Prescribed Services.
The ERA’s review also provided useful guidance on the reliance on international
comparators in informing the assessment of the risk profile of a BEE, including the
degree to which:35
33 ESC (2017a), p.40.
34 ERA (2015a). Review of the method for estimating the Weighted Average Cost of Capital for the Regulated Railway Networks, Final decision, 18 September, p.20.
35 ERA (2015a), p.22.

DETERMINING A WACC ESTIMATE FOR PORT OF MELBOURNE Page 60 of 296
• foreign investors seek to invest equity in Australian firms, augmenting
domestically-sourced investment (in the case of Port of Melbourne, the Lonsdale
Consortium involves a number of foreign investors);
• Australian firms raise capital for their Australian investments on overseas capital
markets, to supplement capital raisings in Australia; and
• there is arbitrage between Australia’s financial markets and those overseas.
This reflects the broader issue of whether estimation of the BEE’s cost of capital should
be based solely on domestic parameter values or can also incorporate international
parameter values. The ERA has previously commented on this issue as follows:36
Overall, the Authority considers that not strictly adhering to the internal consistency
of the estimation method – by basing some estimates on a mix of domestic and
international estimates – is reasonable in the circumstances in order to enhance the
robustness of the parameter estimates.
In this context, the Authority considers that some parameters are likely to be more
independent of jurisdiction than other parameters. For instance, gearing, credit rating
and equity beta (notwithstanding differences in, for example, tax treatment) are likely
to be more independent of jurisdiction than are the risk-free rate and market risk
premium, which will be closely related to country conditions.
Both the ERA and ACCC have used international comparators to ensure the estimation
of robust efficient benchmark beta and gearing parameter values for regulated
Australian transport entities. Synergies concurs with this approach.
This view has been reflected by the Full Federal Court in its recent judgment in Australian
Energy Regulator v Australian Competition Tribunal (No 2) where it comments in relation
to the BEE:37
…The allowed rate of return objective confers on the benchmark its particular,
necessary and defining characteristics: it must be efficient and it must face “a similar
degree of risk” as that which applies to the particular service provider in question in
relation to the provision of standard control services. But the attribution of the
relevant “efficiency” (i.e., in respect of financing costs) is to be gauged by the
disciplines of a workably competitive market (i.e., an unregulated market).
36 ERA (2015a), p.24.
37 Australian Energy Regulator v Australian Competition Tribunal (No 2) [2017] FCAFC 79, para. 537.
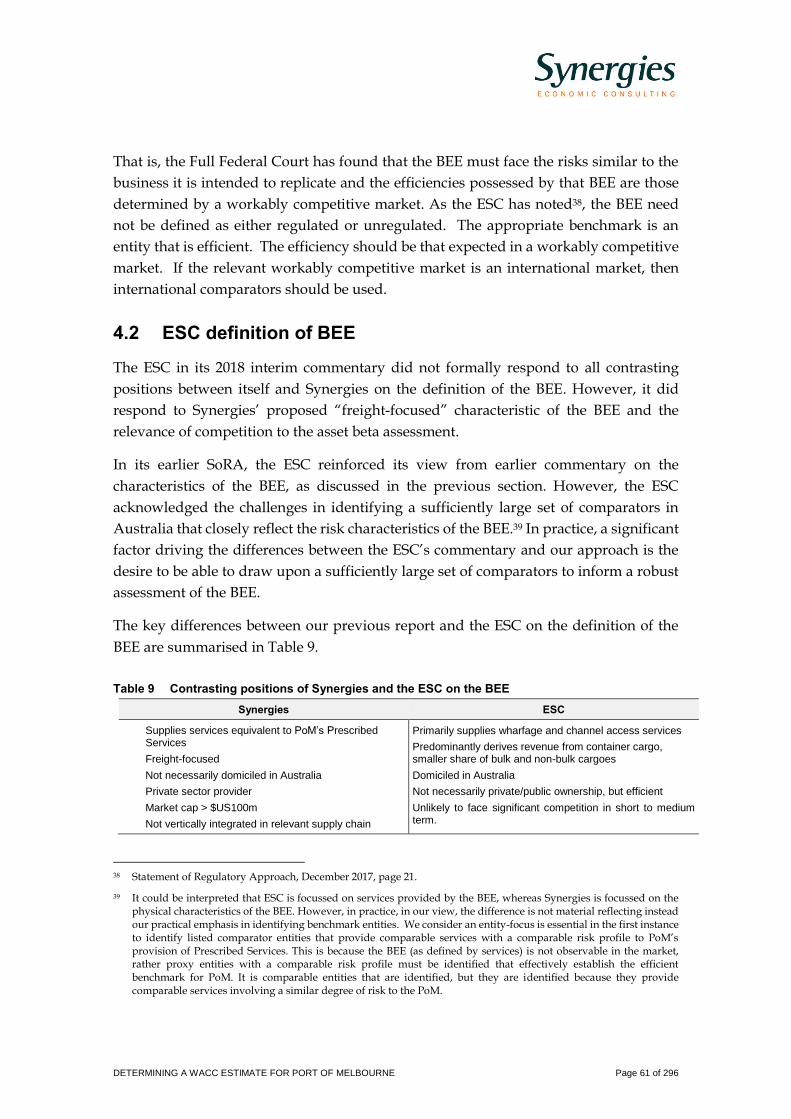
DETERMINING A WACC ESTIMATE FOR PORT OF MELBOURNE Page 61 of 296
That is, the Full Federal Court has found that the BEE must face the risks similar to the
business it is intended to replicate and the efficiencies possessed by that BEE are those
determined by a workably competitive market. As the ESC has noted38, the BEE need
not be defined as either regulated or unregulated. The appropriate benchmark is an
entity that is efficient. The efficiency should be that expected in a workably competitive
market. If the relevant workably competitive market is an international market, then
international comparators should be used.
4.2 ESC definition of BEE
The ESC in its 2018 interim commentary did not formally respond to all contrasting
positions between itself and Synergies on the definition of the BEE. However, it did
respond to Synergies’ proposed “freight-focused” characteristic of the BEE and the
relevance of competition to the asset beta assessment.
In its earlier SoRA, the ESC reinforced its view from earlier commentary on the
characteristics of the BEE, as discussed in the previous section. However, the ESC
acknowledged the challenges in identifying a sufficiently large set of comparators in
Australia that closely reflect the risk characteristics of the BEE.39 In practice, a significant
factor driving the differences between the ESC’s commentary and our approach is the
desire to be able to draw upon a sufficiently large set of comparators to inform a robust
assessment of the BEE.
The key differences between our previous report and the ESC on the definition of the
BEE are summarised in Table 9.
Table 9 Contrasting positions of Synergies and the ESC on the BEE
Synergies ESC
Supplies services equivalent to PoM’s Prescribed Services
Freight-focused
Not necessarily domiciled in Australia
Private sector provider
Market cap > $US100m
Not vertically integrated in relevant supply chain
Primarily supplies wharfage and channel access services
Predominantly derives revenue from container cargo, smaller share of bulk and non-bulk cargoes
Domiciled in Australia
Not necessarily private/public ownership, but efficient
Unlikely to face significant competition in short to medium term.
38 Statement of Regulatory Approach, December 2017, page 21.
39 It could be interpreted that ESC is focussed on services provided by the BEE, whereas Synergies is focussed on the physical characteristics of the BEE. However, in practice, in our view, the difference is not material reflecting instead our practical emphasis in identifying benchmark entities. We consider an entity-focus is essential in the first instance to identify listed comparator entities that provide comparable services with a comparable risk profile to PoM’s provision of Prescribed Services. This is because the BEE (as defined by services) is not observable in the market, rather proxy entities with a comparable risk profile must be identified that effectively establish the efficient benchmark for PoM. It is comparable entities that are identified, but they are identified because they provide comparable services involving a similar degree of risk to the PoM.

DETERMINING A WACC ESTIMATE FOR PORT OF MELBOURNE Page 62 of 296
Synergies ESC
Some contestability between ports
Several points of difference can be drawn from this comparison:
• the ESC has questioned the need for a $US100m threshold for market capitalisation
of comparator entities. We consider entities with less than $US100m market
capitalisation could meet the test of the BEE but should still be subject to the
statistically significant filtering process for beta estimation based on available data;
• we accept that public sector entities could well form part of the sample of the BEE
as suggested by the ESC, but they would fail any filtering process for the purposes
of estimating the cost of capital because they are not traded and so cannot sensibly
inform the estimate of the asset beta (or capital structure) for the BEE;
• our earlier report identified a “freight-focused” entity, whereas the ESC’s
characterisation is arguably narrower in that it refers to an entity that derives
revenue primarily from container cargo and a smaller share of bulk and non-bulk
cargoes;
• we assume the BEE could face some contestability with other ports, in contrast the
ESC considers the BEE is unlikely to face significant competition in the short to
medium term; and
• our earlier report assumed the BEE is not necessarily domiciled in Australia,
whereas the ESC favours an Australia-domiciled BEE.
Each of these points of difference is discussed in the following sections of this chapter.
Market capitalisation threshold
In our 2017 report, we placed a market capitalisation threshold on the size of the BEE, at
$US100 million, in recognition that asset intensity is a relevant consideration for
assessing comparability with PoM. The ESC responded that “it is not obvious that size
should define the risk characteristics of the BEE.”40
As a matter of principle, the key question is whether the comparator entity reasonably
reflects the risk profile of the BEE providing services with a similar degree of risk as that
which applies to PoM in providing the Prescribed Services. We acknowledge that it is
an open question whether it is possible for an entity that is substantially smaller in scale
compared to PoM will meet this threshold (noting that size and asset intensity are
40 ESC (2017b). Feedback on consultation and other matters: Statement of Regulatory Approach version 1.0., December,
p.43.

DETERMINING A WACC ESTIMATE FOR PORT OF MELBOURNE Page 63 of 296
relevant, but not determinative, considerations in the classification of PoM’s BEE,
including, for example, operating leverage).
In practice though, we note that firms with small market capitalisations are generally
more prone to missing data or statistically insignificant beta estimates. With this in mind
and in addressing the ESC’s comments regarding size, we note that the decision to be
made is whether these firms are removed from consideration at the BEE definition stage,
or through statistical criteria in the subsequent asset beta filtering process.
We therefore acknowledge that the $US100 million threshold was arbitrary and that each
firm should be considered individually in terms of risk characteristics, as well as
statistical significance. Accordingly, we have included companies whose market
capitalisation is less than $US100 million in the comparator set where appropriate.
Public or private sector status of the BEE
Another point of difference between the two BEE definitions relates to the public and
private sector delineation.
The ESC stated that “Synergies did not explain why the BEE should be a private sector
provider.”41 Instead, the ESC held that the BEE could be private or public, provided it
was ’efficient.’42 In theory, we agree with the ESC. However, our view is very much
driven by a practical consideration regarding the purpose of the investigation. In our
view, public sector entities may well be relevant comparators if the investigation
concerned, for example, assessments of operating cost.
As such, in principle, Synergies does not object to a definition of the BEE that
encompasses both private and public sector owned entities. However, there are
significant practical limitations using public-sector entities to inform the cost of capital
because of the absence of relevant market data. For example, publicly owned entities,
even if they are very similar to PoM, cannot inform the assessment of beta.43 Even in the
case of capital structure, concerns arise regarding the strength of commercial incentives
of publicly owned entities, including due to wider Government priorities.
As such, at least for the purposes of assessing the cost of capital, we maintain that only
private sector entities can be considered in the context of the BEE.
41 ESC (2017b), p.38.
42 ESC (2017b), p.43.
43 It is possible that the view of the owner Government about how the cost of capital is determined could be relevant although it would not be an outcome that is necessarily market tested.

DETERMINING A WACC ESTIMATE FOR PORT OF MELBOURNE Page 64 of 296
General freight-focussed BEE
In practice, we do not perceive material issues in the composition of the trade of
comparator ports for the purposes of identifying the BEE beyond the key matter that the
BEE should broadly reflect PoM’s general freight exposure. Importantly, this freight
exposure is relatively broadly based, including exposures to containers, motor vehicles,
export and general cargo trades with overall trade levels being significantly driven by
domestic economic activity (as opposed to a narrow freight exposure, which would
typically be the case for a single bulk commodity port or transport service provider).
For example, dedicated coal-related entities are not considered relevant to PoM’s BEE.
Entities such as Aurizon Network, Dalrymple Bay Coal Terminal and the ARTC Hunter
Valley rail network will have different risk profiles due to their narrow exposure to
international thermal and coking coal markets, as well as the prevalence of take-or-pay
contracts regarding the provision of transport infrastructure services in this sector.
Moreover, they operate in a materially different regulatory environment to PoM.
Accordingly, considerably less weight should be placed on these entities for comparison
purposes.
In the SoRA, in identifying the BEE’s characteristics, the ESC implied using a relatively
granular assumption regarding the nature of services provided by PoM and its
associated revenues. However, we consider the ESC’s proposed service granularity to
be impractical in terms of identifying an appropriate comparator set from publicly listed
Australian and international entities for gearing and beta. Hence, we favour a broad
assumption about the freight-related services provided by the BEE.
Further, our reference to freight-focussed is, in our view, a necessary broadening of
terms to allow a large enough comparator sample to be identified to determine a robust
asset beta estimate.
In this regard, the ESC noted and we agree about the need for trade-offs when sourcing
comparators from other sectors (such as rail).
Extent of competition
The extent of competition constraining the BEE, including the prospect of competition
from a second container port, also received attention from the ESC in the SoRA. The
ESC’s view is that the BEE would be unlikely to face significant competition in the
provision of services similar to those of the Prescribed Services.
We argued that it should be assumed that PoM’s BEE should be exposed to some
contestability between ports. Moreover, and unusually, the BEE should recognise that

DETERMINING A WACC ESTIMATE FOR PORT OF MELBOURNE Page 65 of 296
PoM is subject to the prospect of a second container port being developed in the
Melbourne region within its 50-year lease term, to which we now turn.44
The ESC considered that, at the present time, it is “highly uncertain whether a second
port will be developed in the Melbourne region.”45 We contend that the likelihood of the
development of a second Melbourne port is at the very least a significant possibility and
as such considerably more likely than has been characterised by the ESC, although the
timing of such a development is uncertain.
The ESC then goes on to state that even if the development of a second port were a
reasonable likelihood, the specified timeframe for the second port is nearly 40 years
away and is therefore unlikely to exert competitive pressures.
However, in May 2017, Infrastructure Victoria reported to the Victorian Government
that a new container report would be required in Melbourne by 2055. The Victorian
Government is yet to formerly endorse this timeline, and it has been contended that the
construction of the port could be brought forward.
Whilst clearly not imminent, the prospect of the development of a new port has material
implications for PoM with respect to its return on future investments. PoM must make
investment decisions across long-term horizons, and any change in demand for services
will affect these investment decisions. The prospect of a second port potentially weakens
PoM’s bargaining power in commercial negotiations, reducing its market power.
Furthermore, PoM is only entitled to compensation for the construction of a second port
if it takes place within the next 15 years.46 From that point onwards, a significant barrier
to the second port’s construction is removed.
The impact of the Tariff Adjustment Limit (TAL), by deferring a large proportion of
PoM’s capital recovery to the second half of its lease term, further exacerbates the risk to
PoM of a second port being constructed.
Moreover, PoM faces pressure from several competing facilities. PoM’s liquid bulk, dry
bulk and break bulk trades (which account for approximately 13% of total revenue
tonnes) are all subject to some form of competition from other ports.
Container traffic is also subject to competition from a variety of Australian ports
(Adelaide and Botany for imports, Botany and Adelaide for exports, and both Station
Pier and direct calls for the Tasmanian trade).
44 Further details on the second Melbourne port are presented in Attachment D.
45 ESC (2017b), p.43.
46 Delivering Victorian Infrastructure (Port of Melbourne Lease Transaction) Act 2016, Clause 65(2)(a)(ii).

DETERMINING A WACC ESTIMATE FOR PORT OF MELBOURNE Page 66 of 296
These existing competitive pressures are not mitigated by any element of PoM’s
regulatory regime.
The impact of competition on our beta estimation is covered in further detail in the first
principles analysis in Section 8.2.5 and in Attachment C of our report.
Domicile of BEE
The ESC has maintained its view that, for the purposes of defining the BEE, the
Prescribed Services are provided by a port in Australia. In principle, the assumption of
an Australian-domiciled BEE is reasonable given PoM is a Melbourne-based entity with
no operations or revenue streams outside of Australia. However, when deriving a
WACC estimate for an Australian entity, the practical reality is that there are generally
insufficient Australian listed entities to derive robust asset beta and gearing estimates.
Our assumption that the BEE is not necessarily domiciled in Australia reflects this
practical reality.
The ESC’s 2018 Interim Commentary noted that while understanding Synergies’ reasons
for using international comparators to derive asset beta and gearing estimates, it had
identified several drawbacks in our approach to using beta estimates for international
firms. We address the ESC’s comments in Attachment B and section 8.2 (asset beta
estimation) of our report.
There is a tradeoff between the size of the comparator sample and the extent of filtering
that is undertaken to refine it. We accept that being an international comparator may be
a legitimate filter to be applied in certain circumstances. Here, however, there is not a
sufficient number of Australian based listed entities to inform a beta assessment of PoM.
There is no realistic option but to draw on international comparators. We have
minimised the risk of incorporating less comparable international comparators by
filtering on the basis of the quality of the relevant capital market where such entities are
listed.
4.3 Defining the BEE for PoM
Having regard to the commentary provided by the ESC, we consider that the competing
concepts of the BEE are not irreconcilable. The main challenge we (and the ESC) face is
that there are relevant practical considerations, such as data limitations and the lack of
suitable comparator entities, which need to be recognised, particularly in asset beta
estimation.
As such, we propose to substantively retain our position on the BEE definition from the
2018-19 TCS submission. This position is driven in part by what we believe to be the true

DETERMINING A WACC ESTIMATE FOR PORT OF MELBOURNE Page 67 of 296
BEE for PoM but is primarily based on the practical issue of identifying an appropriate
sample of entities to inform WACC estimation.
In response to the ESC’s commentary, we have provided additional justification of our
asset beta comparator filtering procedure, and the implications that this has for the
resulting sample of comparable firms. These are examined in detail in Chapter 8 and
Attachment B.
Given the above considerations, we remain of the view that PoM’s BEE, for the purposes
of the Pricing Order, is a private sector provider of general freight services broadly
equivalent to the Prescribed Services.
Further, the BEE is not vertically integrated upstream or downstream from the provision
of port services consistent with the narrow definition of Prescribed Services.
Conceptually, for the purposes of the Pricing Order, the BEE would not earn revenue
from sources other than Prescribed Services, which excludes property-related assets and
activities.
Ideally, the BEE would have reference to landlord port businesses in Australia and
internationally that provide a similar range of services to the Prescribed Services and
hence face comparable risks. However, in practice, there are no listed port businesses
operating in Australia providing services that are comparable to PoM’s Prescribed
Services and hence that have comparable risks to the BEE required under the Pricing
Order. Hence, this has required us to identify transport entities outside of the Australian
and international port sector with a comparable risk profile to PoM’s Prescribed Services.
The systematic approach we have taken in determining WACC parameter values for the
BEE with comparable risks to PoM are discussed in more detail in Chapter 5 (capital
structure) and Chapter 6 (return on equity) of our report. The following section provides
an overview of the sectors that we have investigated to source comparable companies
for the BEE.
4.3.1 Comparable Marine Ports and Services
Port-related businesses are categorised as “Marine Ports and Services” under the Global
Industry Classification Standard (GICS) classification.
Whilst terminal operators and PoM have similar market exposures, many of the entities
in the Marine Ports and Services category operate primarily as terminal operators or
stevedores and do not provide the core infrastructure service that PoM provides. This is
reflected in terminal operators generally having lower fixed capital costs and higher
variable costs within their total cost base than a landlord port, such as PoM. This means
that these terminal operators’ earnings will be less sensitive to sales volumes than PoM.

DETERMINING A WACC ESTIMATE FOR PORT OF MELBOURNE Page 68 of 296
Consequently, whilst PoM’s risk profile is not identical to several of these businesses, we
consider there is a sufficiently strong overlap in market exposure and demand drivers
between the entities comprising the Marine Ports and Services classification and PoM to
warrant their inclusion in our comparable companies set.
4.3.2 Comparable Railroads
We have also included freight railroad companies in our sample as there are a number
of publicly listed firms in this sector with similar infrastructure characteristics and
demand drivers to ports. In particular, freight railroad companies have high fixed capital
costs and significant volume exposure driven by economy-wide economic conditions.
Whilst in previous reports we have included major city airports in our comparator set,
we have removed them partly in response to the concerns expressed by the ESC. This is
discussed in more detail in Chapter 8.
4.3.3 Comparable List Application
Having selected the relevant industry sectors for inclusion in our comparable companies
set, we reviewed the business description for each listed company in each relevant sector
and eliminated companies that were of limited relevance to PoM’s Prescribed Services
because they are unlikely to face comparable risks.
Using Bloomberg, and having regard to FTSE (Financial Times Stock Exchange) country
classifications, we have extracted gearing and other relevant data from companies in the
following GICS categories:
• Marine Ports and Services
• Railroads.
This filtering process results in a comparator set of 19 firms (11 marine ports and services
firms and 8 railroads) from 10 countries from FTSE Developed country classification.
Regarding possible adjustments to empirical beta estimates, the ESC’s commentary
sought explanation about how specific adjustments to our empirical beta estimates (and
to a lesser extent gearing) should be made where the nature of the comparators and their
risk characteristics are not strictly equivalent to the BEE used to establish PoM’s WACC.
In our view, caution should always be applied in determining asset beta estimates to
avoid applying ‘false precision,’ especially at an individual entity level. This includes
applying purportedly precise quantitative adjustments to beta estimates derived from
the comparator set. Instead, the approach that we have taken is to consider the

DETERMINING A WACC ESTIMATE FOR PORT OF MELBOURNE Page 69 of 296
characteristics of the two industry sectors that comprise our comparator set, with this set
establishing a reasonable asset beta range from which a point estimate can be selected
and substantiated through qualitative analysis of differential risk factors.

DETERMINING A WACC ESTIMATE FOR PORT OF MELBOURNE Page 70 of 296
5 Capital structure
Chapter overview
We have retained our assumed capital structure for PoM of 30% from the 2018-19 submission. This remains within the range of transport regulatory decisions, and evidence from listed comparators indicates no material movement in gearing levels.
5.1 Introduction and background
The Pricing Order requires the cost of debt and equity to be distinguished. This in turn
requires the weighting of equity and debt in the rate of return calculation to be
established. The purpose of this chapter is to identify an appropriate long-term target
gearing ratio for the BEE based on domestic and international entities with comparable
risks, and having regard to relevant regulatory precedent.
In a perfect capital market, finance theory provides that the valuation of a firm is
unaffected by its capital structure. A higher proportion of debt in the capital structure
will increase the weight placed on the return on debt (which is lower than the return on
equity), but this is offset by an increase in the required return on equity resulting from
the higher leverage. However, in practice, the assumptions underpinning a perfect
capital market do not hold and as such capital structure can have valuation impacts.
Clearly, this is relevant to a consideration of the capital structure applying to a BEE.
The assessment of capital structure (or gearing) in the WACC calculation is therefore
based on an assessment of an ‘optimal’ long-term target capital structure for the BEE
given its risk profile and the industry within which it operates.
To achieve consistency with the Pricing Order requires the selection of a benchmark
gearing ratio that would apply to an efficient benchmark firm in the same industry with
the same risk profile as PoM. However, in practice we see numerous and sometimes
disparate factors affecting the capital structure adopted by firms within the same
industry (for example, different financing strategies, investment needs, owner
preferences, tax treatments).
Consequently, it is reasonable to determine a range to assess the efficient financing of a
benchmark entity before choosing a point estimate from within the range based on a
qualitative assessment of PoM’s risk profile. To inform this range for PoM we begin by
looking at relevant regulatory precedent followed by evidence from comparable entities.
5.2 ESC commentary on proposed capital structure for BEE
The 2018 interim commentary reiterated the ESC’s earlier commentary that the majority
of regulatory transport decisions in Australia have assumed benchmark gearing levels

DETERMINING A WACC ESTIMATE FOR PORT OF MELBOURNE Page 71 of 296
between 50% and 60%. Based on this, the ESC noted that regulators have tended to use
gearing levels higher than that assumed by Synergies for the BEE.
We continue to consider that any comparison of gearing levels should focus on sound
financial principles. Debt levels assumed by Australian regulators for regulated
transport entities range from 20% for the Pilbara railways up to 60% for Dalrymple Bay
Coal Terminal (DBCT) noting that the relevance of benchmarks for regulated entities
needs to be considered on a case by case basis. As such, our proposed gearing ratio of
30% sits comfortably within this regulatory range. Even within this regulatory range
though, we observe that there are entities with varying risk profiles, in part due to
different market, contractual and regulatory characteristics. For these reasons, we have
refrained from drawing direct comparisons to the regulatory entities.
The remainder of this chapter explains the basis of our proposed gearing assumption for
the BEE.
5.3 Regulatory precedent
Consistent with the other WACC parameters, Australian regulators apply a benchmark
capital structure (gearing) that would apply to an efficient benchmark entity in the same
industry with the same risk profile. It is based on an ‘optimal’ long-term target for the
regulated entity given its risk profile and the industry within which it operates. This is
reflected in relatively stable gearing ratios once established. A similar approach is also
used by international regulators.
Under this benchmark approach, the regulated entity’s actual gearing level is given
limited (and perhaps no) weight. This is consistent with the objective of incentive
regulation, which bases costs on efficient benchmark targets. The gearing assumption
also influences the notional credit rating assumption used to estimate the return on debt.
Table 10 shows recent regulatory decisions relating to the regulated Australian transport
sector. The highest observed gearing assumption is 60% (debt to total value) for
Dalrymple Bay Coal Terminal, Australia’s most heavily regulated port related asset, and
thus not an ideal comparator for PoM. In contrast, for rail entities, gearing assumptions
have generally been lower, including the lowest of 20% for the dedicated iron-ore
terminal operated by The Pilbara Infrastructure.
Table 10 Recent Australian regulatory gearing decisions for transport entities
Company Regulator Year Gearing Ratio
NSW Rail Access Undertaking
IPART (Rail) 2019 45%
Dalrymple Bay Coal Terminal
QCA (Ports) 2010 & 2016 60%

DETERMINING A WACC ESTIMATE FOR PORT OF MELBOURNE Page 72 of 296
Company Regulator Year Gearing Ratio
Aurizon Network QCA (Rail) 2018 55%
ARTC Interstate Rail Network
ACCC (Rail) 2008 & 2018 50%
Public Transport Authority - passenger
ERA (Rail) 2019 50%
Arc Infrastructure (formerly Brookfield Rail) - freight
ERA (Rail) 2019 25%
The Pilbara Infrastructure – iron ore
ERA (Rail) 2019 20%
V/Line ESC (Rail) 2012 50%
Pacific National ESC (Rail) 2012 50%
Vic Track ESC (Rail) 2012 50%
Metro Trains Melbourne ESC (Rail) 2011 55%
ARTC (Hunter Valley Coal Network)
ACCC (Rail) 2011 & 2017 52.5%
Queensland Rail QCA (Rail) 2019 40%
Source: Synergies, various regulatory decisions.
The basis of Australian regulator’s gearing assumption is generally an analysis of
internationally comparable companies, an approach we have adopted in our report.
Such an approach is also frequently observed in regulatory determinations overseas.
In the context of the BEE, we consider the two most relevant regulatory gearing
assumptions are for:
• ARTC’s interstate freight network, which currently assumes 50 per cent gearing
• Arc Infrastructure’s freight network, which currently assumes 25 per cent gearing.
The ERA’s most recent review of the WACC to apply to Arc Infrastructure), completed
in 2019, included an updated review of the gearing levels for a set of comparator firms.47
Its sample included the US Class I railways, as well as a small number of other firms
(including Aurizon Holdings). The ERA concluded that the current evidence supported
the continuation of a benchmark gearing level for Arc Infrastructure of 25 per cent.48
In its 2018 decision for ARTC’s interstate freight network, the ACCC maintained its
gearing ratio assumption for ARTC of 50 per cent. In doing so, it referenced recent
regulatory decisions as well as its analysis in the previous 2008 Interstate Access
Undertaking. The gearing levels of ARTC’s sample of firms across the rail, trucking and
47 ERA (2019). Draft determination – 2018 weighted average cost of capital at 30 June 2018 for the freight and urban
networks, and the Pilbara railways, 2 May.
48 ERA (2019), p.19.

DETERMINING A WACC ESTIMATE FOR PORT OF MELBOURNE Page 73 of 296
shipping industries examined at the time were generally higher in the pre-GFC
environment than currently observed. However, the average capital structure of the 12
rail companies in ARTC’s survey was 27 per cent debt, with the most levered firm
holding only 47 per cent debt.49
Overall, this evidence supports a gearing level of 30% for the BEE. Recent regulatory
evidence continues to indicate a very broad range of benchmark gearing ratios. This is
particularly evident in the context of the ERA’s findings that resulted in the application
of a lower gearing level in the most recent review for Arc Infrastructure.
5.4 Metrics
Attachment A contains our comparator set emerging from the above process and
categorises the sample by:
• Sector
• FTSE classification
• Companies that are rated by rating agencies and those that have not been.
Attachment A contains the gearing ratios for each company in the comparator set. We
now turn to a consideration of the results of this analysis.
5.5 Gearing range
Determining the appropriate target gearing level is inherently imprecise. The starting
point for the analysis is the range of gearing levels maintained by comparable entities
which, by definition, must be consistent with one or a combination of well-accepted
approaches.
5.5.1 Empirical Evidence
In determining an appropriate gearing ratio for PoM, it is reasonable to analyse empirical
evidence from relevant comparator firms, including the entities that we have also used
to estimate beta for the return on equity calculation.
We have examined the average gearing levels maintained by other relevant comparator
entities in Australia and internationally.
49 ACCC (2008). Australian Rail Track Corporation access undertaking – Interstate Rail Network, Final decision, July,
p.158.

DETERMINING A WACC ESTIMATE FOR PORT OF MELBOURNE Page 74 of 296
Gearing ratios (average and median ratios) for the entities comprising our comparator
set and that are rated by ratings agencies as having an investment grade or better are
contained in the tables below. We have classified these results by sector in Table 11 below
and included the latest available credit ratings where possible.
Table 11 Companies in our sample with investment grade ratings
Company Country OECD Sector Moody’s Credit Rating
S&P Credit Rating
Gearing
China Merchants Port Holding Company
Hong Kong No Marine Ports and Services
Baa1 BBB 27%
Port of Tauranga New Zealand
Yes Marine Ports and Services
- BBB+ 4%
Hutchinson Port Holdings Trust
Singapore No Marine Ports and Services
Baa1 A- 50%
Aurizon Holdings Australia Yes Railroads Baa1 BBB+ 24%
Canadian National Railway Company
Canada Yes Railroads A2 A 12%
Canadian Pacific Railway
Canada Yes Railroads - BBB+ 20%
CSX Corporation US Yes Railroads Baa1 BBB+ 24%
Kansas City Southern US Yes Railroads Baa2 BBB 18%
Norfolk Southern Corporation
US Yes Railroads Baa1 BBB+ 22%
Union Pacific Corporation
US Yes Railroads Baa1 A- 14%
Source: Moody’s
Amongst companies in our sample with an investment grade rating, the median gearing
level is 21% and the average gearing level is 22%. As demonstrated in Attachment A, the
average and median gearing ratios are higher with the revised comparator set when
considering the full sample of comparable companies. Average and median gearing by
industry sector is summarised in Table 12.
Table 12 Gearing averages and ranges by sector
Overall Average Overall Median Overall Minimum Overall Maximum
Full Sample 29% 24% 4% 61%
Sector Average Sector Median Sector Minimum Sector Maximum
Marine Ports and Services 35% 28% 4% 61%
Railroads 21% 21% 12% 34%
Source: Bloomberg

DETERMINING A WACC ESTIMATE FOR PORT OF MELBOURNE Page 75 of 296
5.5.2 Privatised Australian ports
To evaluate gearing, we have augmented our comparable companies set with private
ports from around Australia. The gearing of recently privatised ports also provides a
relevant benchmark, while recognising initial gearing levels may not be reflective of
longer term gearing levels depending on reported earnings growth.
Further, gearing levels of privatised ports are reflective of the risk profile of the total port
business, including lower risk property assets, compared to a gearing level pertaining
only to prescribed service assets (as defined for PoM) that, in principle, would be lower.
Table 13 presents the acquisition gearing from Australian port privatisations other than
Flinders Ports. It shows an average initial gearing ratio in excess of 40% for these
privatisations.
Table 13 Acquisition Gearing Ratios for Australian Ports
Port Acquisition Value ($ million)
Acquisition Debt (drawn) ($ million)
Acquisition Gearing
Port of Brisbane (2010) 2,100 847 40%
Port Botany / Kembla (2013) 5,070 2,010 40%
Port of Newcastle (2014) 1,750 800 46%
Average 42%
PoM’s acquisition gearing ratio is in line with these precedents, recognising that these
privatised gearing ratios relate to the whole port entity rather than the narrower range
of port channel and berthing-related services that are covered by the Prescribed Services
definition.
5.6 Conclusion
Considering relevant market evidence, we maintain our view that a gearing range of
between 20% and 40% is appropriate for the efficient benchmark port entity. The
considerations that inform this view are as follows:
• The gearing levels for our comparator sample range is between 21% and 42%.
• Despite the ESC’s observation that the majority of transport regulatory decisions
assign gearing ratios between 50% and 60%, there are several cases where we have
seen gearing levels approved below 50% for Australian regulated entities, including
the ERA’s most recent decisions for rail networks, where it applied 25% gearing for
Arc Infrastructure (the most relevant comparator for PoM) and 20% for The Pilbara
Infrastructure, a dedicated iron ore rail and port infrastructure provider. IPART
recently adopted a gearing level of 45% for the NSW Rail Access Undertaking,

DETERMINING A WACC ESTIMATE FOR PORT OF MELBOURNE Page 76 of 296
which covers various rail networks across New South Wales, and the QCA
approved a gearing ratio of 40% for Queensland Rail.
The very nature of a gearing range is that a reasonable value may fall anywhere within
that range. Furthermore, both the range and the point estimate for a BEE may change
over time in response to several factors.
For the purpose of this estimate, a gearing level of 30% has been retained, which
represents the mid-point of the gearing ratios for the investment-grade listed companies
of 21% and the gearing ratios for the privatised ports of 42% (after rounding to the
nearest 5%).

DETERMINING A WACC ESTIMATE FOR PORT OF MELBOURNE Page 77 of 296
6 Assessing alternative return on equity approaches
Chapter overview
We have retained the same three return on equity approaches that we adopted in the 2017-18 and 2018-19 submissions. However, we now place a 90% weighting on the SL CAPM, a 5% weighting on the Black CAPM, and a 5% weighting on the Fama-French Model (FFM). In previous submissions, we placed equal weighting on each of these approaches. We present comprehensive evidence that each of these approaches can be considered well-accepted in accordance with the Pricing Order. However, implementation of the Fama-French model for the comparators available to PoM is constrained by limited country-specific size and value factors. For the Black CAPM, we have generated an updated estimate of the zero-beta premium, which is very similar to the SFG (2014) estimate, but it remains statistically insignificant at conventional levels. Consequently, this year we have given less weight to the FFM and Black CAPM when determining PoM’s return on equity. Notwithstanding this, we consider that PoM could re-consider the weightings given to the FFM and Black CAPM if these data issues were rectified in the future.
6.1 Introduction
6.1.1 Motivation for considering different models
The cost of equity is not observable ex ante. This means that the only way to predict the
cost of equity for the purposes of assessing the rate of return is through the use of
predictive tools or models.
All models are an abstraction of reality. Each return on equity model makes differing
assumptions about the real-world markets to which it is being applied. The need for
abstraction arises because there may be factors that are unobservable, or whose
magnitude is at least uncertain. This gives rise to inherent and unavoidable imprecision
in the estimation of parameters to inform a cost of equity estimate as well as the resulting
cost of equity estimate itself.
Consequently, each model will have its strengths and weaknesses, especially under
varying market conditions. As such, it may be difficult for one model to outperform all
others all the time. Where one model is unable to capture all of the complexities of actual
market phenomena, the regulatory objectives (efficient outcomes consistent with a
workably competitive market; efficient investment; fair and reasonable prices; and
recovery of efficient costs) are more likely to be achieved through the use of multiple
models to establish a clearer benchmark for the entity in question. Moreover, the
application of robust models mitigates, as much as is feasible, the need to rely on
discretion when deriving outcomes.
6.1.2 Criteria for relevant models
In Section 3.5.2, we introduced an array of criteria that Australian economic regulatory
bodies have employed to evaluate the merits of competing WACC methodologies. These
criteria are pertinent to any component of the WACC, whether they be individual
parameters or entire models. These criteria are:

DETERMINING A WACC ESTIMATE FOR PORT OF MELBOURNE Page 78 of 296
• Accuracy
• Stability and predictability
• Transparency and replicability
• Reflection of economic and financial principles
• Flexibility with changing market conditions
• Robust data
There is a benefit of examining multiple return on equity approaches where no single
approach is clearly superior when measured against these criteria. This is the case for
models developed for assessing the cost of equity - each model differs in its level of
theoretical appeal; its empirical fit with observed data (i.e. reliability to inform the return
necessary to compensate a provider of prescribed services having regard to the risks
involved in providing prescribed services); and its ‘fitness-for-purpose’ in the context of
a regulatory process for determining a return on equity allowance.
For example, there may be a model that is superior in terms of simplicity and theoretical
appeal. However, to the extent that the theoretical assumptions are inappropriate or the
model abstracts from financial reality too heavily, it will misestimate the true cost of
equity for a firm. In turn, despite its theoretical appeal, such a model could be ranked
behind other models for the purpose of determining the return necessary to compensate
a provider of prescribed services commensurate with the risks involved in providing
prescribed services. In other words, other models, which are less theoretically elegant,
but perform empirically better, in the sense that they more accurately predict the return
necessary to compensate a provider of prescribed services for the risks involved in
providing prescribed services, may better meet the statutory objectives.
The consequences of this in a regulatory setting depend on the direction of the error. If
the WACC is under-estimated relative to the cost of efficient financing, such an outcome
may establish low prices for users and consumers (with fair and reasonable prices being
one objective of the regulatory regime) but it will jeopardise the opportunity to earn a
return commensurate with the risks involved and, in turn, undermine the promotion of
efficient investment (both of which are also objectives of the regulatory regime).50
Likewise, a return on equity (and, by extension, WACC) that is too high may lead to
excessive prices, foster inefficient investment and over-compensate the provider of
Prescribed Services for the risks borne. In Chapter 3 we discuss the asymmetric
consequences of error, which suggests that in an environment of uncertainty about the
50 See Section 3.5.1 of this report for an overview of the relevant objectives.

DETERMINING A WACC ESTIMATE FOR PORT OF MELBOURNE Page 79 of 296
true WACC (and in particular the cost of equity) of the BEE, which is inevitable given
the inherent and unavoidable imprecision of its estimation, the adverse social
consequences of this uncertainty are minimised by erring on the side of not understating
WACC in a regulatory setting. This can be seen in the context of how financial
practitioners frequently apply the SL CAPM, through the incorporation of adjustments.
6.1.3 Candidate cost of equity approaches
Given that it is unlikely that one model could meet all of the above criteria, it is prudent
to consider different models that can jointly meet all of these requirements. Four return
on equity approaches are described below that we consider are likely to support an
estimate of the return on equity commensurate with the requirements of the BEE and
the Pricing Order:
• Sharpe-Lintner Capital Asset Pricing Model (SL CAPM) – the SL CAPM expresses
the return on equity as the premium required in regards to the undiversifiable risk
of holding a portfolio of assets relative to overall market risk (reflected in a beta
estimate). The SL CAPM predicts that the variations in mean returns of this portfolio
of assets should be entirely explained by variations in the beta estimate.
• Black CAPM – this model is a more broadly based form of CAPM, which adds the
excess returns of a zero-beta portfolio to the return earned on the risk-free rate in
the SL CAPM formula. If the excess returns of the zero-beta portfolio are estimated
to be zero, the Black CAPM reduces to the same formula as the SL CAPM. As per
the SL CAPM, the Black CAPM predicts that variations in mean returns should be
entirely explained by variations in the beta estimates.
• Fama-French three factor model (FFM) – this model can be considered an extension
of the SL CAPM by including two additional explanatory factors: small
capitalisation stocks; and high book-to-market value stocks (in addition to the
sensitivity of the returns of the asset compared to the overall market return as
captured under the SL CAPM).
• Dividend Discount Model (DDM) – this model estimates a return on equity based
on a company’s stock price and future expected dividend payments. It states that
the required return on an asset is dependent on the expected future growth rate in
dividends.
These return on equity models are not intended to be an exhaustive list. Rather, we
consider that each one satisfies the well-accepted threshold established by the Pricing
Order. The next section of our report summarises the strengths and weaknesses of each

DETERMINING A WACC ESTIMATE FOR PORT OF MELBOURNE Page 80 of 296
of these models. Further detail on our four chosen methodologies is provided in
Attachment C.
6.2 Sharpe-Lintner CAPM
6.2.1 SL CAPM formulation
The SL CAPM is expressed as follows:
Re = Rf + e * [E(Rm) - Rf]
Where:
Rf = the risk-free rate of return
E(Rm) = the expected return on the market
[E(Rm) – Rf] = the market risk premium
e = equity beta (measures systematic risk)
The equity beta measures systematic business risk, as well as the financial risk of a
company. This can be contrasted with the asset beta, which reflects only the business
risk of a company and can be calculated by de-levering the observed equity beta.
A well-accepted approach of estimating a company’s equity beta is taking the asset beta
(observed from a comparable set) and then re-levering the asset beta by applying the
company’s assumed capital structure (in PoM’s case, the gearing of a BEE) to finally
arrive at an estimated equity beta measurement for the company.
6.2.2 Strengths
The SL CAPM was the original prescription of the CAPM and is the model from which
other CAPM-oriented models have evolved. One strength of the SL CAPM is its relative
simplicity and intuitive appeal, specifically its underlying theoretical basis regarding the
relationship between expected returns and risk in an asset portfolio context.
Systematic risk is a useful way to think about risks incorporated into market prices.
Its intuitive appeal has resulted in the use of the SL CAPM in both financial market and
regulatory contexts. However, its use in financial market contexts has often been with
practitioners making adjustments to individual parameter values, specifically the risk-
free rate or market risk premium. We explore this phenomenon further in Section 6.2.6.

DETERMINING A WACC ESTIMATE FOR PORT OF MELBOURNE Page 81 of 296
6.2.3 Weaknesses
The main weakness of the SL CAPM is that it generates values of expected returns that
have very limited relevance with actual returns (i.e. the method produces a poor fit to
the observed data).
Empirical studies published in academic journals demonstrate that the model presents
a downwardly biased estimate of the rate of return for the low-beta entities, which
signifies that the relationship between beta estimates and average stock returns is too
flat in comparison to what we observe. Similarly, companies with high book-to-market
ratios (high stock returns) counter the predictions of this model (refer to discussion of
the FFM in Section 6.3 below).
The frequency of use of SL CAPM in a regulatory context in Australia has revealed
further limitations of the model when applied in a prescriptive, formulaic way, as has
been the practice of most Australian regulators over the past decade. These concerns
have become more pronounced since the Global Financial Crisis (GFC), when risk-free
rates have fallen to historical lows, resulting in low return on equity outcomes when the
low risk-free rate is combined with a ‘static’ long-run average market risk premium
(MRP) of 6%, which, at least until the GFC, was the most commonly applied value for
the MRP. These concerns were particularly evident when debt margins increased
considerably following the GFC at the same time as regulatory allowances for the return
on equity reduced because of falling risk-free rates. To our knowledge no logical reason
has ever been advanced as to why this would be the case.
The underlying assumptions for the model are also problematic, including that investors
can borrow or lend freely at the risk-free rate and investors share the same beliefs about
distribution of returns.
6.2.4 Application of SL CAPM by regulators
The SL CAPM model is acknowledged by the ESC as meeting the criterion of being well-
accepted and we agree with its assessment. However, when applied in practice, the
model does encounter significant empirical limitations.
The SL CAPM is used extensively by regulators in Australia and other jurisdictions.
Graham and Harvey (2001) surveyed nearly 400 chief financial officers of large US
corporations to establish, among other things, what approaches these businesses applied

DETERMINING A WACC ESTIMATE FOR PORT OF MELBOURNE Page 82 of 296
in valuing capital.51 Brounen, de Jong and Koedijk (2004) broadened this work by
extending the survey to businesses in the UK, Netherlands, Germany and France.52 In
all, these researchers confirmed the widespread use of CAPM in companies in the US
and several European countries (around 60 per cent).
Relevantly for our assessments of acceptance of other approaches besides the SL CAPM,
survey research has found that a significant minority of corporations (skewed towards
larger companies) modified the SL CAPM by including additional risk factors. In other
words, many companies regarded the SL CAPM (as it is generally applied in regulatory
processes) as insufficient to be used as the sole measure of the cost of equity. This reflects
the application of SL by financial practitioners in Australia.
A number of studies have also provided evidence in support of using the SL CAPM. The
results from Moyer, McGuigan and Kretlow (2001) and Campbell, Lo and Mackinlay
(1997), for instance, suggest that the SL CAPM is appropriate for examining the pricing
of capital assets, evaluation of investment portfolios and event studies of efficient
markets. Davis (2011), Handley (2014) as well as McKenzie and Partington (2014)
supported the use of the SL CAPM in reports to the Australian Energy Regulator
(AER).53
6.2.5 Application of SL CAPM in academia
The logic of the CAPM is that an investment should earn at least the risk free rate
(otherwise there would be no reason to invest in risky assets). CAPM stipulates that a
security’s excess return above the risk free rate depends only on the correlation of its
returns with those of the market as a whole. The strength of this relationship is measured
by beta.
Two of the earliest and most significant contributions were Black et al. (1972)54 and Fama
and Macbeth (1973).55 To investigate the association between beta estimates and average
stock returns, Black et al. (1972) used monthly statistics relating to price, dividend,
51 Graham, J. and Harvey, C. (2001). The theory and practice of corporate finance: Evidence from the field. Journal of
Financial Economics, 60, pp.187-243.
52 Brounen, D., de Jong, A. and Koedijk, C.G. (2004). Corporate finance in Europe: Confronting theory with practice. 2004 Maastricht Meetings Paper No. 2769. Also published in Financial Management.
54 Black, F., Jensen, M.C., and Scholes, M. (1972). The capital asset pricing model: Some empirical tests, in Studies in the Theory of Capital Markets. Michael C. Jensen, ed. New York: Praeger, pp.79-121.
55 Fama, E. F. and Macbeth, J. (1973). Risk, return and equilibrium: Empirical tests. Journal of Political Economy, 81(3), pp. 607–636.

DETERMINING A WACC ESTIMATE FOR PORT OF MELBOURNE Page 83 of 296
adjusted price and dividend information for all common stocks traded on the New York
Stock Exchange for the period between January 1926 and March 1966. Similarly, Fama
and Macbeth (1973) used monthly percentage returns for the same data from January
1926 to June 1968. The results from these two studies highlighted that the SL CAPM
generated values of expected returns that had a small or zero association with actual
returns. Specifically, the findings from these studies suggested that the SL CAPM
produced a poor fit to the observed data.
In addition to the study by Black et al. (1972), a 2004 review of the literature concerning
CAPM by Fama and French (2004) highlighted that the SL CAPM presented a
downwardly biased estimate of the rate of return for the low-beta firms.56 This provided
an indication that the linear relation between average return and beta is flat compared
to SL CAPM predictions, i.e., a shortcoming in the SL CAPM identified as the low beta
bias. The authors (Fama and French) concluded that:
The attraction of the CAPM is that it offers powerful and intuitively pleasing
predictions about how to measure risk and the relation between expected return and
risk. Unfortunately, the empirical record of the model is poor – poor enough to
invalidate the way it is used in applications. The CAPM's empirical problems may
reflect theoretical failings, the result of many simplifying assumptions. But they may
also be caused by difficulties in implementing valid tests of the model.
In the end, we argue that whether the model's problems reflect weaknesses in the
theory or in its empirical implementation, the failure of the CAPM in empirical tests
implies that most applications of the model are invalid.
Acknowledging that the true market portfolio is unobservable, Shanken (1987) reported
empirical evidence that SL CAPM was invalid by generating a multivariate proxy for
the true market portfolio.57 Burmeister and McElroy (1988) employed the S&P 500 Index
as a proxy for the market and also rejected the hypothesis of SL CAPM.58 Findings from
a number of recent studies are also found to be in line with the findings of these earlier
empirical works. Mehrling (2005), for instance, revealed that:59
56 Fama, E.F. and French, R.K. (2004). The capital asset pricing model: Theory and evidence. Journal of Economic
Perspectives, 18(3), pp. 25–46.
57 Shanken, J. (1987). Multivariate proxies and asset pricing relations. Journal of Financial Economics, 18, pp.91-110.
58 Burmeister, E. and McElroy, M.B. (1988). Joint estimation of factor sensitivities and risk premia for the Arbitrage Pricing Theory. Journal of Finance, 43, pp.721-33.
59 Mehrling, P. (2005). Fischer Black and the revolutionary idea of finance, Wiley, pp.104–105.

DETERMINING A WACC ESTIMATE FOR PORT OF MELBOURNE Page 84 of 296
One important consequence of the BJS (a 1972 paper of Fischer Black, Michael Jensen,
and Myron Scholes titled The Capital Asset Pricing Model: Some Empirical Tests) was
to confirm earlier suggestions that low-beta stocks tend to have higher returns and
high-beta stocks tend to have lower returns than the theory predicts.
Campbell and Vuolteenaho (2004) revealed that: 60
It is well known that the CAPM fails to describe average realized stock returns since
the early 1960s, if a value-weighted equity index is used as a proxy for the market
portfolio. In particular, small stocks and value stocks have delivered higher average
returns than their betas can justify. Adding insult to injury, stocks with high past betas
have had average returns no higher than stocks of the same size with low past betas.
Da, Guo and Jagannathan (2012) revealed that:61
A variety of managed portfolios constructed using various firm characteristics earn
very different returns on average from those predicted by the CAPM. Fama and
French make a convincing case that the CAPM fails to describe the cross section of
stock returns.
Lewellen and Nagel (2006) respond to suggestions that the unconditional SL CAPM
failed due to time-variation in risk and expected returns. This would imply a role for a
conditional SL CAPM, which allows for beta to vary over time. However, the authors
demonstrated that the conditional SL CAPM performed nearly as poorly as the
unconditional SL CAPM, and that time-variation in betas and the equity premium
would have to be implausibly large to explain the value premium.62
A brief summary of other contributions SL CAPM academic literature is presented in
Table 14. Of the 38 papers in Table 14 (which are in addition to the papers introduced
above), 25 present evidence that rejects the SL CAPM; 5 uncover evidence that supports
the SL CAPM; and 8 make neutral findings. Of the 18 papers published since 2000, 13
reject the SL CAPM (72%), while the remaining 5 papers (28%) reach a neutral or
supportive conclusion. Although some authors find insufficient evidence to reject the SL
CAPM on statistical grounds, the majority of the literature finds that the SL CAPM is
empirically inadequate for explaining observed returns.
60 Campbell, Y. J and Vuolteenaho, T. (2004). Bad beta, good beta. The American Economic Review, 94(5), p.1249.
61 Da, Z. Guo, R.J. and Jagannathan, R. (2012). CAPM for estimating the cost of equity capital: Interpreting the empirical evidence. Journal of Financial Economics, 103(1), pp.204–206.
62 Lewellen, J. and Nagel, D. (2006). The Conditional CAPM does not explain asset-pricing anomalies. Journal of Financial Economics, 82, pp.289-314.

DETERMINING A WACC ESTIMATE FOR PORT OF MELBOURNE Page 85 of 296
Table 14 Additional SL CAPM literature
Author Year Study Name Summary CAPM - Support / Neutral / Reject
Douglas 1969
Risk in the equity markets; an empirical appraisal of market efficiency
In annual and quarterly return data, it was found that there seemed to be measures of risk, in addition to beta, that contribute systematically to observed average returns. These results are inconsistent with the hypothesis that investors attempt to hold efficient portfolios.
Reject
Miller and Scholes
1972
Rates of return in relation to risk: a re-examination of some recent findings
By using individual securities' returns in testing the validity of the CAPM, they found that the intercept has values much larger than the risk-free rate of return while the coefficient of beta statistically has a lower value.
Reject
Basu 1977
Investment performance of common stocks in relation to their price earnings ratios: a test of efficient market hypothesis
Basu finds that when stocks are sorted on earnings-price ratios, those with high E/P have higher expected future returns than is predicted by the CAPM which suggests there are other factors that contribute to asset returns.
Reject
Roll 1977
A critique of the asset pricing theory's tests - part 1: on past and potential testability of the theory
Raised doubts testing the CAPM. Regression tests are probably of quite low power, and grouping may lower the power further. As long as proxies are used for the market portfolio, the Sharpe-Lintner theory is not being tested.
Neutral
Roll 1978
Ambiguity when performance is measured by the securities market line
Neutral
Lakonishok and Shapiro
1984 Stock returns, beta, variance and size: an empirical analysis
Found that an insignificant relationship between beta and returns and a significant relationship between market capitalisation and returns.
Reject
Lakonishok and Shapiro
1986
Systematic risk, total risk and size as determinants of stock market returns
Concludes that neither the traditional measure of risk (beta) nor alternative measures (such as variance or residual standard deviation) can significantly explain the cross-sectional variation in returns. Instead, only size appears to be of relevance.
Reject
Tinic and West 1984 Risk and return, January vs the rest of the year
Conducted similar study to Fama and MacBeth (1973), which has previously been cited in our report, but concluded opposite results. They found that residual risk has no effect on asset returns. However, their intercept is greater than the risk-free rate, and their results indicate that the CAPM might not hold.
Reject
Bhandari 1988
Debt/equity ratio and expected common stock returns: empirical evidence
Bhandari finds that expected common stock returns are positively related to the ratio of debt to equity, controlling for beta and firm size. Shows that single factor CAPM does not hold and other factors also contribute to asset returns.
Reject
Chan et al 1991 Fundamentals and stock returns in Japan
Research on a sample of Japanese firms found that differences in returns were related to four variables: earnings yield; size; book to market ratio; and cash flow yield. Their findings "reveal a significant relationship
Reject

DETERMINING A WACC ESTIMATE FOR PORT OF MELBOURNE Page 86 of 296
Author Year Study Name Summary CAPM - Support / Neutral / Reject
between these variables and expected returns in the Japanese market.”
Amihud et al 1992 Further Evidence on the Risk-Return Relationship
Argue that data is too noisy to invalidate the CAPM. Show that when a more efficient statistical method is used, the estimated relationship between average return and beta is positive and significant.
Support
Black 1993 Beta and return
Posits that it is too premature to declare the “death” of beta. Argues that rational investors who can borrow freely, whether individuals or firms, should continue to use the CAPM and beta to value investments and to choose portfolio strategies.
Support
Davis 1994
The cross-section of realized stock returns: the pre-compustat evidence
Using a database that is free of survivorship bias, it finds that book-to-market equity, earnings yield and cash flow yield have significant explanatory power. This goes against the theory of the SL CAPM, which posits that only systematic risk exposure is relevant.
Reject
He and Ng 1994 Economic forces, fundamental variables and equity returns
Finds that book-to-market exhibits the most explanatory power of average returns, contrary to the theory of the SL CAPM. Meanwhile, size is found to play a weaker role.
Reject
Lakonishok et al 1994 Contrarian investment, extrapolation, and risk
Argue that the size and P/B effects are due to investor overreaction rather than compensation for risk bearing. As a result, investors systemically overreact to corporate news, unrealistically extrapolating high or low growth into the future. This leads to under-pricing of 'value' (small capitalisation, high P/B stocks) and overpricing of 'growth' (large capitalisation, low P/B stocks).
Neutral
Fama and French 1995 Size and book-to-market factors in earnings and returns
Predicts that the return on the portfolio of small stocks is higher than the return on the portfolio of large stocks (the so-called size effect) and also that the return on stocks with high B/M ratios is higher than the return on stocks with low B/M ratios. Follow-up paper to earlier seminal work
Reject
Kothari et al 1995 Another look at the cross-section of expected stock returns
Notes that using historical betas estimated from annual rather than monthly returns produces a stronger relation between return and beta. Also, that the relation between P/B and return is exaggerated by survivor bias in many samples used.
Neutral
Pettengill et al 1995 The conditional relation between beta and returns
Finds that a consistent and highly significant relationship between beta and cross-sectional portfolio returns and beta predicted by CAPM is based on expected rather than realized returns.
Neutral
Miles and Timmermann
1996
Variation in expected stock returns: evidence on the pricing of equities from a cross-section of UK companies
Provide weak empirical evidence on the single-factor CAPM and rather find that book to market value, and to a lesser extent company size and liquidity, are the only company attributes that appear to contain information about variation in expected returns.
Reject

DETERMINING A WACC ESTIMATE FOR PORT OF MELBOURNE Page 87 of 296
Author Year Study Name Summary CAPM - Support / Neutral / Reject
Kothari and Shanken
1999 Beta and book-to-market: is the glass half full or half empty?
Counters Fama and French (1992) emphasising that the evidence ignored positive evidence on historical betas and overemphasise the importance of P/B. Although size is statistically significant, the incremental benefit of size, given the beta, is surprisingly small. Also claim that P/B is a weak determinant of the cross-sectional variation in average returns among large firms and fails to account for return differences related to momentum and trading volume.
Neutral
Elsas et al 2000
Beta and returns revisited: evidence from the German stock market
Find a positive and statistically significant relationship between beta and return in their sample period, 1960 - 1995, as well as in all sub-periods they analyse for the German market. They maintain that the empirical results provide justification for the use of betas estimated from historical return data by portfolio managers.
Support
Bartholdy and Pearl
2001 The relative efficiency of beta estimates
Argue that five years of monthly data and an equal-weighted index provide the most efficient estimates of historical beta. However, they find that the ability of historical betas to explain differences in returns in subsequent periods ranges from a low of 0.01% to a high of 11.73% across years. With these results, they conclude that it may well be appropriate to declare the beta dead.
Reject
Cremers 2001
Reviving beta? Bayesian tests of the CAPM when the market portfolio is unobservable
Claims that the data do not provide clear evidence against the CAPM. Poor performance of the CAPM often appears to be due to measurement problems with respect to the market portfolio and its beta. Thus, he concludes that the CAPM may still be valid.
Neutral
Avramov 2002 Stock return predictability and model uncertainty
Shows that small-cap value stocks appear to be more predictable than large-cap growth stocks and that model uncertainty is more important than estimation risk: investors who discard model uncertainty face large utility losses.
Reject
Griffin 2002 Are the Fama and French factors global or country specific?
Concludes that country-specific three-factor models are more useful in explaining stock returns than world and international versions
Reject
Koutmos and Knif 2002 Estimating systematic risk using time varying distributions
Propose a dynamic vector GARCH model for estimation of time-varying betas. They find that in 50% of cases, betas are higher during market declines (the opposite is true for the remaining 50%). They claim that the static market model overstates unsystematic risk by more than 10% and that dynamic betas follow stationary, mean reverting processes.
Reject
Shalit and Yitzhaki
2002 Estimating beta
Argue that the OLS regression estimator is not appropriate for estimating betas. Suggest alternatives: eliminate the highest and lowest four market returns and show that the betas of 75% of the firms change by more than one standard error.
Reject
Thompson et al 2006 Nobels for nonsense
Presents three important pieces of evidence against the CAPM: 1) the correlation between the return and the volatility of the Ibbotson Index in 1926 - 2000
Reject

DETERMINING A WACC ESTIMATE FOR PORT OF MELBOURNE Page 88 of 296
Author Year Study Name Summary CAPM - Support / Neutral / Reject
was negative (-0.32) 2) 65% of the portfolios randomly chosen had a higher return than the CAPM could predict 3) an 'equal weight index', in 1970-2002, had an annualised return 4.8% higher than the S&P 500.
Aktas and McDaniel
2009
Pragmatic problems in using beta for managerial finance applications
Present cases in which CAPM-generated costs of equity are less than zero, less than the risk-free rate and less than the company's marginal cost of debt. They calculate betas using 60 and 120 monthly returns. They reference a Compustat database with 8,361 companies with listed betas: 925 of these are negative.
Reject
Brennan and Lo 2010 Impossible frontiers
Define 'impossible' as when every efficient portfolio has at least one negative weight. They prove that the probability of an impossible frontier approaches 1 as the number of assets increases with sample parameters.
Neutral
Levy and Roll 2010 The market portfolio may be mean/variance efficient after all
Affirm that many conventional market proxies could be perfectly consistent with the CAPM and useful for estimating expected returns.
Support
Levy 2011 The capital asset pricing model in the 21st century
Although behavioural economics contradicts aspects of expected utility theory, CAPM and M-V remain intact in both expected utility theory and cumulative prospect theory frameworks. Furthermore, the paper finds that there is no evidence to reject CAPM empirically when ex-ante parameters are employed.
Support
Dempsey 2013
The capital asset pricing model (CAPM): the history of a failed revolutionary idea in finance?
Concludes that available empirical evidence does not support the CAPM.
Reject
Giannakopoulos 2013
A deep dive into the mean/variance efficiency of the market portfolio
Counter to Levy and Roll (2010). Results are highly sensitive to the choice of the portfolio used, the market returns and the standard deviation as well as to the choice of the risk-free rate. They conclude that the performance of these models, with their real market values, is not sufficiently robust to justify global acceptance.
Reject
Antoniou et al 2014 Investor Sentiment, Beta and the Cost of Equity Capital
Argue that the security market line accords with the CAPM by taking an upward slope in pessimistic periods but a downward slope in optimistic periods. In particular, high beta stocks become over-priced in optimistic periods. For this reason, CFOs can use the CAPM for capital budgeting decisions in pessimistic periods but not optimistic ones.
Reject
Carelli et al 2014 Which is the right 'market beta'?
Calculated the betas of 1,385 US companies on March 31, 2014 and showed 147 betas for each company, using monthly, weekly and daily returns over different intervals. The median of the difference [maximum beta - minimum beta] was 1.03. Ranking the companies according to their betas, they find that the average of the maximum ranking - minimum ranking for the 1,385 companies is
Reject

DETERMINING A WACC ESTIMATE FOR PORT OF MELBOURNE Page 89 of 296
Author Year Study Name Summary CAPM - Support / Neutral / Reject
786. In addition, it shows that for single data, calculated betas have an average range of 1.03.
Fernandez 2014 CAPM: an absurd model
Conclude that most papers that use calculated betas are irrelevant. It is clear that both, the assumptions and the predictions/conclusions of the CAPM, have no basis in the real world.
Reject
Gilbert et al 2014
Daily data is bad for beta: opacity and frequency-dependent betas
Report that beta varies across return frequencies. Using returns over the previous 60 months, they conclude that beta differences across frequencies occur even in large and liquid stocks and cannot be explained by microstructure and trading frictions.
Reject
6.2.6 Application of SL CAPM by financial practitioners
It is helpful to frame the model assessment in the context of how the financial community
approaches WACC – in practice, this is the community of interest with the most direct
connection with identifying a return that is necessary to compensate a provider of
prescribed services for the risks involved in providing prescribed services.
As such, financial practitioners offer the clearest indication of how financial markets
would determine the cost of capital for an entity such as PoM, which relates to the PMA’s
objective of allowing a provider of Prescribed Services a reasonable opportunity to
recover the efficient costs of providing Prescribed Services, including a return
commensurate with the risks involved. As we demonstrate, financial practice diverges
from “textbook” return on equity models as applied by regulators in consistent and very
important ways. We begin by interrogating market evidence on how financial
practitioners actually calculate WACC in independent expert reports.
Evidence from independent expert reports
This section outlines our insights from independent expert reports, both in Australia and
in the United States. For Australian reports, we have analysed the Connect 4 database in
relation to adjustments to the SL CAPM. The Connect 4 database (provided by Thomson
Reuters) contains independent expert reports for companies listed on the ASX. For US
reports, we have consulted the EDGAR SEC filings database.
For the Australian sample, Synergies has investigated all 424 independent expert reports
relating specifically to acquisitions, takeovers, divestments, demergers and merger

DETERMINING A WACC ESTIMATE FOR PORT OF MELBOURNE Page 90 of 296
schemes from 1 January 2013 to present.63 Of these 424 reports, only 198 (47%) made
explicit reference to the use of a WACC or discount rate, and of these only 150 (35%)
provide a detailed description of their WACC methodology.
Our main findings are as follows:
• Of the 150 reports with detailed WACC calculations, we have identified 51 IE
reports that make ad hoc adjustments to the conventional SL CAPM formulation.64
A number of these reports apply size and other premiums consistent with the
principles of the FFM model. 14 out of 50 reports explicitly apply size premiums.
• Many IE reports adopt risk-free rates well in excess of contemporaneous risk-free
rates, consistent with the higher intercept implied by the principles of the Black
CAPM (see Section 6.3).
The remainder of this section elaborates on the varying treatment of the risk-free rate
parameter, before discussing the nature of the risk premiums that we have identified.
Use of higher risk-free rates
There is also clear evidence that IE reports frequently adopt risk-free rates above the
contemporaneous risk-free rate as measured by the RBA. To illustrate this phenomenon,
Figure 1 shows the divergence between the risk-free rate adopted in each IE report and
the prevailing risk-free rate published by the RBA at the time. This is a significant
finding, because it shows that industry practice diverges from the regulatory practice of
calculating the risk-free rate based on a short averaging period of long-term bond rates
informed by contemporaneous data (see Chapter 7). In the current environment, this will
inevitably result in higher WACC estimates than those arising from regulatory
processes, although independent experts also achieve a similar effect through
adjustments to the MRP and other parameters.
63 To facilitate an efficient interrogation of the database, we restricted our analysis to acquisitions with a deal size greater
than $AUD10 million.
64 We define an ad hoc adjustment as the inclusion of an additional parameter not included in the conventional SL CAPM formula as applied by Australian economic regulators. The ad hoc adjustments presented here do not incorporate reflect uplifts to the MRP, risk-free rate, or other standard WACC parameters, which may increase the overall WACC further relative to a standard regulatory approach.

DETERMINING A WACC ESTIMATE FOR PORT OF MELBOURNE Page 91 of 296
Figure 1 Comparison of risk-free rates with prevailing RBA risk-free rate
Data source: RBA, Connect 4, Synergies calculations
Application of risk premiums
In the 424 independent expert reports that we interrogated, it is clear that independent
experts apply size and other premiums (such as for growth prospects, product execution
risk and market-imposed hurdle rates).
In cases where size and other risk premiums are applied, the consequences for the
resulting WACC are far from immaterial. Figure 2 illustrates the divergence between the
actual WACC estimates used in independent expert reports and the WACC estimates in
the absence of any ad hoc adjustments for risk premiums. In the upper panel, the orange
points denote the WACC estimate after incorporating the ad hoc premium adjustments,
while the dark green points denote the resulting WACC in the absence of any such
adjustments. In the lower panel of Figure 2, we present the magnitude of the ad hoc
adjustment, which is in effect the difference between the two lines in the upper panel.
0.00%
1.00%
2.00%
3.00%
4.00%
5.00%
6.00%
Aug-13 Feb-14 Sep-14 Mar-15 Oct-15 Apr-16 Nov-16 Jun-17 Dec-17 Jul-18
RBA risk-free rate Risk-free rate used

DETERMINING A WACC ESTIMATE FOR PORT OF MELBOURNE Page 92 of 296
Figure 2 Comparison of WACC estimates with and without ad hoc adjustments
Data source: Connect 4, Synergies calculations
Across the sample, the average adjustment was 2.83%, while the median was 1.60%. In
proportional terms, this causes the ad hoc adjusted WACC estimates to be on average
almost a third larger than the unadjusted WACC estimates implied by the CAPM.
On top of this, risk-free rates used by practitioners are on average 0.93% higher than
those that would be used in regulatory processes, effectively adding almost another 1%
to the ad hoc premium.
The data extracted from independent expert reports can also be used to generate
estimates of the post-tax total market return.65 The median total market return across the
sample period is 10.0% (with an average of 10.1%). It is important to note that these
65 The total market return is equal to the risk free rate plus the market risk premium. In the CAPM framework, this is
equivalent to the post tax return on equity for an asset with an equity beta of 1.
6%
8%
10%
12%
14%
16%
18%
20%
22%
24%
26%
Aug-13 Feb-14 Sep-14 Mar-15 Oct-15 Apr-16 Nov-16 Jun-17 Dec-17 Jul-18
WA
CC
WACC WACC with 'ad hoc' adjustments
0%
2%
4%
6%
8%
10%
12%
14%
16%
Aug-13 Feb-14 Sep-14 Mar-15 Oct-15 Apr-16 Nov-16 Jun-17 Dec-17 Jul-18
'Ad
ho
c' A
dju
stm
ent
Size

DETERMINING A WACC ESTIMATE FOR PORT OF MELBOURNE Page 93 of 296
estimates do not incorporate any ad hoc risk premia, which would further add to total
equity returns.
Figure 3 Post-tax total market returns implied by independent expert reports
Note: The total market returns in this chart are presented on a post-tax basis and do not include any ad hoc risk premia.
Data source: Connect 4, Synergies calculations
Conclusions on financial practitioner evidence
The evidence we have presented in this section shows that financial practitioners
routinely depart from the conventional SL CAPM as it is typically applied by Australian
economic regulators through the use of additional premia and higher risk-free rates.
Accordingly, this suggests that exclusive reliance on the SL CAPM (without adjustment)
will not meet the statutory objective in terms of providing the return required by the
BEE providing services with a similar degree of risk as that which applies to PoM in
respect of the provision of Prescribed Services. In turn, this suggests that the optimal
return on equity framework for PoM may give some weight to the SL CAPM, but also
have regard to other well-accepted approaches that are capable of addressing the discord
between the SL CAPM and actual financial practice and empirical observation. We
examine such candidate models in the rest of this chapter.
0.00%
2.00%
4.00%
6.00%
8.00%
10.00%
12.00%
14.00%
Aug-13 Feb-14 Sep-14 Mar-15 Oct-15 Apr-16 Nov-16 Jun-17 Dec-17 Jul-18

DETERMINING A WACC ESTIMATE FOR PORT OF MELBOURNE Page 94 of 296
6.2.7 Application of guiding principles for well-accepted approaches
The evidence presented in the preceding subsections enables us to ascertain how the SL
CAPM performs in relation to the guiding principles we introduced in Chapter 3. An
overview of these criteria as they apply to the SL CAPM are presented in Table 15.
Table 15 Application of IPART/AER criteria to SL CAPM
Criteria Applicability to SL CAPM
Accuracy SL CAPM has been proven across multiple studies to provide poor empirical fit. Any persistent mis-estimation of the return on equity will not contribute to the achievement of the regulatory objectives.
Stability and predictability SL CAPM is relatively stable and predictable, as it relies on only three parameters (although the risk-free rate and MRP may change with market conditions).
Transparency and replicability The SL CAPM is easy to implement and replicate.
Reflection of economic/financial principles SL CAPM has strong theoretical appeal, although its assumption of investors being able to borrow and lend at the risk-free rate is not consistent with financial practice.
Flexibility with changing market conditions SL CAPM will adjust in line with changes in the risk-free rate, MRP and/or beta, but will not capture any other factors that affect the return on equity.
Robust data Data for SL CAPM is readily available and directly observable – the issue instead is what the model fails to capture.
6.2.8 Conclusion on SL CAPM
In summary, the SL CAPM’s theoretical foundations are attractive but its empirical
performance is poor. Accordingly, we consider exclusive reliance upon the SL CAPM is
inappropriate given the asymmetric consequences of regulatory error.
The theoretical foundations of the SL CAPM do not offset the poor explanatory power
of that model in terms of predicting actual returns. In this context, a more pertinent
consideration is whether the requirements of the Pricing Order and the statutory
objectives can be met by the SL CAPM alone or whether those requirements and
objectives are better met by combining the SL CAPM with other well-accepted
approaches, such as the Black CAPM and the FFM. Moreover, if the SL CAPM had a
proven track record of accurately matching observed returns, there would have been
little scope for the FFM to have been developed in the first instance.
6.3 Black CAPM
The purpose of this section is to explain the evolution of the Black CAPM (1972) and its
application.66 The Black CAPM augments the SL CAPM by adding what is known as a
66 Black, F. (1972). Capital market equilibrium with restricted borrowing. Journal of Business, 28(1), pp.444-454.

DETERMINING A WACC ESTIMATE FOR PORT OF MELBOURNE Page 95 of 296
zero-beta portfolio to the risk-free rate to take into account the observed tendency of the
SL CAPM to understate asset returns for companies with betas less than one. We have
applied the Black CAPM to estimate a return on equity for the BEE.
A key motivation for modifying SL CAPM is the empirical observation of low beta bias,
evidence of which is well documented in academic literature.
6.3.1 Black CAPM formulation
The Black CAPM is expressed as follows:
Re = Rz + e * [E(Rm) – Rz]
Where:
Rz = the rate of return on the zero-beta portfolio (equal to risk-free rate plus zero beta premium)
E(Rm) = the expected return on the market
[E(Rm) – Rz] = the zero-beta adjusted market risk premium
e = equity beta (measures systematic risk)
The relationship between the SL CAPM and Black CAPM is indicated in Figure 4.67 The
SL CAPM uses a theoretical lower bound for the intercept (i.e., the intercept cannot
possibly be lower than the risk-free rate). In contrast the Black CAPM provides an
empirical estimate of the risk-free rate, the zero-beta portfolio. This is reflected in a
higher intercept point on the Y-axis, reflecting the zero-beta premium.
67 SFG Consulting (2014c). The required return on equity for regulated gas and electricity network businesses, 27 May,
p.22.

DETERMINING A WACC ESTIMATE FOR PORT OF MELBOURNE Page 96 of 296
Figure 4 Relationship between SL CAPM and Black CAPM
Source: SFG Consulting (2014)
6.3.2 Black CAPM strengths
By construction, the Black CAPM removes the tendency of the SL CAPM to under-
estimate the returns to low beta assets and over-estimate the returns to high beta assets.
There is substantial evidence in Australia and the US demonstrating large zero-beta
premiums.
It has less restrictive assumptions than the SL CAPM, with its central prediction being
that market betas suffice to explain expected returns and the risk premium for beta is
positive (in contrast the SL CAPM assumes the premium per unit of beta is strictly the
expected market return minus the risk-free interest rate).
It has been applied in rate of return regulation cases in other jurisdictions, for example
in the United States and Canada, where it is sometimes known as the empirical CAPM
(ECAPM) or the zero-beta CAPM.
Black, Jensen and Scholes (1972), among others, discovered that the slope in CAPM
regressions was flatter than would be implied by SL CAPM. Specifically, the SL CAPM
tended to understate asset returns for companies with betas less than one, and overstate
asset returns for betas greater than one. One implication of this is that the intercept in
these regressions was higher than expected. In the SL CAPM, the intercept takes the form
of the risk-free rate. Therefore, the Black CAPM proposes adding the zero-beta premium
to the risk-free rate.
A key difference between the SL CAPM and the Black CAPM is that the SL CAPM
assumes that investors can borrow and lend at the risk-free rate, which presents
difficulties in practice (as it is not generally possible). The Black CAPM does not require

DETERMINING A WACC ESTIMATE FOR PORT OF MELBOURNE Page 97 of 296
this assumption, but instead assumes that investors can short sell risky assets such as
stocks. This assumption has its limitations too because investors may be able to short sell
only to a certain extent. However, it is not considered to be as limiting an assumption.
These differing assumptions thus explain the contrasting formulas for the two models.
In the Black CAPM, expected return is equal to the return on a zero-beta asset (an asset
with no systematic risk) plus a premium for bearing systematic risk (the SL CAPM equity
beta).
6.3.3 Black CAPM weaknesses
While the Black CAPM is intended to address the low beta bias inherent in the SL CAPM,
many studies have found that it too fails to produce a statistically significant association
between beta estimates and stock returns. In addition, deriving a statistically significant
estimate of the rate of return on the zero-beta portfolio has proven elusive in Australia.
6.3.4 Application of Black CAPM by regulators
In its 2010 final decision relating to network regulation, Ofgem (UK Office of Gas and
Electricity Markets) highlighted that although the return on equity will be computed
using the CAPM approach, evidence from other models will also be considered.68
Subsequently, Ofgem stated that the CAPM should be “sense-checked by other
approaches and evidence.”69 This implies that other potential models (e.g. Black CAPM,
FFM, DDM) can be used as cross-checks for the analysis of the return on equity.
The Public Service Commission of Maryland (PSCM 2016) considered the Black CAPM
as well as a number of other financial models for its determination of return on equity.
According to PSCM:70
The ROE witnesses used various analyses to estimate the appropriate return on equity
for BGE’s electric and gas distribution operations, including the DCF model, the
IRR/DCF, the traditional CAPM, the ECAPM (Black CAPM), and risk premium
methodologies. Although the witnesses argued strongly over the correctness of their
competing analyses, we are not willing to rule that there can be only one correct
method for calculating an ROE. Neither will we eliminate any particular methodology
as unworthy of basing a decision.
68 Ofgem (2010). RIIO: A new way to regulate energy networks, Final decision, October, p.40.
69 Ofgem (2013). Strategy decision for the RIIO-ED1 electricity distribution price control, Financial issues, Supplementary annex, 4 March.
70 Public Service Commission of Maryland (2016). In the matter of the application of Baltimore gas and electric company for adjustments to its electric and gas base rates, order no. 87591, case no. 9406, June, p.153.

DETERMINING A WACC ESTIMATE FOR PORT OF MELBOURNE Page 98 of 296
The Alberta Utilities Commission (2016) was found to apply an equity risk premium
(ERP) approach as its primary method. This approach considered several financial
models employed by various experts that participated in its proceeding in order to
establish a fair allowed return on equity. Financial models employed by experts were
comprised of CAPM, Black CAPM, bond yield plus risk premium model, predictive risk
premium model and DDM.71
Similarly, a rate of return was computed through a formula-based approach using the
ERP method by the Ontario Energy Board (2009). Specifically, the OEB considered
various financial models to determine the initial ERP model or cost of equity, i.e., CAPM,
Black CAPM, bond yield plus risk premium model, predictive risk premium model and
DDM. 72
The Mississippi Public Service Commission (MPSC 2009) in the US has, in addition,
included the Black CAPM as one of the models used for the return on equity
determination.73 The following regulatory decisions by the New York Public Service
Commission provide further evidence to the use of the Black CAPM in US regulatory
decisions:
• Public Case Proceeding on Motion of the Commission as to the Rates, Charges,
Rules and Regulations of Consolidated Edison Company of New York, Inc. for
Electric Service; Petition for Approval, Pursuant to Public Service Law, Section
113(2), of a Proposed Allocation of Certain Tax Refunds between Consolidated
Edison Company of New York, Inc. and Ratepayers.74
• Public Case Proceeding on Motion of the Commission as to the Rates, Charges,
Rules and Regulations of National Fuel Gas Distribution Corporation for Gas
Service.75
• Public Case Proceeding on Motion of the Commission as to the Rates, Charges,
Rules and Regulations of Central Hudson Gas & Electric Corporation for Electric
71 Alberta Utilities Commission (2016). 2016 generic cost of capital, Decision 20622-D01-2016, October.
72 Ontario Energy Board (2009). Report of the board on the cost of capital for Ontario’s regulated utilities, EB-2009-0084, December.
73 Mississippi Public Service Commission (2009). Performance evaluation plan – Rate schedule “PEP-5A”, Mississippi Power Company, Schedule No. 28.1, January.
74 New York PUC 2009, LEXIS 507.
75 New York PUC 2007, LEXIS 449; 262 PUR 4th 233.
DETERMINING A WACC ESTIMATE FOR PORT OF MELBOURNE Page 99 of 296
Service; Proceeding on Motion of the Commission as to the Rates, Charges, Rules
and Regulations of Central Hudson Gas & Electric Corporation for Gas Service.76
An expert report to the AER by Professor J. Robert Malko from Utah State University
also highlighted that the Black CAPM had been presented and considered by many
regulatory commissions in the US. This, for instance, included regulatory commissions
in California, Colorado, Delaware, Kentucky, Maryland, Michigan, Minnesota,
Mississippi, New York, South Dakota, Virginia, Washington and West Virginia.77
6.3.5 ESC interim commentary on the Black CAPM
The ESC provided a number of observations on the Black CAPM and low beta bias in its
interim commentary. Largely, these focus on the considerations of the AER. In this
section, we summarise the issues the ESC has raised, and also supplement the discussion
with developments from the AER’s final Rate of Return Instrument, which was released
after the ESC published its interim commentary. Attachment D provides responses to
the detailed issues raised by the ESC. We also address the key issues raised by the ESC.
As we have previously documented, the AER considered in its 2013 guidelines that the
Black CAPM could be used to inform the equity beta. The AER stated in its December
2013 Better regulation – Rate of return guideline that:78
‘We account for the Black CAPM because we recognize that there is merit to its
theoretical basis, particularly when viewed alongside the standard Sharpe-Lintner
CAPM.’
The AER cited the relaxed assumptions of the Black CAPM compared to the SL CAPM
as reasons for consideration, but did caution that even these assumptions may not hold
in practice. The AER noted that the Black CAPM can be used to inform the equity beta.79
This was attributable to the SL CAPM understating and overstating the return on equity
for low beta stocks and high beta stocks, respectively.
Accordingly, the AER chose an equity beta towards the upper end of the identified
empirical range.
76 New York PUC 2006, LEXIS 227; 251 PUR 4th 20.
77 Malko, J.R. (2015). Statement of Dr. J. Robert Malko, June.
78 AER (2013b). Better regulation – Explanatory statement – Rate of return guideline, December, p.85.
79 AER (2013b), p.58.

DETERMINING A WACC ESTIMATE FOR PORT OF MELBOURNE Page 100 of 296
However, in the 2018 Rate of Return Guideline Review, the Independent Panel
reviewing the AER’s draft guidelines questioned this approach, arguing instead that the
Black CAPM and low beta bias are unrelated to the estimation of beta and recommended
against applying any arbitrary adjustment in an attempt to rectify the bias.80
In comments referenced by the ESC, the AER now states that its consideration of the
Black CAPM was not related to low-beta bias, but was instead intended to “capture
possible market imperfections that may lead actual returns to differ from expected
returns.” Irrespective of the AER’s justification for considering (or not considering) the
principles of the Black CAPM, the ultimate outcome of its use (abandonment) is that it
flattens (steepens) the security market line to be more (less) in keeping with long-term
and persistent empirical reality. The AER abandoned the Black CAPM without ever
addressing what these “possible market imperfections” may include. A number of
stakeholders in the AER review process have been concerned that the regulator has
reached an entirely different conclusion on much the same evidence base as was
available at the time of the previous guideline review.81 The Black CAPM was deemed
suitable for consideration under the AER’s assessment framework in 2013.
The AER appears to have considered only three papers that have been published since
it released the 2013 guidelines. In its critique of issues with low beta bias and ex post
empirical tests of the SL CAPM, the AER relies on Frazzini and Pedersen (2014) to
support the argument that low beta bias arises due to the over-pricing of high beta
stocks.82 Frazzini and Pedersen (2014) examine the impact of funding constraints (such
as an inability to borrow) on asset pricing models using a betting against beta (BAB)
factor. A BAB factor is a portfolio that holds low-beta assets (i.e. a long position), while
shorting high-beta assets. The rationale behind this is that investors without access to
leverage will overweight high-beta assets rather than levering up low-beta assets,
leading high-beta assets to offer lower returns. Frazzini and Pedersen (2014) conclude
their paper by stating that:83
The security market line is not only flatter than predicted by the standard CAPM for
US equities (as reported by Black, Jensen, and Scholes (1972)), but we also find this
relative flatness in 18 of 19 international equity markets, in Treasury markets, for
corporate bonds sorted by maturity and by rating, and in futures markets.
80 Independent Panel (2018). Review of the Australian Energy Regulator’s rate of return draft guidelines, 7 September.
81 See, for example, Energy Networks Australia
82 Frazzini, A & Pedersen, L.H. (2014). Betting against beta. Journal of Financial Economics, 111, pp.1-25.
83 Frazzini & Pedersen (2014), p.20.

DETERMINING A WACC ESTIMATE FOR PORT OF MELBOURNE Page 101 of 296
This appears to be wholly consistent with at least partial reliance on the Black CAPM to
accurately estimate the return on equity. Baker et al. (2011) also appears to be a new
paper for the Rate of Return Instrument, which the AER also uses to substantiate the
idea that investors overprice high-beta stocks.84 The central hypothesis of the paper is
that high beta stocks underperform low beta stocks in part due to institutional investors’
mandates to beat fixed benchmarks, which discourage arbitrage activity:85
The combination of irrational investor demand for high volatility and delegated
investment management with fixed benchmarks and no leverage flattens the
relationship between risk and return.
However, in the paper, the authors also go on to stress that:86
If our explanation is valid, this thesis will be the case so long as fixed-benchmark
contracts remain pervasive and the share of the market held by investment managers
remains high. There is no reason to expect that the anomaly will go away any time
soon.
This statement seems to be at odds with claims by some regulators, including the AER
(and cited by the ESC), that it is not clear that low beta bias necessarily exists on an ex
ante basis, nor whether this is accounted for by investors. The academic research above
clearly shows that the case for the persistence of low-beta bias is bolstered by its
theoretical underpinnings. As we have presented in previous submissions, a significant
weakness in the SL CAPM arises because of the assumption that all investors can borrow
and lend at the risk free rate. As long as this assumption fails to hold in practice, it can
only be expected that the empirical reality will continue to depart from the pattern
predicted by the SL CAPM, and can therefore not be considered a transitory anomaly.
Finally, the AER also cites “The low beta anomaly”, an October 2014 presentation by Ed
Fishwick, which is in part based on Muijsson, Fishwick and Satchell (2014), also cited by
the AER.87 This evidence is relied upon by the AER to support the hypothesis that
observations of low-beta bias are attributable to interest rate movements. Specifically,
low-beta assets outperform when interest rates fall, but underperform when interest
rates rise. It is not clear to what extent this phenomenon is captured by the SL CAPM.
Given the persistently low interest rates that continue to prevail at present (and which
84 Baker, M., Bradley, B. & Wurgler, J. (2011). Benchmarks as limits to arbitrage: Understanding the low-volatility
anomaly. Financial Analysts Journal, 67(1), pp.40-54.
85 Baker et al. (2011), p.49.
86 Baker et al. (2011), p.49.
87 Muijsson, C., Fishwick, E. & Satchell, S. (2014) Taking the art out of smart beta. Sydney University discussion paper.

DETERMINING A WACC ESTIMATE FOR PORT OF MELBOURNE Page 102 of 296
may do so for some time yet), this would seem to remain a relevant consideration for
adjusting the output of the SL CAPM.
Reference was also made by the ESC to the Vasicek adjustment, which weights equity
betas from a comparator set according to the precision of their standard errors.88 As the
ESC acknowledges in its interim commentary, the Vasicek adjustment is used by IPART
to partly correct for the downward bias of the CAPM. However, just as the AER argues
that its consideration of the CAPM is not related to low beta bias, IPART also makes clear
that “the Vasicek adjustment is not explicitly designed to address the downward bias of
the SL-CAPM,” even though it can partly compensate for this bias in practice.89 This is
significant because it suggests that regulators are utilising methodologies and/or
approaches for reasons different from their originally intended purpose.
In July 2018, the Australian Competition Tribunal found that the ERA did not commit a
reviewable error by opting not to make adjustments for low beta bias in its determination
for the Dampier to Bunbury Natural Gas Pipeline (DBGNP).90 DBGNP sought for the
ERA to adjust for low-beta bias through either a quantitative adjustment that better
related actual/historical returns to the SL CAPM, or a qualitative adjustment (by
selecting a beta at the top of the defined range, as the AER had done previously). The
Tribunal considered that the exercise by the ERA of regulatory judgment (or discretion)
was correct, having regard to all of the circumstances, nor was it unreasonable, such that:
In the end, the issue before us was very narrow indeed. It was confined to the question
of whether some adjustment to the output or alternatively to the alpha intercept
should be made in order to reflect some alleged low beta bias.
We are of the opinion that, in adopting the approach which it did, the ERA did not
commit reviewable error.”91
While we accept that qualitative adjustments may be difficult to substantiate, we
continue to consider that the Black CAPM can be credibly implemented to rectify some
(but not all) of the shortcomings of the SL CAPM. Moreover, ignoring alternative
approaches to the SL CAPM that partially or wholly overcomes this identified concern
of the SL CAPM appears contrary to a statutory objective which requires identification
of the return necessary to compensate a provider of Prescribed Services for the risks
involved in providing Prescribed Services.
88 Vasicek, O.A. (1973). A note on using cross-sectional information in Bayesian estimation of security betas. The Journal
of Finance, 28(5), pp.1233-1239.
89 IPART (2018). Review of our WACC method, February, p.96.
90 Australian Competition Tribunal, Application by DBNGP (WA) Transmission Pty Ltd [2018] ACompT1, July 2018.
91 ACompT [2018], paras. 289-290.

DETERMINING A WACC ESTIMATE FOR PORT OF MELBOURNE Page 103 of 296
The ESC also makes reference to a January 2011 expert report to the AER by Professor
Kevin Davis, which dates back to before the previous 2013 Rate of Return Guidelines.
Although this particular report is referenced only once in the Explanatory Statement for
the Rate of Return Instrument (and was not mentioned by the AER in the draft rate of
return guidelines at all), Professor Davis nevertheless raises important points that we
now address.92
Professor Davis concluded in 2011 that the theoretical assumptions of the SL CAPM do
not necessarily lead to downwardly biased estimates of the rate of return for low-beta
firms, and the empirical evidence does not clearly demonstrate low-beta bias. One of
Professor Davis’s observations is that even if investors are unable to borrow and lend at
the risk-free rate, actual rates may not differ sufficiently to distort the SL CAPM. In our
view, even if Professor Davis is correct that some institutional investors may be able
borrow at rates close to the risk-free rate (noting that debt margins vary over time), the
challenge remains that subsequent academic literature, such as that cited above, has
continued to identify funding constraints as a material source of bias in the SL CAPM.93
The ESC then goes on to cite comments from Professor Davis that the use of the Black
CAPM to address low-beta bias has limited empirical significance and does not resolve
the problems of the SL CAPM. In a follow-up report in May 2011, Professor Davis adds
the following:94
While the data … may reject the static Sharpe CAPM, this does not imply that the
alternative of the static Black CAPM would not also be rejected. Both may be
inconsistent with the data, because some third model is appropriate, or due to specific
assumptions adopted in estimating the relationship.
Professor Davis appears to be highlighting the merit of averaging a combination of well-
accepted approaches as permitted by the Pricing Order. We accept that reliance on the
Black CAPM, does not, on its own, resolve all of the problems of the SL CAPM. This is
because the Black CAPM still ignores factors other than the market return that can
influence the return of a stock. For this reason, we have also placed weight on the Fama-
French Model, which we introduce in Section 6.4.
92 The 2011 Davis reports were relied upon by a number of consumer groups in their submission to the review process.
93 Funding constraints could comprise both the ability to borrow/lend at the risk-free rate, as well as the quantity of funds that can be borrowed/lent even if borrowing/lending at the risk-free rate is possible for some market participants.
94 Davis, K. (2011). Cost of equity issues: A report for the AER, 16 January, p.9.

DETERMINING A WACC ESTIMATE FOR PORT OF MELBOURNE Page 104 of 296
6.3.6 Application of guiding principles for well-accepted approaches
The evidence presented in the preceding subsections enables us to ascertain how the
Black CAPM performs in relation to the guiding principles we introduced in Chapter 3.
An overview of these criteria as they apply to the Black CAPM are presented in Table
16.
Table 16 Application of IPART/AER criteria to Black CAPM
Criteria Applicability to Black CAPM
Accuracy The Black modifications to the SL CAPM have been proven to successfully achieve a better fit with observed data, namely that the security market line is flatter than predicted by the SL CAPM.
Stability and predictability We have generated a revised estimate of the zero beta premium using updated data. Our estimate is 3.36%, which is close to SFG’s 2014 estimate of 3.34%. Although both estimates are statistically insignificant, it is clear that the premium has remained stable over time.
Transparency and replicability The Black CAPM is only marginally more complex to implement than the SL CAPM.
Reflection of economic/financial principles As we have documented, there are theoretical underpinnings for the low-beta bias and the Black CAPM, which are likely to persist over time.
Flexibility with changing market conditions Black CAPM will respond to market conditions by reflecting changes in estimated betas, the MRP and the risk free rate over time.
Robust data Zero beta premium can be derived from readily available market data. All other data is identical to SL CAPM.
6.3.7 Conclusion on the Black CAPM
In summary, the Black CAPM represents a theoretical (and generally an empirical)
improvement in the SL CAPM. However, as explored in the following section, its
empirical performance is inferior to the Fama-French model.
However, despite these strengths, we acknowledge that the zero beta premium that we
determined is not statistically significant at conventional levels. Accordingly, we have
decreased the weighting in PoM’s overall return on equity to 5%, noting that it may be
appropriate to revisit this weighting in future if the zero beta premium can be
determined to be statistically significant at the 5% level.
6.4 Fama-French model
This section explains the evolution of the Fama and French (1993) model (FFM) and its
application.95 The FFM augments the SL CAPM by considering the impact of size and
value premiums, in addition to the market risk premium, on stock returns.
95 Fama, E.F. and French, K.R. (1993). Common risk factors in the returns on stocks and bonds. Journal of Financial
Economics, 33(1), pp.3-56.

DETERMINING A WACC ESTIMATE FOR PORT OF MELBOURNE Page 105 of 296
We begin by discussing the motivation for the FFM and its strengths and weaknesses,
before examining the support for the model in academic literature and regulatory
practice. Furthermore, we provide evidence that financial practitioners make ad hoc size
and other risk premium adjustments to the SL CAPM, implicitly adopting the rationale
of the FFM. We also explore the FFM’s acceptance in other spheres, including its
presence in finance curriculum and the 2013 Nobel Prize awarded to Eugene Fama for
the development of the model. All of these sources of evidence serve to solidify the well-
accepted standing of the FFM.
6.4.1 Emergence and evolution of the FFM
The FFM emerged in response to the poor explanatory power of the SL CAPM. Fama
and French observed that high stock returns were associated with smaller listed
companies and listed companies that have a high book to market value ratio. Fama and
French demonstrated that when these two additional variables were incorporated into
an asset pricing model the explanatory power of the model increased significantly.
The FFM operates on excess returns to the market being assessed having regard to:
• The returns on the market as a whole
• HML (High Minus Low) is the average return on two value portfolios minus the
average return on two growth portfolios.
• SMB (Small Minus Big) is the average return on three small portfolios minus the
average return on three big portfolios
The FFM is expressed as follows:
Re = Rf+ j * [E(Rm) - Rf] + k * [HML] +l * [SMB]
Where:
Rf = the risk-free rate of return
E(Rm) = the expected return on the market
[E(Rm) – Rf] = the market risk premium
HML = expected high-minus-low risk premium
SMB = expected small-minus-big risk premium
j = market excess returns beta
k = high-minus-low factor beta
l = small-minus-big factor beta

DETERMINING A WACC ESTIMATE FOR PORT OF MELBOURNE Page 106 of 296
In contrast to the SL CAPM and the Black CAPM models, the FFM expresses the return
on equity based on expected returns and two additional explanatory factors: a size factor
(Small Minus Big); and a book-to-market equity factor (High Minus Low).
6.4.2 Strengths
The FFM retains systematic risk as an explanatory factor that explains stock returns
consistent with the SL CAPM and Black CAPM.
However, the FFM better explains stock returns in comparison with either the SL CAPM
or the Black CAPM. The model mostly and uniformly has statistically significant
explanatory power and performs better than the SL and Black CAPM models in terms
of goodness of fit (as measured by a higher R2 value or by measures of forecast error).
For instance, Chiah et al. (2016) (see Section 6.4.4) is the most recent Australian study to
directly compare the FFM with the SL CAPM. Using their preferred measure of model
fit, they find that the use of the three-factor FFM reduces the average mean absolute
forecast error from 1.68 to 1.44 (a 14% reduction) over a 5-year forecast horizon relative
to the SL CAPM (the Black CAPM was not evaluated in this particular study). In other
words, the better empirical performance of the FFM is such that it is less likely to
understate investors’ required cost of equity by the incorporation of additional risk
factors in the model that are evidently being priced by the market.
FFM posits that multiple risks other than solely market risk are reflected in stock returns
and that the high book-to-market and small-cap stock factors are the best available
proxies for these risks.
In an Australian context, the size and value premiums in the model have been estimated
using market data and delivered results consistent with US studies, particularly in
relation to the value premium. This indicates that incorporating the FFM in the
determination of the cost of equity estimate for the benchmark port entity, including
with the SL and Black CAPMs, would provide a higher degree of confidence that the
resulting estimate is robust and reflective of investor expectations.
6.4.3 Weaknesses
As for the SL CAPM, the FFM restricts the zero-beta rate to be the risk-free rate.
The model in the Australian market has sometimes yielded inconclusive results,
particularly in respect of the high minus-low explanatory factor, although this may

DETERMINING A WACC ESTIMATE FOR PORT OF MELBOURNE Page 107 of 296
reflect data issues. However, Brailsford, Gaunt and O’Brien (2012) addressed these data
issues and developed an Australian FFM that reconciled with US results.96
While the FFM is often employed in academic studies, it is less commonly employed in
financial market and regulatory contexts, with practitioners citing challenges relating to
data sourcing in some situations. However, as described earlier in this report, this reason
alone should not preclude a particular approach from being “well-accepted”. Our
approach to applying the FFM is described further in Attachment C.
6.4.4 Application of FFM in academia
There is an extensive literature that has built up surrounding the performance of the
Fama-French model, along with the empirical existence of size and value premiums. The
following is an overview with particular reference to Australian experience.
By the 1980s, empirical evidence was mounting that variations in expected returns were,
to a significant extent, unrelated to market betas (well before the Fama French model
emerged). Fama and French (2004)97 identify Banz (1981) as one of the first papers to
uncover a size effect, namely that average returns on smaller cap stocks were higher than
those predicted by CAPM.98 Meanwhile, Stattman (1980)99 and Rosenberg, Reid and
Lanstein (1985) observed that stocks with high book-to-market equity ratios experienced
returns not captured by their betas associated with market returns.100 This was the
turning point where research pursued other determinants of market returns, eventually
leading to the seminal Fama and French (1993) paper.
There is extensive empirical evidence in support of the Fama and French factors. Davis,
Fama and French (2000) show that the value premium, the positive relationship between
average returns and book-to-market value of equity, is robust across time.101 The
estimated US premium between 1929 and 1963 (0.50 per cent per month) is almost
96 Brailsford, T., Gaunt, C. and O’Brien, M (2012). The investment value of the value premium. Pacific-Basin Finance
Journal, 20(3), pp.416-437.
97 Fama, E.F and French, K.R. (2004).
98 Banz, R.W. (1981). The relationship between return and market value of common stocks. Journal of Financial Economics, 9(1), pp.3-18.
99 Stattman, D. (1980). Book values and stock returns. The Chicago MBA: A Journal of Selected Papers, 4, pp.25-45.
100 Rosenberg, R., Reid, K. and Lanstein, R. (1985). Persuasive evidence of market inefficiency. Journal of Portfolio Management, 3(11), pp.9-17.
101 Davis, J.L., Fama, E.F. and French, K.R. (2000). Characteristics, covariances and average returns. Journal of Finance, 55(1), pp.389-406.

DETERMINING A WACC ESTIMATE FOR PORT OF MELBOURNE Page 108 of 296
identical to the premium between 1963 and 1997 (0.45 per cent per month). The size effect
was found to be smaller (0.20 per cent per month) across their entire sample period.
In the Australian context, Gaunt (2004) demonstrates that the three-factor model offers
a better explanation of observed Australian stock returns than the conventional SL
CAPM.102 He employed a longer dataset than earlier Australian contributions that
returned mixed findings based on shorter, deficient data. However, in contrast to US
findings, the main contributor to explanatory power was the size factor.
Gharghori, Lee and Veeraraghavan (2009) use Australian data from 1992-2005 and find
evidence of both size effects and book to market ratio effects. They note that the observed
R-square values are lower than those observed in the original Fama and French (1993)
results for the US, but nevertheless provide important explanatory power.103 This finding
built on earlier work by Gharghori, Chan and Faff (2007) which found that Fama-French
factors were capturing some form of priced risk.104
O’Brien, Brailsford and Gaunt (2010) consider information on 98% of all listed companies
between 1981 and 2005, the most comprehensive dataset employed in the Australian
literature.105 The results also present evidence of size and book-to-market ratio effects,
indicating that the FFM provides increased explanatory power relative to CAPM.
Brailsford, Gaunt and O’Brien (2012) also find evidence of a value premium in Australia,
but uncover less substantive evidence of a size premium.106 Key to their investigation is
the portfolio formation technique used in the analysis. Many previous studies simply
sorted stocks into arbitrary categories with an equal number of stocks. To address this,
the authors formed portfolios that better represent realistic investment sets. The impact
of book to market ratios is found to be systematic across all size categories. This lends
support to the use of the FFM, as it shows that the findings are robust to different dataset
102 Gaunt, C. (2004). Size and book to market effects and the Fama-French three factor asset pricing model: evidence from
the Australian stockmarket. Accounting and Finance, 44(1), pp.27-44.
103 Gharghori, P., Lee, R. and Veeraraghavan, M. (2009). Anomalies and stock returns: Australian evidence. Accounting and Finance, 49, pp.555-576.
104 Gharghori, P., Chan, H. and Faff, R. (2007). Are the Fama-French Factors proxying default risk? Australian Journal of Management, 32, pp.223-249.
105 O’Brien, M., Brailsford, T. and Gaunt, C. (2010). Interaction of size, book-to-market and momentum effects in Australia. Accounting and Finance, 49(1), pp.197-219.
106 Brailsford, T., Gaunt, C. and O’Brien, M (2012). The investment value of the value premium. Pacific-Basin Finance Journal, 20(3), pp.416-437.

DETERMINING A WACC ESTIMATE FOR PORT OF MELBOURNE Page 109 of 296
assumptions. Abhakorn, Smith and Wickens (2013) find that the value factor, though not
the size factor, helps to determine equity returns.107
Chiah et al. (2016) and Huynh (2017) employ the most recent datasets.108 109 It should be
noted that these two papers employ the five-factor model, which adds terms for
profitability and level of investment premiums. However, Huynh (2017) in particular
observes that the five-factor model offers only marginal improvements on top of the
three-factor model. Importantly, the book-to-market factor (HML) or value premium
retains its explanatory power in both studies, even with the inclusion of the profitability
and investment factors.
Chiah et al. (2016) also find that the SMB factor is not statistically significant. That being
said, they do not conclude that the size factor is completely redundant; rather, the factor
does still appear to bolster the model’s capacity to explain empirical returns. This finding
is not inconsistent with the results that we have generated for PoM, in which the size
premium contributes substantially less to the return on equity relative to the value
premium.
To verify the international applications of the FFM, Fama and French (2006) examine
value premiums in 14 international markets (Australia, Belgium, Canada, France,
Germany, Great Britain, Hong Kong, Italy, Japan, the Netherlands, Singapore, Spain,
Sweden and Switzerland) between 1975 and 2004. International returns are found to
exhibit statistically and economically significant value premiums.110 Furthermore, the
magnitudes of the effects are as substantial for the biggest stocks as they are for smaller
stocks. Malin and Veeraraghavan (2004) confirmed the presence of a size effect in France,
Germany and the United Kingdom, although they found no evidence of a value effect in
these markets.111
Country-specific studies also provide backing for the use of the FFM. Nwani (2015)
presented findings for 100 stocks in the United Kingdom, using monthly data from
107 Abhakorn, P., Smith, P. and Wickens, M. (2013). What do the Fama-French factors add to CCAPM? Australian
National University, Centre for Applied Macroeconomic Analysis, Working Paper 23/2013.
108 Chiah, M., Chai, D., Zhong, A. and Li, S. (2016). A better model? An empirical investigation of the Fama-French Five-factor model in Australia. International Review of Finance, 16(4), pp.595-638.
109 Huynh, T.D. (2017). Explaining anomalies in Australia with a five-factor asset pricing model. International Review of Finance.
110 Fama, E.F. and French, K.R. (2006). The value premium and the CAPM. The Journal of Finance, 61, pp.2163-2185.
111 Malin M. and Veeraraghavan M. (2004). On the Robustness of the Fama and French Multifactor Model: Evidence from France, Germany, and the United Kingdom. International Journal of Business and Economics, 3(2), pp.155-176.

DETERMINING A WACC ESTIMATE FOR PORT OF MELBOURNE Page 110 of 296
January 1996 to December 2013.112 He detected evidence of a value effect across small
and large cap stocks, suggesting that book to market ratios are an important determinant
of returns. Daniel, Titman and Wei (2001) study Japanese stock returns between 1975
and 1997. They find that the observed value premium in average stock returns was even
stronger in Japan than in the United States.113 Rossi (2012) investigates the influence of
factors for the Italian Stock Exchange between 1989 and 2004 and confirms the presence
of a size effect.114
Mishra and O’Brien (2019) developed an ex ante variant of the three-factor FFM based
on an implied cost of equity approach.115 They found that the ex ante FFM provides a
better explanation of the dispersion of the implied cost of equity observations than the
CAPM. Furthermore, the average absolute difference between the CAPM and FFM
estimates was substantial (199 basis points). With respect to our task in estimating the
return on equity for PoM, the insights from this paper demonstrate that the FFM has
ample validity when determining a forward-looking return on equity allowance.
SFG Consulting reviewed leading finance journals to gauge acceptance of the FFM
among finance academics.116 They found FFM is routinely applied to estimate required
returns in articles published in the Journal of Finance and the Journal of Financial
Economics which, it was noted, have both received the highest possible ratings for
journals from both the Australian Council of Deans and the Australian Research Council.
SFG Consulting argued that “the use of the Fama-French factors, for the purpose of
estimating the required return on equity, is so widespread in the academic literature, its
use as a measure of normal returns has become a matter of course.”117
6.4.5 Application of FFM in regulatory practice
We have identified several examples of regulators applying or considering the results of
the FFM. The FFM has been recognised as an appropriate model by several eminent
economic experts (for example, Professor Stewart Myers and Professor Julian Franks)
112 Nwani, C. (2015). An empirical investigation of the Fama-French-Carhart Multifactor Model: UK Evidence. Journal
of Economics and Finance, 66(1), pp.95-103.
113 Daniel, K., Titman, S. and Wei, K.C.J. (2001). Explaining the cross-section of stock returns in Japan: Factors or characteristics. The Journal of Finance, 56(2), pp.743-766.
114 Rossi, F. (2012). The three-factor model: evidence from the Italian stock market. Research Journal of Finance and Accounting, 3(9), pp.151-160.
115 Mishra, D.R. & O’Brien, T.J. (2019). Fama-French, CAPM, and implied cost of equity. Journal of Economics and Business, 101, pp.73-85.
116 SFG Consulting (2014d). The Fama-French model, 13 May, p.19.
117 SFG Consulting (2014d), p.20.

DETERMINING A WACC ESTIMATE FOR PORT OF MELBOURNE Page 111 of 296
engaged by the New Zealand Commerce Commission (NZCC).118 Moreover, in its 2009
report concerning the estimation of the cost of capital, the NZCC stated that: 119
Where appropriate (e.g., where reliable data are available and where the models seem
amendable to particular industries), the Commission may use evidence based on the
Fama-French and DCF (or DDM) models as cross-checks on the CAPM.
In Australia, IPART has expressed a willingness to consider implementation of the FFM
in the future. In the February 2018 final report of its WACC methodology review, IPART
stated that:120
We intend to monitor the FFM over the next five years to examine how it would
perform if we adopted it instead of the SL CAPM in our WACC method.
IPART acknowledged the reasoning that the increased explanatory power of the FFM
(relative to the SL CAPM) outweighed any theoretical concerns or costs of
implementation, stating that:121
In our view, this argument is sufficient to warrant estimation and comparison of FFM
estimates, but is not sufficient reason to replace the SL CAPM as our model at this
stage.
These remarks from an Australian economic regulator lend credence to the
implementation of a multi-model cost of equity approach. Consistent with IPART’s
position, PoM does not propose to remove the SL CAPM from consideration entirely;
rather, the SL CAPM should be considered in conjunction with other well-accepted
models when determining the appropriate cost of equity for the BEE.
There is also regulatory precedent for the use of the FFM in the UK. In 2005, the then
Competition Commission (CC) employed the FFM in a liquefied petroleum gas (LPG)
inquiry.122 The CC was tasked with estimating the appropriate cost of capital for a pure-
play LPG supplier. The CC deemed that there was only one relevant listed UK
comparator, and sought to determine whether any size premium was warranted. In this
particular application of the methodology, neither the size nor value premium was
118 Franks, J., Lally, M. and Myers, S. (2008). Recommendations to the New Zealand Commerce Commission on an
appropriate cost of capital methodology, 18 December.
119 New Zealand Commerce Commission (2009). Revised draft guidelines – the Commerce Commission’s approach to estimating the cost of capital, 19 June, p.21.
120 IPART (2018a), p.98.
121 IPART (2018a), p.98.
122 UK Competition Commission (2005). Market investigation into supply of bulk liquefied petroleum gas for domestic use: Provisional findings report, August, Appendix K, p.7.

DETERMINING A WACC ESTIMATE FOR PORT OF MELBOURNE Page 112 of 296
found to be statistically significant. However, this in no way detracts from this example
of the FFM being adopted in a regulatory setting. Regardless of whether the Fama-
French factors for this specific firm were significant or not, what is clear is that the
economic regulator applied and had regard to the FFM as part of its assessment.
The FFM has been used in several regulatory processes throughout the United States.
For example, according to Ronald L. Knecht, the Nevada State Controller:123
[W]hile there is still some apprehension about the use of the FF3F [Fama-French Three
Factor] Model it has been recognised in at least three states, Massachusetts, Delaware
and Nevada, when used in conjunction with other models to produce an arithmetic
mean as an estimate. This approach ensures that factors that are ignored by one model
are adequately addressed. Because the FF3F model is fairly new relative to other
models I am not aware of any jurisdiction that has endorsed it exclusively or adopted
allowed rates of return based expressly on it. Instead, the tradition in the United States
is for regulatory decisions to review (or even just list) all the evidence in the record
and then, subjectively balancing the merits and results of all of it, to arrive at a final
conclusion as either a range of reasonableness or a point estimate.
As a former and thereby well-experienced energy regulator, Mr Knecht has employed
the FFM in several state regulatory proceedings. These include:
• A 2006 hearing conducted by the Public Utilities Commission of Nevada, where
the commission accepted his evidence.124
• A 2014 expert evidence held before the California Public Utilities Commission,
where the commission acknowledged that the FFM had “gained great currency
in investment practice.”125
Furthermore, Mr Paul R. Moul, as an expert witness before the Massachusetts
Department of Telecommunication, noted the FFM as a useful approach for
investigating the association between stock returns and firm size.126 Mr Paul Hunt as an
expert witness before the California Public Utilities Commission presented results using
123 Knecht, L. R. (2015). Statement, 19 June, para. 4.6, p.3.
124 Application of Sierra Pacific Power Company for the authority to increase its annual revenue requirement for general rates charged to all classes of electric customers and for relief properly related thereto; Application of Sierra Pacific Power Company for approval of new and revised depreciation rates for electric operations based on its 2005 deprecation study, 2005 Nev. PUC LEXIS 91.
125 Application of Southern California Edison Company (U338E) for authority to establish its authorised cost of capital for utility operations for 2013 and to reset the annual cost of capital adjustment mechanism 2014 Cal. PUC LEXIS 633.
126 Moul, R. P. (2005). Direct testimony of Paul. R. Moul, Managing Consultant, P. Moul & Associates, Concerning cost of equity, Commonwealth of Massachusetts Department of Telecommunications and Energy, p.50.

DETERMINING A WACC ESTIMATE FOR PORT OF MELBOURNE Page 113 of 296
both the CAPM and FFM.127 Artesian Water Company before the Delaware Public
Service Commission highlighted findings from the FFM that was accepted by the
Commission without reservation.128 In 2007, before the California Public Utilities
Commission, Mr Gary Hayes (an expert from San Diego Gas and Electric) also provided
expert testimony using the FFM.129
The Public Utility Commission of Nevada in the state of Nevada has recognised the use
of the FFM in calculating the return on capital estimates. See, for example, the Decisions
in Docket No. 05-10003 and Docket No. 05-10004.130 In 2006, Mr Knecht acted as a
representative on behalf of the Nevada Public Utilities Commission and used the
average of a combination of models, comprised of two dividend discount model (DDM)
estimates, average of 2 CAPM/FFM and one risk premium estimate, for the calculation
of the return on equity.131 Mr Knecht, once again, acted as a representative on behalf of
the Nevada Public Utilities Commission in 2007, where he examined the return on equity
using the FFM.132
Sarmentero and Hull (2017) examine FERC’s policy regarding return on equity
determinations.133 They identify Opinion No. 551, issued in September 2016 in regard to
the Midcontinent Independent System Operator, as having significant implications for
FERC’s methodological approach.134 They write that:135
127 Application of Pacific Gas and Electric Company for Authority to Establish Its Authorized Rate of Return on Common
Equity for Electric Utility Generation and Distribution Operations and Gas Distribution for Test Year 2006. (U 39-M); Application of Southern California Edison Company (U 338-E) for Authorized Capital Structure, Rate of Return on Common Equity, Embedded Cost of Debt and Preferred Stock, and Overall Rate of Return for Utility Operations for 2006; Application of San Diego Gas & Electric Company (U 902-M) for Authority to: (i) Increase its Authorized Return on Common Equity, (ii) Adjust its Authorized Capital Structure, (iii) Adjust its Authorized Embedded Costs of Debt and Preferred Stock, (iv) Increase its Overall Rate of Return, and (v) Revise its Electric Distribution and Gas Rates Accordingly, and for Related Substantive and Procedural Relief 2005 Cal. PUC LEXIS 537; 245 P.U.R.4th 442.
128 In the matter of the application of Artesian Water Company, Inc., for an increase in water rates 2003 Del. PSC LEXIS 51 at [8]-[11]
129 Testimony of Gary G. Hayes on behalf of San Diego Gas and Electric before the California Public Utilities Commission 2007, p.19.
130 Decisions in Docket No. 05-10003 and Docket No. 05-10004, April 26, 2006, 2006 Nev. PUC LEXIS 91.
131 Application of Sierra Pacific Power Company, 2006 Nev. PUC LEXIS 91 at [63]
132 Application of Nevada Power Company 2007 WL 2171450 (Nev. P.U.C) at [102]; and Application of Sierra Pacific Power Company, 2006 Nev. PUC LEXIS 91 at [63].
133 Sarmentero Garzon, A.I. & Hull, G.F. (2017). Developments in FERC policy for determining return on equity. Energy Law Journal, 38, pp.375-412.
134 Opinion No. 551, Association of Businesses Advocating Tariff Equity v. Midcontinent Independent System Operator, Inc., 156 FERC ¶ 61,234 (2016), rehearing pending.
135 Sarmentero Garzon, A.I. & Hull, G.F. (2017), p.396.

DETERMINING A WACC ESTIMATE FOR PORT OF MELBOURNE Page 114 of 296
The CAPM analysis that Opinion No. 551 relied upon used an upward adjustment
based on the rationale that differences in investors’ required rates of return that are
related to firm size are not fully captured by beta.
In the opinion, FERC reinforced its position from an earlier 2015 opinion that “this type
of size adjustment is a generally accepted approach to CAPM analyses.”136 FERC then
goes on to explain that the purpose of such an adjustment is to render the CAPM analysis
useful in estimating the cost of equity for companies that are smaller than the companies
that are typically used to determine the MRP in the CAPM analysis.
Opinion No. 551 is subject to a rehearing of the case, but it does indicate that regulators
are increasingly having regards to the merits of additional premiums that augment the
CAPM, bringing them more into line with the conventions of financial practitioners.
6.4.6 Application of FFM by financial practitioners
A measure of implicit acceptance of the FFM in finance industry practice is indicated by
the fact that it is routine for industry practitioners to make additional risk adjustments
in estimating the SL CAPM, as documented at the beginning of this chapter.
Independent experts consistently estimate the cost of equity to be several percentage
points higher than the estimate derived from a simple application of the SL CAPM alone.
The point to emphasise here is that it is plainly common practice among finance
practitioners to estimate discount rates based on risk factors in addition to systematic
risk.
In this regard, the survey-based research by Graham and Harvey (2001) and Brounen,
de Jong and Koedijk (2004) identified that significant minorities of investors adjusted
their expectations based on additional risk factors including business size and market to
book ratio.137 Of the more advanced CAPM alternatives in which additional risk factors
are included they found that these techniques were used mostly by large companies. In
the case of Bancel and Mittoo (2014), the most recent survey, 66% of respondents
consider firm size as a risk factor, while more than 45% have regard to price-book ratios
(another term for market-to-book ratios) in their valuations.138
136 Opinion No. 531-B, Martha Coakley v. Bangor Hydro-Electric Co., 150 FERC ¶ 61,165 (2015), order on rehearing.
137 Brounen, D., de Jong, A. and Koedijk, C.G. (2004). Note that Brounen et al. collated and included summaries of the data from Graham and Harvey (2001) in their 2004 paper.
138 Bancel, F. & Mittoo, U.R. (2014). The gap between the theory and practice of corporate valuation: Survey of European experts. Journal of Applied Corporate Finance, 26(4), pp.106-117.

DETERMINING A WACC ESTIMATE FOR PORT OF MELBOURNE Page 115 of 296
The Ibbotson Stocks, Bonds, Bills, and Inflation Yearbook is an industry data reference
for advisors, planners, and brokers seeking to analyse asset class performance and
determine the cost of capital in the US. It provides historical return figures such as equity
risk premiums and includes a chapter for each of the FFM factors – quantifying the size
and value premiums appropriate to specific settings.139
6.4.7 Acceptance in other spheres
When it awarded the 2013 Nobel Prize in Economics to Eugene Fama, the Economic
Sciences Prize Committee said that Fama’s extension of the CAPM “greatly improves
the explanatory power relative to the single-factor CAPM model.”140 The Committee
considered asset pricing to be “one of the fields in economics where academic research
has had the most impact on non-academic practice.”141 It went on to say that “many
professional investors use factor models such as the Fama-French model to guide their
portfolio decisions”142 and that “it has become standard to evaluate [investment]
performance relative to ‘size’ and ‘value’ benchmarks, rather than simply controlling for
overall market returns.”143
The FFM is taught as part of many finance qualifications, including the Chartered
Financial Analyst (CFA) certification. As this is the leading professional finance
qualification in both Australia and the US, it is noteworthy that course participants are
required to be able to both explain and demonstrate the use of both the SL CAPM and
the FFM.
6.4.8 ESC interim commentary on the Fama-French model
The ESC raised a number of issues with the FFM in its interim commentary. At a high
level, these concerns can be grouped under the following categories:
• Consideration of the FFM by other Australian regulators
• Theoretical underpinnings for the FFM
• Use of the FFM by financial practitioners
139 See Wiley Publishing (2017). Available from: http://au.wiley.com/WileyCDA/WileyTitle/productCd-
1119316405.html.
140 Economic Sciences Prize Committee (2013). Scientific Background on the Sveriges Riksbank Prize in Economic Sciences in Memory of Alfred Nobel 2013: Understanding Asset Prices, p.3.
141 Economic Sciences Price Committee (2013), p.42.
142 Economic Sciences Price Committee (2013), p.43.
143 Economic Sciences Price Committee (2013), p.44.

DETERMINING A WACC ESTIMATE FOR PORT OF MELBOURNE Page 116 of 296
• Data limitations and other technical issues
Attachment D provides responses to the detailed issues raised by the ESC. In this section,
we address the key issues raised by the ESC.
Consideration of the FFM by other Australian regulators
In the interim commentary, the ESC made reference to conclusions other Australian
regulators have drawn on the FFM. The ESC made clear that no Australian regulator has
moved away from the SL CAPM in favour of the FFM or any other return on equity
model. On this point, we are largely in agreement with the ESC.
However, at no stage have we suggested abandoning the SL CAPM. Rather, we are of
the view that the SL CAPM, if relied upon exclusively, will tend to understate the return
necessary to commensurate PoM for the risks involved in providing Prescribed Services
and thereby not achieve the regulatory objectives. This is in recognition of the evidence
that suggests that the SL CAPM is an underspecified model (i.e. it omits crucial size and
value factors) that can understate the returns necessary to promote efficient investment.
The ESC considered that we had not provided sufficient discussion of how the FFM has
been considered by other regulators. We have addressed several of these issues
previously (e.g. empirical reliability, portfolio formation, consensus on how to apply the
FFM) and where appropriate reiterate and elaborate upon our response here. Where the
ESC has cited specific points raised by regulators previously, we have responded to
these in Attachment D.
The ESC also questioned the extent to which IPART’s recent endorsement of the FFM for
possible future use lends credence to our multi-model return on equity approach. We
accept that IPART’s stance on the FFM is not yet an example of an Australian regulator
actually applying the Fama-French model to calculate a WACC. Nevertheless, IPART’s
preparedness to consider the FFM at a future methodology review is a significant
development. A frequent criticism of the FFM is that it is not “fit for purpose” in a
regulatory setting, regardless of its acceptance in academic circles and in financial
practice. We are cautious not to infer too much from IPART’s statements on the FFM,
however, we deem it unlikely that IPART would even be monitoring the FFM if it could
not be fit for purpose for calculating the return on equity in a building blocks framework.

DETERMINING A WACC ESTIMATE FOR PORT OF MELBOURNE Page 117 of 296
The ESC also noted that decisions of the AER and ERA have previously been found not
to be in error on appeal. The following quote from the Tribunal is worth noting:144
The Tribunal’s role is not to pass judgment on the superiority of one study over the
others investigating the application of the FFM to Australian data. Its role is to assess
whether the regulator made errors or was unreasonable in considering (or not
considering) the available information available to it in forming a judgment about the
merits of incorporating results from one, or some, or none of those studies into its
determination of the return on equity.
In other words, the findings in support of regulator’s rejection of the FFM were made in
relation to a different instrument to the Pricing Order that conferred different discretions
on the regulator and the regulated.
Theoretical underpinnings
The ESC listed previous concerns among regulators about the theoretical basis for the
FFM. As we qualify below, there is clear economic logic supporting the existence and
persistence of the Fama-French factors. Moreover, in our view, theoretical elegance is
not an end in itself in meeting statutory objectives – indeed, what is paramount is the
ability of a model to deliver a return that adequately compensates the provision of
Prescribed Services. Nevertheless, it is acknowledged that the FFM lacks the theoretical
elegance and simplicity of the SL CAPM.
However, this is not to suggest that the FFM is without a theoretical base. With respect
to the size premium, Carlson et al. (2004) develop a theoretical framework in which the
size premium reflects the importance of growth options relative to assets in place.145
Meanwhile, the authors posit that book-to-market effects can be attributed to differences
in operating leverage.
Koijen et al. (2017) link excess returns on high minus lower book-to-market stock
portfolios to negative cash-flow shocks and output risk during economic downturns.146
They provide evidence to support the hypothesis that the value premium reflects
compensation for macroeconomic risk not captured by the conventional market beta.
This is based on the premise that periods of low returns on value stocks versus growth
144 ACompT 10, 13 July 2016, para. 678.
145 Carlson, M., Fisher, A. & Giammarino, R. (2004). Corporate investment and asset dynamics: Implications for the cross-section of returns. The Journal of Finance, 59(6), pp.2577-2603.
146 Koijen, R.S.J, Lustig, H. & Van Nieuwerburgh, S. (2017). The cross-section and time series of stock and bond returns. Journal of Monetary Economics, 88, pp.50-69.

DETERMINING A WACC ESTIMATE FOR PORT OF MELBOURNE Page 118 of 296
stocks are times when future economic activity is low and future cash-flows on value
stocks are low relative to those on growth stocks.
To better understand the economic origin of the size and value premium, de Groot and
Huij (2018) investigate the hypothesis that these factors reflect pricing for distress risk.147
Although small-cap stocks tend to have substantially higher probabilities of financial
distress, the authors find that distress risk is not priced and that the size premium is
priced “beyond” distress risk. Importantly, the results indicate that it is not the case that
small-cap stocks only yield positive abnormal returns if they run higher levels of distress
risk; rather, the size premium can also be concentrated in low risk small-cap stocks.
Similar conclusions were reached on the value premium.
In a recent article on selection criteria and assessing the merits of competing factors,
Eugene Fama and Ken French discuss how the FFM’s theoretical underpinnings can be
derived from the dividend discount model (DDM):148
We suggest that model comparisons in any paper should be limited by theory, even
an umbrella theory like the dividend discount model, and by evidence on model
robustness out-of-sample (different time periods and markets). For example, Fama
and French (2015, 2016) invoke the dividend discount model to motivate the five-
factor model.
These comments are significant, because they clearly show that even Fama and French
themselves acknowledge the importance of a theoretical framework for their model. We
have not replicated these derivations, but they can be found in Fama and French (2015)
or Fama and French (2016).149
At this point, it is worthwhile to clarify the distinction between the three-factor model
(that we implement for PoM) and the five-factor model, which has emerged in recent
years. The five-factor model is an extension of the three-factor model. Both models
incorporate size (SMB) and value (HML) premia, but the five-factor model adds
profitability and investment. In the interim commentary, the ESC highlighted our
remarks that more recent contributions to the Fama-French literature actually adopt a
five-factor model as opposed to the three-factor model. It also referenced commentary
147 De Groot, W. & Huij, J. (2018). Are the Fama-French factors really compensation for distress risk
148 Fama, E.F. & French, K.R. (2018). Choosing factors. Journal of Financial Economics, 128, pp.234-252. The 2015 and 2016 papers relate to five-factor model publications (see next footnote).
149 Fama, E.F. & French, K.R. (2015). A five-factor asset pricing model. Journal of Financial Economics, 116, pp.1-22; Fama, E.F. & French, K.R. (2016). Dissecting anomalies with a five-factor model. The Review of Financial Studies, 29, pp.69-103.
DETERMINING A WACC ESTIMATE FOR PORT OF MELBOURNE Page 119 of 296
by the ERA, which noted Fama and French’s observation that the value premium
appeared to become redundant when the profitability and investment factors are added.
Taken at face value, critiques of the three-factor model on the basis that there exists a
five-factor model are not detrimental to the merits of the FFM per se. It could well be the
case that profitability and investment adequately account for the same phenomena that
the book-to-market value of equity has historically captured. However, even if the five-
factor model is superior to the to the three-factor model, then it is clear that the inclusion
of the three-factor model (as one of a combination of well of accepted approaches) is
likely to better meet the statutory objective concerning the return to be earned by the
provider of Prescribed Services, relative to a situation where it is abandoned altogether.
In other words, this apparent stance towards the five-factor model seems to imply that
the debate revolves around which variant of the FFM to apply, rather than a debate
around whether any FFM should be given consideration at all. If this is indeed the case,
then in terms of the statutory objectives it would appear preferable to implement the
three-factor FFM rather than disregard the FFM framework entirely.
Use of the FFM by financial practitioners
In determining the WACC to apply to PoM, we have investigated approaches that can
be considered well-accepted. In regard to financial community support for the FFM, we
have previously presented evidence that the FFM is taught in financial curricula, and
that the awarding of the Nobel Prize clearly stated that the methodology was relied upon
by financial professionals.150
We also demonstrated that many financial practitioners depart from a conventional
application of the SL CAPM through the use of ad hoc risk premia in independent expert
reports. Updating our analysis to the end of 2018 (see Section 6.2.6), we find that on
average, these ad hoc adjustments add on average 2.65% to the final WACC estimate.
Despite this widespread departure from the SL CAPM, we did not uncover explicit
applications of the FFM as we implement it for PoM amongst independent expert
reports.
Financial practitioners are likely to be less constrained in the discretion that they can use
in determining WACC estimates. If we were to truly emulate private sector financial
practice, then the most representative way to do this would be by applying an ad hoc
premium adjustment based on our own judgement. However, such an adjustment may
appear arbitrary in the context of regulatory process adhering to statutory objectives.
150 Professor William F. Sharpe, one of the originators of the SL CAPM, was also awarded the Nobel Prize for his
contributions to the theory of corporate finance
DETERMINING A WACC ESTIMATE FOR PORT OF MELBOURNE Page 120 of 296
This would likely fall short of expectations in a regulatory setting, where each
component of a WACC must be substantiated.
At the same time though, it is not a satisfactory conclusion to apply no augmentation
whatsoever to the SL CAPM, as this would be clearly inconsistent with how many
financial practitioners would ascertain the efficient cost of financing for an entity such
as PoM. Instead, we have sought to apply to identify candidate return on equity models
that best capture the imperfections of the SL CAPM that financial practitioners are trying
to resolve when they use ad hoc premia.
We undertake this task following the guiding principles for WACC approaches
mentioned in Chapter 3. In this instance, we ensure transparency and replicability based
on robust data by avoiding arbitrary adjustments. Viewed in conjunction with IPART’s
recent sentiment towards the FFM, we maintain that the FFM is the best available
augmentation of the SL CAPM capable of achieving these objectives, in addition to the
Black CAPM. Furthermore, the premium over the SL CAPM implied by the FFM (see
Chapter 10) is not inconsistent with the average premium that we have seen applied in
independent expert reports.
Data limitations and other technical issues
The Ken French website does not provide country-specific factors for all of the countries
in PoM’s comparator sample. This means that in many instances, we are required to rely
on global factors. This led the ESC to suggest that the FFM does not have a theoretical
base, because parameters can be defined in a way that is incompatible with a
domestically segmented market framework. This is not the case. The use of global factors
relates solely to a paucity of available data for all of the countries in the sample. As we
have previously noted in response to information requests from the ESC, the global
factors cover many of the countries contained in PoM’s comparator set.
The ESC also considered that Synergies had not sufficiently explained why it used
Professor Ken French’s data for all countries except Australia. On p.168 of last year’s
report, we explained that calculate the return on equity for PoM, we require estimates of
the size and value premia for Australia (analogous to the requirement for an Australian
MRP). The compilation of country-specific factors is a data-intensive process, and we
would anticipate that the sample of countries for which these factors exist will improve
over time.
As discussed in Chapter 8, we have made two important changes to PoM’s comparator
set in response to ESC commentary. Firstly, we have removed the airports sector from
the comparator set. Secondly, we have applied further filtering to the countries that are
admissible for the comparator set across all sectors. This reduces the comparator set to

DETERMINING A WACC ESTIMATE FOR PORT OF MELBOURNE Page 121 of 296
19 companies. Of these 19 comparators, 9 have country-specific size and value factors,
while 10 do not.151 Recognising that the lack of country-specific factors is a limitation to
implementing the FFM at the present time, we have decreased to 5% the weighting that
we assign to the FFM. Nevertheless, it may be appropriate to revisit this weighting in
future if gaps in country-specific data is rectified.
Portfolio formation has been another point of contention. The ESC reproduced ERA
commentary that there is no strong theory to guide the method of portfolio formation.
In principle, it is unclear whether we would necessarily expect there to be strong
theoretical literature around a specific technical issue such as portfolio formation.
The Brailsford et al. method, upon which our approach was based, takes into account
the unique composition of the Australian market when forming portfolios (elaborated
on in Attachment C, as per last year’s report). They show that this country-specific
adjustment emulates the total market capitalisation assigned to each portfolio in US
studies. Whilst it is true that different portfolio formations could lead to different results,
we are not aware of any compelling case that has been put forward in the literature for
deviating from current practice. Moreover, a similar criticism could be directed toward
various other WACC parameters; naturally if model assumptions are changed, outputs
will also change, but there needs to be a rationale for doing so.
6.4.9 Application of guiding principles for well-accepted approaches
The evidence presented in the preceding subsections enables us to ascertain how the
FFM performs in relation to the guiding principles we introduced in Chapter 3. An
overview of these criteria as they apply to the FFM are presented in Table 17.
Table 17 Application of IPART/AER criteria to FFM
Criteria Applicability to FFM
Accuracy The three factor model has been shown to offer greater explanatory power in regard to observed returns.
Stability and predictability Our Fama-French methodology has delivered a stable return on equity estimate over time (accounting for changes in the risk free rate), noting that this year’s FFM estimate is not directly comparable with previous years due to refinements made to the underlying comparator set.
Transparency and replicability The FFM provides a transparent framework for modelling the ad hoc premia that financial practitioners apply in their assessments.
Reflection of economic/financial principles There is clear economic logic supporting the existence and persistence of the Fama-French factors. This ensures that the size and value premia are not transitory statistical anomalies.
151 In the Marine Ports and Services sector, 3 firms have country-specific factors, while 8 do not. In the railroads sector,
6 firms have country-specific factors, while 2 do not.

DETERMINING A WACC ESTIMATE FOR PORT OF MELBOURNE Page 122 of 296
Criteria Applicability to FFM
Flexibility with changing market conditions All model parameters are estimated based on market data, which will reflect and incorporate underlying market movements.
Robust data The Australian Fama-French data has been derived according to a peer-reviewed academic methodology that takes into account country-specific considerations. The Ken French data for other countries is a globally recognised dataset. The lack of country-specific factors for all countries in PoM’s comparator set has led us to place less weight on the FFM this year. We would consider increasing the weight if country-specific factors become available for a broader sample of countries. That being said, global data serves as a useful proxy in the absence of country-specific data, allowing us to still place some weight on the FFM.
6.4.10 Conclusion on Fama-French model
The FFM has clearly demonstrated superior empirical performance in comparison to
other asset pricing models. This highlights its importance as a relevant well-accepted
model in a regulatory setting, where the long-term interests of consumers are served by
ensuring an infrastructure owner is adequately remunerated for its investment.
Furthermore, the model has received favourable endorsements from various economic
regulators, including most recently by IPART.
However, despite its empirical appeal and endorsements by regulators, we acknowledge
that it is not possible to source country-specific factor estimates for all of the firms in
PoM’s comparator set. Accordingly, we have decreased the weighting in PoM’s overall
return on equity to 5%, noting that it may be appropriate to revisit this weighting in the
future if gaps in country-specific data are rectified.
6.5 Dividend Discount Model
The DDM is a different construction from the three CAPM models in that it is
underpinned by the assumption current stock prices reflect the present value of the
expected future cash flows (dividends) that will be paid to investors. In so doing, its
value reflects the current risk premium associated with holding the market portfolio.
The DDM is expressed as follows:
Where:
p = current stock price
d = dividend
g = expected dividend growth
r = discount rate/return on equity

DETERMINING A WACC ESTIMATE FOR PORT OF MELBOURNE Page 123 of 296
The formula can be rearranged to express the return on equity (r) as a function of the
stock price and future dividend growth.
6.5.1 Strengths
The DDM is a theoretically strong model because it does not require assumptions to be
made regarding what explanatory factors drive expected returns, i.e., this model equates
the present value of future dividend cash flows to the current stock price.
Findings from several empirical studies published in academic journals have found
outcomes to be in line with the predictions of the model.
Reasonable specifications of the DDM produce estimates of the overall required return
on equity that are more stable than the risk-free rate implying a risk premium that tends
to partially offset changes in the risk-free rate, so that the estimate of the overall required
return does not rise and fall one-for-one with changes in the risk-free rate. This
characteristic means the DDM can also be used (and is or has been used by several
regulators) to develop forward-looking estimates of the market risk premium.
The DDM is often applied in financial market and regulatory contexts internationally.
6.5.2 Weaknesses
In commenting on the weaknesses of the DDM as a means of estimating the cost of equity
for an individual stock, it is relevant to note that the weaknesses that arise in the
application of the DDM to an individual stock do not apply or do not apply to the same
extent in its use for assessing the MRP (which relies on the market as a whole).
For the purposes of assessing the cost of equity for an individual firm, the model is most
applicable to mature, stable companies who have a proven track record of paying out
dividends consistently. Immature growth stocks or stocks more generally without a
track record of paying dividends are not captured in the model.
The DDM is built on the assumption that the only value of a stock is the return on
investment it provides through dividends rather than expectations of capital growth,
which in practice is unrealistic.
We have not pursued the DDM for informing the cost of equity for PoM (as opposed to
the MRP) in the current case because of the limited sample of comparable Australian
companies to underpin the application of the model. In contrast to the other three cost
of equity models that we have examined, the use of overseas comparators for the DDM
for an individual company requires assumptions about key economic inputs (such as
long-run growth rates). These may differ from the Australian context, making the

DETERMINING A WACC ESTIMATE FOR PORT OF MELBOURNE Page 124 of 296
estimates derived from the DDM less representative of the appropriate cost of equity.
Previous applications of the DDM have relied heavily upon Australian (and New
Zealand) comparators for this reason. This does not undermine the application of the
model for the purposes of estimating the MRP; rather it limits the usefulness of
international comparators for the purposes of using the model for assessing the most of
equity for an individual firm.
6.6 Choosing a well-accepted cost of equity approach
Based on academic recognition, global regulatory and independent expert practice, we
consider the following four models identified in this chapter are well-accepted such that
they satisfy the Pricing Order requirements in regards to estimating the rate of return:
• SL CAPM
• Black CAPM
• FFM
• DDM.
Valuation techniques, asset pricing and regulatory practice evolve. Clearly, regulatory
precedent in Australia supports the SL CAPM despite a range of known limitations.
Given our assessment of strengths and weaknesses of each of the suitable cost of equity
models, academic literature and the evidence of global regulatory and financial market
practice, we consider it is appropriate to either:
• use values generated from a combination of well-accepted models to estimate the
return on equity rather than solely relying on a single model given no single model
is compelling in terms of its strengths compared to the other models; or
• if data or other constraints preclude such an approach, to explicitly allow for other
approaches to be utilised in the future or to utilise various approaches as a cross
check.
The following section explains how we will use a combination of models to estimate the
cost of equity rather than solely relying on a single model.
6.6.1 Applying a multi-model approach
We have determined the cost of equity for the benchmark port entity for PoM using a
combination of the three well-accepted CAPM models discussed in the preceding
sections, with parameters estimated using large datasets, (these being SL CAPM, Black
CAPM and FFM). We consider a cost of equity estimate calculated using a combination

DETERMINING A WACC ESTIMATE FOR PORT OF MELBOURNE Page 125 of 296
of these well-accepted approaches will provide a reliable estimate that satisfies the
requirements of the Pricing Order and the statutory objectives underpinning the Pricing
Order.
For this regulatory period submission, we have not included the DDM as a standalone
well-accepted cost of equity estimate due to the limited comparable set on the Australian
Stock Exchange (ASX), which limits the statistical reliability of the results. Instead, we
have utilised DDMs in our market risk premium estimate (which relies only on a whole
of ASX analysis). DDMs contains potentially important (albeit volatile) forward-looking
equity market information that can inform an appropriate MRP value.
In light of this, the outstanding methodological issue relates to the relevant weighting to
apply to each of the three models, where the weights, in principle, should broadly reflect
the relative strengths and weaknesses of the three models. In our view, based on model
accuracy alone it may be reasonable to more heavily weight the FFM than the SL CAPM
and Black CAPM given its demonstrably greater predictive power in regards to required
market returns. However, issues sourcing country-specific FFM factors for the all of the
countries in PoM’s comparator set, as well as the ongoing statistical insignificance of the
zero-beta premium in the Black CAPM, have led us to place a lower weighting on these
models. Accordingly, we have placed a 90% weighting on the SL CAPM, and a 5%
weighting on each of the Black CAPM and FFM. In our view, it may be appropriate to
revisit this weighting in future if these data related concerns are rectified.
Chapter 7 of our report explains how we have estimated the return on the market as a
whole. Chapter 8 explains how we have calculated a cost of equity estimate using the SL
CAPM model. In Chapters 9 and 10 we present estimates generated by applying the
Black CAPM and FFM, respectively.

DETERMINING A WACC ESTIMATE FOR PORT OF MELBOURNE Page 126 of 296
7 Total market return
Chapter overview
2019-20 submission
Comments
9.30% to 9.73%
This chapter sets out our approach to estimating the total market return (calculated as the sum of the risk-free rate and the market risk premium (MRP). The point estimate of 9.73% is based on a risk-free rate of 1.96% and an MRP of 7.77% (based on a 50% weighting to the Ibbotson MRP, a 25% weighting to the Wright MRP, and a 25% weighting to DDMs). The lower range estimate retains a risk-free rate estimate of 1.96%, but applies an MRP of 7.34% based on a 66.7% weighting to the Ibbotson MRP, a 16.7% weighting to the Wright MRP, and a 16.7% weighting to DDMs.
Given the inherent volatility in the risk-free rate over time, it is informative to evaluate
the expected value of the total market return outcome (measured as the risk-free rate
plus the MRP). As explained below, this ensures that the approach to PoM’s return on
equity is consistent with the pricing principles and capable of achieving the regulatory
objectives of ensuring efficient outcomes consistent with a workably competitive market;
incentivising efficient investment; establishing prices that are fair and reasonable, and
which recover efficient costs. Due to PoM’s point estimate equity beta of 1.0, the total
market return coincides with PoM’s point estimate post-tax return on equity under the
SL CAPM and Black CAPM.
7.1 Why focus on the total market return?
Evidence from market practitioners indicates that required return on capital does not
necessarily change one-for-one with observed government bond yields, especially when
yields are low.
In an article for the RBA bulletin, Lane and Rosewall (2015) investigate market practice
on the relationship between interest rates and investment decisions in Australia. The
authors, from the Economic Analysis Department of the RBA, employ evidence from the
RBA’s business liaison program, which conducts discussions with market contacts who
are CEOs, CFOs or operations managers from primarily mid-sized and large-sized firms
on an annual or semi-annual basis. These businesses are selected on the basis that they
are more likely to reflect economy-wide trends rather than firm-specific factors.
Their primary finding is that “the capital expenditure decisions of many Australian firms
are not directly sensitive to changes in interest rates.”152 Instead, “Australian firms tend
to require expected returns on capital expenditure to exceed high ‘hurdle rates’ of return
that are often well above the cost of capital and do not change very often”. The authors
also remark that this phenomenon is not confined to Australia, with other advanced
152 Lane, K. & Rosewall, T. (2015). Firms’ investment decisions and interest rates, RBA Bulletin, June quarter 2015, p.1.

DETERMINING A WACC ESTIMATE FOR PORT OF MELBOURNE Page 127 of 296
economies exhibiting similar patterns of hurdle rates sometimes several percentage
points above the contemporaneous WACC.
More broadly, post-GFC evidence supports the notion that the required return on equity
is relatively stable over time. This point was implicitly made by Glenn Stevens, former
Governor of the Reserve Bank of Australia, in a speech to the Australian American
Association:153
But another feature that catches one's eye is that, post-crisis, the earnings yield on
listed companies seems to have remained where it has historically been for a long
time, even as the return on safe assets has collapsed to be close to zero (Graph 2). This
seems to imply that the equity risk premium observed ex post has risen even as the
risk-free rate has fallen and by about an offsetting amount. Perhaps this is partly
explained by more sense of risk attached to future earnings, and/or a lower
expected growth rate of future earnings.
Or it might be explained simply by stickiness in the sorts of ‘hurdle rates’ that decision
makers expect investments to clear. I cannot speak about US corporates, but this
would seem to be consistent with the observation that we tend to hear from
Australian liaison contacts that the hurdle rates of return that boards of directors
apply to investment propositions have not shifted, despite the exceptionally low
returns available on low-risk assets.
The possibility that, de facto, the risk premium being required by those who make
decisions about real capital investment has risen by the same amount that the riskless
rates affected by central banks have fallen may help to explain why we observe a pick-
up in financial risk-taking, but considerably less effect, so far, on ‘real economy’ risk-
taking.
The graph the Reserve Bank Governor referred to is reproduced in Figure 5.
153 Glenn Stevens, Address to The American Australian Association Luncheon, New York, USA – 21 April 2015.

DETERMINING A WACC ESTIMATE FOR PORT OF MELBOURNE Page 128 of 296
Figure 5 Earnings and sovereign bond yields
Source: RBA
Based on this recent evidence, it is imperative to ensure that the sum of the risk-free rate
and MRP are capable of achieving the regulatory objectives. It is also important to note
that the risk-free rate is now even lower than it was at the time of these two
commentaries, which suggests that these phenomena will be even more pronounced at
the present time.
7.2 Evidence from independent experts
Further market evidence on the relationship between the MRP, the risk-free rate and the
return on equity can be sourced from recent independent expert reports. In an October
2018 independent expert report, KPMG highlighted that “market evidence indicates that
bond yields and the market risk premium are strongly inversely correlated.” They go on
to stress that:154
It is important that any assessment of the risk-free rate should be made with respect
to the position adopted in deriving the market risk premium. As the market risk
premium is based on a long-term view of the market, it is also important to do the
same with the risk-free rate to ensure the combination of the risk free rate and market
risk premium represents an appropriate return in the current investment
environment.
154 KPMG (2018a). Scottish Pacific Group Limited – Independent Expert report, 24 October, p.97.
DETERMINING A WACC ESTIMATE FOR PORT OF MELBOURNE Page 129 of 296
This suggests to us that a comparison of total market returns (i.e. risk-free rate + MRP,
or the return on equity for a firm with an equity beta of 1) is relevant. This was the
motivation for our previous comparisons with IPART’s MRP (clarified below), which
assumes a materially higher risk-free rate.
In an earlier January 2018 report, KPMG also stated that, “On balance, we consider
adopting the spot Government Bond yield in isolation of a change in the MRP to be
inappropriate and therefore have applied an adjusted risk-free rate.”155 With the 10-year
Commonwealth Government bond rate still at near record low levels, this comment
remains highly applicable to PoM’s approach for setting its WACC.
Countering arguments that current interest rate conditions constitute a “new normal”,
Grant Samuel argued in a separate report that they do not believe the current position is
sustainable over the long term, and that “the risk is clearly towards a rise in bond
yields.”156 Grant Samuel then went on to observe that some academics and valuation
practitioners consider it to be inappropriate to add a “normal” market risk premium (e.g.
6%) to a temporarily depressed bond yield and therefore advocate that a “normalised”
risk free rate should be used. They contend that “has become increasingly common
among broker analysts.”157
The risk-free rate has decreased even further in the approximately six months since this
independent expert report was written, so the low interest rate phenomenon is an
increasingly relevant consideration. Although KPMG and Grant Samuel propose an
adjustment to the return on equity via the risk-free rate rather than the MRP158 both
experts make clear that it is inappropriate to combine a long-term estimate of the MRP
(as given by the Ibbotson approach) with a contemporaneous estimate of the risk-free
rate (as given by the on-the-day approach).
A key theme emerging from this market commentary is that a bottom-up compilation of
WACC parameters is not sufficient in isolation of the wider consideration of a sufficient
overall return on equity outcome to incentivise investment. When return on equity
parameters such as the risk-free rate depart significantly from their long-term averages,
it is imperative that this is at least partially accommodated in the total market return.
155 KPMG (2018b). Altona Mining Limited – Independent Expert’s report, 9 January 2018, p.95.
156 Grant Samuel (2018b). Billabong International Limited – Proposal from Boardriders, Inc., 13 February, p.51.
157 Grant Samuel (2018b), p.52.
158 Given the evidence of its implementation by both financial practitioners and regulators alike (both in Australia and overseas) we consider that this approach remains open to PoM.

DETERMINING A WACC ESTIMATE FOR PORT OF MELBOURNE Page 130 of 296
Connect 4 insights
Finally, the data on independent expert reports extracted from the Connect 4 database
can also be used to generate estimates of the post-tax total market return. The median
post-tax total market return across the sample period is 10.0% (with an average of 10.1%),
as shown in Figure 6. This compares to the post-tax total market return of 9.73% that we
currently estimate as at 29 March 2019 (based on 50% weighting to the Ibbotson MRP,
25% weighting to the Wright MRP and 25% weighting to DDMs, combined with an on-
the-day estimate of the risk-free rate).159 We do observe a modest decline in the total
market return since the end of 2017, with estimates used by independent experts
clustering between 8% and 10%. This remains consistent with a point estimate for the
total market return of around 9%.
Figure 6 Post-tax total market returns implied by independent expert reports
Note: The total market returns in this chart are presented on a post-tax basis and do not include any ad hoc risk premia, which would
further increase the post-tax return on equity for a firm with an equity beta of 1.
Data source: Connect 4, Synergies calculations
7.3 Regulatory approaches to the total market return
It is important to understand how the approach in financial markets differs from the
practice of Australian economic regulators. This section begins with a brief overview of
159 9.73% = risk-free rate (1.96%) + MRP (7.77%)
0.00%
2.00%
4.00%
6.00%
8.00%
10.00%
12.00%
14.00%
Aug-13 Feb-14 Sep-14 Mar-15 Oct-15 Apr-16 Nov-16 Jun-17 Dec-17 Jul-18

DETERMINING A WACC ESTIMATE FOR PORT OF MELBOURNE Page 131 of 296
regulatory approaches to the risk-free rate and market risk premium, before combining
these into estimates of total market returns.
7.4 Regulatory approach to the risk-free rate
Following the recent QCA draft decision for Queensland Rail released in April 2019, all
Australian regulators assume a 10-year risk-free rate in their transport determinations.160
In regard to averaging periods, the most common regulatory practice is to average the
rate over a short horizon, which typically ranges from between ten and forty days, noting
that over such a short horizon the choice of averaging period is likely to be of little
consequence. IPART is the only Australian regulator that takes into consideration longer
term averages, which it does in conjunction with short term estimates.
Updated risk-free rate for PoM
We have updated our risk-free rate estimate for PoM based on 10-year Commonwealth
Government bond yields and a 20-day averaging period to 29 March 2019. As the quoted
rates are semi-annual, we have converted them to annual effective rates.161 The resulting
estimate is 1.96%.
Further commentary on the risk-free rate is presented in Attachment H.
7.5 Regulatory decisions on the MRP
Table 18 summarises the most recent MRP estimates derived by Australian economic
regulators. Several regulators have adopted values for the MRP greater than 6%.
Table 18 Most recent MRP estimates applied by Australian regulators
Regulator Date Sector MRP (per cent)
IPART February 2019 Biannual WACC update 7.3% based on the August 2018 range from 6.0% - 8.6%.
Increases to 8.5% once account is taken of uplift to
risk-free rate
QCA April 2019 Rail 6.5%
ERA May 2019 Rail 5.9%
ACCC December 2018 Rail 6%
ESCOSA June 2016 Water 6%
ESC July 2016 Water 6%
160 The ERA continues to apply a term-matching rate for its electricity and gas decisions.
161 Annual effective rate = (1+ semi-annual rate/2)^2 -1

DETERMINING A WACC ESTIMATE FOR PORT OF MELBOURNE Page 132 of 296
Regulator Date Sector MRP (per cent)
AER December 2018 Electricity and Gas 6.1%
OTTER May 2018 Water 6.5%
ICRC May 2018 Water 6.5%
Source: Synergies based on Australian regulatory determinations
Key points to note in terms of Australian regulators’ recent approved MRPs are as
follows:
• IPART derives its feasible MRP range based on long-run averages and current
market data. The latter value is derived from the DDM. IPART applies the mid-
point of its MRP range. However, IPART’s MRP estimate as a margin above the
contemporary risk-free rate is greater than its reported value (7.3%) because of the
higher risk-free rate assumed in its approach.162
• Until recently, the QCA has applied four main methods to estimate the MRP, being
two forms of historical averaging (the Ibbotson and Siegel averaging methods),
survey evidence (including independent expert reports) and the Cornell DDM. In
its December 2018 UT5 Final Decision for Aurizon Network, the QCA has also
stated that it will now have greater regard to the Wright MRP in its determinations,
to which it has previously given only a low weight.163
• ESCOSA and ESC appear to solely rely on historical long-term averages based on
the Ibbotson averaging approach.
Clarification on IPART’s effective MRP
The ESC asked us to clarify why and how IPART’s MRP should be converted into an
‘effective’ value, which in the 2018-19 report we estimated to be approximately 8%.
IPART has since updated its MRP and risk-free rate estimates, so we use its most recent
market update as an illustration.
IPART currently applies a risk-free rate of 3.15% in all of its decisions. This is derived
from a ‘current’ estimate, which provides a risk-free rate of 2.7% (as at 31 January 2019),
and a 10-year estimate, which IPART calculates to be 3.6% (also as at 31 January 2019).
The final risk-free rate is calculated as the midpoint of these two estimates.
The reason why this higher risk-free rate needs to be reflected in the MRP estimate
becomes apparent when we consider the total market return allowed by IPART and
162 IPART (2018b). WACC biannual update, August, p.3.
163 QCA (2017). Aurizon Network’s 2017 draft access undertaking, December, p.492.
DETERMINING A WACC ESTIMATE FOR PORT OF MELBOURNE Page 133 of 296
other economic regulators. The market return is simply the sum of the risk-free rate and
the market risk premium.164 Therefore, IPART’s total market return is calculated as
follows:
Total market return = risk-free rate + market risk premium
= 3.15% + 7.30%
= 10.45%
However, if we assume a risk free rate of 1.96% for PoM (as at 29 March 2019), a total
market return of 10.45% could only be achieved if a market risk premium of 8.49% was
used. As a result of this, the market risk premium that is consistent with IPART’s total
market return is well in excess of 8%.
We put this into the context of other Australian regulators’ implied market returns in the
next section.
Attachment F provides more details on Australian regulators’ estimation of the MRP.
7.6 Australian regulatory estimates of market returns
Figure 7 shows a wide range for the total market return currently applied by Australian
regulators. This effectively shows how these regulatory bodies would assess the return
on equity for a firm with an equity beta of 1. All Australian regulators now assume a 10-
year risk-free rate in their transport determinations.165 As such, we have adopted for
these regulators the same current 10-year risk-free for PoM, which we calculate to be
1.96%. This ensures that we are making comparisons at the same point in time.
164 In terms of the CAPM equation, the total market return can be thought of as the return on equity for a firm with an
equity beta of 1.
165 The ERA continues to apply a term-matching rate for its electricity and gas decisions.

DETERMINING A WACC ESTIMATE FOR PORT OF MELBOURNE Page 134 of 296
Figure 7 Market returns applied by Australian regulators
Data source: Various regulatory decisions
The total market return ranges between a minimum of 7.96% for the ACCC and
ESCOSA, and a maximum of 10.45% for IPART. This compares to a total market return
of 9.97% for PoM (based on the approach of a 50% weighting on each of the Wright and
Ibbotson MRPs that PoM has historically applied). The approach that PoM applies this
year results in a range for the total market return of 9.30% and 9.73%. This range is below
the median total market return applied by financial practitioners according to our
analysis of the Connect 4 database in Section 7.2.
What is evident about most of the Australian regulators with total markets returns at or
around 8% is that they typically combine a short-term average of the risk-free rate with
a long-term average of the historical excess return. If the short-term risk-free rate is
reflective of conventional market conditions, then this is less likely to be problematic.
Current market conditions are far from this ideal, with Commonwealth Government
bond yields close to all-time lows. This is not to say that the long-term averaging period
for the MRP is inappropriate. It is wholly appropriate that a long-term data series should
be employed, where available. However, regard must be had to the range of risk-free
rates that have underpinned these historical excess returns over time. Between 1883 and
2018, the average government bond yield was 5.5%.166
166 The average bond yield across shorter sampling periods is actually higher (between 6.2% and 7.7%).
0.00% 2.00% 4.00% 6.00% 8.00% 10.00% 12.00%
IPART
PoM (previous approach)
PoM (2019-20 point estimate)
PoM (2019-20 lower range)
AER
ACCC
ERA
QCA
ESCOSA
ICRC
OTTER
Risk-free rate MRP
Med
ian to
tal marke
t return
ado
pted
by fin
ancial
practitio
ners = 1
0.0
%
Lon
g-term average m
arket retu
rn (18
83
-presen
t)= 1
1.5
%

DETERMINING A WACC ESTIMATE FOR PORT OF MELBOURNE Page 135 of 296
As a hypothetical scenario, it is useful to observe how this regulatory range would adjust
to a risk-free rate of 5% (which has been observed as recently as 2011 and is close to the
long-run risk-free rate underpinning the Ibbotson estimate). This is shown in Figure 8.
It is difficult to predict how DDMs would behave under different market conditions, but
the heavy reliance on the Ibbotson approach means that regulatory MRPs are likely to
remain relatively constant over time (except for the QCA, for which we have performed
an indicative adjustment based on the weight given to the Wright approach). There is a
notable compression of market return estimates, and PoM’s approach places it far closer
to notional regulatory outcomes when the risk-free rate is higher.
This verifies the notion that an MRP informed primarily by Ibbotson is more appropriate
when the risk-free rate is measured over the same period that the total market return is
assessed. Moreover, the total market returns in Figure 8 are more in line with those
applied by independent experts, as evidenced by the findings from the Connect 4
database in the previous section.
Figure 8 Notional market returns at a risk-free rate of 5%
Note: We have adjusted the QCA’s MRP estimate based on our expected impact of the risk-free rate given their weighting on the Wright
MRP
Data source: Synergies analysis
In summary, combining an on-the-day risk-free rate with a largely constant MRP will
lead to a fluctuating return on equity over time. Excessive fluctuations would be
inconsistent with the regulatory objectives. In contrast though, the market evidence from
Sections 7.1 and 7.2 makes clear that required rates of return are not as sensitive to these

DETERMINING A WACC ESTIMATE FOR PORT OF MELBOURNE Page 136 of 296
short-run market fluctuations as the approaches of some Australian regulators seem to
imply.
7.7 Determining a total market return for PoM
The contrast between the outcomes in financial markets and the outcomes of current
regulatory methodologies raises an important question on how to set the sum of the risk-
free rate and MRP in a way that is consistent with the requirements of the Pricing Order
and best capable of achieving the regulatory objectives.
The practice of financial valuation experts is to assume a relatively constant MRP, but to
provide an uplift to the risk-free rate (or to make other adjustments) in order to ensure
that the overall return on equity allowance is adequate for the valuation.
Whilst the end result is similar, this approach is somewhat different from that which we
have previously applied for PoM. We have adopted the prevailing regulatory practice
(with the exception of IPART) of adopting a short-term average of the contemporaneous
risk-free rate, combining this with an MRP methodology that appropriately
accommodates fluctuations in the risk-free rate. Previously, this has been achieved by
assigning a 50% weighting to the Wright approach. This ensures that our MRP estimate
for PoM moves inversely with the risk-free rate, albeit not as a one-for-one relationship.
Ibbotson MRP
The ESC recommended that we provide more transparency as to how our MRP value is
derived. Specifically, the ESC observed that our estimate of 6.56% for the Ibbotson
method (now 6.48%) was towards the upper end of historical excess return estimates
from recent regulatory determinations.167 As part of its rate of return review process in
2018, the AER published its MRP model as a supporting attachment to its draft decision.
This allows us to compare any differences in the AER’s underlying calculations in data
with our own model. We are not aware of any other Australian economic regulator
making its MRP model public in recent times.
Our comparison and reconciliation of the two models has revealed the following:
• Synergies favours the NERA adjustment to earlier historical data
• The AER informs its MRP with shorter averaging periods (the ESC expressed
hesitation in its interim commentary about reliance on shorter averaging periods)
167 Interim Commentary, p.54.

DETERMINING A WACC ESTIMATE FOR PORT OF MELBOURNE Page 137 of 296
• The AER gives weight to geometric averaging in order to select a value towards the
lower end of the range of historical excess returns, which likely results in a
downwardly biased estimate of the MRP
• Synergies and the AER make different assumptions about theta (a component of
gamma, as explored in Chapter 12)
NERA adjustment
One of the regulatory debates on historical returns has centred around the treatment of
earlier market data (such as the Lamberton 1882-1979 historical accumulation index
series). The so-called Brailsford et al. methodology relied on data from the ASX that
adjusted the Lamberton series between 1883 to 1957 to account for perceived deficiencies
in the series. NERA argued that these adjustments overstate the potential downward
bias and only a smaller adjustment was necessary. As such, the NERA-adjusted dataset
is our preferred source for historical MRP estimates, although we acknowledge that this
adjustment is not currently favoured by the AER. On the other hand, the ERA takes an
average of the Brailsford et al. and NERA estimates.
Geometric averaging vs arithmetic averaging
Another MRP debate revolves around the reliance on geometric and arithmetic
averaging. Regulators have had regard to geometric averages, which compound the
market return over time, leading to a lower MRP. However, even AER advisors such as
Dr Martin Lally have shown that arithmetic averages must be used when there is no
compounding applied to the WACC estimate (as is the case for PoM and the way its
WACC is applied). Therefore, we do not believe that PoM should give any weight to
geometric averaging at the present time.
The AER states that it places more weight on arithmetic averages than geometric
averages. Although the AER openly acknowledges that geometric averages are
downwardly biased, it nevertheless relies on them to select a point estimate towards the
bottom of the range defined by arithmetic averaging over different time periods. This
also exerts downward pressure on the AER’s MRP estimate relative to Synergies’
Ibbotson calculation.
The ERA adopts a simple average of the lowest arithmetic and highest geometric means
across different averaging periods to estimate the lower bound of the historic market
premium. The ERA justifies this on the basis that “an arithmetic average will tend to

DETERMINING A WACC ESTIMATE FOR PORT OF MELBOURNE Page 138 of 296
overstate returns, whereas a geometric average will tend to understate them.”168 In our
view, the ERA’s proposed remedy is likely to understate the true MRP as well.
Wright MRP
Most of the ESC’s commentary on the MRP related to our reliance on the Wright
approach. Following the QCA’s adoption of the Wright approach, the most significant
regulatory development since the submission of the previous TCS has been the ERA’s
decision to no longer use the Wright approach to inform its MRP estimate. The following
section identifies a number of issues with the ERA’s rationale for doing so.
The ESC considered that the Wright approach is not widely relied upon by Australian
regulators, and where it has been adopted, regulators have contended that the evidence
supporting its core premise is mixed (noting that we have never suggested that exclusive
reliance should be based on the Wright approach to inform the MRP). Whilst it is true
that the Wright MRP is not supported by all Australian regulators, evidence supporting
the core premise of a constant MRP (as provided by the Ibbotson approach) is far from
unanimous either. Indeed, the AER’s own advisors have acknowledged the feasibility of
an inverse risk-free rate-MRP relationship.
For instance, Partington and Satchell did not rule out the possibility that a decrease in
the risk-free rate could be associated with an increase in the MRP, writing that “on
occasion, it is entirely possible that the MRP may increase as interest rates fall.”169 In
addition, Professor Martin Lally has recently stated the following in a submission
accompanying the final Rate of Return Guideline:170
As with the AER, I do not think that there is any clear evidence that the MRP is
inversely related to the risk-free rate. However, I consider that the proposition of an
inverse relationship is plausible and therefore favour some weight being placed on
the Wright methodology, consistent with my previously expressed views.
At no point in time have we recommended that the Wright approach should be the only
source of information that informs the MRP estimate. Even if the MRP does not move
exactly one-for-one with the risk-free rate, there is certainly evidence that there is at least
some inverse relationship, as we document in the next section. For this reason, it is
prudent that we give the Wright MRP weight in our analysis, in conjunction with the
Ibbotson MRP.
168 ERA (2018). Final gas rate of return guidelines – Explanatory statement. 18 December, p.178.
169 Partington & Satchell (2016), p.15.
170 Lally, M. (2018). Review of the Earwaker report, 4 December, p.9.

DETERMINING A WACC ESTIMATE FOR PORT OF MELBOURNE Page 139 of 296
ERA position on the Wright MRP
The ESC noted in its interim commentary that the ERA has recently withdrawn its
support for the Wright approach. We consider it useful to provide an overview of how
the ERA has perceived the Wright MRP over time, and the justifications it has provided
for its recent change in methodology.
In its 2015 rail decision, the ERA considered that the Wright MRP provided a strong
indicator for the likely return on equity for the next 50 years.171 This was based on
statistical evidence in support of mean reversion for the return on equity. Using Dickey-
Fuller and Engle-Granger statistical tests for unit roots and cointegration, the results
indicated that:
• The market return on equity was a stationary series
• Bill and bond yields were non-stationary
• The MRP was likely to be non-stationary, although the evidence was mixed.
In essence, this implied that the return on equity was observed to be constant over time,
while the risk-free rate was not, leaning to the conclusion that the MRP must vary over
time. These findings offered empirical support for the Wright MRP and led to its
subsequent use in ERA decisions.
In its final decision on the 2018 Rate of Return Guidelines published in December, the
ERA has confirmed that it will no longer have regard to the Wright approach when
calculating the MRP. The ERA attributes the decision not to continue using the Wright
MRP primarily to analysis by Partington and Satchell for the AER.
In their 2017 report, Partington and Satchell considered that the MRP is likely to be lower
than its long run historic mean.172 They contend that the cost of equity in the Australian
market has decreased since 2013, but that the MRP has remained constant. In reviewing
the empirical evidence, Partington and Satchell did not find it compelling that the MRP
should be estimated as the long run mean return on the market less the current risk-free
rate (i.e. the Wright approach), as opposed to simply calculating the long run average
MRP (i.e. the Ibbotson approach).
In reviewing the ERA’s analysis, Partington and Satchell identified a series of issues:
171 ERA (2015), p.145.
172 Partington, G. & Satchell, S. (2017). Report to the AER: Discussion of estimates of the return on equity, 12 April.

DETERMINING A WACC ESTIMATE FOR PORT OF MELBOURNE Page 140 of 296
• A random walk, as indicated by the findings of a unit root test, is not the only notion
of non-stationarity, such that there are time series that are non-stationary, yet not
random walks.
• The non-stationarity detected for bill and bond yields was possibly attributable to
high inflation between 1973 and 1986, and therefore real yields may have been a
more suitable candidate for unit root and cointegration testing.
• It may have been more ideal to perform the econometric analysis on all of the
variables in levels (i.e. prices) rather than on first differences (i.e. the change in
prices).
Specifically, Partington and Satchell remark that if the conclusions relied upon by the
ERA “did not apply, then it would substantially weaken the ERA case for using the mean
return on equity rather than the mean MRP.”173
In principle, we do not disagree with Partington and Satchell’s technical appraisal of the
ERA’s econometric analysis. The high inflation in the 1970s and 1980s may well have led
to the detection of a random walk, and it is more conventional to test for cointegration
using variables in levels rather than in first differences (i.e. returns).
Synergies has previously endorsed the ERA’s use of the Wright MRP, but not exclusively
based on the unit root testing that the ERA conducted. In other words, we consider that
the evidence in support of the Wright MRP approach is in no way conditional on
whether or not the MRP is found to be stationary through unit root and cointegration
testing.
In essence, the argument being put forward by Partington and Satchell and the ERA is
that the recommended refinements to the unit root and cointegration testing may
ultimately reveal that the MRP is a stationary time series. Such a finding, however,
would not necessarily be inconsistent with the application of the Wright MRP.
Specifically, what stationarity implies is that a time series is mean-reverting.174 This does
not stipulate that a time series must take the exact same value in each and every time
period. For instance, GDP growth (as opposed the level of GDP itself) is typically a
stationary series for most countries, but annual growth rates can still vary significantly
from year to year in proportional terms.
173 Partington & Satchell (2017), p.41.
174 Partington & Satchell note that “stationarity and mean reversion are not necessarily the same thing and compatibility between them requires the imposition of various assumptions on the behavior of the time series under consideration.” We accept this, but consider that these assumptions are not likely to be contentious in the present context.

DETERMINING A WACC ESTIMATE FOR PORT OF MELBOURNE Page 141 of 296
Shocks may cause a stationary series to deviate in the short run from its long-run
average. Shocks may also be prolonged by the tendency for economic cycles to not be
perfectly correlated; for example, there may be a lack of synchronisation between cycles
in equity market valuations, observed returns and risk-free rates in the short term. With
the property of stationarity though, the impact of such shocks on the series will
eventually die down, allowing the variable to revert to its long-run mean.
Applying this rationale to the context of the MRP, the return on the market less the risk-
free rate could be stationary in the long run. However, in response to macroeconomic
shocks (such as the persistently low interest rates in the aftermath of the GFC,
particularly in the context of the current macroeconomic environment in Australia,
which will see accommodating monetary policy for some time), the MRP may deviate
from a long-run average, until such a time as these shocks begin to dissipate.
Consequently, the potential stationarity of the MRP does not preclude the use of the
Wright approach.
If the risk-free rate is sufficiently high, estimates from both the Ibbotson and Wright MRP
approaches will be similar (i.e. in the event that the spot risk free rate resembles the
historical average). Furthermore, when the risk-free rate is above its long-run average it
is possible for the Ibbotson MRP to be higher than the Wright MRP. This is precisely the
purpose of the Wright MRP. It reflects the phenomenon that the MRP tends to increase
during periods of low interest rates, but corrects back once interest rates return to levels
around the average RFR from the Ibbotson MRP calculation.
In separate comments, Partington and Satchell claimed in 2016 that:175
Current 10 year Australian bond yields are 40 basis points below the previous
minimum, so we have struck a new minimum. However, we do not consider that the
magnitude of current interest rates is so dissimilar to the past as to invalidate the
historic MRP informing an estimate of the current MRP.
It is not entirely clear to which previous minimum Partington and Satchell are referring.
Historical data from the RBA website extends back to July 1969. Prior to December 2008,
the lowest recorded 10-year risk-free rate over that timeframe was 4.8% in June 2003. The
current 10-year risk-free rate, while not at an all-time record minimum, is 1.96% (as at 29
March 2019), so the previous minimum being referred to is possibly a post-GFC
minimum. If so, the argument above implies that the Wright MRP is not required
because the risk-free rate is only marginally lower than it has been post-GFC. Yet the
depressed risk-free rates resulting from the GFC are precisely the reason why the Wright
175 Partington & Satchell (2016), p.25.

DETERMINING A WACC ESTIMATE FOR PORT OF MELBOURNE Page 142 of 296
MRP is warranted. If the cost of equity is to be informed (at least in part) by backward
looking assessments of the MRP (as is normally the case) then the assessment of the MRP
should recognise the average risk free rate over the period corresponding to the
measurement period of the MRP. There is no evidence that the MRP has declined to the
extent implied by the Ibbotson model assessed over a long term average and applied
with contemporary risk free rates (which are currently at historical lows).
It could instead be the case that Partington and Satchell are referring to interest rate
history prior to 1969, but it would be difficult to draw parallels between the methods
adopted for determining the MRP then and now.
We respectfully disagree with Partington and Satchell’s comments that the Wright
approach has no “well accepted theoretical support”, “does not seem to be much used,
if at all” and “runs contrary to the well accepted view that asset prices are inversely
related to interest rates.”176 We have presented a wide range of evidence from other
economic regulators and financial practitioners that substantiates the principles behind
the Wright MRP. This is in addition to our investigation of Connect 4 databases, where
independent experts consistently assume risk free rates in excess of prevailing rates (see
Chapter 6). This has the end result of increasing the return on equity that they adopt.
What is notable about the ERA’s decision is that it has not undertaken any follow-up
empirical analysis to attempt to verify the claims that Partington and Satchell have made.
On this basis, we consider that the ERA has provided insufficient rationale for removing
the Wright MRP from consideration, especially when contrasted against the QCA’s final
decision for Aurizon Network in December 2018 that maintained support for the
approach. As a result, we maintain that the Wright MRP should continue to be given
some weight in PoM’s MRP estimate.
A further relevant consideration is not simply the inclusion of the Wright approach to
the assessment of the MRP – rather it is the inclusion of the Wright approach in
combination with the Ibbotson approach. It reflects the phenomenon that the MRP tends
to increase during periods of low interest rates, but corrects back once interest rates
return to conventional levels. Accordingly, an important benefit of combining the
Wright and Ibbotson approaches to efficiently incentivise investment in long term
infrastructure, such as the Port of Melbourne; the combination of approaches brings long
term stability to the cost of equity that moderates the impact of movements in the risk
free rate. All else being the same, greater stability in the rate of return can be consistent
with providing a more investment friendly environment (and less volatility in tariffs for
users).
176 Partington & Satchell (2016), p.31.

DETERMINING A WACC ESTIMATE FOR PORT OF MELBOURNE Page 143 of 296
Dividend discount models (DDMs)
In previous reports for PoM, we have treated DDMs with caution, as the ESC noted in
its interim commentary. In particular, while we endorsed the principles underpinning
the approach, we observed that there was a lack of consensus around the values of key
inputs, such as the assumed long-run growth rate. This along, with fluctuating dividend
forecast inputs and a relatively small sample of relevant Australian listed entities led us
not to adopt the approach for the purposes of assessing PoM’s cost of equity.
Nevertheless, there is an important difference between applying DDM for estimating the
cost of equity given a limited sample of Australian entities to draw upon and its use for
informing the MRP. A particular advantage of the DDM is that it offers a forward-
looking component to PoM’s MRP estimate. We note that three Australian economic
regulators give some regard to DDMs when informing MRP estimates. These are
summarised in Table 19.
Table 19 DDM used by Australian economic regulators
Regulator Methodologies Comments
IPART Damodaran, Bank of England (2002), Bank of England (2010), Bloomberg, SFG Market indicator (mean), SFG analysts implied
IPART gives a 50% weighting to its short-run MRP estimate in its overall MRP estimate. It determines the point estimate based on these six approaches. Its most recent estimate (as at 31 January 2019) is 8.6%.
QCA Cornell DDM The QCA’s most recent Cornell DDM estimate is 5.1% (as of January 2019), which is clearly an outlier among forward-looking regulator estimates. Concerns have previously been raised about adjustments that the QCA makes, which appear to exert downward pressure on the estimate. These include reductions the QCA applies to its evidence of long-run dividend growth, as well as assumptions about future government bond yields.
ERA ERA two-stage dividend growth model The ERA’s two-stage approach assumes that dividends grow at the long-term growth rate following the dividend forecast period. In its recent rail WACC review draft decision, the ERA now places less reliance on its DDM than on its historical MRP, using regulatory discretion to select its overall MRP estimate. The most recent ERA DDM estimate available is 7.2% (note that this estimate from the rail WACC draft decision is backdated to October 2018).
Source: Various regulatory decisions
In previous years, we have presented three well accepted approaches to the estimation
of the MRP using DDMs:
• Damodaran (2013), a modified two stage method;177
177 Damodaran, A. (2013). Equity risk premiums (ERP): Determinants, estimation and implications – The 2013 edition,
pp.63-73.

DETERMINING A WACC ESTIMATE FOR PORT OF MELBOURNE Page 144 of 296
• Bank of England (2010), a multi-stage dividend discount model; and178
• Gordon Constant Growth Model, a simpler model that serves as a useful robustness
check on multi-stage approaches.
We apply equal weighting to all three sub-models as we think there is sufficient
differentiation between assumptions in the models to provide an appropriate estimate
when they are averaged. Table 20 presents the results of these approaches.
Table 20 Forward looking MRP estimates based on DDM (based on a zero gamma)
Methodology Estimate Weighting
Damodaran (2013) 8.63% 33%
Bank of England (2010) 8.62% 33%
Gordon Constant Growth Model 8.42% 33%
Weighted Average MRP 8.56%
For comparison, IPART’s estimate of the Damodaran (2013) MRP as at 31 January 2019
was 8.83%, while its Bank of England (2010) MRP was calculated to be 8.85%.
7.8 Conclusion on the total market return
PoM has previously assigned equal weighting to the Ibbotson and Wright MRP
approaches. This methodology was adopted on the basis that the MRP is likely to vary
inversely with the risk-free rate to some degree, rather than remain constant over time.
Whilst not bound by regulatory precedent, it is clear different regulators apply different
weights to various approaches to inform their MRP estimate (although not always in a
transparent manner). Whilst the combination we have applied previously remains in our
view a valid method of estimating the MRP, we have taken into account comments made
by the ESC in the Interim Commentary, including in relation to the change in approach
by some regulators regarding the Wright approach, and reduced the weighting of the
Wright approach for the estimation of the MRP.
Accordingly, for our point estimate and high WACC, we have adopted a 50% weighting
on the Ibbotson MRP, a 25% weighting on the Wright MRP, and a 25% weighting on
dividend discount models (DDMs).
As an alternative weighting scheme, at the low end of a range, we have also presented
an estimate based on a 66.6% weighting on Ibbotson, a 16.6% weighting on the Wright
178 The Bank of England developed another approach in 2002. This approach is one of the methods adopted by IPART
on its assessment of the MRP. However, the Bank of England (2002) approach has not been included in our analysis as it was not developed to derive implied MRPs.

DETERMINING A WACC ESTIMATE FOR PORT OF MELBOURNE Page 145 of 296
MRP, and a 16.6% weighting on DDMs. The resulting weighted average MRP is 7.34%,
which we use in our lower range WACC estimate for PoM.
Table 21 MRP range
Methodology Estimate Weighting
(Lower range)
Weighting
(Point estimate and upper range)
Ibbotson MRP 6.48% 66.6% 50%
Wright MRP 9.54% 16.6% 25%
Dividend Discount Models (DDMs) 8.56% 16.6% 25%
Weighted Average MRP 7.34% 7.77%
Risk-free rate 1.96% 1.96%
Total market return 9.30% 9.73%
The resulting range for the total market return is between 9.30% and 9.73%, which is well
below the total market return of 10.45% currently applied by IPART. Moreover, this
range is also below the median total market return applied by financial practitioners
(10.0%), which is likely to provide the strongest indication of outcomes in a workably
competitive market.

DETERMINING A WACC ESTIMATE FOR PORT OF MELBOURNE Page 146 of 296
8 Estimating the return on equity using SL CAPM
Chapter overview
2019-20 submission
2018-19 submission
Comments
Point estimate: 12.55% (from range of 12.00%-13.27%)
13.48% Our methodology for estimating the SL CAPM pre-tax return on equity is unchanged from the previous submission, except in relation to the MRP and the adoption of a range that incorporates changes to the MRP (lower bound) and asset beta (upper bound). However, a decrease in the risk-free rate and market risk premium have resulted in a slightly lower estimate compared to the 2018-19 submission.
SL CAPM parameters
Risk-free rate: 1.96%
Risk-free rate: 2.74%
The risk-free rate has again been calculated as a 20-day average on 10-year Australian Government bond yields, an approach frequently adopted by economic regulators.
Asset beta: 0.70-0.75
Equity beta: 1.00-1.07
Asset beta: 0.70
Equity beta: 1.00
Our estimate of PoM’s asset and equity betas are unchanged from last year’s submission. The average and median of the comparator set, across both 5 and 10-year timeframes, reinforces an asset beta of at least 0.70, with 0.75 forming the upper end of the range. An asset beta of 0.70 (0.75) corresponds to an equity beta of 1.00 (1.07) assuming gearing of 30%.
MRP: 7.34% - 7.77%
MRP: 7.71% MRP is now based on a 50% weighting to the Ibbotson MRP, a 25% weighting to the Wright MRP, and a 25% weighting to Dividend Discount Models (DDMs). The lower end of the range is driven by a higher weighting to Ibbotson (66.7%) and corresponding lower weightings to Wright and DDM (16.7% respectively)
8.1 Estimating the SL CAPM return on equity
The SL CAPM is expressed as follows:
Re = Rf + e * [E(Rm) - Rf]
Where:
Rf = the risk-free rate of return
E(Rm) = the expected return on the market
[E(Rm) – Rf] = the market risk premium
e = equity beta (measures systematic risk)
Given all parameters other than the equity beta have been addressed in the previous
chapter, we turn to a consideration of this parameter.
8.2 Estimating beta
There are three key sources of information for the assessment of an entity’s systematic
risk, namely:
• Benchmark results from comparable entities
• First principles analysis

DETERMINING A WACC ESTIMATE FOR PORT OF MELBOURNE Page 147 of 296
• Regulatory precedent.
In undertaking an empirical analysis of beta estimates, reference needs to be made to an
appropriate set of listed comparators for whom equity betas can be estimated and we
have explained our approach in Chapter 4 of our report. Using share price information
for these companies, their equity betas are estimated using regression analysis. As the
companies will have different gearing levels (and hence different levels of financial risk),
these equity betas must be ‘de-levered’ to produce an asset beta. This approach is
generally applied for the assessment of asset betas under the SL CAPM.
The comparator analysis will typically produce a range of estimates for beta,
necessitating an assessment of where PoM’s asset beta might sit relative to these other
comparators. This assessment is facilitated by a first principles analysis, which is a
qualitative assessment of PoM’s systematic risk profile. This approach analyses the key
factors that impact the sensitivity of the firm’s returns to movements in the economy or
market.
Accordingly, in practice, we see a first principles analysis helping to inform, for a
particular firm (in this case, a BEE), where it is likely to sit in the range generated from
an empirical assessment. Accordingly, we turn first to an empirical assessment of port
related betas and then a first principles assessment of PoM.
Firstly, we consider relevant regulatory precedent.
8.2.1 Relevant regulatory precedent
Six Australian regulators have considered regulated revenues of transport
infrastructure:
• ACCC – rail
• IPART – rail
• ERA (WA) – rail
• QCA – rail and coal terminal
• ESC – rail
• ESCOSA – rail.
All regulators have acknowledged the specific challenges the sector presents to identify
comparators given the paucity of listed Australian transport entities. However, the ESC
and ESCOSA have not engaged in a detailed review of comparable companies for many
years and hence they have not been included in this review.

DETERMINING A WACC ESTIMATE FOR PORT OF MELBOURNE Page 148 of 296
For rail businesses, Australian regulators have generally adopted an international
sample of rail and port businesses (ERA for a freight rail network and ACCC for the
Interstate network).
These reviews adopt an asset beta in the range we have suggested (e.g. 0.7 for Arc
Infrastructure).179 This aligns with the approach we have adopted and we believe it
meets the “well-accepted” threshold.
These approaches (to varying degrees of analysis) conclude that the absence of sufficient
Australian transport comparators forces international comparison to ensure robust beta
estimates, without the need for the intervening step of a detailed analysis of a broader
set of Australian comparators. In its April 2018 draft report on the NSW Rail Access
Undertaking, IPART concluded that “taking into account the systematic risk of all rail
networks that fall under the Undertaking, the equity beta would be similar to that of the
US Class 1 railroads, rather than other regulated utilities.” Accordingly, IPART adopted
an equity beta of 1.0, which corresponded to an asset beta of 0.55 based on the 45%
gearing assumption. Although IPART acknowledges some competition with road, parts
of the rail network covered by the NSW Rail Access Undertaking would be expected to
have lower systematic risk exposure than the BEE for PoM. IPART identifies that
RailCorp would exhibit a close alignment with the systematic risk faced by the electricity
generation sector, due to its role in supplying the Eraring and Vales Point power stations.
Detailed analysis of ERA and ACCC freight rail beta precedent is presented in
Attachment E of this report.180
8.2.2 Comparable companies analysis
The first step in a comparable companies analysis involves identifying an appropriate
set of listed companies. In defining the BEE, the ESC contends that the Prescribed
Services should be provided by a port in Australia. However, as per the discussion in
Chapter 4, there are relatively few listed businesses comparable to the BEE operating in
Australia. Consequently, it is necessary to rely on international comparators, as well as
companies from other transport sectors. This is similar to the approach adopted by
regulators in the transport and telecommunications sectors.
179 The ACCC decreased its asset beta assumption from 0.65 to 0.60. However, ARTC has now withdrawn this
undertaking.
180 On a first principles basis, DBCT, Aurizon and the Hunter Valley and are not relevant comparators for PoM given the nature of the take-or-pay contracts and regulatory regimes in place at those assets (which differ significantly from the Pricing Order).

DETERMINING A WACC ESTIMATE FOR PORT OF MELBOURNE Page 149 of 296
Use of international comparator firms
The ESC identified a number of drawbacks with the use of international firms for
deriving beta estimates. In particular, the ESC considered that:
• international beta estimates will reflect the industry composition of the particular
index against which the firm’s returns are being compared, and this may differ from
Australia; and
• returns for other market portfolios may reflect varying degrees of leverage as well
as differences in taxation and bankruptcy arrangements in other countries.
Although the ESC does not cite any literature in support of these claims, and it is unclear
what the magnitudes of these effects on the final beta estimate are likely to be, Australian
regulators have continued to rely significantly on international comparators in recent
decisions without making adjustments for the factors the ESC identified. Based on our
review of regulatory decisions, regulators have previously relied upon comparators
from Australia, New Zealand, the US, Canada, the UK, France, Italy and Spain.181 It is
also the case that financial practitioners commonly draw on international comparators
to supplement a dearth of relevant domestic comparators.
This is the case notwithstanding the fact that betas from different markets reflect the
observed variability of a foreign firm’s returns relative to the market index of its country
and may not accurately reflect how those returns would vary against the Australian
market. However, adjustments on account of this factor are themselves problematic and
controversial.
To address these concerns, we have investigated possible metrics we can employ to
further refine the range of countries that we rely upon to inform PoM’s beta and gearing.
One prominent candidate is the FTSE (Financial Times Stock Exchange) country
classifications. These country criteria are used in a wide array of global index funds, and
also frequently appear in media reports and academic literature.182 This is likely to be a
more robust and informative classification than the OECD/non-OECD split that we
have used for illustrative purposes in previous submissions.
FTSE assesses countries against a “Quality of Markets Matrix”, which has five key
components:
181 IPART, in its recent consultation paper on “Estimating equity beta”, relied on a sample of 35 water utilities for the
entities it regulates. These comparators were sourced from countries such as Hong Kong, the Philippines, Malaysia, Thailand, Vietnam and Chile. Many of these countries have appeared in PoM’s comparator set previously. Further information about this review process (which is in progress at the time of writing) is presented in Attachment E.
182 See Attachment B for further discussion.

DETERMINING A WACC ESTIMATE FOR PORT OF MELBOURNE Page 150 of 296
• GNI per capita
• Dealing Landscape and Brokers
• Custody and Settlement
• Regulation
• Derivatives
These components are further broken down into disaggregated criteria (see Appendix
B). These include various quality indicators such as market liquidity, stock market
oversight, whether equity and foreign exchange markets are free and “well-developed”,
level of transaction costs, and brokerage quality.
Markets are then assigned a rating of “Pass”, “Restricted” (partial failure) or “Not Met”
on each of these factors. Countries are then categorised into Developed, Advanced
Emerging, Secondary Emerging, or Frontier, based on how many of these criteria are
met. For the analysis that follows, we restrict our attention to those countries that appear
in the Developed category. This category is most likely to mitigate the drawbacks of
international comparators that the ESC highlighted in its interim commentary.
The FTSE classifications are not the only possible way of splitting up the comparator
sample. The S&P Dow Jones Broad Market Indices (BMI) are an alternative classification
system (similarly split into Developed, Emerging and Frontier). However, use of the S&P
Developed BMI instead of the FTSE Developed series would result in exactly the same
sample based on the comparators available for PoM.
Further information on the FTSE approach is provided in Attachment B.
Sectors used for sourcing comparable companies
In the 2018 interim commentary, the ESC questioned the inclusion of airports in PoM’s
comparator set, because airports derive only a small proportion of revenues from freight.
This means that they are less likely to be “freight-focused”, which is a component of our
definition for the BEE. As the ESC acknowledged, we previously recognised that
aeronautical services are likely to have different demand drivers relative to the
Prescribed Services. Our rationale for including airports previously was instead more on
the basis that they had some merit as infrastructure assets with high fixed costs in their
total fixed costs base (i.e. high operating leverage). On the other hand, airport
comparators have significant non-aeronautical revenue, which differs substantially from
the Prescribed Services. On balance, and acknowledging the ESC’s concerns, we consider
that the comparator set remains sufficiently robust without airports included.

DETERMINING A WACC ESTIMATE FOR PORT OF MELBOURNE Page 151 of 296
On this basis, we have retained marine ports and services firms and railroads in our
comparator set, but we have removed airports. Restricting the sample of countries
according to the FTSE Developed category, this results in a comparator set of 19 firms
(11 marine ports and services firms and 8 railroads) from 10 countries.183
Marine ports and terminals are considered a primary comparator set from a first
principles analysis due to similar market exposure to container freight trade. However,
terminal operators are not infrastructure providers providing Prescribed Services.
Freight railroads (in particular, North American Class I railroads) are considered a
primary comparator set due to their freight-focussed business model, strong market
position and below rail infrastructure services. Overall, and notwithstanding the
differences noted above, the international sample collectively includes companies with
sufficiently comparable systematic risks to PoM that will enable a robust beta estimate
to be developed for the BEE.
As per the 2018-19 TCS submission, we do not apply a market capitalisation threshold
to the firms in our comparator set.
8.2.3 Beta estimation
Betas have been estimated based on five years of monthly returns, regressed against the
relevant domestic share market index using Ordinary Least Squares. We also eliminated
any firms with: 184
• a t-statistic of less than 2 (this is considered particularly important)
• an R2 less than 0.1.
The ESC raised concerns about our reliance on statistical significance as a criterion. We
address these concerns in the beta diagnostics in Attachment B.
The resulting equity betas were de-levered to produce an asset beta using the Brealey-
Myers approach as follows:
( )EDae /1* +=
Where
183 The 10 countries are Australia, New Zealand, the US, Canada, Japan, South Korea, Hong Kong, Singapore, Germany
and the UK (Global Ports Investments has previously been classified as International, but is UK-listed).
184 Following beta estimation, we removed a Canadian coal terminal that now reports zero gearing and an asset beta of 1.54 (Westshore Terminals) reducing the average and median asset beta of the sample.

DETERMINING A WACC ESTIMATE FOR PORT OF MELBOURNE Page 152 of 296
e = equity beta
a = asset beta
D = proportion of debt within the assumed capital structure
E = proportion of equity within the assumed capital structure
The average gearing levels for each business were calculated using annual data over the
five-year period (using the ratio of long-term debt to market value of equity).
Results
The median asset beta across the full sample of comparable companies is 0.79, based on
a 5-year sample, while the average is 0.76. This suggests that our previous asset beta
estimate for PoM remains reasonable, although an asset beta of 0.75 also appears to be
justified on the basis of market data. A 5-year sample is well-accepted in financial
markets and regulatory practice as likely to provide a robust beta estimate based on a
relatively short historical data set that is reflective of contemporary market conditions.
As the period of the analysis lengthens a richer data set emerges but the contemporary
relevance of the estimates diminishes. Longer sample periods risk incorporating data on
market conditions that is no longer relevant to beta estimates.
However, as a robustness check, we also considered average and median betas over 10
years. For this timeframe, the overall median beta was 0.75 and the average beta was
0.72. This highlights the conservatism of our proposed asset beta of 0.7 and justifies the
upper bound of the range is at least 0.75.
The full comparator set exhibits a reasonably broad range of relevant and comparable
businesses to the BEE. We have calculated the average and median for each sector over
a 5-year period, with the estimates presented in Table 22. The full list of beta estimates
for each company is presented in Attachment B.
Table 22 Comparable companies’ asset beta summary (5-year period)
Overall Average Overall Median Overall Minimum Overall Maximum
Full Sample 0.76 0.79 0.39 1.22
Sector Average Sector Median Sector Minimum Sector Maximum
Marine Ports and Services 0.68 0.53 0.39 1.22
Railroads 0.87 0.94 0.38 1.11
Note: Equity betas were unlevered using the Brealey-Myers approach
Source: Bloomberg
We have also calculated the average and median for each sector over a 10-year period,
with the estimates presented in Table 23.
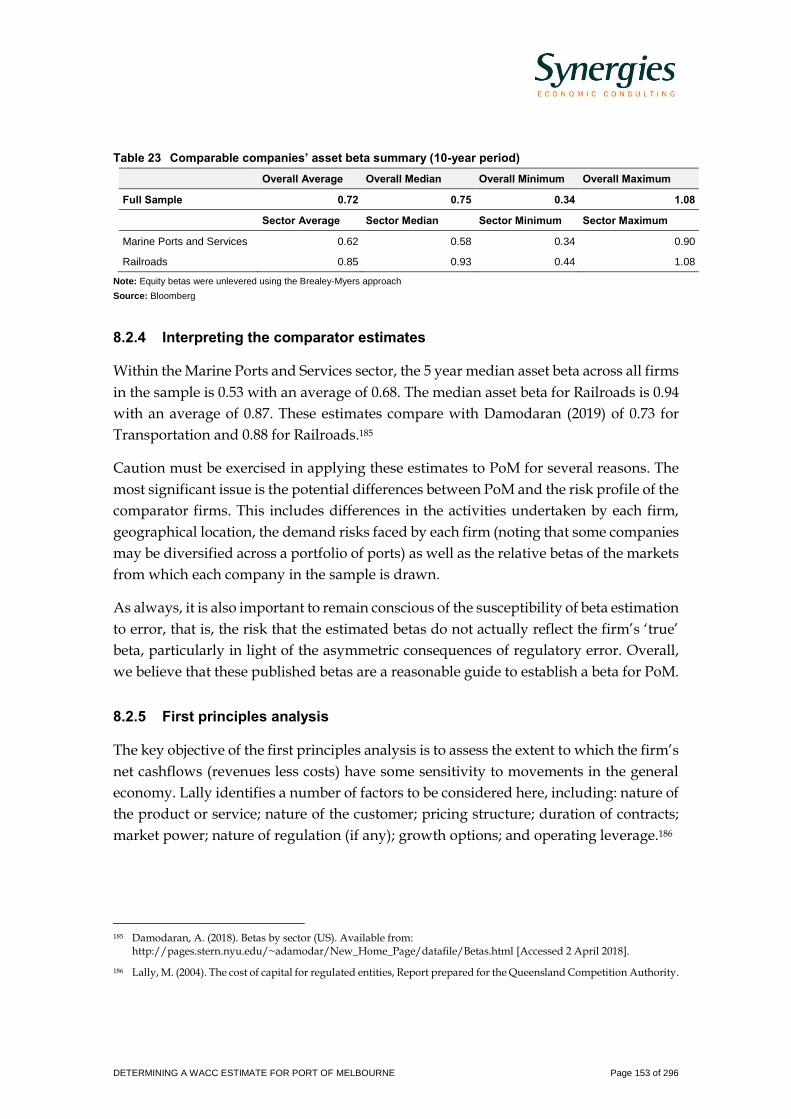
DETERMINING A WACC ESTIMATE FOR PORT OF MELBOURNE Page 153 of 296
Table 23 Comparable companies’ asset beta summary (10-year period)
Overall Average Overall Median Overall Minimum Overall Maximum
Full Sample 0.72 0.75 0.34 1.08
Sector Average Sector Median Sector Minimum Sector Maximum
Marine Ports and Services 0.62 0.58 0.34 0.90
Railroads 0.85 0.93 0.44 1.08
Note: Equity betas were unlevered using the Brealey-Myers approach
Source: Bloomberg
8.2.4 Interpreting the comparator estimates
Within the Marine Ports and Services sector, the 5 year median asset beta across all firms
in the sample is 0.53 with an average of 0.68. The median asset beta for Railroads is 0.94
with an average of 0.87. These estimates compare with Damodaran (2019) of 0.73 for
Transportation and 0.88 for Railroads.185
Caution must be exercised in applying these estimates to PoM for several reasons. The
most significant issue is the potential differences between PoM and the risk profile of the
comparator firms. This includes differences in the activities undertaken by each firm,
geographical location, the demand risks faced by each firm (noting that some companies
may be diversified across a portfolio of ports) as well as the relative betas of the markets
from which each company in the sample is drawn.
As always, it is also important to remain conscious of the susceptibility of beta estimation
to error, that is, the risk that the estimated betas do not actually reflect the firm’s ‘true’
beta, particularly in light of the asymmetric consequences of regulatory error. Overall,
we believe that these published betas are a reasonable guide to establish a beta for PoM.
8.2.5 First principles analysis
The key objective of the first principles analysis is to assess the extent to which the firm’s
net cashflows (revenues less costs) have some sensitivity to movements in the general
economy. Lally identifies a number of factors to be considered here, including: nature of
the product or service; nature of the customer; pricing structure; duration of contracts;
market power; nature of regulation (if any); growth options; and operating leverage.186
185 Damodaran, A. (2018). Betas by sector (US). Available from:
http://pages.stern.nyu.edu/~adamodar/New_Home_Page/datafile/Betas.html [Accessed 2 April 2018].
186 Lally, M. (2004). The cost of capital for regulated entities, Report prepared for the Queensland Competition Authority.

DETERMINING A WACC ESTIMATE FOR PORT OF MELBOURNE Page 154 of 296
The first principles analysis is largely contextual and can inform an assessment of where
beta might sit within a range (that is, whether a factor puts upward or downward
pressure on the beta for the firm). However, this remains qualitative. Noting the inherent
uncertainty in beta estimation, it is not feasible to reliably quantify the impact of a
particular factor on beta in isolation of other factors.187
A number of these factors are also interrelated – that is, the impact of one factor on beta
could either be increased or lessened by another factor. Hence, while the impact of each
factor can be considered in isolation, the overall assessment will reflect the net impact of
the factors in combination. The first two factors are inextricably linked and so will be
considered together.
Nature of the product/nature of the customer
Fundamental to understanding a firm’s risk profile is identifying and analysing the
demand for its core services. The analysis needs to be extended to the services from
which the infrastructure’s demand is derived, which in this case, is the demand for
accessing and usage of channel and wharf assets by shipping companies and related port
users. Other issues that may impact on the extent to which the port is exposed to the risk
of changes in the demand for port services, such as market power and the structure of
PoM’s contracts with its customers, are considered separately.
Availability of substitutes
One of the key drivers of a firm’s risk profile is the extent to which the demand for its
services is exposed to competition from substitutes.
An appraisal of PoM’s competitive pressures is a complex exercise, because the degree
of contestability differs both by cargo type and by destination. As demonstrated in Table
24, PoM’s liquid bulk, dry bulk and break bulk trades (which account for approximately
13% of total revenue tonnes) are all subject to some form of competition from other ports.
Container traffic is also subject to competition from a variety of Australian ports
(Adelaide and Botany for imports, Botany and Adelaide for exports, and both Station
Pier and direct calls for the Tasmanian trade).
These competitive pressures are not mitigated by any element of PoM’s regulatory
regime. In fact, as explored below, the nature of the regime is more likely to amplify risk
than reduce it.
187 This would necessitate being able to have two samples, where the firms in the samples are largely identical other than
for the relevant factor.

DETERMINING A WACC ESTIMATE FOR PORT OF MELBOURNE Page 155 of 296
Table 24 Competitive pressures by cargo type
Cargo type Revenue contribution (FY 18)
Competitive pressures
Containers (TEU) 2.93 million TEU
Approximately 80% of revenue
Riverina originated containers represent approximately 4% of revenue
Tasmania trade represents approximately 8% of revenue (includes wheeled unitised cargo but not dry and liquid bulk)
We have documented in previous submissions that PoM has lost import container trade to Adelaide. There is also contested trade between PoM and Port Botany.
In addition, only 54% of containers exported through PoM originate from Melbourne. This suggests that there is competition between ports for export containers. There is particularly intense competition with Port Botany for containerised exports originating from the Riverina and surrounds, which accounts for approximately 6% of PoM’s volumes. This includes some Riverina trade that PoM handled in FY18 (approx. 35000 TEU or 1% of revenue), which has since been lost to Port Botany. PoM also competes with Port Adelaide for exports of containerised agricultural commodities (mainly grain and stock feed) originating from the Mt Gambier region.
However, the largest element of the container trade subject to competition is in relation to the Tasmanian trade. There are 3 coastal shipping operators between Tasmania and the mainland. The Spirit of Tasmania from Station Pier in Melbourne and carries freight in competition with the other carriers who operate out of the PoM, providing direct port on port competition. Additionally, competition to PoM arises from direct calls from international vessels. These vessel calls enable direct imports into and exports from Tasmania, bypassing PoM. They also provide the opportunity for coastal shipping from Tasmania to other Australian destinations (particularly Sydney). Continued growth in the Tasmanian trade increases scope for direct calls to Tasmanian ports.
Motor vehicles 7.4 million revenue tonnes
Approximately 8% of revenue
The closure of major Australian car manufacturers has had a major impact on motor vehicle exports. Exports decreased 49.3% following the closure of Toyota’s Altona manufacturing plant in October 2017. New motor vehicle throughput fell 2.1% overall in 2017-18 and has continued to fall this financial year. This highlights PoM’s exposure to general economic conditions.
Moreover, the Port of Geelong is a potential competitor to the motor vehicle trade. Indeed, prior to privatisation, the State Government carefully examined a proposal to shift the motor vehicle trade to Geelong as an alternative to the reconfiguration of Webb Dock. Port of Geelong is well placed to establish a competing car import facility to PoM.
Liquid bulk 6.3 million revenue tonnes
Approximately 4% of total revenue
Liquid bulk faces competition from Geelong (import crude) and Hastings (refined products).
Dry bulk 5.0 million revenue tonnes
5% of total revenue
Dry bulk faces competition from Geelong (especially in regard to grain exports, cement, soda ash and fertiliser). A new clinker grinding and cement facility established at the Port of Geelong highlights the range of trades subject to competition for PoM.
Break bulk 1.1 million revenue tonnes
Approximately 1% of total revenue
Break bulk faces competition from Geelong and Hastings
TOTAL TRADE 94.1 million revenue tonnes
Source: Port of Melbourne
Modal substitution is limited. Domestically, there is limited competition from rail for
inter-city freight movements given the distances between cities and some inherent
inefficiencies in the freight rail network (lack of volume, conflict between passenger and
freight networks, different track configurations and double handling charges). There is

DETERMINING A WACC ESTIMATE FOR PORT OF MELBOURNE Page 156 of 296
strong road competition and limited rail competition for intercity freight movements.
Air services may compete for small time-sensitive freight, but generally, it is too small
and expensive for regular freight movements.
Income elasticity of demand for port services
The income elasticity of demand is relevant to this assessment given the relationship
between incomes (or GDP) and domestic economic activity. For PoM, the relationship is
considered strong as demand for port services is inextricably linked to demand for
freight goods.
PoM has indicated that demand for container imports is driven by:188
• population growth
• retail activity and consumer confidence
• building investment
• manufacturing industry growth.
Container exports are predominantly driven by local agricultural production and
manufacturing industry growth.
All of these factors have a direct correlation with GDP. Accordingly, PoM’s revenues
and earnings are significantly affected by levels of domestic economic activity.
Moreover, our analysis of PoM’s comparator set also indicates that this is a source of
differentiation from other listed port businesses. For example, the Port of Tauranga can
be considered more of export-driven infrastructure asset, and furthermore these exports
are concentrated in industries such as timber, which are likely to be less susceptible to
fluctuations in economic activity.
Exchange rate sensitivities
International trade will be sensitive to exchange rates. This is significant for beta as the
exchange rate will be correlated with domestic economic activity.
Market disruption risks
There is a range of market disruption risks for PoM – these risks have both systematic
and non-systematic elements:
188 Victorian Ports Corporation (Melbourne) (2016). Reference tariff schedule: Effective 1 July 2016, p.15.

DETERMINING A WACC ESTIMATE FOR PORT OF MELBOURNE Page 157 of 296
• Changes to globalisation
• Reduction in demand due to sharing economy (e.g. Uber) and the automation of
motor vehicles
• 3D printing
• Miniaturisation/Virtualisation
• Reduced manufacturing and exports (e.g. Ford, Toyota)
Broader trends in ports and shipping
Emerging trends within the global shipping industry have a bearing on PoM’s
competitive outlook as well. The introduction of increasingly larger container ships will
lead to increasing concentration in the shipping industry. Over the short to medium
term, this is likely to generate greater substitutability between PoM and its closest
competitors, such as Port Botany and, to a lesser extent, Port Adelaide.
However, in the medium to longer term, larger vessels present a significant threat to
PoM’ volumes on account of their impact on accelerating the establishment of a second
container port (either at Bay West or Hastings). For example, Swanston Dock is not
necessarily well located to accommodate larger vessels and the combination of growth
in vessel sizes and PoM’s configuration will place increasing pressures on the port’s
capacity to handle all container traffic currently handled by PoM. The creation of a
second container port would present a major threat to PoM.
Implications for beta
In general, port revenues can be expected to have a strong correlation with domestic
economic activity, driven by fundamentals such as:
• the income elasticity of demand for port services and freight goods
• the sensitivity of international shipping to changes in exchange rates
• the sensitivity of demand for freight transport to domestic GDP
• market disruptions
• broader trends in trade and shipping
Given PoM’s beta is being assessed relative to international comparators, consideration
needs to be given as to whether these demand characteristics are likely to be more or less
sensitive to domestic economic activity compared to other comparators (relative to their

DETERMINING A WACC ESTIMATE FOR PORT OF MELBOURNE Page 158 of 296
own domestic economies). Overall, we expect that the relationships described above
demonstrate an elevated risk profile for an international port and at least comparable
level of risk across the comparator set.
Pricing structure
Pricing structure refers to the extent to which the firm’s pricing arrangements either
mitigate or increase its exposure to systematic risk. For example, if a firm’s cost structure
comprises fixed and variable costs, an important consideration here will be the extent to
which prices have a fixed and variable component that reflect this cost structure.
At PoM, all fees are levied on a usage basis without long term contractual commitments
in place, which increases its risk profile. Of the major fees levied, the wharfage fee
(charged on a per unit quantity, volume or weight basis) underscores that PoM’s
revenues are significantly affected by levels of economic activity.
Overall, the pricing structure significantly exposes the port to systematic volume risk,
although this risk is characteristic of ports globally and is very unlikely to change during
the term of the lease.
Impact of the TAL
The risks described above appear to be exacerbated by the nature of the Tariff
Adjustment Limit (TAL), which applies a CPI cap to tariffs until at least 2032 (and 2037
at the latest). This structure of the TAL “back-ends” capital recovery. Consequently,
much of the Port Licence Holder’s return on investment is deferred to a point in time
when competitive pressures will be most elevated, especially with the likely prospect of
a second Melbourne port. This is a key source of differentiation from other regulated
infrastructure assets in Australia, especially utilities, which resemble a poor comparison
to PoM’s systematic risk exposure.
Market power
The existence of market power will have a mitigating effect on systematic risk. This
assumes that where a firm possesses market power, it is able to exercise that power to
its advantage. This in turn is a function of considerations such as the degree of market
power held (which in turn will depend on the availability of substitute port facilities of
appropriate size and scale), the number of buyers in the market and the extent to which
those buyers can exert countervailing power in negotiations.
PoM currently has market power in some of its trades in relation to particularly the
Melbourne catchment. However, there is clear evidence of contestability that further
constrains PoM’s market power. Even within the limited geographic region where

DETERMINING A WACC ESTIMATE FOR PORT OF MELBOURNE Page 159 of 296
PoM’s market power is most relevant, that market power is not without constraints. For
example, PoM suffers from an inability to price discriminate, which means that the
benefits of price competition to capture marginal trades are transmitted across the entire
PoM customer base. The regulatory environment restricts the ability of PoM to exert
market power.
As presented above, there is clear evidence of contestability given that PoM has lost trade
to Adelaide (import containers), Geelong (breakbulk) and Port Botany (agricultural
exports). Moreover, PoM competes with Geelong in relation to import crude and refined
oil, breakbulk cargo, bulk grain exports, dry bulk import (cement, soda ash and fertiliser)
and Station Pier (Tasmania trade). Nevertheless, a significant proportion of PoM’s
volumes are not contestable, with 87% and 54% of imported and exported containers,
respectively, destined for or originating from the Melbourne metropolitan region.189
Moreover, there is clearly the prospect of competition in the form of the development of
a second port serving Melbourne. In this respect, PoM is unique – there is no other
Australian port that is subject to the threat of an entrant as part of a deliberate
Government strategy to develop a new facility.
Prospect of second Melbourne port
The prospect of the second port in the Melbourne region clearly constrains PoM’s market
power. Whilst it is true that the development of a second port is not currently imminent,
the prospect of a second port brings substitution risk as well as potentially providing
PoM’s counterparties (shipping, logistics, and, to a certain extent, stevedoring
companies) more countervailing power in negotiations.
Moreover, there is clearly scope for the Victorian Government to accelerate the
development of a second port towards the second half of PoM’s lease period as the State
has the ability to bring forward the development of the second port without
compensation to PoM. The credible threat of a second port (the development of which
can be brought forward in time) is sufficient to impact the beta. Holding all other factors
constant, we consider this should be reflected in a higher value of beta relative to the
comparable companies.
In May 2017, Infrastructure Victoria recommended the construction of a new port for
Melbourne at Bay West.190 Infrastructure Victoria’s view is that the new port will not be
required until 2055, as PoM has a potential capacity of approximately 8 million TEU.
189 Port of Melbourne Corporation (2009). Port of Melbourne – Management Presentation, p.16.
190 Ackerman, I., “Go west says IV,” Lloyd’s List Australia, May 25, 2017.

DETERMINING A WACC ESTIMATE FOR PORT OF MELBOURNE Page 160 of 296
In response to last year’s report, the ESC contended that the 2055 timeframe is around
40 years into PoM’s 50 year lease, and as such the threat of competition was unlikely to
impact the rate of return. However, as an infrastructure owner, PoM must make
investment decisions across long-term horizons. Therefore, such a significant change in
the demand outlook even 40 years into the lease impacts on investment decisions today.
Moreover, the threat of a second port constrains PoM’s behaviour today, even though
there is only a threat of a second port. Market power only exists where there is an absence
of constraint on an incumbent’s conduct. To the extent that the threat of a State
Government investment in a competing port is credible (as clearly it is), it will magnify
the constraints that already exist on PoM. It can also impact the dynamics of negotiations
between PoM and counterparties, and in turn, systematic risk.
Mr Michael Masson, the chief executive of Infrastructure Victoria, has stated that the Bay
West port could handle overflow container capacity initially, but it would be well suited
to becoming Melbourne’s future container port in the long term. Planning for the port is
likely to begin 15 years before it is required to be operational. In short, it is possible for
the State to bring forward the development of the port if it perceives it to be in the public
interest to do so.
As such, given the current attention to the issue, there is no guarantee that the 2055
timeline will be maintained. Political considerations could see the implementation of the
second port occur even earlier, which presents considerable risk to PoM. In particular,
Infrastructure Victoria has noted that:191
Increasing capacity at Webb Dock to accept ships larger than around 7,500 TEU could
make it difficult for Swanson Dock’s capacity to be fully utilised due to its vessel size
restrictions. This may prematurely compromise the viability of Swanson Dock,
unnecessarily bringing forward the need to invest in additional capacity. This can be
managed through deliberate staging of infrastructure investments at Webb Dock as
well as upgrades to navigation infrastructure (channels and swing basins) and
changes to regulation of navigation.
Moreover, in one of its recommendations, Infrastructure Victoria highlights that further
urban development is likely to hinder capacity enhancement within the existing Port of
Melbourne footprint:192
Maintaining the Port’s social licence to operate is an important consideration if
capacity expansions are to be sustainably achieved. If the amenity impacts of port
191 Infrastructure Victoria (2017). Advice on securing Victoria’s ports capacity, p.16.
192 Infrastructure Victoria (2017), p.17.

DETERMINING A WACC ESTIMATE FOR PORT OF MELBOURNE Page 161 of 296
related freight services are not effectively managed, the Port of Melbourne may be
unable to reach its optimal capacity.
Infrastructure Victoria has recommended that the Victorian Government should
monitor key indicators relevant to all Victorian ports that impact planning and publish
a report every five years. This report will have the objective of identifying whether PoM
has the ability to meet demand for 15 years or more. In the meantime, Infrastructure
Victoria has recommended measures to optimise capacity at PoM, through
augmentations at Swanson and Webb Dock. Infrastructure Victoria has also
recommended that the Victorian Government should not enter into any arrangement
that restricts the ability to develop a second port after 2031:193
There is an initial 15 year period in the Port of Melbourne lease legislation where there
cannot be a second port built without compensation to the lessee. There is
considerable value in the State retaining the unfettered option under the current terms
of the Port of Melbourne lease legislation to develop a second container port after 15
years.
The ESC disagreed with our assertion that the Port Growth Regime provisions are a
significant barrier to the construction of a second port, and that their expiry after 15 years
increases the risk of competition. However, if the Port Growth Regime provisions are
not a significant barrier to the construction of a second port, then this would actually
seem to imply that PoM is indeed exposed to an even greater risk of competition.
Moreover, the 15 year period is actually very brief in the context of the planning and
investment decisions that need to be made for a second port to become operational.
These considerations make it clear that the Victorian Government can act relatively
quickly to develop a new port in the future. This will tend to increase the beta for PoM
compared to other Australian capital city ports when considering the investment’s 50
year lease horizon. It would put Melbourne in the unique position of being the only
capital city in Australia with a competing container port servicing a similar catchment
area (the closest example being in Sydney with the Port of Newcastle, which is very
unlikely to become a major container port) noting that Port Botany and Port Kembla are
under the same ownership).
This justifies a higher beta for the port relative to comparables that do not face this same
threat of competition.
193 Infrastructure Victoria (2017), p.18.

DETERMINING A WACC ESTIMATE FOR PORT OF MELBOURNE Page 162 of 296
Form of regulation
The effects of regulation on beta are unclear. In the first instance, regulatory risk is not
necessarily in itself systematic as it could be avoided through diversification. However,
the issue of relevance here is the extent to which regulation mitigates, or increases, PoM’s
exposure to systematic volume risk.
Regulation can reduce risk if it increases revenue certainty over a period. Conversely,
regulatory risk can be seen as a source of risk to the extent that there is uncertainty as to
how it will be applied and/or it reduces the firm’s ability to adjust prices in response to
changes in costs.
The general practice of Australian regulators is to assume that regulation reduces risk
and accordingly will have a dampening effect on beta. This comment is generally made
in the context of revenue caps having a dampening effect on beta relative to price cap
regimes.
However, this is unlikely to be the case for the PoM as it is effectively subject to a price
cap form of regulation rather than a revenue cap and this, together with the sensitivity
of trade to economic activity means that it is likely to have its revenues significantly
affected by levels of economic activity throughout the lease period. Moreover, PoM is
predominantly import-oriented, which means that its revenues are likely to correlate
with GDP. Apart from the modest impact of potentially rebalancing charges, PoM’s
regulatory regime does not provide any meaningful protection against volume risk.
Accordingly, there is no basis to conclude that the Pricing Order provides revenue
certainty (whether during or after the period in which the TAL is in place) or mitigates
exposure to systematic risk, particularly when comparing the port against comparables
that are either subject to more light handed price monitoring or are unregulated.
Moreover, PoM has not and is never likely to have long term take or pay contracts in
place which could mitigate the extent to which its revenues are affected by levels of
economic activity.194
Form of regulation for listed comparators
194 However, even ToP contracts only reduce variability during the contract period. Post contract, if the business is
exposed to volume risk i.e. price cap, then they will simply see a larger change in revenue once re-negotiating their contract. This has been the experience of Arc Infrastructure in Western Australia following the expiry of take or pay commitments.

DETERMINING A WACC ESTIMATE FOR PORT OF MELBOURNE Page 163 of 296
In response to the ESC’s recommendation that the first principles analysis should also
be extended to PoM’s listed comparator firms, we have undertaken a closer investigation
of the regulatory regimes under which PoM’s comparators operate.
Virtually all of the port owners and operators are subject to concession agreements that
set price caps or stipulate tariff charges. As documented above, we retain our view that
PoM’s regulatory regime does not have any dampening effect on beta. Aside from this,
the findings from our comparator set indicate that, even if regulation did cause beta to
be lower, holding all else equal, many of the listed comparators are themselves subject
to some form of price regulation. Consequently, this would suggest that no downward
adjustment to PoM’s empirical beta estimate would be warranted on the basis of this
first principles factor.
Growth options
Growth options refer to the potential to undertake significant new investment,
particularly in new areas or products. It is argued that businesses that have a number
of valuable growth opportunities in addition to their existing assets will tend to have
higher systematic risk compared to firms that have limited growth options.
In the case of PoM, it is likely to undertake a number of capital projects to maintain /
upgrade existing assets as well as expand the Port’s capacity to service Victoria’s
increasing freight demand. Synergies understands that examples of these include the
following:
• Upgrading rail network and other freight terminal facilities
• Developing new container and dry trade terminal capacity
• Undertaking investment to cater for larger container vessels
• Developing new liquid bulk capacity.
Operating leverage
A high degree of operating leverage will increase the volatility of a firm’s returns relative
to the market, which can increase its beta.
It is understood that most ports have a relatively high fixed cost base and this is the case
in relation to PoM due to the inherently capital intense nature of the business. However,
this is even more significant for the PoM - Synergies understands that PoM pays a port
licence fee (PLF) of approximately $85 million per annum and a cost contribution
amount (CCA) of approximately $16 million per annum. These fees are unrelated to
actual port services or costs and are calculated in accordance with the requirements of

DETERMINING A WACC ESTIMATE FOR PORT OF MELBOURNE Page 164 of 296
the PMA and the Port Concession Deed. As fixed costs, these obligations add to
operating leverage.
Leaving aside the very significant impact of the port licence fee, PoM’s operating
leverage may be similar to comparator ports in this regard. However, it could be a
distinguishing feature compared to, say, stevedoring services, as they are likely to have
lower operating leverage. This means that holding all else constant, this would increase
PoM’s beta relative to those firms. A second port will materially exacerbate the impact
of operating leverage on PoM’s cash flow volatility.
8.2.6 Conclusion: asset beta for PoM
In conclusion:
• the empirical evidence appears to directly support an asset beta estimate of at least
0.7 and an upper bound of at least 0.75. The question is whether there are any factors
from the first principles analysis that suggest that PoM’s systematic risk is different
from the average of the sample;
• in this regard, the key differentiator is the prospect of competition from a second
port, which increases PoM’s exposure to trade flows reflecting domestic and
international economic conditions;
• an asset beta of 0.7 is consistent with the most recent regulatory review of a similar
freight business in Australia, Arc Infrastructure, which on a first principles basis,
could be expected to have lower systematic risk than PoM.195
Overall, we consider that an asset beta value of 0.7 is a reasonable estimate and that an
upper bound estimate of asset beta of 0.75 is justified from the analysis.
8.3 Estimating the return on equity using the SL CAPM
8.3.1 Post-tax return on equity
Synergies’ SL post-tax CAPM estimate and its underlying input parameter values are
presented in Table 25 (assuming a gamma of 0.25 which we address in Chapter 12 of our
report).
195 ERA (2017). Determination on the 2017 weighted average cost of capital for the freight and urban rail networks, and
for Pilbara railways, 6 October.

DETERMINING A WACC ESTIMATE FOR PORT OF MELBOURNE Page 165 of 296
Table 25 SL CAPM post-tax cost of equity range
Parameter Lower range Point estimate Upper range
Risk-free rate 1.96% 1.96% 1.96%
Gearing 30% 30% 30%
Asset beta 0.7 0.7 0.75
Equity beta 1.0 1.0 1.07
MRP 7.34% 7.77% 7.77%
SL CAPM 9.30% 9.73% 10.28%
Source: Synergies
8.3.2 Pre-tax return on equity
Given the Pricing Order requires that the WACC estimate be expressed in pre-tax
nominal terms, the following formula grosses up the post-tax Re for gamma-adjusted
corporate tax to generate a pre-tax Re:
Pre-tax Re = Post-tax Re / (1 – t * (1 - ))
Where
t = corporate tax rate = 0.3
= gamma (refer Chapter 12 of our report)
Substituting the parameter values into the above formula:
Table 26 Pre-tax return on equity range
Estimate Lower range Point estimate Upper range
Pre-tax return on equity = 9.30% / (1-0.3*(1-0.25))
= 9.30% / 0.775
= 12.00%
= 9.73% / (1-0.3*(1-0.25))
= 9.73% / 0.775
= 12.55%
= 10.28% / (1-0.3*(1-0.25))
= 10.28% / 0.775
= 13.27%
Source: Synergies
8.3.3 SL CAPM estimate
Our point estimate of the pre-tax return on equity for the benchmark port entity based
on the SL CAPM is 12.55% from a range of 12.00% to 13.27%.

DETERMINING A WACC ESTIMATE FOR PORT OF MELBOURNE Page 166 of 296
9 Estimating the return on equity using the Black CAPM
Chapter overview
2019-20 submission
2018-19 submission
Comments
Point estimate: 12.55% (from range of 12.00%-12.96%)
13.48% Our methodology for calculating the return on equity using the Black CAPM is unchanged. The pre-tax return on equity from the Black CAPM is identical to that based on the SL CAPM. This is due to PoM’s assumed equity beta of 1.00, at which point the two models provide equal estimates. We have generated an updated estimate of the zero-beta premium, which at 3.36% is very similar to the SFG (2014) estimate of 3.34%. The value of zero-beta premium does not affect the return on equity when the equity beta is 1.00.
9.1 Post-tax return on equity
SFG estimated the zero-beta premium to be 3.34% in 2014. Synergies has generated an
updated estimate of the zero-beta premium using a dataset that extends to the end of
2018. The updated zero-beta premium estimate is 3.36%. The zero-beta return is the sum
of risk-free rate and the zero-beta premium. Hence, our SL CAPM estimate can be
combined with this zero-beta premium to estimate the Black CAPM return on equity
using the following formula:
Re = Rz + e * [E(Rm) – Rz]
Where
Rz = risk-free rate plus zero beta premium
e = beta
E(Rm) = market return
Parameter values:
Zero beta premium = 3.36% (updated Synergies estimate using data to 2018)
Risk-free rate = 1.96% (refer Chapter 7 of our report)
Market return = 9.30% - 9.73% (risk-free rate of 1.96% plus MRP of 7.34%-7.77% from Chapter 7)
Equity beta of 1.00-1.07 (refer Chapter 8 of our report)
Substituting the parameter values into the Black CAPM formula:
Table 27 Post-tax return on equity range
Estimate Lower range Point estimate Upper range
Post-tax return on equity = (1.96% + 3.36%) + 1.00*(7.34% - 3.36%)
= 5.32% + 3.98%
= (1.96% + 3.36%) + 1.00*(7.77% - 3.36%)
= 5.32% + 4.41%
= (1.96% + 3.36%) + 1.07*(7.77% - 3.36%)
= 5.32% + 4.72%

DETERMINING A WACC ESTIMATE FOR PORT OF MELBOURNE Page 167 of 296
Estimate Lower range Point estimate Upper range
= 9.30% = 9.73% = 10.04%
Source: Synergies
9.2 Pre-tax return on equity
Given the Pricing Order requires that the WACC estimate be expressed in pre-tax
nominal terms, the following formula grosses up the post-tax Re for gamma-adjusted
corporate tax to generate a pre-tax Re:
Pre-tax Re = Post tax Re / (1 – t * (1 - ))
Where
t = corporate tax rate = 0.3
= gamma = 0.25 (refer Chapter 12 of our report)
Substituting the parameter values into the above formula:
Table 28 Pre-tax return on equity range
Estimate Lower range Point estimate Upper range
Pre-tax return on equity = 9.30% / (1-0.3*(1-0.25))
= 9.30% / 0.775
= 12.00%
= 9.73% / (1-0.3*(1-0.25))
= 9.73% / 0.775
= 12.55%
= 10.04% / (1-0.3*(1-0.25))
= 10.04% / 0.775
= 12.96%
Source: Synergies
9.3 Black CAPM estimate
Our point estimate of the pre-tax return on equity for the benchmark port entity based
on the Black CAPM is 12.55% from a range of 12.00% to 12.96%. The upper range
estimate is lower than the corresponding SL CAPM upper range estimate (13.27%) due
to the equity beta being above 1.00.
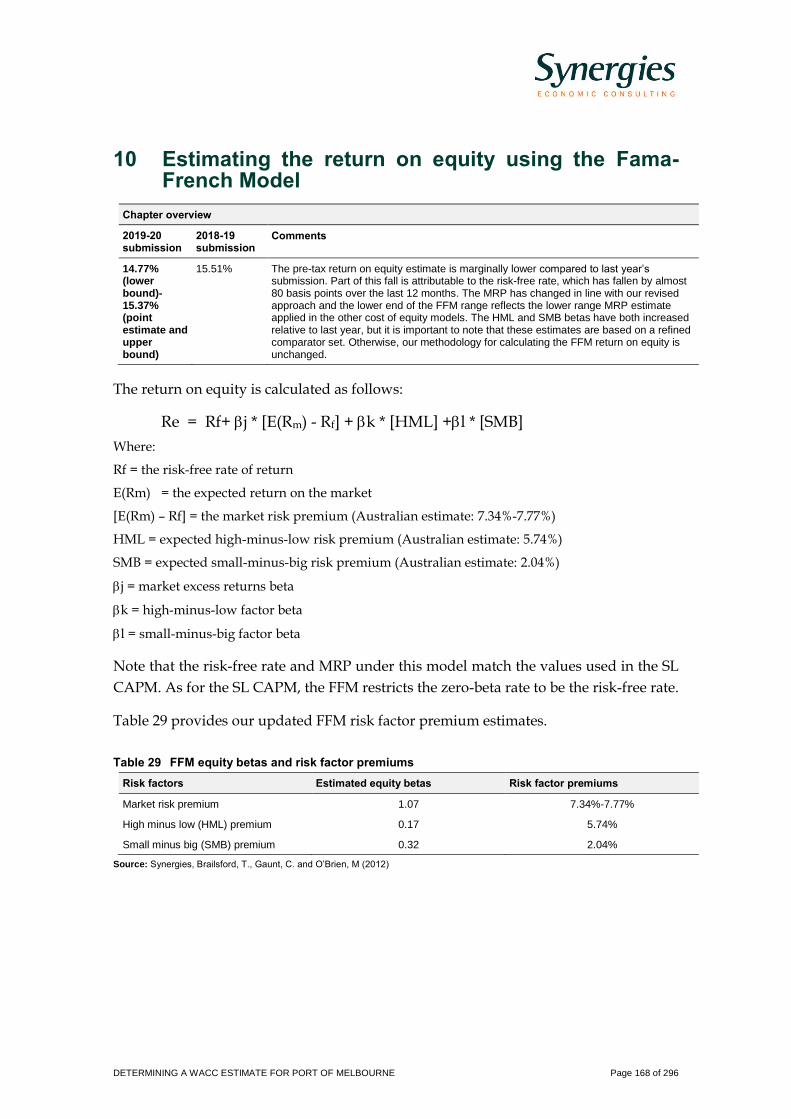
DETERMINING A WACC ESTIMATE FOR PORT OF MELBOURNE Page 168 of 296
10 Estimating the return on equity using the Fama-French Model
Chapter overview
2019-20 submission
2018-19 submission
Comments
14.77% (lower bound)-15.37% (point estimate and upper bound)
15.51% The pre-tax return on equity estimate is marginally lower compared to last year’s submission. Part of this fall is attributable to the risk-free rate, which has fallen by almost 80 basis points over the last 12 months. The MRP has changed in line with our revised approach and the lower end of the FFM range reflects the lower range MRP estimate applied in the other cost of equity models. The HML and SMB betas have both increased relative to last year, but it is important to note that these estimates are based on a refined comparator set. Otherwise, our methodology for calculating the FFM return on equity is unchanged.
The return on equity is calculated as follows:
Re = Rf+ j * [E(Rm) - Rf] + k * [HML] +l * [SMB]
Where:
Rf = the risk-free rate of return
E(Rm) = the expected return on the market
[E(Rm) – Rf] = the market risk premium (Australian estimate: 7.34%-7.77%)
HML = expected high-minus-low risk premium (Australian estimate: 5.74%)
SMB = expected small-minus-big risk premium (Australian estimate: 2.04%)
j = market excess returns beta
k = high-minus-low factor beta
l = small-minus-big factor beta
Note that the risk-free rate and MRP under this model match the values used in the SL
CAPM. As for the SL CAPM, the FFM restricts the zero-beta rate to be the risk-free rate.
Table 29 provides our updated FFM risk factor premium estimates.
Table 29 FFM equity betas and risk factor premiums
Risk factors Estimated equity betas Risk factor premiums
Market risk premium 1.07 7.34%-7.77%
High minus low (HML) premium 0.17 5.74%
Small minus big (SMB) premium 0.32 2.04%
Source: Synergies, Brailsford, T., Gaunt, C. and O’Brien, M (2012)

DETERMINING A WACC ESTIMATE FOR PORT OF MELBOURNE Page 169 of 296
10.1 Post-tax return on equity
As noted in the preceding section, the post-tax FFM formula is as follows
Re = Rf+ j * [E(Rm) - Rf] + k * [HML] +l * [SMB]
Substituting the parameter values into the FFM formula as follows:
Rf = 1.96%
j = 1.07
[E(Rm) - Rf] = 7.34%-7.77%
k = 0.17
[HML] = 5.74%
l = 0.32
[SMB] = 2.04%
Post-tax Re = 1.96% + ((1.07 * 7.77%) + (0.17 * 5.74%) + (0.32* 2.04%))
Post-tax FFM Re = 11.91% (11.45% with a lower range MRP of 7.34%)
10.2 Pre-tax return on equity
Given the Pricing Order requires that the WACC estimate be expressed in pre-tax
nominal terms, the following formula grosses up the post-tax Re for gamma-adjusted
corporate tax to generate a pre-tax Re:
Pre-tax Re = Post tax Re / (1 – t * (1 - ))
Where
t = corporate tax rate = 0.3
= gamma = 0.25 (refer Chapter 12 of our report)
Substituting the parameter values into the above formula:
Pre-tax Re = 11.91% / (1 – (0.3 * (1 - 0.25))
Re = 11.91% / 0.775
Pre-tax FFM Re = 15.37% (14.77% with a lower range MRP of 7.34%)
DETERMINING A WACC ESTIMATE FOR PORT OF MELBOURNE Page 170 of 296
10.3 FFM estimate
Our point estimate of the pre-tax return on equity based on the FFM is 15.37% with a
lower range of 14.77% when the lower range MRP estimate is applied. This is higher
than the SL CAPM and Black CAPM estimates, reflecting the incorporation of two
additional risk factors that, along with systematic overall market risk, explain investors’
expected return on equity for the benchmark port entity.

DETERMINING A WACC ESTIMATE FOR PORT OF MELBOURNE Page 171 of 296
11 Estimating the return on debt
Chapter overview
2019-20 submission
2018-19 submission
Comments
Risk-free rate: 1.96%
DRP: 3.18%
Debt raising costs: 0.10%
Return on debt: 5.24%
Risk-free rate: 2.74%
DRP: 2.53%
Debt raising costs: 0.10%
Return on debt: 5.37%
The risk-free rate has again been calculated as a 20-day average on 10-year Australian Government bond yields, an approach frequently adopted by economic regulators.
The return on debt continues to be calculated using a trailing average methodology. For the 2019-20 estimate, an 80% weighting is placed on the initial 2017 on-the-day estimate, a 10% weighting on the 2018 on-the day estimate, and a 10% weighting on the 2019 on-the-day estimate. Each year, 10% of the weighting on the 2017 on-the-day estimate will be refreshed with the prevailing on-the day estimate for the given year. As we document in this chapter, support among regulators for the trailing average methodology remains strong, and in fact appears to have increased somewhat since last year’s report. Our position on debt raising costs is unchanged.
11.1 Introduction and background
The Pricing Order provides no guidance regarding estimation of the return on debt
beyond it being one or a combination of well-accepted approaches. Furthermore, the
ESC has not made specific reference to our chosen methodology in any of its
commentary. In simple terms, the return on debt calculation is the sum of the risk-free
rate and an estimate of the debt risk premium consistent with the risk profile of the
benchmark efficient port entity.
This approach is well-accepted in financial markets and by economic regulators in
Australia and internationally, underpinned by the concept of credit spreads reflecting
credit and liquidity risks associated with government and corporate bonds. A credit
spread is the difference in yield (return to the investor) between two bonds of similar
maturity but with different credit quality due to the different underlying risks associated
with each bond. The difference in yields between a long-term government bond
(assumed to be the risk-free rate) and an equivalent term corporate bond is an example
of the credit spread concept.
The return on debt calculation can be expressed as follows:
Rd = Rf + DRP + DRC
Where:
Rf = risk-free rate
DRP = debt risk premium
DRC = debt raising costs
An allowance for debt raising costs could be included in the cashflows of the benchmark
entity as an opex item rather than included in the Rd formula.

DETERMINING A WACC ESTIMATE FOR PORT OF MELBOURNE Page 172 of 296
In applying the above return on debt formula, there are several underlying assumptions
that are required including in regards to:
• risk-free rate
• notional credit rating assumption
• term to maturity
• debt management approach
• method used to estimate the debt risk premium (DRP)
• assumed debt raising costs.
Each of these parameters is estimated in the sections below after we have summarised
well-accepted methodologies regarding estimation of the return on debt.
11.1.1 Implications of ESC commentary for return on debt
The ESC noted in its interim commentary that it has not examined all elements of PoM’s
WACC in detail. In regard to the trailing average methodology, the ESC’s expectation
was that, “having now adopted such an approach, the port would not revert to the on-
the-day approach.”196 This is indeed the case, with our approach for the 2019-20 WACC
estimate being a continuation of the trailing average adopted last year.
This year, the trailing average calculation places an 80% weighting on the 2017 return on
debt estimate, a 10% weighting on the 2018 return on debt estimate, and a 10% weighting
on the 2019 return on debt estimate. With each subsequent year, 10% of the 2017
weighting will be refreshed with the prevailing return on debt estimate.
This approach is being adopted on the basis of its stability (ie lower volatility over time),
and because it is more consistent with the debt management practices of a benchmark
efficient entity. It is also in line with our approach to other WACC parameters, which,
where possible, are based on long-term averages. This methodology is also consistent
with the approach currently in use by the AER.
Our methodology for calculating the 2019 on-the-day estimate used in the trailing
average calculation is unchanged from last year’s submission.
196 Interim commentary, p.13.

DETERMINING A WACC ESTIMATE FOR PORT OF MELBOURNE Page 173 of 296
11.2 Well-accepted methodologies
Given the CAPM is intended to reflect expectations as of the day of analysis, it is
theoretically correct to base the risk-free rate on the prevailing yield on the date of the
valuation. This means that the return on debt is based on prevailing rates, set over a very
short averaging period prior to the point at which prices are reset. It then remains fixed
during the regulatory period, with the regulated business managing the risk of interest
rate movements.
However, problems may occur if there is a spike in yields on-the-day that the rate is
applied. It is therefore now common regulatory practice to average the rate over a short
horizon, which typically ranges from between ten and forty days, noting that over such
a short horizon the choice of averaging period is likely to be of little consequence. The
Independent Pricing and Regulatory Tribunal (IPART) in NSW is the only Australian
regulator that has looked at longer term averages, which it does in conjunction with
short term estimates.
Until relatively recently, Australian regulators always applied an ‘on-the-day’ approach
to estimate the return on debt. The ACCC is the most recent example, which presented
an ‘on-the-day’ return on debt calculation in its December 2018 IAU Draft Decision.
Other economic regulators have now accepted the trailing average approach, including
the ESC in regard to Melbourne Water, which allowed an immediate transition but based
on a data series that excluded the ‘GFC years’ (2008-09 to 2012-13). This approach
emanates from the recognition that in practice, a more efficient debt management
strategy may be to maintain a staggered debt maturity profile and progressively
refinance debt through time. This in turn means that the return on debt set in the WACC
will therefore reflect the cost at which debt was raised or refinanced historically,
resulting in a return on debt that reflects historical rates. The trailing average approach
involves ‘averaging in’ a portion of the prevailing return on debt each year.
The ERA has also accepted the trailing average approach in recent gas network
decisions,197 although based on a ‘hybrid’ approach, allowing an immediate transition
for the DRP and a ten-year transition for the base rate.198
197 Refer: ATCO Gas Australia, Dampier to Bunbury Pipeline.
198 The rationale for this is that the benchmark efficient entity can use swap transactions to hedge the base rate component of its return on debt at each regulatory reset. However, it cannot similarly hedge the DRP.

DETERMINING A WACC ESTIMATE FOR PORT OF MELBOURNE Page 174 of 296
In its recent decision for SA Water, the Essential Services Commission of South Australia
(ESCOSA), determined that it will immediately transition to this approach in the first
year of its new regulatory control period.199
The AER has also now transitioned to a trailing average approach as explained in its
Rate of Return Guideline.200 The 2012 rule changes made by the AEMC allowed for the
return on debt to be estimated based on one of: the trailing average approach; the current
on-the-day approach; or a hybrid of the two. In its 2013 Rate of Return Guideline, the
AER determined that its preferred approach is the trailing average. It has employed a
simple averaging approach, which means that each year, one-tenth of the prevailing ten-
year bond yield would be ‘averaged in’ to the return on debt estimate.201 This means that
the regulated return on debt, and hence tariffs, will vary throughout the period.202 The
AER also determined that this must be implemented over a ten-year transition period.203
The only Australian regulator that has explicitly rejected the trailing average approach
is the Queensland Competition Authority (QCA). However, the QCA’s stance towards
the trailing average appears to have become more favourable in the UT5 Final Decision
for Aurizon:204
The QCA is open to considering alternative regulatory benchmarking debt
management approaches (for example a trailing average approach) in future
assessments.
It is also informative to consider evidence from regulators overseas in regard to how
they determine the appropriate cost of debt. A number of regulators adopt a trailing
average methodology.
The NZCC has previously used a prevailing average (i.e., an on the day approach).
However, in its 2016 Input Methodologies Review, the NZCC announced that it would
199 ESCOSA (2016). SA Water Regulatory Determination 2016, Final determination, June. In making this conclusion,
ESCOSA noted that over the previous ten years, there would have been an immaterial difference had there been a gradual transition to the trailing average compared to the on-the-day approach.
200 AER (2013a), p.28.
201 We would consider that a more effective approach would be to adjust the changes in the benchmark debt balance, as this recognises the lumpy capital expenditure profiles that are typical of regulated businesses, that is, in a year when capital expenditure is high, more weight would be given to the prevailing return on debt in that year.
202 Alternatively, they could be adjusted via a ‘true up’ mechanism at the end.
203 This is seen as particularly relevant at the current time given the recent contraction in debt margins, that is, the estimate that would be produced using the ‘on-the-day’ approach would be lower than the trailing average, which would reflect the significant expansion in debt margins following the global financial crisis.
204 Queensland Competition Authority (2018). Aurizon Network’s 2017 draft access undertaking, Decision, December, p.77.

DETERMINING A WACC ESTIMATE FOR PORT OF MELBOURNE Page 175 of 296
move to a five-year historical averaging approach for the debt premium. This change
applies only to the debt premium, and a prevailing average will be retained for the risk-
free rate. In explaining this change of methodology, the NZCC observed that:205
Firms can be exposed to any difference between the debt premium paid at the time
they issue debt and the debt premium determined during the averaging window
prior to the setting of the WACC.
Whereas in Australia most regulators employ data from Bloomberg and/or the RBA, the
NZCC constructs a pool of publicly traded corporate bonds that are comparable to the
regulated entity in question. The NZCC allows for debt issuance costs of 0.20%.
In the UK, Ofgem bases its cost of debt on Markit iBoxx Non-Financial corporate bond
market indices, and applies a 10 year trailing average. The Competition and Markets
Authority has regard to evidence from yields and spreads on sterling-denominated
corporate bonds issued by energy firms in the UK, along with evidence from spreads on
UK corporate bonds more generally.
11.2.1 Synergies’ assessment
The application of a long-term trailing average approach is more likely to approximate
the debt management practices of an entity that has been subject to deterministic price
regulation for a long period, but this does not invalidate the application of the on-the-
day approach. This is because a regulated entity could choose to adopt a debt
management practice that reflects the on-the-day approach.
Indeed, the Australian energy regulatory framework recognises that the return on debt
can be estimated based on either the on-the-day approach or the trailing average
approach or a hybrid of the two. This is left to the discretion of the regulated entity
notwithstanding the AER’s current preference for the trailing average approach.
In the context of the benchmark port entity, we consider that the choice between these
approaches should reflect the preferences of the Port Licence Holder. This is because a
return on debt for a benchmark efficient entity can be estimated under both the on-the-
day and trailing average approaches. Consequently, this year we have continued the
transition to a trailing average approach, placing an 80% weighting on the 2017 return
on debt estimate, and a 10% weighting on the 2018 return on debt estimate and a 10%
weighting on the 2019 return on debt estimate.
205 New Zealand Commerce Commission. (2016). Input methodologies review decisions – Topic paper 4: Cost of capital
issues, 20 December, para. 138.

DETERMINING A WACC ESTIMATE FOR PORT OF MELBOURNE Page 176 of 296
11.3 Risk-free rate
As noted in Chapter 7, we have applied an updated estimate of the risk-free rate based
on a twenty-day average of the ten-year Commonwealth Government bond yield as at
29 March 2019.
The resulting estimate is 1.96 per cent (annual effective).
11.4 Notional credit rating assumption
A common starting point for the notional credit rating assumption is BBB, or minimum
investment grade. The most common notional credit rating assumption applied to
regulated entities in Australia is either BBB or BBB+.
It is noted that in practice, this distinction often has no practical consequence given most
regulators have estimated the BBB/BBB+ DRP from the broader BBB corporate bond
category, which reflects BBB-, BBB+ and BBB bonds.206
It is also appropriate that the credit rating assumption used for the DRP should be
consistent with the gearing assumption.
In Australian regulatory practice, the adoption of an investment grade credit rating for
an efficient benchmark entity has not been contentious.
11.5 Term to maturity
Consistent with our risk-free rate calculation for the return on equity, we have assumed
a ten-year term to maturity for BBB bonds, the longest available tenor (with appropriate
liquidity) in an Australian context.
There are currently two robust data series available with the relevant bond yield
information, Reserve Bank of Australia (RBA) and Bloomberg. These series are discussed
further in Section 11.7 below.
11.6 Debt management approach
The options that have been adopted by Australian regulators are as follows:
• Risk-free rate based on the 10-year Commonwealth bond yield plus debt margin
calculated using the prevailing cost of funds based on a short averaging period close
to commencement of the regulatory period.
206 The exceptions to this are the QCA and the ERA, who both employ their own ‘bespoke’ in house approaches to
estimate the DRP.
DETERMINING A WACC ESTIMATE FOR PORT OF MELBOURNE Page 177 of 296
• Risk-free rate based on the 10-year Commonwealth bond yield plus debt margin
calculated using a moving 10-year historical trailing average.
• Some form of hybrid approach, which is based on a 10-year rolling average of the
debt risk premium on 10-year corporate bonds added to the 5-year swap rate
prevailing close to commencement of (first) regulatory period.
The issue of the best approach to estimating the return on debt is likely to be determined
by the debt management strategies of many regulated entities subject to deterministic
price setting arrangements. The BEE test does not undermine this approach – rather, the
question is what the cost of debt would be for the BEE given its debt management
approach so long as it is consistent with an outcome that what would be expected in a
workably competitive market, which will be the case across a range of debt management
strategies on account of the efficiency of debt markets.
In the case of the benchmark port entity, similar to last year, we consider that a trailing
average approach to estimating the return on debt is appropriate, as this methodology
is more reflective of the debt management practices of a benchmark efficient entity.
The remainder of this chapter outlines how we have calculated the 2019 on-the-day
return on debt estimate, before detailing how we have weighted this estimate in our
trailing average calculation.
11.7 Debt risk premium (DRP)
The DRP is estimated based on the difference between the yield on ten-year BBB
corporate bonds and the risk-free rate (averaged over the same twenty-day period).
The key issue is the data source and methodology used to estimate the ten-year BBB
corporate bond yield. The majority of Australian regulators use an independent third
party data source, being either Bloomberg’s BVAL series or the RBA’s bond yields for
non-financial corporates, with the exception of the QCA and ERA. The latter employ
their own in-house methodology that applies an econometric approach. In the case of
the QCA, in applying discretion to reach its final WACC for Aurizon Network, it relied
on an average of RBA and Bloomberg data as partial justification for applying an uplift
to its “bottom-up” WACC assessment. Reliance on RBA/Bloomberg data resulted in a
return on debt that was approximately 20 basis points higher.
We continue to hold the view that the use of an independent third party data sources
that are reputable and robust represents a well-accepted approach.
In its October 2015 decision for Telstra, as well as its April 2017 decision for the ARTC
Hunter Valley Access Undertaking (HVAU), the ACCC applied an average of

DETERMINING A WACC ESTIMATE FOR PORT OF MELBOURNE Page 178 of 296
Bloomberg and RBA estimates. Synergies adopted the same approach for the ARTC
Interstate Access Undertaking. In response, the ACCC considered that this approach to
calculating the DRP was appropriate.207
As we elaborate below, the AER will now apply an average of three third-party data
sources (RBA, Bloomberg and now Thomson Reuters) under its new Rate of Return
Instrument. Our initial assessment of this change in approach is that it is unlikely to lead
to materially different return on debt estimates.
11.7.1 RBA series
There are two issues that need to be addressed in the use of the RBA’s data:
• single day end of month estimate: as the estimates are currently only produced on the
last day of each month, there is a risk that this day was ‘atypical’ or influenced by a
one-off event or perturbation in the market. This can be addressed by taking an
average of the most recent three month-ends (January, February and March), which
has been done previously by the AER208;
• average tenor less than ten years: as noted above, to the extent that the ‘ten year’
estimate reflects an average bond tenor of less than ten years, it is not a ten year
estimate. Accordingly, it should be extrapolated to a ten-year estimate. We have
done this by using all of the RBA’s data (i.e. the three, five, seven and ten-year
estimates) to approximate the slope of the RBA’s yield curve.
11.7.2 Bloomberg BVAL Curves
Bloomberg provides estimates of BBB-rated Australian corporations under its
Bloomberg Valuation service, also referred to as ‘BVAL’. The BVAL curves use a
proprietary algorithm to derive bond prices which are then used to construct a yield
curve. The inputs to the BVAL models include direct observations of bond prices
through trading and historical tracking of the bond compared to comparable firms if
there is thin data available for the given security. Another method used to address thin
trading is that the data can be supplemented using the historical correlation of price
movements with observed comparable bonds.
207 ACCC (2018). Draft decision. p.133
208 AER (2014a). Ausgrid, Endeavour Energy, Essential Energy, ActewAGL, Transitional Distribution Determination, 2014-15, April; AER (2014b). Transgrid, Transend, Transitional Transmission Determination, 2014-15, March.
DETERMINING A WACC ESTIMATE FOR PORT OF MELBOURNE Page 179 of 296
11.7.3 Other sources of third-party evidence on the DRP
In its 2018 Rate of Return Guideline review, the AER considered the merits of
incorporating data from Thomson Reuters and S&P Global in its return on debt estimate.
The AER opted to include Thomson Reuters data, but chose not to rely on data from S&P
Global for the purpose of its current instrument.
For the purpose of our update, we have not used Thomson Reuters data to inform the
return on debt estimate for PoM. As demonstrated by the AER’s analysis, the difference
in estimated yields with and without the Thomson Reuters data is virtually
indistinguishable. It is difficult to ascertain whether this tendency will persist in the
future, but our assessment is that its omission or inclusion is unlikely to have any
systematic or material impact on the estimate.
11.8 Debt raising costs
The debt risk premium reflects a premium for credit and liquidity risk. However, it does
not include any allowance for the actual costs of raising debt. In practice, an efficient
benchmark port entity will incur transaction and administration costs in raising and
managing its debt.
11.8.1 Regulatory precedent
PwC has undertaken market research of Australian debt raising transaction costs, which
have been applied in an Australian energy economic regulation context.209 Incenta have
subsequently applied PwC’s findings in recent energy regulatory processes. PWC’s
study built on earlier work undertaken by Allen Consulting Group.210 We regard this
collective body of work prepared in an Australian regulatory context to provide the most
authoritative evidence of debt raising costs for Australian corporates based on surveys
and interviews with legal firms, banks and credit rating agencies that are involved in the
corporate bond raising process.
PWC noted that during the past decade a benchmark of 12.5 basis points per annum
(bppa), representing direct costs of debt raising, was developed and applied by several
Australian regulators. However, from 2004 the AER applied a methodology based on
empirical observations of direct debt raising costs, which resulted in lower benchmark
209 PwC (2013).
210 Allen Consulting Group (2004). Debt and equity raising transaction costs, Final report, December.

DETERMINING A WACC ESTIMATE FOR PORT OF MELBOURNE Page 180 of 296
values in the range of 8 to 10 bppa depending on the size of the regulated network
business.211
PwC’s breakdown of direct debt transaction costs are as follows:
• Legal counsel – Master program – legal costs for the preparation of a Master
Program, which becomes the base document for multiple issuances over 10 years;
• Legal counsel – Issuer’s – legal fees for the preparation of documents under the
Master Program;
• Credit rating agency – Initial credit rating – a fee to establish the credit rating;
• Credit rating agency – Annual surveillance – a rating agency fee for the maintenance
of the credit rating each year;
• Credit rating agency – Up front bond issue – a fee charged by the rating agency
when a new bond is issued;
• Registrar – Up front – an initial set-up fee charged by a bond registry organisation;
• Registrar – Annual – the annual fee charged by the registry service; and
• Investment bank’s out-of-pocket expenses – the fees charged by the agents of a bank
for travel, accommodation, venue hire, printing etc.
We consider this full list is relevant for the total benchmark transaction costs that would
be prudently incurred by the BEE required to re-finance the debt component of the
Prescribed Services Asset Base over each regulatory period. Using the above cost
components, PwC derived an estimate for total debt raising transaction costs for
Australian bond issues, based on the standard issue size ($250 million) and benchmark
term to maturity (10 years), of 10 bppa. This estimate combines the base arrangement fee
with ‘other’ costs in terms of an equivalent bppa. Accordingly, 10 bppa has been added
to our return on debt estimate.
Recent regulatory decisions reinforce an allowance around this level. For instance, the
ERA has previously allowed for debt issuing costs of 0.125%. However, in its Draft
Determination for its rail WACC review, it signalled that it would decrease this
allowance to 0.10%.
211 PwC (2013), p.6.

DETERMINING A WACC ESTIMATE FOR PORT OF MELBOURNE Page 181 of 296
11.9 Cost of debt estimates
We consider that both the RBA and Bloomberg data series represent an independent,
credible and reliable data source for return on debt estimation purposes.
The different samples used for each series is likely to provide valuable information on
the level of and movements in BBB bond yields. This suggests that using an average of
two comparable series is likely to be a superior approach to choosing just one where
there are no substantive methodological grounds to favour one series over the other.
Consequently, we consider calculating an average of the RBA and BVAL series is
appropriate in estimating the cost of debt for the efficient benchmark port entity.
Assuming a risk-free rate of 1.96% and debt raising costs of 10 bppa gives an on-the-day
cost of debt estimate for the benchmark efficient port entity of 4.40%. Table 30 indicates
this calculation.
Table 30 2019 on-the-day cost of debt calculation
Averaging period RBA Bloomberg Average
BBB DRP based on 20 days to 29 March 2019
2.37% 1.92% 2.15%
Risk-free rate based on 20 days to 29 March 2019
1.96% 1.96% 1.96%
Debt raising costs 0.10% 0.10% 0.10%
2019 on-the-day cost of debt
4.43% 3.98% 4.21%
Source: RBA, Bloomberg, Synergies calculations
This 2019 on-the-debt estimate is then used as an input in the trailing average calculation,
as displayed in Table 31.
Table 31 Trailing average cost of debt calculation
Time period Estimate Weighting
2017 on-the-day cost of debt 5.45% 80%
2018 on-the-day cost of debt 4.58% 10%
2019 on-the-day cost of debt 4.21% 10%
Cost of debt 5.24%
Note: Assuming a risk-free rate of 1.96% and debt raising costs of 0.10%, this implies a DRP of 3.18%
Source: RBA, Bloomberg, Synergies calculations
Given a risk-free rate of 1.96%, and debt raising costs of 10 bppa, a cost of debt of 5.24%
implies a DRP of 3.18%, which is higher than the 2018 DRP estimate of 2.53%, owing
mainly to the lower risk free rate.

DETERMINING A WACC ESTIMATE FOR PORT OF MELBOURNE Page 182 of 296
12 Gamma
Chapter overview
2019-20 submission
2018-19 submission
Comments
0.25 0.25 We have retained our gamma estimate from 2018-19 based on an equal weighting of the gamma value implied by finance theory (zero value), the equity ownership approach (0.50 value) and market valuation studies (0.25 value). In the Australian regulatory setting, IPART has recently reaffirmed its commitment to a gamma value of 0.25. The equity ownership approach estimate has been increased from 0.45 to 0.50 to reflect recent regulatory decisions, although this does not affect the overall gamma estimate.
Gamma () is the value of imputation credits to investors in the BEE, where some part of
corporate tax paid by this entity can be claimed as a tax credit against personal income
tax. To the extent it can be accessed by investors, it forms part of the assumed equity
return to investors.
As discussed in Chapter 2 of our report, the Pricing Order requires that the WACC be
determined on a pre-tax nominal basis. This requires tax to be incorporated in the pre-
tax nominal WACC formula which, in turn, requires an assumption to be made
regarding the value of gamma and assumed required pre-tax return on equity. However,
the Pricing Order provides no guidance regarding determination of this value.
Following an introductory section on the components of gamma, the remainder of this
chapter discusses gamma in the context of finance theory, practical evidence of dividend
imputation systems and Australian regulatory precedent. It highlights that there is a
marked difference between market evidence and academic views on the market valuation
of imputation credits (on the one hand) and the approach adopted by regulators which
looks to an average valuation of imputation credits based on Australian Bureau of
Statistics (ABS) or Australian Taxation Office (ATO) data (on the other).
12.1 Introduction and background
Under a dividend imputation system, corporate tax paid prior to the distribution of
dividends can be credited against the tax payable on the dividends at a shareholder level.
In other words, corporate tax is a prepayment of personal tax withheld at a company
level. Under Australia’s dividend imputation system, only domestic shareholders can
avail themselves of imputation credits.
Gamma is the product of two inputs which must be estimated:
• the proportion of tax paid that has been distributed to shareholders as franking
credits (the distribution rate); and
• the value the marginal investor places on $1 of franking credits, referred to as the
value of franking credits (or theta).

DETERMINING A WACC ESTIMATE FOR PORT OF MELBOURNE Page 183 of 296
Gamma must take a value between zero and one depending on the assumptions made
in regards to the distribution rate and theta.
Imputation credits are only available in respect of company tax paid on income subject
to Australian taxation. For gamma to equal one all income must be domestically taxable.
What is clear is that different shareholders value franking credits differently, as their tax
status determines whether their credits can be redeemed.
If the shareholder is an Australian taxpayer, then they are subject to Australian personal
income tax and can offset the prepayment of this tax at the corporate level against their
own personal liabilities. If they are not subject to Australian personal income tax, such
as non-residents and tax-exempt individuals or entities, then the company tax paid
cannot be offset, and no additional value is therefore derived. In other words, the value
of gamma is zero. The following section reviews current positions on gamma in the
regulatory setting, before proceeding to a review of academic and financial market
evidence.
12.2 Evidence on gamma from economic regulators
This section discusses the approach that Australian economic regulators have adopted
when determining a value for gamma. Throughout, we respond to the ESC’s feedback
in relation to our treatment of regulatory evidence on gamma, in light of recent
regulatory developments.
The ESC considered that we misrepresented current regulatory sentiment by stating that
regulators’ positions on gamma remain mixed. With the AER opting for a gamma value
of 0.585, the regulatory range for gamma in Australian regulatory practice is now
between 0.25 and 0.585. On this metric alone, the current value of gamma in the
regulatory setting is indeed mixed. Moreover, in its Final Gas Rate of Return Guidelines,
the ERA has repeated earlier comments that:212
Experts differ in their interpretation of the best approach to estimating gamma in the
regulatory setting. This is particularly the case for the value of the utilisation rate.
In the interim commentary, reference was made to determinations from the Office of the
Tasmanian Economic Regulator (OTTER) and the Independent Competition and
Regulatory Commission (ICRC). The ESC remarked that “while not explicitly referring
to this value themselves, the AER’s approach has been adopted” by these regulators.213
However, the decisions the ESC cites actually opted for a gamma of 0.4, which is not the
212 ERA (2018). Final Gas Rate of Return Guidelines, p.256.
213 ESC (2018). Interim commentary, p.75.

DETERMINING A WACC ESTIMATE FOR PORT OF MELBOURNE Page 184 of 296
value the AER has proposed to adopt. The decisions by the OTTER and ICRC were
actually published before the AER released its latest draft or final guidelines, so it is
unclear whether these regulators have endorsed the AER’s new approach to calculating
gamma.
The ESC raised the concern that our presentation of regulatory determinations since 2010
caused us to overlook the important effect of appeal outcomes on regulatory decisions.
We do not believe that this is the case. Our reason for doing so was to outline the key
issues that have emerged in the debate over gamma and why regulatory values for
gamma have fluctuated over time. For example, in the case of the AER, it has until
recently been using a value of gamma (0.4) that did not feature in its 2013 Rate of Return
Guideline (which actually decided on a gamma of 0.5). In light of this, our objective in
previous WACC reports has been to provide context surrounding why such regulators
have departed from their chosen values mid-review.
This echoes the sentiment of the AER itself, which made clear that its July 2018 draft Rate
of Return Guideline “does not attempt to cover in detail the theoretical, empirical and
legal debate that has occurred since 2013.”214 Likewise, with the new AER and ERA
guidelines released, we take these documents as our primary source of evidence about
current the opinions of these regulators.
12.2.1 Recent developments with the distribution rate
The distribution rate (also referred to as the payout ratio) represents the proportion of
tax that is distributed to shareholders as imputation credits. Until recently, most
regulators opted for a value in the vicinity of 0.70 (the QCA was the only regulator to
assume a distribution rate above 0.8). Since PoM’s 2018-19 TCS was submitted though,
the AER and ERA have begun to apply the Lally 50 firms approach, which bases the
distribution rate on the top 50 firms on the ASX.
Concerns have been raised that both the AER and ERA have now placed full weight on
Lally’s approach to calculating the distribution rate, with no weight placed on ATO-
based data. The issues with this approach include:
• The 50 firms (previously 20) are not appropriate comparators for the BEE – although
this argument has been made in relation to energy networks, it also appears that
there are few firms similar to PoM’s BEE in the top 50 firms
214 AER (2018). Draft rate of return guidelines, Explanatory statement, July, p.389.

DETERMINING A WACC ESTIMATE FOR PORT OF MELBOURNE Page 185 of 296
• The methodology relies on the use of franking account balances – this is one of the
main criticisms of the taxation statistics approach, which is no longer relied upon
by the AER (which we discuss below)
• The distribution rate for listed firms can be distorted by the presence of foreign
profits – this causes issues with applicability to PoM’s BEE, which provides
prescribed services in Australia.
To address concerns about the compatibility of the top 20 firms with the BEE, the AER
engaged its consultant, Professor Martin Lally, to extend his analysis to the top 50 firms.
This analysis led the AER to increase its estimated distribution rate to 0.9 (90%), with the
ERA doing likewise in its final Gas Rate of Return Guidelines. Even with this extended
dataset, it is still unclear whether there are sufficient firms in this sample that are
comparable to the BEE for PoM, such that they could inform its distribution rate.
12.2.2 Non-market approaches adopted by regulators
Equity ownership approach
The equity ownership approach estimates the value-weighted proportion of domestic
investors in the Australian equity market. Although the AER has previously given
weight to evidence from various sources, ultimately it opted in its 2018 final decision to
rely only on equity ownership approach based on ABS data. Stakeholders raised a
number of concerns with this approach, especially as the AER now intends to place full
weight on this approach. The predominant concern is that the equity ownership
approach overlooks various reasons why even domestic investors may not value credits
at their full face value (such as the 45 day rule), causing the approach to provide at best
an upper bound for gamma, rather than a point estimate.
Queries have been raised previously on the integrity of the data underpinning the equity
ownership approach. Virtually all gamma approaches are subject to some form of
uncertainty in relation to data, but the risks of poor data are heightened if full weight is
placed on a single approach, as the AER has done in its 2018 final decision.
ATO taxation statistics
Regulators such as the AER and ERA have previously placed material weight on the use
of taxation statistics. The purpose of this subsection is to describe the taxation statistics
approach in more detail, explain some of the criticisms with the method, and whether
these concerns have merits.
The taxation statistics approach employs data from the Australian Tax Office (ATO) to
calculate the proportion of imputation credits that are actually redeemed by investors.

DETERMINING A WACC ESTIMATE FOR PORT OF MELBOURNE Page 186 of 296
While also an example of a non-market approach, the advantage of the taxation statistics
approach is that it estimates directly the proportion of imputation credits redeemed. On
the other hand, the equity ownership approach can only be considered an indirect
estimate. It will successfully account for non-resident effects, but will not capture any
other reasons why imputation credits may be valued at less than their face value. This is
likely to be one of the reasons why gamma estimates based on the equity ownership
approach tend to be higher than those based on the taxation statistics approach.
Previously, concerns have been raised regulators regarding the quality of the ATO data.
For instance, the ERA has stated previously that:215
The Authority does not place much weight on the estimate, or on its ability to inform
a point estimate of the utilization rate, given concerns about the robustness of the
taxation data used for estimating the utilization rate.
The issue can be observed visually in Figure 9, taken from Hathaway (2014), the most
recent report on taxation statistics.216 What this diagram shows is that the two methods
imply materially different distribution rates (or access fractions, to use Hathaway’s
terminology). As gamma is the product of the distribution rate and the theta, this would
suggest that reliance on ATO data is problematic, and regulators would be justified in
minimising its emphasis.
Figure 9 Visual representation of ATO tax flows, 2004-2012
Note: FAB stands for Franking Account Balances.
Data source: Hathaway (2014)
215 ERA (2015), pp.207-208.
216 Hathaway, N. (2014). Franking credit redemption ATO data 1988 to 2012, Capital Research, October.

DETERMINING A WACC ESTIMATE FOR PORT OF MELBOURNE Page 187 of 296
However, as far as the determination of gamma is concerned, only the orange section
(Company Tax) and the green section (Credits Redeemed) are relevant inputs.
The equation for gamma in terms of credits created, distributed and redeemed is
expressed below:
Gamma = (Credits redeemed/Credits distributed) * (Credits distributed/Credits
created)
Mathematically, Hathaway explains that this expression simplifies to:
Gamma = (Credits redeemed/Credits created)
This means that for the purpose of estimating gamma, the taxation statistics approach
does not actually depend on an estimate of the distribution rate, adding to the robustness
of the estimate.
In December 2017, Hathaway addressed these concerns, stating that:217
The Company Tax item is the total company tax collected by the ATO during the
relevant period and the Credits Redeemed item is the total amount of credits
redeemed via the filing of personal tax returns. These two data items are 100% reliable
as they are figures that relate directly to ATO collections. There is no reason to
question the ATO’s records of the amount of corporate and personal tax it has
collected.
As a consequence, a reliable estimate of gamma is provided by the following:
Gamma = (Credits redeemed = $148.3 billion) / (Company tax = $485.7 billion) = 0.31
Because tax statistics from the ATO offer a direct estimate of the actual amount of credits
redeemed by taxpayers, an estimate of gamma derived from this approach already
provides an upper bound on the estimate of gamma.218 This is because the taxation
approach assumes that all imputation credits are valued at their full face amount. For
this reason, the equity ownership approach is actually made redundant; it is, in effect,
the upper bound of the upper bound for gamma.
Although we favour the implementation of non-market approaches for estimating
gamma in conjunction with market and finance theory approaches, we believe that the
taxation statistics approach is the most robust of the non-market methods available.
217 Hathaway, N. (2017). Letter to Energy Networks Australia, 12 December, p.1.
218 Frontier Economics (2017). Estimating gamma within the regulatory context – Final report prepared for Aurizon Network, September, p.43.

DETERMINING A WACC ESTIMATE FOR PORT OF MELBOURNE Page 188 of 296
Especially given that the data quality issues previously raised do not preclude the
estimation of gamma, there is no reason why the taxation approach should be assigned
any less weight compared to the equity ownership approach. The issue remains though
that both of these approaches still assume that investors value imputation credits at their
face value.
One drawback of taxation statistics is that, while it is capable of estimating gamma
directly, it offers two quite disparate estimates of the distribution rate (0.49 and 0.69,
respectively). We agree that estimates of the two components of the gamma estimate are
still necessary (theta and the distribution rate). For example, to adjust the MRP estimate
for imputation yields, an estimate of theta is required. The key issue here is the
divergence between the value of imputation credits as measured by taxation statistics.
Professor Lally, in a submission accompanying the AER’s final decision, believes the
difference can be attributed at least in part to the following phenomenon:219
The ATO data includes firms that made profits and thereby generated credits but then
made losses and liquidated without distributing the credits. Such firms would tend
to have low distribution rates and, as with unlisted firms, would not be suitable for
estimating the distribution rate for the BEE.
This explanation is not implausible, but it is unclear whether this factor alone is sufficient
to explain the substantial difference in gamma values between the taxation statistics
(0.31) and ABS equity ownership approaches (0.585).
Given the continuing uncertainty surrounding the validity of non-market approaches to
gamma, we do not believe there is justification at this point in time for increasing the
weight that we place on these methodologies in our overall gamma estimate for PoM.
Current approaches applied by other Australian economic regulators
Australian economic regulators’ positions on gamma remain mixed, with both market
and non-market approaches being applied, making it difficult to identify a well-accepted
approach by regulators (as one of the relevant communities in the context of the Pricing
Order). In fact, two approaches emerge involving non-market (the equity ownership
approach) and market-based approaches (market value studies of theta using
techniques, such as dividend drop-off studies). It is therefore clear that regulatory
precedent involves two distinct approaches.
Table 32 summarises the current status of regulatory precedent.
219 Lally, M. (2018). The estimation of gamma: Review of recent evidence, 14 December, p.9.

DETERMINING A WACC ESTIMATE FOR PORT OF MELBOURNE Page 189 of 296
Table 32 Current Australian regulatory status of gamma
Regulator Current value applied
Market or non-market approach
Comments
QCA 0.48 Non-market Recently revised from 0.46 based on distribution rate of 0.88.
AER 0.585 Non-market Final decision based on a utilisation rate of 0.65 and a distribution rate of 0.9.
ACCC 0.50 Non-market This was applied in the draft ARTC Interstate Access Undertaking in December 2018.
IPART 0.25 Market Arrived at under a specific review of gamma concluded in 2012220. Re-affirmed in its 2018 WACC methodology review
ERA 0.5 Non-market and market
Revised up from 0.4 in Final Decision for Gas Rate of Return Guideline and Final Decision for Western Power.
ESCOSA 0.5 Non-market As per 2016 Final Decision for SA Water.
ESC 0.5 Non-market As per most recent Melbourne Water decision. The ESC has not provided its rationale, other than noting in the Guidance Paper that this was consistent with its previous review.
OTTER 0.4 Non-market As per the May 2018 final decision for the Water and Sewerage Price Determination Investigation. OTTER based this estimate on the AER’s position at the time of the decision.
ICRC 0.4 Non-market As per May 2018 final decision for Regulated Water and Sewerage Services Prices 2018-23. ICRC agreed with the AER and QCA approaches that prevailed as at the time of the decision.
Source: Synergies based on Australian regulatory decisions
12.3 Finance theory and market evidence
12.3.1 Dividend drop-off studies
Market evidence represents one of the well-accepted approaches that we employed to
inform our gamma estimate. In the most recent dividend drop-off study, Cannavan and
Gray (2017) employ an extended dataset with improved econometric techniques in order
to assess the value of imputation credits.221 Their results reinforce earlier findings that
the market values distributed imputation credits at approximately 35% of the face
amount (i.e. theta = 0.35). This estimate of theta is consistent with a value for gamma of
0.25, assuming a distribution rate of 70%. Furthermore, IPART makes specific reference
to this paper in substantiating its decision to retain a gamma estimate of 0.25.222
220 IPART (2012). Review of imputation credits (gamma), Research – Final decision, March.
221 Cannavan, D. and Gray, S. (2017). Dividend drop-off estimates of the value of dividend imputation tax credits. Pacific-Basin Finance Journal, 46, pp.213-226.
222 IPART (2018a), p.83.

DETERMINING A WACC ESTIMATE FOR PORT OF MELBOURNE Page 190 of 296
The ESC suggested in its interim commentary that “Synergies overlooked other studies
that would support theta estimates that are higher than the value of 0.35 it relies on.”223
Commenting on a 2011 dividend drop-off study by SFG, of which the Cannavan and
Gray (2017) study is an updated analysis, the Australian Competition Tribunal
concluded in a 2011 decision that that:224
No other dividend drop-off study estimate has any claims to be given weight vis-à-
vis the SFG report value.
Accordingly, we have followed the guidance of the Tribunal in our selection of dividend
drop-off studies on which to rely.
It is true that the estimation of theta under market-based approaches is not without
controversy (with measurement and estimation issues arising in part because of the
restricted window of analysis). However, all other WACC parameters are set having
regard to market values. Accordingly, the assessment of the value of gamma should be
informed by approaches assessing market values. Furthermore, the market value
interpretation is more compatible with the concept of the marginal investor, whereas the
redemption proportion interpretation relies on the concept of an average investor. In the
context of price setting in financial markets, especially in Australia, the former is likely
to be a more realistic representation. This approach is consistent with the academic
findings and equity market data presented elsewhere in this chapter.
12.3.2 ESC interim commentary on academic evidence
The ESC was concerned that the academic literature that we compiled was not
compatible with the foundational papers on gamma in Australia:225
Synergies’ view of what is accepted in the academic literature is also not derived from
the principal academic papers relating to gamma, namely Officer, Monkhouse and
Lally and van Zijl which provide derivations of the model in which gamma appears.
None of these papers assert that gamma is zero by reference to empirical evidence.
It is helpful to present the context and the key passages from the papers that the ESC has
referenced in order to gain a proper perspective on the ESC commentary. In the case of
Officer (1994) and Monkhouse (1993), there was insufficient empirical data to make any
informed appraisal of the value of imputation credits. This was because dividend
imputation had been only recently been introduced in 1987. Consequently, none of these
223 ESC (2018). Interim commentary, p.76.
224 Application by Energex Limited (Gamma) (No 5) [2011] ACompT 9 (12 May 2011), Paragraph 38.
225 ESC (2018), p.75.

DETERMINING A WACC ESTIMATE FOR PORT OF MELBOURNE Page 191 of 296
papers assert any specific value for gamma by reference to empirical evidence. These
data deficiencies have been resolved as time has progressed, including via dividend
drop-off studies.
Officer (1994)
In a footnote of his seminal paper, Officer states the following:226
For example, if the shareholder can fully utilize the imputation credits then (“value”)
gamma = 1, e.g. a superfund or an Australian resident personal taxpayer. On the other
hand a tax exempt or an offshore taxpayer who cannot utilize or otherwise access the
value in the tax credit will set gamma = 0. Where there is a market for tax credits one
could use the market price to estimate the value of gamma for the marginal
shareholder, i.e. the shareholder who implicitly sets the price of the shares and the
price of gamma and the company’s cost of capital at the margin, but where there is
only a covert market, estimates can only be made through dividend drop-off rates.
Understandably, this wording has generated significant debate in the regulatory setting
– a debate to which the ESC refers in its interim commentary. Energy Networks Australia
(ENA) made the following observation on the Officer framework in its response to the
AER’s draft decision:227
Officer (1994) is not a model. There is no set of assumptions and no derivation of a
market-clearing equilibrium. Rather, Officer provides a useful set of formulas for a
given gamma – he provides no mathematical framework for determining what
gamma means or what it should be. Thus, it would be wrong to suggest that a
particular estimate of gamma is ‘consistent with the Officer model.’ Every estimate of
gamma is consistent with Officer, so long as the same estimate is used in the cash
flows and the corresponding estimate of the discount rate. [Italicised emphasis in the
original]
As such, Officer does not dismiss the potential for a gamma of zero in the manner the
ESC seems to be implying.
Monkhouse (1994)
In the conclusion to his paper, Monkhouse writes the following:228
226 Officer, R.R. (1994). The cost of capital of a company under an imputation tax system, Accounting and Finance
227 Energy Networks Australia (2018). AER Review of the Rate of Return Guideline – Response to Draft Guideline, 25 September, p.144.
228 Monkhouse, P.H.L. (1993). The cost of equity under the Australian dividend imputation tax system.

DETERMINING A WACC ESTIMATE FOR PORT OF MELBOURNE Page 192 of 296
This paper set out to derive a CAPM consistent with a cash flow measured after
corporate tax but before investor-level taxes in the context of the Australian dividend
imputation tax system. This question has considerable significance since it relates
directly to the issue of specifying the discount rate that firms in Australia should use
to value risk cash flows. The answer derived in this paper is given by equation (7.2)
which presents a CAPM that contains two terms that capture the effects of the
dividend imputation tax system.
Equation 7.2 in Monkhouse (1994) is the following expression:
Where the two theta terms correspond to retained and distributed imputation credits,
respectively. Monkhouse reported in 1994 that these two theta terms “cannot be readily
measured.” He proposes the following:
In a practical application, an analyst could estimate the values of these terms on the
basis of “market experience” and an assessment of the investor base of the firm. While
the values of theta(d,j) and theta(r,m) must ultimately be determined empirically, in
most of the comments that follow it has been assumed that both theta(d,j) and
theta(r,m) are greater than zero.
The cost of equity capital for an Australian tax-paying firm with predominantly
Australian investors is lower than if the same firm were owned by offshore investors.
In the latter case, theta(d,j) and theta(r,m) = 0 and the CAPM reverts to the “classical”
CAPM.
Consequently, although Monkhouse does favour a non-zero gamma, and the
Monkhouse framework is more readily associated with non-market approaches to
gamma, the paper not rule out the possibility of a zero gamma either, especially where
the marginal investor is a foreign investor.
Lally and van Zijl (2003)
As raised by the ESC in the interim commentary, Lally and van Zijl (2003) argue that
theta is equal to 1. The AER has recently opted not to rely on this approach, and we have
not uncovered any financial practitioner evidence to substantiate it either.

DETERMINING A WACC ESTIMATE FOR PORT OF MELBOURNE Page 193 of 296
12.3.3 Academic evidence on gamma
It is well-accepted in the academic literature that the gamma for a security where the
marginal investor is foreign should be zero. We turn to a consideration of some of the
key findings of this literature.
Cannavan et al. (2004) infer the value of imputation tax credits from the prices of
derivative securities in Australian retail markets. Their findings are consistent with non-
residents being marginal price-setting investors in large Australian firms. They argue
that a company’s cost of capital is not affected by a dividend imputation system.229 Thus,
if an international investor derives no value from imputation credits a company must
produce the same return for a marginal stockholder irrespective of the existence of an
imputation system. Feuerherdt et al. (2010) extend the analysis to Australian hybrid
securities, also finding evidence consistent with a price-setting investor placing no value
on franking credits.230
Lajbcygier and Wheatley (2012) test whether equity returns are related to imputation
credit yields. They find no evidence that the provision of imputation tax credits lowers
the return investors require on equity.231 Furthermore, using a general equilibrium
model, they demonstrate that if the domestic market is small relative to the foreign
market, which is the case for Australia, the impact of imputation credits on the domestic
equity premium is negligible.
In the SL CAPM, equity markets are presumed to be segmented between domestic and
foreign markets to determine the cost of equity for regulated firms. In this sense,
imputation-eligible domestic investors make portfolio decisions based on with-
imputation credit returns, while ineligible foreign investors make decisions based on
without-imputation credit returns. In an open economy, such as Australia, which
represents a small proportion of global equity, the returns will be determined largely by
the expectations of foreign investors.
Siau, Sault and Warren (2015) employ discounted cash-flow valuation models to assess
whether imputation tax credits are capitalised into Australian stock prices. They uncover
229 Cannavan, D., Finn, F. and Gray, S. (2004). The value of dividend imputation tax credits in Australia. Journal of
Financial Economics, 2, pp.167-197.
230 Feuerherdt, C., Gray, S. and Hall, J. (2010). The value of imputation credits on Australian hybrid securities. International Review of Finance, 10(3), pp.365-401.
231 Lajbcygier, P. and Wheatley, S.M. (2012). Imputation credits and equity returns. Economic Record, 88(283), pp.476-494.

DETERMINING A WACC ESTIMATE FOR PORT OF MELBOURNE Page 194 of 296
no clear evidence that imputation credits influence the level of stock prices.232 This
reinforces the notion that credits are not valued by the marginal investor, who in the
context of Australia is likely to be an international investor.
Gray and Hall (2006) explicitly derive the relationship between the value of franking
credits (gamma) and the MRP. With a specific emphasis on Australian regulators, they
demonstrate that the typical parameter estimates adopted in practice are incompatible
with this mathematical relationship.233 If internal consistency within the cost of equity
model is to be restored, then at least one of the parameter values needs to be modified.
To restore internal consistency, the authors propose that setting gamma equal to zero is
the most straightforward way of achieving this. The advantage of this approach is that
no further assumptions are required about the magnitude of dividend yields.
Alternatively, to support a gamma value greater than zero other parameters would have
to assume implausible values.
While not necessarily the most reliable of sources, the authors cite two surveys in
support of their findings. Firstly, Truong, Partington and Peat (2005) surveyed 356 listed
Australian firms on their corporate finance practices: 85 per cent of respondents
indicated that they made no adjustment for the value of franking credits.234
Additionally, Lonergan (2001) conducted a review of expert valuation reports, finding
that 42 of 48 (88 per cent) used the CAPM for their cost of equity calculations without
making any adjustments for dividend imputation.235 Of the six reports that did
incorporate it, only one was able to assign any non-negligible value to the company on
the basis of franking credits. Although some time has passed since these surveys, there
is little indication that these key sentiments have changed.
12.3.4 Summary
Academic research analysing market data indicates strong support for a gamma value
of zero based on the assumption that in open capital markets like Australia, the marginal
investor will be an international investor who gains no value from imputation credits
232 Siau, K.S., Sault, S.J. and Warren, G.J. (2015). Are imputation credits capitalised into stock prices? Accounting and
Finance, 55, pp.241-277.
233 Gray, S. and Hall, J. (2006). Relationship between franking credits and the market risk premium. Accounting and Finance, 46, pp.405-428.
234 Truong, G., Partington, G. and Peat, M. (2005). Cost of capital estimation and capital budgeting practice in Australia. AFAANZ Conference, Melbourne, Australia, 3-5 July.
235 Lonergan, W. (2001). The disappearing returns: Why imputation has not reduced the cost of capital. Journal of the Securities Institute of Australia, Issue 1 Autumn, pp.8-17.

DETERMINING A WACC ESTIMATE FOR PORT OF MELBOURNE Page 195 of 296
and hence whose expected return on equity is not affected by the operation of the
Australian tax imputation system.
12.3.5 Independent expert valuations
In its interim commentary, the ESC raises an observation from the Australian
Competition Tribunal, which was that valuation experts may choose to assign no value
to imputation credits on the basis that it is difficult to reliably estimate their value, not
because these experts believe that they have no value.236 This does not align with the
evidence that we have uncovered to date. Most prominently, Grant Samuel has stated
unequivocally on numerous occasions that it does not believe that Australian equity
prices incorporate value franking credits, nor does it believe that gamma adjustments
are made by asset acquirers, as shown below.
It is acknowledged that Deloitte has raised concerns about the diverse views on
imputation credit valuation. However, this does not imply that Deloitte would have
assigned a non-zero value to gamma if there was a dominant approach to calculating it.
If an independent expert were to genuinely believe that imputation credits held
significant value, it would not be prudent to assign no value to gamma whatsoever,
simply because there are differing views on calculating the parameter. Instead, a more
measured approach would be to have regard to the most well-accepted methodologies
(or at least a range of the most well-accepted), combining these in a way that gives
appropriate weight to each approach based on its merits. This is the approach that we
have adopted in ascertaining a suitable gamma value for PoM.
The ESC then goes on to reference market practice survey (Truong, Partington and Peat,
2005, which we have cited in previous reports and have done so again above), which
finds that some valuation experts (15%) assign value to imputation credits. On the whole
though, there is also substantial evidence that imputation credits are not valued by
independent experts. In a review of market evidence on the cost of equity for Aurizon,
Ernst and Young find that “there is no evidence that market practitioners (i.e.
independent experts) take information on imputation credits into account in estimating
required rates of returns.”237
In response to a 2014 AER draft decision for Transgrid, Grant Samuel wrote that:238
We have always made it clear in our reports that we do not believe that day to day
market prices of Australian equities incorporate any particular value for franking
236 Essential Services Commission (2018). Interim Commentary, p.76.
237 Ernst and Young (2016). Market evidence on the cost of equity, 22 November, p.28.
238 Grant Samuel (2015). Response to AER draft decision, 12 January, p.5.

DETERMINING A WACC ESTIMATE FOR PORT OF MELBOURNE Page 196 of 296
credits attached to any future income stream and we have never made any adjustment
for dividend imputation (in either the cash flows or the discount rate) in any of our
500 plus public valuation reports.
Furthermore, in a 2015 Independent Expert’s Report for Asciano, Grant Samuel puts
forward the perspective of financial markets, arguing that:239
The evidence gathered to date as to the value of the market attributes to franking
credits is insufficient to rely on for valuation purposes. The studies that measure the
value attributed to franking credits are based on the immediate value of franking
credits distributed and do not address the risk and other issues associated with the
ability to utilise them over the longer term. More importantly, Grant Samuel does not
believe that such adjustments are widely used by acquirers of assets at present.
Deloitte points to the lack of conclusive evidence on the value of imputation credits:240
We have not adjusted the cost of capital or the projected cash flows for the impact of
dividend imputation due to the diverse views as to the value of imputation credits
and the appropriate method that should be employed to calculate this value.
Determining the value of franking credits requires an understanding of shareholders’
personal tax profiles to determine the ability of shareholders to use franking credits
to offset personal income. Furthermore, the observed EMRP already includes the
value that shareholders ascribe to franking credits in the market as a whole. In our
view, the evidence relating to the value that the market ascribes to imputation credits
is inconclusive.
The KPMG Valuation Practices Survey sampled 56 valuation professionals across
Australian on their approach to gamma.241 The responses are shown in Figure 10.
239 Grant Samuel (2015). Independent Expert’s Report, Asciano, 30 September, p.315.
240 Deloitte (2015). Independent Expert’s Report, Energy Developments Limited, 3 September, p.63.
241 KPMG (2018). It is worth taking note – KPMG Valuation Practices Survey 2018.

DETERMINING A WACC ESTIMATE FOR PORT OF MELBOURNE Page 197 of 296
Figure 10 KPMG Valuation Practices Survey, gamma
Note: The gamma values in this figure are expressed as percentages rather than as decimals (e.g. 50.0% corresponds to a gamma of
0.50). The number (rather than proportion) of respondents is measured on the horizontal access.
Data source: KPMG Valuation Practices Survey 2018
57% of respondents indicated a factor of zero, while less than 10% of respondents applied
a gamma in excess of 0.10. This means that more than 90% of the Australian financial
practitioners surveyed assume a gamma that is less than half of the value we have
adopted for PoM.
12.3.6 Dividend imputation policy evidence
Australia, Canada, Chile, Mexico and New Zealand are the only five countries in the
Organisation for Economic Co-operation and Development (OECD) that operate a full
imputation tax system where all corporate tax is credited to domestic shareholders.
South Korea and the United Kingdom are operating partial imputation systems.
However, as the tax credits provided in these countries are not linked to the amount of
corporate tax paid, these are not true imputation tax systems.242
The broad international trend to removal of dividend imputation systems over the 2000s
has also been reflected in tax policy considerations in an Australian context:243
242 Ainsworth A. (2016). Dividend imputation: The international experience. The Finsia Journal of Applied Finance, 1,
pp.58-63.
243 Commonwealth Treasury (2010). Australia’s Future Tax System, Chapter B: Investment and Entity Taxation, p.199.

DETERMINING A WACC ESTIMATE FOR PORT OF MELBOURNE Page 198 of 296
Dividend imputation continues to deliver benefits for Australia, particularly for
smaller firms and those operating in the more closed segments of the economy.
However, a continuation of the trend of increased openness, rapid growth in cross-
border investment flows and greater capital mobility will reduce the benefits of
imputation in the longer term.
For a small, open economy that is increasingly integrated with international capital
markets, providing tax relief only on dividends paid to resident shareholders will
become less effective in reducing the cost of capital for companies (and hence of
reduced benefit in encouraging investment) or in providing a neutral treatment of
debt and equity.
These tax policy considerations are consistent with the academic and independent expert
evidence in suggesting that international investors should be given a relatively large
weighting in determining a gamma value in an Australian context.
12.3.7 Evidence of international investor interest in Australian transport and
energy infrastructure
Further to the findings of academic studies discussed in this chapter, this section
focusses on the resident and non-resident investor shares of equity held in major
Australian transport and energy infrastructure.
Table 33 below shows only the proportion of Institutions & Strategic Holders &
Individuals/Insiders. Equity from domestic manager/listed companies has been
allocated fully to the domestic category even though some capital may have been foreign
– there is no way to discern this from the source data.
Table 33 Proportion of equity ownership – Institutions & Strategic Holders & Individuals/Insiders
Data
Proportion of Institutions and Strategic Holders & Individuals /
Insiders
Company Ticker Domestic Foreign Domestic Foreign
Qube Holdings ASX:QUB 25% 19% 58% 42%
Port of Tauranga NZSE:POT 56% 2% 96% 4%
Aurizon Holdings ASX:AZJ 25% 31% 45% 55%
Sydney Airport ASX:SYD 21% 23% 48% 52%
Auckland International Airport NZSE:AIA
25% 24% 52% 48%
Transurban ASX:TCL 19% 22% 46% 54%
Atlas Arteria ASX:ALX 22% 39% 36% 64%
Spark ASX:SKI 20% 30% 40% 60%

DETERMINING A WACC ESTIMATE FOR PORT OF MELBOURNE Page 199 of 296
Data
Proportion of Institutions and Strategic Holders & Individuals /
Insiders
APA Group ASX:APA 21% 16% 57% 43%
Min 19% 2% 36% 4%
Max 56% 39% 96% 64%
Median 22% 23% 48% 52%
Average 26% 23% 53% 47%
Source: Capital IQ data as at 29 May 2019
Table 33 indicates the significant proportion of foreign equity ownership of Australian
transport and energy infrastructure.
Table 34 presents a similar picture for unlisted infrastructure transactions over the last
three years (based on InfraDeals data).
Table 34 Proportion of equity ownership – Unlisted infrastructure transactions
Transaction Sub-Sector Date Equity Providers Domestic Foreign
WestConnex Toll Road System (Green & Brownfield)
Oct-18 Transurban, CPPIB, AustralianSuper, ADIA
71% 29%
Loy Yang B Generation Dec-17 Alinta (Chow Tai Fook Enterprises Limited)
0% 100%
NSW Endeavour Energy
Distribution May-17 Macquarie Infrastructure, AMP (REST), bcIMC, QIA
57% 43%
DUET Distribution Apr-17 CKI 0% 100%
Alinta Energy Utility Mar-17 Chow Tai Fook Enterprises Limited 0% 100%
NSW Ausgrid Distribution Dec-16 AustralianSuper, IFM 100% 0%
GRail Rail Dec-16 G&W, Macquarie Infrastructure 49% 51%
Port of Melbourne Ports Oct-16 Future Fund, CIC, OMERS, NPS, CalPERS, GIPA, QIC
31% 69%
Asciano (Pacific National)
Rail Aug-16 GIP II, CPPIB, CIC, GIC, bcIMC 0% 100%
Asciano (Ports) Ports Aug-16 Qube, Brookfield, GIC, bcIMC, QIA 50% 50%
AirportLinkM7 Roads Apr-16 Transurban, AustralianSuper, ADIA 88% 13%
Pacific Hydro Renewables Jan-16 China State Power Investment Corporation
0% 100%
NSW TransGrid Transmission Dec-15 Spark, Hastings, CDPQ, ADIA, Wren House
35% 65%
Iona Gas Storage Energy Dec-15 QIC, QSuper 100% 0%
Median 43% 57%
Average 47% 53%
Note: Fund managers have been classified based on the location of their head office where their underlying investor details are confidential.
Source: InfraDeals
The data in Table 33 and Table 34 highlights at best a 50:50 split between foreign and
domestic buyers of major infrastructure assets in Australia. In these circumstances, it is

DETERMINING A WACC ESTIMATE FOR PORT OF MELBOURNE Page 200 of 296
clear the marginal (i.e. price setting) investor is a foreign investor that will be unable to
access any value from imputation credits.
It is acknowledged that domestic shareholders derive benefits from dividend
imputation. However, in a valuation context, these shareholders are inframarginal – they
do not set the relevant price for an infrastructure asset – available evidence suggests the
price for a large Australian infrastructure asset is set by foreign investors and the market
valuation of imputation credits for these investors is zero. Put another way, it cannot be
concluded that the marginal investor in an efficient Australian benchmark entity is
anything but a foreign investor who places no value on imputation credits. Given the
relevant workably competitive market in which the BEE raises funds for investment is a
global capital market, the implication is that the gamma for PoM should be zero.
12.4 Identifying a well-accepted gamma estimation approach
In attempting to identify a well-accepted approach to gamma, we have reviewed
academic literature, relevant finance industry evidence (particularly from independent
and expert reports), as well as Australian regulatory practice. This is consistent with our
overarching position on the definition of well-accepted applied across our WACC
calculations.
The first well-accepted approach is adopted from the academic literature and strongly
indicates that the gamma for a security where the marginal investor is foreign should be
zero given the marginal investor for the BEE is an international investor and hence, in
an Australia context, unable to utilise any accrued imputation credits.
There is also substantial evidence that imputation credits are not considered by
independent experts in a valuation context. Australian economic policy makers have
also questioned the value of imputation credits in an economy that is small by
international standards and characterised by open capital markets.
In contrast to this reasonably consistent and well-accepted view, Australian regulatory
precedent is a highly contested area with ongoing disagreement over the value of
imputation credits (theta) in the hands of investors, one of the two critical inputs into the
gamma calculation.
Consequently, there are several approaches that have been applied in Australian
regulatory practice. This has been reflected in a large range of gamma values from 0.25
to 0.585 that have been adopted by Australian regulators in recent years. However, what
is common to all these regulatory decisions is the assumption that the marginal investor
is either a resident Australian or that the identity of the marginal investor is not relevant
to the assessment of the valuation of imputation credits. The value of theta continues to
DETERMINING A WACC ESTIMATE FOR PORT OF MELBOURNE Page 201 of 296
be highly contentious and in broad terms can be estimated using the following non-
market and market-based approaches:
• the equity ownership approach, which is the proportion of Australian equity held
by Australian residents (given only domestic investors can utilise franking credits),
or taxation approach using statistics drawn from the Australian Taxation Office on
the utilisation of franking credits – which forms our second well-accepted and non-
market approach; and
• market value studies, which seek to ascribe the value that investors place on theta
using techniques, such as dividend drop-off studies (i.e. pre and post-dividend
share prices) - which forms our third well-accepted and market-based approach.
Each of these approaches establishes a broad range of theta values and in turn a gamma
value.
The second approach has been applied by some regulators, including the ESC. It
provides a theta value of around 0.55 to 0.65 resulting in a gamma value of 0.4 to 0.585
depending on the assumed distribution rate. An average of current regulatory non-
market approaches results in a point estimate in the vicinity of 0.5. The equity ownership
approach assumes an investor that is eligible to fully utilise imputation credits they
receive has a utilisation rate of 1 (i.e. they gain 100 percent of the “value” of the
imputation credits); whereas an investor that is ineligible to redeem imputation credits
has a utilisation rate of 0 (i.e. they gain no “value” from the imputation credits).
However, this approach fails to recognise the potential for individual eligible investors
to value imputation credits at less than their nominal dollar value, notwithstanding
evidence to the contrary. Moreover, the equity ownership approach does not reflect a
market based approach despite every other relevant parameter informing the WACC
being based on a market proxy.
In contrast, the third approach relies on a market value estimate of imputation credits.
As noted above, this approach is still used by some regulators and has been recently
reaffirmed by IPART. An updated gamma estimate prepared by SFG Consulting that
applies the methodology accepted by the Australian Competition Tribunal in 2011
continues to support a theta value of 0.35 and hence a gamma value of 0.25 (assuming a
70% distribution rate).244
Accordingly, we consider these three broad approaches have been well-accepted in the
relevant communities of expertise. On balance, we favour the market valuation
approach. However, given the pros and cons of each methodology, we have calculated
244 SFG Consulting (2014b).
DETERMINING A WACC ESTIMATE FOR PORT OF MELBOURNE Page 202 of 296
an average of the three values (which are zero based on finance theory, 0.50 based on an
equity ownership approach and 0.25 based on market valuation studies), which results
in a gamma value of 0.25.
What the analysis in this chapter shows is that no single methodology is unanimously
superior to others in terms of well-acceptance. Whilst it appears that most Australian
regulators are placing increasing weight on non-market approaches (in some cases, such
as the AER, no weight is being placed on any other approach), this need not and should
not be viewed as a default position for PoM’s compliance with the Pricing Order. We
recognise that recent Tribunal and Court decisions have not found error with recent AER
and ERA regulatory decisions. In our view, this falls short of the conclusion drawn in
the ESC’s Interim Commentary that gamma has been “settled by other recent regulatory
processes.” It is clear that those decisions were found to be validly made under their
relevant statutory regime. It is also the case that other values (such as those presented in
this chapter) could equally be validly found only those regimes. Not only is PoM subject
to a different statutory regime (which is compliance-based rather than deterministic),
but our analysis of recent evidence has shown that a broader set of approaches are well
accepted for the purposes of the Pricing Order. There are sufficient disadvantages and
uncertainties surrounding non-market approaches such that PoM should have regard to
a broader range of well accepted valuation methods for imputation credits.
Therefore, we have assigned equal weighting to each approach in the absence of a
compelling basis to do otherwise. If we were to depart from this approach, we would
ascribe less weight to the equity ownership approach because of its non-market
orientation.
12.5 Conclusion
On the balance of the evidence, the issue of the valuation of imputation credits turns on
whether a market valuation is adopted or whether a non-market based utilisation of
imputation credits approach is adopted. We believe the issue of well-accepted means
well-accepted beyond the community of regulatory agencies to embrace relevant
assessments of the market value of imputation credits from the academic and finance
communities.
Given the above, we consider a strong argument exists that the only truly well-accepted
gamma value within the meaning of the Pricing Order is zero based on academic and
contemporary Australian equity market evidence. However, the average of the three
well-accepted approaches identified in this chapter recognises the market and non-
market approaches to valuing utilisation credits that have emerged in an Australian

DETERMINING A WACC ESTIMATE FOR PORT OF MELBOURNE Page 203 of 296
regulatory context and which reflect the most contentious aspect of the value of gamma
calculation.
On these grounds, we consider a gamma value of 0.25 for the BEE is reflective of a well-
accepted approach and is consistent with the Pricing Order.

DETERMINING A WACC ESTIMATE FOR PORT OF MELBOURNE Page 204 of 296
13 Proposed WACC estimate for BEE
The purpose of this chapter is to present the values of the key components of our pre-
tax nominal WACC estimate of 10.46% for the BEE.
We also demonstrate that this WACC estimate satisfies the three stage assessment
approach set out by ESC to assess compliance of PoM’s WACC estimate with the Pricing
Order.
13.1 Changes since 2018-19 TCS submission
The changes to our return on equity and debt estimates since the 2018-19 TCS submission
reflect changes in market-based parameter values (e.g. risk-free rate, MRP, DRP) as well
as a change in the weightings given to each of the return on equity models. Our asset
beta, gearing and gamma value assumptions remain unchanged.
13.1.1 Return on equity calculation
The return on equity estimation methodologies used to calculate our pre-tax return on
equity estimate of 12.69% are discussed in Sections 8, 9 and 10 of our report. It places a
weighting of 90% on the SL CAPM, and a weighting of 5% each on the Black CAPM and
FFM. This compares to a pre-tax return on equity estimate of 14.16% in the 2018-19 TCS
submission, which placed an equal weighting on each of the three return on equity
models.
13.1.2 Return on debt calculation
The underlying components of our return on debt estimate of 5.24% are discussed in
Chapter 10 of our report.
13.1.3 WACC estimate
Our pre-tax nominal WACC estimate of 10.46% (from a range of 10.07% to 10.92%) and
its underlying components, based on three well-accepted return on equity models, is
presented in Table 35. For this year’s TCS submission, we have established a WACC
range around our point estimate for PoM.
For the 2019-20 TCS, we have maintained a point estimate of the asset beta of 0.7. We
have adopted a MRP point estimate of 7.77%, by placing a 50% weighting on the
Ibbotson MRP (6.48%), a 25% weighting on the Wright MRP (9.54%), and a 25%
weighting on DDMs (8.56%). The lower range retains the assumptions of the point
estimate, but presents an alternative weighting scheme for the MRP. It places a weight

DETERMINING A WACC ESTIMATE FOR PORT OF MELBOURNE Page 205 of 296
of 66.7% on the Ibbotson MRP, 16.7% on the Wright MRP, and 16.7% on DDMs. The
upper range retains all the assumptions of the point estimate, but applies an asset beta
of 0.75, which is supported by the empirical evidence from PoM’s comparator set. Note
that for the upper range of the estimate, the Black CAPM is now lower than the SL
CAPM, because the equity beta is above 1.
Table 35 WACC estimate for PoM
Parameter 2017-18 TCS
2018-19 TCS
2019-20 TCS
(Lower range)
2019-20 TCS
(Point estimate)
2019-20 TCS
(Upper range)
Risk-free rate 2.81% 2.74% 1.96% 1.96% 1.96%
Capital structure 30% 30% 30% 30% 30%
Gamma 0.25 0.25 0.25 0.25 0.25
Corporate tax rate 30% 30% 30% 30% 30%
CAPM Parameters
Ibbotson MRP 6.53% 6.56% 6.48% 6.48% 6.48%
Wright MRP 9.01% 8.86% 9.54% 9.54% 9.54%
Dividend Discount Models (DDMs) - - 8.56% 8.56% 8.56%
Ibbotson MRP weighting 50% 50% 66.6% 50% 50%
Wright MRP weighting 50% 50% 16.6% 25% 25%
DDMs weighting 0% 0% 16.6% 25% 25%
Weighted MRP 7.34% 7.77% 7.77%
Asset beta 0.70 0.70 0.70 0.70 0.75
Equity beta 1.00 1.00 1.00 1.00 1.07
Zero Beta Premium 3.34% 3.34% 3.36% 3.36% 3.36%
Fama-French Model Parameters
Market risk premium (MRP) 7.77% 7.71% 7.34% 7.77% 7.77%
Value (HML) premium 6.05% 6.10% 5.74% 5.74% 5.74%
Size (SMB) premium 1.77% 1.93% 2.04% 2.04% 2.04%
Asset beta (Market) 0.62 0.74 0.75 0.75 0.75
Asset beta (HML) 0.20 0.08 0.12 0.12 0.12
Asset beta (SMB) 0.11 0.16 0.23 0.23 0.23
Equity beta (Market) 0.89 1.06 1.07 1.07 1.07
Equity beta (HML) 0.29 0.11 0.17 0.17 0.17
Equity beta (SMB) 0.16 0.23 0.32 0.32 0.32
Return on equity (pre-tax)
SL CAPM weighting 33.3% 33.3% 90% 90% 90%
Black CAPM weighting 33.3% 33.3% 5% 5% 5%
FFM weighting 33.3% 33.3% 5% 5% 5%

DETERMINING A WACC ESTIMATE FOR PORT OF MELBOURNE Page 206 of 296
Parameter 2017-18 TCS
2018-19 TCS
2019-20 TCS
(Lower range)
2019-20 TCS
(Point estimate)
2019-20 TCS
(Upper range)
SL CAPM 13.66% 13.48% 12.00% 12.55% 13.27%
Black CAPM 13.66% 13.48% 12.00% 12.55% 12.96%
FFM 15.12% 15.51% 14.77% 15.37% 15.37%
Weighted return on equity (pre-tax) 14.14% 14.16% 12.14% 12.69% 13.36%
Debt beta 0.00 0.00 0.00 0.00 0.00
Debt risk premium 2.54% 2.53% 3.18% 3.18% 3.18%
Debt raising costs 0.10% 0.10% 0.10% 0.10% 0.10%
Return on debt (pre-tax) 5.45% 5.37% 5.24% 5.24% 5.24%
Pre-tax nominal WACC 11.54% 11.52% 10.07% 10.46% 10.92%
13.2 Satisfying the ESC’s compliance assessment framework
This section demonstrates how our proposed WACC estimate for the BEE satisfies the
following three stages of the ESC’s compliance assessment framework:
• use of well-accepted approaches in its development;
• determining the overall reasonableness of the proposed WACC estimate and
whether it is likely to be commensurate with that required by the BEE, including
having regard to the WACCs of comparable entities; and
• if any concerns arise regarding the proposed WACC estimate, a more detailed,
focussed analysis of its basis will be undertaken.
13.2.1 Use of well-accepted approaches
Table 7 in Chapter 3 of our report outlines the reasons for our view that ‘well-accepted’
encompasses regulatory precedent, financial practitioner evidence and academic
literature. We also outline evidence from economic regulators in support of the
approaches that we have adopted.
13.2.2 Overall consistency of proposed WACC estimate with returns required by
the BEE
The purpose of this section is to substantiate the consistency of our proposed overall
WACC estimate with the returns required by the BEE with a similar degree of risk as
that which applies to PoM in the provision of the Prescribed Services. Firstly, we
evaluate the WACC margins implied from the more comparable regulatory decisions
DETERMINING A WACC ESTIMATE FOR PORT OF MELBOURNE Page 207 of 296
identified by the ESC in its Interim Commentary, as well as the recent NSW Rail Access
Undertaking draft decision.
Whilst the ESC has previously confined its assessments to regulatory decisions, we
consider a broader assessment is necessary so as to ensure that the regulatory objectives
are likely to be achieved. Accordingly, we have generated estimated WACC margins for
our listed comparator set using data from Bloomberg on country-specific market risk
premiums and risk-free rates, as well as firm-specific information regarding the return
on debt. An overview of the methodology for the assessment of the cost of equity is
located in Attachment G.
13.3 Benchmarking the WACC for the BEE
13.3.1 Complexities in benchmarking WACC
The inherent complexity in benchmarking WACCs can readily be seen in the different
components and approaches that can be adopted for the purposes of benchmarking.
Here, there are two principal sources of difference:
• those relating to the intrinsic characteristics of the entities and their commercial
environments
• those relating to the WACC assessment itself.
We briefly explain these in turn.
Differences in the intrinsic characteristics of the entities and their commercial
environments include:
• Inherent differences in the entities being benchmarked – PoM has very substantial
exposure to the domestic market because of its import concentration, and has very
high operating leverage, due to, amongst other things, relevant licensing fees and a
regulatory regime which provides a very limited ability for PoM to adjust prices in
response to changing circumstances (in contrast to, for example, a revenue cap
environment). It is the only Australian container port to be subject to a Government
endorsed plan for the creation of a second port
• Different regulatory regimes – the Pricing Order confers upon PoM important
discretions about the approaches to be adopted for determining the WACC that are
not reflected in any other Australian regulatory regime. This affects the comparison
of WACC because a wider range of values can be compliant under the Pricing Order
when compared to the more common deterministic regimes that apply to the
comparator regulated entities

DETERMINING A WACC ESTIMATE FOR PORT OF MELBOURNE Page 208 of 296
These differences are captured in Table 36.
Table 36 Environmental benchmarking summary
Entity
Revenue model (where relevant, regulatory framework)
Systematic Risk Exposure
Other relevant factors
Comparability to PoM
PoM
Price-capped, full demand risk
Uncontracted revenue
Contestable trades
Threat of 2nd port
Volumes linked to domestic economic cycles
Compliance not deterministic regime
High operating leverage exacerbated due to large Government licensing fees
N/A
Coal-related network entities
Long-term take-or-pay contracts
Revenue capped, very low demand risk
Relatively limited exposure to imports
Generally single commodity exposure
Deterministic regulatory regime
Poor comparator due to regulated revenue cap and substantially different operating environment, means significantly lower systematic risk
ARTC Interstate Network
Ceiling revenue test, full demand risk
Limited contractual protection
Volumes linked to economic cycles
Limited road competition on major route (East-West), other routes more contestable (North- South)
Negotiate arbitrate regime
2018 Voluntary Access Undertaking withdrawn following ACCC Draft Determination
Reasonable comparator noting the impact of a different regulatory regime
Arc infrastructure
Ceiling revenue test, full demand risk
Long term contracts
Predominantly export focused, although some domestic traffic akin to ARTC Interstate Network
Negotiate arbitrate regime with potential deterministic outcomes (arbitration)
Reasonable comparator noting the impact of a different regulatory regime
NSW Rail Access Undertaking
Ceiling revenue test, full demand risk
Wide variety of traffics ranging from coal (not contestable) to grain to intermodal (more contestable).
Negotiate arbitrate regime with potential deterministic outcomes (arbitration)
Lower systematic risk comparator noting the impact of a different regulatory regime
Pilbara rail networks
Take-or-pay model
Ceiling revenue test, full demand risk
Relatively limited exposure to imports
Generally single commodity exposure
Negotiate arbitrate regime with potential deterministic outcomes (arbitration)
Subject to single commodity risk with no regulated revenue cap protection
Class I US railroads
Intensity of competition between Class I Railroads is controversial. Limited competitive switching
Short term contracts
Volumes linked to economic cycles
Extensions to switching regimes remain controversial
Comparable due to exposure to domestic freight activity, limited contractual protection and no regulated revenue cap protection

DETERMINING A WACC ESTIMATE FOR PORT OF MELBOURNE Page 209 of 296
Marine and Ports
Concession agreements
Typically non-regulated
Volumes linked to economic cycles
Exposure to competition
Low operating leverage
Exposure to shipping industry trends (e.g. growth in liner sizes)
Comparable due to exposure to freight activity, limited contractual protection and no regulated revenue cap protection. Impact of low operating leverage significant for systematic risk.
Source: Synergies analysis
Differences relating to the WACC assessment itself include:
• Different cost of debt assumptions – different cost of debt assumptions materially
affect the WACC and are therefore particularly important when comparing a
WACC in the context of:
− a regulated setting (such as PoM for current purposes) – where PoM adopts a
trailing average and other entities comprised in the sample do not, even
though, over time, an entity should be indifferent between a trailing average
approach and an on the day approach
− an unregulated setting – where debt margins are not available on a consistent
basis for the entirety of the comparator set and we need to rely on an alternative
(Bloomberg) that is unlikely to properly reflect the true cost of debt for the
entity.
• Different tax regimes –post-tax comparisons abstract from consideration of
differences in tax regimes and thereby highlight the underlying risk/return
relationships of interest (the focus of 4.1.1(a)). This is particularly the case for
international comparators. Moreover, in the context of domestic comparators, pre-
tax comparisons reflect differences in the gamma, which is unrelated to the
underlying risk/return relationship.
Accordingly, in presenting benchmarked relevant WACC estimates, we believe the
following are most relevant:
• Pre-tax nominal WACC margins – whilst not necessarily the most representative,
this presentation reflects the terms of the Pricing Order. Accordingly, the material
is presented subject to the caveats expressed above. In order to address the cost of
debt issue, we present pre-tax nominal WACC margins for the comparators
adjusting for the BEE’s trailing average cost of debt
• Post-tax unlevered cost of equity margins – on the basis that:
− It removes the distracting influence of the cost of debt and the various
approaches that inform that estimate in different comparators. Moreover, once
the approach to the cost of debt is accepted, the attribution of parameter values

DETERMINING A WACC ESTIMATE FOR PORT OF MELBOURNE Page 210 of 296
is uncontroversial in most cases. As such, removing the cost of debt facilitates
a more straightforward reference point that is most relevant to the workably
competitive market of greatest relevance for the BEE
− The relevant workably competitive market for the assessment of PoM’s cost of
equity is an international capital market. The evidence is clear that in such a
market, a post-tax comparison is the most informative because international
investors cannot access imputation credits.
13.3.2 Pre-tax nominal WACC margins
Firstly, we present regulatory and listed comparator estimates on the basis of WACC
margins (the WACC less the risk-free rate). Regulatory decisions provide a reference
point for establishing an appropriate WACC range, but for a range of reasons, including
the comparability of regulated firms with the BEE as well as the reservations with
applying regulatory benchmarks in the context of the Pricing Order (see Chapter 3) it is
also important to consider evidence on WACC from listed, non-regulated comparators.
As such, we present WACC estimates for the Class I railroads and Marine Ports and
Services entities from our comparator set. The calculations presented here are based on
Bloomberg-generated estimates of the SL CAPM return on equity and return on debt.
We have supplemented these with Black CAPM and FFM estimates for each of the
comparators, so that the calculations are directly comparable with our multi-model
approach for PoM. As per the 2019-20 WACC estimate for PoM, the SL CAPM is given
a 90% weighting, and the Black CAPM and FFM are each given a 5% weighting. All
calculations are expressed as pre-tax nominal estimates using country specific corporate
taxation rates.
These WACC margins are presented in Figure 11 using box and whisker plots. The first
box and whisker plot (dark green) shows the range of recent regulatory decisions.245 The
second box and whisker plot (orange) shows the range of WACC margins for listed
Marine Ports and Services entities, while the third box and whisker plot presents WACC
margins for listed Class I Railroads (light green). The fourth box and whisker plot (dark
blue) presents the range for PoM’s WACC margin, based on the point estimate, lower
range and upper range that we have estimated for the 2019-20 TCS submission.

DETERMINING A WACC ESTIMATE FOR PORT OF MELBOURNE Page 211 of 296
Figure 11 Pre-tax nominal WACC margins
Note: The ERA and IPART decisions are at the draft stage. The ERA released its draft rail WACC decisions in May 2019, but the risk-free
rate it has applied are as at 30 June 2018.
Data source: Synergies calculations, various regulatory decisions, Bloomberg
PoM’s pre-tax nominal WACC margin range is situated marginally above the range of
relevant Australian regulatory transport decisions. Meanwhile, PoM’s pre-tax nominal
WACC margin range is towards the lower end of the WACC margin range for listed
Class I railroads, but substantially above the range of WACC margins for listed Marine
Ports and Services entities. In the following subsection, we disaggregate the WACC
margins into cost of equity and cost of debt margins, in an attempt to isolate the drivers
of these differences.
Regulatory decisions
In the 2018-19 report, PoM’s WACC margin (pre-tax nominal WACC less the risk-free
rate) was situated between the WACC margins adopted by the ERA for Arc
Infrastructure and Pilbara Railways. In the 2019-20 analysis, although PoM’s overall
WACC remains below that of Pilbara Railways, the 80 basis point difference in the risk-
free rate means that PoM’s WACC margin range is now situated slightly above that of
Pilbara railways (although our lower range WACC margin is almost identical to Pilbara
railways). This is predominantly due to changes the ERA has made to parameters that
are not firm specific, which involved a substantial decrease in the MRP along with an
increase in gamma. Together, these changes decrease the pre-tax nominal WACC for
Pilbara railways by approximately 200 basis points. It is important to note that the ERA
has retained its previous asset beta and gearing assumptions for Arc Infrastructure and

DETERMINING A WACC ESTIMATE FOR PORT OF MELBOURNE Page 212 of 296
it has applied only a slight decrease of 0.05 in the Pilbara railways beta in light of changes
in relevant comparator estimates.
Listed comparators
In regard to the listed comparators, the median WACC margin for Class I railroads is 86
basis points above the WACC margin for PoM, and the median WACC margin for listed
Marine Ports and Services entities is significantly lower than the WACC margin for PoM,
by a margin of approximately 270 basis points.
13.3.3 Impact of cost of debt assumptions
Overall WACC comparisons of PoM with international non-regulated listed
comparators are complicated by the low cost of debt assumptions that Bloomberg adopts
for certain companies, including those in our comparator set. This occurs because
Bloomberg applies a debt adjustment factor, which is a multiple of the risk-free rate.
When the risk-free rate is very low (as it currently is both in Australia and
internationally) this leads to relatively low (and, in our view, unrealistic) cost of debt
estimates. As a result, a comparison of cost of equity margins is more informative.
On the other hand, the cost of debt margins Bloomberg applies to the listed comparators
are considerably lower than that arising from the trailing average methodology that we
have implemented for PoM. Debt margins for regulatory and listed comparators are
shown in Figure 12. Median DRPs reported by Bloomberg across both sectors of listed
comparators are less than 1% above the risk-free rate.

DETERMINING A WACC ESTIMATE FOR PORT OF MELBOURNE Page 213 of 296
Figure 12 Debt risk premia (DRP)
Note: The ERA and IPART decisions are at the draft stage. The ERA released its draft rail WACC decisions in May 2019, but the risk-free
rate it has applied are as at 30 June 2018.
Data source: Synergies calculations, various regulatory decisions, Bloomberg
13.3.4 Adjusted pre-tax nominal WACC margins
Clearly, the Bloomberg-generated debt margins for listed comparators are unlikely to be
commensurate with those required by the BEE in its provision of the Prescribed Services.
Moreover, the debt margin for PoM is based on a trailing average which reduces
comparability with a purely forward-looking assessment available from Bloomberg. As
a result, to enhance comparability, we have re-calculated the WACC margins adopting
the same cost of debt as that which we have applied for the BEE. For consistency, we
have also adopted the BEE’s trailing average cost of debt for the Australian regulatory
decisions in this assessment.
Using these revised pre-tax nominal WACC margin estimates, shown in Figure 13, the
lower end of the range for PoM’s WACC margin is situated at the upper end of relevant
Australian regulatory transport decisions. On the other hand, PoM’s WACC margin
range is below the listed Class I Rail WACC margin range and within the interquartile
range of listed Marine Ports and Services (denoted by the orange box).

DETERMINING A WACC ESTIMATE FOR PORT OF MELBOURNE Page 214 of 296
Figure 13 Pre-tax WACC margins adjusted for the BEE’s trailing average cost of debt
Note: The ERA and IPART decisions are at the draft stage. The ERA released its draft rail WACC decisions in May 2019, but the risk-free
rate it has applied are as at 30 June 2018. Both regulatory and listed WACC margins have been adjusted for the BEE’s trailing average
cost of debt.
Data source: Synergies calculations, various regulatory decisions, Bloomberg
13.3.5 Post tax cost of equity margins
In Attachment G, we disaggregate the pre-tax nominal WACC estimate into cost of
equity and cost of debt margins. We find that median cost of equity margins for both
listed Marine Ports and Services firms and Class I Railroads are higher (whether on a
pre-tax or post-tax basis) than the cost of equity margin for PoM. Moreover, we also
examined levered and unlevered cost of equity estimates, the latter removing the effect
of gearing.
Results on a post-tax, unlevered cost of equity basis are displayed in Figure 14. In our
view, this is the most representative benchmarking approach for current purposes.
PoM’s cost of equity margin range is situated towards the lower end of the ranges for
the two listed comparator sectors. Moreover, PoM’s cost of equity margin range sits
within the range of relevant Australian regulatory transport decisions.
Results on a post-tax and/or levered basis are similar and are presented in Attachment
G.

DETERMINING A WACC ESTIMATE FOR PORT OF MELBOURNE Page 215 of 296
Figure 14 Post-tax unlevered cost of equity margins
Note: The ERA and IPART decisions are at the draft stage. The ERA released its draft rail WACC decisions in May 2019, but the risk-free
rate it has applied are as at 30 June 2018.
Data source: Synergies calculations, various regulatory decisions, Bloomberg
13.4 Conclusion
In undertaking these comparisons, we note that precise comparison of WACC decisions
is elusive as the risk profile of each regulated entity in the transport sector differs
materially. Moreover, when comparing regulatory decisions, it is relevant that
regulators adopt different approaches to the estimation of the cost of capital – with
different values being assumed for parameters such as the averaging interval, MRP and
gamma. There is inherent uncertainty on the value of these parameters noting that each
exerts a significant influence on the regulator’s determination of the cost of capital. It is
possible regulators balance to some extent the exercise in regulatory discretion in
making judgements (and tradeoffs) on these parameters.
Accordingly, we consider attempting a precise reconciliation of PoM’s WACC with
regulatory decisions is inviting false precision to the analysis and a more relevant insight
in terms of PoM’s compliance with the Pricing Order can be gained from undertaking a
reconciliation on the basis of broad relativities and rankings. It also highlights the benefit
of broadening the perspective of the comparison beyond regulatory decisions to include
unregulated comparators for the purposes of this aspect of the ESC’s assessment
framework.

DETERMINING A WACC ESTIMATE FOR PORT OF MELBOURNE Page 216 of 296
With these caveats in mind, our main findings highlight that our WACC estimate is
consistent with the returns required by the BEE with a similar degree of risk as that
which applies to PoM in the provision of the Prescribed Services:
• PoM’s pre-tax nominal WACC margin range is situated marginally above the range
of relevant Australian regulatory transport decisions. This is predominantly due to
changes the ERA has made to parameters that are not firm specific, which involved
a substantial decrease in the MRP along with an increase in gamma. Together, these
changes decrease the pre-tax nominal WACC for Pilbara railways by approximately
200 basis points.
• PoM’s pre-tax nominal WACC margin range is below the WACC margin range for
listed Class I railroads, and within the range of WACC margins for listed Marine
Ports and Services entities once we take account of differences between cost of debt
for these entities and that which we have applied for the BEE.
• PoM’s post-tax unlevered cost of equity margin range (which is the most
informative basis for comparison given international differences in tax regimes) is
within the range of comparable Australian regulatory transport decisions and is
situated towards the lower end of cost of equity margins for Listed Marine Ports
and Services and Class I railroads.
We consider that the preceding sections of this chapter demonstrate that our proposed
WACC estimate satisfies the requirements of the Pricing Order. Additionally, Synergies’
approach to the estimation of the WACC parameters for the current and previous TCS
submissions continue to be in compliance with the guiding principles of this step, as we
consider that these naturally form part of a robust WACC estimation process.

DETERMINING A WACC ESTIMATE FOR PORT OF MELBOURNE Page 217 of 296
A Gearing Ratios
The purpose of this attachment is to provide further details on the comparator
companies that Synergies has used to develop its gearing and asset beta assumptions for
the BEE.
A.1 Characteristics of a benchmark efficient entity
The various determinants of capital structure for port service providers present
challenges when defining an ideal capital structure. In defining the BEE, several key
characteristics must be considered.
A.1.1 Cash Flow Volatility
PoM is a landlord port as opposed to a port / terminal operator. As such, its business
model in the context of the provision of Prescribed Services is characterised by relatively
high operating leverage, which is a capital-intensive business model with limited
operating elements, and means that it has a large fixed capital base and relatively low
variable costs. All things held equal, a business with operating leverage is reflected in
greater sensitivity of earnings to changes in sales volumes and revenues compared to
entities with low operating leverage.
PoM’s historical cash flow profile has been significantly affected by levels of economic
activity, which is reflective of the nature of trade activity at the port (e.g. services
provided to facilitate import and export trades, which in turn are driven by domestic
demand and international trade activity) and the captive trade catchment area which it
services (i.e. the majority of trade originating from or destined for Melbourne
metropolitan and greater Melbourne regions).
Moreover, there is some contestability in the broader trade catchment areas serviced by
PoM and, in the longer term, it is expected the port may be subject to increased
competition in the Melbourne market, should the Victorian Government proceed with
procuring a second container port as is contemplated in the study completed by
Infrastructure Victoria. In its October 2017 Victorian Infrastructure Plan, the Victorian
Government announced that it would “undertake strategic planning to identify and
prioritise future freight investment, including consideration of a second container
port.”246
246 Victorian Government (2017). Victorian infrastructure plan, October, p.43.

DETERMINING A WACC ESTIMATE FOR PORT OF MELBOURNE Page 218 of 296
A.1.2 Investment Needs
Capital investment needs for port infrastructure assets can be characterised as “lumpy,”
in the sense that capacity expansions generally can only be undertaken in relatively large
increments. This can lead to a material variation in capital structure over time in line
with the need to upgrade and expand port facilities.
A.1.3 Debt Serviceability
The assessment techniques of credit rating agencies also provide guidance on the
characteristics of a BEE. In Moody’s rating methodology for Privately Managed Port
Companies, their considerations include, but are not limited to, the following:247
• Market Position:
− How large is the port, and to what extent does it form an essential part of the
local economy?
− Does it have an effective monopoly on port services in the region, or is it a
major transhipment hub?
− What is the quality of the connecting road and/or rail infrastructure? Are
there any operational restrictions? (For example, unable to accept certain ship
types, or other capacity limitations)
• Diversity of Customer Base
− How exposed is the port to volume variation?
− How dominant are its main customers?
• Capital Program and Financial Profile
− How much expansion capital expenditure is planned?
− What proportion of revenues come from non-core activities?
• Nature of Asset Ownership
− Are all key port assets held outright in perpetuity and controlled by port
management, or are they subject to short term operating leases?
• Key Credit Metrics
− How does the port perform against key credit metrics, the most important of
which are:
247 Moody’s (2016). Privately managed port companies rating methodology, 15 September.

DETERMINING A WACC ESTIMATE FOR PORT OF MELBOURNE Page 219 of 296
o funds from operations (FFO) to debt ratio. FFO can be defined as cash flow
from operations prior to movements in working capital. A lower
FFO/Debt ratio indicates that the firm is more highly leveraged. FFO /
Debt is particularly relevant to credit rating agencies – a cashflow-based
gearing metric is seen to be more relevant for high cash yielding
infrastructure businesses;
o interest coverage ratio is typically defined as the ratio of EBIT to interest
payable on debt. As such, it measures a firm’s ability to service its debt.
Evaluating the interest coverage ratio of comparable companies provides
an indication of the necessary interest cover required for an efficient
benchmark entity.
A.2 Comparator Companies
Table 37 lists the 5-year gearing estimates for the 19 comparator companies that emerged
from the process set out in chapter 5.
Table 37 Gearing for full list of comparators (19 entities)
Company Country Sector Gearing
Qube Holdings Australia Marine Ports and Services 17%
Port of Tauranga New Zealand Marine Ports and Services 4%
Hamburger Hafen und Logistik
Germany Marine Ports and Services 22%
Sakurajima Futo Kaisha
Japan Marine Ports and Services 24%
Rinko Corporation Japan Marine Ports and Services 55%
Dongbang Transport Logistics
South Korea Marine Ports and Services 61%
China Merchants Port Holding Company
Hong Kong Marine Ports and Services 27%
COSCO Shipping Ports
Hong Kong Marine Ports and Services 34%
Dalian Port Hong Kong Marine Ports and Services 28%
Hutchinson Port Holdings Trust
Singapore Marine Ports and Services 50%
Global Ports Investments
International Marine Ports and Services 60%
Aurizon Holdings Australia Railroads 24%
CSX Corporation US Railroads 24%
Genesee & Wyoming Inc.
US Railroads 34%
Kansas City Southern US Railroads 18%
Norfolk Southern Corporation
US Railroads 22%

DETERMINING A WACC ESTIMATE FOR PORT OF MELBOURNE Page 220 of 296
Company Country Sector Gearing
Union Pacific Corporation
US Railroads 14%
Canadian National Railway Company
Canada Railroads 12%
Canadian Pacific Railway
Canada Railroads 20%
Median 24%
Average 29%
Source: Bloomberg
Table 38 lists the median and average gearing ratios for our full sample of companies.
We have also divided these results by sector. Using the full sample, the median gearing
level is 24% and the average gearing level is 29%.
Table 38 Gearing by sector
Sector Average Sector Median Sector Minimum Sector Maximum
Marine Ports and Services 35% 28% 4% 61%
Railroads 21% 21% 12% 34%
Source: Bloomberg
DETERMINING A WACC ESTIMATE FOR PORT OF MELBOURNE Page 221 of 296
B Beta diagnostics
The purpose of this attachment is to present estimates that reinforce the robustness of
our beta analysis. To this end we present estimates over ten years to complement our
primary estimation period of five years. We have estimated portfolio betas for each of
the three industry sectors (Marine Ports and Services, Railroads and Airports), and we
have also experimented with different monthly starting days for the monthly returns
used in our beta estimates. Comparators with market capitalisations below $US100
million that have been included for the first time this year are shaded in grey.
B.1 Further information on FTSE country classifications
The classification of countries into Developed, Advanced Emerging, Secondary
Emerging and Frontier are displayed in Figure 15.

DETERMINING A WACC ESTIMATE FOR PORT OF MELBOURNE Page 222 of 296
Figure 15 Developed, Advanced Emerging, Secondary Emerging and Frontier classifications
Data source: FTSE
The criteria comprising the Quality of Markets Matrix used to assign countries to the
various classifications is displayed in Figure 16.

DETERMINING A WACC ESTIMATE FOR PORT OF MELBOURNE Page 223 of 296
Figure 16 FTSE Quality of Markets Matrix
Note: “X” indicates that the criterion must be satisfied
Data source: FTSE
B.1.1 Use by financial practitioners
FTSE classifies all countries included in its global indexes into one of three categories:
Developed, Advanced Emerging and Secondary Emerging. Frontier countries do not
typically feature in these indices.
The following indices (and associated ETFs) use the country inclusion criteria:
• FTSE Emerging Markets All Cap China A Inclusion Index
− Vanguard FTSE Emerging Markets ETF (VWO)
− Invesco FTSE RAFI Emerging Markets ETF (PXH) is based on the FTSE RAFI
Emerging Markets Index. The Fund will generally invest at least 90% of its total
assets in the securities that comprise the Index as well as American Depository

DETERMINING A WACC ESTIMATE FOR PORT OF MELBOURNE Page 224 of 296
Receipts (ADRs) and global depositary receipts (GDRs) that represent
securities in the Index.
• FTSE Developed All Cap ex US Index
− Schwab International Equity ETF (SCHF)
− Vanguard FTSE Developed Markets ETF (VEA)
• FTSE Developed Asia Pacific All Cap Index
− Vanguard FTSE Pacific ETF (VPL)
• FTSE Developed Europe All Cap Index
− Vanguard FTSE Europe ETF (VGK)
• FTSE All-World ex US index
− Vanguard FTSE All-World ex-US ETF (VEU)
• FTSE Global All Cap Index
− Vanguard Total World Stock ETF (VT)
• FTSE Global Small Cap ex US Index
− Vanguard FTSE All-World ex-US Small-Cap ETF (VSS)
• FTSE Global All Cap ex US Index
− Vanguard ESG International Stock ETF (VSGX)
• FTSE High Dividend Yield Index
− Vanguard High Dividend Yield ETF (VYM)
• FTSE Developed high dividend yield index
− Vanguard International High Dividend Yield Index Fund (VYMI)
This suggests that FTSE classifications are sufficiently well-accepted by financial markets
such that they are used in high profile indices. Considering that Vanguard has $US5.3
trillion in assets under management (second highest in the world), as of September 2018,
this suggests that the FTSE classifications are influential on investor behaviour.
B.1.2 Use in academic literature
The FTSE country classifications are also recognised in the academic community as a
robust way of delineating countries. For instance, Borges (2010) uses the FTSE
classifications to test the validity of the Efficient Markets Hypothesis (EMH) in European

DETERMINING A WACC ESTIMATE FOR PORT OF MELBOURNE Page 225 of 296
stock markets that were defined as developed.248 The choice of developed stock markets
stemmed from the expectation that these markets would be most likely to adhere to the
EMH. Kim and Shamsuddin (2008) conduct a similar exercise for Asia, finding that the
FTSE country classification is a key determinant of whether the EMH is likely to hold for
a particular country.249 More recently, Uzhegova (2015) employed the FTSE country
classifications to investigate the determinants of bank performance and profitability
across countries.250
B.1.3 Media attention
While less authoritative than academic evidence or financial market practice, we have
uncovered articles that suggest country classifications may help guide investors in
portfolio formation. For example, when Poland was reclassified to Developed status last
year, this received substantial coverage by business news outlets such as Forbes and
Bloomberg.251 252
B.2 Empirical estimates
Note that the sample has been reduced from 51 to 19 comparator companies. We have
removed all airports from the comparator sample and restricted admissible countries to
those with an FTSE Developed classification.
Table 39 Beta Comparables over 5 and 10 year periods (19 entities)
Comparables Country Sector 5 Yr Asset Beta 10 Year Asset Beta
Qube Holdings Australia Marine Ports and Services
1.22 0.90
Port of Tauranga New Zealand Marine Ports and Services
0.47 0.58
Hamburger Hafen und Logistik
Germany Marine Ports and Services
0.53 0.81
Sakurajima Futo Kaisha
Japan Marine Ports and Services
1.02 0.58
248 Borges, Maria Rosa. “Efficient Market Hypothesis in European Stock Markets.” The European Journal of Finance 16,
no. 7 (October 2010): 711–26. https://doi.org/10.1080/1351847X.2010.495477.
249 Kim, Jae H., and Abul Shamsuddin. “Are Asian Stock Markets Efficient? Evidence from New Multiple Variance Ratio Tests.” Journal of Empirical Finance 15, no. 3 (June 2008): 518–32. https://doi.org/10.1016/j.jempfin.2007.07.001.
250 Uzhegova, Olga. “The Relative Importance of Internal Factors for Bank Performance in Developed and Emerging Economies.” Mediterranean Journal of Social Sciences 6, no. 3 (May 1, 2015): 277.
251 Aitken, R. (2018). Polish Stocks: Should You 'Fill Your Boots' On FTSE's Developed Market Upgrade? Forbes, 22 September. Accessed from: https://www.forbes.com/sites/rogeraitken/2018/09/22/polish-stocks-should-you-fill-your-boots-on-ftses-developed-market-upgrade/#67cc4f392880
252 Krasuski, K. (2018). Poland Targets New Investors as Stocks Jump After FTSE Promotion. Bloomberg, 25 September.

DETERMINING A WACC ESTIMATE FOR PORT OF MELBOURNE Page 226 of 296
Comparables Country Sector 5 Yr Asset Beta 10 Year Asset Beta
Rinko Corporation Japan Marine Ports and Services
0.39 0.34
Dongbang Transport Logistics
South Korea Marine Ports and Services
0.82 0.46
China Merchants Port Holding Company
Hong Kong Marine Ports and Services
0.79 0.82
COSCO Shipping Ports
Hong Kong Marine Ports and Services
0.44 0.75
Dalian Port Hong Kong Marine Ports and Services
0.79 0.64
Hutchinson Port Holdings Trust
Singapore Marine Ports and Services
0.49 0.51
Global Ports Investments
International Marine Ports and Services
0.52 0.47
Aurizon Holdings Australia Railroads 0.38 0.44
CSX Corporation US Railroads 0.98 1.00
Genesee & Wyoming Inc.
US Railroads 1.04 1.08
Kansas City Southern
US Railroads 0.73 1.06
Norfolk Southern Corporation
US Railroads 1.11 0.93
Union Pacific Corporation
US Railroads 0.94 0.93
Canadian National Railway Company
Canada Railroads 0.80 0.52
Canadian Pacific Railway
Canada Railroads 0.94 0.83
Median 0.79 0.75
Average 0.76 0.72
Source: Bloomberg
B.3 Portfolio Betas
An informative robustness test for our beta estimates is to evaluate the beta for each
sector using a value-weighted portfolio of the comparable companies, rather than
averaging across the firms in each sector. The returns of each stock in the portfolio were
weighted by market capitalisation in each month. In a similar way, the monthly market
return was calculated as the weighted average of the monthly returns for each
company’s home country benchmark. Likewise, each company’s gearing ratio was also
weighted by its market capitalisation. The results from these estimates are presented in
Table 40.

DETERMINING A WACC ESTIMATE FOR PORT OF MELBOURNE Page 227 of 296
Table 40 Portfolio Asset Beta Estimates
Timeframe Marine Ports and Services Railroads All firms
5 Year Portfolio 0.72 1.01 0.97
10 Year Portfolio 0.78 0.92 0.90
Source: Bloomberg, Synergies calculations
For the Marine Ports and Services sector, the 5-year portfolio beta is 0.72, while the 10-
year portfolio beta is 0.78. These estimates are higher than those that result from simple
averages or medians of the sample (see Chapter 8). This can be attributed to the
weighting of firms according to their market capitalisations. For example, China
Merchants Port Holding Company (which has a 5-year asset beta of 0.79 and 10-year
asset beta of 0.82) accounts for approximately 30% of total market capitalisation for the
11 Marine Ports and Services firms. As such, this entity will receive a larger weighting
than it would in an assessment of the average or median asset beta for the sector, thereby
influencing the overall estimate.
In regard to the Railroads sector, the 5-year and 10-year portfolio betas (1.01 and 0.92,
respectively) are marginally higher than the corresponding median asset betas for the
sector (0.94 and 0.93 over 5 and 10 years, respectively). Again, this is likely to be driven
by differences in market capitalisation among the firms in the sample. For example,
Aurizon Network, which has the lowest asset beta in the sample, accounts for less than
3% of total market capitalisation.
The portfolio betas for the full sample of firms (i.e. both Marine Ports and Services and
Railroads) are closer to the portfolio beta estimates for Railroads than for Marine Ports
and Services. 89% of the total market capitalisation of the comparator set is accounted
for by the Railroads sample. As a result, the overall portfolio beta will more closely
resemble the estimate for this sector.
B.4 Beta estimates using different monthly starting days
By default, the monthly returns used in our beta analysis are calculated at the end of
each month. To add robustness to our beta estimates, we have compiled supporting beta
estimates using every other day of the month, and have averaged across these individual
estimates. Results over both a five-year and ten-year time frame are displayed in Table
41, and reinforce an asset beta point estimate of 0.70, as well as an upper range of 0.75.
Table 41 Beta estimates averaged across different starting days
Timeframe 31-day Average 31-day Median
5 Years 0.76 0.80
10 Years 0.73 0.75

DETERMINING A WACC ESTIMATE FOR PORT OF MELBOURNE Page 228 of 296
Note: To accommodate different month lengths throughout the year, we have also taken averages over 28 days. This causes a difference
of only 0.01 in the median for the 10 year estimates, and a difference of only 0.01 in the average for the 5 year estimates.
Source: Bloomberg, Synergies
The results presented in the table above are based on 31-day averages. If the given
starting date falls on a weekend or public holiday in a particular month, we use the most
recent trading day as an approximation. For example, where the starting day is set to be
the 15th of the month, if the 15th falls on a weekend, the value from the previous trading
day is used as an approximation. To accommodate different month lengths throughout
the year, we have also taken averages over 28 days. This has virtually no impact on the
findings.
B.5 Statistical significance as a filtering criterion
In the interim commentary, the ESC was concerned that the exclusion of firms with
negative and/or statistically insignificant betas may impart upward bias on PoM’s beta
estimate. The ESC generated the following chart, based on data that we provided to them
in a follow-up information request.
Figure 17 ESC chart of betas and standard errors for included and excluded firms
Data source: ESC analysis using Synergies’ data
The ESC’s inference from this chart was that the level of statistical confidence in the beta
estimates (as measured by the standard errors) does not change over the range of beta
values. Our concern with this conclusion is that the scale originally used for this graph
makes the variation in standard errors look very small. Moreover, standard errors are
always positive by construction, regardless of whether the associated beta is positive or

DETERMINING A WACC ESTIMATE FOR PORT OF MELBOURNE Page 229 of 296
negative. This means that firms with very negative betas (which in a transport context
are theoretically unlikely and should be uncontentiously classified as outliers) will have
high positive standard errors, further masking any upward trend in standard errors as
beta increases.
To see if this pattern persists on a different scale without the inclusion of negative beta
firms, we have attempted to replicate the ESC’s chart. We display the data on a more
informative scale, and we also indicate where the standard error would have to be for
the beta to be statistically significant.253
As per the ESC’s chart, the blue points represent asset betas for each comparator and the
red points denote the standard errors for each of these comparators. The new addition
to this chart is the line of black points. These show the standard error that the beta would
need to have to achieve a t-statistic of 2 (i.e. to be statistically significant at the 5% level).
If the red point for a given firm is below the black point, the standard error is sufficiently
low for the beta to be statistically significant. Otherwise, if the red point for a given firm
is above the black point, the standard error is too high and the estimate is statistically
insignificant.
This revised graph demonstrates that, contrary to the ESC’s conclusion, the statistical
confidence of the beta estimates does change over the range of beta values. There are
firms with low betas that are statistically significant, and there are firms with low betas
that are not significant. Moreover, a linear trendline fitted to the comparator standard
errors (shown in red) is clearly upward sloping, even if not increasing quite as steeply
as the statistical significance thresholds (shown in black).
253 This analysis is based on the 2018 beta estimates, so that it is compatible with the ESC’s analysis in the interim
commentary.

DETERMINING A WACC ESTIMATE FOR PORT OF MELBOURNE Page 230 of 296
Figure 18 Revised graph of ESC analysis
Data source: Synergies analysis based on ESC commentary
Based on this analysis, we maintain that filtering betas on the basis of statistical
significance is an important component of the comparator selection process. This
criterion ensures that we are not inadvertently including firms with statistically “noisy”
returns, where disruptive firm-specific events are causing their returns to fluctuate out
of sync with the broader market. The ESC contended that this filtering process would be
biased towards including firms with higher betas and excluding firms with lower betas.
In principle, if different firms’ betas are measured with the same level of precision, then
there is no reason why their standard errors should not be proportional to the magnitude
of their betas.
B.6 Comparator descriptions
The following two tables present descriptions of the comparators that we have included
in our sample.

DETERMINING A WACC ESTIMATE FOR PORT OF MELBOURNE Page 231 of 296
Table 42 Marine Ports and Services comparators
Company Country Description
Qube Holdings Australia Qube Holdings Ltd. is a logistics company. The Group operates in divisions covering Automotive, Bulk and General Stevedoring, Landside Logistics and Strategic Development Assets.
Port of Tauranga New Zealand
Port of Tauranga Limited activities include the provision of wharf facilities, back up land for the storage and transit of import and export cargo, berthage, cranes, tug and pilotage services for exporters, importers and shipping companies and the leasing of land and buildings. The Group also operates a container terminal and has bulk cargo marshalling operations.
Hamburger Hafen und Logistik
Germany
Hamburger Hafen und Logistik AG (HHLA) provides services to the port in the European North Range. The Company's container terminals, transport systems, and logistic services provide a network between overseas port and European hinterland.
China Merchants Port Holding Company
Hong Kong
China Merchants Port Holdings Company Limited, through its subsidiaries and associated companies, operates ports, airports, and other container and cargo terminals around the world. The Company also manages toll roads, properties, and assets management.
COSCO Shipping Ports
Hong Kong
Cosco Shipping Ports Limited, through its subsidiaries, provides ports services worldwide. The Company operates container terminals, and provides container handling, storage, transportation, management, and stevedoring services.
Dalian Port Hong Kong
Dalian Port (PDA) Company Limited provides international and domestic cargo handling, transportation, transit, warehousing and other port operations and logistics services. The Company also provides oil and liquid chemicals terminal and related logistics services, tugging, pilotage, cargo handling and information technology services.
Hutchinson Port Holdings Trust
Singapore
Hutchison Port Holdings Trust is a container port business trust. The Trust invests in, develops, operates, and manages deep-water container ports in the Pearl River Delta. Hutchison Port Holdings also invests in other types of port assets such as river ports, as well as undertake certain port ancillary services that include warehousing and distribution services.
Global Ports Investments
International
Global Ports Investments PLC provides terminal operator services. The Company offers import and export logistics operations including oil products, container and other cargo operations. Global Ports operates ports and termials in Finland, Estonia and Russia.
Dongbang Transport Logistics
South Korea
Dongbang Transport Logistics Co., Ltd. provides stevedoring, forwarding, and container storage services at the local ports in South Korea. The Company also offers inland and marine transportation services.
Rinko Corporation Japan
Rinko Corporation is a marine transport company based at Niigata Port. The Company also provides truck transportation, warehousing and storage, and freight handling services. Rinko also leases real estate, sells and repairs construction machinery, and operates customs brokerage.
Sakurajima Futo Kaisha Ltd
Japan
Sakurajima Futo Kaisha, Ltd. provides marine transportation and warehousing services at the Osaka Bay areas. The Company mainly handles imported raw materials, petroleum products, and frozen food. The Company also provides land transportation, customs clearance, and insurance agency services.
Source: Bloomberg

DETERMINING A WACC ESTIMATE FOR PORT OF MELBOURNE Page 232 of 296
Table 43 Railroad comparators
Company Country OECD Description
Aurizon Holdings Australia Yes
Aurizon Holdings Ltd is a rail freight company. The Company provides coal, bulk and general freight haulage services, operating on the central queensland coal network (CQCN) and including specialized track maintenance and workshop support functions.
CSX Corporation US Yes
CSX Corporation is an international freight transportation company. The Company provides rail, intermodal, domestic container-shipping, barging, and contract logistics services around the world. CSX's rail transportation services are provided principally throughout the eastern United States.
Genesee & Wyoming Inc.
US Yes
Genesee & Wyoming Inc., through its subsidiaries, owns and operates short line and regional freight railroads and provides related rail services. The Company also offers railroad switching and related services to the United States industries with extensive railroad facilities within their complexes. Genesee & Wyoming operates in the United States and Australia.
Kansas City Southern US Yes
Kansas City Southern, through its subsidiary, is the holding company for transportation segment subsidiaries and affiliates. The Company operates a railroad system that provides shippers with rail freight services in commercial and industrial markets of the United States and Mexico.
Norfolk Southern Corporation
US Yes
Norfolk Southern Corporation provides rail transportation services. The Company transports raw materials, intermediate products, and finished goods primarily in the Southeast, East, and Midwest and, via interchange with rail carriers, to and from the rest of the United States. Norfolk Southern also transports overseas freight through several Atlantic and Gulf Coast ports
Union Pacific Corporation
US Yes
Union Pacific Corporation is a rail transportation company. The Company's railroad hauls a variety of goods, including agricultural, automotive, and chemical products. Union Pacific offers long-haul routes from all major West Coast and Gulf Coast ports to eastern gateways as well as connects with Canada's rail systems and serves the major gateways to Mexico.
Canadian National Railway Company
Canada Yes
Canadian National Railway Company operates a network of track in Canada and the United States. The Company transports forest products, grain and grain products, coal, sulfur, and fertilizers, intermodal, and automotive products. Canadian National operates a fleet of locomotives and railcars.
Canadian Pacific Railway
Canada Yes
Canadian Pacific Railway Limited is a Class 1 transcontinental railway, providing freight and intermodal services over a network in Canada and the United States. The Company's mainline network serves major Canadian ports and cities from Montreal to Vancouver, and key centers in the United States Midwest and Northeast.
Source: Bloomberg
B.7 Excluded comparators
The following tables provide a list of firms that were excluded from our sample, whether
because of statistical insignificance, insufficient data, or incompatibility with the BEE.
Table 44 Marine Ports and Services comparators excluded from sample
Firm Comments
Piraeus Port Authority FTSE Advanced Emerging classification
Thessaloniki Port Authority FTSE Advanced Emerging classification

DETERMINING A WACC ESTIMATE FOR PORT OF MELBOURNE Page 233 of 296
Firm Comments
Sociedad Matriz SAAM FTSE Secondary Emerging classification
Luka Koper FTSE Frontier classification
Isewan Terminal Service Statistically insignificant
Wilson Sons FTSE Advanced Emerging classification
ADSEZ FTSE Secondary Emerging classification
Asian Terminals FTSE Secondary Emerging classification
International Container Terminal Services FTSE Secondary Emerging classification
Kingston Wharves No FTSE classification
Prumo Logistica Now delisted
Pakistan International Container Terminal FTSE Secondary Emerging classification
DP World FTSE Secondary Emerging classification
Alexandria Containers & Goods FTSE Secondary Emerging classification
China Container Terminal Corporation FTSE Advanced Emerging classification
Summit Alliance Port Ltd FTSE Frontier classification
United Arab Shipping Co SAG FTSE Secondary Emerging classification
Bremer Lagerhaus-Gesellschaft AG Statistically insignificant
Eurokai GmbH Statistically insignificant
Logistec Corporation Statistically insignificant
Essar Ports Statistically insignificant
Salalah Port Services Company SAOG Statistically insignificant
Puerto Ventanas S.A. Statistically insignificant
Tradia Corporation Statistically insignificant
Lyttelton Port Company Limited Statistically insignificant with partially incomplete data
South Port New Zealand Limited Statistically insignificant
Point Lisas Industrial Port Development Corporation Limited Statistically insignificant
Namyong Terminal Negative beta
Mercantile Ports and Logistics Limited (MPL) Statistically insignificant
Shanghai International Port Chinese-listed (issues with openness of capital markets)
Ningbo Zhoushan Port Company Chinese-listed
Kamigumi Significantly diversified
Tianjin Port Development Holdings Sale of materials accounts for majority of revenue
Tianjin Port Co. Chinese-listed
Mitsubishi Logistics Corporation Significant diversification, port and harbour operations only 10% of revenue

DETERMINING A WACC ESTIMATE FOR PORT OF MELBOURNE Page 234 of 296
Firm Comments
Nissin Corporation 28% travel services and real estate, and port services are only a subset of its logistics business
Sumitomo Warehouse Co. Revenue is substantially diversified
Xiamen Port Development Co. Chinese-listed
Qingdao Port International Co. Missing observations
Xiamen International Port Company Trading business of merchandise accounted for 61.5% of revenue in FY2016.
Guangzhou Port Company Limited Chinese-listed
Anhui Wanjiang Logistics Group Co Chinese-listed
COSCO SHIPPING International (Hong Kong) Shipping
Novorossiysk Commercial Sea Port Handles mainly crude oil
Tangshan Port Group Co. Chinese-listed
Qinhuangdao Port Company Limited Some observations missing
Rizhao Port Co. Chinese-listed
Sebang Some diversification
Meiko Diversification beyond port operations
Yingkou Port Liability Chinese-listed
Westports Holdings Berhad Insufficient observations
Ocean Wilsons Holdings Holding company
Beibuwan Port Co. Chinese-listed
Touax Unrelated operations
EMS Seven Seas Unrelated operations
Jinzhou Port Co. Chinese-listed
National Marine Dredging Company Not relevant – dredging
Chongqing Gangjiu Co. Chinese-listed
Toyo Wharf and Warehouse Port and harbour operations only 23% of revenue
Shenzhen Chiwan Wharf Holdings Chinese-listed
Bintulu Port Holdings Berhad Holding company
Muehlhan Surface protection solutions
Contracting & Marine Services Company Services and maintenance
Zhuhai Port Co. Chinese-listed
Societe d'Exploitation des Ports, dba Marsa Maroc Missing data
Westshore Terminals Very high gearing, single commodity exposure
Santos Brasil Participacoes S.A. Missing data
Andino Investment Holding Statistically insignificant

DETERMINING A WACC ESTIMATE FOR PORT OF MELBOURNE Page 235 of 296
Firm Comments
Braemar Shipping Services Unrelated operations
Daito Koun Imports frozen foods
Jiangsu Lianyungang Port Co. Chinese-listed
Saudi Industrial Services Company (Sisco) Unrelated services
Gemadept Corporation Shipping company
Vostochney Port Missing data
Kuwait & Gulf Link Transport Co. (K.S.C) Unrelated services
Sical Logistics Ltd. Diversified into trucking and rail
Zhangjiagang Freetrade Science & Technology Group Co. Chinese-listed
Global Ports Holding Limited Holding company
Fushiki Also runs liners
Sinwa Limited Unrelated - supply, logistics and services
Port of Hai Phong Missing data
Gujarat Pipavav Port Ltd. Missing gearing data
China Dredging Environment Protection Holdings Unrelated – dredging
Puertos y Logistica Has unrelated subsidiaries - also statistically insignificant
Dredging Corporation of India Unrelated - dredging
Overseas Commerce Ltd. Missing data
Novorossyisk Grain Plant PJSC Missing data
Suria Capital Holdings Berhad Holding company
Gateway Distriparks Limited Limited port exposure
Navkar Corporation Limited Missing data
Portuaria Cabo Froward Also involved in construction
Gold Bond Group Holding company
General Silos & Storage Single commodity exposure
Perak Corporation Berhad Statistically insignificant
Nanjing Port Co. Chinese-listed
Zhuhai Winbase International Chemical Tank Terminal Co. Chinese-listed
Dinh Vu Port Investment & Development Statistically insignificant
Harbor Star Shipping Services, Inc. Shipping services, statistically insignificant
CIG Yangtze Ports Plc Missing data
Luka Ploce d.d. Statistically insignificant
Uljanik Plovidba DD Very high gearing
Pelayaran Nasional Bina Buana Raya Tbk Unrelated operations

DETERMINING A WACC ESTIMATE FOR PORT OF MELBOURNE Page 236 of 296
Firm Comments
DaNang Port Joint Stock Company Very few observations
Globalport 900, Inc. Incomplete data
Hai An Transport & Stevedoring JSC Statistically insignificant
Luka Rijeka dd Primarily support services
Dong Nai Port JSC Statistically insignificant
Odessos Shiprepair Yard AD Repair services
VMS Industries Ltd. Ship dismantling
Comvex SA Statistically insignificant
Socep S.A. Statistically insignificant
Starlog Enterprises Ltd Unrelated operations
exactEarth Ltd. Satellite data services
Cat Lai Port JSC Insufficient data
Vietnam Maritime Development JSC Missing data
PT Indo Straits Tbk Unrelated operations
Sutton Harbour Holdings Not directly relevant, statistically insignificant
Camper & Nicholsons Marina Investments Marinas
Marine Supply and Engineering Service JSC Unrelated services
PT ICTSI Jasa Prima Tbk Statistically insignificant
Canal Shipping Agencies Company Shipping agency
Cia de Remorcare Maritima Coremar SA Constanta Unrelated services, missing data
Sino-Global Shipping America Ltd. Shipping agency
Jadroagent D.D. Shipping agency
Doan Xa Port Joint Stock Company Statistically insignificant
Western India Shipyard Limited (WISL) Repair services
Bangpakong Terminal Public Company Limited Missing data
Taiwan Allied Container Terminal Corp. Statistically insignificant
Marsden Maritime Holdings Limited Holding company
The Vegetexco Port JSC Statistically insignificant
Natura Hue Chem Ltd. Unrelated operations
C Security Systems AB Communications and technology
JITF Infralogistics Limited Repair services
Companhia Docas de Imbituba Missing data, statistically insignificant
Movis Cote d'Ivoire Ivory Coast
Pakistan International Bulk Terminal Limited Insufficient observations

DETERMINING A WACC ESTIMATE FOR PORT OF MELBOURNE Page 237 of 296
Firm Comments
Yangtze River Development Limted Real estate
Quayside Holdings Ltd Part owner of Port of Tauranga
Source: Bloomberg, Synergies analysis
Table 45 Railroad comparators excluded from sample
Firm Comments
Globaltrans Investment Statistically insignificant
Container Corporation of India Limited FTSE Secondary Emerging classification
VTG AG Statistically insignificant
Center for Cargo Container Traffic TransContainer PJSC Statistically insignificant
East Japan Railway Company Passenger, too diversified
Central Japan Railway Company Diversified, not freight
West Japan Railway Company Too Diversified
Kintetsu Corp Too Diversified
Tokyu Corporation Too Diversified
Daqin Railway Co., Ltd. Chinese-listed
Hankyu Hanshin Holdings, Inc. Passenger
MTR Corporation Limited Public Transport
Nagoya Railroad Co., Ltd. Passenger
Go-Ahead Group PLC Buses and Taxis as well
Tobu Railway Co., Ltd. Passenger
Odakyu Electric Railway Co., Ltd. Passenger, Diversified
Keio Corporation Passenger, Diversified
Kyushu Railway Company Passenger, Diversified
Nishi-Nippon Railroad Co. Passenger, Diversified
Keikyu Corporation Passenger, Diversified
Guangshen Railway Company Limited Chinese-listed
Sotetsu Holdings, Inc. Passenger, Diversified
Keisei Electric Railway Co., Ltd. Passenger, Diversified
Nankai Electric Railway Co., Ltd. Passenger, Diversified
Cosan Logistica SA Incomplete Data
Rumo S.A. Incomplete Data
Rumo Logistica Operadora Multimodal S.A. Incomplete Data
PKP Cargo S.A Incomplete Data
China Railway Tielong Container Logistics Co., Ltd. Diversified, Chinese-listed

DETERMINING A WACC ESTIMATE FOR PORT OF MELBOURNE Page 238 of 296
Firm Comments
BLS AG Insignificant, Missing data
China High-Speed Railway Technology Co., Ltd. China, Maintenance
FNM S.p.A Holding company, strong public transport emphasis
Kobe Electric Railway Co., Ltd. Passenger, other diversified services
Berner Oberland-Bahnen AG Incomplete Data, Mountain Railways
Shin-Keisei Electric Railway Co., Ltd. Bus, Real Estate
Jungfraubahn Holding AG Tourism-related
BTS Group Holdings Public Transport
BVZ Holding AG Passenger railway
Shanghai Shentong Metro Co. Ltd. Subway Transit Systems
Keifuku Electric Railroad Co., Ltd. Diversified
Forestiere Equatoriale Ivory Coast
Chichibu Railway Co., Ltd. Passenger and Bus as well as freight
The Central Provinces Railways Co. Ltd. Construction
Las Vegas Railway Express Passenger
GMexico Transportes Insufficient data – listed only in November 2017
Source: Bloomberg, Synergies analysis

DETERMINING A WACC ESTIMATE FOR PORT OF MELBOURNE Page 239 of 296
C Supplementary information on cost of equity methodologies
The purpose of this attachment is to provide additional detail on the well-accepted cost
of equity approaches discussed in Chapter 6.
C.1 Black CAPM
C.1.1 SFG Consulting’s estimate of the zero-beta premium254
SFG quantifies the relationship between realised portfolio returns, market returns and
beta, ultimately arriving at an estimate of the zero-beta premium.
Its first step is to form portfolios. Rather than analyse returns on individual stocks, it
analyses returns on portfolios of stocks to minimise the “noise” in historical stock
returns.
Its second step is to perform a regression of portfolio returns every four weeks on two
independent variables – beta × market returns and (1 – beta). SFG demonstrates that the
coefficient on the second independent variable (1 – beta) is an estimate of the zero-beta
return. To estimate the zero-beta premium, SFG subtracts the average four-weekly risk-
free rate over the sample period, measured as the yield to maturity on 10-year
government bonds.
Using this two-step process, SFG’s estimated return on the zero-beta asset lies between
the normal estimate of the risk-free rate of interest and the average market return. The
zero-beta premium (the difference between the zero-beta return and the estimate of the
risk-free rate) is estimated at 0.239% over four weeks or 3.34% per year.255
We consider this estimate is the most robust estimate of this parameter currently
available in an Australian context.
C.1.2 Synergies’s updated estimate of the zero-beta premium
The ESC made a number of observations about our reliance on the SFG zero beta
premium estimate. This year, we have generated an updated zero beta premium
estimate, using data from 1993 to 2018. Our revised zero beta premium estimate is 3.36%,
which is very close to the SFG estimate from 2014.256 With a t-statistic of 0.61, the estimate
254 SFG Consulting (2014a).
255 SFG Consulting (2014a), p.27.
256 The monthly estimate is 0.28%, which corresponds to an annual estimate of 3.36%.

DETERMINING A WACC ESTIMATE FOR PORT OF MELBOURNE Page 240 of 296
remains statistically insignificant, but it is notable that the estimate has remained very
stable over the last 5 years.
C.2 Fama-French Model (FFM)
C.2.1 Beta factors
The FFM is based on the principle that excess returns to the market must be assessed
having regard to the following three explanatory factors:
• the returns on the market as a whole;
• HML (High Minus Low) is the average return on two value portfolios minus the
average return on two growth portfolios; and
• SMB (Small Minus Big) is the average return on three small portfolios minus the
average return on three big portfolios.
C.2.2 Estimating the FFM cost of equity
The companies examined in the FFM are the same as those used for the SL CAPM
analysis. Estimates of the factor premiums for the US and Japan were sourced from
Professor Kenneth French’s website, an internationally recognised source.257 However,
country-specific factors are not available for all firms in our sample. In these instances,
we have employed global factor estimates, also acquired from the website of Professor
Kenneth French. The global factor estimates are used for the SMB and HML returns, but
the returns for the market as a whole are based on the company’s local market return,
rather than the global market return. This is likely to result in a more robust and stable
estimate over time. Moreover, the market beta estimate for the FFM will more closely
resemble the beta estimate for the CAPM.
In the case of Australia, estimates of the factor premiums must also be constructed. For
the estimates in this report, we have extended the factor premium dataset to the end of
2018, following the methodology set out in SFG Consulting (2014), which is in turn based
on the approach of Brailsford, Gaunt and O’Brien (2012).
The Australian context requires careful consideration. Estimation of the small-minus-big
premium involves construction of SMB portfolios, which partition the sample of firms
according to market capitalisation. In Australia, this is complicated by the fact that only
a small proportion of stocks can be considered “large cap.” Considering this issue,
257 http://mba.tuck.dartmouth.edu/pages/faculty/ken.french/data_library.html

DETERMINING A WACC ESTIMATE FOR PORT OF MELBOURNE Page 241 of 296
Brailsford, Gaunt and O’Brien (2012) define the large stocks portfolio as the top 90%
according to market capitalisation, while the small stocks portfolio comprises the
smallest 10% of the market.
In regards to book-to-market ratios, firms are sorted into three categories, partitioned at
the 30th and 70th percentiles. Another important consideration is the interaction between
size and book-to-market factors. Following SFG Consulting (2014) and Brailsford, Gaunt
and O’Brien (2012), our SMB and HML factors have been constructed to be independent
of each other. In other words, the small and large stock portfolios have similar book-to-
market values of equity, while the high and low book-to-market stocks are of similar
size. This enables us to properly identify the true impact of each factor. Figure 19
illustrates the various portfolios that are created in the model.

DETERMINING A WACC ESTIMATE FOR PORT OF MELBOURNE Page 242 of 296
Figure 19 Buy ranges of Fama French Benchmark portfolios
Small Value
Big Value
Small Neutral
Big Neutral
Small Growth
Big Growth
Data source: http://mba.tuck.dartmouth.edu/pages/faculty/ken.french/Data_Library/bench_m_buy.html
C.2.3 Model specification
Data on monthly returns, market capitalisation and book-to-market ratios for all listed
firms in Australia from 1985 to 2018 (including both currently listed and now delisted)
were sourced from Datastream.
Once this data was compiled, the monthly returns of each firm over five years (December
2013 to December 2018) were regressed on the monthly measures of the market risk

DETERMINING A WACC ESTIMATE FOR PORT OF MELBOURNE Page 243 of 296
premium, size premium and value premium for the specific country (or the global
premiums if country-specific premiums were not available), using OLS multiple
regression. This does not apply to the Australian factor premium data.
These regressions yield estimates of the three Fama-French betas. These betas must then
be de-levered using the firm-specific leverage. The unlevered betas are averaged across
all firms in the sample, then re-levered using the benchmark port entity’s target gearing
of 30%.
Table 46 presents our estimated FFM asset betas.
Table 46 Fama-French asset beta estimates, by company
Company Country Sector Beta (MRP) Beta (HML) Beta (SMB)
Aurizon Holdings Australia Railroads 0.32 0.17 -0.20
Qube Holdings Australia Marine Ports and Services
1.28 0.07 0.25
Canadian National Railway Company Canada Railroads
0.95 -0.77 -0.86
Canadian Pacific Railway Canada Railroads
0.97 -0.39 -0.05
Hamburger Hafen und Logistik Germany
Marine Ports and Services
0.54 0.35 0.55
China Merchants Port Holding Company Hong Kong
Marine Ports and Services
0.77 0.00 0.27
COSCO Shipping Ports Hong Kong Marine Ports and Services
0.46 0.00 -0.44
Dalian Port Hong Kong Marine Ports and Services
0.84 0.22 0.05
Sakurajima Futo Kaisha Japan Marine Ports and Services
1.17 0.65 1.63
Rinko Corporation Japan Marine Ports and Services
0.36 0.33 0.26
Dongbang Transport Logistics South Korea
Marine Ports and Services
0.69 -0.14 0.60
Port of Tauranga New Zealand Marine Ports and Services
0.41 -0.31 0.00
Hutchinson Port Holdings Trust Singapore
Marine Ports and Services
0.46 0.10 -0.18
Global Ports Investments International
Marine Ports and Services
0.61 0.45 0.43
CSX Corporation US Railroads 0.96 0.24 0.51
Genesee & Wyoming Inc. US Railroads
1.04 0.28 0.51
Kansas City Southern US Railroads 0.67 0.29 0.17
Norfolk Southern Corporation US Railroads
1.01 0.42 0.40
Union Pacific Corporation US Railroads
0.78 0.25 0.42

DETERMINING A WACC ESTIMATE FOR PORT OF MELBOURNE Page 244 of 296
Company Country Sector Beta (MRP) Beta (HML) Beta (SMB)
Average asset betas 0.75 0.12 0.23
Note: The betas presented here have been de-levered using the same debt-to-equity ratios applied in the standard beta analysis
Source: Bloomberg, Synergies Calculations
DETERMINING A WACC ESTIMATE FOR PORT OF MELBOURNE Page 245 of 296
D Detailed responses to ESC commentary
This attachment addresses specific comments made by the ESC in its 2018 interim
commentary that we have responded to throughout the report.
Table 47 Overview of ESC interim commentary on Black CAPM
ESC interim commentary Synergies response
Currently, IPART makes adjustments to its estimation of equity betas to partly correct for the downward bias of the SL CAPM. IPART implements the Vasicek adjustment, which gives a higher weight to more precisely estimated equity betas and lower weight to estimated equity betas with higher standard errors. IPART was of the view that the adjusted equity beta estimates sufficiently adjusted for the known downward bias of the SL CAPM.
We have provided commentary on IPART’s use of the Vasicek adjustment in chapter 8. Elsewhere, the ESC has questioned our reliance on statistical significance, and, by extension standard errors. These statistics play a central role in the Vasicek adjustment. More importantly though, IPART’s implementation of such a method demonstrates that the existence of downward bias is acknowledged in a regulatory context.
The main weakness Synergies identified with the SL CAPM is that it produces downwardly biased estimates of the rate of return for low-beta entities. We note that this issue does not appear to be especially relevant for the moment as Synergies has estimated that the port does not have a low beta
As we have noted in our report, SL CAPM and Black CAPM result in the same cost of equity when the equity beta is equal to 1.
In any case, our objective is to utilise well-accepted models that estimate the return on equity as accurately as possible for any beta assumption.
The AER noted that the use of the Black CAPM is an alternative model to the SL CAPM and is not the only method to address low-beta bias.
While true, this in isolation does not disqualify the Black CAPM from consideration.
The AER stated that its consideration of the Black CAPM is not related to low-beta bias and is instead to ‘capture possible market imperfections that may lead to actual returns to differ from expected returns.’
Similarly, IPART also acknowledges that the Vasicek adjustment is not explicitly designed to address the downward bias of the SL-CAPM either. Regardless of the AER’s actual intention, the Black CAPM has the effect of mitigating the “flatter than expected” security market line.
The AER noted some shortcomings of the Black CAPM, such as that it is not empirically reliable, it is not widely used and does not meet the AER’s assessment criteria well.
The SL CAPM has been shown not to be empirically reliable either. Consideration of the Black CAPM has met the AER’s assessment criteria in the past. Concerns have been raised by energy networks that the AER has reached a different conclusion in its 2018 Rate of Return Guideline review based on substantively identical evidence.
The AER does not give any weight to low-beta bias in its rate of return guidelines, partly due to:
• Ongoing academic debate on the existence of low-beta bias
• The existence of a number of explanations (such as economic conditions) that do not imply a bias in equity beta.
We have supplemented our analysis from previous reports with additional literature confirming the existence of low-beta bias
As discussed above, many of the explanations for low-beta bias still imply substantial deficiencies in the SL CAPM, which are unlikely to disappear over time.
The AER also noted that it is not clear that low-beta bias exists on an ex-ante basis or is accounted for by investors and market practitioners on an ex-ante basis.
The persistence of low-beta bias over time strongly suggests that this phenomenon is not merely an ex post deviation from ex ante returns that would otherwise be based on the conventional CAPM.
In relation to low beta bias, Professor Davis suggested that it is not possible to make inferences about whether the SL CAPM produces downwardly biased estimates for low-beta firms.
It should be noted that this report to the AER dates back to 2011. Subsequently, reliance on the Black CAPM was accepted by the AER in its 2013 guidelines.
In particular, Professor Davis is of the opinion that:
• The theoretical assumptions of the SL CAPM do not necessarily lead to downwardly biased estimates of the rate of return for low-beta firms
• The empirical evidence does not clearly demonstrate a low-beta bias of the SL CAPM
The issue is not so much the theoretical assumptions themselves as it is the validity of these assumptions in practice.
The empirical evidence that we have compiled in chapter 6 comprehensively demonstrates that observations of low-beta bias are too persistent to be attributed to transitory statistical anomalies.
DETERMINING A WACC ESTIMATE FOR PORT OF MELBOURNE Page 246 of 296
ESC interim commentary Synergies response
In addition, Professor Davis suggested that the use of the Black CAPM to address low-beta bias has limited empirical significance and does not resolve the problems of the SL CAPM.
Although we disagree on the empirical significance of the Black CAPM, we are largely in agreement with Professor Davis that reliance on the Black CAPM, does not, on its own, resolve all of the problems of the SL CAPM. This is because the Black CAPM still ignores factors other than the market return that can influence the return of a stock. Thus, we have also placed weight on the Fama-French Model.
Table 48 Overview of ESC commentary on the Fama-French model
ESC interim commentary Synergies response
In Synergies’ submission, there is no discussion of the consideration of the FFM in the Australian context, where regulators have noted that it is unreliable on empirical and theoretical grounds and so rejected its use.
On p.71 of last year’s report, where we discuss the weaknesses of the FFM, we stated that the FFM is less commonly employed in regulatory contexts, and that the model in the Australian market has sometimes yielded inconclusive results.
It is notable that Synergies has not mentioned the analysis and conclusions of the AER and ERA (including where the decisions of these regulators relating to the FFM have not been found to be in error on appeal).
In our previous reports for PoM, we addressed many of the issues raised by these regulators (including portfolio formation in the Australian setting; empirical stability of the estimates; the emergence of the five-factor model; and dealing with the complexity of empirical implementation). In the 2019-20 WACC report, we respond to specific areas of concern among these regulators that the ESC cited.
With regards to judicial appeals, commentary from bodies such as the Australian Competition Tribunal is a useful source of guidance, but ultimately this guidance is focused primarily on how regulators weigh up conflicting evidence. Our objective is to have regard to approaches well-accepted by regulators, academia and financial practitioners in the context of the Pricing Order and the regulatory objectives (including providing PoM with a reasonable opportunity to recover a return commensurate with the risks involved). This may or may not differ from the task facing other regulators on previous occasions.
The FFM is not used by any Australian regulator
Synergies stated that IPART’s views lend credence to the implementation of a multi-model approach to estimating the return on equity. This is not an example of a regulator ‘applying or considering the results of the FFM’. IPART has maintained the use of the SL CAPM as its return on equity model and did not find sufficient evidence to replace this model.
We have not at any time proposed that the SL CAPM be replaced. Rather, we believe that it should continue to be given weight in conjunction with the Black CAPM and FFM. The ESC states elsewhere that it is “particularly interested in the model’s application in a regulatory context to estimate the benchmark return on equity”. The key question is whether a sufficient return is allowed to enable PoM to earn a return commensurate with the risks involved.
Synergies appears to overstate instances of the use of the FFM by international regulators
Synergies stated that Professors Myers and Franks consider the FFM is to be an ‘appropriate’ model. This reflects the advice of these academic and not views or decisions of the NZ Commerce Commission.
As we have presented in previous reports, the NZCC subsequently went on to endorse the FFM as a potential cross-check on the CAPM in its 2009 revised guidelines.
Synergies used similar examples when referring to expert witnesses; Mr Paul Moul, Mr Paul Hunt and Mr Gary Hayes. These individuals are not regulators and are not applying the FFM in a regulatory context.
In these cases, the regulator in question subsequently acknowledged the findings of these expert witnesses. In any case, it shows that the FFM has received attention by expert witnesses in a regulatory context.
Various examples provided by Synergies in its review of expert reports and of financial practice highlight the making of ad hoc adjustments to the SL CAPM formula, rather than the adoption of the FFM. Synergies explicitly notes that this practice is ‘consistent with the underlying rationale of the FFM’ rather than the use of the FFM. Further below we note that it is also common practice for Australian regulators to use the SL CAPM with some adjustments and cross
In our experience, financial practitioners and independent expert report authors have more latitude to apply discretionary adjustments to mechanical cost of equity calculations. Our approach formalises these adjustments by considering the exposure to factor premia for comparators relevant to PoM.

DETERMINING A WACC ESTIMATE FOR PORT OF MELBOURNE Page 247 of 296
ESC interim commentary Synergies response
checks, rather than adopt an alternative model for estimating the cost of equity.
For Australian regulators, many adjustments to the SL CAPM are somewhat arbitrary in nature and require the exercise of significant regulatory discretion, especially when the regulator is required to select a value within a range of possible estimates.
Nevertheless, the ESC’s statement seems to suggest that it is indeed common practice for Australian regulators to make adjustments to the SL CAPM. If so, it would appear open to PoM to give weight to other approaches that achieve a similar outcome but in a more formulaic and transparent manner.
Synergies notes that ‘in the 344 independent expert reports that we interrogated, we have not located any formal application of the three-factor Fama-French model as it is employed in the PoM WACC report.’ This is a significant finding in that it does not appear to support Synergies’ claim that the FFM is ‘well accepted’ by financial practitioners, and also highlights that the FFM can take various forms. The variability in how the FFM is applied gives rise to concerns on theoretical and empirical grounds.
Independent experts are typically not required to present detailed analysis to substantiate the premia that they apply. One reason for this is that the application of ad hoc risk premia not accounted for in the SL CAPM is commonplace in financial practice. In our view, the FFM is the best formal model available for accurately quantifying size and value premia. The fact that financial practitioners are accounting for premia outside the CAPM framework is a sign that the SL CAPM requires augmentation.
Australian regulators have recognised issues with the SL CAPM but do not use the FFM
No Australian regulator has moved away from the SL CAPM in favour of the FFM or any other return on equity model. Professor Kevin Davis, in a report for the AER in 2011, stated his view that there is a lack of general agreement on the superiority of alternative asset pricing models to the CAPM.
As we have stressed in previous reports, we are not recommending moving away from the CAPM. If there is indeed a lack of general agreement on the superiority of alternative pricing models to the CAPM, then, given the recognised weaknesses with the SL CAPM it is preferable to have regard to a wider range of well-accepted approaches.
The FFM appears to have theoretical issues
A number of Australian regulators have raised concerns with the theoretical basis for the FFM’s risk factors. Specifically, while these factors have been identified through empirical methods to explain ex post equity returns, how they explicitly or implicitly affect investors’ perceptions of risk is not well understood.
More recently, Fama and French have motivated the theoretical basis underpinning the Fama-French model using the theory of the dividend discount model. Carlson et al. (2004) argue that the size premium reflects the importance of growth options relative to assets in place, while book-to-market effects can be attributed to differences in operating leverage. We have extended our coverage of the theoretical size and value premium literature in this year’s report.
In its 2013 and 2018 rate of return guideline reviews, the AER stated that the FFM could not be used to inform any parameter estimates in its foundation model due to its lack of clear theoretical foundation.
Despite our comments above that the FFM does have a theoretical basis, theoretical underpinning is only one of several criteria for an effective cost of equity model. We believe it is important to strike a balance between empirical relevance and theoretical foundation.
The ERA, in the context of a 2016 decision on the Dampier to Bunbury Natural Gas Pipeline (DBNGP), also noted that the FFM is ‘empirically unstable due to the fact that the model is not developed on a robust theory’.
Commenting on the wide range of factors that have been considered over time, Fama and French (2018) acknowledge that some factors have lost explanatory power out-of-sample. However, they stress that “most if not all” of the three-factor and five-factor variables survive tests on samples of different time periods and different countries. This is at odds with the claim that the FFM is empirically unstable.
The ERA raised a similar view on the theory of the FFM in its 2015 final decision on ATCO Gas’ access arrangement for gas distribution. Specifically, the ERA stated that there is no strong theoretical basis to support the inclusion of the size and value risk factors in the return on equity estimation.
We discuss the theoretical underpinnings for the FFM in Section 6.4. The theory of the FFM can be motivated via the Dividend Discount Model (DDM). Size and value premia can be driven by factors such as growth options and operating leverage.
The ERA considered that the FFM risk factors were selected based on data exploration and were not guided by economic theory.
It is true that the factors were originally identified through empirical observation, but this does not detract from any

DETERMINING A WACC ESTIMATE FOR PORT OF MELBOURNE Page 248 of 296
ESC interim commentary Synergies response
subsequent work that has been undertaken to understand why such phenomena have persisted over time.
The ERA noted that the introduction of the Fama French five-factor model has placed the validity of the value premium in doubt, based on Fama and French suggesting the value premium appears redundant for explaining average returns in this new model.
This line of reasoning seems to suggest that the five-factor model is more appropriate than the three-factor model. This is possible, but at present the three-factor model represents a significant improvement on the CAPM.
On appeal, the Australian Competition Tribunal did not find that the ERA made any error in its determination relating to the FFM. In particular, the Tribunal considered that it was not unreasonable for the ERA to be concerned over the theoretical foundations of the FFM, due to the empirical facts of the model not being generally agreed.
Whether or not the ERA made any error in the context of the merits review framework is a different question from whether the FFM is well-accepted for the purposes of the Pricing Order. Further, the Tribunal made the following remarks: “The Tribunal recognises that the evolution of approaches and differences in results in succeeding versions of a research project’s output are an inherent feature of the research process, rather than indicating that the credibility of the most recent results is contaminated by differences with earlier results.” Viewed in this light, the evidence in favour of applying the FFM has only strengthened since this decision was handed down.
The FFM has been found to produce unreliable empirical results
Regulators in Australia have found it difficult to apply the FFM in a regulatory context due to a lack of consensus on the appropriate risk factors and portfolio formation.
The Brailsford method, upon which our approach is based, takes account of Australia-specific portfolio breakpoints. Brailsford et al. successfully show that their portfolio formation approach emulates the distribution of total market capitalisation among portfolios observed in US studies.
Regulators have also found that the results of the FFM are dependent upon the methodology chosen, and the robustness of the FFM risk factors in explaining Australian data has been questioned.
See next point and comment from the Tribunal above.
Synergies listed a number of academic studies that suggest the FFM provides a better explanation of observed stock returns than the SL CAPM, including for Australian datasets. As described in Synergies’ report, these studies provide mixed evidence on the reliability of the FFM. The ESC notes that the results from the academic studies referenced by Synergies are inconsistent, and the most recent studies do not appear to provide clear evidence in support of the size effect.
Brailsford et al. observes that “prior Australian studies employ a portfolio construction method that is not comparable with prior US research. The consequently mixed and inconclusive findings from previous Australian studies leave a confusing picture for those interested in a deeper understanding of how the Australian equity market prices risky assets.”
Extending on the Tribunal’s comments about the difficulties in concluding on the superiority of one paper over another, previously mixed findings do not detract from the model’s current merits going forward.
Synergies noted that past studies of the FFM in the Australian market have yielded inconclusive results, which may be due to ‘data issues’. Synergies stated that the Brailsford et al study (2012) addressed these issues and produced FFM estimates using Australian data that reconciled with US studies. As noted above, Brailsford et al found the value premium was statistically significant, while the size premium was not.
As noted below, we find evidence that the size premium is significant at the 10% level. It is important to remember that the Brailsford study had access to approximately 25 years of data. Meanwhile, we have access to 32 years of data. More observations increase the precision of the data.
The Brailsford et al study has been relied on by other regulated entities in proposing reliance on the FFM. The ERA, in its 2015 final decision for ATCO Gas, decided against relying on the Brailsford et al study. The ERA did not agree with ATCO’s consultants that one study is superior to others.
Our application of the Fama-French is not conditional on a single study. It is also informed and supported by a growing body of literature and the approach of financial practitioners, who regularly augment the CAPM to account for additional factors that the model fails to capture.
In the subsequent review of the ERA’s decision by the Australian Competition Tribunal, the Tribunal accepted that the ERA considered the latest available research before rejecting the use of the FFM.
As we have documented in Section 6.2, there is a wide array of available research that rejects the use of the SL CAPM. In our view, the regulatory objectives can be fulfilled only if weight is given to a combination of well-accepted approaches.

DETERMINING A WACC ESTIMATE FOR PORT OF MELBOURNE Page 249 of 296
ESC interim commentary Synergies response
Synergies also noted that the most recent studies employ a five-factor model, rather than the three-factor model it uses in its submission. (p.49)
It is possible to generate a five-factor model for the Port of Melbourne, but the three-factor model is nevertheless a significant improvement on the SL CAPM.
Synergies also reviewed a number of independent Australian financial expert reports, where around 30 per cent of reports made ad hoc adjustments to the SL CAPM, although none formally used the three-factor FFM. Synergies is not clear on how often the financial expert reports use value and size premiums compared to other ad hoc adjustments.
See above for our comments on our interrogation of independent expert reports.
Australian regulators have found that the FFM has empirical issues in a regulator context
The ERA noted that the ranges of the high-minus-low and small-minus-big risk premium were too large to confirm the presence of these risk factors when using the FFM in Australia. (p.50)
The ERA references studies as far back as 1998. In any case, the range of HML and SMB values are not prohibitively large when clear outliers are removed.
The ERA noted that a fundamental issue with the application of the FFM in Australia is the adoption of different approaches to portfolio formation, which can lead to different conclusions. (p.50)
We agree that different portfolio approaches could lead to different conclusions, but this does not prevent the application of the FFM in Australia. What is important is that the ultimate choice of portfolio formation is informed by sound financial and economic reasoning, as is the case in the Brailsford et al. paper.
The ERA suggested that there is no strong theory to guide the method of portfolio formation due to the inherent empirical nature of the types of studies the FFM has been used in. (p.50)
See comments on Brailsford approach. It is unclear why portfolio formation would actually require “guiding theory.” Arguably, the technical nature of portfolio formation should in fact be informed by empirical considerations.
The ERA also recognised that the FFM is dependent on empirical justification (the systematic observance of the FFM risk premia). The ERA noted that because these risk premia are not systematically observed in the Australian market, there is no reasonable basis for this model to be applied in Australia.
The value premium has been found to be persistent over time. We also believe there is a convincing basis for persistence of the size premium, especially when 2008 data is omitted.
The ERA further justified its rejection of the FFM’s value and size premium in a 2015 decision based on the following:
• The 2012 Brailsford study concluded that the size premium is not priced in Australia. A number of the academic studies referenced by Synergies in its submission suggest a similar finding for the size premium.
• In Fama and French’s most recent five factor model, they conclude that the value premium has become redundant in explaining average returns
We find that removing 2008 data results in a statistically significant size premium.
As per above, it is possible to estimate the five-factor model for PoM. If the five-factor model is to be considered, then it is clear that the SL CAPM (a one-factor model) must be inadequate to meet the regulatory objectives.
The AER has similarly dismissed various proposals to rely on the FFM for a range of reasons, including:
• The FFM’s empirical implementation is relatively complex and opaque
• There appears to be no consensus on the appropriate factors and methodological choices for the FFM
• The FFM is sensitive to the choice of factors and methodology, creating a potential for bias and regulatory gaming
• There is no agreed ‘best’ methodology for applying the FFM and there are no clear objective grounds to distinguish the ‘best’ studies of FFM estimates
Complexity of empirical implementation: we have provided the ESC with extensive detail of our approach for implementing the FFM, both in our report and via information requests.
Consensus on appropriate factors and methodological choices: This criticism could be made of several other WACC parameters, such as gamma and the MRP. We do not consider that this is a valid reason for excluding the FFM from consideration.
Potential for bias and regulatory gaming: The choice of factors and methodology must at all times be informed by credible and carefully reasoned academic and financial market evidence. If these criteria are satisfied, it is difficult for regulatory gaming to occur.
No clear objective grounds to distinguish the ‘best’ studies of FFM estimates: There is unlikely to be any definitive basis (quantitative or otherwise) for distinguishing best

DETERMINING A WACC ESTIMATE FOR PORT OF MELBOURNE Page 250 of 296
ESC interim commentary Synergies response
studies. Instead, as is the case for other WACC parameters and models, studies should be judged on the strengths of their assumptions and the breadth of real-world considerations that they incorporate into their modelling. In our view, the work of Brailsford and others meets this threshold and is well accepted for the purposes of the Pricing Order.
In IPART’s 2018 review of its WACC methodology, it noted some shortcomings with the FFM, including that the empirical evidence on the impact of firm size on equity returns had not been stable over time in Australia.
There is evidence that the MRP has not been stable over time in Australia either. IPART did note shortcomings, but overall we consider that IPART viewed the method positively.
We have identified what appear to be methodological issues with Synergies’ application of the FFM
Synergies’ use of the FFM appears to lack a consistent theoretical approach in terms of whether national share markets are assumed to be integrated internationally or are segmented and reflect domestic investment choices only.
Our reliance on global data is not related to the consistency of the theoretical approach. Rather, it relates to data availability. This has led us to reduce the weight on the FFM for the 2019-20 WACC estimate.
The portfolios chosen for foreign companies are local in respect of the market portfolio and (for some countries) global in respect of the HML and SMB portfolios. This tends to suggest that the FFM does not have a theoretical base, and is therefore open to defining parameters in ways that are incompatible with any theoretical framework. That is, Synergies’ use of global data occurs in those cases where Professor French’s database lacks data for the country in question rather than because of any guiding principle. A lack of strong theoretical foundation could undermine confidence in the model in the case (as applies here) of conflicting evidence on observed statistical relationships.
See response above.
Synergies did not explain why it used data from Professor French’s database for all foreign markets but not for Australia. (p.51)
On p.168 of the 2018 report, we explain that Professor French does not construct factors specifically for Australia. However, we require estimates of the Australian size and value premia just as it is well-accepted to derive a country-specific estimate for the MRP.
Regarding Australian data, Synergies’ estimate of the MRP in the FFM (and SL CAPM) is based on the same historical data used by Australian regulators (spanning the years 1883 to 2017). However, data used to estimate the risk premiums for HML and SMB in the FFM are from 1986 to 2017. No explanation is offered for this difference, however, presumably reflects the computational burden of constructing the HML and SMB portfolios back to 1883. The result is a much less reliable estimate of the HML and SMB premiums.
For all parameters, we seek to utilise as much information as is available. Data availability prevents us from collecting information prior to the 1980s. While it is true that the dataset for HML/SMB is shorter than that for the MRP, this is still a substantial time series of almost 400 observations each.
We are not aware of there being a method to estimate the HML and SMB premiums that is substantially different to that used by Synergies.
This seems at odds with the ESC’s claims that there are too many competing methodologies for deriving FFM estimates. Rather, there appears to be a very clear procedure that stands out for deriving robust estimates.
The SMB premium estimated by Synergies is 1.93 per cent. This annual value is derived from monthly observations that produced a premium estimate of 0.16 per cent, with a standard error of 0.15 per cent, meaning the premium estimate is not statistically significant. This is consistent with most of the Australian empirical studies cited by Synergies failing to find clear evidence of the size effect.
With the removal of data from 2008, the size premium becomes significant at the 10% level. Significance at the 5% level can be justified if a one-sided hypothesis is assumed (i.e. if the size premium is assumed to be positive).
Sensitivity of Synergies’ results to changes in method
The changes in the overall FFM cost of equity attributed to the coefficients for the ‘market’ and ‘growth’ risk factors are large and offsetting.
The fact that the changes are offsetting suggests that both methods lead to a similar cost of equity estimate, which is the ultimate objective of any cost of equity model.

DETERMINING A WACC ESTIMATE FOR PORT OF MELBOURNE Page 251 of 296
ESC interim commentary Synergies response
We do not have any context to determine whether these changes ‘result in a more robust and stable estimate over time’ as claimed by Synergies. We are concerned that an apparently slight change in methodology can result in large changes in some of the FFM’s component estimates
Despite changes to the comparator set in the 2019-20 report, the FFM methodology continues to result in a stable estimate of the return on equity.
Table 49 ESC interim commentary on the MRP
ESC interim commentary Synergies response
The port’s MRP estimate is materially higher than recent decisions
Synergies’ estimate of the MRP is 7.71 per cent. This is significantly above the value used by all other Australian regulators, and is due to Synergies placing material reliance on the ‘Wright’ approach, which has limited support. The Wright approach is not widely relied upon by Australian regulators.
In regard to regulatory acceptance, the ESC has indicated in its SoRA that “at a minimum, at least one economic regulator should be using (or should have recently used) an approach for it to be considered ‘well accepted.’” Even applying the ESC’s limited test for ‘well accepted’, its minimum requirement is satisfied given the QCA has recently re-affirmed its use of the Wright approach.
Where it has been used, regulators have noted that evidence supporting its core premise is mixed.
Evidence on the premise of virtually all MRP approaches is mixed, as indicated by commentary from Partington and Lally.
Recent publications from the AER and ERA express fresh concerns in light of this evidence.
As we document in chapter 7, the ERA in particular has, at the present time, not undertaken any additional empirical analysis to substantiate its change of position.
Our view is that the Wright approach now has very limited support, and the weighting Synergies placed on this approach is the primary reason why its MRP estimate is significantly above that otherwise used in Australian regulatory decisions. We expect the port to consider the reliability of the Wright approach and more recent regulatory sentiment in future tariff compliance statements.
We have presented our position on the issues the AER and ERA have raised in relation to the Wright MRP. On balance, the evidence they have presented does not warrant us decreasing the weight that we place on this methodology. However, with the incorporation of DDMs, the weight we assign to the Wright MRP is now less than 50%.
We have not examined Synergies’ reliance on historical excess returns, and note that Synergies did not explain its method or data sources in its report.
The ESC has not requested any additional information on the MRP in any of its information requests in 2017 or 2018. We have provided additional details on the assumptions underpinning the Synergies MRP model. The underlying data are broadly similar to those in the AER model.
Recent regulatory determinations derive estimates ranging from 5 per cent to 6.5 per cent from historical excess return data, reflecting different methods, sampling periods and data sources. That Synergies’ estimate is at the high end of this range may partially explain its higher overall MRP estimate when combined with the Wright approach estimate. The port should consider more transparency on how this value has been derived in future tariff compliance statements.
The AER is the only regulator to publish its historical excess returns model. We have undertaken a reconciliation with this model. Our historical excess returns model uses the NERA adjustment for market return estimates before 1958. This is the main source of difference between the corresponding AER estimate, along with different theta assumptions.
Moreover, regulators have placed excessive reliance on geometric averaging, which has been shown to be inappropriate for informing an MRP.
Our observations on the Wright approach
The ERA has recently withdrawn its support for the Wright approach.
We have provided an overview of the ERA’s rationale for doing so, with which we have identified several issues.
The evidence considered by the AER and the ERA, and qualifications by the QCA, contrast to Synergies’ assertion that ‘(t)he post-GFC evidence supports the Wright approach to the determination of the MRP.’ Notably, Synergies did not refer to any of the evidence considered by these regulators, which directly addressed (including through statistical testing) the stability of the MRP relative to the cost of equity.
Although we acknowledge that the ERA has since changed its position, at the time of PoM’s 2018 submission, it was relying on statistical testing actually suggesting that the MRP was not stable. In regard to the QCA, we noted their decision to place more reliance on the Wright approach.
Synergies’ reference to post-GFC evidence is based on comments by the Governor of the Reserve Bank of
In addition to the RBA evidence, our views on post-GFC evidence have also been informed by our interrogation of

DETERMINING A WACC ESTIMATE FOR PORT OF MELBOURNE Page 252 of 296
ESC interim commentary Synergies response
Australia. We consider these comments more equivocal than Synergies suggests, are not based on any statistical analysis and refer to a fairly limited historical time series, compared to datasets spanning over 100 years that are standard in examining the relationships between these variables.
the Connect 4 independent expert report database, which shows that many practitioners have been applying return on equity values materially above those that would result from a strict application of the SL CAPM.
Our observations on the value of Synergies’ MRP estimate
Synergies noted that its estimate is below IPART’s ‘effective’ MRP value of 8 per cent. This effective value is above IPART’s actual value because of ‘the higher risk-free rate assumed in its approach (approximately 40 basis points).’ Synergies provided no further explanation for this adjustment.
To address the ESC’s feedback, we have provided a worked example this year that explains the adjustment and illustrates why it is necessary to focus on effective MRP estimates.
This adjustment may reflect a desire to account for the difference between IPART’s ‘midpoint’ risk free rate and its ‘current’ risk free rate. Specifically, IPART’s ‘midpoint’ risk free rate may not be suitable for comparison because it combines the current prevailing risk-free rate (typically used in regulatory determinations and hence relevant for comparisons) and a long-run average rate.
The midpoint risk free rate is the rate that IPART uses in its WACC determinations for the entities that it regulates. On this basis, the midpoint is the only risk-free rate that is suitable for comparison. In this sense, IPART’s approach is “Wright-like” in that accounts for when the risk-free rate is below its long-run average.
The difference between IPART’s midpoint and the current risk-free rate in its February 2018 WACC update is 60 basis points, not 40 basis points as quoted by Synergies. Regardless of this difference, it is not clear why this should result in any corresponding adjustment to the MRP.
The 40 basis points we quoted was informed by the risk-free rate we used in the PoM’s WACC estimate, not the risk free rate that IPART used in its February 2018 WACC update. The difference between the two risk free rates arose solely because of timing differences. The justification for the use of an effective MRP is analogous in either case.
The port may wish to clarify why and how IPART’s MRP should be converted into an ‘effective’ value if it wishes to rely on such a value in future tariff compliance statements.
As per above, this year we have provided a clarification as to how and why an effective MRP should be considered.
The Wright approach was neither considered nor relied upon by IPART in its WACC review. IPART’s MRP (whether 7.55 per cent or Synergies’ higher ‘effective’ value) mostly reflects IPART giving 50 per cent weighting to forward-looking measures of the MRP, which produce estimates that are materially higher than historic measures
As the ESC also acknowledges in the interim commentary, it is entirely possible that two different approaches can both produce a reasonable outcome and corroborate each other. This lends support to the robustness of the estimates.
Almost all of IPART’s forward-looking measures are variants of the DDM, which are treated with caution by other regulators and by Synergies.
In Section 7.7, we identify three Australian regulators (IPART, the QCA and the ERA) who all incorporate DDMs to varying degrees. Previously, we have observed that there was a lack of consensus around the values of key inputs, such as the assumed long-run growth rate. Nevertheless, DDMs bestow a forward-looking component on PoM’s MRP estimate, and therefore we see merit in giving them at least some weight in conjunction with the Ibbotson and Wright approaches.
No other Australian regulator places as a high a weighting as IPART on DDM measures because they are highly sensitive to the assumptions and specific model used.
We accept that this is a drawback of DDM approaches. One way IPART mitigates this risk is by relying on a range of different DDM measures, which reduces the sensitivity to assumptions specific to certain models. This is the approach that we have adopted in giving weight to DDM methodologies.
The QCA is now the only Australian regulator that appears to place any reliance on the Wright approach as an input to estimating the MRP, and the extent of this reliance will be confirmed in its final decision for Aurizon later this year. We expect the port to reflect on these developments and the overall reasonableness of its MRP estimate in future compliance statements.
The QCA has indeed re-affirmed its reliance on the Wright approach for its MRP methodology in its December 2018 final decision for Aurizon Network.

DETERMINING A WACC ESTIMATE FOR PORT OF MELBOURNE Page 253 of 296
Table 50 ESC interim commentary on beta and gearing
ESC commentary Synergies response
The port’s methods for estimating beta and gearing have shortcomings
Synergies adopted an initial gearing level of 30 per cent, close to the mid-point of the sample range. By comparison, the majority of the regulatory decisions outlined in Table 2 (of the interim commentary) assume a benchmark gearing level of between 50 and 60 per cent.
It is true that a number of decisions have adopted benchmark gearing levels between 50 and 60 per cent. However, the only transport entity not subject to a revenue cap with gearing at 50 per cent was the ARTC interstate rail network (December 2018 draft decision).
Regulators have tended to use lower asset betas in combination with higher levels of gearing than that used by Synergies.
Arc Infrastructure (currently at the draft stage) has an identical beta, but with a gearing of only 25%. Similarly, Pilbara railways has a higher beta, but gearing of only 20%.
We have some concerns with Synergies’ relatively higher asset beta, as it is a contributor to the port’s overall WACC estimate, which as discussed above also appears high.
The proposed asset beta for PoM is identical to Arc Infrastructure, lower than Pilbara, and only modestly higher than ARTC interstate rail network. As discussed in the 2018 report, ARTC HVCN and Aurizon Network are less comparable.
Synergies’ beta estimate may reflect the presence of upward bias because of the exclusion of firms with particular statistical properties.
For reasons we expand upon in Attachment B, there is unlikely to be any upward bias due to the exclusion of firms with statistically insignificant betas.
The estimates of beta and gearing may also reflect potential shortcomings in Synergies’ examination of risk characteristics when selecting comparator firms. We expect the port to consider these points in addressing our observations on the reasonableness of the WACC estimate in future tariff compliance statements.
Regarding the reasonableness of the beta value and its effect on the WACC estimate, the beta has been shown to be close to (although not identical to) relevant regulatory comparators.
Exclusion of firms with statistically insignificant betas
Synergies analysis excludes 31 comparator firms because their beta estimate was negative or not statistically significant. We are concerned that excluding these firms may have introduced an upward bias in the resulting estimate derived from the remaining firms.
We have addressed the concerns raised in the ESC’s commentary in regard to the implications of statistical significance as a sample filtering criterion. As we detail in Attachment B, the prospect of upward bias is unlikely. Statistical insignificance also applies to firms with betas of various magnitudes. The ESC provides no basis to substantiate its assertions on this issue.
This is because potential comparator firms will have low systematic risk. The beta estimates for these firms will be closer to zero, but in statistical terms not different from zero (suggesting the estimate is not reliable). Firms with higher systematic risk but the same statistical confidence in their beta estimate would still be included in Synergies’ list of firms.
To use an illustrative example from the comparator set, Aurizon has an asset beta of 0.38. Nevertheless, it is statistically significant. As another example, consider Logistec Corporation, which had an asset of 0.63 but was excluded from the comparator set due to statistical insignificance.
Figure 4 in the interim commentary illustrates that the level of statistical confidence in the beta estimates does not change over the range of beta values, which are plotted in numerical order.
The scale that the ESC has adopted for its chart masks important variability in the standard errors for the comparator betas. In essence, given that most of the firms in the comparator set have a beta of less than one, even a difference of only 0.1 in the standard error can have a meaningful impact on the statistical significance of the estimate.
In Attachment B, we have replicated Figure 4 from the ESC’s interim commentary with a scale that better illustrates the challenge of identifying precisely measured betas. We also indicate the threshold the beta would have to meet to be statistically significant.
Analysis of systematic risk and the impact of regulation
The analysis contained in Attachment D of [Synergies’] report is limited to characteristics of the Port of Melbourne. We consider that such an analysis could have also been applied in examining potential firms for inclusion in the comparator set used for beta estimation.
In response to the ESC’s feedback, our first principles analysis now places increased emphasis on the characteristics of firms in the comparator set. However, we do not agree that it is feasible or possible to include a comparison with every comparator with the detail of a first principles analysis. The key point of the sample is that it

DETERMINING A WACC ESTIMATE FOR PORT OF MELBOURNE Page 254 of 296
ESC commentary Synergies response
provides a comparison of average and median values and a comparison of general relativities, rather than a precise comparison on a comparator by comparator basis.
A key issue with Synergies’ first principles analysis is that it finds the nature of regulation is unlikely to have any mitigating impact on the port’s systematic risk. Its primary reason is because the port is ‘is likely to have its revenues significantly affected by levels of economic activity throughout the lease period’.
PoM is predominantly import-oriented, which means that its revenues are likely to correlate with GDP. PoM’s regulatory regime does not provide significant protection against volume risk.
Synergies also notes that regulatory risk could be avoided through diversification, and the port has not and is never likely to have long term take or pay contracts in place, which could mitigate revenue variations due to changes in economic activity. These points do not support Synergies’ finding that the nature of regulation has no impact on the port’s systematic risk. While the port’s revenues may indeed by significantly affected by levels of activity, Synergies does not examine how elements of the regulatory regime will alter this relationship. The avoidance of ‘regulatory risk’ and absence of take or pay contracts also have no bearing on whether other elements of the regulatory regime affect systematic risk.
The fact that it may be possible to partially diversify regulatory risk does not reduce its systematic element for the reasons outlined in the 2018/19 TCS. There is no reason for regulation to have a dampening effect on beta. There is no current impact of the regulatory regime on revenue except for reducing PoM’s ability to respond to changes which increases systematic risk.
In a separate report, Synergies has noted that regulation in the form of price and revenue caps, by affecting a firm’s exposure to volume risk, affects systematic risk.
The report in question was prepared for Australian Rail Track Corporation’s Hunter Valley Coal Network, which is subject to a revenue cap. In that context, regulation may have some mitigating effect on systematic risk. This does not translate to the BEE for the PoM due to its regulatory arrangements (including the TAL), which may also increase diversifiable risk for the port.
Synergies finding that the regulatory regime has no impact on the port’s systematic risk contrasts to the views of regulators when examining separate but similar regimes. For example, the AER and QCA have both noted that regulation tends to reduce systematic risk relative to unregulated firms.
This is a mis-statement – the report did not say that the regulatory regime has no impact on the port’s systematic risk. We said the regime had no dampening effect on beta. The regimes referred to by the AER and QCA relate to revenue caps.
Some of the elements identified by the AER that are also present in the port’s regulatory regime include:
- the periodic resetting of prices to align with revenue requirements
- the ability of the port to enter into direct contracts with users which could involve fixed amounts rather than volumetric charges
- tariff rebalancing
- prescribed asset values that are ‘rolled forward’, which significantly reduces the risk of asset stranding
- indexation of prices and the asset base by CPI
These observations are either not relevant in the current environment under the TAL (e.g. periodic resetting of prices and RAB roll forward) or are likely to be available to the benchmarked entities at least to the same and if not, greater extent (e.g. direct contracts, tariff rebalancing, price indexation). The restrictive environment for PoM increases systematic risk relative to benchmarked entities.
Consistent with the findings of other regulators, the presence of regulation will, all else being equal, lower the systematic risk of the BEE providing the port’s prescribed services. We would expect Synergies to reconsider how regulation affects the port’s systematic risk and whether it should place weight on regulated entities in its benchmark comparator set in the future.
Regulating a price cap under the current regime increases systematic risk because the PoM cannot adapt to changing circumstances. The full effects of volume risk are borne by the PoM and there is no ability to mitigate it significantly under the current regulatory arrangements.
There is a paucity of listed regulated entities, especially in Australia, but also around the world. Even in our existing comparator set though there are firms that derive revenue from regulated activities. Moreover, asset betas for other regulated entities, such as Arc Infrastructure, largely corroborate the beta we have derived from listed entities.
The merits of including airports and rail

DETERMINING A WACC ESTIMATE FOR PORT OF MELBOURNE Page 255 of 296
ESC commentary Synergies response
We consider a more methodical application of the factors affecting systematic risk in comparative industries is justified.
In this year’s report, we have expanded our discussion on the similarities of risks faced in other sectors.
The choice of airports and rail appears to be based on them being ‘freight focused’. In this context, the decision to include airports is questionable, given airports derive a small proportion of revenues from freight. Even so, and as noted by Synergies, the correlation between demand for aeronautical infrastructure-related services and general economic activity is different than for port services, but is presumed to be immaterial without any analysis.
We agree that airports exhibit weaker correlation with economic activity than is the case for ports, and this is why we have previously stipulated that the median beta from the airports sample forms the lower bound for PoM’s asset beta. Our rationale for including airports previously was instead more on the basis that they had some merit as infrastructure assets with high fixed costs in their total fixed costs base (i.e. high operating leverage). Moreover, this follows transport regulatory precedent, which has often had regard to airport comparators. On balance though, we consider that the comparator set remains sufficiently robust without airports included.
The sufficiency of comparators in ports and marine services
Synergies stated that ‘the ESC noted the need for trade-offs when sourcing comparators from other sectors (such as rail and airports)’. This misrepresents the view in our Statement, which was that the port may need to use comparator firms that supply services which do not meet the characteristics we outlined. Synergies appears to have traded off these characteristics for the sake of broadening its data set.
We disagree that this is inconsistent. In the May 2017 Regulatory Approach to the Pricing Order – A consultation paper, the ESC stated that:
“There are no publicly-listed ports in Australia. Consequently, the port will have to determine a comparator set by considering other characteristics of the port’s prescribed services, and by making trade-offs between elements of comparability. For example, by including other firms (not ports) that provide similarly risky services or to include overseas ports in the comparator set. Whichever approach is adopted, it is important that a systematic approach to comparator selection be used to avoid ‘cherry picking’ comparators in each regulatory period.” (p.40)
In any case, the lack of comparators with these characteristics is precisely the reason why we have sought to broaden our comparator set. Reliance on only a small subset of such firms would subject PoM to accusations of cherry-picking, which the ESC has previously cautioned against.
Synergies found 28 comparators in the ‘marine ports and services’ category that it regarded were suitable for inclusion. It is not apparent from Synergies’ analysis that a reliable beta estimate cannot be derived from these firms, including the subset of eleven firms that are identified as port owners or operators.
We agree that this comparator set is one possible source of evidence for informing PoM’s asset beta. However, other transport providers whose revenues are tied to freight movements also reliable comparators, especially since they better reflect PoM’s capital intensity and accordingly should not be excluded from the analysis.
In terms of Synergies’ first principles analysis, concerns about the presence of terminal operators and stevedores in this sample relates to one of the seven factors examined (i.e. operating leverage). The extent to which this factor is dominant in determining the port’s systematic risk is not clear.
The issue is not whether one factor dominates other factors and it is not asserted that it would be the case. However, it is a clear area of distinction that is highlighted.
Overall it appears that Synergies has widened its dataset with the implicit aim of producing a more reliable result, with minimal consideration to whether the included firms reflect comparable risk. As outlined above, the presence of regulation will reduce the systematic risk of the benchmark efficient entity in the port’s context relative to unregulated firms providing the same services. Synergies point regarding the port’s operating leverage relative to comparator firms may or may not offset this effect.
There is no evidence that the current regulatory framework being applied to PoM reduces systematic risk, particularly in the circumstances as they currently present. Indeed, the restrictions imposed by the current regulatory environment increase systematic risk.
The higher operating leverage brought about by PoM’s infrastructure component will clearly have an impact of increasing systematic risk relative to many of the comparators.
Potential issues in using international comparator firms
Synergies noted challenges in finding suitable comparator firms in Australia and the need to refer to international comparators. While we understand the reasons for this
We address the ESC’s concerns on our international comparators for PoM below. However, we would stress that it is far from uncommon for Australian economic regulators

DETERMINING A WACC ESTIMATE FOR PORT OF MELBOURNE Page 256 of 296
ESC commentary Synergies response
approach, we have identified a number of drawbacks in using beta estimate for international firms.
to have regard to international comparators in the beta analyses.
These estimates reflect the industry composition of the particular index used to approximate the market portfolio against which covariance of a firm’s returns are measured. That is, the observed variability of a foreign firm’s returns relative to the market index of its country may not accurately reflect how those returns would vary against the market index in the country where regulated services are provided i.e. in Australia. The returns for each market portfolio will also reflect the degree of leverage underlying that portfolio which may differ between countries.
It is true that betas from different markets reflect the observed variability of a foreign firm’s returns relative to the market index of its country and may not accurately reflect how those returns would vary against the Australian market. However, adjustments on account of this factor are themselves problematic and controversial. To address these concerns, we have employed FTSE country classifications to further filter the sample of countries used in our beta analysis
Other factors to consider (that are more relevant to gearing estimates) are differences in taxation and bankruptcy arrangements in different countries.
Our approach is a well-accepted means of determining capital structure. Moreover, it is noteworthy that our approach to determining target capital structure results in an estimated gearing ratio that is within the range of other regulatory determinations for comparable entities.
Other regulators have faced the challenges of not being able to draw on many, or any, comparator firms in Australia and in the same industry as the benchmark entity
We agree on this challenge, and we have had consistent regard to how Australian economic regulators have approached this issue in the past. In particular, Attachment E of last year’s report demonstrated how the AER and ERA have dealt with this issue for regulated businesses similar (but not identical) to PoM.
In dealing with this challenge for rail entities, the ERA did not compile a large dataset across different countries and industries. Rather, a limited set of comparators was selected following detailed consideration of relative risk characteristics, with importance placed on firms residing in Australia or a similar developed country. For example, the ERA’s approach for Brookfield Rail involved the selection of eleven comparators from the United States, Canada, Australia and New Zealand.
It is correct that the ERA did not compile a large dataset, although it did rely on comparators from several different industries. Unfortunately, in the space of a five-year guideline period, 2 of the 11 firms were delisted, which reduced the size of the comparator set by 18%.
More recently in the case of energy, the ERA considered that it was preferable to limit its sample to only four comparator firms than to include international comparators that may have fundamentally different risks.
Reliance on only four firms leaves the overall beta estimate extremely vulnerable to firm-specific fluctuations and/or delistings.
The QCA, in the case of Aurizon, referred to a relatively large number of international comparators in its draft decision. The comparator firms were largely limited to the same countries as those for the ERA mentioned above. The QCA’s decision involved a comprehensive first principles analysis on the basis of factors similar to those as identified by Synergies, supported by quantitative analysis of different industry returns relative to GDP growth.
The QCA’s decision is notable as it found that rail businesses in North America were not appropriate comparators, while regulated energy and water businesses were.
The systematic risk profile of Aurizon Network is materially different from PoM. In the 2018 report, we discussed the presence of take-or-pay contracts, as well as the imposition of a revenue cap. These protections are not afforded to the Port of Melbourne under its current regulatory arrangements.
In Synergies’ view, utilities are not suitable comparators for Aurizon Network. Even so, what the QCA’s decision does pertinently demonstrate is that it is well-accepted for Australian economic regulators to look to other sectors to inform a beta estimate where the characteristics of those companies (such as utilities) are not relevant to the BEE.
These examples underline how a more comprehensive assessment of comparable risk might assist Synergies in overcoming the apparent lack of suitable comparators. We note that Synergies, in examining the overall reasonableness of its WACC estimate, made some detailed observations on risk for rail entities, i.e. ARTC Interstate and Pilbara Railways.
There is no indication that PoM is exposed to less systematic risk than Arc or ARTC interstate rail network. Even so, it is important to note that the ERA and ACCC, respectively, inform their beta estimate based on an assessment of a listed comparator set, including firms that we have considered for PoM.
While these firms are not listed, such detailed analysis of a limited number of firms may be preferable to Synergies’ approach of drawing observations from firms across three different industry classifications in around 30 different countries.
We have undertaken a similar exercise to the one described here in chapter 13 of the report. Arc Infrastructure’s beta remains identical to PoM’s, and similar to ARTC’s, which although recently decreased is still 0.6.
The threat of competition

DETERMINING A WACC ESTIMATE FOR PORT OF MELBOURNE Page 257 of 296
ESC commentary Synergies response
There are other related provisions in the Port Lease Transaction Act 2016 and the Port Management Act [other than the Port Growth Regime] that protect the interests of the port in the advent of a second container port.
Even with the pricing protections offered by these provisions, there would still be a substantial impact on PoM’s volume.
We disagree with Synergies that the Port Growth Regime provisions are a significant barrier to the construction of a second port, and that their expiry after 15 years increases the risk of competition. Prospects for a second port depend on demand growth and the exhaustion of the port’s natural container capacity.
If the Port Growth Regime provisions are not a significant barrier to the construction of a second port, then this actually seems to imply that PoM is indeed at risk of competition.
As noted by Synergies, Infrastructure Victoria’s recommendation to the government were that it would not be cost effective for a second major container port to begin operations until 2055, following investments that increase the port’s capacity to 8 million twenty-foot equivalent units. This is around 40 years into the port’s 50 year lease.
As we documented in the 2018 report, PoM must make investment decisions across long-term horizons. Therefore, such a significant change in the demand outlook even 40 years into the lease impacts on investment decisions today. Also, 2055 is considerably closer in terms of when this WACC will begin to apply to cap PoM’s revenue streams (after the TAL). Many changes will occur in the next 35 years and the Government is clearly positioning itself to move more quickly on a second major container port if it perceives benefit from doing so.
Overall, we consider that the threat of competition is unlikely to materially affect the benchmark rate of return.
It is uncontroversial that a second major container port would materially affect PoM’s systematic risk. It would also potentially materially affect PoM’s regulatory environment. Given these realities, the planning work being undertaken by the Victorian Government means that the prospect of a second major container port is a material consideration for the PoM’s beta today as it will impact valuation considerations. PoM is entitled to consider this factor. Moreover, as the regulatory environment moves beyond the TAL, the impact of the second major container port will be correspondingly sooner and consequently more significant for the PoM.
Table 51 Overview of ESC interim commentary on gamma
ESC commentary Synergies response
The port’s gamma estimate is at the lowest end of recent decisions
The most recent appeal outcomes and regulatory determinations are based on consideration of a range of evidence, overturning a previous precedent of relying solely on ‘market’ estimation approaches.
The appeal decisions were made in the context of particular rules around estimating the cost of corporate income tax and the value of imputation credits. The constraints in those rules do not apply in the Pricing Order. The only relevant constraint is that the approach is well accepted. Similar arguments could also be made in support of how IPART determines its gamma estimate based on dividend drop-off studies.
We note Synergies’ continued preference for relying on a ‘market’ approach and these matters are likely to be considered further in other regulatory determinations.
Synergies is not relying exclusively on a ‘market’ approach. We are placing a weighting of one-third each of the approaches we have utilised.
The first approach adopted by Synergies produces a value of zero given certain presumptions of investor characteristics, and has never been adopted by Australian regulators. It represents a theoretical extreme which is not supported by evidence, including from the other two approaches Synergies relies on.
We have presented extensive evidence from academia and financial practice that endorse a gamma value of zero. We are not proposing full weight on this approach; rather, we are proposing a weight of one-third, equal to the weight we place on the other two approaches.
Our observations on Synergies’ gamma estimate
As with the MRP, Synergies’ value of 0.25 is in line with the value used by IPART but is materially different from all other recent determinations.
This observation is valid, but the final gamma value adopted by regulators, financial practitioners and academics should not be in question – the methodology

DETERMINING A WACC ESTIMATE FOR PORT OF MELBOURNE Page 258 of 296
ESC commentary Synergies response
applied by each of these is the focus of what is a well-accepted methodology.
Synergies states that it is ‘well accepted in the academic literature that the gamma for a security where the marginal investor is foreign should be zero.’ We note that it would be as equally well accepted that the utilisation rate for a security where the marginal investor is domestic should be one.
Assuming the domestic investor is able to fully redeem the face value of the imputation credit, this would be theoretically correct. However, this is at odds with the empirical evidence. The AER has recently implicitly accepted this fact in its latest Rate of Return Instrument.
While both of these observations raise important considerations about how to estimate gamma in a regulatory setting, neither position has been relied upon in the regulatory context. That is, they reflect conceptual or theoretical extremes.
A gamma of zero (or one) does denote the numerical extremes of the values gamma can take, but it is not entirely clear that a zero gamma is theoretically extreme, especially given that IE reports frequently assign no value to imputation credits, and also that Australia is a country where the marginal investor is likely to be foreign, particularly in the context of the BEE given known ownership patterns. Academic support also favours a zero gamma.
Synergies used the conceptual approach adopted by regulators in terms of the market definition underpinning the CAPM. Specifically, the risk-free rate and MRP are based on the assumption that the relevant market is closed and domestic, implying that the relevant Australian investor is an Australian resident, but then the estimate of gamma reflects the presence of foreign investors. This is widely known to be inconsistent with a strict, academic application of the CAPM but is done so in the belief that it produces more realistic results. If Synergies were committed to such an application, it should consider its implication on estimates of the risk-free rate and MRP.
This is the approach adopted by economic regulators in Australia. It is not entirely clear what the ESC is attempting to imply here, by suggesting that we should consider implications on estimates of the risk-free rate and MRP.
Our approach to estimating the risk-free rate follows those adopted by the AER, ACCC and ERA (for rail). Similarly, our MRP is based (amongst other approaches) on an approach adopted by virtually all Australian regulators (Ibbotson), an approach which has recently been reaffirmed by the QCA (Wright), and an approach adopted to varying degrees by IPART, the QCA and the ERA (DDMs).
Synergies’ view of what is accepted in the academic literature is also not derived from the principal academic papers relating to gamma, namely Officer, Monkhouse and Lally and van Zijl which provide derivations of the model in which gamma appears. None of these papers assert that gamma is zero by reference to empirical evidence.
None of the papers that the ESC mentions attempt to establish a value for gamma based on empirical evidence. Given that most of this research took place not long after the introduction of the imputation system, there was insufficient time series data with which to infer the true value of imputation credits. More recently, these gaps have been addressed by empirical studies such as dividend drop-off analysis. Regardless, Synergies has addressed each of these papers in this year’s report.
Lally and van Zijl argue that theta should be 1 consistent with the model embodying the assumption that all investors are local residents coupled with the fact that virtually all local investors can fully utilise the credits.
This is true, but as the ESC has confirmed elsewhere in its commentary, this approach has not been implemented by economic regulators. The AER has also recently dismissed this approach.
Distribution rate / payout ratio
Contrary to Synergies’ statement that a payout ratio of 0.7 is not contentious, several regulators have recently highlighted issues in relying on tax statistics and each determined a value of 0.83, namely the AER, ERA and QCA. While not explicitly referring to this value themselves, the AER’s approach to gamma has been adopted by the Office of the Tasmanian Economic Regulator (OTTER) and the ICRC. The value of 0.83 comes from work undertaken by Lally using data for the years 2000 to 2013, which has recently been recently updated for the period 2000 to 2017, resulting in a revised value of 0.88.
These decisions were released after the 2018 TCS was submitted. Moreover, some of these decisions have again been revised since the ESC submitted its own commentary. We have reflected these changes in this year’s report.
To be completely accurate, both the ICRC OTTER decisions cited by the ESC actually opted for a gamma of 0.4 – strictly speaking they have not provided any endorsement of the AER’s latest guideline. A gamma of 0.4 is unlikely to placing full weight on Lally’s distribution rate.
The ESC states that each of the AER, ERA and QCA determined a value of 0.83, but this was not independently of each other. Rather, all placed full weight on the exact same methodology.
Valuation experts
The practice of valuation experts has been considered in regulatory determinations. A main finding (affirmed by the tribunal) has been that valuation experts may choose to assign no value to imputation credits because of the
This is at odds with commentary provided by Grant Samuel. It is true that Deloitte has acknowledged difficulties in estimating gamma. Nevertheless, if valuation experts considered that imputation credits did have meaningful

DETERMINING A WACC ESTIMATE FOR PORT OF MELBOURNE Page 259 of 296
ESC commentary Synergies response
difficulties in reliably estimating their value, rather than an in-principle or evidence based view that credits have no value to investors.
value, then it would seem somewhat irresponsible to avoid placing any value on credits, simply because there is uncertainty regarding the precise measurement.
Some surveys of market practice have found that valuation experts to assign some value to imputation credits.
The paper the ESC references here is a paper that we have cited in both of our previous reports. The paper in question finds that approximately 15% of valuation experts assign some value to imputation credits.
Academic studies of the ‘market’ value of imputation credits have been considered extensively in regulatory proceedings. Concerns around the quality of these studies led the Australian Competition Tribunal to commission a ‘state of the art’ dividend drop-off study. This was completed by Professor Stephen Gray, who co-authored four of the six academic papers referred to by Synergies. These and similar academic studies, when considered in depth, do not support Synergies’ assertion that it is well accepted in the academic literature that gamma should take a zero value.
We have placed weight on three well-accepted approaches to gamma. As we have stated previously, the market-based approach is a distinctly different approach from the finance theory / market practice approach, just as the market approach is in turn different from the non-market approach.
Synergies overlooked other studies that would support theta estimates that are higher than the value of 0.35 it relies on.
The Australian Competition Tribunal has previously indicated that no other dividend drop-off study estimates should be given weight. (see Section 12.3.1)
We consider that Synergies misrepresents current regulatory sentiment in stating that ‘regulators’ positions on gamma remain mixed’, and it is ‘clear that regulatory precedent involves two distinct approach’, namely the ‘market’ value approach to estimating theta and those that also have regard to ‘non-market’ evidence.
Once again, we did not have the benefit of the AER draft decision at the time of submitting the TCS. Nevertheless, values range from 0.25 to 0.585. This is indeed mixed.
By presenting values from regulatory determinations since 2010, Synergies overlooks the important effect of appeal outcomes on regulatory decisions. That is, the 2010 decision by the Australian Competition effectively established a precedent for the ‘market’ approach and a gamma value of 0.25. Importantly, this decision left various issues unresolved that have now been examined in more recent decisions, notably by the Federal Court and others by the Tribunal. The latter two decisions overturn the gamma value of 0.25 in favour of the AER’s approach, which places primary weight on the utilisation approach leading to a higher value for gamma.
Our motivation for referencing regulatory determinations since 2010 was to explain why the AER and ERA had adopted different values of gamma in recent years. In particular, at the time of last year’s PoM submission, the AER was using a value that was different from the value in its guidelines. Now that new guidelines have been released, we have placed more weight on these documents as sources of precedent for these regulators.
A key issue considered in recent Tribunal and Federal Court decisions has been whether the Officer WACC framework, including more detailed derivations by Monkhouse and Lally and van Zijl, defines theta as a ‘market’ value. Related to this are arguments around whether prominence should be given to the marginal investor, and whether estimates produced by dividend drop off are consistent with the Officer framework and valuation by the marginal investor. Synergies does not appear to have raised any arguments not already considered in these decisions.
Our analysis has found that no single methodology is unanimously superior to others in terms of well-acceptance. Whilst it appears that most Australian regulators are placing increasing weight on non-market approaches, this need not and should not be viewed as a default position for PoM’s compliance with the Pricing Order. We recognise that recent Tribunal and Court decisions have not found error with recent AER and ERA regulatory decisions. Not only is PoM subject to a different regulatory regime (which is compliance-based rather than deterministic), but our analysis of recent evidence has shown that there are sufficient disadvantages and uncertainties surrounding non-market approaches such that PoM should have regard to a broader range of well-accepted valuation methods for imputation credits.
Conclusions on gamma
We consider that the aforementioned regulatory decisions and appeal outcomes have been comprehensive, and reflect the accumulation of evidence and expert views including from academia and financial practice. Therefore, they provide considerable guidance on what might be regarded as acceptable in the context of setting regulated rates of return at the present time.
As documented above, regulatory values for gamma now range between 0.25 and 0.585. Those values have been estimated under specific Rules which do not apply to PoM. Even among regulators that support non-market approaches, there is disagreement on the precise value for gamma. Additionally, the AER stated objective for the latest rate of return instrument was to undertake an incremental review. This means that the AER was not intending to move

DETERMINING A WACC ESTIMATE FOR PORT OF MELBOURNE Page 260 of 296
ESC commentary Synergies response
away from its non-market approach regardless of any new evidence available.
While the value of 0.25 may have been supported in light of particular positions held during the course of recent debates, we consider that there is significantly less support for such a value now.
IPART continues to adopt a gamma value of 0.25, but once again, the final gamma value adopted by regulators / financial practitioners / academics should not be in question – the methodology applied by each of these is the focus of what is a well-accepted methodology.
In any case, Synergies’ lower gamma is partly due to reliance on a presumption that only foreign investors are relevant when determining the value of imputation credits, which has not been supported in the regulatory context.
This approach is supported by finance theory and financial practitioners.
The port should also consider more recent decisions on the value of the payout ratio in preparing future tariff compliance statements.
Decisions released since the TCS were submitted have now been incorporated into our considerations.
E Australian regulatory precedent on beta determination
The purpose of this attachment is to set out the relevant regulatory precedent for the
assessment of an asset beta for Australian transport companies whose revenues and
earnings are significantly affected by levels of economic activity. It focuses on the
ACCC’s decision on the interstate network and the relevant ERA decisions (both 2008
and 2015).
E.1 ACCC – ARTC’s Interstate network (2008)
E.1.1 2018 Interstate rail access undertaking (draft decision)
The ACCC released its draft decision for the ARTC interstate access undertaking in
December 2018. In the draft decision, the ACCC has decreased ARTC’s asset beta from
0.65 (in the previous 2008 decision) to 0.60.258 The ACCC cited the following reasons for
doing so:
• ARTC’s asset beta should sit at the lower end of the beta range defined by Class I
railroads due to North American railways competing with each other on parallel
infrastructure
• The rail comparator sample includes firms with a high proportion of unregulated
operations, which would contribute to higher asset betas
• ARTC’s assumed steady state perpetual RAB implies that it is exposed to less
systematic risk than other below-rail infrastructure providers
258 ACCC (2018). Australian Rail Track Corporation’s 2018 Interstate Access Undertaking, 20 December.

DETERMINING A WACC ESTIMATE FOR PORT OF MELBOURNE Page 261 of 296
• It is too soon to determine any long-term implications of Aurizon’s intermodal exit.
ARTC subsequently withdrew its proposed access undertaking from the ACCC’s
consideration.
E.1.2 2008 Interstate rail access undertaking
In the ACCC’s beta assessment of ARTC’s interstate network (2008) it determined that
the asset betas of Australian trucking, shipping and other non-rail service providers are
not suitable proxies for ARTC’s asset beta.259
In the ACCC’s assessment, although these firms are observable and have the desirable
quality that they are Australian based transport businesses, the systematic risks of these
types of transport investments is likely to differ markedly to that of a below rail service
provider. For this reason, the ACCC has focussed on non-regulated below rail operators
operating overseas to determine whether ARTC’s requested beta seems reasonable. In
its view, the use of overseas firms was necessitated by the lack of non-regulated below
rail operators in Australia to use as proxy companies.
Despite the fact these firms operate overseas, the ACCC identified these companies as
the best proxy companies to use to estimate ARTC’s exposure to systematic risk. The
proxy companies chosen by the ACCC, principally operating in North America,
typically have asset betas estimated at over 0.65 under the ACCC’s assumption of a zero
debt beta as shown in Table 52 below.
However, the ACCC acknowledged that these operators may operate under slightly
different conditions to ARTC, which may slightly increase their systematic risk relative
to ARTC. In particular, North American railways may have higher market risk because
they often compete with one another due to parallel infrastructure. Despite this, on
balance the ACCC considered that North American and other overseas rail operators’
asset betas generally support ARTC’s argument for an asset beta of 0.65 for its Interstate
Rail Network.
The ACCC’s chosen beta comparators for ARTC’s interstate network are presented in
Table 52.
Table 52 Comparison firms’ equity and asset beta estimates
Equity Beta D/E ratio % Asset Beta
Burlington Santa Fe Corporation 0.969 41 0.69
Canadian National Railway Company 0.62 46 0.43
259 ACCC (2008), p.154.

DETERMINING A WACC ESTIMATE FOR PORT OF MELBOURNE Page 262 of 296
Equity Beta D/E ratio % Asset Beta
Canadian Pacific Railway Limited 0.793 32 0.60
CSX Corporation 0.822 72 0.48
Genesee & Wyoming Inc 1.54 28 1.21
Kansas City Southern 1.241 72 0.73
RailAmerica 1.498 133 0.65
Union Pacific Company Limited 1.097 38 0.80
Simple Average 1.0725 57.75 0.70
Note: Equity Betas were estimated using Bloomberg using 5 years of monthly data. The debt to equity ratio is the estimated average debt
to equity ratio over the beta estimation period and was the debt to equity ratio used for delivering the equity betas. Equity betas were
delivered using the Monkhouse formula.
Source: Bloomberg
Finally, the ACCC noted that ARTC operates under some market demand and price
constraints due to inter-modal competition. This is the principal reason it operates well
below its revenue ceiling on major segments. As such, it bears some market risk and if
the economy does badly (or well) ARTC will lose (or gain) business and profits. This is
different to a typical regulated business, such as electricity distribution or transmission,
that can simply raise prices if demand drops and, therefore, bears far lower market risk.
While the ACCC considered that an asset beta of 0.65 is broadly acceptable for ARTC’s
interstate network, it noted this conclusion would not necessarily apply to other rail
networks nor would it necessarily hold for a future regulatory review in the future.
E.2 ERA – Arc Infrastructure, Pilbara railways and Public Transit Authority
The ERA establishes WACC estimates for Arc Infrastructure, the Pilbara railways and
the Public Transit Authority.260
The Authority notes that choosing a relevant benchmark sample for these three entities
is difficult due to the lack of close comparators of rail infrastructure trading on the
Australian Stock Exchange. Only one directly comparable company is available in
Australia, Aurizon, which was floated on the ASX in July 2010 as QR National. A single
comparable firm leaves the Authority with an insufficient sample on which to estimate
regulated cost of capital parameters.
The Authority is of the view that estimates of asset beta based on benchmark samples
should ideally be relevant to the regulated rail businesses in Western Australia. In this
260 ERA (2015a).

DETERMINING A WACC ESTIMATE FOR PORT OF MELBOURNE Page 263 of 296
context, the Authority considers that two aspects of relevance to a benchmark entity
should be considered.
First, estimates of asset beta from the benchmark samples should provide some
relevance to the economy in which the BEE is operating (in this case, the Australian
economy). Second, these estimates should also provide some relevance to the
industry/sector in which the efficient benchmark entity is operating (in this case, the rail
industry).
The Authority considers that a benchmark sample including only Australian businesses
that are comparable with rail is preferred for the purposes of its empirical studies.
However, the Authority’s analysis indicates that there are insufficient rail businesses
comparators operating in Australia. Given empirical estimates are the only viable option
for estimating the asset beta for rail businesses, the Authority is of the view that a
benchmark sample including both Australian and developed countries in Europe and
America is appropriate.
In this context, the ERA follows the same structured process to determine its beta
comparators for each of these regulated entities, which entails first identifying
Australian comparators and then due to an insufficiently small sample, extending its
search to include the most comparable international entities. The ERA recently released
a draft determination for its 2019 draft determination. Its approach to beta is
substantively similar to the 2015 methodology.
E.2.1 Arc Infrastructure (2015 and 2019)
The Arc Infrastructure network in the south-west of Western Australia is a freight rail
network that primarily transports commodities such as iron ore, grain, coal, alumina and
interstate freight.
The Authority considers that a firm must satisfy the following conditions in order to
belong to the Arc Infrastructure benchmark sample:
• primarily involved in the transportation of goods across comparable distances;
• located in Australia or a similar developed economy;
• involved in the transportation of similar commodities to those transported on the
Arc Infrastructure network (that is, bulk goods, but also general freight).
The ERA indicates that it applies the following filters in the Bloomberg terminal using
the Equity Screening function, such that the comparator firm must:

DETERMINING A WACC ESTIMATE FOR PORT OF MELBOURNE Page 264 of 296
• operate in an OECD country that has similar political, economic and geographical
similarities to Australia;
• belong to the ICB (Industry Classification Benchmark) Subsector: Railroads; and
• provide sufficient pricing data to allow calculation of its equity beta and gearing.
In addition, the Authority has included comparator companies that were included in its
previous WACC determinations for the Arc Infrastructure network.
The Authority considers that Aurizon is the closest comparator company to the Arc
Infrastructure network in respect of its Australian operations and transport task. It is
also listed. However, the regulatory regime differs between Arc Infrastructure and
Aurizon in that Arc Infrastructure is subject to a negotiate-arbitrate regulatory regime,
while the Aurizon network is subject to a revenue cap system. In addition, the use of
only one comparator company may not adequately capture the risks faced by the Arc
Infrastructure network.
The Authority has previously accepted advice that Australian and New Zealand
transport companies are relevant to inform the required equity beta, credit rating and
gearing for the Arc Infrastructure network. However, it considers non-rail operators to
be less relevant proxy companies compared to rail network operators. Nevertheless, they
provide some information of value, particularly given the small size of the sample, so
are retained.
The ERA’s beta comparators are presented in the following table.261 This sample of 11
comparators is reduced from the 15 comparators used in its rate of return decisions prior
to 2015. The Authority removed Auckland Airports and Infratil (a NZ investment fund
with investments in energy, transport and social infrastructure businesses) from the pre-
2015 benchmark sample, as well as Macquarie Infrastructure Group. Aurizon Holdings
has been added to the sample.
Table 53 Comparator companies for Arc Infrastructure
Company Name
Country Ticker Company Description
Genesee & Wyoming
United States GWR US Equity
Genesee & Wyoming Inc., through its subsidiaries, owns and operates short line and regional freight railroads and provides related rail services. The company also provides railroad switching and related services to United States industries with extensive railroad facilities within their complexes. Genesee operates in the United States and Australia.
Union Pacific Corporation
United States UNP US Equity
Union Pacific Corporation is a rail transport company. The Company’s railroad hauls a variety of goods, including agricultural, automotive, and chemical products. Union Pacific offers long-haul routes from all major
261 ERA (2015a).

DETERMINING A WACC ESTIMATE FOR PORT OF MELBOURNE Page 265 of 296
Company Name
Country Ticker Company Description
West Coast and Gulf Coast ports to eastern gateways as well as connects with Canada’s rail systems and serves the major gateways to Mexico.
Norfolk Southern Corporation
United States NSC US Equity
Norfolk Southern Corporation provides rail transportation services. The Company transports raw materials, intermediate products and finished goods primarily in the Southeast, East and Midwest and, via interchange with rail carriers, to and from the rest of the United States. Norfolk Southern also transports overseas freight through several Atlantic and Gulf Coast ports.
Kansas City Southern
United States KSU US Equity
Kansas City Southern, through its subsidiary, is the holding company for transportation segment subsidiaries and affiliates. The Company operates a railroad system that provides shippers with rail freight services in commercial and industrial markets of the United States and Mexico.
CSX Corporation
United States CSX US Equity
CSX Corporation is an international freight transportation company. The Company provides rail, intermodal, domestic container-shipping, barging, and contract logistics services around the world. CSX’s rail transportation services are provided principally throughout the eastern United States.
Canadian Pacific Railway
Canada CP CN Equity
Canadian Pacific Railway Limited is a Class 1 transactional railway, providing freight and intermodal services over a network in Canada and the United States. The Company’s mainline network serves major Canadian ports and cities from Montreal to Vancouver, and key centers in the United States Midwest and Northeast.
Canadian National Railway
Canada CNR CN Equity
Canadian National Railway Company operates a network of track in Canada and the United States. The Company transports forest products, grain and grain products, coal, sulphur, and fertilizers, intermodal, and automotive products.
Canadian National operates a fleet of locomotives and rail cars.
Toll Holdings Limited
Australia TRH NZ Equity
Toll NZ Ltd. Provides freight transport and distribution services. The Company offers transportation, long-haul bulk freight, warehousing and freight forwarding services. Toll NZ also operates passenger and freight transport vehicles that provides relocation and priority delivery services. Toll NZ conducts its business in New Zealand and Internationally.
Aurizon Holdings
Australia AZJ AU Equity
Aurizon Holdings Ltd. is a rail freight company. The Company provides coal, bulk and general freight haulage services, operating on the Central Queensland Coal Network (CQCN) and including specialised track maintenance and workshop support functions.
Asciano Limited Australia AIO AU Equity
Asciano Limited is a provider of essential transport services in the rail and ports and stevedoring industries in Australia and New Zealand. The Company operates container terminals, bulk export facilities and container and bulk rail haulage services.
Port of Tauranga
New Zealand POT NZ Equity
Port of Tauranga Limited activities include the provision of wharf facilities, back up land for the storage and transit of import and export cargo, berthage, cranes, tug and pilotage services for exporters, importers and shipping companies and the leasing of land and buildings. The Group also operates a container terminal and has bulk cargo marshalling operations.
Source: Bloomberg, ERA Analysis.
Finally, the Authority’s a priori expectation is that overseas rail operators will possess a
higher level of risk, relative to an Australian railway operator, as American and
Canadian railway operators for example are expected to face higher degrees of
competition from alternative forms of transportation, such as roads. The Authority
indicates it will therefore employ significant regulatory discretion when determining
appropriate benchmark parameters for the Arc Infrastructure network, with a view that
its risks are at the lower end of overseas railway operators, and at the higher end of
Australian and New Zealand transport companies.

DETERMINING A WACC ESTIMATE FOR PORT OF MELBOURNE Page 266 of 296
The Authority estimates the asset beta for the Arc Infrastructure network as being 0.7.
Utilising the estimated gearing of 25 per cent, this corresponds to an equity beta of 0.9.
E.2.2 TPI (2015 and 2019)
The TPI railway transports iron ore from Fortescue Metal Groups (FMG) Cloud Break
iron ore mine in the East Pilbara to TPI’s port facilities at Anderson Point, Port Hedland.
Of the three Western Australian rail networks, TPI has the least number of direct
comparators. Unlike, the PTA and Brookfield Rail, TPI lacks diversification and
exclusively services the mining industry exposing it to the relatively high volatility of
minerals markets.
The Authority notes that TPI’s reliance on a single commodity – iron ore – transported
across one large distance, significantly differentiates it from the Brookfield Rail network.
As a consequence, not all of the companies in the Brookfield sample are appropriate as
comparators to TPI. The Authority considers that only Aurizon in Australia
supplemented by overseas railway operators are able to adequately capture the risks
faced by the TPI rail network.
Furthermore, the Authority considers that due to TPI’s exposure to only a limited
number of potential users in the mining industry, TPI’s risks are likely to be at the upper
end of those faced by the companies contained in the benchmark sample. At the same
time, the Authority considers that the US short-line rail operator Genesee & Wyoming
Inc. is likely to be the best comparator for TPI. This is primarily due to Genesee &
Wyoming Inc. operating class II/III short railway lines, including a number of similar
lines in Australia.
The ERA’s beta comparators are presented in Table 54.
Table 54 Comparator companies for TPI Network
Company Name
Country Ticker Company Description
Aurizon Holdings
Australia AZJ AU Equity
Aurizon Holdings Ltd is a rail freight company. The Company provides coal, bulk and general freight haulage services, operating on the Central Queensland Coal Network (CQCN) an including specialised track maintenance and workshop support functions.
Genesee & Wyoming Inc.
United States GWR US Equity
Genesee & Wyoming Inc., through its subsidiaries, owns and operates short line and regional freight railroads and provides related rail services. The company also provides railroad switching and related services to United States industries with extensive railroad facilities within their complexes. Genesee operates in the United States and Australia.
Union Pacific Corporation
United States UNP US Equity
Union Pacific Corporation is a rail transportation company. The Company’s railroad hauls a variety of goods, including agricultural, automotive, and chemical products. Union Pacific offers long-haul routes from all major West Coast and Gulf Coast ports to eastern gateways as well as connects with Canada’s rail systems and serves the major gateways to Mexico.

DETERMINING A WACC ESTIMATE FOR PORT OF MELBOURNE Page 267 of 296
Company Name
Country Ticker Company Description
Norfolk Southern Corporation
United States NSC US Equity
Norfolk Southern Corporation provides rail transportation services. The Company transports raw materials, intermediate products, and finished goods primarily in the Southeast, East, and Midwest and, via interchange with rail carriers, to and from the rest of the United States. Norfolk Southern also transports overseas freight through several Atlantic and Gulf Coast ports.
Kansas City Southern
United States KSU US Equity
Kansas City Southern, through its subsidiary, is the holding company for transportation segment subsidiaries and affiliates. The Company operates a railroad system that provides shippers with rail freight services in commercial and industrial markets of the United States and Mexico.
CSX Corporation
United States CSX US Equity
CSX Corporation is an international freight transportation company. The Company provides rail, intermodal, domestic container-shipping, barging, and contract logistics services around the world. CSX’s rail transportation services are provided principally throughout the eastern United States.
Canadian Pacific Railway
Canada CP CN Equity
Canadian Pacific Railway Limited is a Class 1 transcontinental railway, providing freight and intermodal services over a network in Canada and the United States. The Company’s mainline network serves major Canadian ports and cities from Montreal to Vancouver, and key centres in the United States Midwest and Northeast.
Canadian National Railway
Canada CNR CN Equity
Canadian National Railway Company operates a network of track in Canada and the United States. The Company transports forest products, grain and grain products, coal, sulphur, fertilizers, intermodal, and automotive products. Canadian National operates a fleet of locomotives and railcars.
Source: Bloomberg Terminal, ERA Analysis
The Authority now considers that an asset beta of 1.00 reflects the higher risks associated
with the returns of the TPI network. This is a decrease from 1.05 in the previous review,
due to asset beta decreases observed for relevant comparators. When combined with the
estimated gearing of 0.2, this results in an equity beta of 1.3.
E.2.3 Public Transit Authority (PTA) (2015 and 2019)
The Authority considers that a firm must satisfy the following in order to belong to the
PTA benchmark sample:
• provide a service similar to passenger rail, for example toll road or commercial
passenger transportation companies;
• be located in Australia or a similar OECD economy;
• be mature, hence have limited growth opportunities;
• be of similar size to the PTA.
The Authority has used the Bloomberg terminal in order to identify comparable
companies for the PTA. The following filters were applied in the Bloomberg terminal
using the Equity Screening function. Selected companies will:
• belong to the OECD;

DETERMINING A WACC ESTIMATE FOR PORT OF MELBOURNE Page 268 of 296
• provide a reference service similar to that of the PTA (toll roads and/or commercial
passenger transportation across suburban areas);
• be well established with limited growth opportunities; and
• have sufficient pricing data in order to estimate equity beta and gearing.
The ERA’s beta comparators for the PTA are presented in Table 55.
Table 55 Comparator companies for PTA as returned by Bloomberg
Company Name
Country Bloomberg Ticker
Company Description
Transurban Group
Australia TCL AU Equity
Transurban Group is involved in the operation of the Melbourne City Link and the Hills Motorway M2 toll roads. The Group is also involved in developing and operating electronic toll systems.
Atlantia SPA Italy ATL IM Equity
Atlantia S.P.A is a holding company with responsibility for portfolio strategies in the transport and communications infrastructures and network sectors.
Vinci SA France DG FP Equity
Vinci SA builds roads, offers electrical, mechanical and civil engineering and construction services, and operates toll roads. The Company builds and maintains roads and produces road construction materials, builds electricity and communications networks, installs fire protection and power and ventilation systems, and operates toll highways, bridges, parking garages, and a stadium.
Abertis Infraestructuras S.A
Spain ABE SM Equity
Abertis Infraestraucturas S.A is an international group which manages mobility and telecommunications infrastructures through three business areas: toll roads, telecommunications infrastructure and airports. The group is present in Europe and the Americas.
Macquarie Atlas Roads Group
Australia MQA AU Equity
Macquarie Atlas Roads Group manages toll roads. The Company operates toll highways in the United Kingdom, France and the United States.
Source: Bloomberg Terminal, ERA Analysis.
Given the low level of systematic risk for the PTA rail network, the Authority considers
that an asset beta of 0.3 is appropriate. Utilising the estimated gearing of 50 per cent, this
corresponds to an equity beta of 0.6.
E.3 ERA’s pre-2015 beta comparators for Brookfield Rail (freight)
Based on advice from Allen Consulting Group, ERA used the following sample of
Australian and international beta comparators in its rate of return decisions between
2008 and 2015.262 A key difference in the comparator set adopted in 2008 relative to 2015
was the inclusion of airports in the former sample.
262 Allen Consulting Group (2007). Railways (Access) Code 2000: Weighted average cost of capital, 2008 WACC
determinations, October, pp.28-29.

DETERMINING A WACC ESTIMATE FOR PORT OF MELBOURNE Page 269 of 296
Table 56 Relative asset and equity betas of US comparator firms
Company Country Raw Equity Beta Debt/assets ratio Asset beta
Kansas City Southern US 1.23 0.70 0.74
Union Pacific Corporation US 0.81 0.38 0.59
RailAmerica Inc US 1.61 1.32 0.69
CSX Corporation US 1.15 0.77 0.65
Burlington Northern Santa Fe US 1.07 0.43 0.75
Average 0.69
Source: Bloomberg, ACG Analysis
Table 57 Relative asset and equity betas of US comparator firms
Company Country Raw Equity Beta Debt/assets ratio Asset beta
Canadian Pacific Railway Ltd Canada 0.956 0.48 0.65
Canadian National Railway Company
Canada 1.023 0.28 0.80
Average 0.73
Source: Bloomberg, ACG Analysis
Table 58 Relative asset and equity betas of Australian comparator transport sector firms
Company Country Raw Equity Beta Debt/assets ratio Asset beta
Adsteam Marine Limited Australia 1.238 0.90 0.65
Macquarie Infrastructure Group
Australia 0.745 0.31 0.57
Patrick Corporation Ltd Australia 1.056 0.07 0.99
Toll Holdings Limited Australia 0.869 0.22 0.71
Average 0.73
Source: Bloomberg, ACG Analysis
Table 59 Relative asset and equity betas of New Zealand comparator transport sector firms
Company Country Raw Equity Beta Debt/assets ratio Asset beta
Auckland International Airport Ltd
New Zealand 0.944 0.26 0.75
Infratil Ltd New Zealand 1.29 0.65 0.78
Port of Tauranga Ltd New Zealand 0.873 0.31 0.67
Toll NZ Ltd New Zealand 0.773 0.72 0.45
Average 0.66
Source: Bloomberg, ACG Analysis
E.4 IPART equity beta methodology review
On 1 April 2019, IPART initiated a consultation on its approach to estimating the equity
beta. The review will cover pre-estimation screening rules, data quality and liquidity
filters, and post-estimation screening rules. At the time of writing, IPART’s review is still

DETERMINING A WACC ESTIMATE FOR PORT OF MELBOURNE Page 270 of 296
at the consultation process. An overview of IPART’s proposed framework is outlined in
Table 60. To a large extent, these steps resemble those already embedded in our own
filtering process (e.g. removing firms with overly diversified revenues; excluding
companies from China, Russia and some African exchanges; deleting firms with a high
number of missing observations.)
Table 60 Equity beta estimation sample selection methodology
Criteria Procedure
1.0 Pre-estimation screening rules To pass stage one, the selection of proxy companies must pass three characteristic screening tests and must operate in an industry that face similar risk characteristics to the benchmark entity for which we calculate the WACC. If the industry sector is narrow, there may few if any listed firms to observe. In those cases, IPART may examine upstream or downstream industries on which the benchmark entity relies on.
1.1 Industry Does the firm operate in the nominated industry?
• What industry/s should be used to identify proxy firms?
The industry of the benchmark firm is often chosen as a broad proxy for the risk profile of that firm because all firms within a common industry group face the same or similar business risks. However, it is possible to broaden the scope of potential comparators (with the additional risk of bias) by including companies that operate under similar conditions in another industry from the benchmark firm.
The Thompson Reuters Business Classification (TRBC) is one of many industry classification schemes. It divides publicly traded equities into 54 industries and 136 sub-industries. IPART used this scheme in its case study to estimate a water industry beta using the “Water” sub-industry definition.
1.2 Market Does the firm undertake their activities in capital markets that are sufficiently similar to Australia?
Sample firms must undertake their activities in capital markets that are sufficiently similar to Australia given the benchmark firm is Australian. IPART seeks to include markets that approximate Australia’s sovereign characteristics. Therefore, to determine the comparability of international firms:
- Is the sovereign’s government bond market sufficiently deep and liquid compared to the benchmark firm’s capital market?
- Is the sovereign’s equity market sufficiently deep and liquid?
- Is the firm’s international headquarters consistent with their actual operating market?
In IPART’s case study, IPART excluded companies that trade on the Chinese, Russian and African stock exchanges on the basis they exhibit sufficiently different sovereign characteristics to Australia which may bias the results.
1.3 Operating Profile Does the firm have a similar operating profile to the benchmark firm?
• Are firm revenues predominately in the nominated industry?
In terms of business structure, firms that should be included in the sample must have revenues that are predominately sourced from the nominated industry chosen for the benchmark firm.
IPART nominated the ‘water’ sub-industry and have assumed the majority of firm’s revenue comes from activities related to water supply and treatment. Therefore, no adjustments to the sample size was made in this selection criteria.
2.0 Data quality and Liquidity filters Exclude firms with insufficient data and thinly-traded stocks according to three liquidity filters
Data quality To ensure accuracy and robustness, only firms with high quality data are kept in the sample. Firms are excluded from the sample if:
- They do not return an International Securities Identification Number (ISIN) since relevant data for the firm cannot be extracted
- Do not return a market index code since the market in which the firm operates in cannot be identified

DETERMINING A WACC ESTIMATE FOR PORT OF MELBOURNE Page 271 of 296
Criteria Procedure
- Are no longer trading
Beta estimation liquidity filters are applied as thinly-traded stocks could produce distorted estimates due to stale price data
1. Remove a monthly observation for a given stock if there is less than 10 days of trading data available in that month
In IPART’s case study, only around 70% of the monthly observations for all companies have more than 10 days of trading data.
2. Remove a monthly observation for a given stock if the calculated Amihud measure exceeds the threshold of 25
The Amihud measure approximates the price impact of illiquidity and is used as a screening tool to remove a monthly observation for a given stock if the calculated Amihud measure exceeds the threshold of 25. This threshold value was benchmarked against historical equity returns data for the Australian stock market.
3. Remove firm if it has less than 36 months of trading data available
In IPART’s case study, after applying the above filters, firms with less than 36 months of trading data are excluded from the sample because a time series of less than three years is too short to calculate a reliable medium-run beta estimate. A short time series represents a newly established firm, which is inconsistent with a mature benchmark firm. Short time series are also prone to measurement error, hence reducing reliability of results.
3.0 Post-estimation screening rules
The post-estimation screens focus on the equity beta outputs for the sample of individual firms, to ensure estimates are robust and appear unbiased. IPART would accept the proxy sample as final where:
1. The sample size is sufficiently large
2. Estimates appear to be consistent, with clear outliers excluded from the sample
3. There is no obvious bias in the results by comparing the equity beta estimates against other estimates from Bloomberg, Datastream and other comparable regulators or academic estimates
Source: IPART

DETERMINING A WACC ESTIMATE FOR PORT OF MELBOURNE Page 272 of 296
F Market risk premium – Supplementary information
The purpose of this attachment is to provide further details of regulatory precedent and
market survey evidence in regard to the market risk premium.
The market risk premium (MRP) is the amount an investor expects to earn from a
diversified portfolio of investments (reflecting the market as a whole) that is above the
return earned on a risk-free investment. The key difficulty in estimating the MRP arises
from it being an expectation and therefore not being directly observable.
Whilst the MRP is an inherently forward-looking parameter, the difficulty with
observing or inferring it from market data means that there is valuable information
about its value in historical data (historical averages of excess returns from the market
above the relevant risk-free rate).
A range of methods have been developed to estimate the MRP falling broadly into two
approaches – historical and forward looking. These are considered in turn. In combining
approaches to determining the MRP we have had regard to the approaches adopted by
financial practitioners, academic literature and Australian regulators in their assessment
of the MRP.
F.1 Regulatory decisions on the MRP
Brief summaries of Australian regulators’ approaches to estimating the MRP are
presented below.
IPART
IPART derives its feasible WACC range from a range based on long run averages and a
range based on current market data.
Under this approach, it will still use long run historical averages of the MRP, which it
values at between 5.5% and 6.5%, to estimate its long run average WACC range. Its
current WACC range reflects the current implied MRP, which is derived from DDM
estimates.
In its semi-annual update for February 2018, IPART’s range for the MRP extended from
6.0% (mid-point of long term average range) to 9.1% (mid-point of current range), with
a mid-point of the two ranges of 7.6%.263
263 IPART (2018b), p.2.

DETERMINING A WACC ESTIMATE FOR PORT OF MELBOURNE Page 273 of 296
For the most recent update in February 2019, IPART continued to hold its long-term
estimate fixed at 6.0%. Meanwhile, its current measure has fallen over the last 12 months
by 50 basis points to 8.6%, making the midpoint of these two estimates 7.3%.264
However, IPART’s MRP estimate as a margin above the contemporary risk-free rate is
likely to be greater than this reported value because of the higher risk-free rate assumed
in its approach (3.15%, due to its 50% weighting on the 10-year risk-free rate estimate).
ERA (WA)
In 2015, the ERA completed a review of the methodology it applies to estimate the
WACC for rail networks. In its first Draft Determination for this review released in June
2014, the ERA’s assessment of the MRP was primarily informed by historical averages
and the DDM.265 It arrived at a range of 5% to 7.5% and stated that it will apply
judgement as to where it will select the point estimate at any point in time. For that Draft
Determination, it proposed a value of 6%.
Subsequently, the ERA fundamentally changed its approach to estimating the MRP for
rail networks. In a revised Draft Decision issued in November 2014, it proposed to solely
rely on the Wright approach.266 The ERA further revised its position in the Final Decision
issued in September 2015 and took into consideration estimates informed by historical
excess returns (Ibbotson and Wright) and DDMs.267 It stated it is more inclined towards
the Wright approach as “a strong indicator for the likely return on equity for the next 50
years, given the statistical evidence for the mean reversion of the return on equity.”268 It
arrived at a final estimate of 7.3%.
It took a similar approach in its assessment for ATCO Gas, where it applied an MRP of
7.6%.269 It applied an updated value of 7.4% in its most recent determination for the
Dampier to Bunbury Pipeline.270 In its June 2015 decision for ATCO, the ERA
commented on its approach as follows:271
264 IPART (2018c). WACC biannual update, February 2019, p.2.
265 ERA (2014a). Review of the method for estimating the weighted average cost of capital for the freight and urban rail networks, Draft determination, 5 June.
266 ERA (2014b). Review of the method for estimating the weighted average cost of capital for the regulated railway networks, Revised draft decision, 28 November.
267 ERA (2015a).
268 ERA (2015a), p.145.
269 ERA (2015b). Final decision on proposed revisions to the Access Arrangement for the Mid-West and South-West gas distribution systems, Submitted by ATCO Gas Australia Pty Ltd, 30 June.
270 ERA (2016). Final decision on proposed revisions to the Access Arrangement for the Dampier to Bunbury Natural Gas Pipeline 2016-2020, 30 June.
271 ERA (2015b), p.249.

DETERMINING A WACC ESTIMATE FOR PORT OF MELBOURNE Page 274 of 296
Most significantly, the Authority has now concluded that it is not reasonable to
constrain the MRP to a fixed range over time. The erratic behavior of the risk-free rate
in Australia to date, and more particularly, its pronounced decline in the current
economic environment, leads to a situation where the combination of a fixed range
for the MRP and prevailing risk-free rate may not result in an outcome which is
consistent with the achievement of the average market return on equity over the long
run.
The results indicated the market return on equity was stationary [consistent with the
Wright approach for estimating the MRP] ... with the analysis supporting a conclusion
that the MRP is non-stationary. This finding led the Authority to the important
conclusion that the long run historical estimate of 6 per cent could be a poor predictor
of the MRP prevailing in future regulatory periods.
We note that the changing values applied by the ERA primarily reflect changes in the
DDM estimates, which are more volatile through time (compared with comparatively
stable historical excess returns).
More recently, the ERA has expressed less confidence in the Wright MRP. For the
Western Power final decision released in September 2018, the ERA applied an MRP of
6.0%, which was a further decrease from the 6.2% applied in the draft decision.272 These
decisions give no weight to the Wright approach. The ERA has also signalled that it has
diminished confidence in the dividend growth model and considers that it is reasonable
to place less reliance on it relative to the historic MRP. The ERA revised its MRP estimate
to 5.9% for the rail WACC draft determination in May 2019.
AER
Under the AER’s Rate of Return Guideline, the AER is proposing to estimate the MRP
having regard to historical excess returns, DDM estimates, survey evidence and
conditioning variables.273 The key difference from previous approaches is that it may
place some weight on forward-looking DDM estimates, which could see more variability
in the MRP estimate through time. Unlike previously, the AER has not stipulated the
value of the MRP in the Guideline but will review it at the time of each revenue
determination.
272 ERA (2018). Final decision on proposed revisions to the access arrangement for the Western Power network –
Appendix 5: Return on regulated capital base, 20 September.
273 The AER does not explain what it means by ‘conditioning variables’.

DETERMINING A WACC ESTIMATE FOR PORT OF MELBOURNE Page 275 of 296
In its Explanatory Statement accompanying its Final Decision on the Guideline274, the
AER arrived at a range for the MRP of 5% to 7.5% (with historical averages informing
the lower bound and DDM estimates the upper bound). It arrived at a point estimate of
6.5%, which was consistent with its post-GFC uplift previously applied under its
Statement of Regulatory Intent. It set out its reasons based on the consideration of the
relative strengths and weaknesses of each piece of evidence. It did not stipulate weights
but stated that “greatest consideration” was given to historical averages, followed by the
DDM estimates and then surveys.275
Unlike previously, the AER has not prescribed the MRP in its guideline, which reflects a
view that it is likely to vary through time (although this does not imply that it is
considered highly variable or volatile). However, it has consistently applied a MRP of
6.5% in all decisions made under that guideline since it was finalised in December 2013.
The 2018 Rate of Return Instrument will apply an MRP of 6.1% for the duration of the
review period.276 This is a slight increase from the draft decision of 6.0%. The 0.1%
increase was attributable to the increase in the utilisation rate between the draft and final
decisions.
QCA
Until recently, the QCA has applied four main methods to estimate the MRP, being three
forms of historical averaging (the Ibbotson, Siegel and Wright methods), survey
evidence (including independent expert reports) and the Cornell DDM.
It had previously applied equal weights to each approach but similar to the AER,
proposes a more flexible approach based on judgement. It concluded that 6.5% was the
most appropriate value at the time and it has continued to apply this value in decisions
made since then, including its most recent Draft Decision for DBCT, where it rejected
DBCT Management’s proposed MRP of 8%.277
However, in its UT5 draft decision for Aurizon Network in December 2017, the QCA
approved Aurizon Network’s proposed MRP of 7%. The QCA stated that it in light of
stakeholder submissions, it reviewed its position on the Wright approach and will now
give “more regard to estimates from the Wright method”.278 In reaching this conclusion,
274 AER (2013b).
275 AER (2013b), p.95.
276 AER (2018). Rate of return instrument – Explanatory statement, December.
277 QCA (2016). DBCT Management’s 2015 draft access undertaking, Draft decision, April.
278 QCA (2017), p.493.

DETERMINING A WACC ESTIMATE FOR PORT OF MELBOURNE Page 276 of 296
the QCA noted that its analysis suggesting greater stability in the MRP than the return
on equity over time was “not determinative, given the limitations identified.”279 The
QCA maintained this approach for both the Seqwater Bulk Water Price Review 2018-21
in March 2018, and the UT5 final decision in December 2018.
For the 2020 Queensland Rail Draft Access Undertaking, the QCA applied a 10-year risk-
free rate instead of a risk-free rate matching the regulatory period. The use of a higher
risk-free rate led the QCA to decrease its MRP to 6.5% because its methodology relies in
part on approaches that respond to changes in interest rates.
ESCOSA
In its June 2016 for SA Water, ESCOSA applied an MRP of 6%, expressing a preference
for historical excess returns. It considers that the DDM approach is “potentially volatile
and unreliable.” It also notes that this is the value it has applied to SA Water in previous
determinations.
Essential Services Commission (Vic)
The ESC does not have any formal guidelines in place that outline its approach to
assessing WACC.
We note that in its June 2016 Melbourne Water decision it applied a MRP of 6%, which
was originally contained in a Guidance Paper.280 The reasoning behind this was not
provided. It reflects a preference for relying on historical excess returns to estimate the
MRP.
Office of the Tasmanian Economic Regulator (OTTER)
The Economic Regulator currently sets its MRP at 6.5%. It had previously used an MRP
of 6% for TasWater’s first and second regulatory periods. For the third price
determination completed in March 2018, the Economics Regulator accepted TasWater’s
proposal that all state-owned regulated network monopolies should have the same
MRP. As the AER had applied an MRP of 6.5% for TasNetworks, the Economic Regulator
elected to apply the same MRP for TasWater.
279 QCA (2017), p.493.
280 ESC (2015). Melbourne Water 2016 price review, Guidance paper, March. We note that 6% was also applied to Goulburn Murray Water in its June 2016 decision, although for a different reason, which was the need for consistency with the ACCC’s Pricing Principles for Price Determinations and Approvals under the Water Charge (Infrastructure) Rules 2010. These Pricing Principles prescribe an MRP of 6%.

DETERMINING A WACC ESTIMATE FOR PORT OF MELBOURNE Page 277 of 296
Independent Competition and Regulatory Commission (ICRC)
The ICRC also currently sets its MRP at 6.5%. The most recent evidence for its stance on
this parameter comes from its final report on regulated water and sewerage services
prices for Icon Water.
As the ESC noted in its interim commentary, the ICRC had regard to the range of MRP
estimates adopted by other Australian economic regulators in reaching its decision. On
this point, the ICRC noted that:281
Most Australian regulators use a range of methodologies to arrive at a preferred
estimate of the market risk premium. The AER, ERA, IPART and the QCA have
completed major reviews of their WACC methodologies in recent years and used a
range of information to establish a preferred market risk premium.
Such practices effectively recognize that there is no firm consensus on how the market
risk premium should be estimated for regulatory applications.
For its final decision, the ICRC considered that the most recent AER decision available
to it at the time (handed down in November 2017) provided the best estimate of the MRP.
It noted elsewhere that:282
The practice of using a range of methods and models, provided they have credibility,
is more appropriate when there is uncertainty about a parameter, as recognised by
the Australian Competition Tribunal in endorsing the AER approach.
The ICRC has not published any further decisions since May 2018, so it is not clear
whether its support extends to the value of 6.1% that the AER will now apply in its Rate
of Return Instrument.
F.2 Market surveys
Fernandez’s surveys
Of the surveys frequently cited by regulators is one conducted by the Spanish academic
Pablo Fernandez. Frontier Economics (2016) raises the concern that this source
consistently reports an MRP in the range of 6%, regardless of the conditions in financial
markets.283
281 ICRC (2018). Regulated water and sewerage services prices 2018-23, Final report, May, p.109.
282 ICRC (2018), p.112.
283 Frontier Economics (2016). The market risk premium: Report prepared for Aurizon Network, November.

DETERMINING A WACC ESTIMATE FOR PORT OF MELBOURNE Page 278 of 296
However, in the 2017 Fernandez et al. survey, the average (median) MRP was estimated
to be 7.3% (7.6%) for Australia.284 However, in a report for the QCA, Lally (2017) argued
that this Australian MRP estimate was higher than any other developed country in the
survey (other than Portugal) and that the sample size was relatively small (26 responses,
roughly one third of the previous year’s responses).285 Thus, there are substantial issues
regarding how much weight can be placed on evidence from market surveys.
The 2018 Fernandez et al. survey reported an average (median) MRP of 6.6% (7.1%), a
slight decrease from the 2017 results.286 The 2018 survey was based on 74 responses, a
sample size more in line with previous years. The survey also samples the average and
median risk-free rate used in each country. For Australia, the average (median) risk free
rate was 3.1% (3.0%), substantially above the observed 10-year Commonwealth
Government bond yields that prevailed during the course of the year. The average
(median) required return to the market (the risk-free rate plus MRP) in the sample was
9.7% (10.0%).
Respondents were identified as finance and economics professors, analysts and
managers of companies obtained from previous correspondence, papers and webs of
companies and universities, but there is no further information presented about the
specific qualifications of these respondents. The survey does not ask respondents for
what purpose they are using their estimate of the MRP.
Lally (2013) notes that “the respondents to these surveys are academics, analysts, and
managers rather than investors per se.”287 Hence it is unlikely that the overwhelming
majority of any of the survey respondents would be employing their estimate of the MRP
to reach real-world investment decisions.
Another issue relates to response rates. Emails were sent to 22,500 email addresses with
2,396 emails received in reply. Whilst this is probably a reasonable response rate for an
international survey, there is no real indication of how the non-response may impact
upon the results.
284 Fernandez, P., Pershin, V. & Acin, I.F. (2017). Discount rate (risk-free rate and market risk premium) used for 41
countries in 2017: a survey.
285 Lally, M. (2017). Review of submissions from Frontier Economics on the WACC for Aurizon Network. 8 November, p.19
286 Fernandez, P., Pershin, V. & Acin, I.F. (2018). Market risk premium and risk-free rate used for 59 countries in 2018: a survey.
287 Lally M. (2013), p.23.

DETERMINING A WACC ESTIMATE FOR PORT OF MELBOURNE Page 279 of 296
On top of this, there is evidence that many respondents may simply base their estimates
on textbooks or historical data, meaning that there is often no real value added compared
to other measurements.
Asher and Hickling Surveys
Regulators including the ACCC also rely upon the Asher and Hickling Equity Risk
Premium Surveys. In a summary of the survey results, Asher and Carruthers (2016)
discuss the methods that survey respondents use for determining their MRP estimates:288
Most people (52%) used a variety of methods for determining the equity risk
premium, with forward looking measures (21%) more prevalent than historical data
(17%) for the rest. The methodology for determining the ERP ranged from detailed
modelling to “gut feel based on 40 years’ experience”. Gut feel has a bad name in
some quarters … but only time will tell which method proves to be most accurate.
KPMG Australian Valuation Practices Survey
With regard to the KPMG Australian Valuation Practices Survey, 40% of participants state
that they ‘always’ adjust the CAPM rate of return by a premium, to reflect unique risks
that are not modelled in the forecast cash flows.289 The remaining 60% report doing this
at least ‘sometimes’, while no respondent stated that they ‘never’ make an adjustment.
In terms of the methodology used to adjust the CAPM rate of return, 13% of respondents
relied solely on the historic equity bond spreads, 26% relied solely on the expected
premium, while the majority (61%) used a combination of the two.
The Australian Competition Tribunal has also raised concerns about the use of market
surveys:290
Surveys must be treated with great caution when being used in this context.
Consideration must be given at least to the types of questions asked, the wording of
those questions, the sample of respondents, the number of respondents, the number
of non-respondents and the timing of the survey. Problems in any of these can lead
to the survey results being largely valueless or potentially inaccurate.
When presented with survey evidence that contains a high number of non-
respondents as well as a small number of respondents in the desired categories of
288 Asher A. and Carruthers, D. (2016). Equity risk premium survey 2015, Actuaries Digital, Available from:
https://www.actuaries.digital/2016/05/26/equity-risk-premium-survey-2015/ [Accessed 4 May 2017].
289 KPMG (2015). Australian valuation practices survey 2015, May, p.21.
290 Application by Envestra Ltd (No 2) [2012], ACompT 3, para. 162-163.

DETERMINING A WACC ESTIMATE FOR PORT OF MELBOURNE Page 280 of 296
expertise, it is dangerous for the AER to place any determinative weight on the
results.
In a report to Corrs Chambers Westgarth, McKenzie and Partington list several
shortcomings associated with surveys:291
• Selecting an appropriate survey group that is representative of actual investors.
• Low response rates, and the extent to which survey authors deal with response bias.
• The lack of justification for respondents’ claims
• The effect of question wording on responses – ambiguity can lead to diverse
responses
• How respondents adjust their opinions in relation to changing market conditions
Synergies’ view
Based on the above expert opinions, we surmise that surveys need to meet three broad
criteria to provide an informed estimate of the MRP:
• they must be timely;
• there must be clarity around what question the respondents were asked to answer;
and
• the survey must gauge the market’s view of the MRP and not the view of a small,
unrepresentative sample.
Whilst open to interpretation, there appear to be very limited circumstances where a
survey would meet all three criteria and therefore would be eligible for inclusion in a
robust regulatory determination on the MRP.
291 McKenzie, M. and Partington, G. (2011), p.19.
DETERMINING A WACC ESTIMATE FOR PORT OF MELBOURNE Page 281 of 296
G WACC benchmarking
The purpose of this attachment is to set out an analysis of the factors relevant to a
comparison between PoM and the regulated entities in our sample. It goes on to fully
disclose a range of comparison metrics for benchmarking purposes some of which are
less relevant, but nevertheless supplement the analysis of WACC and cost of equity
margins in Chapter 13. The attachment concludes with additional information on the
Bloomberg-generated WACC estimates for listed comparators.
G.1 Relevance of regulatory comparisons
In its 2015 decision on WACC, the ERA summarised some aspects of its 2008 WACC
decision, where it explicitly recognised that Arc Infrastructure’s (formerly Brookfield
Rail) asset beta should sit below that of a business whose revenue source is driven by
domestic-based freight operations, such as a Class I Railroad (as opposed to longer term
contract-based export bulk mineral hauls) being offset by considerations of operating
leverage:292
In 2008 for the WestNet Rail (now Brookfield Rail) WACC determination, the
Authority took the view that the equity beta for the freight network is 1.0. This was
also based on the advice of ACG, who recommended a range of 1.0 to 1.15 based on
35 per cent gearing and an asset beta of 0.65 to 0.75. The sample of comparable firms
included rail infrastructure businesses in the United States and Canada and listed
transport infrastructure services firms in Australia and New Zealand.
ACG’s view was that an assumed asset beta in this range would overstate an asset
beta for the freight rail system in Western Australia. This was because the above
comparator companies were thought to have a higher proportion of revenues derived
from intermodal traffic, which is expected to have a higher beta than the freight rail
system in Western Australia. Accordingly, ACG recommended an asset beta of 0.6 at
a 35 per cent gearing level, giving an equity beta of 0.92.
The Authority also acknowledged submissions that the high operating leverage (ratio
of variable to fixed costs) of the freight-network business may, all other things being
equal, contribute to a relatively high sensitivity of profits to changes in levels of
demand and a higher beta value for the freight network business. However, the
Authority was of the view that the Western Australian freight network is likely to
have a lower beta than the comparators due to the predominance of bulk grain and
minerals freight which were found to have asset betas closer to 0.45. Based on this, its
292 ERA (2015a), p.147. Paragraph numbers and footnote references omitted.

DETERMINING A WACC ESTIMATE FOR PORT OF MELBOURNE Page 282 of 296
view was that there was limited justification to adopt a beta value outside of the range
derived from comparator businesses.
In other words, the ERA acknowledged that the high operating leverage of the freight-
network business offset a relatively lower risk profile on account of Brookfield Rail’s (as
it then was) reliance on export related freight activity. The ERA observed that around
85% of Brookfield Rail’s freight task related to the transport of either export commodities
or inputs to commodities, such as grain and alumina, with the remainder being
accounted for by general freight. The ERA’s 2018/2019 rail WACC review, which is
currently at the draft stage, does not provide such granular commentary on systematic
risk; rather, the current determination reiterates observations made at previous reviews.
Whilst we do not endorse the ERA’s approach, it is appropriate we adopt the reasoning
for current purposes given we are essentially reconciling our proposed WACC with the
outcomes of relevant regulatory processes.293
In this context, it is noted that PoM exhibits a much higher sensitivity to domestic
economic activity than Arc Infrastructure due to its reliance on imports (over 60% in
revenue terms) which are inherently correlated with domestic economic activity.
Moreover, PoM’s cost structure is such that costs vary insignificantly with throughput
across a broad range of demand and, in this respect, it varies from rail infrastructure
which has a higher level of variable cost due to throughput-driven maintenance and
scheduling activities.
Adopting the ERA’s logic, the nature of the trade mix and the absence of long term
contracts exposes PoM to volume risk to a greater extent than Arc, especially once regard
is had to PoM’s inability to adjust expenditure in response to volume fluctuations.
Pilbara Railways, being single-commodity focused, is sensitive to fluctuations in
commodity prices (specifically iron ore) and does have a concentrated customer base,
which amplifies volume risk. However, as detailed in our first principles analysis, PoM
is also subject to high levels of systematic volume risk arising from the correlation of
underlying demand with economic activity as well as arising from competitive pressures
from other ports (including the Port of Geelong, Port Botany and Port Adelaide), which
compete with PoM for import containers, agricultural exports, and various other
commodities and raw materials. This is compounded further by the prospects for a
second Melbourne port (see Section 8).
293 Contract cover may indeed provide revenue certainty and mitigate volatility in the short to medium term. However,
this has the consequence of masking underlying systematic risk, effectively crystallising this risk at discrete points in time.

DETERMINING A WACC ESTIMATE FOR PORT OF MELBOURNE Page 283 of 296
It is clear that both the Pilbara Railways and PoM face material systematic risk. However,
it cannot be said that Pilbara Railways sets an upper limit for PoM.
In the case of the IPART draft decision for the NSW Rail Access Undertaking, which has
not previously featured in our analysis, it is noteworthy that PoM’s WACC is less than
50 basis points higher than the IPART decision. This is despite some parts of the network
in the IPART decision having systematic risk exposure limited by long term contracts,
such as electricity generation-related activities and export activity (such as grain). All of
these factors are likely to contribute to significantly lower systematic exposure as it is
typically assessed by regulators.
G.2 Benchmarking outcomes
G.2.1 Pre-tax nominal WACC margins
Figure 20 displays the pre-tax nominal WACC margins from Chapter 13. As discussed
there, comparison with listed comparators on this metric is complicated by the low cost
of debt margins that Bloomberg adopts for these estimates. An adjustment for the cost
of debt is addressed in section G.2.6 below.
Figure 20 Regulatory and listed comparator pre-tax nominal WACC margins
Note: The ERA and IPART decisions are at the draft stage. The ERA released its draft rail WACC decisions in May 2019, but the risk-free
rate it has applied are as at 30 June 2018.
Data source: Synergies calculations, various regulatory decisions, Bloomberg
G.2.2 Post-tax nominal WACC margins

DETERMINING A WACC ESTIMATE FOR PORT OF MELBOURNE Page 284 of 296
Although the Pricing Order stipulates that the WACC for the BEE should be calculated
on a pre-tax nominal basis, a comparison of post-tax nominal WACC margins is
informative for distinguishing the impact of differing gamma assumptions. In contrast
to the pre-tax nominal WACC margins, PoM’s post-tax nominal WACC margin sits
within the regulatory range. This can be attributed to the difference in gamma values
that are adopted (0.25 in the case of PoM and IPART, and 0.50 in the case of the ERA
decisions).
Figure 21 Regulatory and listed comparator post-tax nominal WACC margins
Note: The ERA and IPART decisions are at the draft stage. The ERA released its draft rail WACC decisions in May 2019, but the risk-free
rate it has applied are as at 30 June 2018.
Data source: Synergies calculations, various regulatory decisions, Bloomberg
G.2.3 Cost of equity margins
Cost of equity margins can be presented using a number of specifications, each with their
own merits:
• Pre-tax or post-tax – the Pricing Order requires the WACC to be calculated on a pre-
tax nominal basis, but post-tax comparisons are also useful, particularly in relation
to international comparisons with entities given the most relevant workably
competitive market for a consideration of the appropriate WACC is an international
capital market. For Australian regulatory comparisons, pre-tax is relevant for
distinguishing the impact of differing gamma assumptions. For international listed
comparators, it is necessary to ensure that differences in corporate taxation rates
and imputation credit schemes across countries do not impact heavily upon the
results and a post-tax comparison is most appropriate.

DETERMINING A WACC ESTIMATE FOR PORT OF MELBOURNE Page 285 of 296
• Levered or unlevered - two firms with the same asset beta (i.e. underlying
systematic risk exposure) may have different equity betas due to differences in
leverage. This may be consequential when comparing the cost of equity. Unlevered
cost of equity comparisons (which assume zero gearing for all comparators) are
likely to be the most relevant for informing PoM’s benchmarking, but levered cost
of equity estimates may provide a useful starting point.
We consider each of these approaches in turn.
G.2.4 Pre-tax cost of equity margins
Levered
Figure 22 displays pre-tax cost of equity margins on a levered basis. This means that part
of the difference in cost of equity margins could still be attributable to differences in
gearing (i.e. financial risk) rather than differences in asset betas (i.e. systematic risk). In
any case, PoM cost of equity margin range is at the lower end of the range defined by
listed comparators, but remains above the range of regulatory comparators. This
comparison is affected because no allowance is made for differing gearing levels which
is addressed by comparing equity margins on an unlevered basis.
Figure 22 Regulatory and listed comparator pre-tax cost of equity margins (levered)

DETERMINING A WACC ESTIMATE FOR PORT OF MELBOURNE Page 286 of 296
Note: The ERA and IPART decisions are at the draft stage. The ERA released its draft rail WACC decisions in May 2019, but the risk-free
rate it has applied are as at 30 June 2018.
Data source: Synergies calculations, various regulatory decisions, Bloomberg
Unlevered
Table 23 presents the same cost of equity margins as in Figure 22, but instead calculated
on an unlevered basis. In other words, they have been calculated assuming zero gearing
(i.e. asset beta = equity beta) to eliminate the impact of gearing from the comparison.
The previous comparison is confounded by the impact of gearing, because two entities
with the same asset betas could have different equity betas (and in turn, have a different
cost of equity) depending on their gearing assumptions. Again, PoM is well below the
listed comparators, and it is now closer to the upper end of the range of regulated post-
tax cost of equity margin (being Pilbara Railways) now that the difference in gearing
(30% for PoM versus 20% for Pilbara Railways) has been accounted for.
Figure 23 Regulatory and listed comparator pre-tax cost of equity margins (unlevered)
Note: The ERA and IPART decisions are at the draft stage. The ERA released its draft rail WACC decisions in May 2019, but the risk-free
rate it has applied are as at 30 June 2018.
Data source: Synergies calculations, various regulatory decisions, Bloomberg
G.2.5 Post-tax cost of equity margins
Levered
As shown in Figure 24, PoM’s post-tax cost of equity margin is well-below listed
comparators on a levered basis, and it is virtually identical to the upper end of the range
of regulated post-tax cost of equity margin (being Pilbara Railways). Noting the impact

DETERMINING A WACC ESTIMATE FOR PORT OF MELBOURNE Page 287 of 296
of gearing expressed above, this suggests that the cost of equity for PoM and Pilbara
Railways are more comparable once we account for differences in gamma, which are not
firm-specific.
Figure 24 Regulatory and listed comparator post-tax cost of equity margins (levered)
Note: The ERA and IPART decisions are at the draft stage. The ERA released its draft rail WACC decisions in May 2019, but the risk-free
rate it has applied are as at 30 June 2018.
Data source: Synergies calculations, various regulatory decisions, Bloomberg
Unlevered
On an unlevered basis, PoM’s post-tax cost of equity margin is below that of the upper
end of the range of regulated post-tax cost of equity margin (being Pilbara Railways), as
shown in Figure 25. In effect, the post-tax cost of equity margin comparison removes the
impact of differences in gearing as well as gamma.

DETERMINING A WACC ESTIMATE FOR PORT OF MELBOURNE Page 288 of 296
Figure 25 Regulatory and listed comparator post-tax cost of equity margins (unlevered)
Note: The ERA and IPART decisions are at the draft stage. The ERA released its draft rail WACC decisions in May 2019, but the risk-free
rate it has applied are as at 30 June 2018.
Data source: Synergies calculations, various regulatory decisions, Bloomberg
G.2.6 Comparison of DRPs
The significantly lower WACC margins for listed Marine Ports and Services entities is
due to anomalies in Bloomberg’s cost of debt estimation. Figure 26 shows the debt risk
premia (DRPs), measured as the cost of debt less the risk-free rate, for regulated and
listed comparators.
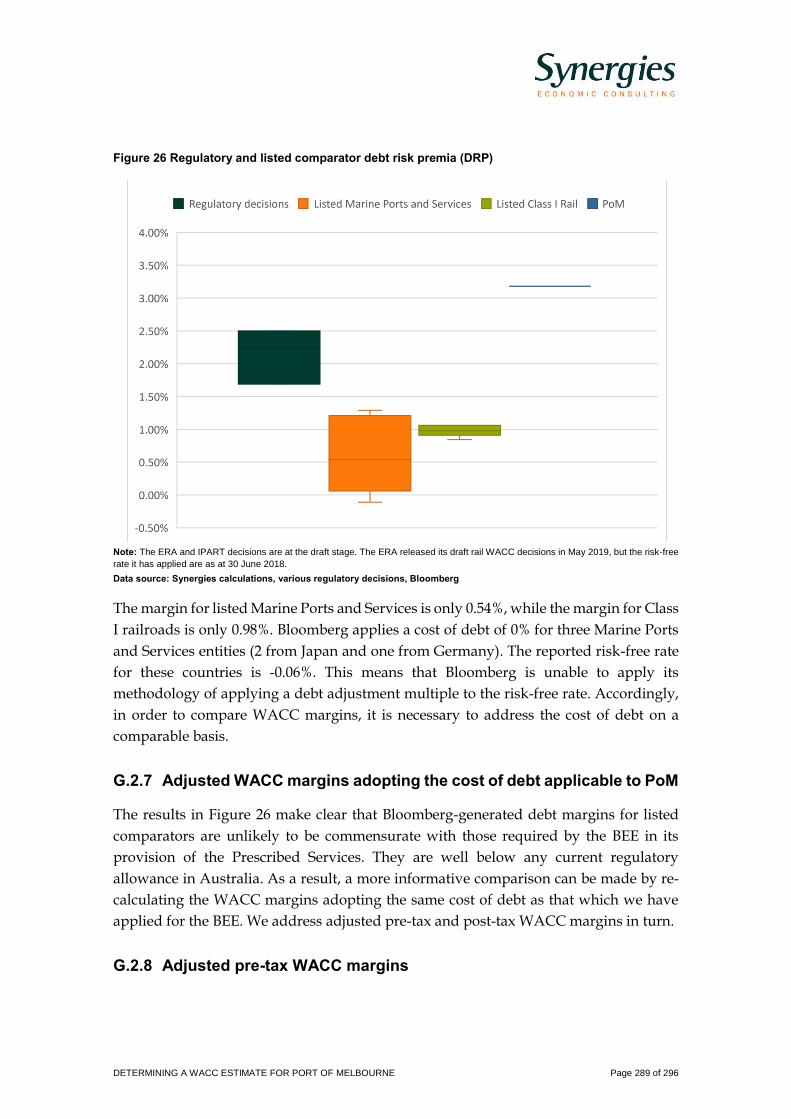
DETERMINING A WACC ESTIMATE FOR PORT OF MELBOURNE Page 289 of 296
Figure 26 Regulatory and listed comparator debt risk premia (DRP)
Note: The ERA and IPART decisions are at the draft stage. The ERA released its draft rail WACC decisions in May 2019, but the risk-free
rate it has applied are as at 30 June 2018.
Data source: Synergies calculations, various regulatory decisions, Bloomberg
The margin for listed Marine Ports and Services is only 0.54%, while the margin for Class
I railroads is only 0.98%. Bloomberg applies a cost of debt of 0% for three Marine Ports
and Services entities (2 from Japan and one from Germany). The reported risk-free rate
for these countries is -0.06%. This means that Bloomberg is unable to apply its
methodology of applying a debt adjustment multiple to the risk-free rate. Accordingly,
in order to compare WACC margins, it is necessary to address the cost of debt on a
comparable basis.
G.2.7 Adjusted WACC margins adopting the cost of debt applicable to PoM
The results in Figure 26 make clear that Bloomberg-generated debt margins for listed
comparators are unlikely to be commensurate with those required by the BEE in its
provision of the Prescribed Services. They are well below any current regulatory
allowance in Australia. As a result, a more informative comparison can be made by re-
calculating the WACC margins adopting the same cost of debt as that which we have
applied for the BEE. We address adjusted pre-tax and post-tax WACC margins in turn.
G.2.8 Adjusted pre-tax WACC margins

DETERMINING A WACC ESTIMATE FOR PORT OF MELBOURNE Page 290 of 296
Figure 27 Pre-tax WACC margins adjusted for the BEE’s trailing average cost of debt
Note: The ERA and IPART decisions are at the draft stage. The ERA released its draft rail WACC decisions in May 2019, but the risk-free
rate it has applied are as at 30 June 2018.
Data source: Synergies calculations, various regulatory decisions, Bloomberg
A comparison of pre-tax nominal WACC margins after adjusting for the cost of debt is
likely to be the most suitable basis on which to benchmark the required return for the
BEE. The median WACC margin for Class I railroads is now more than 100 basis points
above PoM, and PoM’s range sits within the WACC margin range for listed Marine Ports
and Services entities.
G.2.9 Adjusted post-tax WACC margins
It is also informative to examine post-tax WACC margins after adjusting for the use of a
trailing average for the cost of debt. Interestingly, the WACC margin ranges across
sectors are more similar on a post-tax basis.

DETERMINING A WACC ESTIMATE FOR PORT OF MELBOURNE Page 291 of 296
Figure 28 Post-tax WACC margins adjusted for the BEE’s trailing average cost of debt
Note: The ERA and IPART decisions are at the draft stage. The ERA released its draft rail WACC decisions in May 2019, but the risk-free
rate it has applied are as at 30 June 2018.
Data source: Synergies calculations, various regulatory decisions, Bloomberg
G.3 Supplementary information on listed comparator methodology
The purpose of this section is to provide further detail on the methodology for the
Bloomberg-generated listed comparator WACC estimates that we presented in Chapter
13.
G.3.1 Country risk premium
Bloomberg calculates country-specific market risk premium estimates. Bloomberg
estimates do not provide full transparency, but the country risk premium is calculated
as the return on the domestic market less the risk-free rate. The return on equity is
therefore calculated as the risk-free rate plus the country risk premium multiplied by the
equity beta.
G.3.2 Return on debt
Bloomberg calculates the return on debt for each company by multiplying the risk-free
rate by a debt adjustment factor. The debt adjustment factor is proprietary, but it is
described by Bloomberg as a debt premium specific to the credit-rating of the company.
Because the risk-free rate in Japan and European countries remains low, it appears that
this approach may underestimate the true return on debt for these companies. This

DETERMINING A WACC ESTIMATE FOR PORT OF MELBOURNE Page 292 of 296
makes the WACC estimates, especially for the port and airport samples, more
conservative in nature.
G.3.3 Bloomberg-generated WACC estimates
Pre-tax WACC estimates for North American Class I railroads and OECD ports and
airports have been calculated using country specific corporate tax rates. We have used
our estimated Fama-French betas for each company, as well as our zero-beta premium
estimate for the Black CAPM, to generate multi-model WACC estimates for each of the
comparators, so that the estimates are directly comparable to our WACC estimate for
PoM. PoM’s WACC margin is 8.50%, which is situated between the Class I railroad and
Ports WACC margins. Note that the WACC margins presented here are before applying
the trailing average cost of debt methodology used for the BEE.
Table 61 North American Class I railroad WACC estimates
Bloomberg country risk premium
Bloomberg return on debt
Pre-tax nominal WACC
Risk-free rate
WACC margin
CSX Corporation 7.00% 3.40% 11.78% 2.42% 9.36%
Kansas City Southern
7.00% 3.33% 10.45% 2.42% 8.03%
Genesee & Wyoming
7.00% 3.48% 10.46% 2.42% 8.04%
Norfolk Southern Corporation
7.00% 3.37% 11.85% 2.42% 9.43%
Union Pacific Corporation
7.00% 3.26% 11.45% 2.42% 9.03%
Canadian Pacific Railway
7.53% 3.33% 12.01% 1.73% 10.28%
Canadian National Railway Company
7.53% 2.78% 11.26% 1.73% 9.53%
Average 7.15% 3.28% 11.32% 2.22% 9.10%
Median 7.00% 3.33% 11.45% 2.42% 9.36%
Source: Bloomberg, Synergies calculations
Table 62 Marine Ports and Services WACC estimates
Bloomberg country risk premium
Bloomberg return on debt
Pre-tax nominal WACC
Risk-free rate
WACC margin
Qube Holdings 6.48% 2.36% 8.48% 1.72% 6.76%
Port of Tauranga 7.10% 2.48% 9.22% 1.80% 7.42%
Hamburger Hafen und Logistik
11.06% 0.00% 11.15% -0.06% 11.21%
Sakurajima Futo Kaisha
8.84% 4.56% 9.09% 3.27% 5.82%

DETERMINING A WACC ESTIMATE FOR PORT OF MELBOURNE Page 293 of 296
Bloomberg country risk premium
Bloomberg return on debt
Pre-tax nominal WACC
Risk-free rate
WACC margin
Rinko Corporation
8.84% 4.48% 8.25% 3.27% 4.98%
Dongbang Transport Logistics
8.84% 3.67% 7.75% 3.27% 4.48%
China Merchants Port Holding Company
10.16% 2.17% 5.26% 1.63% 3.63%
COSCO Shipping Ports
7.51% 8.15% 14.72% 8.26% 6.46%
Dalian Port 9.43% 0.00% 10.23% -0.06% 10.29%
Hutchinson Port Holdings Trust
9.43% 0.00% 4.26% -0.06% 4.32%
Global Ports Investments
9.63% 3.11% 6.05% 1.86% 4.19%
Average 8.85% 2.82% 8.59% 2.26% 6.32%
Median 8.84% 2.48% 8.48% 1.80% 5.82%
Source: Bloomberg, Synergies calculations
DETERMINING A WACC ESTIMATE FOR PORT OF MELBOURNE Page 294 of 296
H Background on risk-free rate
The risk-free rate is used in estimating the return on equity and debt. There are three
main decisions to be made:
• the proxy used
• the term to maturity
• the averaging period.
H.1 Proxy
The Commonwealth Government bond yield is most commonly used as a proxy for the
risk-free rate in Australia, including by the ESC.
Concerns have been expressed as to whether it remains the best proxy during highly
volatile or uncertain market conditions, where a ‘flight to quality’ is often observed
reflecting increased demand for Commonwealth Government bonds as a safe haven for
investors, resulting in a compression of the yield.
However, we consider the Commonwealth Government bond yield remains the best
proxy for the risk-free rate in an Australian context. In our view, the downward
compression of WACC values that have emerged due to its application in recent years
relate more to the rigidity of Australian regulators estimation of the market risk
premium than to the risk-free rate itself.
H.2 Term to maturity
In an Australian context, the term to maturity most commonly applied for investors in
infrastructure with long economic lives is ten years. This is consistent with the long-term
forward-looking horizon over which it is assumed investors are forming their return
expectations under the SL CAPM.
In Australia, the ten-year bond is the longest liquid maturity currently available. This is
also the most commonly used proxy for the risk-free rate in regulatory decisions.
Two Australian regulators, the Queensland Competition Authority (QCA) and WA’s
Economic Regulation Authority (ERA)294, match the term to maturity with the length of
the regulatory period (which we consider is a flawed approach). However, it is
important to note that in the case of the UT5 final decision for Aurizon Network, the
294 Except for its determinations for rail access because the use of a 10-year CGS is seen to reflect the requirements of the
WA Rail Access Code.

DETERMINING A WACC ESTIMATE FOR PORT OF MELBOURNE Page 295 of 296
QCA had regard to the use of a 10-year bond term when applying an uplift to its bottom-
up WACC estimate.
We believe the term to maturity should not be set to match the length of the regulatory
period. This is because the relevant perspective is not the regulatory period but rather
the views of the providers of capital (equity holders and lenders), who will be assessing
an investment of this type of infrastructure over a long-term horizon. For PoM, the
remainder of the 50-year lease term effectively defines the long-term investment horizon.
We have therefore assumed a ten-year term to maturity, balancing the liquidity of
available long-term bond instruments in the Australian market, and the long term nature
of the PoM investment.
H.3 Averaging period
The length of averaging period for the risk-free rate will depend amongst other things
on whether a contemporary rate reflecting current market expectations is preferred to a
longer-term average rate that will also incorporate the effects of historical market
expectations.
In general, Australian and International corporate finance, academic and regulatory
practice uses short averaging periods close to the commencement of each regulatory
period.
This is intended to mitigate problems that may occur if there is a spike in yields on-the-
day that the rate is applied. It is therefore common practice to average the rate over a
short horizon, which typically ranges from between ten and forty days, noting that over
such a short horizon the choice of averaging period is likely to be of little consequence.
The Independent Pricing and Regulatory Tribunal (IPART) in NSW is the only
Australian regulator that takes into consideration longer term averages, which it does in
conjunction with short term estimates.
We have not provided a detailed outline of the approach to the risk-free rate by overseas
regulators, as the calculation is generally uncontentious. The typical approach taken is
similar to Australia, in that regulators take a short-term average on government bonds
for the given country. We note that in the UK, regulators such as Ofgem and the
Competition Markets Authority may also have regard to longer-term averages of
government bond yields. This has been in response to recent market conditions, during
which the risk-free rate has been deemed to be below its long-run average.
H.4 Risk-free rate estimate

DETERMINING A WACC ESTIMATE FOR PORT OF MELBOURNE Page 296 of 296
Our estimate is based on 10-year Commonwealth Government bond yields and has been
produced over a 20-day averaging period to 28 February 2019. As the quoted rates are
semi-annual, we have converted them to annual effective rates.295 The resulting estimate
is 2.14%.
295 Annual effective rate = (1+ semi-annual rate/2)^2 -1