detlef borghardt, ceo - saf-holland · detlef borghardt, ceo. 2 ... based on top 7 european truck...
TRANSCRIPT

Design
the future
December 09, 2015
Capital Markets Day 2015
“Strategy 2020: Megatrends and Organizational
Structure”
Detlef Borghardt, CEO

2
SAF-HOLLAND in brief 3
Megatrends – Which global trends will be driving our future? 9
Strategy 2020 – How we will benefit 15
Strategy 2020 – Where do we stand? Organizational structure and reporting 21
1
2
3
4
Agenda

3
SAF-HOLLAND: Europe’s largest listed commercial vehicle supplier
• One of the leading global producers and
suppliers of key systems and components for
the trailer, truck, bus, and recreational vehicle
industries
• 29 subsidiaries including 18 manufacturing
facilities on six continents
• ~3,400 employees
• Approx. 9,000 Aftermarket spare parts and
service stations around the world
Axle systems
Landing gear
Kingpins
Fifth wheels
Suspensions
General information Components and systems
1) Please refer to page 37 for detailed information on EBIT adjustments.

4
2014
SAF-HOLLAND
Market Position
Market shares
Europe North America
Europe North America SAF-HOLLAND Σ Top 3 SAF-HOLLAND Σ Top 3
Axles # 1 # 3 39% 89% 8% 90%
Suspensions # 1 # 2 36% 90% 15% 84%
Kingpins # 2 # 1 12% 89%1) 69% 87%1)
Landing gears # 3 # 1 6% 89% 39% 78%1)
Fifth wheel # 2 # 1 23%2) 96% 51% 100%
Truck suspensions n/a # 2 0% 90%3) 6%4) 38%
Service points # 1 # 1 Approx. 9,000 Aftermarket spare parts and service stations
Strong market position in oligopolistic marketsT
rail
er
Syste
ms
Po
were
d V
eh
icle
Syste
ms
Aft
er-
mark
et
Source: L.E.K. Consulting, April 2015
1) Top 2 players 2) Based on top 7 European truck OEMs (Mercedes Benz, VOLVO, MAN, DAF, SCANIA, Renault, IVECO) 3) Predominantly captive market 4) Commercial market share excluding sales to U.S. Defence Dept.
Among the TOP 2 players in almost every product area; Significant growth potential in the North
American market in trailer axles and suspensions as well as truck suspensions to be exploited

5
An international player: 90% of sales originate from Europe and the US
Core sales regions
Production sites
CanadaWoodstock
Norwich
USAHolland
Muskegon
Warrenton South
Warrenton North
Wylie
Dumas
BrazilJaguariuna
IndiaSriperambadur Taluk
AustraliaMelton
ChinaXiamen
Bautou
GermanyBessenbach/Keilberg
Bessenbach/Frauengrund
Singen
South AfricaJohannesburg
United Arab EmiratesDubai

6
Going Global: Truck & Trailer

7
Going Global: Truck & Trailer

8
Going Global: Truck & Trailer

9
Going Global: Truck & Trailer

10
SAF-HOLLAND in brief 3
Megatrends – Which global trends will be driving our future? 9
Strategy 2020 – How we will benefit 15
Strategy 2020 – Where do we stand? Organizational structure and reporting 21
1
2
3
4
Agenda

11
Proposition 1
Understanding and drawing on the global megatrends is the key to maximizing
SAF-HOLLAND’s growth potential
Propositions for SAF-HOLLAND
Mega-Trends significantly affect the truck&trailer markets
Proposition 2
We found the right key drivers (mega-trends) for our business
Proposition 3
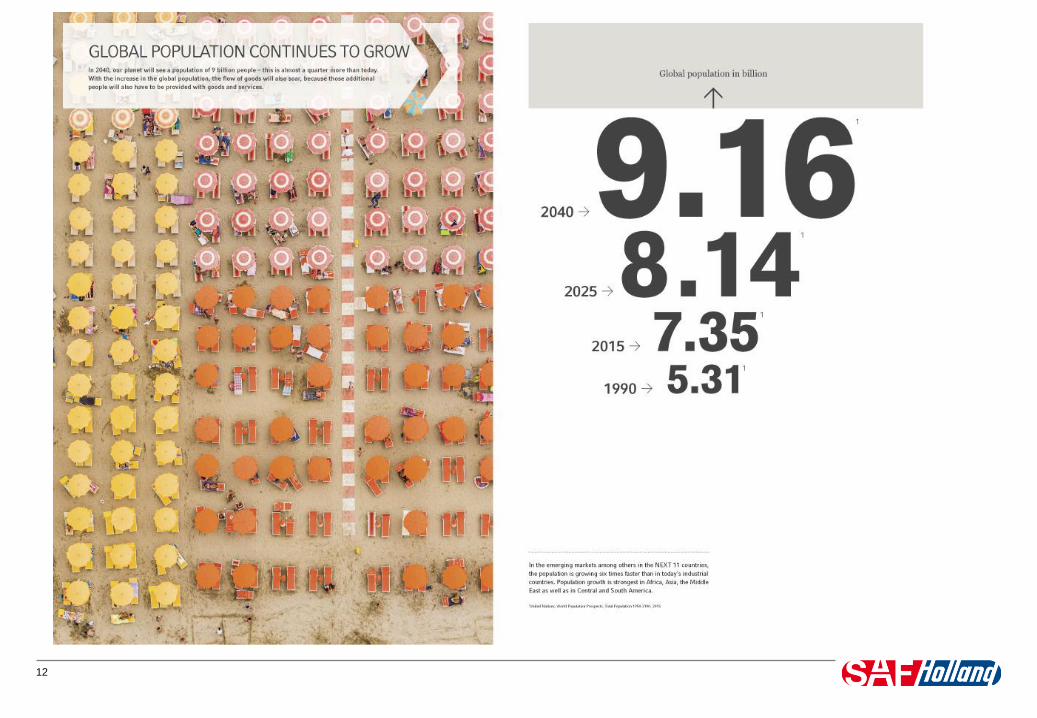
In 2030, there will be significantly more:
PEOPLE, MONEY, and ROADS
12

13

14

15

16

17
17
Population and active consumers per region
People
Source: United Nations, Department of Economic and Social Affairs, Population Division. World Population
Despite current slowdowns in the emerging markets, the mid-term trends will prevail
The number of active consumers will e.g. in NEXT-11 and MINT will outgrow the EU/US by far
“We found the right key drivers (mega-trends) for our business.“

18
Money
• Beside the number of people, the MONEY spend for goods which are transported in trucks on
roads is obviously important
• How does the income per capita develop on a global scale?
Source: Gapminder – a fact-based worldview, www.gapminder.org
• The most important consumer group is the so-called “middle class”
• Middle Class is defined as all those living in households with daily per capita incomes of between USD
10 and USD 100 in purchasing power parity (PPP) terms
“We found the right key drivers (mega-trends) for our business.“

19
The right drivers for SAF-HOLLAND’s business
PeopleMoney
Trucks/
Trailers
Goods
Roads
The demand for SAF-HOLLAND products, is and will be driven by people, who have the money
to buy goods that are transported in trucks on roads.

20
SAF-HOLLAND in brief 3
Megatrends – Which global trends will be driving our future? 9
Strategy 2020 – How we will benefit 15
Strategy 2020 – Where do we stand? Organizational structure and reporting 21
1
2
3
4
Agenda

21
SAF-HOLLAND extrapolated regional sales split
Source: CIA World Factbook
RegionActual 2014 MTP 2020 Trend 2030
Core markets
(Europe & North
America)
~90% ~70% ~50%
Emerging
Markets/ RoW~10% ~30% ~50%
ΣΣ 100% 100% 100%
SAF-HOLLAND will exploit the opportunities of the global megatrends by organic growth in
addition to complementary external growth by joint ventures, acquisitions or cooperations;
By 2020 approx. 30% of sales are supposed to originate from today’s RoW area

22
Megatrends provide sustainable mid- and long-term growth perspectives and
business opportunities: 64 individual business plans to drive growth
SAF-HOLLAND will focus on its core competencies: “We will stick with where we
are really good at”
Expand our product portfolio and applications into new markets beyond the
current core regions Europe and North America
Take advantage of leading technological position and outstanding global brand
reputation when it comes to regional cooperations and applications
In the price-sensitive emerging markets the developing premium and techno-
logical mid-market segments will be addressed
Product innovation: Ramp-up of new products, e.g. INTRA-S/R
Above all: Strengthen the Aftermarket focusing on Europe and North America
and simultaneously developing new regions: Share in total Group sales at least
25%
Highlights
1
2
3
7
6
5
4

23
Strategy 2020: Mid-term sales targets
960
≥ 1,035
1,250
0
300
600
900
1200
1500
2014 Actual 2015e 2020 MT
Organic growth is expected to produce €1,250 mn in sales by 2020.
On top, joint ventures, acquisitions and cooperations with local partners will contribute e.g. in the NEXT-11
and MINT countries enabling a faster market entry or expansion of the existing market position
Sales in €mn
1,500

24
SAF-HOLLAND in brief 3
Megatrends – Which global trends will be driving our future? 9
Strategy 2020 – How we will benefit 15
Strategy 2020 – Where do we stand? Organizational structure and reporting 21
1
2
3
4
Agenda

25
Current structure: Business units
Aftermarket
Business Unit
Powered Vehicle Systems
Business Unit
Trailer Systems
Business Unit
• Axle systems
• Landing gears
• Kingpins and coupling products
• Suspensions
Sales FY 2014:
€544.4mn (56.7% of group sales)
• Fifth wheels
• Suspensions (Truck, Bus & RV)
• Tag axles
Sales FY 2014:
€169.5mn (17.7% of group sales)
• Global aftermarket and
service network
Sales FY 2014:
€245.8mn (25.6% of group sales)

26
New structure implementing Strategy 2020: by Region/ Business Area
APAC/ChinaAmericasEMEA/India
Sales FY 2014:
€ 530mn (55.2% of group sales)
Sales FY 2014:
€ 380mn (39.6% of group sales)
Sales FY 2014:
€ 50mn (5.2% of group sales)
• All product groups • All product groups • All product groups

27
Current organizational structure
Detlef Borghardt,
CEO
Wilfried Trepels,
CFO
Mike Kamsickas,
President Powered
Vehicle Systems
Business Unit
Steffen Schewerda,
President Trailer
Systems
Business Unit
Alexander Geis,
President Aftermarket
Business Unit

28
New organizational structure step 1
Detlef Borghardt,
CEO
Detlef Borghardt (temp. double responsibilty)
President APAC/China
Steffen Schewerda
President AmericasAlexander Geis
President EMEA/India
Wilfried Trepels,
CFO
Mike Kamsickas
COO

29
New organizational structure step 2
Detlef Borghardt,
CEO
Steffen Schewerda
President Americas
Alexander Geis
President Europe
Wilfried Trepels,
CFO
Mike Kamsickas
COO
Tbd
President APAC
Tbd
Tbd
President Mid-
East/Africa/India
Tbd
Tbd
President China
Tbd

Design
the future
December 09, 2015
Capital Markets Day 2015
Mike Kamsickas, President Powered Vehicle Systems
Business Unit
31
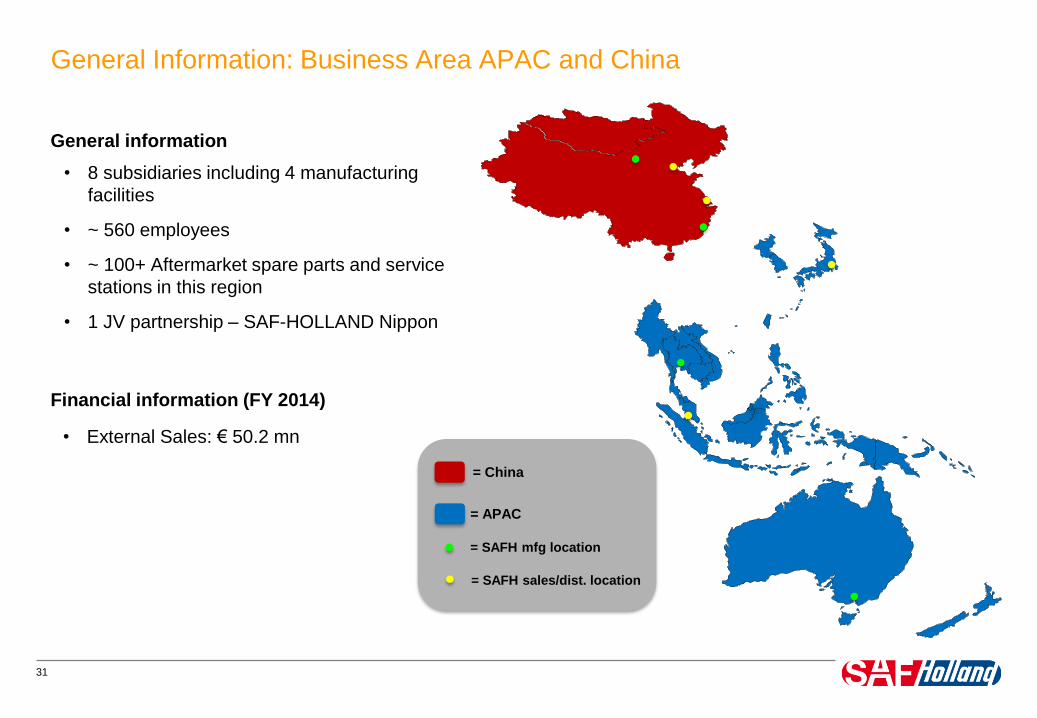
General Information: Business Area APAC and China
• 8 subsidiaries including 4 manufacturing
facilities
• ~ 560 employees
• ~ 100+ Aftermarket spare parts and service
stations in this region
• 1 JV partnership – SAF-HOLLAND Nippon
• External Sales: € 50.2 mn
General information
Financial information (FY 2014)
= China
= APAC
= SAFH mfg location
= SAFH sales/dist. location
32
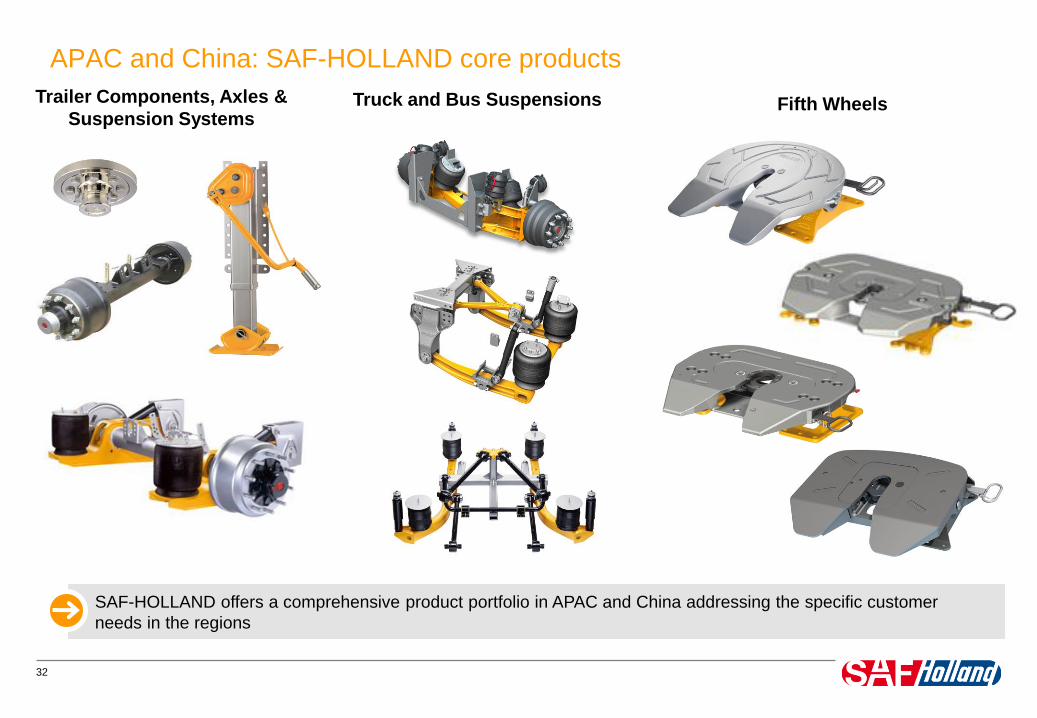
Trailer Components, Axles &
Suspension Systems
SAF-HOLLAND offers a comprehensive product portfolio in APAC and China addressing the specific customer
needs in the regions
Fifth Wheels
APAC and China: SAF-HOLLAND core products
Truck and Bus Suspensions

33
APAC and China: Key OE (customers) producing trucks and trailers
SAF-HOLLAND offers its innovative products to major OE´s in the truck and trailer industry active in APAC and China

34
Focus on major fleets and industry (infrastructure, logistics, specialty, heavy duty, port, etc.)
APAC and China: End customer base of transport companies using trucks & trailers

35
858,60 862,50 881,50
11.612.0
14.1
0
5
10
15
20
-
200,0
400,0
600,0
800,0
1000,0
2014 2015e 2020e
Population in mn Real GDP per capita in K USD
Macroeconomic drivers/ mega trend in the APAC & China region
Population and Real GDP per capita for APAC*
Source: ERS International Macroeconomic Data Set 2014, United Nations, Department of Economic and Social Affairs, Population Division (2015),
World Population Prospects: The 2015 Revision.
ASEAN countries: Indonesia, Malaysia, Thailand, Laos, Cambodia, Vietnam, Myanmar, Brunei, Philippines, and Singapore
1,402 1,405 1,421
7.37.9
10.9
0
5
10
15
20
-
500,0
1000,0
1500,0
2014 2015e 2020e
Population in mn Real GDP per capita in K USD
Population and Real GDP per capita for China
Population growth projections are moderate; however, strong GDP growth will strengthen the economies of
APAC, including China. Specifically, the countries of the ASEAN community are poised for significant
economic growth
* excludes China
1,500
1,000
0
1,000
0
36
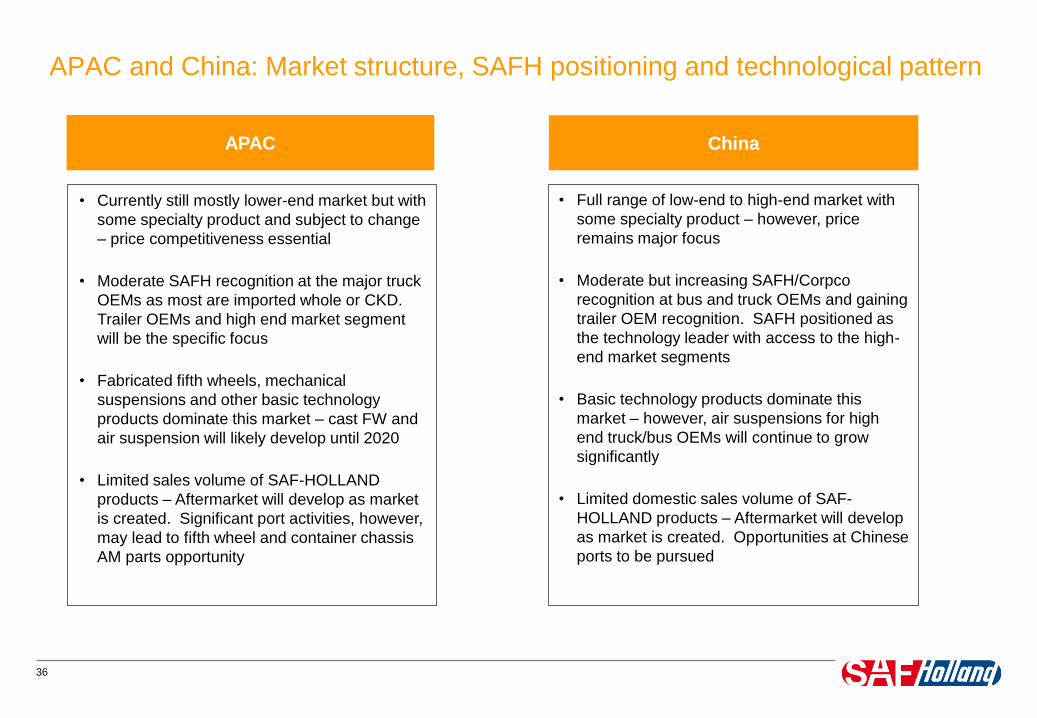
APAC and China: Market structure, SAFH positioning and technological pattern
ChinaAPAC
• Currently still mostly lower-end market but with
some specialty product and subject to change
– price competitiveness essential
• Moderate SAFH recognition at the major truck
OEMs as most are imported whole or CKD.
Trailer OEMs and high end market segment
will be the specific focus
• Fabricated fifth wheels, mechanical
suspensions and other basic technology
products dominate this market – cast FW and
air suspension will likely develop until 2020
• Limited sales volume of SAF-HOLLAND
products – Aftermarket will develop as market
is created. Significant port activities, however,
may lead to fifth wheel and container chassis
AM parts opportunity
• Full range of low-end to high-end market with
some specialty product – however, price
remains major focus
• Moderate but increasing SAFH/Corpco
recognition at bus and truck OEMs and gaining
trailer OEM recognition. SAFH positioned as
the technology leader with access to the high-
end market segments
• Basic technology products dominate this
market – however, air suspensions for high
end truck/bus OEMs will continue to grow
significantly
• Limited domestic sales volume of SAF-
HOLLAND products – Aftermarket will develop
as market is created. Opportunities at Chinese
ports to be pursued

37
APAC: Opportunities and measures
ChinaAPAC
• Content on imported OEM truck and bus
market and development of OEM trailer
and large fleet/industry markets
• Trailer axles, fifth wheels, and truck/bus
suspensions will be the main growth
drivers over the next years
• High end axles, fifth wheel, and truck and
bus suspensions with superior life cycle
characteristics will be a key success factor
• The Aftermarket will grow after the
development of OEMs and with market
growth
• Continued development of bus and truck
market (Corpco), as well as competitive
products for medium segment (axles, FW,
LG, etc.)
• Demonstrated preference for SAFH
product in many high end segments – with
continued work on lower end product
offering
• Truck, bus and trailer suspensions, as well
as competitive FW, axles, and LG provide
significant growth opportunity
• Aftermarket will develop with market share
• Additional M&A activities will increase
sales growth and SAFH development in
the region

38
APAC and China: Strategies for growing the business
China Truck/bus suspensions and FWs for
high end OEMs, mechanical and air
trailer suspensions and axles for all
segments
APAC Maintain the HD market; grow trailer
axles and mechanical suspensions;
increase OEM truck product “pull”
activities (fifth wheels, suspensions)
Significant growth potential in trailer axle, air and mechanical suspensions, and fifth wheels in all market segments

39
50
120
0
200
FY2014 Target 2020
Sales in €mn Summary
• China economy slowing, but still very strong and significant
opportunity for SAFH product
• APAC markets will see significant growth in economies,
export, and infrastructure with growing opportunities for
SAFH product
• Investment will be necessary in personnel as market is
extremely diverse; development of local technical
competence and manufacturing will be necessary
• Technological know-how and brand reputation a key asset
and competitive edge for mid-market and premium market
segments
• Additional product requirements (features, options, etc.)
will be identified and targeted according to group strategy
2020 figures for both APAC and China
Ambitious growth is possible as APAC becomes one of the fastest developing market segments in the world;
China will sustain its high level of growth
APAC and China: Business performance and sales targets 2020

40
Highlights APAC and China
China: Recent award of JMC/Ford truck suspension important reference contract to SAF-
HOLLAND Corpco 1
2China: Shift from export driven economy to a more consumption driven economy requires
continuous development of local manufacturing and domestic customer relationships
3China: Upscaling to high end products for both domestic consumption and export (to compete with
global OEMs)
4 APAC: Road freight in the region is expected to grow at 8.3% annually through 2019
5APAC: There will be additional manufacturing shift from China to lower cost APAC countries and
our presence and product offering will be required
6 Thailand: Award of ISUZU fifth wheel business expected in early 2016

Design
the future
December 09, 2015
Capital Markets Day 2015
Alexander Geis, President Aftermarket Business Unit
42
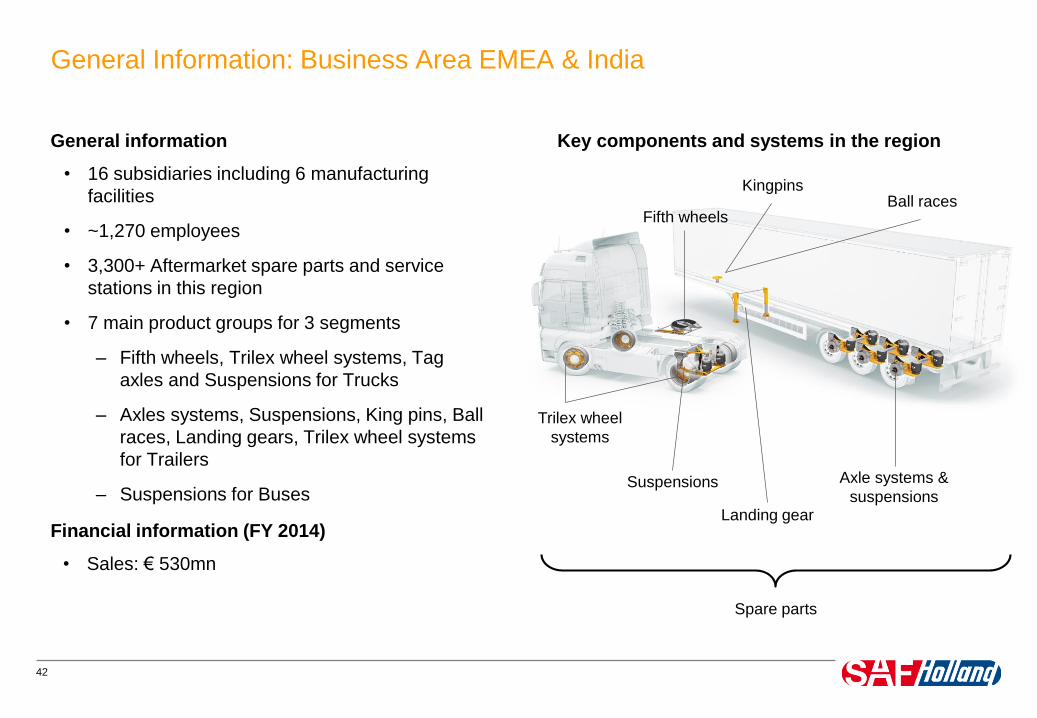
General Information: Business Area EMEA & India
• 16 subsidiaries including 6 manufacturing
facilities
• ~1,270 employees
• 3,300+ Aftermarket spare parts and service
stations in this region
• 7 main product groups for 3 segments
– Fifth wheels, Trilex wheel systems, Tag
axles and Suspensions for Trucks
– Axles systems, Suspensions, King pins, Ball
races, Landing gears, Trilex wheel systems
for Trailers
– Suspensions for Buses
General information
Axle systems &
suspensionsLanding gear
Kingpins
Fifth wheels
Suspensions
Key components and systems in the region
Spare parts
Trilex wheel
systems
Ball races
• Sales: € 530mn
Financial information (FY 2014)
43
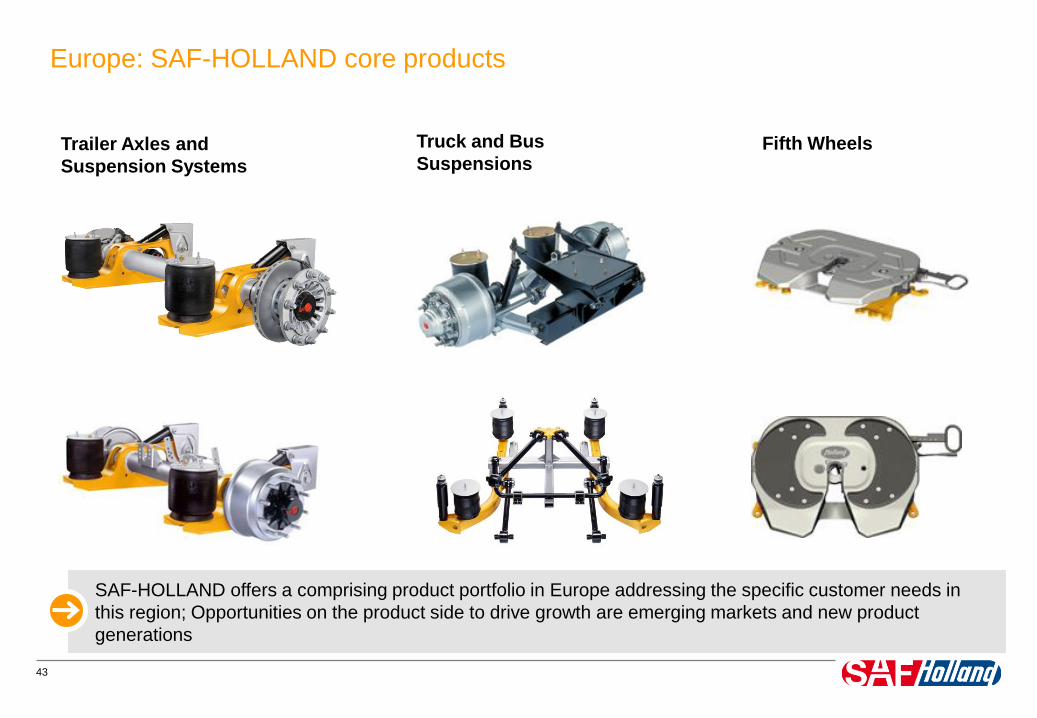
Trailer Axles and
Suspension Systems
SAF-HOLLAND offers a comprising product portfolio in Europe addressing the specific customer needs in
this region; Opportunities on the product side to drive growth are emerging markets and new product
generations
Truck and Bus
SuspensionsFifth Wheels
Europe: SAF-HOLLAND core products

44
Trailer Axles and
Suspension Systems
SAF-HOLLAND offers a comprising product portfolio in MEA addressing the specific customer needs in this
region; Opportunities on the product side to drive growth are emerging markets and new product
generations
Truck and Bus
SuspensionsFifth Wheels
Middle East & India: SAF-HOLLAND core products
Trilex Wheel Systems
Trailer Brake and
EBS Systems
Trailer Lighting
Systems

45
EMEA & India: Key OE (customers) producing trucks and trailers
SAF-HOLLAND offers its innovative products to major OE´s in the truck and trailer industry in EMEA
Focus on fleets: SAF-HOLLAND end customer base includes a manifold of major forwarding agents and
fleets in EMEA
EMEA: End customer base of transport companies using trucks & trailers
46
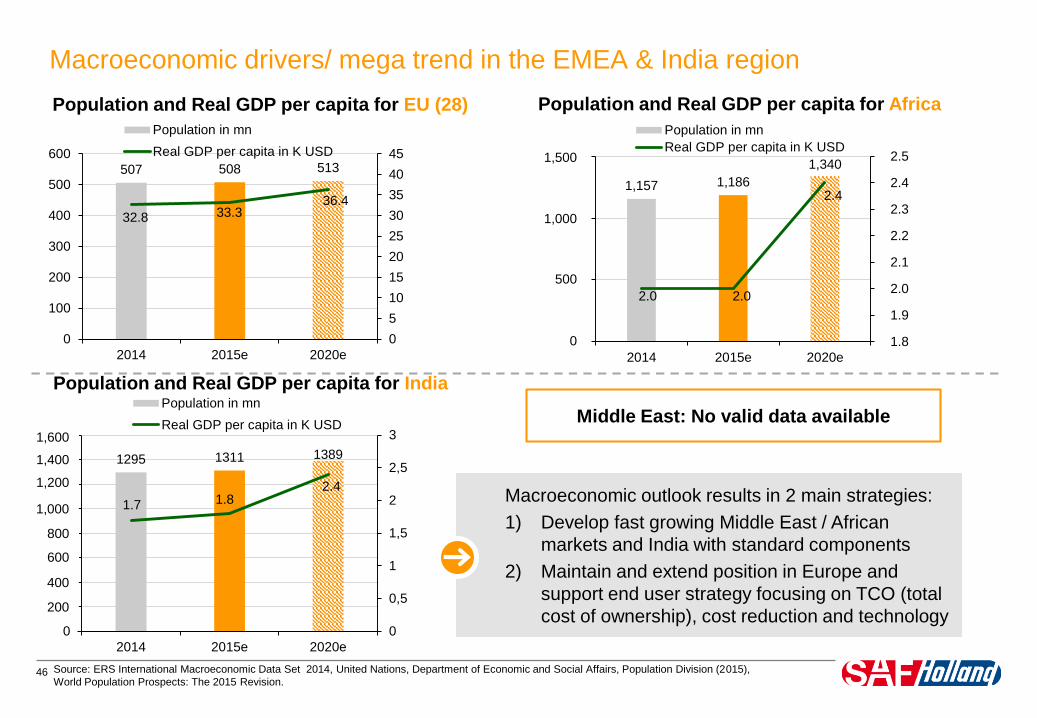
507 508 513
32.8 33.336.4
0
5
10
15
20
25
30
35
40
45
0
100
200
300
400
500
600
2014 2015e 2020e
Population in mn
Real GDP per capita in K USD
Macroeconomic drivers/ mega trend in the EMEA & India region
Population and Real GDP per capita for EU (28)
Source: ERS International Macroeconomic Data Set 2014, United Nations, Department of Economic and Social Affairs, Population Division (2015),
World Population Prospects: The 2015 Revision.
1,157 1,186
1,340
2.0 2.0
2.4
1,8
1,9
2
2,1
2,2
2,3
2,4
2,5
00
500
1.000
1.500
2014 2015e 2020e
Population in mn
Real GDP per capita in K USD
Population and Real GDP per capita for Africa
Macroeconomic outlook results in 2 main strategies:
1) Develop fast growing Middle East / African
markets and India with standard components
2) Maintain and extend position in Europe and
support end user strategy focusing on TCO (total
cost of ownership), cost reduction and technology
1295 1311 1389
1.7 1.82.4
0
0,5
1
1,5
2
2,5
3
0
200
400
600
800
1000
1200
1400
1600
2014 2015e 2020e
Population in mn
Real GDP per capita in K USD
Population and Real GDP per capita for India
Middle East: No valid data available
2.5
2.4
2.3
2.2
2.1
2.0
1.9
1.80
500
1,000
1,500
1,600
1,400
1,200
1,000
800
600
400
200

47
Heavy investments in road infrastructure will occur predominantly in the emerging markets: Russia, India,
Turkey and Nigeria as part of BRIC/MINT are just the most popular examples
Source: CIA World Factbook
8.000.000
9.000.000
10.000.000
11.000.000
12.000.000
13.000.000
14.000.000
15.000.000
0
5.000.000
10.000.000
15.000.000
20.000.000
25.000.000
30.000.000
35.000.000
2005 2010 2012 2015
G7 BRICS+MINT TOTAL
TOTAL km worldwide km G7/BRICS/MINT
+24.5%
+56.8%
+4.0%
Road Network

48
EMEA & India: Market structure, SAFH positioning and technological pattern
Middle East, Africa & IndiaEurope
• Market structure
Developing and growing OEMs
CKD productions for trucks
Gain in local competence as India´s industry
grows
Fast growing populations which lead to an
increase in demand of public and commercial
transport
Old fleets
• SAF-HOLLAND positioning
Premium segment in quality and technology
Entry of market for bus air suspensions
• Technological pattern
Air suspension only for high end applications -
tankers / reefers
Biggest portion is currently mechanical
suspension and drum brake
Presently low end markets
• Aftermarket Unstructured; clear potential for A2 brands and
3rd party products
• Market structure
Mature and well developed market
Big 7 Truck OEMs
Trailer builders with captive axle products
Competition sensitivity and market shares
• SAF-HOLLAND positioning
Technology leader
Focus on TCO
USP: End user approach
• Technological pattern
Air suspension dominating
Disc brake as standard for Truck and Trailer
• Aftermarket
Well developed network with educated
dealers and service stations
OEM population reaching plateau
Increase of A2 and 3rd party product sales

49
EMEA & India: Action plans and measures
Middle East, Africa & IndiaEurope
• Basic axle and mechanical suspension
development to serve standard applications
• Strengthen local FW business as production of
CKD picking up again
• Maintain and strengthen leading position in the
premium segment
• Positioning as complete system supplier for the
local truck / bus and trailer manufacturers
• Expansion of truck and bus suspension business
• Implementation of European end-user strategy
• Expand sales network in Africa
• Further growth of A2 and 3rd party product range
• Focus on smaller OEMs (Truck, Trailer, Bus)
• Introduction of cost reduced INTRA S suspension
• Product to market initiatives of innovations such as
FW32.14W, SAF Direct, galvanized axle, new bus
suspensions, etc.
• Material cost and SG&A: work on detailed plans for
2016/2017
• Finished plant consolidation in Europe and further
investigation of business processes – make or buy
• First impacts to be realized 2016/2017

50
EMEA & India: Risks and Opportunities
EMEA & India
RISKS
• Crisis in Russia / Ukraine / Syria has a significant impact on business including currency issues
• Captive axles of biggest trailer builders – counter measures: introduction of INTRA S & targeting small and
mid-size trailer builders
• Cost pressure – counter measures already implemented
OPPORTUNITIES
• Iranian market to be opened soon
• New customers in small and mid-size segment (Truck, Trailer & Bus)
• End user work in Europe rolled out – additional fleet sales people
• Innovations for Truck and Trailer builders
• Supply of MAN with Fifth wheels starting in 2016
51
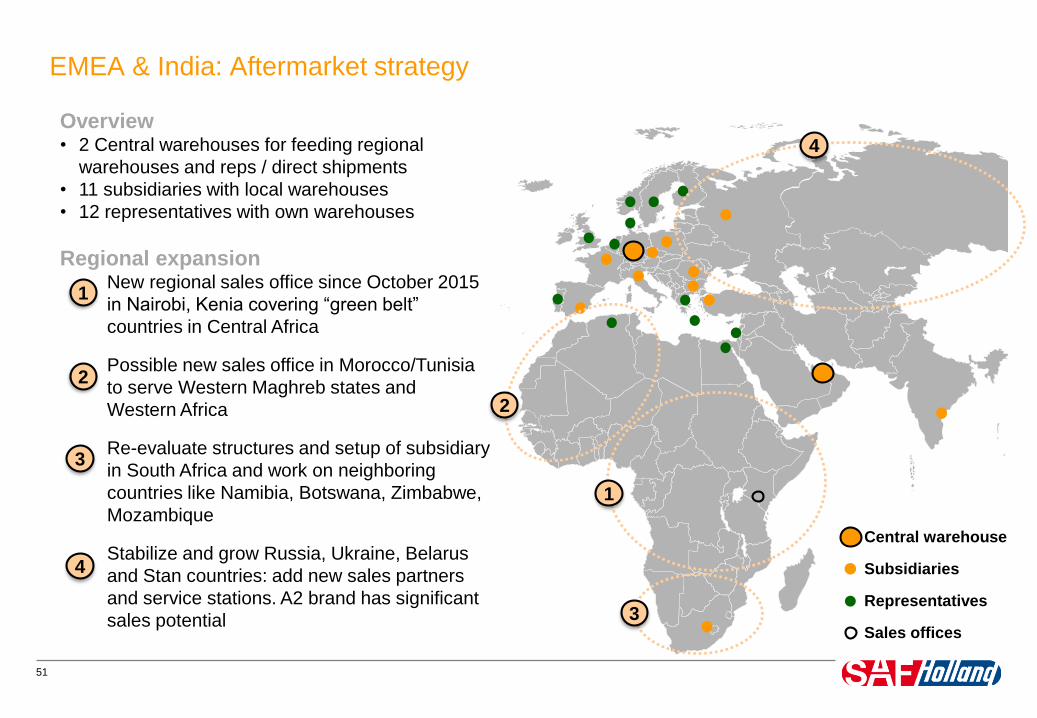
EMEA & India: Aftermarket strategy
Central warehouse
Subsidiaries
Representatives
Sales offices
4
2
3
Overview• 2 Central warehouses for feeding regional
warehouses and reps / direct shipments
• 11 subsidiaries with local warehouses
• 12 representatives with own warehouses
Regional expansionNew regional sales office since October 2015
in Nairobi, Kenia covering “green belt”
countries in Central Africa
Possible new sales office in Morocco/Tunisia
to serve Western Maghreb states and
Western Africa
Re-evaluate structures and setup of subsidiary
in South Africa and work on neighboring
countries like Namibia, Botswana, Zimbabwe,
Mozambique
Stabilize and grow Russia, Ukraine, Belarus
and Stan countries: add new sales partners
and service stations. A2 brand has significant
sales potential
1
2
3
1
4
52
EMEA & India: Aftermarket strategy
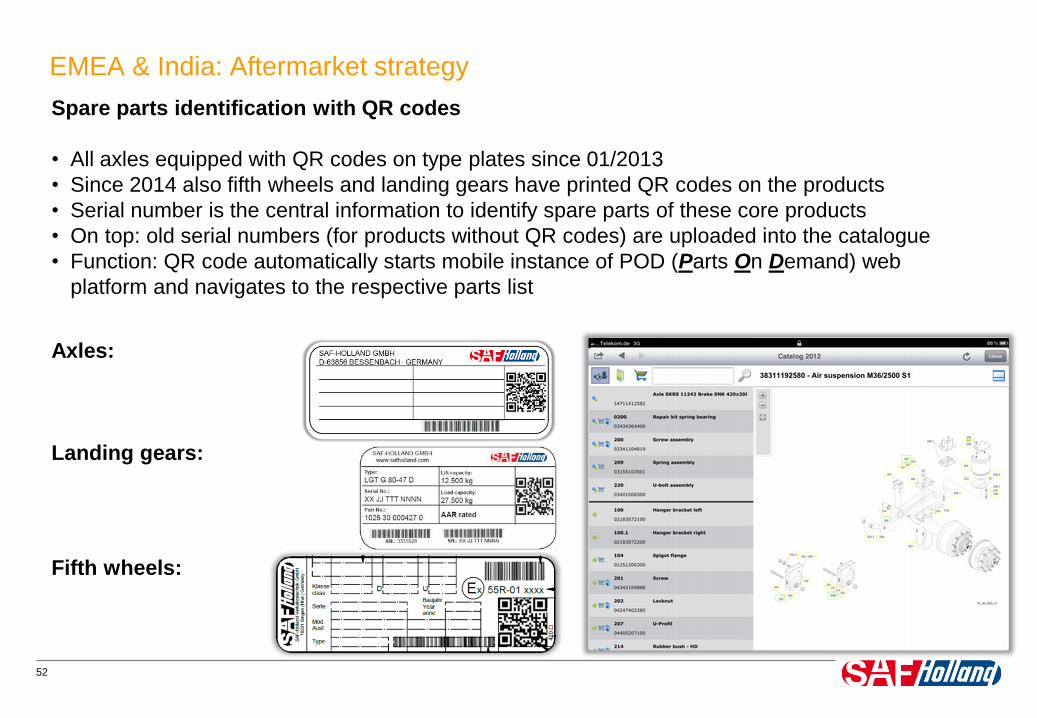
Spare parts identification with QR codes
• All axles equipped with QR codes on type plates since 01/2013
• Since 2014 also fifth wheels and landing gears have printed QR codes on the products
• Serial number is the central information to identify spare parts of these core products
• On top: old serial numbers (for products without QR codes) are uploaded into the catalogue
• Function: QR code automatically starts mobile instance of POD (Parts On Demand) web
platform and navigates to the respective parts list
Axles:
Landing gears:
Fifth wheels:

53
SAF-HOLLAND for Fleets App
• Workshop: GPS based Official Service partner search
• Parts dealer: GPS based Original Parts
dealer search
• QR Code scanner
• POD Shop: mobile version of online shop
• Fleet Connect: access and functions
of accounts
Plans for Version 2.0 (2016 / 2017)
• Additional languages
• Additional functions like training registrations
• Videos and repair instructions
• News channels
EMEA & India: Aftermarket strategy
54
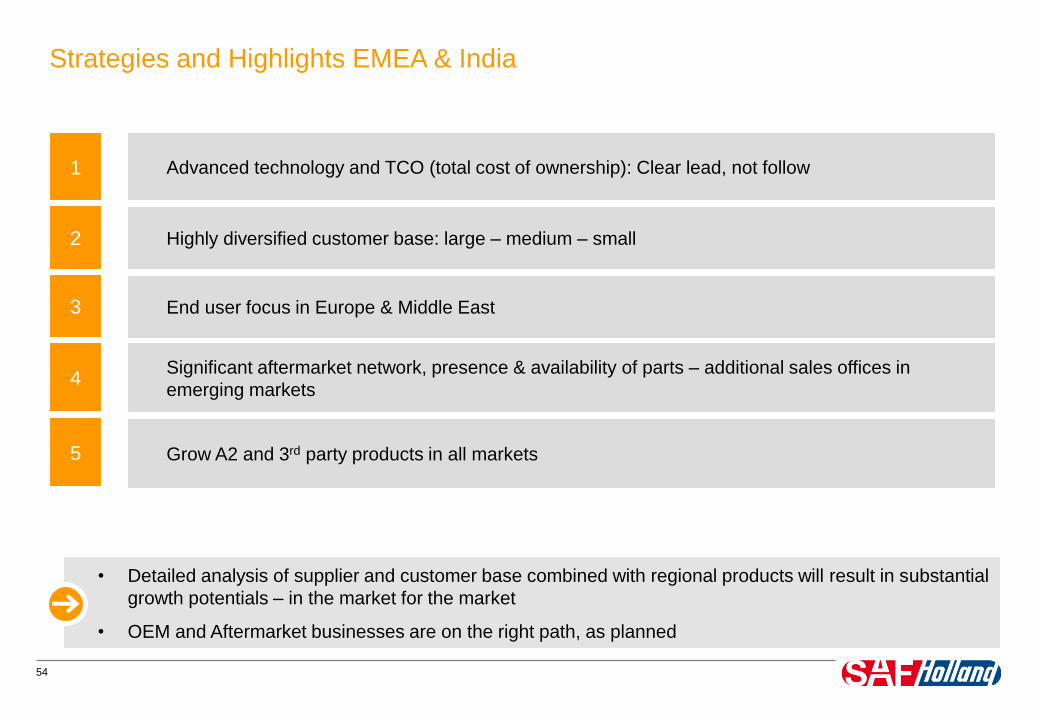
Strategies and Highlights EMEA & India
Advanced technology and TCO (total cost of ownership): Clear lead, not follow1
2 Highly diversified customer base: large – medium – small
3 End user focus in Europe & Middle East
4Significant aftermarket network, presence & availability of parts – additional sales offices in
emerging markets
5 Grow A2 and 3rd party products in all markets
• Detailed analysis of supplier and customer base combined with regional products will result in substantial
growth potentials – in the market for the market
• OEM and Aftermarket businesses are on the right path, as planned

55
Sales in €mn Summary
• Solid market share development in Europe
• Moderate investments in Europe and Middle East
• Strong growth in MEA
• To follow the growth path SAF-HOLLAND Middle East
has to play a more important role in the organization –
will be fully supported by central functions
• Re-started Indian market penetration with fully owned
subsidiary
• Sales target for the region is € 603mn in 2020
• Sales development based on a stable European environment and continuous growth in MEA / India
EMEA & India: Business performance and sales targets 2020
530
603
300
350
400
450
500
550
600
650
FY2014 Target 2020

Design
the future
December 09, 2015
Capital Markets Day 2015
Steffen Schewerda, President Trailer Systems
Business Unit

57
General Information: Business Area AMERICAS
• 4 subsidiaries including 9 manufacturing facilities
• ~ 1,450 employees
• ~ 5,600 Aftermarket service stations in this region
Axle systems &
suspensions
Landing gear
Kingpins
Fifth wheels
Suspensions
• Sales: € 380mn
General information Key components and systems in the region
Financial information (FY 2014)
Spare parts

58
Trailer Axles and
Suspension Systems
SAF-HOLLAND offers a comprising product portfolio in the AMERICAS addressing the specific customer
needs in this region; Opportunities on the product side to drive growth are given especially with suspensions
Truck and Bus
SuspensionsFifth Wheels
AMERICAS: SAF-HOLLAND core products

59
AMERICAS: Key OE (customers) producing trucks and trailers
SAF-HOLLAND offers its innovative products to major OE´s in the truck and trailer industry active in
AMERICAS

60
Focus on the fleets: SAF-HOLLAND end customer base includes a manifold of major forwarding agents and
fleets in AMERICAS
AMERICAS: End customer base of transport companies using trucks & trailers

61
361 362 375
56.2
56.9
63.6
51
53
55
57
59
61
63
65
0
100
200
300
400
500
600
2014 2015e 2020e
Population in mn Real GDP per capita in K USD
Macroeconomic drivers/ mega trend in the AMERICAS region
Population and Real GDP per capita for NA
Source: ERS International Macroeconomic Data Set 2014, United Nations, Department of Economic and Social Affairs, Population Division (2015),
World Population Prospects: The 2015 Revision.
630 631 659
6.7 6.8
8.1
0
1
2
3
4
5
6
7
8
9
0
500
1000
1500
2014 2015e 2020e
Population in mn Real GDP per capita in K USD
Population and Real GDP per capita for Latin America
Growth projections are moderate. However, with 64 K USD per capita, North America is also in 2020 one of
the strongest economies in the world. Latin America will grow >20% over the next 5 years

62
AMERICAS: Market structure, SAFH positioning and technological pattern
Latin AmericaNorth America
• Premium-market segment with clear
focus on the end user
• SAF-HOLLAND well positioned with
brand, products and service
• Trend towards more technically
sophisticated products (e.g. Disc
Brakes) is visible but will require time
• Due to high number of component
suppliers and fleet specifications,
aftermarket business is very diverse
• Low to Mid-market segment more
focused on price. At present small
premium-market segment
• SAFH positioned as the a technology
leader with access to the premium-
market segment
• Core technology. Initial price is more
important than life cycle cost
• Due to the currently low sales volume of
SAF-HOLLAND, the Aftermarket will
develop when population in the market
is installed

63
AMERCIAS: Opportunities and measures
Latin AmericaNorth America
• Beside well established product lines
(e.g. Fifth wheels, Landing gears),
strong growth potential lies especially in
the axle and suspension product line
• Truck suspensions and Trailer axles and
suspensions will be the mayor growth
drivers over the next years
• Introduction of new technology and
providing the fleets with value added
products will be one of the key success
factors
• The Aftermarket will increase even
further, based on growing field
population and recent record
registrations
• Two directional approach: Nurture the
premium-market segment, but also
develop competitive products for the
mid-market segment
• Customers will clearly prefer SAF-
HOLLAND over other brands if the
commercial package is attractive
• Truck, Bus and Trailer suspensions
provide significant growth opportunity
• Aftermarket will develop further with OE
market share
64
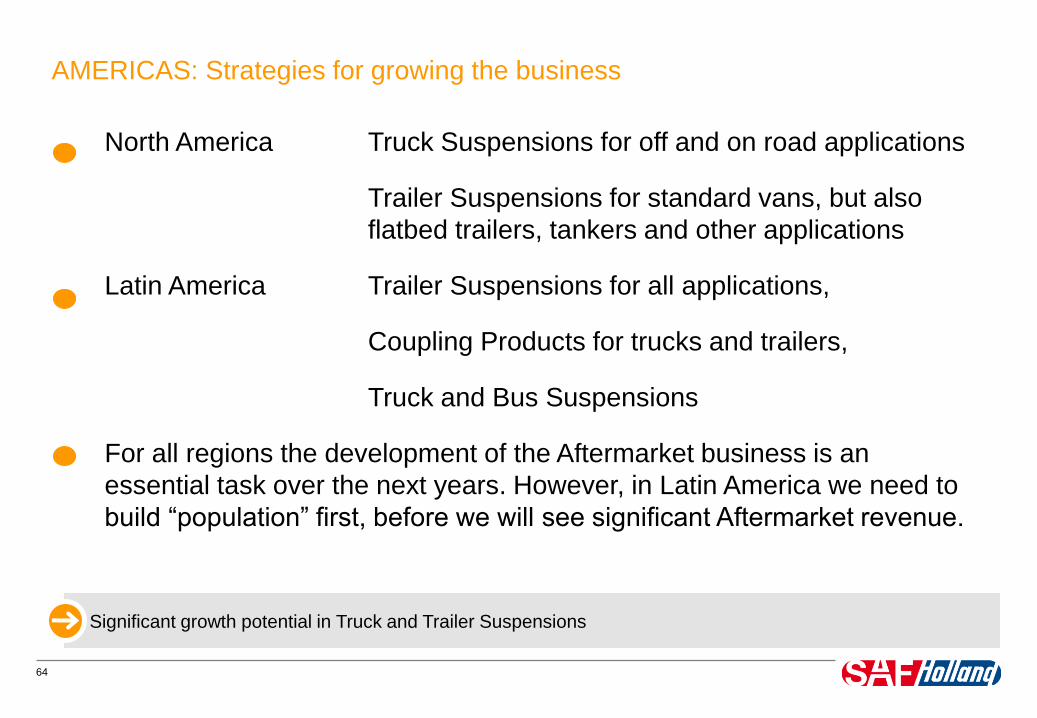
AMERICAS: Strategies for growing the business
North America Truck Suspensions for off and on road applications
Trailer Suspensions for standard vans, but also
flatbed trailers, tankers and other applications
Latin America Trailer Suspensions for all applications,
Coupling Products for trucks and trailers,
Truck and Bus Suspensions
For all regions the development of the Aftermarket business is an
essential task over the next years. However, in Latin America we need to
build “population” first, before we will see significant Aftermarket revenue.
Significant growth potential in Truck and Trailer Suspensions
65
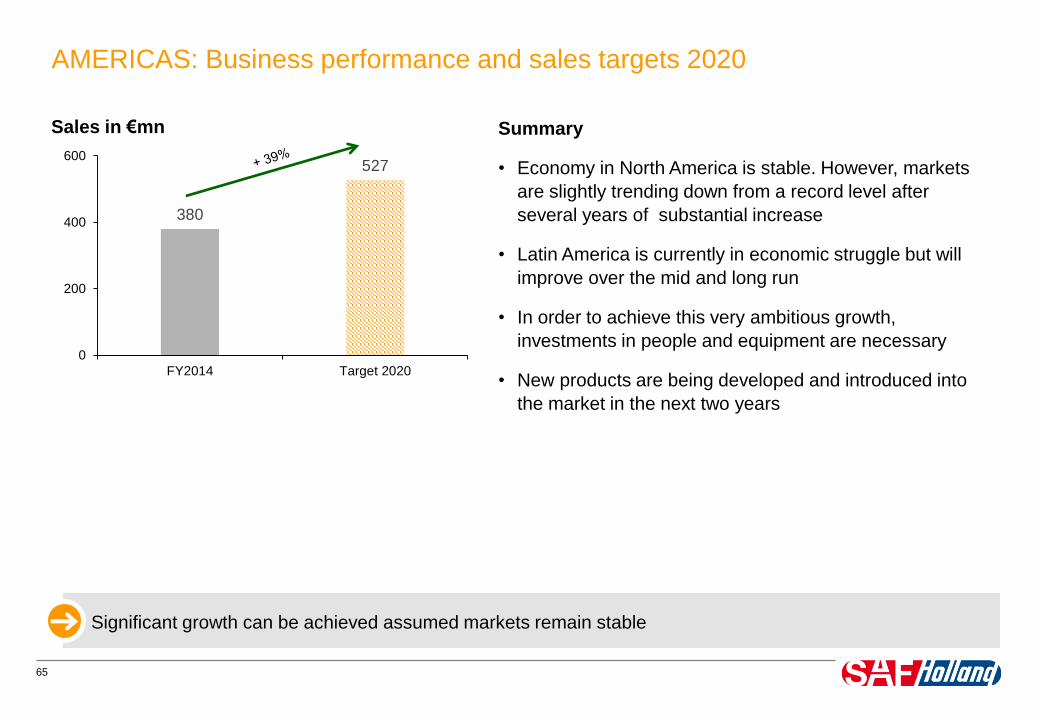
380
527
0
200
400
600
FY2014 Target 2020
Sales in €mn Summary
• Economy in North America is stable. However, markets
are slightly trending down from a record level after
several years of substantial increase
• Latin America is currently in economic struggle but will
improve over the mid and long run
• In order to achieve this very ambitious growth,
investments in people and equipment are necessary
• New products are being developed and introduced into
the market in the next two years
Significant growth can be achieved assumed markets remain stable
AMERICAS: Business performance and sales targets 2020
Challenges in the
Transportation Industry
SAF-HOLLAND Highlights in R&D
Engineering
Mike Kamsickas, President Powered Vehicle Systems Business
UnitDecember 09, 2015

67
Cost
Efficiency
Product
Efficiency
Technology
Innovation
Product
Quality
OEM
How to influence the success of our customers?
Tra
nsp
ort
Eff
icie
ncy
Total Cost of
Ownership
Flexibility /
Multipurpose
Use
Safety
Requirements /
Legislation
Ecological
Requirements /
Legislation
End User / Fleet
68
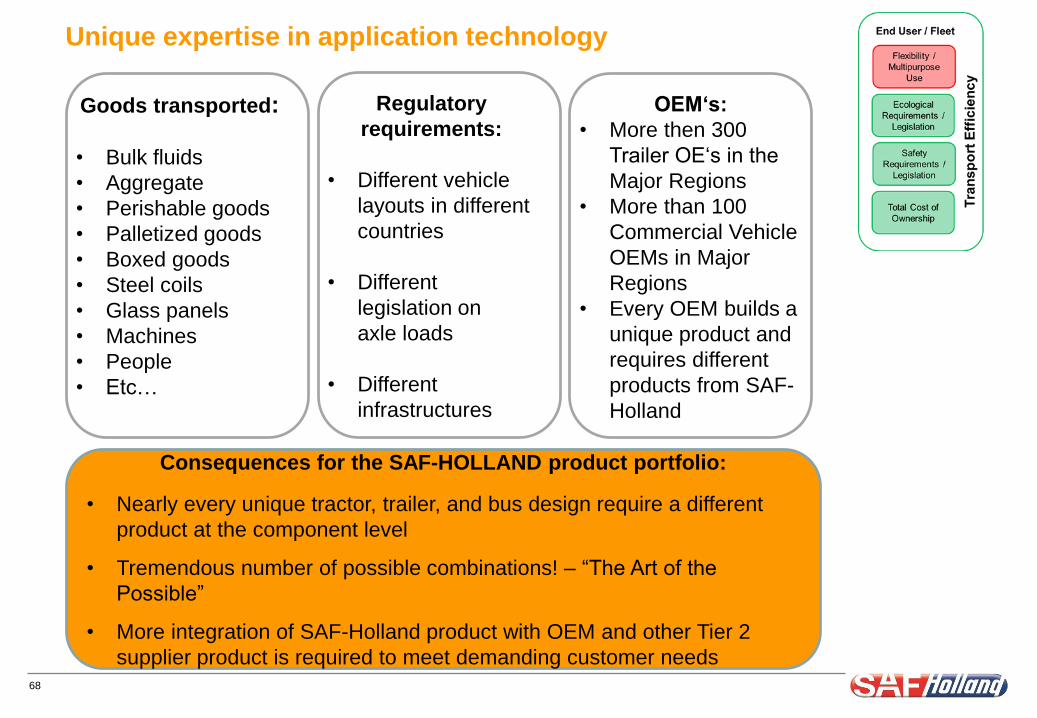
Unique expertise in application technology
Regulatory
requirements:
• Different vehicle
layouts in different
countries
• Different
legislation on
axle loads
• Different
infrastructures
OEM‘s:
• More then 300
Trailer OE‘s in the
Major Regions
• More than 100
Commercial Vehicle
OEMs in Major
Regions
• Every OEM builds a
unique product and
requires different
products from SAF-
Holland
Goods transported:
• Bulk fluids
• Aggregate
• Perishable goods
• Palletized goods
• Boxed goods
• Steel coils
• Glass panels
• Machines
• People
• Etc…
Consequences for the SAF-HOLLAND product portfolio:
• Nearly every unique tractor, trailer, and bus design require a different
product at the component level
• Tremendous number of possible combinations! – “The Art of the
Possible”
• More integration of SAF-Holland product with OEM and other Tier 2
supplier product is required to meet demanding customer needs

69
It’s all about cutting CO2, and cost per mile
IAA 2014: Discussion Forum:
Creating transparency in truck fuel consumption
Wissmann also praised the EU for its plan to create
transparency in truck fuel consumption. “It’s a good idea to
require the disclosure of CO2-values instead of imposing strict
limits as the trucking industry is already calculating on a tight
budget.”
12/2014 :Fact-finding studies in support of the development
of an EU strategy for freight transport logistics
LOT 3: Introduction of a standardized carbon footprint
methodology:
“To harmonize carbon foot printing and to allow
benchmarking of transport . . .
The European Commission has taken the initiative to contributing
to the development of harmonized carbon foot printing standards
for passenger and freight transport.“
3/2015: MISSION OF THE DIRECTORATE-GENERAL FOR
MOBILITY AND TRANSPORT
“developing an agenda for innovation: promoting research
and the development and roll-out of a new generation of
sustainable transport technologies and systems particularly for
integrated traffic management and low-carbon transport,
including in urban areas”
General drive to CO2-based
legislation on OEMs but even
more emphasis on efficiency by
fleet and end users.
70
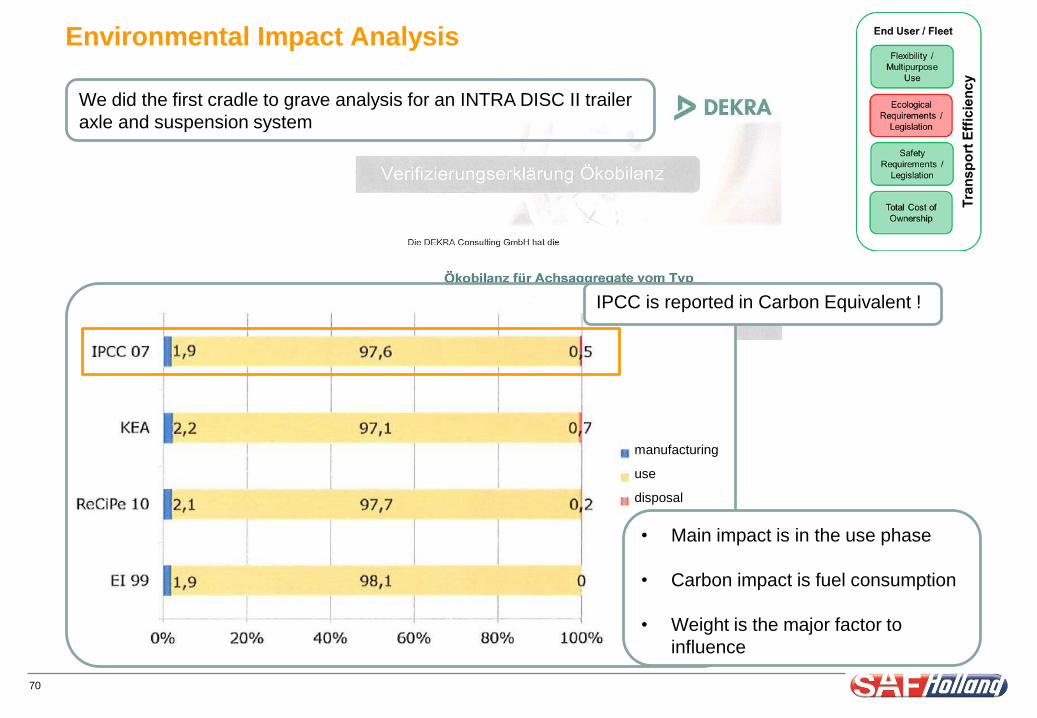
Environmental Impact Analysis
manufacturing
use
disposal
We did the first cradle to grave analysis for an INTRA DISC II trailer
axle and suspension system
IPCC is reported in Carbon Equivalent !
• Main impact is in the use phase
• Carbon impact is fuel consumption
• Weight is the major factor to
influence
71
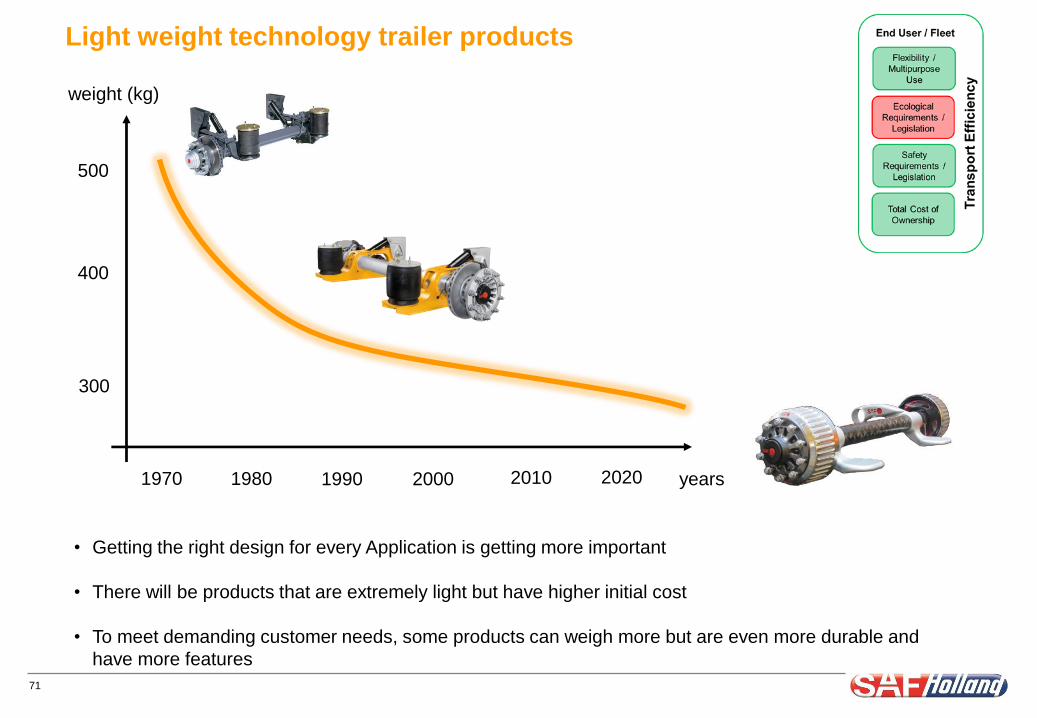
Light weight technology trailer products
• Getting the right design for every Application is getting more important
• There will be products that are extremely light but have higher initial cost
• To meet demanding customer needs, some products can weigh more but are even more durable and
have more features
weight (kg)
500
400
300
1970 1990 2000 years2010 20201980

72
Electric Drivetrain Bus Suspension
• Electric Bus is a high growth market in China and APAC – driven by heavy government subsidies!
• This application requires additional space for batteries, while maintaining suspension performance and roll
stability
• Rear Air Spring positioning allows more space for batteries near the rear wheels.
• New “J Beam” design versus traditional C-Beam allows the bus manufacturer the extra space they need,
with no compromise in ride comfort and performance

73
Light weight technology truck suspension products
• A lot of collaboration with OEMs is necessary to integrate products into new applications.
• OEMs expecting higher levels of DVP&R
• More integration of SAF-Holland products into chassis and axles is necessary for weight reduction
weight (kg)
725
500
300
1970 1990 2000 years2010 20201980
Coming Soon!
74
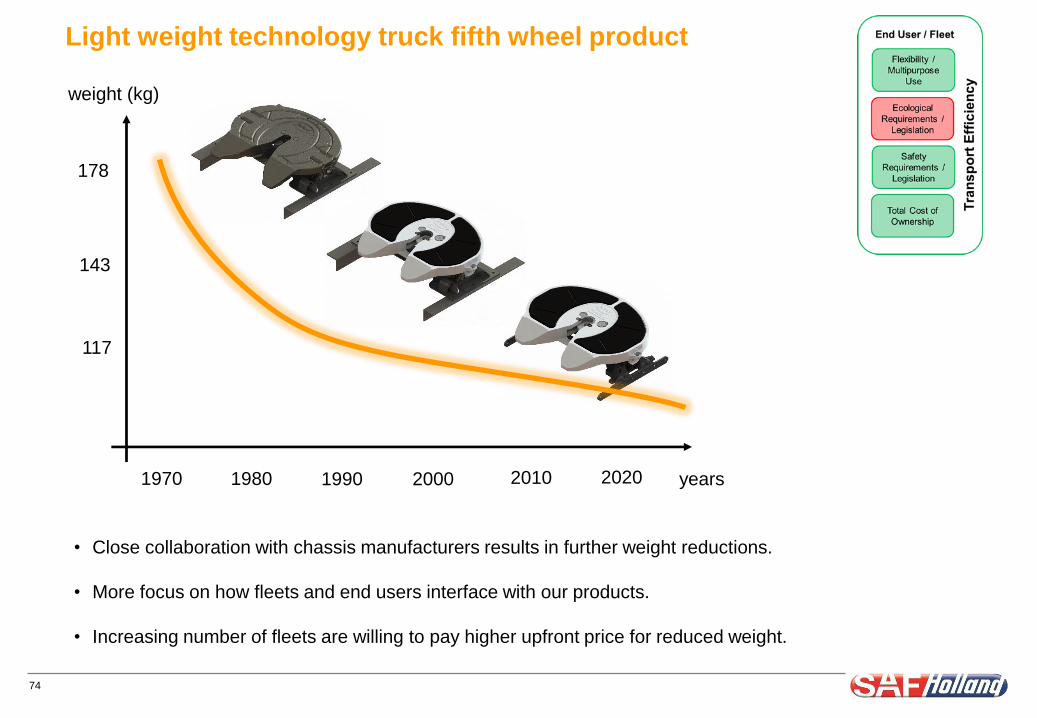
Light weight technology truck fifth wheel product
• Close collaboration with chassis manufacturers results in further weight reductions.
• More focus on how fleets and end users interface with our products.
• Increasing number of fleets are willing to pay higher upfront price for reduced weight.
weight (kg)
178
143
117
1970 1990 2000 years2010 20201980

75
Light weight technology – What’s next?
- 64 kg
per axle
starting at 410 kg system weight…

76
Advantages for End Users
• Weight saving compared to existing solution
Can carry higher loads
Reduction of fuel consumption
CO2-reduction
Advanced driving behavior and safety
Higher resale value
• Optimized field service / maintenance
Maintenance free sealed unit
Use of standard disc brake / brake chambers
Reduction of maintenance times
XXX
Advantages for the OEM
• Component reduction (camshaft, slack,..)
Reduced vehicle weight
Increased freedom of design for the vehicle
manufacturer
• Use of standard disc brake / brake chambers
Brake chambers can already be assembled
Simplified parts logistics
Reduced vehicle assembly effort
SAF Direct: CO2 reduction and TCO
compliment each other

77
Thank you for your attention
Design
the future
December 09, 2015
Capital Markets Day 2015
Wilfried Trepels, CFO
79
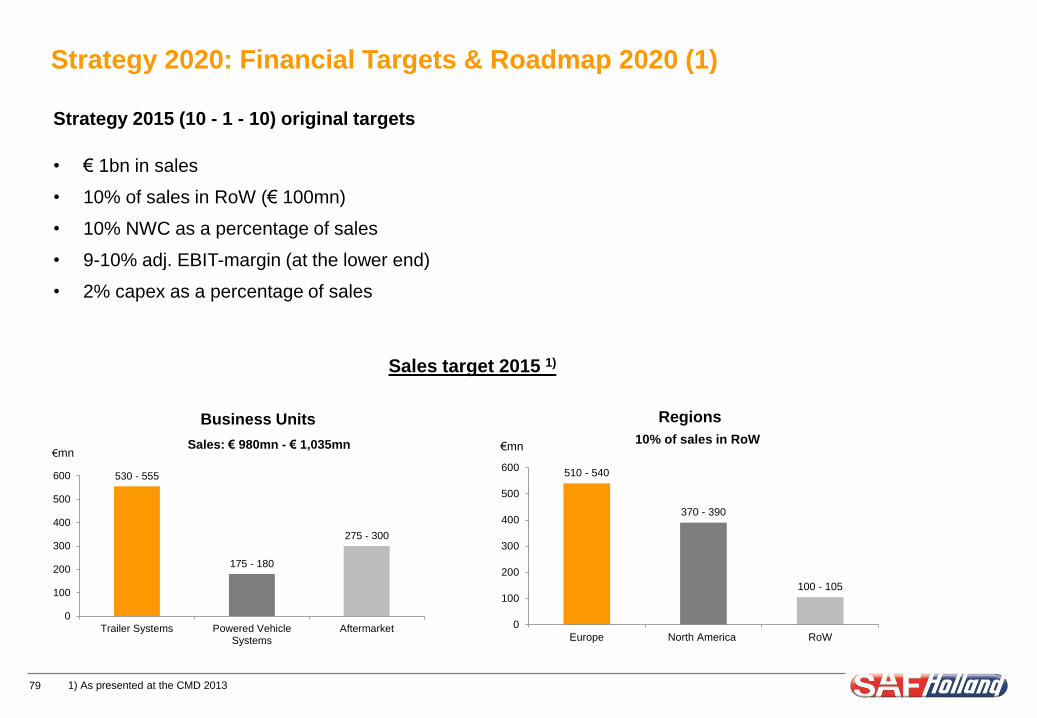
Strategy 2020: Financial Targets & Roadmap 2020 (1)
Strategy 2015 (10 - 1 - 10) original targets
• € 1bn in sales
• 10% of sales in RoW (€ 100mn)
• 10% NWC as a percentage of sales
• 9-10% adj. EBIT-margin (at the lower end)
• 2% capex as a percentage of sales
Business Units Regions
1) As presented at the CMD 2013
510 - 540
370 - 390
100 - 105
0
100
200
300
400
500
600
Europe North America RoW
10% of sales in RoW€mn
Sales target 2015 1)
530 - 555
175 - 180
275 - 300
0
100
200
300
400
500
600
Trailer Systems Powered VehicleSystems
Aftermarket
Sales: € 980mn - € 1,035mn€mn
80
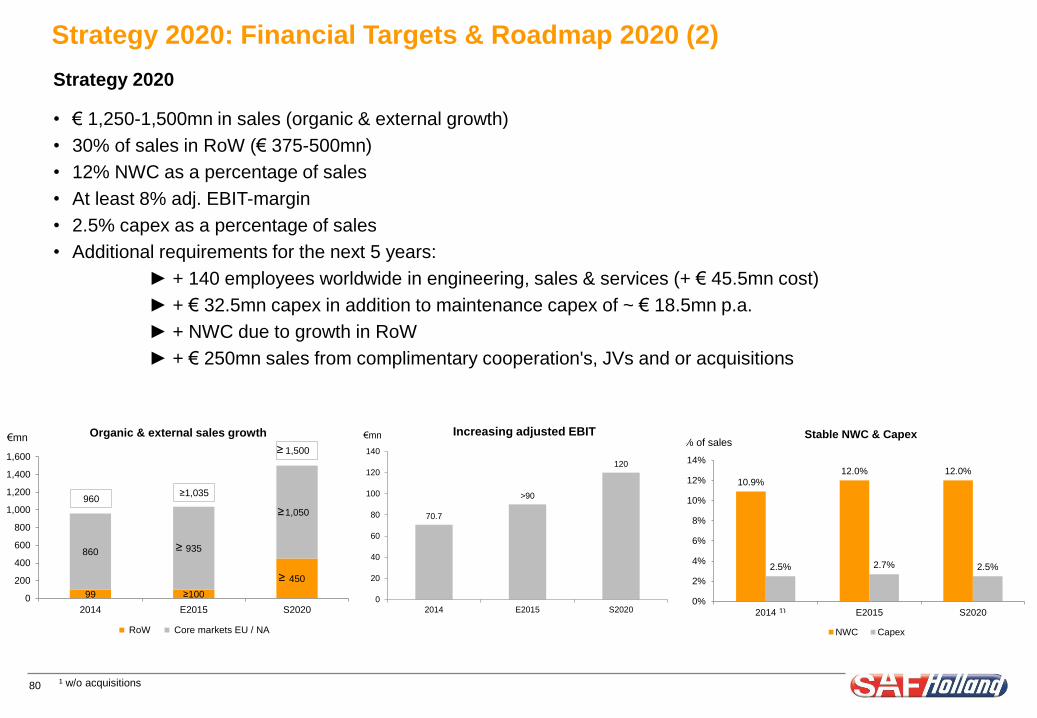
Strategy 2020: Financial Targets & Roadmap 2020 (2)
Strategy 2020
• € 1,250-1,500mn in sales (organic & external growth)
• 30% of sales in RoW (€ 375-500mn)
• 12% NWC as a percentage of sales
• At least 8% adj. EBIT-margin
• 2.5% capex as a percentage of sales
• Additional requirements for the next 5 years:
► + 140 employees worldwide in engineering, sales & services (+ € 45.5mn cost)
► + € 32.5mn capex in addition to maintenance capex of ~ € 18.5mn p.a.
► + NWC due to growth in RoW
► + € 250mn sales from complimentary cooperation's, JVs and or acquisitions
¹ w/o acquisitions
99 ≥100
450
860 935
1,050
0
200
400
600
800
1,000
1,200
1,400
1,600
2014 E2015 S2020
RoW Core markets EU / NA
Organic & external sales growth
≥1,035960
€mn
1,500
70.7
>90
120
0
20
40
60
80
100
120
140
2014 E2015 S2020
€mn€mnIncreasing adjusted EBIT
10.9%
12.0% 12.0%
2.5% 2.7% 2.5%
0%
2%
4%
6%
8%
10%
12%
14%
2014 E2015 S2020
NWC Capex
€mn% of salesStable NWC & Capex
1)
≥
≥
≥
≥
Increasing adjusted EBIT

81
Strategy 2020: Financial Targets & Roadmap 2020 (3)
Strategy 2020
64 Business plans (8 product lines x 8 regions)
• 3 main product areas of growth:
- Trailer Axles & Suspensions
- AM spare parts & service network
- Truck & Bus Suspensions
• 3 main regions:
- Europe & Middle East / Africa/ India
- North America, Mexico & Brazil
- China & APAC
483
240
51
653
333
132
0
100
200
300
400
500
600
700
800
TA&S AMSP T&BS
2014 S2020
€mn€mn€mn€mn€mn3 main product areas (~80% of growth = € 1.1 bn)
+35%
+39%
+159%
530
380
50
603
527
120
0
100
200
300
400
500
600
700
EU / MEA NA / MEX / BRA CH / APAC
2014 S2020
€mn
+39%
+140%
3 main regions
+14%
82
Strategy 2020: Financial Targets & Roadmap 2020 (4)
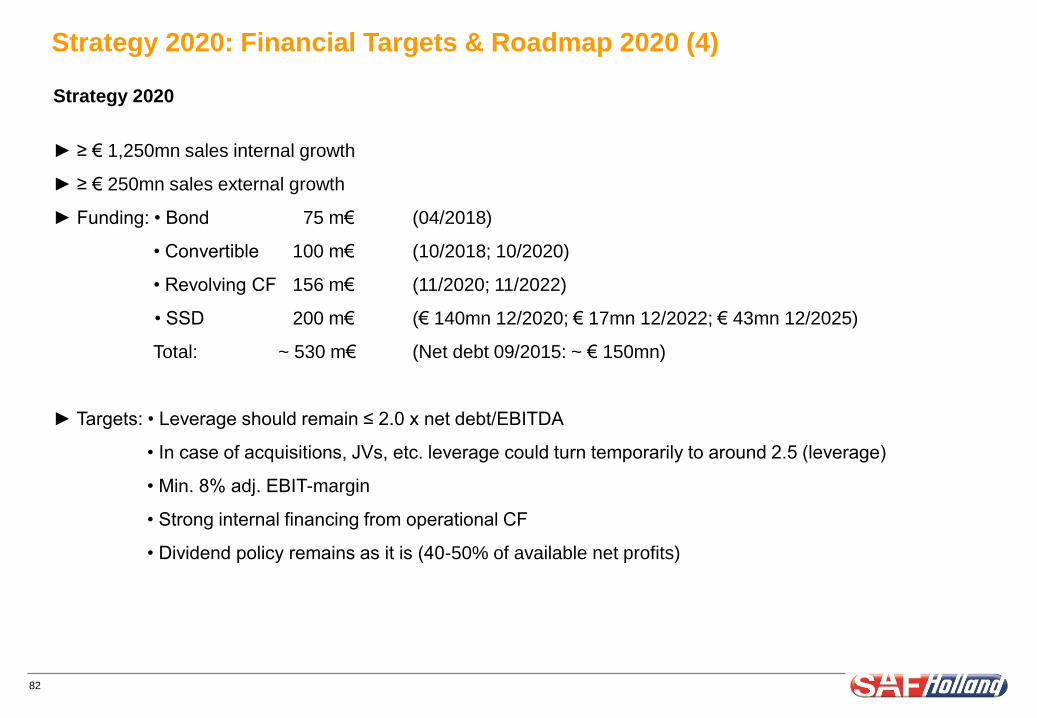
Strategy 2020
► ≥ € 1,250mn sales internal growth
► ≥ € 250mn sales external growth
► Funding: • Bond 75 m€ (04/2018)
• Convertible 100 m€ (10/2018; 10/2020)
• Revolving CF 156 m€ (11/2020; 11/2022)
• SSD 200 m€ (€ 140mn 12/2020; € 17mn 12/2022; € 43mn 12/2025)
Total: ~ 530 m€ (Net debt 09/2015: ~ € 150mn)
► Targets: • Leverage should remain ≤ 2.0 x net debt/EBITDA
• In case of acquisitions, JVs, etc. leverage could turn temporarily to around 2.5 (leverage)
• Min. 8% adj. EBIT-margin
• Strong internal financing from operational CF
• Dividend policy remains as it is (40-50% of available net profits)

83
Building on a strong year 2015, from today’s perspective 2016 will become another solid year with stable
operational performance laying the basis for the implementation of the growth strategy 2020.
Actual 2015 versus Strategy 2020
Markets:
• Anticipating a retraction of the US market peaking off from record levels
• Growth in Western Europe curtailed by continuous weakness in Russia
• Flattish markets in Brazil and Australia due to political situation and insufficient prices of raw materials
• Sale of non-core Aerway product line
Balancing measures to match these effects:
• Market share gains
• New products (e.g. Intra S/R)
• Expansion of vocational segments
• Further efficiency improvements
Strategy 2020: Financial Targets & Roadmap 2020 (5)
84
Disclaimer
By attending the meeting where this presentation is made, or by reading the presentation slides, you agree to be bound by the following limitations: The information in
this document has been prepared by SAF-HOLLAND S.A. ("SAF-HOLLAND") for use at a road show presentation by SAF-HOLLAND and does not constitute a
recommendation regarding securities of SAF-HOLLAND.
No representation or warranty, express or implied, is made as to, and no reliance should be placed on, the fairness, accuracy, completeness or correctness of the
information, or opinions contained herein. Neither SAF-HOLLAND nor any of SAF-HOLLAND's advisors or representatives shall have any responsibility or liability
whatsoever (for negligence or otherwise) for any loss howsoever arising from any use of this document or its contents or otherwise arising in connection with this
document. The information set out herein may be subject to updating, completion, revision, verification and amendment and such information may change
materially.
This presentation is based on the economic, regulatory, market and other conditions as in effect on the date hereof. It should be understood that subsequent
developments may affect the information contained in this document, which neither SAF-HOLLAND nor its advisors are under an obligation to update, revise or
affirm.
The distribution of this presentation in certain jurisdictions may be restricted by law. Persons into whose possession this presentation comes are required to inform
them-selves about and to observe any such restrictions. In particular, this presentation may not be distributed into the United States, Australia, Japan or Canada.
This presentation contains statements concerning the expected future business of SAF-HOLLAND, expected growth prospects and other opportunities for an increase
in value of the company as well as other financial data and certain third-party market data. These forward-looking statements are based on management's current
expectations, estimates and projections and on third-party market data, respectively. They are subject to a number of assumptions and involve known and unknown
risks, uncertainties and other factors that may cause actual results and developments to differ materially from any future results and developments expressed or
implied by such forward-looking statements. Neither SAF-HOLLAND nor its advisors has any obligation to periodically update or release any revisions to the
forward-looking statements contained in this presentation to reflect events or circumstances after the date of this presentation.
This presentation constitutes neither an offer to sell nor a solicitation to buy any securities in the United States, Germany or any other jurisdiction. Neither this
presentation nor anything contained herein shall form the basis of, or be relied on in connection with, any offer or commitment whatsoever.
In particular, this presentation does not constitute an offer to sell or a solicitation of an offer to buy any securities of SAF-HOLLAND in the United States. Securities of
SAF-HOLLAND may not be offered or sold in the United States of America absent registration or an exemption from registration under the U.S. Securities Act of
1933, as amended. SAF-HOLLAND does not intend to conduct a public offering or any placement of securities in the United States.
85
Investor Relations
SAF-HOLLAND GmbH
Stephan Haas
Hauptstraße 26
63856 Bessenbach
Phone +49 6095 301-617
Telefax +49 6095 301-102
Mobile +49 170 306 64 97
www.safholland.com