detr- rehabilitation division sfy 2006 satisfaction survey
DESCRIPTION
DETR- Rehabilitation Division SFY 2006 Satisfaction Survey. BY: Pamela Gallion University of Nevada, Las Vegas. SFY 06 Consumer Assessment Results. Methodology Conducted via telephone 1,795 eligible cases supplied by DETR/Rehab Division Three attempts were made to each number - PowerPoint PPT PresentationTRANSCRIPT
1
DETR-Rehabilitation Division SFY 2006 Satisfaction Survey
BY:Pamela Gallion
University of Nevada, Las Vegas
2
SFY 06 Consumer Assessment Results
Methodology Conducted via telephone 1,795 eligible
cases supplied by DETR/Rehab Division Three attempts were made to each
number 280 interviews completed
3
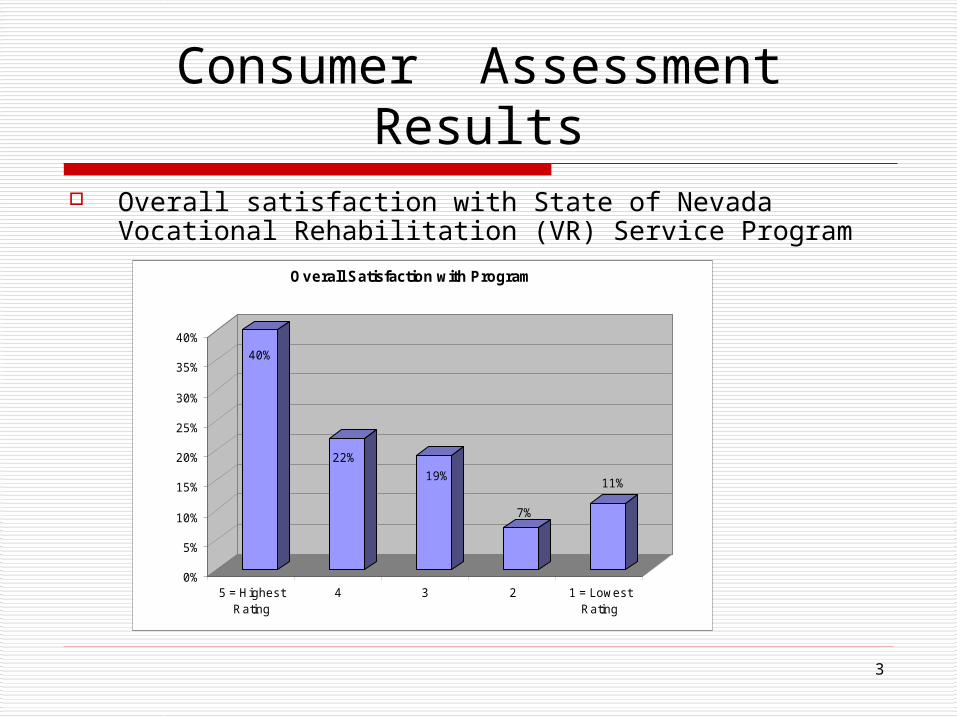
Consumer Assessment Results Overall satisfaction with State of Nevada Vocational
Rehabilitation (VR) Service Program
40%
22%
19%
7%
11%
0%
5%
10%
15%
20%
25%
30%
35%
40%
5 = HighestRating
4 3 2 1 = LowestRating
Overall Satisfaction with Program
4
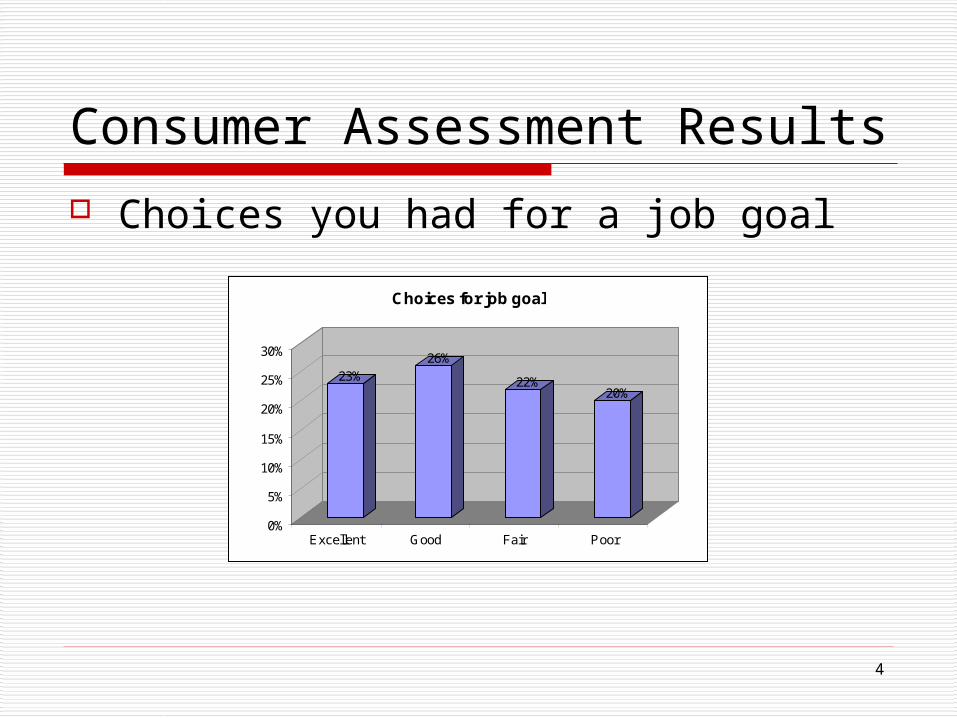
Consumer Assessment Results
Choices you had for a job goal
23%26%
22%20%
0%
5%
10%
15%
20%
25%
30%
Excellent Good Fair Poor
Choices for job goal
5
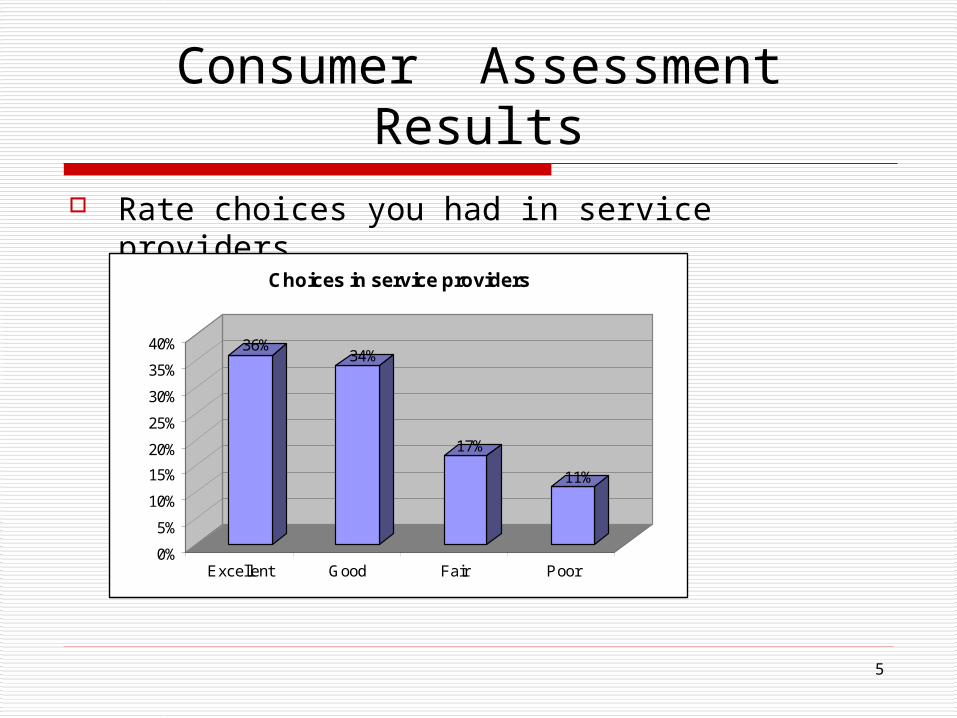
Consumer Assessment Results Rate choices you had in service providers
36%34%
17%
11%
0%
5%
10%
15%
20%
25%
30%
35%
40%
Excellent Good Fair Poor
Choices in service providers
6
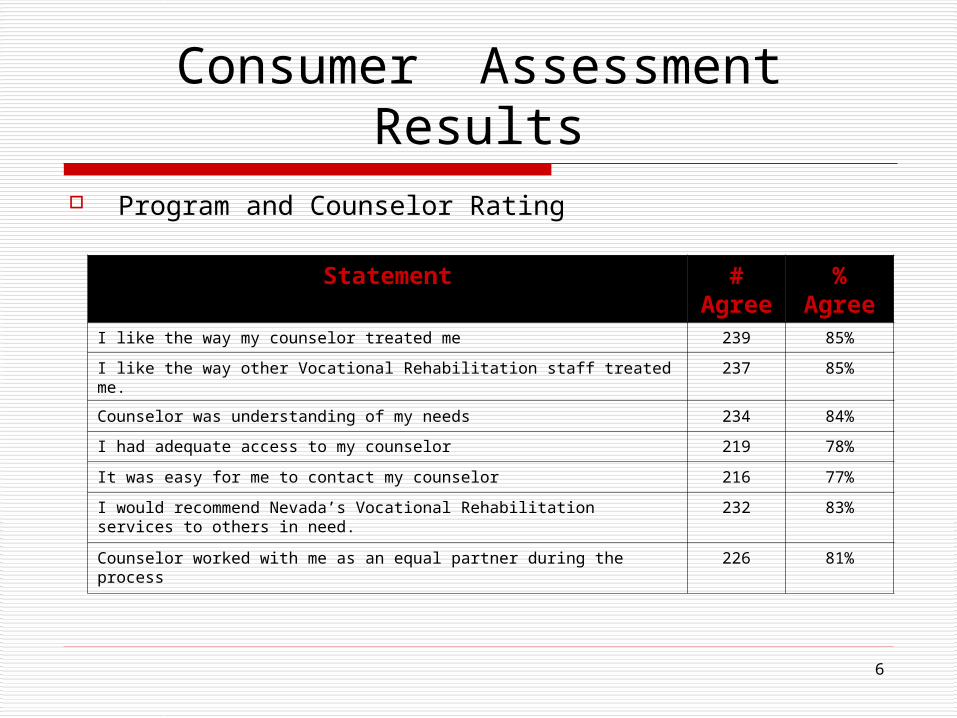
Consumer Assessment Results Program and Counselor Rating
Statement # Agree
% Agree
I like the way my counselor treated me 239 85%
I like the way other Vocational Rehabilitation staff treated me. 237 85%
Counselor was understanding of my needs 234 84%
I had adequate access to my counselor 219 78%
It was easy for me to contact my counselor 216 77%
I would recommend Nevada’s Vocational Rehabilitation services to others in need.
232 83%
Counselor worked with me as an equal partner during the process 226 81%
7
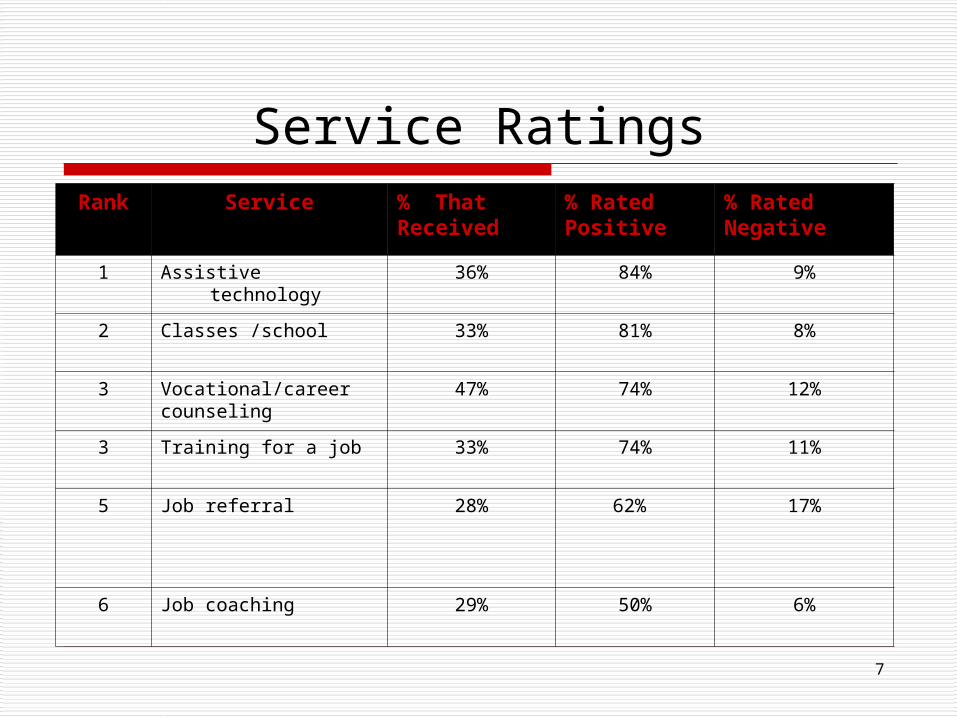
Service RatingsRank Service % That
Received% RatedPositive
% RatedNegative
1 Assistive technology 36% 84% 9%
2 Classes /school 33% 81% 8%
3 Vocational/careercounseling
47% 74% 12%
3 Training for a job 33% 74% 11%
5 Job referral 28% 62% 17%
6 Job coaching 29% 50% 6%
8
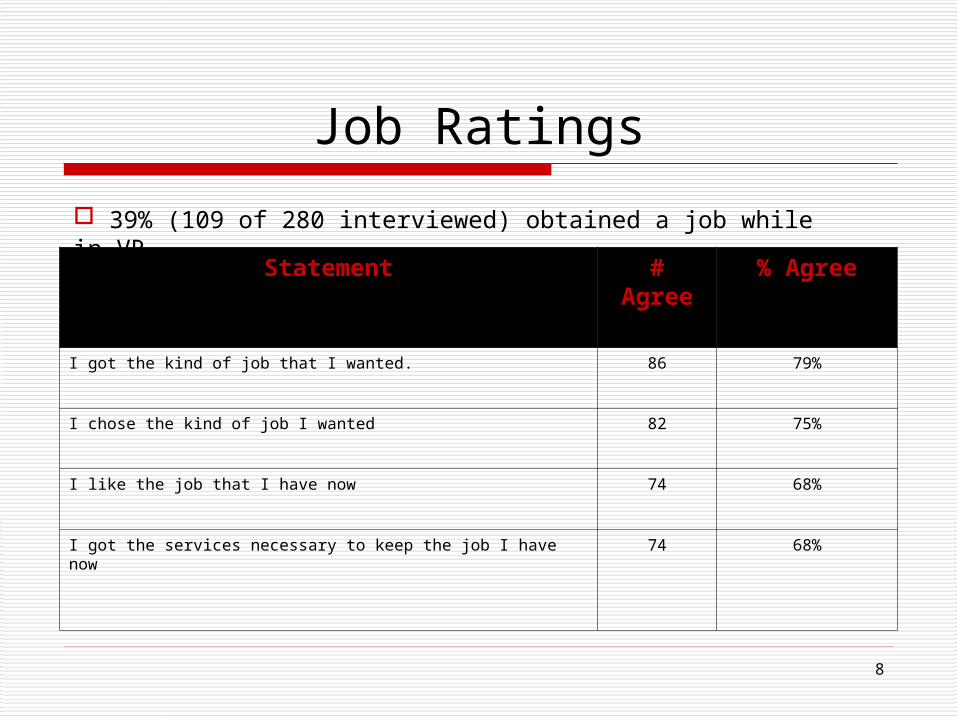
Job Ratings
39% (109 of 280 interviewed) obtained a job while in VR
Statement # Agree % Agree
I got the kind of job that I wanted. 86 79%
I chose the kind of job I wanted 82 75%
I like the job that I have now 74 68%
I got the services necessary to keep the job I have now 74 68%
9
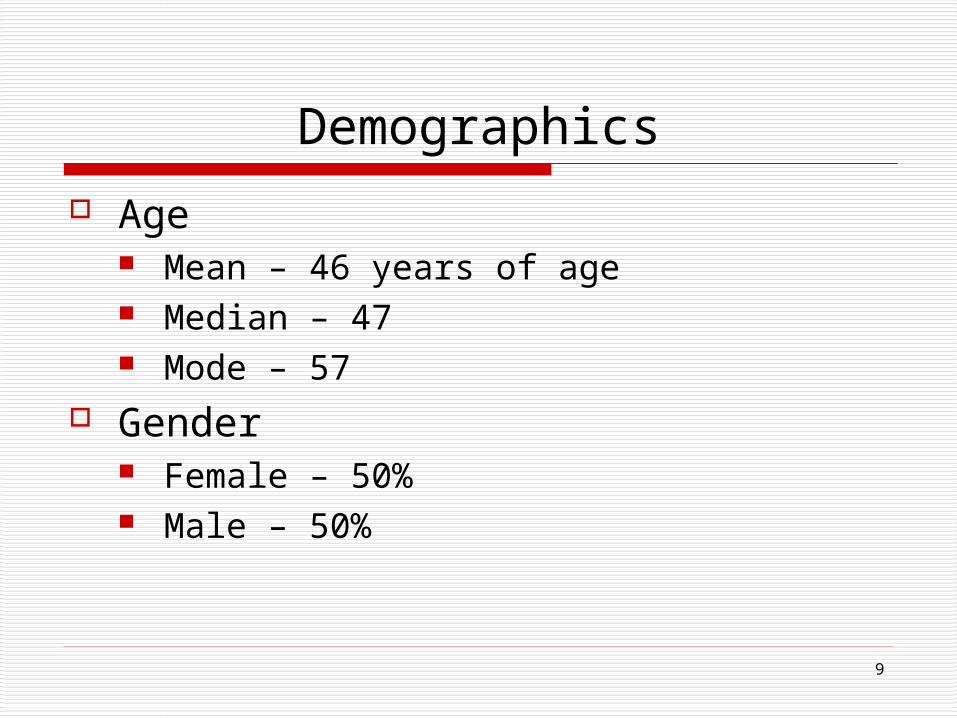
Demographics
Age Mean – 46 years of age Median – 47 Mode – 57
Gender Female – 50% Male – 50%
10
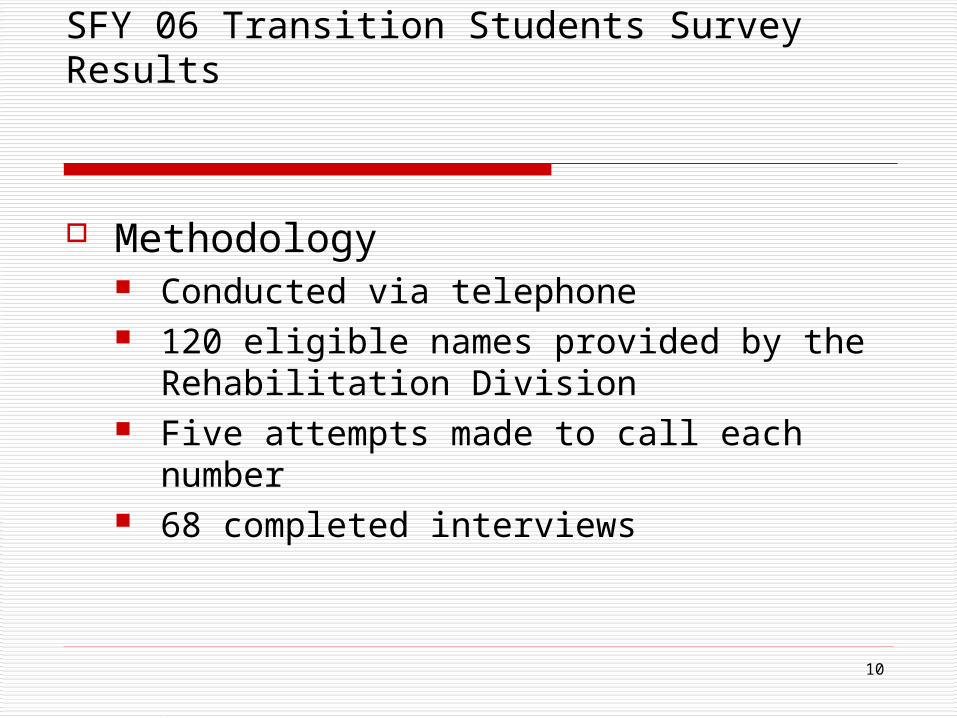
SFY 06 Transition Students Survey Results
Methodology Conducted via telephone 120 eligible names provided by the
Rehabilitation Division Five attempts made to call each number 68 completed interviews

11
Educational Opportunities
10%
18%
1%
6%
21%
3% 4%
0%
5%
10%
15%
20%
25%
OJT Voc RehabTraining
Job Corps Tech/TradeSchool
Jr College University Other
Educational Opportunities
63% of students (43 of 68) indicated that they received one or more “educational opportunities.”
12
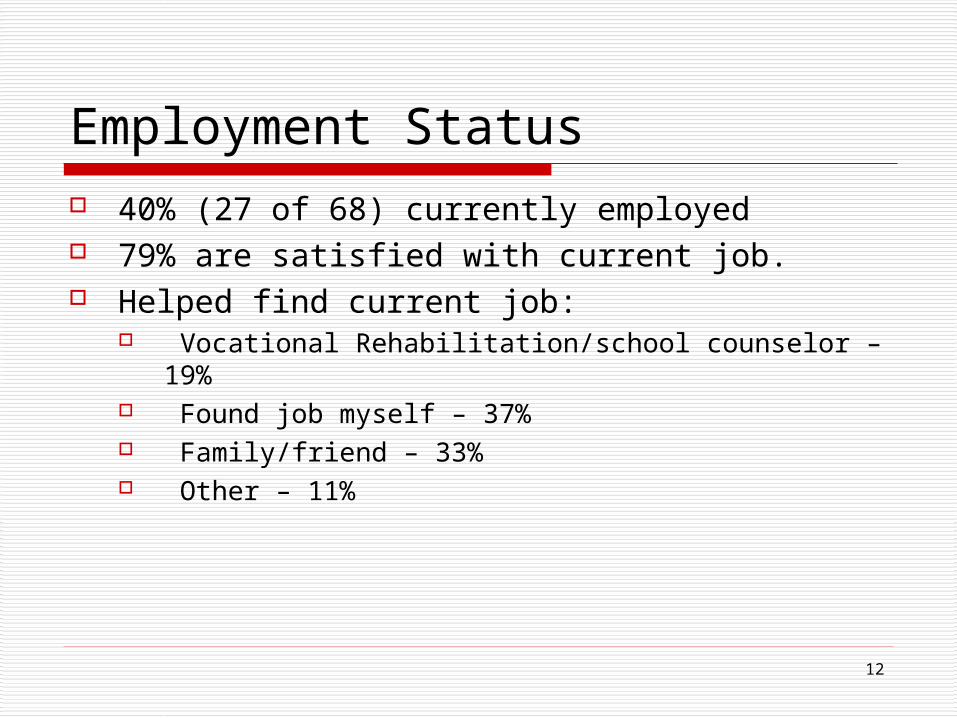
Employment Status 40% (27 of 68) currently employed 79% are satisfied with current job. Helped find current job:
Vocational Rehabilitation/school counselor – 19% Found job myself – 37% Family/friend – 33% Other – 11%
13
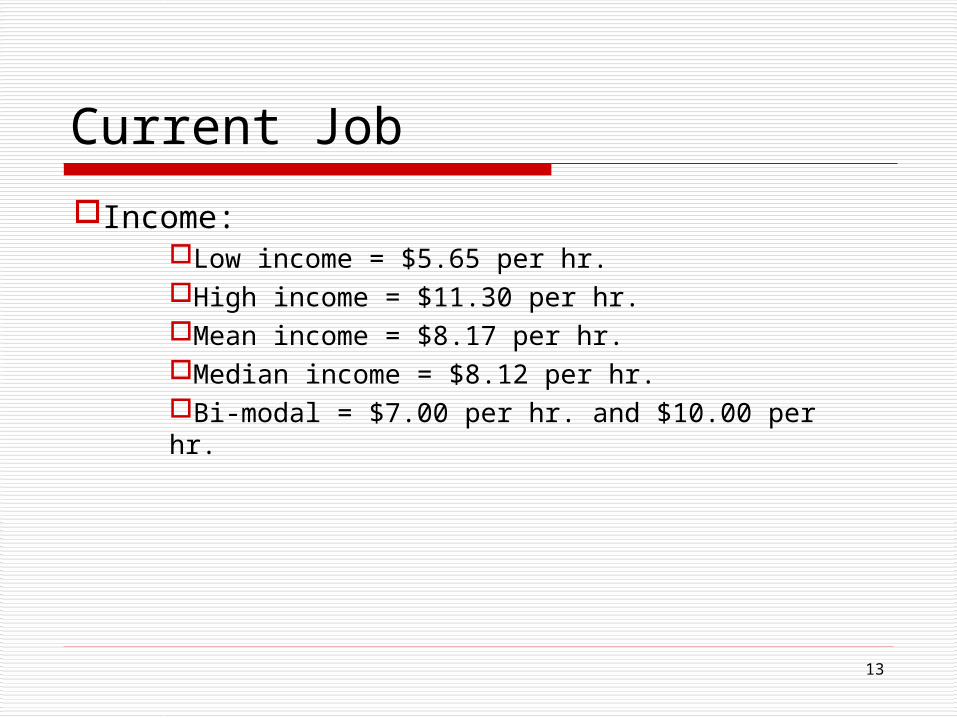
Current Job
Income:Low income = $5.65 per hr.High income = $11.30 per hr.Mean income = $8.17 per hr.Median income = $8.12 per hr.Bi-modal = $7.00 per hr. and $10.00 per hr.
14
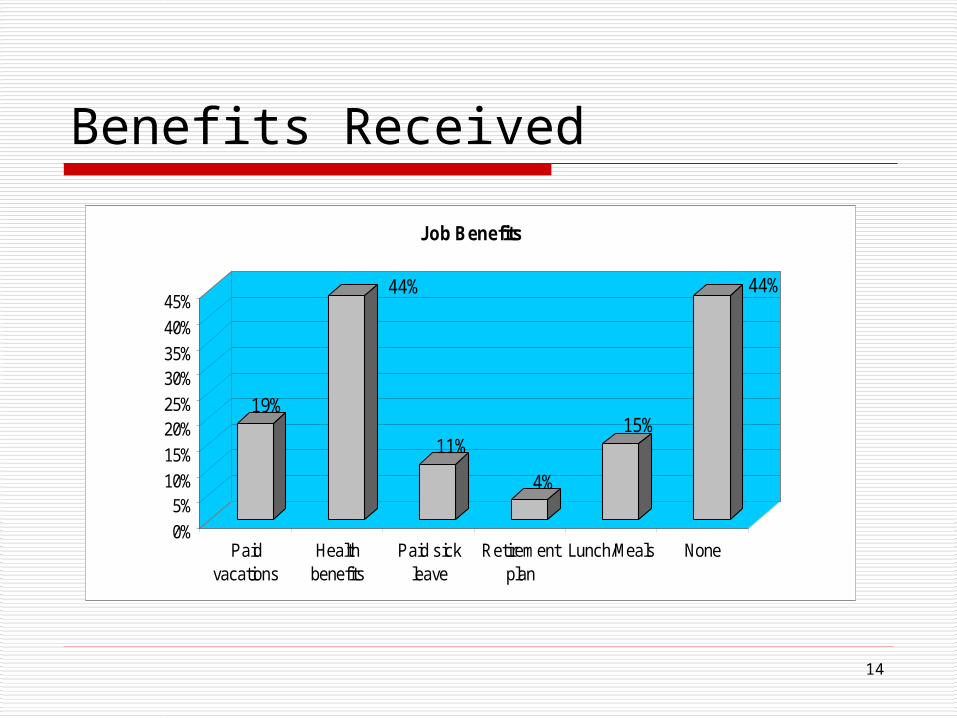
Benefits Received
19%
44%
11%
4%
15%
44%
0%
5%10%
15%
20%25%
30%35%
40%
45%
Paidvacations
Healthbenefits
Paid sickleave
Retirementplan
Lunch/Meals None
Job Benefits
15
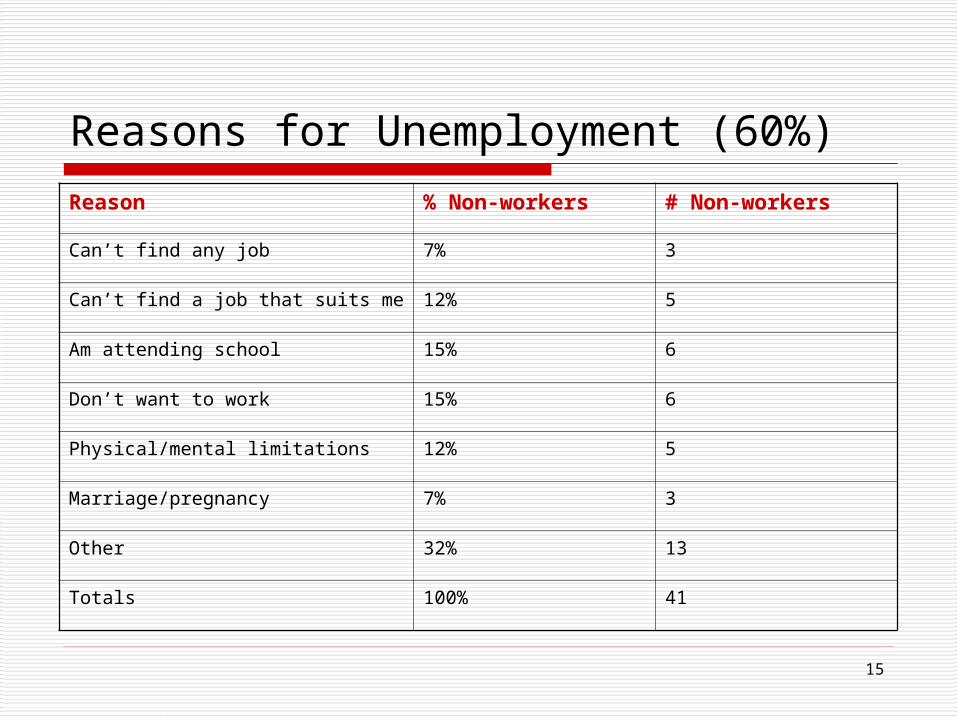
Reasons for Unemployment (60%)
Reason % Non-workers # Non-workers
Can’t find any job 7% 3
Can’t find a job that suits me 12% 5
Am attending school 15% 6
Don’t want to work 15% 6
Physical/mental limitations 12% 5
Marriage/pregnancy 7% 3
Other 32% 13
Totals 100% 41
16
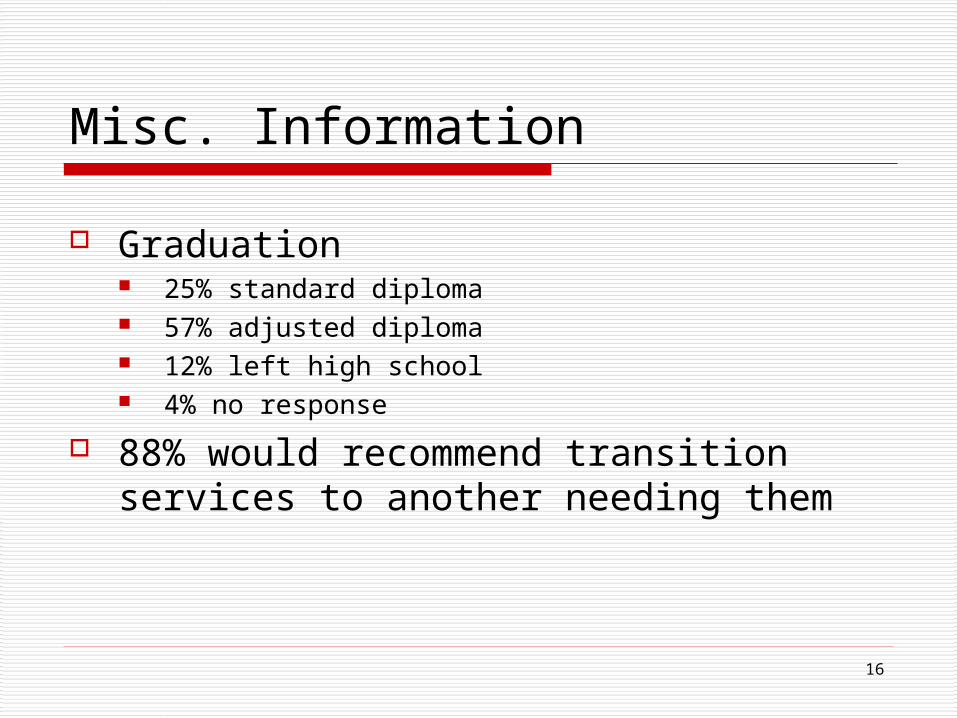
Misc. Information
Graduation 25% standard diploma 57% adjusted diploma 12% left high school 4% no response
88% would recommend transition services to another needing them

17
Where Learned About Transition Services
8%
27%
3%
21%
34%
7%
0%
5%
10%
15%
20%
25%
30%
35%
On myown
Parent(s) Friend Teacher Schoolcounselor
Other
Where Learned about Transition Services
18
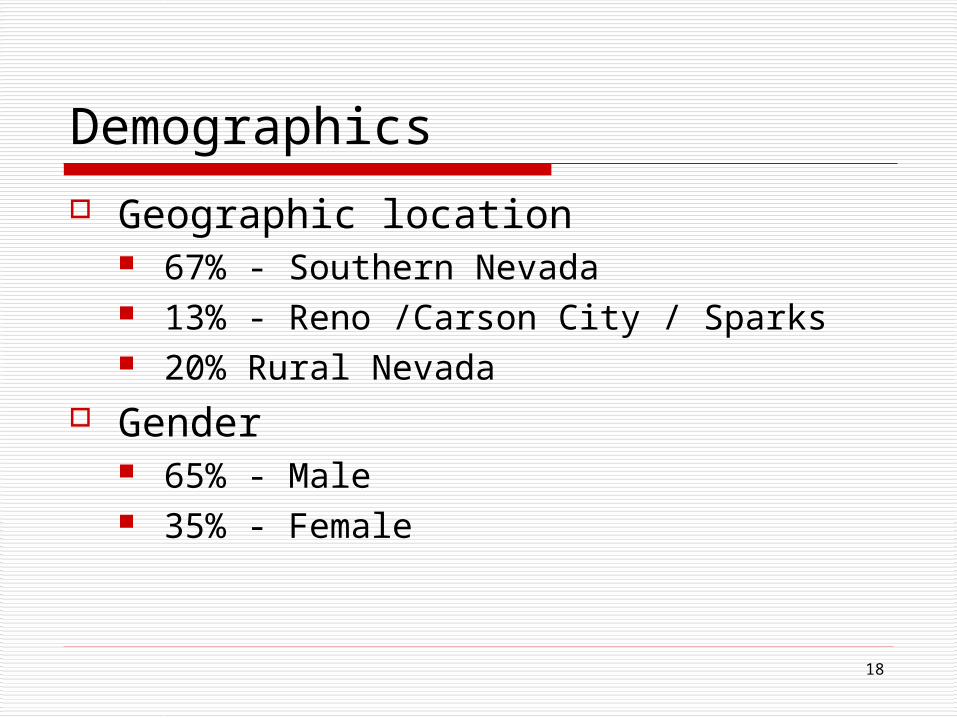
Demographics
Geographic location 67% - Southern Nevada 13% - Reno /Carson City / Sparks 20% Rural Nevada
Gender 65% - Male 35% - Female
19
SFY 06 Employer Survey Results Conducted via telephone – random list of Nevada
businesses Five attempts were made to each number 293 interviews completed, five partial interviews Area
58% from Southern Nevada/Las Vegas 28% from Reno/Sparks 14% from other communities
20
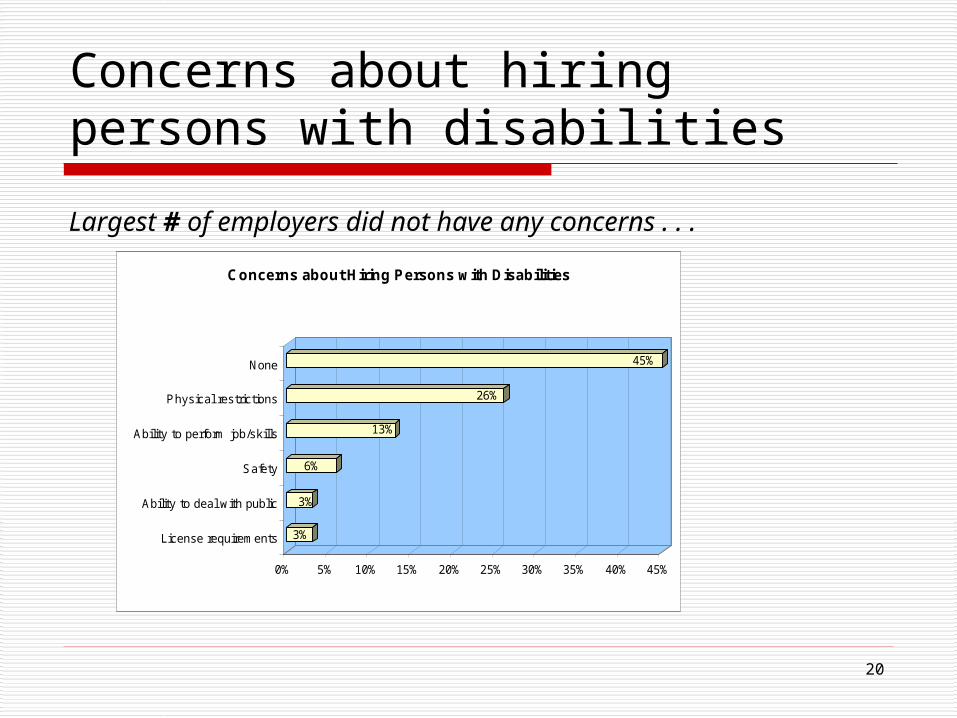
Concerns about hiring persons with disabilities
Largest # of employers did not have any concerns . . .
3%
3%
6%
13%
26%
45%
0% 5% 10% 15% 20% 25% 30% 35% 40% 45%
License requirements
Ability to deal with public
Safety
Ability to perform job/skills
Physical restrictions
None
Concerns about Hiring Persons with Disabilities
21
About the Employers Employers had:
Mean – 38 total employees Median – 12 total employees
3,498 job openings in the past year Mean – 12 available jobs Median – 4 available jobs
Employed persons with disabilities past two years 22% gave a yes response 66% were not aware 12% did not know
22
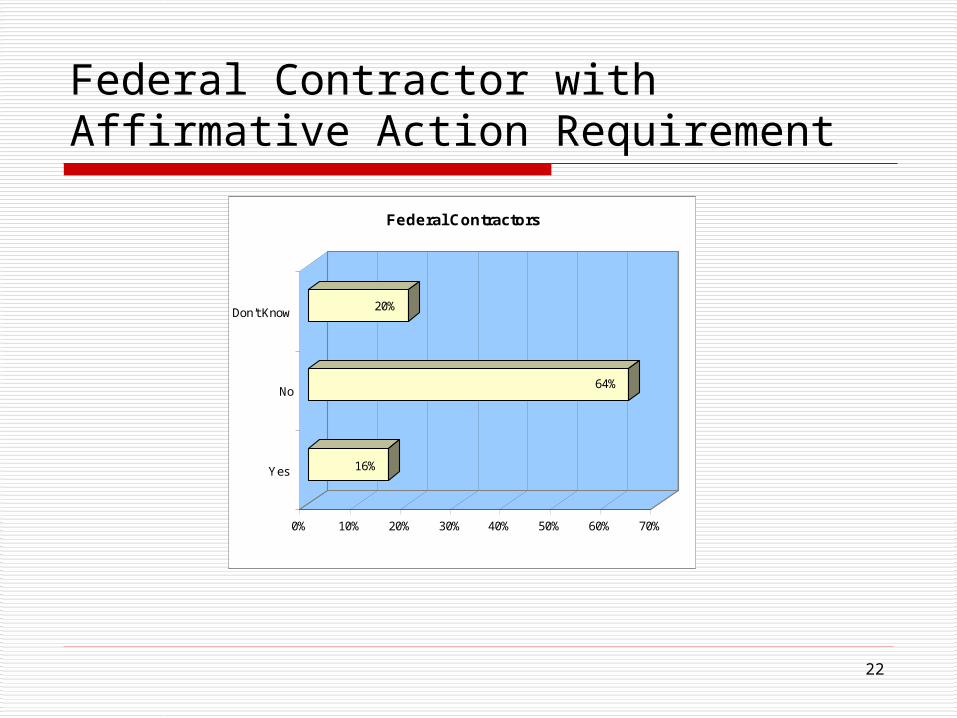
Federal Contractor with Affirmative Action Requirement
16%
64%
20%
0% 10% 20% 30% 40% 50% 60% 70%
Yes
No
Don't Know
Federal Contractors
23
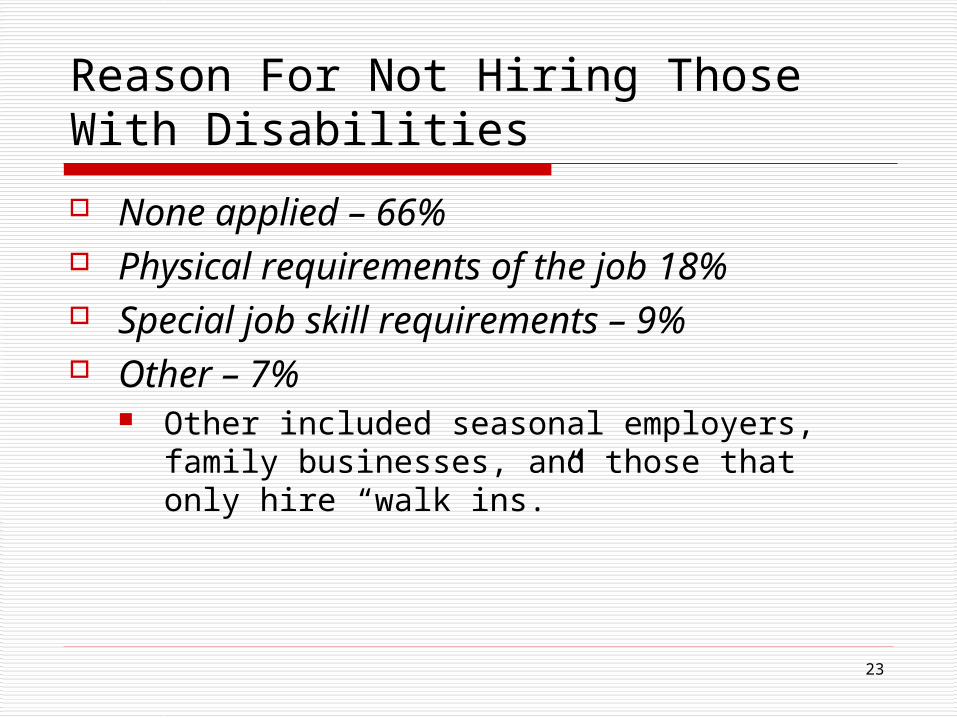
Reason For Not Hiring Those With Disabilities
None applied – 66% Physical requirements of the job 18% Special job skill requirements – 9% Other – 7%
Other included seasonal employers, family businesses, and those that only hire “walk ins.”
24
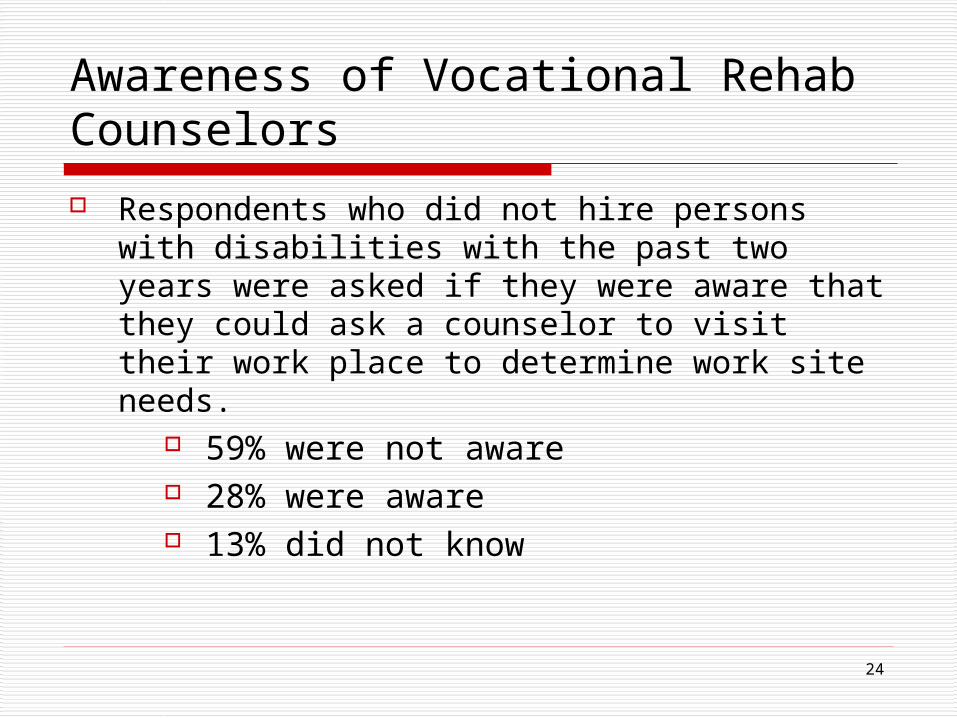
Awareness of Vocational Rehab Counselors
Respondents who did not hire persons with disabilities with the past two years were asked if they were aware that they could ask a counselor to visit their work place to determine work site needs.
59% were not aware 28% were aware 13% did not know
25
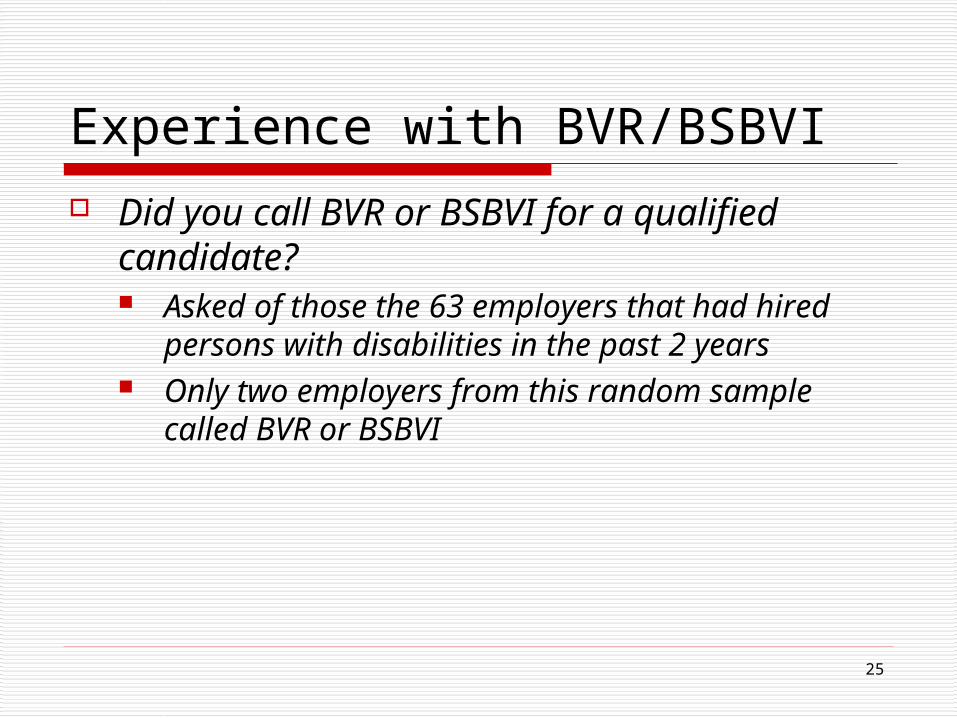
Experience with BVR/BSBVI Did you call BVR or BSBVI for a qualified
candidate? Asked of those the 63 employers that had
hired persons with disabilities in the past 2 years
Only two employers from this random sample called BVR or BSBVI

26
Experience with BVR/BSBVI Why didn’t you call?
14% 1%
7%
5%
3% 3%
40%
27%
0% 5% 10% 15% 20% 25% 30% 35% 40%
Other
Was contacted by counselor
Didn't think to do so
Have "in-house" hiring procedures
Use Job Connect
Job restrictions
No need to call
Use newspaper ads
Reasons for Not Contacting BVR or BSBVI