deutsche bank – q3 2017 results · pdf filedeutsche bank – q3 2017 results 26...
TRANSCRIPT
Deutsche Bank
Deutsche Bank – Q3 2017 Results
26 October 2017

Q3 2017 Results 26 October 2017
Deutsche BankInvestor Relations
Highlights
2
Continued discipline on costs and credit support profitability, despite challenging revenue environment
Significant progress on strategic initiatives
Ongoing progress in resolution of regulatory enforcement actions and litigation matters
Strong capital and liquidity profile provides foundation to support clients

Q3 2017 Results 26 October 2017
Deutsche BankInvestor Relations
3
€ bn, unless otherwise statedGroup financial summary
Q3 2017 Q3 2016 Q3 2017 vs.Q3 2016 9M 2017 9M 2016 9M 2017 vs.
9M 2016
Profit & Loss
Net revenues 6.8 7.5 (10)% 20.7 22.9 (10)%
Provision for credit losses (0.2) (0.3) (44)% (0.4) (0.9) (56)%
Noninterest expenses (5.7) (6.5) (14)% (17.7) (20.5) (13)%
of which : Adjusted costs (5.5) (5.9) (6)% (17.5) (18.6) (6)%
Income before income taxes 0.9 0.6 51% 2.6 1.6 64%
Net income / loss 0.6 0.3 133% 1.7 0.5 n.m.
MetricsRoTE (1) 4.5% 2.0% 2.6 ppt 4.1% 1.2% 2.8 ppt
Cost / income ratio 84% 87% (4)ppt 85% 89% (4)ppt
Q3 2017 Q3 2016 Q3 2017 vs.Q3 2016 Q2 2017 Q3 2017 vs.
Q2 2017
Resources (2)
Tangible book value per share (in €) 27.18 33.50 (19)% 27.24 (0)%
CET1 ratio (CRR/CRD4, fully loaded) (3) 13.8% 11.1% 2.7 ppt 14.1% (0.3)ppt
Leverage ratio (fully loaded) (3) 3.8% 3.5% 0.3 ppt 3.8% (0.0) ppt
Note: Figures may not sum due to rounding differences(1) Post-tax return on average tangible shareholders' equity(2) Figures as of period end(3) Q2 2017 pro-forma CET1 capital ratio and leverage ratio including € 8bn gross proceeds from the capital raise completed in early April (reported CET1 and leverage ratio at 11.8% and
3.2% respectively). See the Q2 2017 interim report for further details

Q3 2017 Results 26 October 2017
Deutsche BankInvestor Relations
Noninterest expenses€ bn
4
Note: Figures may not sum up due to rounding differences(1) Total noninterest expenses excluding restructuring and severance, litigation, impairment of goodwill and other intangibles and policyholder benefits and claims(2) To exclude the FX effects the prior year figures were recalculated using the corresponding current year's monthly FX rates
0.10.0
Q3 2016ex FX(2)
6.4
5.75.9
0.10.50.1
0.10.5 0.1
Q3 2016
6.5Impairments
/ PolicyholderBenefits and Claims
Q3 2017
5.7
5.5
0.0
(11)% / € (0.7)
AdjustedCosts(1)
Restructuring andSeverance
Litigation0.10.0
Q2 2017
5.7
5.6
0.1
0.10.1
0.10.1 0.0
0.10.0
0.0
9M 20179M 2016
20.5
18.6
0.60.8
(12)% € (2.5)
20.2
18.3
0.60.80.50.5
17.7
17.5
0.1 0.10.0
9M 2016 ex FX(2)
0.10.0
0.0

Q3 2017 Results 26 October 2017
Deutsche BankInvestor Relations
Adjusted costs(1)€ m
5
Note: Figures may not sum up due to rounding differences(1) Total noninterest expense excluding restructuring and severance, litigation, impairment of goodwill and other intangibles and policyholder benefits and claims(2) To exclude the FX effects the prior year figures were recalculated using the corresponding current year's monthly FX rates. Q3 2016 adjusted costs as reported were € 5,852m;
9M 2016 adjusted costs as reported were € 18,552m(3) Does not include severance (Q3 2017: € 18m; Q3 2016 ex FX: € 29m; 9M 2017: 92m; 9M 2016 ex FX: 130m)(4) Includes deposit protection guarantee schemes (Q3 2017: € 57m; Q3 2016 ex FX: € 70m; 9M 2017: 181m; 9M 2016 ex FX: 189m)(5) Internal full time equivalents at period end
Q3 2017 Q3 2016ex FX(2) YoY 9M 2017 9M 2016
ex FX(2) YoY
Compensation andbenefits(3) 2,788 2,797 (0)% 8,783 8,827 (1)%
IT costs 938 907 3% 2,799 2,784 1%
Professional service fees 410 494 (17)% 1,260 1,592 (21)%
Occupancy 447 473 (6)% 1,345 1,380 (3)%
Bank levy(4) 81 75 7% 766 722 6%
Other 849 954 (11)% 2,538 3,003 (15)%
Adjusted costs 5,513 5,701 (3)% 17,489 18,309 (4)%
Headcount(5) 96,817 101,115 (4)% 96,817 101,115 (4)%
— Compensation and benefits costs flat withreduced salary expense offset by highercurrent year accruals for variable compensation
— IT costs up 3%. Depreciation for self developedsoftware increased YoY while cost for externalIT support trended downwards
— Professional service fees down 17% driven bylower legal fees and reduced businessconsulting cost
— Occupancy cost down 6% mainly due to one-time items in Q3 2016
— Other costs were down 11% mainly due to the wind down of NCOU in 2016
— Headcount reduced by 4,288 over the past twelve months
Key facts Q3 2017 vs Q3 2016 FX

Q3 2017 Results 26 October 2017
Deutsche BankInvestor Relations
Common Equity Tier 1 Capital and Risk-weighted assets (RWA)CRD4, fully loaded unless otherwise stated
6
Note: Figures may not sum due to rounding differences(1) Q2 2017 pro-forma Common Equity Tier 1 (CET1), including € 8bn gross proceeds from the capital raise completed in early April(2) € (0.5)bn other, including € (0.2)bn higher deductions from DTA, € (0.1)bn actuarial losses and pensions and € (0.1)bn higher deductions from intangible assets(3) Dividend amount based on ECB guidance on recognition of interim profits in CET1 capital, i.e. assuming a 100% payout ratio
— Q3 2017 CET1 capital down by € (0.6)bn on an FX-neutral basis including € (0.1)bn equity compensation impact and € (0.5)bn Other(2)
— No recognition of net income in CET1 due to dividend and AT1 coupon deduction based on CRR/ECB guidance(3)
— Q3 2017 RWA flat on a quarterly basis; excluding FX, RWA increased by € 3bn, of which € 2bn came from higher operational risk RWA, a result of qualitative adjustments and adverse loss development
CET1, € bn
FX effect
(0.4)
30 Jun 2017(1)
50.1
30 Sep 2017
49.1
Other (2)
(0.5)
Equity Comp
(0.1)
Dividend & AT1
Coupon(3)
(0.6)
Net Income
0.6
CET1 ratio, phase-in
CET1 ratio, fully loaded
14.6%
13.8%14.1%
14.9%
RWA, € bn1
02355
AM
(0)
30 Sep 2017
C&APCBCIBFX effect
(3)
30 Jun 2017
355

Q3 2017 Results 26 October 2017
Deutsche BankInvestor Relations
30 Jun 2017 30 Sep 2017 QoQ
CIB 1,079 1,050 (29)PCB 346 342 (4)AM 3 3 0C&A 15 25 10Total 1,443 1,420 (22)
LeverageCRD4, fully loaded unless otherwise stated
7
— Leverage exposure down € 22bn, including FX effect of € (23)bn. FX neutral increase is € 1bn
— Cash reduction of € 19bn reflecting growth in assets and reduction in short term deposits
— Growth in SFT of € 13bn and non-derivative trading assets of € 4bn reflects client activity in the Markets business and Treasury collateral management
Leverage ratio, fully loaded
Leverage ratio, phase-in
3.8%
4.2%
Note: Figures may not sum due to rounding differences(1) Based on fully loaded pro-forma Tier 1 Capital of € 54.7bn, which includes € 4.6bn of Additional Tier 1 Capital(2) Q2 2017 leverage ratio pro-forma including € 8bn gross proceeds from the capital raise completed in early April (3) Pending settlements of € 67bn included in Q3 2017 leverage exposure
3.8%(1)
4.2%
Leverage exposure, € bn
(2)
(3)
30 Sep 2017
1,420
Other
3
Volume growth
17
Cash
(19)
FX effect
(23)
30 Jun 2017
1,443

Q3 2017 Results 26 October 2017
Deutsche BankInvestor Relations
8
Segment results

Q3 2017 Results 26 October 2017
Deutsche BankInvestor Relations
€ mCorporate & Investment Bank (CIB)
9
Note: Figures may not sum due to rounding differences(1) Fully loaded, in € bn(2) Post-tax return on average allocated tangible shareholders' equity
Income before income taxes Financial overview
361543
706
(433)
969
460709
9M
1,610
9M
2,138
Q3Q2Q1Q4Q3Q2Q1
2016 2017 2016 2017
Q3 2017 IBIT decreased 63% YoY driven by lower revenues in a weak market environment, partly offset by lower noninterest expenses and lower credit loss provisionsQ3 2017 revenues were down 23% YoY compared to a strong prior year quarterProvisions for credit losses were down 55% YoY due to continued broad-based improvement in credit performance Noninterest expenses declined 10% YoY mainly driven by lower litigation provisions. Adjusted costs were essentially flat YoYRWA decreased 2% YoY reflecting de-risking and FX movements, partially offset by higher operational risk RWA and the impact of the NCOU asset transfers
Q3 2017 Q3 2016 YoY 9M 20179M 2016 YoY
Net revenues 3,468 4,532 (23)% 11,494 13,493 (15)%
Prov. for credit losses (94) (208) (55)% (207) (513) (60)%
Noninterest expenses (3,011) (3,333) (10)% (9,653)(10,795) (11)%
Adjusted costs (2,908) (2,924) (1)% (9,508) (9,734) (2)%
IBIT 361 969 (63)% 1,610 2,138 (25)%
RWA (1) 242 246 (2)% 242 246 (2)%
CIR 87% 74% 13 ppt 84% 80% 4 ppt
RoTE (2) 2.3% 6.8% (5)ppt 3.5% 4.9% (1)ppt
DVA202 (11) 47 (212) (219) (104) (7) 239 (329)
Restructuring and severance(186) (109) (66) (31) (61) (79) (10) (360) (151)
Litigation68 (141) (342) (192) 27 78 (93) (416) 12
Impairments- (285) 0 - - (6) 0 (285) (6)

Q3 2017 Results 26 October 2017
Deutsche BankInvestor Relations
€ mCIB business unit revenues and YoY drivers
10
Revenues Q3 2017 YoY revenue drivers
974975
9M
(14)%
2,990
9M
3,335
Q3Q2Q1
1,041
Q4
1,085
Q3
1,130
Q2
1,104
Q1
1,101
2016 2017 2016 2017
475563
657556621606
509
(24)%
9M
1,695
9M
1,736
Q3Q2Q1Q4Q3Q2Q1
Global Transaction Banking
Origination & Advisory2016 2017 2016 2017
Note: Figures may not sum due to rounding differences
Cash Management revenues were lower as a result of strategic perimeter adjustments
Trade revenues were lower due to lower volumes and continued margin pressure
Trust, Agency and Securities Services revenues were essentially flat with strong performance in the US supported by interest rate increases partly offset by lower revenues in APAC
Debt Origination revenues were significantly lower with lower market volumes across Leveraged loans and IG bonds versus a very active prior year quarter
Equity origination revenues were significantly lower, partly due to lower market volumes
Advisory revenues were lower versus a strong Q3 2016

Q3 2017 Results 26 October 2017
Deutsche BankInvestor Relations
€ m
11
Revenues Q3 2017 YoY revenue drivers
610547551621583586585
5%
9M
1,709
9M
1,754
Q3Q2Q1Q4Q3Q2Q1
2016 2017 2016 2017
988775
(36)%
9M
3,826
9M
4,311
Q3Q2
1,129
Q1
1,709
Q4Q3
1,540
Q2
1,286
Q1
1,486
Financing
FIC S&T
Equity S&T
525537691444
622742763
Q1Q4Q3Q2Q1 9M
1,7532,127
Q3Q2
(16)%
9M
Note: Figures may not sum due to rounding differences
CIB business unit revenues and YoY drivers (cont’d)
Revenue growth driven by Asset-Based Lending and Commercial Real Estate
Steady balance sheet deployment
Credit revenues were significantly lower due to a less active environment and less favorable trading conditions
Rates revenues were lower compared to a very strong Q3 2016 as low volatility impacted client volumes
FX revenues were lower versus a strong prior year which benefited from post-Brexit client flow
Emerging Markets revenues were significantly lower and FX and Rates revenues in Asia Pacific were lower with continued low volatility impacting client flow across both businesses
Prime Finance revenues were lower due to lower margins and lower average balances during the quarter
Cash Equity revenues were significantly higher, driven by the impact of an asset sale and stronger results in the US
Equity Derivatives revenues were significantly lower due to lower client activity and lower market volatility

Q3 2017 Results 26 October 2017
Deutsche BankInvestor Relations
€ mPrivate & Commercial Bank (PCB)
12
Income before income taxes Financial overview
739
332310399
700
187
367
185
Q2Q1 Q2Q1Q4Q3
1,041
9M9MQ3
2016 2017 2016 2017
Note: Figures may not sum due to rounding differences(1) In € bn(2) Post-tax return on average allocated tangible shareholders' equity
Q3 2017 IBIT up 78% YoY driven by stable operating performance with continued progress on costs, supported by portfolio measuresRevenues increased from asset sales and a successful workout of Sal. Oppenheim legacy positions, which more than offset the absence of PCS revenues. Excluding these items, revenues were flat YoY as the impact of low interest rates was mitigated by higher fee incomeNoninterest expenses declined 2% and adjusted cost declined 4% as investments in digital and regulatory initiatives and higher performance related compensation were more than offset by the absence of PCS costs and other cost initiativesPCC Germany and Postbank completed their standalone restructuring programmes, including previously announced branch closures
Q3 2017 Q3 2016 YoY 9M 20179M 2016 YoY
Net revenues 2,602 2,520 3% 7,865 7,885 (0)%
Prov. for credit losses (90) (102) (12)% (190) (281) (32)%
Noninterest expenses (2,179) (2,231) (2)% (6,634) (6,865) (3)%
Adjusted costs (2,170) (2,249) (4)% (6,608) (6,679) (1)%
IBIT 332 187 78% 1,041 739 41%
Invested assets (1) 505 514 (2)% 505 514 (2)%
CIR 84% 89% (5)ppt 84% 87% (3)ppt
RoTE (2) 6.8% 3.9% 3 ppt 7.3% 5.4% 2 ppt
Restructuring and severance(71) (70) 15 (78) 36 (10) 3 (126) 29
Litigation(8) (55) 4 3 3 (48) (11) (59) (56)
Hua Xia Bank IBIT(124) 5 (21) 756 - - - (141) -
Memo: Private Client Services (PCS) revenues48 48 81 (16) 18 2 (0) 177 20

Q3 2017 Results 26 October 2017
Deutsche BankInvestor Relations
€ mPCB business unit revenues and YoY drivers
13
Revenues Q3 2017 YoY revenue drivers
1,299
Q4
1,229
Q3
1,265
Q2
1,367
Q1
1,365
7%
9M
3,954
9M
3,997
Q3
1,348
Q2
1,307
Q1
824726771824779903861
6%
9M
2,322
9M
2,542
Q3Q2Q1Q4Q3Q2Q1
Private & Commercial Clients(1) (PCC)
Postbank
Wealth Management
429526
634396497490498
1,589
9M 9M
(14)%
Q1 Q2
1,485
Q3Q4Q3Q2Q1
Note: Figures may not sum due to rounding differences (1) Excludes revenues from Hua Xia Bank: Q1 2016 € (124)m, Q2 2016 € 6m, Q3 2016 € (20)m, Q4 2016 € 756m and 9M 2016 € (138)m
Revenues up 7% driven by a € 95m gain from the sale of shares in Concardis GmbH (Germany-based payment service provider). Excluding this gain, revenues essentially flat versus prior yearImpact of low interest rate environment on deposit revenues mitigated by higher fee income from investment products
Revenues up 6% versus prior year. Both periods included valuation impacts and gains from portfolio measures (including a gain of € 13m from the sale of shares in Concardis GmbH in Q3 2017)Excluding these items, revenues up 2% versus prior year. Significant growth in fee income of € 60m (mainly in current accounts and investment products) partially offset by € 41m lower net interest income (lower deposit revenues in part mitigated by loan growth)
Revenues down 14% driven by impacts related to the sale of the PCS unit in Q3 2016, in part compensated by positive impacts from the continued workout of legacy positions in Sal. Oppenheim. Also contributing to the decline were impacts from FX translation and lower net interest income due to selective loan sales in the U.S. and a lower deposit baseContinued good growth momentum in Germany and Asia Pacific
2016 2017 2016 2017

Q3 2017 Results 26 October 2017
Deutsche BankInvestor Relations
€ mDeutsche Asset Management
14
Income before income taxes Financial overview
195234
181215
170161
9M
610
9M
547
Q3Q2Q1Q4
(753)
Q3Q2Q1
2016 2017 2016 2017
1,021
Q3 2017 IBIT down 9% YoY, as Q3 2016 benefited from € 28m net Abbey Life gross-up Revenues flat YoY (ex. Abbey Life gross-up) due to a one-off recovery related to a real-estate fund, offset by non-recurring Abbey Life revenues and lower performance and transaction feesNoninterest expenses (ex. Abbey Life gross-up) in line with prior year driven by Abbey Life disposal in Q4 2016 and lower restructuring costs. Compensation costs slightly higher on normalizing variable compensationNet new asset inflows of € 4bn mainly driven by liquidity product inflows in the Americas and Germany
Note: Figures may not sum to rounding differences(1) Net revenues ex mark to market movements on policyholder positions in Abbey Life. Reported revenues: Q3 2017 € 628m, Q3 2016 € 821m, 9M 2017 € 1,911m, and 9M 2016 € 2,216m(2) Noninterest expenses ex policyholder positions in Abbey Life. Reported noninterest expenses: Q3 2017 € (433)m, Q3 2016 € (606)m, 9M 2017 € (1,300)m and 9M 2016 €(1,669)m(3) In € bn(4) Cost income ratio (CIR) is calculated based on net revenues ex Abbey Life gross-up and noninterest expenses ex Abbey Life gross-up(5) Post-tax return on average allocated tangible shareholders' equity
Q3 2017 Q3 2016 YoY 9M 2017 9M 2016 YoY
Net revenues ex Abbey Life gross-up (1) 628 627 0% 1,911 1,908 0%
Noninterest expenses ex Abbey Life gross-up (2) (433) (439) (1)% (1,300) (1,384) (6)%
Adjusted costs (432) (430) 0% (1,291) (1,316) (2)%IBIT 195 215 (9)% 610 547 11%Invested assets (3) 711 715 (1)% 711 715 (1)%Net new money (3) 4 (8) n.m. 14 (29) n.m.CIR (4) 69% 70% (1)ppt 68% 73% (4)pptRoTE (5) 49.3% 52.7% (3)ppt 53.9% 44.0% 10 ppt
Restructuring and severance(23) (34) (9) (2) (4) (4) 0 (67) (8)
Impairments- - - (1,021) - - - - -

Q3 2017 Results 26 October 2017
Deutsche BankInvestor Relations
€ mConsolidation & Adjustments (C&A)
15
Income before income taxes Financial overview
(627)
(116)
44
(265)
(407)(425)
(215)
4257
Q2Q1 9M9MQ3Q2Q1Q4Q32016 2017 2016 2017
Note: Figures may not sum due to rounding differences(1) Valuation and Timing (V&T) reflects the mismatch in revenue from instruments accounted on a non mark-to-market basis under IFRS that are economically hedged with derivatives that
are accounted for on a mark-to-market basis. In addition, it includes own credit risk related valuation effects of the group’s own debt measured at fair value(2) CTA: Currency translation adjustment
Q3 2017 income of € 44m:Includes € 186m from V&T differences mainly driven by cumulative amortisation income related to Group cash flow hedging programmesCTA realisation loss of € 14m mainly due to the liquidation of a UK entityTreasury funding and liquidity loss of € 21m represent the residual costs after allocation to the businessesRemaining includes the taxable equivalent gross-up on municipal bond holdings of € 25m, litigation costs of € 34m and interest on corporate income tax liabilities of € 22m
Litigation(5) 72 0 (49) (0) (4) (34) 67 (38)
Q3 2017 Q3 2016 YoY 9M 20179M 2016 YoY
IBIT 44 (215) n.m. (627) (116) n.m.
of which :
V&T differences(1) 186 (153) n.m. (4) 90 n.m.CTA realisation(2) / loss on sale (14) 9 n.m. (182) (1) n.m.
Funding and liquidity (21) 6 n.m. (117) 6 n.m.
Remaining (107) (76) 40% (325) (211) 54%

Q3 2017 Results 26 October 2017
Deutsche BankInvestor Relations
Outlook 2017
16
Activity in capital markets remained muted in October although underlying economic fundamentals are strong
Litigation remains difficult to forecast but expect higher cost in Q4
Continued focus on cost management while maintaining investment in controls and revenue growth initiatives
Restructuring charge likely in Q4 principally driven by PCB reorganization, but within prior annual guidance
Q3 2017 Results 26 October 2017
Deutsche BankInvestor Relations
17
Appendix

Q3 2017 Results 26 October 2017
Deutsche BankInvestor Relations
Appendix: Table of Contents
18
26P&L details
36CRD4 – Leverage Exposure and Risk Weighted Assets
37Loan book
38Impaired loans
39Value-at-Risk
Invested assets 40
Headcount 42

Q3 2017 Results 26 October 2017
Deutsche BankInvestor Relations
Profit & Loss€ m
19
Q3 2016 Q3 2016ex FX(1)
Q3 2017 Q3 2017 vs.
Q3 2016
Q3 2017 vs.
Q3 2016ex FX(1)
9M 2016 9M 2016 ex FX(1)
9M 2017 9M 2017 vs.
9M 2016
9M 2017 vs.
9M 2016ex FX(1)
Net revenues 7,493 7,313 6,776 (9.6)% (7.3)% 22,946 22,899 20,738 (9.6)% (9.4)%
Provision for credit losses (327) (323) (184) (43.8)% (43.2)% (891) (887) (396) (55.6)% (55.4)%
Noninterest expenses (6,547) (6,377) (5,660) (13.6)% (11.3)% (20,450) (20,168) (17,708) (13.4)% (12.2)%
of which: Adjusted costs(2) (5,852) (5,701) (5,513) (5.8)% (3.3)% (18,552) (18,309) (17,489) (5.7)% (4.5)%
Income before income tax 619 613 933 50.8% 52.3% 1,606 1,843 2,633 64.0% 42.9%
Note: Figures may not sum up due to rounding differences(1) To exclude the FX effects the prior year figures were recalculated using the corresponding current year's monthly FX rates(2) Total noninterest expenses excluding restructuring and severance, litigation, impairment of goodwill and other intangibles and policyholder benefits and claims

Q3 2017 Results 26 October 2017
Deutsche BankInvestor Relations
€ mReported and adjusted costs
20
Compensation and benefits (in €bn)Noninterest expenses excl. compensation and benefits (in €bn)
Note: Adjusted costs is a non-GAAP financial measure most directly comparable to the IFRS financial measure noninterest expenses. Adjusted costs is calculated by adjusting noninterest expenses under IFRS for the excluded items mentioned above. Figures may not sum due to rounding differences
Adjusted costs 6,668 6,032 5,852 6,181 6,336 5,641 5,513 18,552 17,489excludes:
Impairment of goodwill & intangibles - 285 (49) 1,021 - 6 (0) 236 6Litigation 187 120 501 1,588 (31) (26) 140 809 82Policyholder benefits and claims 44 74 167 88 0 (0) 0 285 0Restructuring and severance 285 207 76 114 29 95 7 568 131
Cost / income ratio (reported) 89% 91% 87% 127% 86% 86% 84% 89% 85%Compensation ratio (reported) 40% 40% 39% 40% 43% 44% 41% 39% 43%
9M
8.9
8.8
9M
20.5
11.4
9.0
Q3
5.7
2.9
2.8
Q2
5.7
2.8
2.9
Q1
6.3
17.7
3.1
Q4
9.0
6.2
2.8
Q3
6.5
3.7
2.9
Q2
6.7
3.8
3.0
Q1
7.2
4.0
3.2
3.2
2016 2017 2016 2017

Q3 2017 Results 26 October 2017
Deutsche BankInvestor Relations
Litigation update€ bn
21
Litigation reserves(1) Contingent liabilities(1)
Decrease due to settlement payments for major cases as well as releases for lower than expected settlements and F/X effects partially offset by builds for other cases
— Further progress in resolving legacy matters, including:— F/X: Settlement reached in US Antitrust Civil Litigation— IBOR: Settlement reached with the Working Group of US
State Attorneys General
€ 0.5bn of the reserves reflect already achieved settlements or settlements-in-principle
Includes possible obligations where an estimate can be made and outflow is more than remote but less than probable for significant mattersDecrease mainly driven by reclassifications to reserves and corresponding cancellations of contingent liabilities
2.52.3
30 Jun 2017 30 Sep 2017
1.8 1.6
30 Jun 2017 30 Sep 2017
(1) Includes civil litigations and regulatory enforcement matters

Q3 2017 Results 26 October 2017
Deutsche BankInvestor Relations
Provision for credit losses€ m
22
2017
Note: Figures may not sum due to rounding differences. Provisions for credit losses in the Consolidation & Adjustments and Deutsche Asset Management segments are not shown on this chart but are included in the DB Group totals
(1) Year-to-date provision for credit losses annualized as a % of total loan book
2016
150 155208
303
94
78 101
102
158
78
5657
90
31
750.11%
0.13%
Q2
2279
Q3
184
133
Q1
0.26%0.28%
Q2
5259
0.33%
Q3
17327
0.13%
Q4
492
304
Q1
0.28%
Cost of risk DB Group(1) Non-Core Operations Unit PCB CIB
0.39% 0.39% 0.44% 0.56%
0.12% 0.13% 0.14% 0.17%
0.16% 0.17% 0.21%
0.10%0.12% 0.08%
Cost of risk CIB(1)
Cost of risk PCB(1)

Q3 2017 Results 26 October 2017
Deutsche BankInvestor Relations
Net Interest Income sensitivityHypothetical +100bps parallel shift impact by business line and major currency, € bn
Note: All estimates are based on a static balance sheet, excluding trading positions & Deutsche AM, and at constant exchange rates. The parallel yield curve shift by +100 basis pointsassumes an immediate increase of all interest rate tenors and no additional management action. Short term is calculated based on applying the shock only to tenors up to andincluding 3 months. The delta NII shown is the difference between projected NII in the scenario with shifted rates vs unchanged rates. Figures do not include MtM/OCI effects oncentrally managed positions not eligible for hedge accounting
EUR
USD
> 3M
1.3
0.9
0.4
0.60.7
3M 3M> 3M
1.5
0.9
0.6
0.70.8
0.2
0.0
3M> 3M
0.2
0.1
0.1
0.3
0.2
0.10.2
3M> 3M
0.1
PCB CIB Group
0.7 0.8 1.5
23
PCB CIB Group
0.9 0.9 1.8
First year Second year
Total (EUR + USD)
Q3 2017 Results 26 October 2017
Deutsche BankInvestor Relations
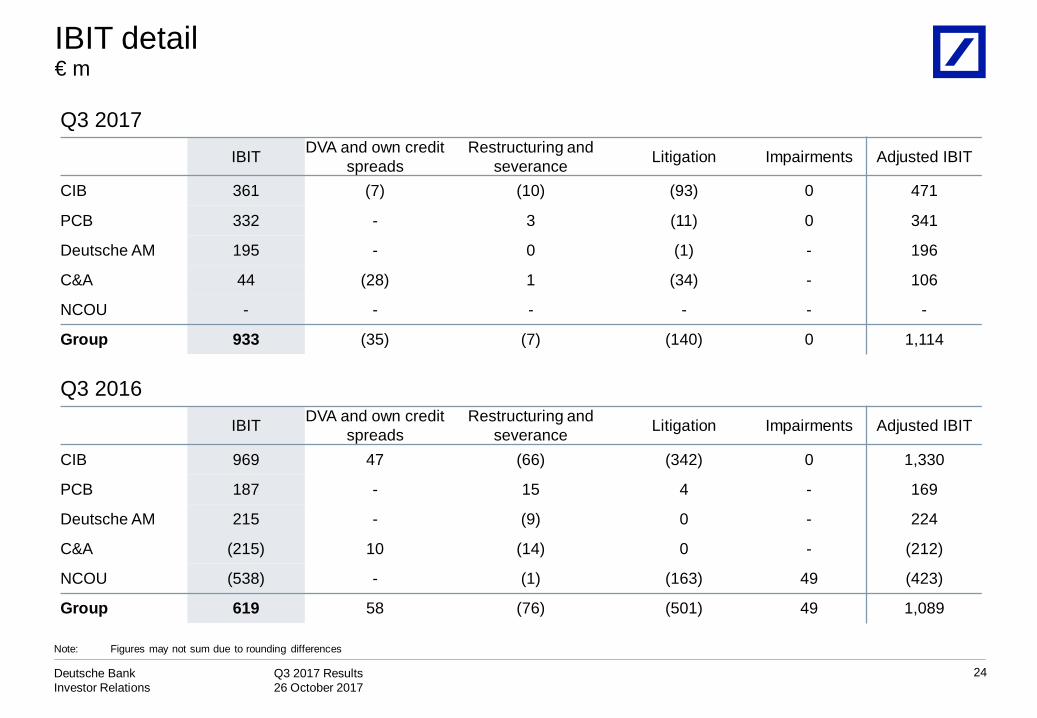
€ mIBIT detail
24
Note: Figures may not sum due to rounding differences
Q3 2017IBIT DVA and own credit
spreadsRestructuring and
severance Litigation Impairments Adjusted IBIT
CIB 361 (7) (10) (93) 0 471
PCB 332 - 3 (11) 0 341
Deutsche AM 195 - 0 (1) - 196
C&A 44 (28) 1 (34) - 106
NCOU - - - - - -
Group 933 (35) (7) (140) 0 1,114
Q3 2016IBIT DVA and own credit
spreadsRestructuring and
severance Litigation Impairments Adjusted IBIT
CIB 969 47 (66) (342) 0 1,330
PCB 187 - 15 4 - 169
Deutsche AM 215 - (9) 0 - 224
C&A (215) 10 (14) 0 - (212)
NCOU (538) - (1) (163) 49 (423)
Group 619 58 (76) (501) 49 1,089

Q3 2017 Results 26 October 2017
Deutsche BankInvestor Relations
€ mIBIT detail
25
Note: Figures may not sum due to rounding differences
9M 2017IBIT DVA and own credit
spreadsRestructuring and
severance Litigation Impairments Adjusted IBIT
CIB 1,610 (329) (151) 12 (6) 2,084
PCB 1,041 - 30 (56) 0 1,067
Deutsche AM 610 - (8) (1) - 619
C&A (627) (218) (2) (38) - (369)
NCOU - - - - - -
Group 2,633 (548) (131) (82) (6) 3,400
9M 2016IBIT DVA and own credit
spreadsRestructuring and
severance Litigation Impairments Adjusted IBIT
CIB 2,138 239 (360) (416) (285) 2,961
PCB 739 - (126) (59) - 925
Deutsche AM 547 - (67) (1) - 614
C&A (116) 152 (6) 67 - (329)
NCOU (1,703) - (9) (401) 49 (1,343)
Group 1,606 391 (568) (809) (236) 2,828

Q3 2017 Results 26 October 2017
Deutsche BankInvestor Relations
Leverage exposure and RWACRD4, fully loaded, € bn
Leverage Exposure vs. RWA(1)
250
6464
Note: Figures may not sum due to rounding differences(1) RWA excludes operational risk RWA of € 99.6bn(2) Excludes any related market risk RWA which has been fully allocated to non-derivatives trading assets(3) Lending commitments and contingent liabilities
26
Credit Risk RWA
CVA
Market Risk RWA
30 Sep 2017
255
213
7
36
Other
Off B/S(3)
Cash and depositswith banks
Reverse repo /securitiesborrowed
Lending
Derivatives(2)
Non-derivativetrading assets
30 Sep 2017
255
38
2607
30 Jun 2017
1,442
188
96
234
148
394
198
185
114
31
40
30 Sep 2017
1,420
187
93
212
157
389
197
185
CRD4 – Leverage Exposure RWA

Q3 2017 Results 26 October 2017
Deutsche BankInvestor Relations
27
Loan book€ bn
Note: Loan amounts are gross of allowances for loan losses. Figures may not sum due to rounding differences
2016 2017
104 105 105 105
43 44 43 40
119 119 120 119
154 158 154 145
NCOU
PB
WM
PCC
CIB
31-Dec
413
3
30-Sep
428
5
30-Jun
433
6
31-Mar
429
8
105 106 108
40 39 37
121 121 121
147 137 134
30-Jun
403414
31-Mar 30-Sep
400

Q3 2017 Results 26 October 2017
Deutsche BankInvestor Relations
Impaired loans(1)Period-end, € bn
28
2016 2017
61% 61% 61% 61%
Q1
6.9
2.9
4.0
Q3
6.7
2.8
3.8
Q2
6.7
2.8
3.8
7.40.8
Q3
7.5
2.8
Q4
7.4
3.0
3.6
1.1
2.6
3.5
1.3
Q1
3.6
7.6
2.4
3.6
1.6
Q2
CIBPCBNon-Core Operations Unit
64% 64% 62% 63%
58% 61% 61% 61%
62% 59% 61%
62%
60%
63% 60%
61% 59%
Cov. Ratio Group(3)
Cov. Ratio CIB
Cov. Ratio PCB
x.x%
1.7% 1.8% 1.8% 1.7% 1.7% 1.7%
Impaired loan ratio Deutsche Bank Group(2)
1.8%
Note: Figures may not sum due to rounding differences(1) IFRS impaired loans include loans which are individually impaired under IFRS, i.e. for which a specific loan loss allowance has been established, as well as loans collectively assessed
for impairment which have been put on nonaccrual status(2) Impaired loans in % of total loan book(3) Total on-balance sheet allowances divided by IFRS impaired loans (excluding collateral); total on-balance sheet allowances include allowances for all loans individually impaired or
collectively assessed
Q3 2017 Results 26 October 2017
Deutsche BankInvestor Relations
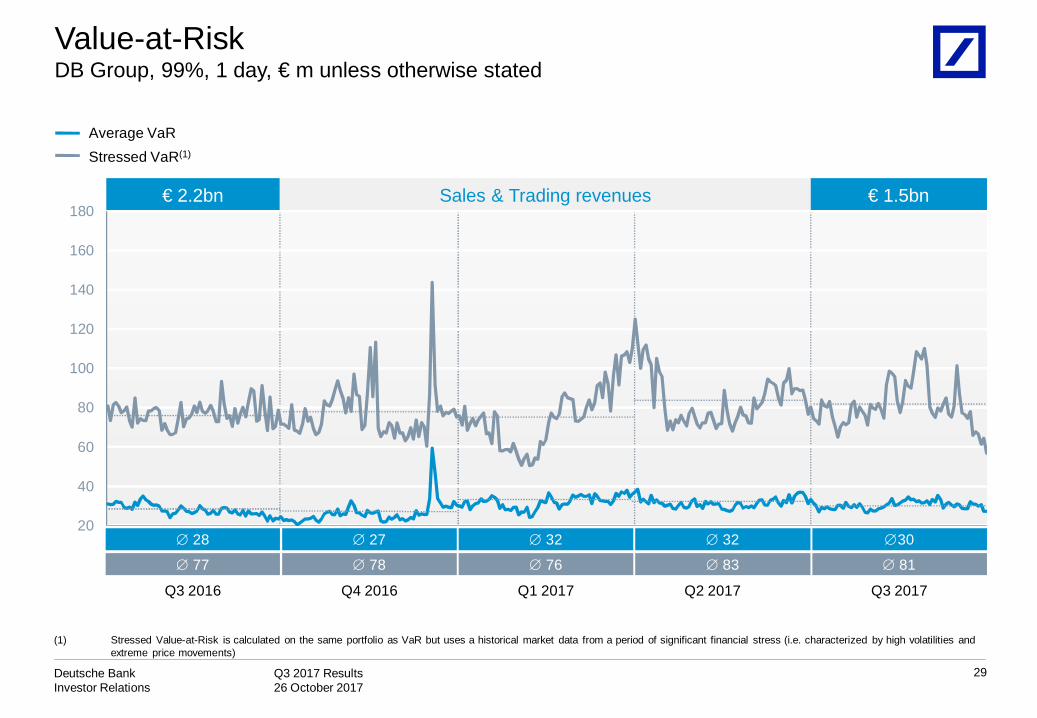
Sales & Trading revenues€ 2.2bn € 1.5bn
Value-at-RiskDB Group, 99%, 1 day, € m unless otherwise stated
29
(1) Stressed Value-at-Risk is calculated on the same portfolio as VaR but uses a historical market data from a period of significant financial stress (i.e. characterized by high volatilities and extreme price movements)
Average VaRStressed VaR(1)
Q3 2016 Q3 2017
28 27
77 78
30
81
Q4 2016
32
76
Q1 2017 Q2 2017
32
83
20
40
60
80
100
120
140
160
180
Q3 2017 Results 26 October 2017
Deutsche BankInvestor Relations
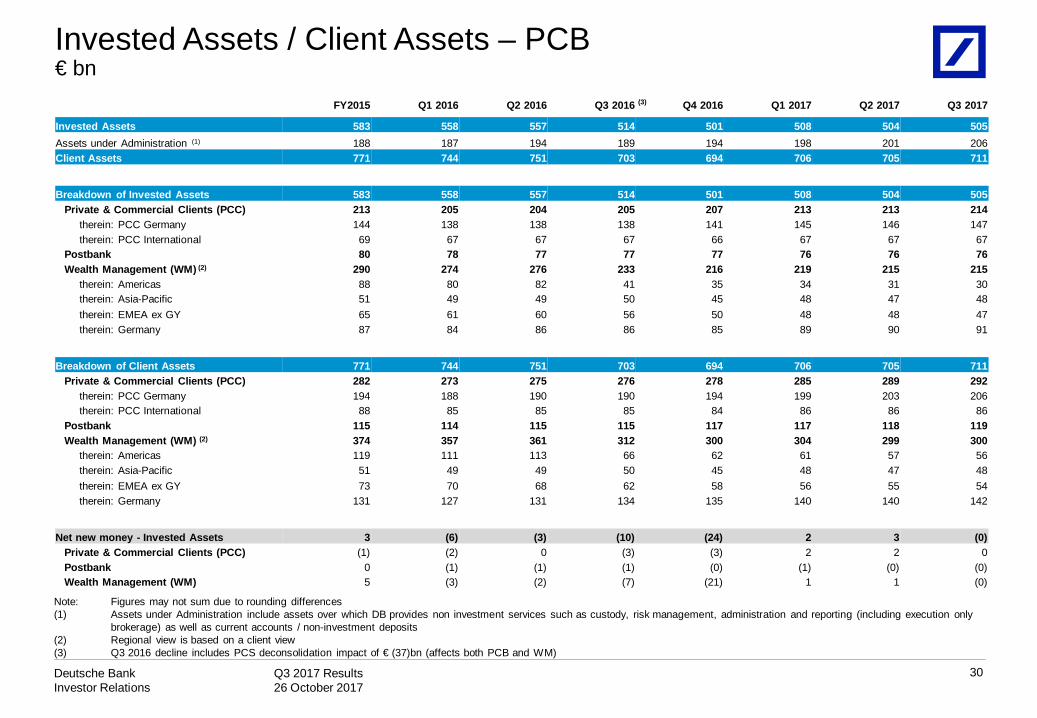
Invested Assets / Client Assets – PCB€ bn
Note: Figures may not sum due to rounding differences(1) Assets under Administration include assets over which DB provides non investment services such as custody, risk management, administration and reporting (including execution only
brokerage) as well as current accounts / non-investment deposits(2) Regional view is based on a client view(3) Q3 2016 decline includes PCS deconsolidation impact of € (37)bn (affects both PCB and WM)
30
FY2015 Q1 2016 Q2 2016 Q3 2016 (3) Q4 2016 Q1 2017 Q2 2017 Q3 2017
Invested Assets 583 558 557 514 501 508 504 505Assets under Administration (1) 188 187 194 189 194 198 201 206Client Assets 771 744 751 703 694 706 705 711
Breakdown of Invested Assets 583 558 557 514 501 508 504 505Private & Commercial Clients (PCC) 213 205 204 205 207 213 213 214
therein: PCC Germany 144 138 138 138 141 145 146 147therein: PCC International 69 67 67 67 66 67 67 67
Postbank 80 78 77 77 77 76 76 76Wealth Management (WM) (2) 290 274 276 233 216 219 215 215
therein: Americas 88 80 82 41 35 34 31 30therein: Asia-Pacific 51 49 49 50 45 48 47 48therein: EMEA ex GY 65 61 60 56 50 48 48 47therein: Germany 87 84 86 86 85 89 90 91
Breakdown of Client Assets 771 744 751 703 694 706 705 711Private & Commercial Clients (PCC) 282 273 275 276 278 285 289 292
therein: PCC Germany 194 188 190 190 194 199 203 206therein: PCC International 88 85 85 85 84 86 86 86
Postbank 115 114 115 115 117 117 118 119Wealth Management (WM) (2) 374 357 361 312 300 304 299 300
therein: Americas 119 111 113 66 62 61 57 56therein: Asia-Pacific 51 49 49 50 45 48 47 48therein: EMEA ex GY 73 70 68 62 58 56 55 54therein: Germany 131 127 131 134 135 140 140 142
Net new money - Invested Assets 3 (6) (3) (10) (24) 2 3 (0)Private & Commercial Clients (PCC) (1) (2) 0 (3) (3) 2 2 0Postbank 0 (1) (1) (1) (0) (1) (0) (0)Wealth Management (WM) 5 (3) (2) (7) (21) 1 1 (0)

Q3 2017 Results 26 October 2017
Deutsche BankInvestor Relations
Invested Assets / Client Assets – AM€ bn
31
Note: Figures may not sum due to rounding differences(1) Assets under Administration include assets over which DB provides non-investment services such as custody, risk management, administration and reporting
Q4 2016 decline includesAbbey Life
deconsolidation impact
FY 2015 Q1 2016 Q2 2016 Q3 2016 Q4 2016 Q1 2017 Q2 2017 Q3 2017Invested Assets 744 711 719 715 706 723 711 711Assets under Administration (1) 54 57 63 65 68 67 62 59Client Assets 798 768 782 780 774 790 772 770
Breakdown of Invested Assets 744 711 719 715 706 723 711 711Regional
therein: Americas 233 215 216 205 210 212 197 195therein: Asia-Pacific 42 38 41 42 38 41 39 38therein: EMEA ex GY 195 189 188 188 179 184 180 181therein: Germany 274 270 274 279 279 286 295 297
Client Viewtherein: Retail 333 301 312 310 316 327 320 321therein: Institutional 411 410 408 404 390 396 391 390
Net New Money - Invested Assets 18 (12) (9) (8) (13) 5 6 4Regional
therein: Americas (1) (10) (6) (8) (7) 2 (4) 2therein: Asia-Pacific 1 0 0 1 (0) 2 0 0therein: EMEA ex GY 9 (3) (3) (2) (5) 1 1 (1)therein: Germany 8 2 (0) (0) (1) (0) 9 2
Client Viewtherein: Retail 32 (6) (8) (6) (8) 3 3 (0)therein: Institutional (14) (6) (1) (2) (4) 2 2 4

Q3 2017 Results 26 October 2017
Deutsche BankInvestor Relations
Full-time equivalents, at period endGroup headcount
32
30 Sep 2016 31 Dec 2016 31 Mar 2017 30 Jun 2017 30 Sep 201730 Sep 2017
vs.30 Jun 2017
CIB 17,264 17,140 16,713 16,294 16,812 517
PCB 45,908 45,045 44,651 44,130 43,671 (459)
Deutsche AM 3,909 3,888 3,823 3,799 3,842 42
NCOU 117 116 - - - -
Infrastructure 33,916 33,555 32,989 32,427 32,492 65
Total 101,115 99,744 98,177 96,652 96,817 165

Q3 2017 Results 26 October 2017
Deutsche BankInvestor Relations
This presentation contains forward-looking statements. Forward-looking statements are statements that are not historicalfacts; they include statements about our beliefs and expectations and the assumptions underlying them. Thesestatements are based on plans, estimates and projections as they are currently available to the management of DeutscheBank. Forward-looking statements therefore speak only as of the date they are made, and we undertake no obligation toupdate publicly any of them in light of new information or future events.
By their very nature, forward-looking statements involve risks and uncertainties. A number of important factors couldtherefore cause actual results to differ materially from those contained in any forward-looking statement. Such factorsinclude the conditions in the financial markets in Germany, in Europe, in the United States and elsewhere from which wederive a substantial portion of our revenues and in which we hold a substantial portion of our assets, the development ofasset prices and market volatility, potential defaults of borrowers or trading counterparties, the implementation of ourstrategic initiatives, the reliability of our risk management policies, procedures and methods, and other risks referenced inour filings with the U.S. Securities and Exchange Commission. Such factors are described in detail in our SEC Form20-F of 20 March 2017 under the heading “Risk Factors.” Copies of this document are readily available upon request orcan be downloaded from www.db.com/ir.
This presentation also contains non-IFRS financial measures. For a reconciliation to directly comparable figures reportedunder IFRS, to the extent such reconciliation is not provided in this presentation, refer to the Q3 2017 Financial DataSupplement, which is accompanying this presentation and available at www.db.com/ir.
33
Cautionary statements