developing a macro-segmentation model at industry level
TRANSCRIPT

Journal of Money and Economy
Vol. 10, No.4 Fall 2015
Developing a Macro-segmentation
Model at Industry Level: Iranian
Banking Industry
Hosseini Kashkouyieh , Seyyed Mahmoud
Asadi, Gholam Hossein
Hamidizadeh, Mohammad Reza
and Moqaddasi Mohammad
Received: 8/1/2016 Approved: 1/17/2017
Abstract
Drastic changes and turbulence in macro-economic factors have the greatest impact on banks
target market attractiveness in Iran. It is assumed that conventional segmentation models at
the corporate level are not efficient for banking system. This study aims to develop a new
segmentation model at the industry level for banks of Iran. For this purpose, structures and
variables at the industry level were identified and defined by reviewing the literature and with
the help of bank experts in focus group sessions. Then, data of ISIC 3-digit factories with 50
and more employees were extracted from Iran Statistic Center and Tehran Stock Exchange
databases during 2005-2013. We used Hierarchical Cluster analysis in each year and identified
4 study groups across 9 years. We found that identified groups are significantly different
regarding industry size, deposit and loan market size, industry growth, deposit
and loan market growth, profitability, investment risk, and transaction with other industries.
Keywords: Macro-segmentation, Manufacturing Industries, Segmentation based on industries,
Hierarchical Clustering, Banking.
JEL Classification: E44, G21, L60, M31, C67, C82
Assistant Professor of Business Administration-Shahid Beheshti University, Faculty of
Management-Department of Business Administration. Associate Professor of Accounting, Shahid Beheshti University, Faculty of Management-
Department of Business Administration. Professor of Business Administration, Shahid Beheshti University, Faculty of
Management, Department of Business Administration. Ph.D. candidate of Marketing Management at Shahid Beheshti University (Corresponding
Author);Email: [email protected]

96 Money and Economy, Vol. 10, No. 4, Fall 2015
1. Introduction
The economy of Iran has experienced severe shocks and turbulences in recent
years resulting in a change in macroeconomic factors including oil production,
sale and price, exchange rate fluctuations, money supply, inflation rate,
economic growth rate, unemployment, etc. Manifold fluctuations and severe
turbulence of macroeconomic factors in the bank-oriented economy of Iran
have affected the competition pattern and market attractiveness of banks in
utilization and allocation of resources in the short run. This has been followed
by precipitate, temporal decision-making by managers considering only their
own judgment and intuition. Economy of Iran is experiencing a recession
which urges the banks, as main players, to pursue an expansionary policy to
support stagnant manufacturing industries and invest in job-creating sections
in order to fulfill Resistance Economy policies.
Macro-segmentation is one of the strategies by which managers are able
to react to changes of circumstances promptly. The intermediary nature of
banking industry allows unrelated industries to connect to each other. The
volatility of money and high velocity of banking products and services
circulation make the segmentation models and variables in banking industry
completely different from other businesses. Segmentation based on industries
(SBI) helps bank managers to better understand the structure of the economy,
identify larger and more stable groups with the same behavioral patterns,
thus redefine organizational strategies and respond to environmental
uncertainty quickly.
Considering the size and pace of changes in the economy of Iran, industry
segmentation is far more necessary than corporate segmentation. In other
words, if significant different groups are identified in industries, this study
will be able to present a new approach in SBI which is particularly useful in
banking. By considering the importance of this study for the economy and
conductors of banking and monetary markets, this study aims to answer the
following questions:
What is the SBI model for banks? What structures and variables does it
include? Based on the identified model, what are the groups and their
members? What are the dominant characteristics of these groups? How has
the behavior of the groups and their members changed during the time? What
are the effective measures and strategies of banks in case of choosing each
group as the target market?

Developing a Macro-segmention Model … 97
2. Literature Review and Theoretical Foundations
Segmentation was first indirectly mentioned in a textbook of industrial and
business marketing by Fredrick (1934). Studying the details of this concept in
papers by researchers did not start until the 1950s and 1960s. Market
segmentation and modeling as fundamental concepts in marketing have
always been the center of attention. Different approaches have been proposed
thus far, each encompassing different assumptions. Table 1 shows the
evolution of these approaches and the place of this study in each approach.
From 2000 onwards, scholars have developed normative and pragmatic
models by criticizing subjective ones. An example of the mentioned criticism
can be found in Webster (1978): “Most of the conducted researches in this
area of study are limited to descriptive studies including repetitive studies of
old subjects. Most of these studies have a small sample and simple
assumptions and do not reflect the real complexity of the world of businesses.”
SBI can be related to business segmentation; the latter is more
sophisticated than consumer market (Pol, 1994). Many logical and normative
models have been developed concerning this matter, as Danneels (1996) put
it: “Segmentation models are called normative as they have a prescriptive
nature meaning that these models suggest specific policies in the
marketplace”. Although several segmentation models have been proposed,
they rarely, if ever, have been implemented (Wind, 1978). Normative models
of market segmentation consist of a series of logical steps including the
Macro-Micro approach of Wind and Cardozo (1974), the Partial approach of
Green (1977), and nest hierarchical model of Shapiro and Bonoma (1985).
Despite the development in different normative models, Dibb and Simkin
(1994) believe that these models mostly deal with conceptual subjects. They
believe subjective models to be meaningless unless they are capable of being
used in the real world. While we need applicable plans, the destitution of
literature in segmentation especially in applying market segmentation plans,
is quite disappointing.
A review of the literature shows the gap between theory and practice in
market segmentation has been studied in a few studies (Danneels, 1996; Deeb
and Simkin, 1994; Jenkins and McDonald, 1994). However, a change of
stream toward practical studies is sensed in recent studies. These recent
researches are focused on market segmentation in the real world, not
98 Money and Economy, Vol. 10, No. 4, Fall 2015
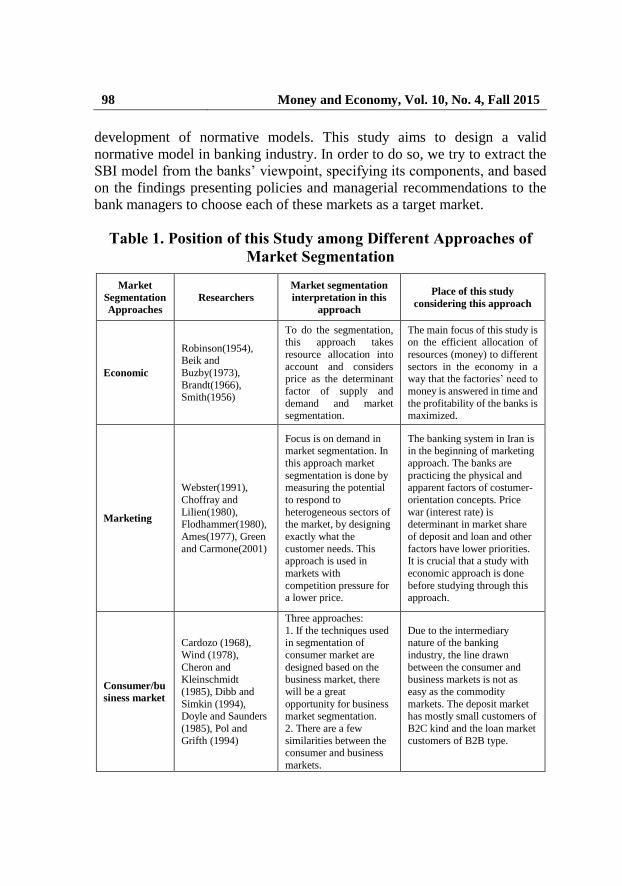
development of normative models. This study aims to design a valid
normative model in banking industry. In order to do so, we try to extract the
SBI model from the banks’ viewpoint, specifying its components, and based
on the findings presenting policies and managerial recommendations to the
bank managers to choose each of these markets as a target market.
Table 1. Position of this Study among Different Approaches of
Market Segmentation
Market
Segmentation
Approaches
Researchers
Market segmentation
interpretation in this
approach
Place of this study
considering this approach
Economic
Robinson(1954), Beik and
Buzby(1973),
Brandt(1966), Smith(1956)
To do the segmentation, this approach takes
resource allocation into
account and considers price as the determinant
factor of supply and
demand and market segmentation.
The main focus of this study is on the efficient allocation of
resources (money) to different
sectors in the economy in a way that the factories’ need to
money is answered in time and
the profitability of the banks is maximized.
Marketing
Webster(1991),
Choffray and
Lilien(1980), Flodhammer(1980),
Ames(1977), Green
and Carmone(2001)
Focus is on demand in market segmentation. In
this approach market
segmentation is done by measuring the potential
to respond to
heterogeneous sectors of the market, by designing
exactly what the
customer needs. This approach is used in
markets with
competition pressure for a lower price.
The banking system in Iran is in the beginning of marketing
approach. The banks are
practicing the physical and apparent factors of costumer-
orientation concepts. Price
war (interest rate) is determinant in market share
of deposit and loan and other
factors have lower priorities. It is crucial that a study with
economic approach is done
before studying through this approach.
Consumer/bu
siness market
Cardozo (1968),
Wind (1978),
Cheron and Kleinschmidt
(1985), Dibb and
Simkin (1994), Doyle and Saunders
(1985), Pol and
Grifth (1994)
Three approaches:
1. If the techniques used in segmentation of
consumer market are
designed based on the business market, there
will be a great
opportunity for business market segmentation.
2. There are a few
similarities between the consumer and business
markets.
Due to the intermediary nature of the banking
industry, the line drawn
between the consumer and business markets is not as
easy as the commodity
markets. The deposit market has mostly small customers of
B2C kind and the loan market
customers of B2B type.
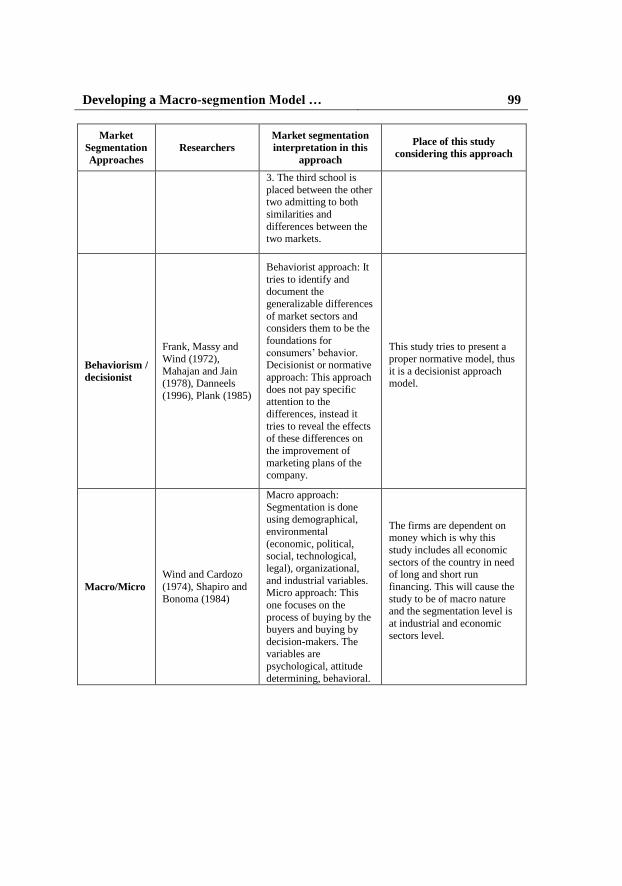
Developing a Macro-segmention Model … 99
Market
Segmentation
Approaches
Researchers
Market segmentation
interpretation in this
approach
Place of this study
considering this approach
3. The third school is
placed between the other two admitting to both
similarities and
differences between the two markets.
Behaviorism /
decisionist
Frank, Massy and
Wind (1972),
Mahajan and Jain (1978), Danneels
(1996), Plank (1985)
Behaviorist approach: It
tries to identify and document the
generalizable differences
of market sectors and considers them to be the
foundations for
consumers’ behavior. Decisionist or normative
approach: This approach
does not pay specific attention to the
differences, instead it
tries to reveal the effects of these differences on
the improvement of
marketing plans of the
company.
This study tries to present a
proper normative model, thus
it is a decisionist approach model.
Macro/Micro
Wind and Cardozo
(1974), Shapiro and
Bonoma (1984)
Macro approach:
Segmentation is done using demographical,
environmental
(economic, political, social, technological,
legal), organizational,
and industrial variables. Micro approach: This
one focuses on the
process of buying by the buyers and buying by
decision-makers. The variables are
psychological, attitude
determining, behavioral.
The firms are dependent on money which is why this
study includes all economic
sectors of the country in need of long and short run
financing. This will cause the
study to be of macro nature and the segmentation level is
at industrial and economic
sectors level.

100 Money and Economy, Vol. 10, No. 4, Fall 2015
Market
Segmentation
Approaches
Researchers
Market segmentation
interpretation in this
approach
Place of this study
considering this approach
Buyer’s-
Seller’s
interests
Whitlark (1986),
Mayers (1996), Riquier, Luxton and
Sharp (1997)
Buyers-oriented
approach: Analyzing process starts from the
customer and ends with
the seller.
Seller-oriented approach
(based on the availability
of the market for the sellers): The process
starts with the seller and
continues with the availability of the market
for the seller and its
identifiability of the different sectors.
Due to the following reasons the study is mostly seller-
oriented:
1.The dominance of financial and accounting thinking in
banking industry;
2.The generality of the need of money;
3.Unavailability of the
information at micro level; 4.The dominance of
productionism thinking in
practice; 5. The youthfulness of the
costumer-orientation thinking
in Iran banking industry; 6. Unavailability of
comprehensive studies in the
field of business segmentation based on real data and
econometric methodology, in
Iran and in the world.
2.1. Iranian researches
Few studies have been conducted concerning segmentation in banking
industry of Iran. Most of studies are limited to retail banking focusing on
current customers which usually use data mining techniques to analyze
consumer preferences. Retail customers’ market segmentation in the banking
industry is focused on depositors and does not cover all potential markets.
These studies often classify current customers based on predetermined
variables while the main goal of market segmentation is gaining competitive
advantage and this goal is not achieved without considering all markets. On
the other hand, this method of research is being static so that the results show
a picture of customer’s preferences in the short run while we need to study
the performance in time to assure the stability and reliability of the results
of the model.

Developing a Macro-segmention Model … 101
Table 2. Summary of the Main Domestic Studies
Researchers Title / Scope of the
study Method Variables
Akhoundzadeh
et al.,
Mining customer
dynamics in designing
customer segmentation
Cluster analysis
(K-Means)
Regency, Frequency,
Monetary (RFM)
Ghaffari et al.,
Identifying Market
Segmentation Variables
in Tourism Industry
Conceptual
Demographic,
Geographical,
Behavioral and
Psychological
Kousha and
Zahmatkesh
Market Segmentation
and Prioritizing
Segments
Cluster
Analysis
(K-Means),
Fuzzy
Hierarchical
Analysis
Regency, Frequency,
Monetary, Payment
terms (RFMP)
Eghtedarian and
Hajipour
Developing Tourism
Strategies using Market
segmentation For
Isfahan Province
Cluster analysis
(K-Means) Pull and Push Motives
Khajevand
et al.,
Segmenting Saderat
Bank depositors using
data mining
Two Step
Clustering
Regency, Frequency,
Monetary (RFM)
Ahmadi et al., Drug market
Segmentation
K-Means,
Neuron
Network
Demographic, ,
Behavioral and
Physiological
Mortazavi
et al.,
Segmenting banks
customers in Mashhad
based on Benefit
Expectation Approach
Factor analysis,
cluster analysis
Customer Benefit
Expectations
2.2. Foreign researches
Most of the researches in the business market, especially in the loan market,
are devoted to subjective studies and surveys. Few of these have used real
data. They have mainly used experts’ viewpoints and ANOVA, MANOVA or
Conjoint Analysis. These studies are typically classified as consumer behavior
survey studies and are able to describe a small part of the market. As the data
in this type of study is obtained by means of surveys, the results are highly
affected by place and time and are not generalizable.

102 Money and Economy, Vol. 10, No. 4, Fall 2015
Table 3. Summary of the Main Foreign Studies
Researcher(s) Market Segmentation Bases Method Sample
Meahala (2013)
Identifying market segmentation
variables: profitability, return on
investment, field of activity, products
and services, deposit and loan volume,
collaterals, customer behavior in loan
repayments, customer reputation
Conceptual SME’s
Silvestrou
(2012) Credit risk
Survey/
descriptive
Romanian
SME’s
Beck and Kunt
(2006)
Accessibility to finance, business
competitive conditions for SME’s Conceptual SME’s
Anthapolos and
Labrokous
(1999)
Study business customer behavior in:
corporate size, required products,
profitability, risk profile)
Survey
(Manova)
467 corporates
in Greece
Zenoldine
(1996)
Product Life Cycle, Differentiation
Strategies in product and services
Conceptual
Model -
Cheron (1989) Designing two step market
segmentation model for banks
Conceptual
model -
Ma and Chan
(1990)
Corporate size, relationship duration,
number of banks used by customers,
perceived quality, diversity of
services, place, CEO’s relationship
with banks
Survey/
descriptive
96 Corporates
in Hong Kong
3. Methodology
The aim of this study is to explore a new segmentation model at industry level
and then to describe and evaluate segments based on longitudinal real data
collection. The data has been obtained from Tehran Stock Exchange and Iran
Stats. Center regarding factories with 50 and more employees between 2005
and 2013. The structures and variables of the research have been identified
and described using focus group technique and interviews with experts of the
industry:
Focus Group: In the first step the factors of measuring the attractiveness
of the market from the banking system viewpoint were identified using a focus
group of 7 experts of banking with different specialties; finance, economics,
Developing a Macro-segmention Model … 103
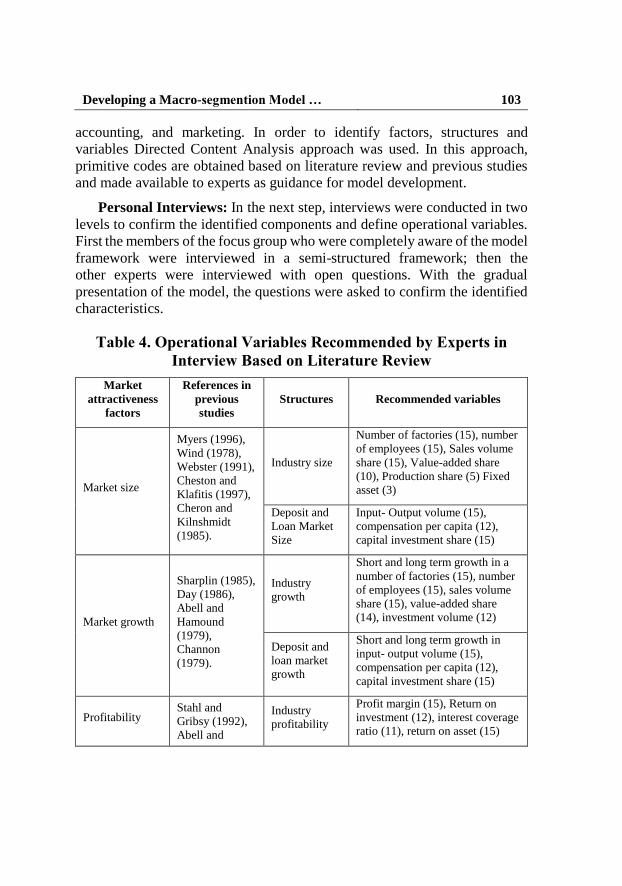
accounting, and marketing. In order to identify factors, structures and
variables Directed Content Analysis approach was used. In this approach,
primitive codes are obtained based on literature review and previous studies
and made available to experts as guidance for model development.
Personal Interviews: In the next step, interviews were conducted in two
levels to confirm the identified components and define operational variables.
First the members of the focus group who were completely aware of the model
framework were interviewed in a semi-structured framework; then the
other experts were interviewed with open questions. With the gradual
presentation of the model, the questions were asked to confirm the identified
characteristics.
Table 4. Operational Variables Recommended by Experts in
Interview Based on Literature Review
Market
attractiveness
factors
References in
previous
studies
Structures Recommended variables
Market size
Myers (1996),
Wind (1978),
Webster (1991),
Cheston and
Klafitis (1997),
Cheron and
Kilnshmidt
(1985).
Industry size
Number of factories (15), number
of employees (15), Sales volume
share (15), Value-added share
(10), Production share (5) Fixed
asset (3)
Deposit and
Loan Market
Size
Input- Output volume (15),
compensation per capita (12),
capital investment share (15)
Market growth
Sharplin (1985),
Day (1986),
Abell and
Hamound
(1979),
Channon
(1979).
Industry
growth
Short and long term growth in a
number of factories (15), number
of employees (15), sales volume
share (15), value-added share
(14), investment volume (12)
Deposit and
loan market
growth
Short and long term growth in
input- output volume (15),
compensation per capita (12),
capital investment share (15)
Profitability Stahl and
Gribsy (1992),
Abell and
Industry
profitability
Profit margin (15), Return on
investment (12), interest coverage
ratio (11), return on asset (15)

104 Money and Economy, Vol. 10, No. 4, Fall 2015
Market
attractiveness
factors
References in
previous
studies
Structures Recommended variables
Hamound
(1979)
Industry
productivity Output to input ratio (12)
Product
differentiation
Stahl and
Gribsy (1992),
Abell and
Hamound
(1979)
Potential to
develop new
products and
services
Commission paid to banks (15),
export to sales ratio (11),
imported capital to total capital
(9), imported raw material to
total raw material (10)
Investment risk
Hassy (1978),
Cardozo and
Wind (1985),
Cheron and
Klinshmidt
(1985)
Financial risk Debt to equity ratio (15)
Default risk Receivable turnover ratio (11)
Commercial
risk
Deviation of real production from
trend (15)
Liquidity risk Liquidity ratio (11)
Intersectional
transactions
Input-output
tables
Forward and
backward
relationships
with other
industries
Forward linkage (15), backward
linkage (15)
Industry value
Abell and
Hamound
(1979), Chavin
and Hirshy
(1993)
R&D
expenses R&D expenses to sales (15)
Advertising
expenses Ad expenses to sales (15)
* Digits in parentheses represent frequency of recommendation by experts.
In the second step after reaching a consensus on the attractiveness model,
the experts were given the information platform and were asked to give their
recommended variables to measure each of the following structures: Industry
market size, deposit and loan market size, industry growth, deposit and loan
market growth, profitability, investment risk, industry value, intersectional
transactions. After 15 interviews, no new variable was added to the model and
the interviews had reached a theoretical saturation.
Table 4 shows the suggested variables and their frequency in the sample
(for more information please refer to appendix 1).

Developing a Macro-segmention Model … 105
Statistical Techniques:
PCA: Having the model developed, we used principal component analysis
to explore the model based on real data for possible modification. In principal
components analysis, the total variance in the data is considered. The diagonal
of the correlation matrix consists of unities, and full variance is brought into
the factor matrix. Principal components analysis is recommended when the
primary concern is to determine the minimum number of factors that will
account for maximum variance in the data for use in subsequent multivariate
analysis (Malhotra and Bricks, 2007).
Hierarchical Clustering: Hierarchical clustering is characterized by
developing a hierarchy or treelike structure. Hierarchical methods can be
agglomerative or divisive. Agglomerative methods are commonly used in
marketing research which start with each objects in a separate cluster. Clusters
are formed by grouping objects into bigger and bigger clusters (Malhotra and
Bricks, 2007). They consist of linkage methods, error sums of squares or
variance methods, and centroid methods. We used centroid methods in this
study. In the centroid method, the distance between two clusters is the distance
between their centroids (means for all the variables).
Discriminant Analysis: We used Discriminant analysis technique to
analyze each group features in this study. Discriminant analysis is a technique
for analyzing data when the criterion or dependent variable is categorical and
the predictor or independent variables are interval in nature. Group
membership is dependent variable and market attractiveness factors are
independent variables in this study.
Population and Sample: The population of this study is the industrial
sector of the country and all factories with 50 and more employees are the
research sample. The sample has been divided into 55 industries using ISIC
classification (list of 55 industries can be found in appendix 2).
4. Data Analysis and Findings of the Research
Principal component analysis: Total 440 observations (55 industries × 8
years) were evaluated by Exploratory Varimax rotation method. Only factors
with Eigen value greater than 1.0 were retained. 13 factors were identified
which explains 70 percent of variance of data. Factor 1 represents market size
in deposit and loan aspect, factor 2 represents long run growth, factor 3

106 Money and Economy, Vol. 10, No. 4, Fall 2015
represents profitability, factor 4 represents market size in industry size aspect,
factor 5 represents short run growth, factor 6 represents investment risks,
factor 10 represents industry value and factor 11 represents intersectional
transactions. Other factors do not show any meaningful concept. According to
PCA result product differentiation is omitted and commission paid to banks is
defined as a measure for market size.
Table 5. Principal Component Analysis Results
Factors
Initial Eigenvalue Loadings with rotation
Total % of
variance Cumulative Total
% of
variance
% of
variance
1 6/026 15/451 15/451 4/130 10/589 10/589
2 3/872 9/929 25/380 2/978 7/636 18/225
3 3/459 8/870 34/251 2/747 7/043 25/268
4 2/481 6/361 40/611 2/739 7/023 32/291
5 2/242 5/749 46/361 2/652 6/799 39/090
6 1/774 4/549 50/909 2/621 6/721 45/811
7 1/535 3/936 54/846 2/353 6/032 51/844
8 1/370 3/513 58/359 1/692 4/339 56/183
9 1/328 3/405 61/764 1/591 4/079 60/261
10 1/190 3/052 64/816 1/394 3/576 63/837
11 1/097 2/812 67/628 1/378 3/533 67/370
12 1/060 2/717 70/345 1/160 2/976 70/345
13 /971 2/489 72/834 - - -
Source: Research results.
Hierarchical Clustering: The industry grouping was done using the
hierarchical clustering method. To do so, the mean of the variables for the 8
years of the study was calculated and the clustering was determined for the
mentioned years. The Dendrogram schematic showed the best case is
clustering the industries into 4 clusters. The identified clusters were compared

Developing a Macro-segmention Model … 107
to the other clusters in each year based on the stability and 4 groups of
industries were determined based on the stability and persistence of the groups
during the 8 years: Green, Yellow, Red, and White. The results of significance
test at significance level of 95% of the variable means of these 4 groups can
be found in table 6.
Discriminant Analysis: As 4 groups were evaluated, a maximum of 3
functions could be derived using discriminant analysis. The Eigenvalue of the
first function is 135.2 which shows 95% of the variance of the data. The higher
Eigenvalue of the first function indicates its potential to better distinguish the
groups. The second function with an eigenvalue of 5.8 can only explain 4% of
the variance of the data. The third function only explains 0.5% of the variance
of the data with an Eigenvalue equivalent to 0.693.
Table 6. Discriminant Functions, Eigenvalue and Equality Test of
Group’s Center
Discriminant
functions Eigenvalue
% of
variance
% of
cumulative
variance
Wilks
Lambda
Chi-
square Sig.
1-3 135.02 95.4 95.4 0.001 301.66 0.000
2-3 5.81 4.1 99.5 0.087 100.24 0.000
3 0.692 0.5 100.0 0.591 21.57 0.364
Source: Research results.
For the hypothesis test of all three group centers to be equal, we have
considered three cases. First, all three, then the second and the third, and
finally, only the third one were evaluated. The results showed that the third
one cannot explain the difference between the groups. The first one can
effectively explain the differences and the second one can do so in a significant
way. Table 5 shows the results of significance test of equal center for all
groups, in all three cases with Eigenvalues and Wilks-Lambda statistic.
Validity of the Identified Groups: To measure the validity of the
identified groups, cross-validation method was used. In this method, the data
is randomly divided into two subsamples. The analysis sample, is used for
estimating the discriminant function, and the validation sample is used for
developing the classification matrix. The discriminant weights, estimated by
using the analysis sample, are multiplied by the values of the predictor
variables in the hold out sample to generate discriminant scores for the cases
in the hold out sample. The cases are then assigned to groups based on their

108 Money and Economy, Vol. 10, No. 4, Fall 2015
discriminant scores and an appropriate decision rule. By a rule of thumb, if
this ratio is 25% more than the random division of the units between the
groups, the results are reliable (Malhotra and Bricks, 2007). As the identified
groups in the present study are 4 groups, if the ratio is higher than 50%, the
groups are valid. Table 6 shows the validity percentage of the units in desirable
groups in each year.
Table 7. Cross Validation Test of Hierarchical
Clustering (2006-2013)
2006 2007 2008 2009 2010 2011 2012 2013
71% 75% 93% 82% 71% 71% 80% 82%
Source: Research results.
Mean Equality Test of Variables across the Groups: Before describing
each group’s characteristics, we need to know which variables distinguish
groups the most. Mean equality test was taken in order to recognize these
variables. Table 7 shows the significance of mean differences of variables
across four groups. Significant variables were selected as the basis of
segmentation and difference description across the groups.
Table 8. Mean Equality Test across Groups
Variables Wilks
Lambda
F
statistic Sig. Variables
Wilks
Lambda
F
statistic Sig.
FS 0.924 1.195 0.121 IOG 0.896 2.562 0.065
ES 0.767 5.177 0.003 LIOG 0.766 5.192 0.003
VAS 0.155 92.675 0.000 IG 0.853 2.928 0.042
SS 0.109 138.39 0.000 LIG 0.0721 6.580 0.001
IOS 0.115 131.133 0.000 PM 0.928 1.318 0.279
IS 0.253 50.194 0.000 ROA 0.26 48.2722 0.000
RTR 0.538 14.598 0.000 ROI 0.851 2.987 0.040
DE 0.772 5.030 0.004 IO 0.855 2.887 0.044
WS 0.46 19.996 0.000 CS 0.201 67.493 0.000
FG 0.899 1.908 0.14 RMIT 0.92 1.473 0.233
LFG 0.895 1.999 0.136 CACT 0.861 2.753 0.052
EG 0.809 4.021 0.012 ETS 0.967 0.577 0.633
LEG 0.791 4.484 0.007 STA 0.911 1.659 0.187
VAG 0.857 2.824 0.047 RDS 0.893 2.039 0.120
LVAG 0.882 2.268 0.092 LR 0.822 3.688 0.018
SG 0.877 2.389 0.08 FLL 0.203 66.81 0.000
LSG 0.835 3.357 0.036 BL 0.754 5.549 0.002
WG 0.798 4.316 0.009 FL 0.795 4.371 0.008
LWG 0.798 4.301 0.009 RISK 0.597 11.48 0.000
Source: Research results.

Developing a Macro-segmention Model … 109
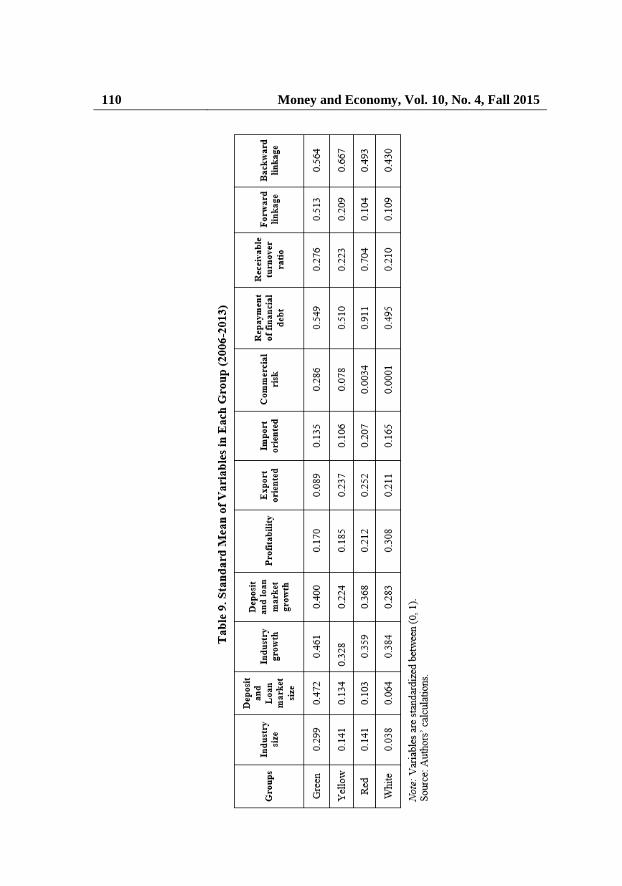
Considering table 7, the main characteristics of identified groups are as
follows:
Group 1. Green Industries:
Number of Members: 4 Industries; ISIC: 232, 241, 271, and 341
This group consists of the industries with the highest number of employees,
sales, investment, and wages and salaries although the number of factories in
this group is ranked three. The turnover of this group is very high and makes
it the biggest market of deposit and loan for the banks. These industries have
had higher long and short run growth rate in value added, sales volume, and
investment in factors of production. Despite the high turnover and growth,
their profit margin, investment return, and productivity are lower than
expected. They have had the highest commission paid to the banks. These
industries are neither export-oriented nor import-oriented thus are least
dependent on foreign markets and could be vital in Resistance Economy
Policies. Business risk is high in these industries, meaning that their sales have
experienced severe fluctuations; they have a medium-range performance in
financial liabilities, and the best liquidity account among all industries; they
have a medium condition in collection period which has been prolonged after
the sanctions. They have the highest forward linkage and relatively high
backward linkage.
Group 2. Yellow Industries:
Number of Members: 35 Industries; ISIC: 151, 152, 154, 155, 210, 221, 222,
242, 243, 251, 269, 272, 273, 281, 289, 291, 292, 293, 311, 312, 313, 315,
319, 321, 322, 323, 331, 333, 342, 343, 351, 352, 359 and 361
The number of factories is relatively high but considering the employees and
other measures of industry size, they have a medium state. Their market size
for attracting deposit and loan is medium and their market growth in the long
and short run is the lowest among all industries in all aspects. These conditions
have improved to some extent in 2011 and 2012; their profitability is low in
general and has improved in recent years; they have the second highest paid
commission to the banks; they import capital equipment and as a result are
import-dependent; they have the lowest rate of export among all industries;
they have a medium state in liquidity, a relatively low collection period, a
medium business risk and have average forward and backward linkage.
110 Money and Economy, Vol. 10, No. 4, Fall 2015

Developing a Macro-segmention Model … 111
Group 3. Red Industries:
Number of Members: 4 Industries; ISIC: 171, 172, 173, and 181
These industries have the highest number of factories. They have an average
state considering the number of employees, investment, and wages and a small
size in sales and factors of production; thus their market for deposit and loan
is small; their growth is average; they have the lowest growth rate of sales
among all industries, and the highest growth rate of deposit and loan market.
Their profitability is medium-range and is ranked third in paid commissions
to the banks. These industries are import-dependent and were severely
affected by the sanctions. They have the highest rate of export, lowest
liquidity, and high collection period, as a result the default risk is high in this
group; however, they have a low business risk. They have the lowest forward
linkage and average backward linkage.
Group 4. White Industries:
Number of Members: 12 Industries; ISIC: 191, 192, 201, 202, 223, 231, 252,
261, 300, 314, 332 and 353
These industries have the smallest size and deposit and loan market among all
groups; value added and investment growth rate are high and they have an
average growth rate in other variables; they have the highest profitability state,
lowest paid commissions to the banks thus a small market for them. Import
and export is of medium-range, so is liquidity; collection period is low and
they rank second in this matter; they have the lowest business risk, forward
and backward linkage.
Table 10 shows industries membership across 9 years. Accordingly, the
majority of industries migrated between the groups. However, final
membership is determined by robust members. This table also presents
validity and reliability of industries’ membership findings.

112 Money and Economy, Vol. 10, No. 4, Fall 2015

Developing a Macro-segmention Model … 113
5. Conclusion and Suggestions
This study introduced a new approach in segmentation models. SBI can be
used in businesses such as banking where its intermediary nature let the
businesses to connect with the variety of industries in massive transactional
relationships simultaneously. Findings in this study showed that four different
and significant groups can be identified at the industry level in Iran banking.
Based on the findings, it is suggested that SBI approaches be taken
into account before corporate segmentation in businesses such as financial
intermediaries, wholesalers and retailers, transportation, public services,
legislative and policy institutions since they have multi-sectional
relationships.
Findings showed that Iranian industries can be divided into 4 groups from
a banking system viewpoint: Green, Yellow, Red, and White. The Green
group is the most attractive one for banks. This group has a priority for the
banks with high capital which pursue strategies such as gaining high market
share, cost leadership in the money market, and utilizing economies of scale.
As these industries have an intermediate role among industries, one of the
efficient strategies in this market is using the advantages of relationship and
network marketing. These industries enjoy a steady and stable growth rate in
long run thus are the proper market for long run development investment
plans. On the other hand, we can see the importance of these industries in
fulfilling the objectives of Resistance Economy as they have a strategic role
in our country; this role must be considered far more than the past. Despite all
advantages of this group, the banks are prone to suffer in times of recession
and shock due to the high business risk of these industries. Also concentration
risk should be taken into consideration as the number of the factories is low
and their market is quite big in these industries.
The red group is the best choice for the banks which are unable to enjoy
the advantages of the first group. Including 35 industries out of 55 in this
study, makes the market seriously attractive for the banks. This market is the
most attractive one for the banks looking for creating diverse commission
revenues with low risk from different sectors, especially in the case of newly
established banks which try to pursue diversification strategy and
development of monetary and banking services under the concept of universal
banking. Most of the industries of this group are import-oriented and are a
good market for import bonds. As they are the closest to final consumers, their

114 Money and Economy, Vol. 10, No. 4, Fall 2015
collection period and liquidity is in a good condition. This makes the market
attractive for the loan to working capital. Low growth rate and profitability
are the Achilles Heel for the banks who choose these industries.
The yellow group including textile and clothing industries are import-
oriented while they have a high rate of export. This makes them a good market
for import and export bonds and to increase commission revenues. The growth
of deposit and loan in this sector has shown a great prospect for near future.
Since they have a financial leverage and low liquidity, they are highly prone
to default risk and thus are a risky market for the banks.
The industries in the white group are a priority for the banks which are
willing to choose niche strategy. Banks with low capital can choose these
industries in order to increase their market share to the highest level in the
market. The high-profit margin of this group members makes these industries
attractive for newly established banks which suffer from a high cost of money.
It is supposed that interest rate determination mechanism would be more
flexible than other groups. Being the most stable and resistant industry against
environment shocks in this group makes it a safer market for infants. Also,
white group market is recommended for working capital loans.
One of the limitations encountered in this study was the difficulty of
identifying the industries’ attractiveness dimensions for the experts due to the
vast coverage of industries which is why only quantitative data and indices
were used to evaluate the groups of the market. In future studies, subgroups
of each group could be developed using quantitative and qualitative variables,
based on the findings of this study. It is also recommended to try SBI
approach to other businesses such as wholesalers, retailers, other financial
intermediaries etc.
References
Abell, Derek F. and John S. Hammond, (1979). Strategic Market Planning:
Problems and Analytical Approaches. Englewood Cliffs, NJ: Prectice-Hall.
Ahmadi, P., A. Azar, and F. Samsami, (2011). “Market Segmentation Using
Neural Networks (Case Study: Pharmaceutical Market in Iran)”. Quarterly
Journal of Business Management, 2(6), 1-20 (in Persian).

Developing a Macro-segmention Model … 115
Akhoundzadeh-Noghabi, E., A. Albadavi, and M. Aghdasi, (2015). “Mining
Customer Dynamics in Designing Customer Segmentation Using Data
Mining Techniques”. Journal of Information Technology Management, 6(10),
1-30 (in Persian).
Ames, B. C. (2001). “Trappings VS, Substance in Industrial Marketing”.
Critical Perspectives on Business and Management, 2(24), 24 .
Athanassopoulos, A. D., and N.S. Labroukos, (1999). “Corporate Customer
Behavior towards Financial Services: Empirical Results from the Emerging
Market of Greece”. International Journal of Bank Marketing, 17(6), 274-285 .
Beck, T., and A. Demirguc-Kunt, (2006). “Small and Medium-size
Enterprises: Access to Finance as a Growth Constraint”. Journal of Banking
& Finance, 30(11), 2931-2943 .
Beik, L. L& ,.and S.L. Buzby, (1973). “Profitability Analysis by Market
Segments”. The Journal of Marketing, 48-53 .
Brandt, S .C. (1966). “Dissecting the Segmentation Syndrome”. The Journal
of Marketing, 33(4), 22-27 .
Cardozo, R. N. (1968). “Segmenting the Industrial Market”. Marketing and
the New Science of Planning, 23(3), 443-450.
Channon, Derek F. (1979). Commentary-on Grant and King, in Schendel, D.E
and Hofer, C. W (Eds.), Strategic Management- A New View of Business
Policy and Planning. Boston: Little, Brown, 122-33.
Chauvin, K. W., and M. Hirschey, (1993). “Advertising, R&D Expenditures
and the Market Value of the Firm”. Financial Management, 128-140.
Chéron, E. J., and E.J. Kleinschmidt, (1985). “A Review of Industrial Market
Segmentation Research and a Proposal for an Integrated Segmentation
Framework”. International Journal of Research in Marketing, 2(2), 101-115.
Chéron, E. J., et al. (1989). “Segmentation of Bank Commercial Markets”.
International Journal of Bank Marketing 7(6): 25-30.
116 Money and Economy, Vol. 10, No. 4, Fall 2015
Choffray, J.-M., and G.L. Lilien, (1980). “Industrial Market Segmentation by
the Structure of the Purchasing Process”. Industrial Marketing Management,
9(4), 331-342 .
Danneels, E. (1996).” Market Segmentation: Normative Model Versus
Business Reality: An Exploratory Study of Apparel Retailing in Belgium”.
European Journal of Marketing, 30(6), 36-51 .
Day, George S. (1986). Analysis for Strategic Marketing Decisions. St. Paul,
MN: West Publishing Company.
Dibb, S., and L. Simkin, (1994). “Implementation Problems in Industrial
Market Segmentation”. Industrial Marketing Management, 23(1), 55-63 .
Doyle, P. and J. Saunders, (1985). “Market Segmentation and Positioning in
Specialized Industrial Markets”. The Journal of Marketing: 24-32.
Eghtedarian, M. and B. Hajipour, (2014). “Developing Tourism Strategies
using Market Segmentation”. International Conference on Geography, Urban
Planning and Sustainable Development. February 2014, Tehran (in Persian).
Frank, R. E., W.F. Massy, and Y. Wind, (1972). Market Segmentation,
Prentice-Hall Englewood Cliffs, NJ.
Ghaffari, M., A. Konjkav, and A. Monfared, (2014). “Identifying Factors for
Tourism Market Segmentation” First National Conference of Green Tourism,
May 2014, Hamedan (in Persian).
Green, P. E. (1977). “A New Approach to Market Segmentation”. Business
Horizons, 20(1), 61-73 .
Green, P. E., and F.J. Carmone, (1977). “Segment Congruence Analysis: a
Method for Analyzing Association among Alternative Bases for Market
segmentation”. Journal of Consumer Research, 217-222.
Jenkins, M., and M. McDonald, (1994). “Defining and Segmenting Markets:
Archetypes and Research Agendas”. Paper Presented at the MEG Annual
Conference, University of Ulster, July 1994, pp. 533-542.

Developing a Macro-segmention Model … 117
Khajevand, S., M. Taghavifard, and E. Njafi, (2013). “Bank Customer
Segmentation Using Data Mining”. Management Studies in Development &
Evolution, 22(67), 91-200 (in Persian).
Kousha, H. and M. Zahmatkesh, (2014). “Identifying Tourism Market
Segmentation Variables”. Tenth International Industrial Engineering,
January 2014, Tehran (in Persian).
Mahajan, V., and A.K. Jain, (1978). “An Approach to Normative
Segmentation”. Journal of Marketing Research, 338-345 .
Malhotra, N. K., and D.F. Birks, (2007). Marketing research: An Applied
Approach. Pearson Education.
Mihaela, N. S. (2013). “Segmentation of SME Portfolio in Banking System”.
Annals of Faculty of Economics, 1(1), 1786-1796 .
Mortazavi, S., A. Kaffashpour, A. Habibirad, and Yaser Asemandarreh,
(2009). Mashhad Bank Segmentation Based on Customers Benefits
Expectation. 16(29), 126-161 (in Persian).
Plank, R. E. (1985). “A Critical Review of Industrial Market Segmentation”.
Industrial Marketing Management, 14, 79-91 .
Riquier, C., S. Luxton, and B. Sharp, (1997). “Probabilistic Segmentation
Modelling”. Journal of Market Research Society, 39(3), 571-587 .
Shapiro, B. P., and T.V. Bonoma, (1984). “How to Segment Industrial
Markets”. Harvard Business Review, 62(3), 104-110 .
Sharplin, Arthur (1985). Strategic Management. New York: McGraw-Hill
Book Company.
Silivestru, D. R. (2012). “Bank Loans and Small Firm Financing in Romania”.
Annales Universitatis Apulensis Series Oeconomica, 1(14), p. 178.
Smith and W. R. (1956). "Product Differentiation and Market Segmentation
as Alternative Marketing Strategies." Osmania Journal of Social Sciences,
pp. 3-8.

118 Money and Economy, Vol. 10, No. 4, Fall 2015
Stahl, Micheal J. and David W. Grigsby, (1992). Strategic Management for
Decision Making. Boston, MA: P W S- Kent Publishing Company.
Webster Jr, F. E. (1978). “Management Science in Industrial Marketing”. The
Journal of Marketing, 21-27 .
Webster, F. E. (1991). Industrial marketing strategy, Vol. 3: Wiley New York.
Wind, Y. (1978). “Issues and Advances in Segmentation Research”. Journal
of Marketing Research, 317-337 .
Wind, Y. and R. N. Cardozo, (1974). “Industrial Market Segmentation”.
Industrial Marketing Management 3(3): 153-165.
Zineldin, M. (1996). “Bank-corporate Client “Partnership” Relationship:
Benefits and Life Cycle”. International Journal of Bank Marketing,
14(3), 14-22.

Developing a Macro-segmention Model … 119

120 Money and Economy, Vol. 10, No. 4, Fall 2015

Developing a Macro-segmention Model … 121

122 Money and Economy, Vol. 10, No. 4, Fall 2015

Developing a Macro-segmention Model … 123