developing a model to predict corporate …
TRANSCRIPT
FACTA UNIVERSITATIS
Series: Economics and Organization Vol. 17, No 2, 2020, pp. 127 - 139
https://doi.org/10.22190/FUEO191118010V
© 2020 by University of Niš, Serbia | Creative Commons Licence: CC BY-NC-ND
Original Scientific Paper
DEVELOPING A MODEL
TO PREDICT CORPORATE BANKRUPTCY
USING DECISION TREE IN THE REPUBLIC OF SERBIA1
UDC 347.736(497.11)
Sanja Vlaović Begović1, Ljiljana Bonić
2
1School of Business Novi Sad, Serbia
2University of Niš, Faculty of Economics in Niš, Serbia
Abstract. Decision trees made by visualizing the decision-making process solve a
problem that requires more successive decisions to be made. They are also used for
classification and to solve problems usually addressed by regression analysis. One of
the problems of classification that arises is the proper classification of bankrupt
companies and non-bankruptcy companies, which is then used to predict the likelihood
of bankruptcy. The paper uses a random forests decision tree to predict bankruptcy of
companies in the Republic of Serbia. The research results show the high predictive
power of the model with as much as 98% average prediction accuracy, and it is
recommended for auditors, investors, financial institutions and other stakeholders to
predict bankruptcy of companies in Republic of Serbia.
Key words: decision trees, bankruptcy, prediction, model
JEL Classification: C44, C53, G33
1. INTRODUCTION
A quantitative method that iteratively detects links between attributes, data subject to
testing, is called data mining. Data mining relies on decision trees that visualize the
decision-making process to solve a problem that requires several successive decisions
(Sikavica, et al., 2014, p. 476). Decision trees are often used to solve classification
problems, i.e. to determine belonging to a particular class, and to solve regression problems.
Received November 18, 2019 / Revised March 18, 2020 / Accepted March 25, 2020
Corresponding author: Sanja Vlaović Begović
School of Business Novi Sad, Vladimira Perića – Valtera 4, 21102 Novi Sad, Serbia
E-mail: [email protected]
128 S. VLAOVIĆ BEGOVIĆ, LJ. BONIĆ
One of the classification problems is the proper classification of bankruptcy and non-
bankruptcy companies, thus making a prediction of corporate operations. Identifying
business difficulties that lead to bankruptcy is a core task for numerous stakeholders. Banks,
managers, investors, customers, suppliers avoid major losses by timely discovering unstable
operations leading to bankruptcy. However, forecasting bankruptcies under current business
conditions has become an increasingly significant challenge for analysts due to the
globalization and complexity of companies, as well as the fact that certain economists
perceive the initiation of bankruptcy as a strategic solution for the limitation of liability
arising from court-imposed penalties (Kliestik et al., 2018). Various bankruptcy prediction
models have been developed bearing in mind the significance of bankruptcy forecasting to
numerous market participants and factors that affect the forecasting accuracy. Decision trees
are categorized as contemporary models which, based on input data (numeric and
categorical), predict bankruptcy.
The remainder of this paper is structured as follows. First, the theoretical and
methodological basis of the decision tree is given, as well as an overview of some of the
models used to predict bankruptcy. The advantages and disadvantages of the decision tree
are highlighted as well as the previous research results in this area. Finally, a decision tree
is implemented to predict corporate bankruptcy in Republic of Serbia. An overview of the
influence of individual variables on the prediction result is also given.
2. THEORETICAL AND METHODOLOGICAL BASES OF MODELS
FOR CORPORATE BANKRUPTCY PREDICTION USING DECISION TREE
Decision trees can be a graphic overview of decision making by experts based on a
hand-created tree. In addition to the expert’s decision, decision trees can rely on data
finding its mutual links to obtain predictive values. Such trees are called Classification
and Regression Trees (CART) and were developed by a group of American statisticians,
Breiman, Friedman, Olshen, and Stone (1984). The goal of classification trees is to assign
attributes to a subset of known classes. Specifically, the attribute space is divided into
several different regions that do not overlap. A new object is determined to belong to one
of the regions based on the values of the attributes describing the object (for example,
corporate business operations are described by financial ratios). The object will be
assigned to the class that dominates the region in which the object is located (James, et.al.
2013 p. 311) (for example, the class may be to continue business or go bankrupt).
The regression trees were developed in a similar way to the classification trees, except
that the result of the analysis does not represent belonging to a class but an approximation
of an unknown regression function. Regression trees are estimated using non-parametric
regression functions (Härdle & Simar, 2007, 401).
The decision tree is based on recursive, binary splitting data, moving from a higher
(tree) to a lower (leaf) level. Each tree node represents one test of the input attribute
(variable) value, and each branch stemming from the node shows one of the possible
attribute values. A leaf represents a class to which subset attributes belong (Stanojević, et
al. 2017 p. 94). The tree is then formed by splitting the input dataset into subsets based on
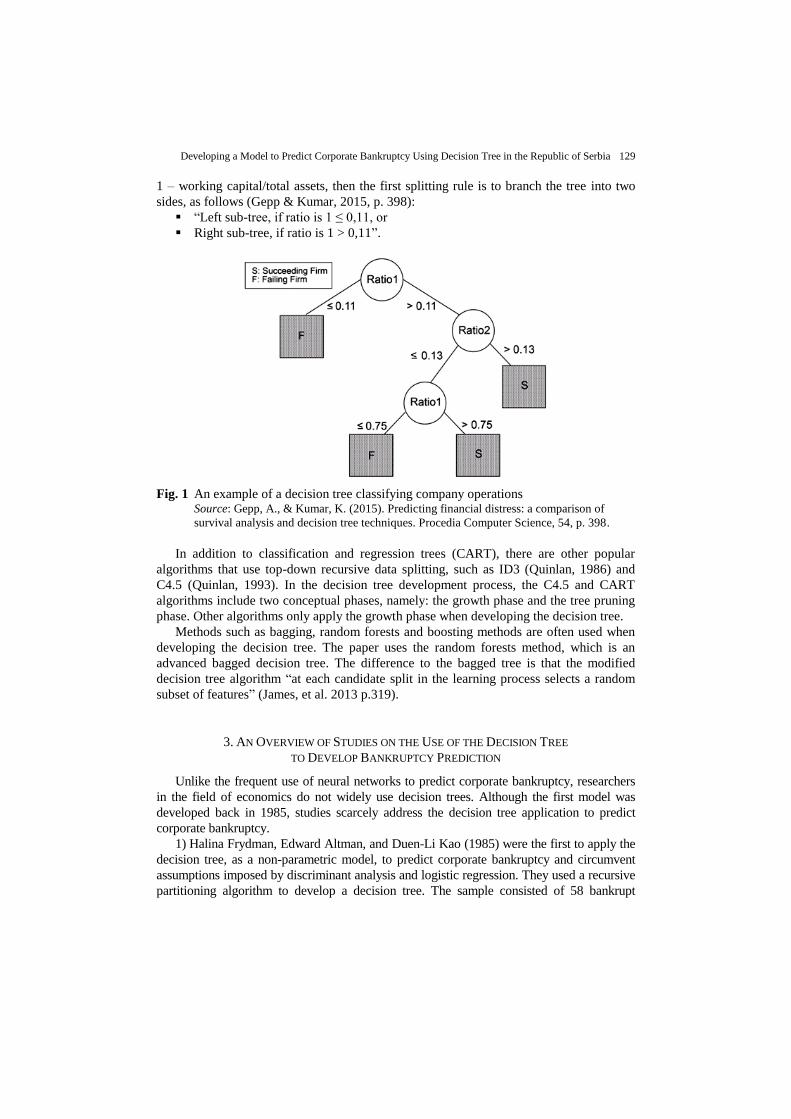
data value testing. The figure 1 shows a decision tree for predicting company bankruptcy,
classifying each company as succeeding or failing. Assuming one of the attributes is ratio
Developing a Model to Predict Corporate Bankruptcy Using Decision Tree in the Republic of Serbia 129
1 – working capital/total assets, then the first splitting rule is to branch the tree into two
sides, as follows (Gepp & Kumar, 2015, p. 398):
―Left sub-tree, if ratio is 1 ≤ 0,11, or
Right sub-tree, if ratio is 1 > 0,11‖.
Fig. 1 An example of a decision tree classifying company operations Source: Gepp, A., & Kumar, K. (2015). Predicting financial distress: a comparison of
survival analysis and decision tree techniques. Procedia Computer Science, 54, p. 398.
In addition to classification and regression trees (CART), there are other popular
algorithms that use top-down recursive data splitting, such as ID3 (Quinlan, 1986) and
C4.5 (Quinlan, 1993). In the decision tree development process, the C4.5 and CART
algorithms include two conceptual phases, namely: the growth phase and the tree pruning
phase. Other algorithms only apply the growth phase when developing the decision tree.
Methods such as bagging, random forests and boosting methods are often used when
developing the decision tree. The paper uses the random forests method, which is an
advanced bagged decision tree. The difference to the bagged tree is that the modified
decision tree algorithm ―at each candidate split in the learning process selects a random
subset of features‖ (James, et al. 2013 p.319).
3. AN OVERVIEW OF STUDIES ON THE USE OF THE DECISION TREE
TO DEVELOP BANKRUPTCY PREDICTION
Unlike the frequent use of neural networks to predict corporate bankruptcy, researchers
in the field of economics do not widely use decision trees. Although the first model was
developed back in 1985, studies scarcely address the decision tree application to predict
corporate bankruptcy.
1) Halina Frydman, Edward Altman, and Duen-Li Kao (1985) were the first to apply the
decision tree, as a non-parametric model, to predict corporate bankruptcy and circumvent
assumptions imposed by discriminant analysis and logistic regression. They used a recursive
partitioning algorithm to develop a decision tree. The sample consisted of 58 bankrupt
130 S. VLAOVIĆ BEGOVIĆ, LJ. BONIĆ
companies and 142 active manufacturing and trading companies. The survey covered the
period from 1971 to 1981. The authors used 20 financial ratios they considered significant
for predicting bankruptcy in previous studies.
In relation to the number of input variables, the authors developed 2 decision tree
models (larger, more complex, and smaller, simpler decision trees) and 2 models based on
discriminant analysis (one model containing 4 and one with 10 variables). The research
results showed the superiority of the decision tree model over the discriminant analysis
models. In line with expectations, smaller decision tree showed better results, while complex
decision trees highlighted the potential risk of over-training and poorer predictive results.
2) Thomas E. McKee (1995a) implemented the ID3 inductive inferencing algorithm to
predict the bankruptcy of 60 US publicly traded companies. Half of the sample companies were
bankrupt companies and the other half were active companies. The survey covered the period
from 1986 to 1989. The input variables were 8 financial ratios (McKee, 1995a. p. 30):
―Net income/Total assets
Working capital/Total assets
Current assets/Current liabilities
Cash/Total assets
Current assets/Sales
Long-term debt/Total assets
Accounts receivable/Sales revenue‖.
As the final research result, the author proposed a bankruptcy prediction model
containing only two financial ratios, namely: current assets to current liabilities ratio and net
income to total assets ratio. The model showed to predict the sample company bankruptcy
with 97% accuracy. The author notes that the model should be tested using a larger sample,
but still recommends auditors, investors and other stakeholders to use the model to predict
bankruptcy.
In the same year, the author McKee (1995b) developed a recursive partitioning algorithm
to predict bankruptcy, with the rule that if the current liquidity ratio was greater than or equal
to 0.64 and the ratio of net income to total assets greater than or equal to 0, then the
company will not file for bankruptcy, otherwise it is believed that the company will file for
bankruptcy. The model was developed and tested using a sample of 202 companies, half of
which were bankrupt and the other half actively operating. A few years later, McKee and
Greenstein (2000) tested the robustness of the same model using an extended sample over a
different time period and with different data. The results of the study showed that the
developed model had a higher average percentage of prediction accuracy than the logit
model and the neural network model. However, when it comes to predicting bankrupt
company bankruptcy, the developed model showed less predictive power than the other
models examined.
3) Adrian Gepp, Kuldeep Kumar, and Sukanto Bhattacharya (2010) extended the
Frydman et al. research, applying different decision tree algorithms to predict corporate
bankruptcy. In addition to the recursive partitioning algorithm, the authors implemented the
CART and See5 algorithm. They compared the results of different decision trees, but also
compared the results of the decision tree with the discriminant analysis model. Interestingly,
the authors conducted a survey using the sample used by Frydman et al, with the same
number of input variables.
Developing a Model to Predict Corporate Bankruptcy Using Decision Tree in the Republic of Serbia 131
Algorithms play a role in managing the decision tree development process, with two
main tasks (Gepp, et.al. 2010 p. 540):
Selection of the best splitting rule of data at each node distinguishing between
active and bankrupt companies, and
Managing the complexity of the decision tree (number of nodes). Many algorithms
first develop a very complex tree, and then prune it to the desired complexity.
The results of the study confirmed the results of previous studies that smaller and simpler
decision tree models ―are better predictors than more complex models‖ (Gepp, et.al. 2010 p.
546). The authors emphasize that the recursive partitioning algorithm is a superior classifier
and predictor of corporate bankruptcy. On the other hand, the See5 algorithm showed the
best classification ability but also the worst predictive power. The CART algorithm showed
very similar results to the recursive partitioning algorithm. Compared to the discriminant
analysis model, all decision tree models showed their superiority.
4. ADVANTAGES AND DISADVANTAGES OF CORPORATE BANKRUPTCY PREDICTION
MODELS USING DECISION TREE
„Decision trees are powerful classification algorithms that are becoming increasingly
popular due to intuitive explanatory features― (Olson, et al. 2012 p. 466). Nayab (A Review of
Decision Tree Analysis Advantages, Retrieved from: https://www.brighthubpm.com/project-
planning/106000-advantages-of-decision-tree-analysis/, 11/08/2019) summarized the benefits
of a decision tree in several points:
Transparency – Decision trees explicitly provide all possible alternatives and present
each alternative to a final conclusion, thus enabling alternatives to be compared;
Specificity – The ability of the decision tree to assign certain values to the decisions
(problem) and results of each decision, thereby reducing ambiguities in decision making
Comprehensiveness – Decision trees provide a comprehensive analysis of the
consequences of any decision that may end with a definitive conclusion, uncertainty or
lead to new issues that require a repeat of the process;
Ease of use – Decision trees provide a graphical representation of problems and
alternatives in a simple and easy to understand format that requires no further
explanation;
Flexibility – The ability of the decision tree to handle different types of data (value and
categorical);
Resilience – Decision trees focus on the relationship between different events, depicting
the natural course of events. That way, they remain robust to error, provided the input is
correct;
Confirmation – Decision trees are used as a quantitative analysis of problems in
corporate operations, but also for validation of the results of statistical tests.
Because of their structure, decision trees are believed to be similar to human decision
making, and graphical representation facilitates interpretation, especially with small trees.
The ability to manage qualitative predictors does not require the introduction of dummy
variables (James, et al. 2013 p. 315).
Developing a decision tree is possible by applying different algorithms, which have
their advantages and disadvantages. One of the most famous algorithms for generating a
132 S. VLAOVIĆ BEGOVIĆ, LJ. BONIĆ
decision tree is the ID3 algorithm. Noting the shortcoming of an original decision tree,
reflected in dealing with noisy and/or incomplete data, Quinlan (1986) compares two ways
to modify methodology and overcome the shortcoming by introducing a new algorithm.
Quinlan (1987) investigated four methods for simplifying decision trees in a way that
does not compromise predictive accuracy to ensure ease of use. The author concludes that
the „pessimistic pruning method is faster than other applied methods and does not require
a special test sample for validation―. At the same time, the author states that the reduced
error pruning method requires a separate test sample, and another weakness of the method
is that parts of the original tree that are less frequent and specific cases are not presented
in the test sample and can be cut. Finally, the author concludes that the simplifying to
production rules method has proven particularly powerful.
Nayab found disadvantages of the decision tree (A Review of Decision Tree
Disadvantages. Retrieved form: https://www.brighthubpm.com/project-planning/106005-
disadvantages-to-using-decision-trees/, 11 August 2019) in the following features:
Instability – Reliability of information in the decision tree depends on the accuracy of
the input data. Even a small change in data entry can cause major changes in the tree,
which may require the development of a new tree;
Complexity, Unwieldy – Although the decision tree is easy to use compared to other
models, developing a decision tree is a complex and time-consuming process.
Complexity is particularly pronounced in large trees with many branches, and
expertise and experience are crucial to solving such problems. Large trees are often
cumbersome, leading to difficulties and incomprehensibility in their presentation;
Costs – As already mentioned, developing large trees requires human training and
expertise, and training costs for using a decision tree are imposed as a necessity;
Information overload – Although decision trees are capable of generating large
amounts of data, which is considered a positive feature, it may sometimes be that
decision makers face a wealth of information. In these circumstances, it takes time for
the decision maker to process all the data, making the decision-making process time-
consuming and costly.
Compared to other regression and classification approaches, the decision tree
generally does not have the same level of prediction accuracy. However, by modifying the
decision tree by introducing different methods such as bagging, random forests, and
boosting, predictive power significantly improves (James, et al. 2013 p. 316).
Kim and Upneja (2014) used a decision tree and an adaboosted decision tree to examine
the key factors for the financial failure of a publicly traded restaurant in the US. The authors
found that restaurants with financial problems had a higher share of debt in the capital
structure, a lower rate of increase in assets, a lower profit margin, and a lower current
liquidity ratio than restaurants that were not financially disadvantaged. Due to the good
performance of predicting business failure, the authors recommend using an adaboosted
decision tree.
In the credit rating evaluation, Bastos (2008) applied a boosted decision tree.
Considering that the boosted decision tree outperformed multilayer perceptron and the
support vector machines, the author concludes that the model is competitive with other credit
rating models.
Shirata (1998) applies classification and regression trees (CART) to select the
variables that will be used in the discriminant analysis model to predict the bankruptcy of
Developing a Model to Predict Corporate Bankruptcy Using Decision Tree in the Republic of Serbia 133
Japanese companies. Using CART, it is possible to calculate significance for each
variable. In order to predict the bankruptcy of Huarng, Yu and Chen (2005) applied
CART and demonstrated its superiority over other models. The main objection to their
research is that the sample included only 12 companies and 5 variables. Li, Sun and Wu
(2010) also confirmed the superiority of CART, highlighting the positive sides reflected
in ease of application and results, accuracy and stability, non-linear estimation and non-
parametric model. Durica et al. (2019) applied the CARD and CHAID decision tree
algorithm to predict the bankruptcy of Polish companies, whereby the average prediction
accuracy of the final models was 97.9% for the CART model and 98.2% for the CHAID
model. Application simplicity, handling of missing data and easy interpretation of results
were the most prominent advantages of these models.
Cha and Tappert (2009) applied a genetic algorithm to make decision trees compact
and near-optimal. By limiting the height of the tree, the authors state that the derived
model offers the same or better results than the best known algorithms.
Although they prefer to use the decision tree to predict corporate bankruptcy over
logistic regression models, neural networks and support vector machines, Olson et al.
state that comprehensibility, as a major advantage of the decision tree, is undermined by
too many rules in developing the tree itself. Avoiding this problem is possible by
controlling the „number of rules obtained from decision tree algorithms to a certain
degree, by setting different minimum levels of support― (Olson, et al. 2012 p. 464).
5. IMPLEMENTATION OF THE DECISION TREE TO DEVELOP BANKRUPTCY PREDICTION
MODELS OF MANUFACTURING AND TRADE COMPANIES IN THE REPUBLIC OF SERBIA
For the research purposes, a sample of 204 (large and medium-sized) manufacturing and
trade companies operating in Republic of Serbia was formed. Half of the sample companies are
bankruptcy companies from 2011 to 2017. The other half is made up of non-bankruptcy
companies, timed with those in bankruptcy. Companies that initiated bankruptcy proceedings
were selected on the basis of a list of active bankruptcy proceedings published by the
Bankruptcy Licensing Agency (Bankruptcy Statistics, 2018). Non-bankruptcy companies are
those that continuously and unhindered carry out their business activity, matched by industry
(manufacturing and trade companies ) and asset sizе with bankruptcy companies, selected from
the database of the Business Registers Agency (Unified Search, 2018).
The total sample is divided into two parts. One part represents the training sample and is
used for model development, while the other part is the validation sample and is used to
control, i.e. to check the predictive power of the developed model (Banasik, Crook, &
Thomas, 2003). The largest part of the total sample should be related to the model
construction, and it is accepted in practice that this ratio can be 80:20 or 70:30 in favor of
the training sample (Nikolić, et al. 2013). 80:20 ratio, 42 companies in validation sample and
162 companies in training sample were used in the paper.
Based on previous studies dealing with the corporate bankruptcy prediction, 56 initial
variables were selected. After a t-test that eliminated variables that did not significantly
influence bankruptcy prediction and eliminated multicollinearity, there were 15 variables
left to use to develop the decision tree:
134 S. VLAOVIĆ BEGOVIĆ, LJ. BONIĆ
(EBIT + amortization) / Interest expense
Net income / Sales
Net income / Total assets
Total liabilities / (Retained earnings + Amortization)
Working capital / Total assets
Current assets / Current liabilities
Total debt / Equity
Sales / Accounts receivable
Retained earnings / Total assets
Sales / Total assets
Cuurent assets / Sales
Total assets (log)
Cash flow from operation / Current liabilities
Current assets / Total assets
Long-term debt / Total assets
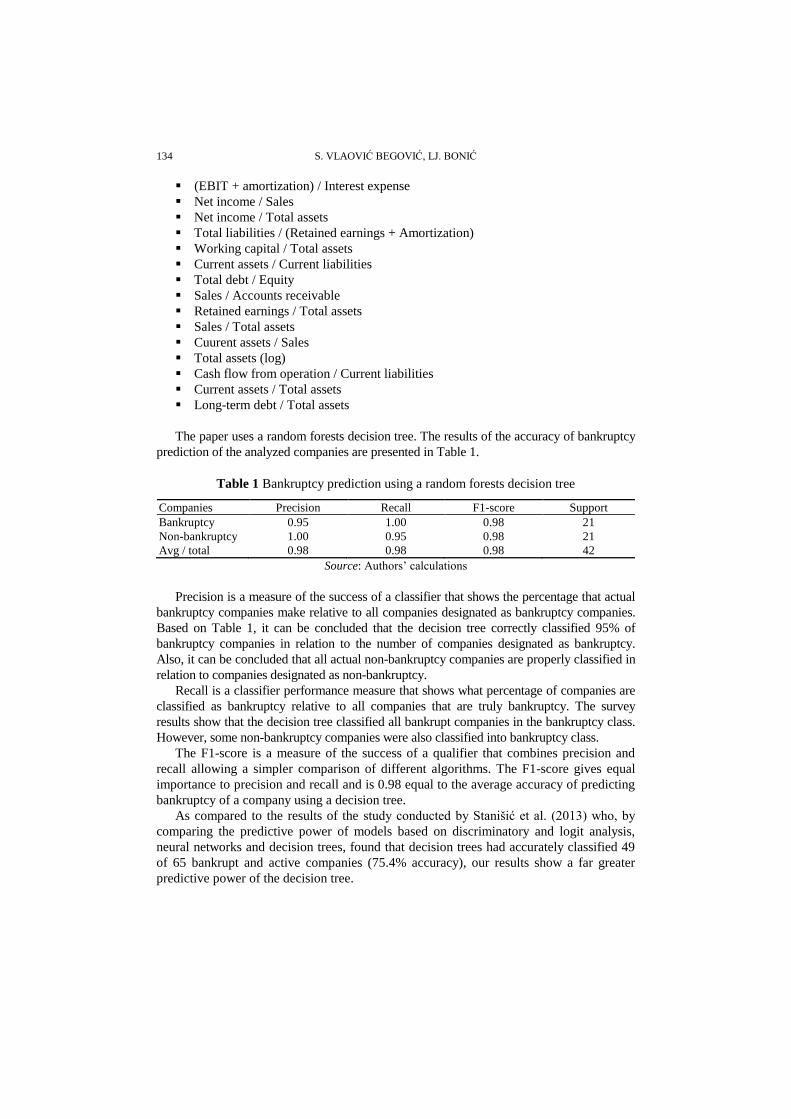
The paper uses a random forests decision tree. The results of the accuracy of bankruptcy
prediction of the analyzed companies are presented in Table 1.
Table 1 Bankruptcy prediction using a random forests decision tree
Companies Precision Recall F1-score Support
Bankruptcy 0.95 1.00 0.98 21
Non-bankruptcy 1.00 0.95 0.98 21
Avg / total 0.98 0.98 0.98 42
Source: Authors’ calculations
Precision is a measure of the success of a classifier that shows the percentage that actual
bankruptcy companies make relative to all companies designated as bankruptcy companies.
Based on Table 1, it can be concluded that the decision tree correctly classified 95% of
bankruptcy companies in relation to the number of companies designated as bankruptcy.
Also, it can be concluded that all actual non-bankruptcy companies are properly classified in
relation to companies designated as non-bankruptcy.
Recall is a classifier performance measure that shows what percentage of companies are
classified as bankruptcy relative to all companies that are truly bankruptcy. The survey
results show that the decision tree classified all bankrupt companies in the bankruptcy class.
However, some non-bankruptcy companies were also classified into bankruptcy class.
The F1-score is a measure of the success of a qualifier that combines precision and
recall allowing a simpler comparison of different algorithms. The F1-score gives equal
importance to precision and recall and is 0.98 equal to the average accuracy of predicting
bankruptcy of a company using a decision tree.
As compared to the results of the study conducted by Stanišić et al. (2013) who, by
comparing the predictive power of models based on discriminatory and logit analysis,
neural networks and decision trees, found that decision trees had accurately classified 49
of 65 bankrupt and active companies (75.4% accuracy), our results show a far greater
predictive power of the decision tree.
Developing a Model to Predict Corporate Bankruptcy Using Decision Tree in the Republic of Serbia 135
The results obtained are in line with the Bastos (2008) study, which established a
generalization accuracy of 94.03% for Australian data using boosted decision trees.
Largely similar results were obtained by Durica et al. (2019) who established an average
accuracy of the bankruptcy prediction model in cases of Polish companies of 97.9% for
the CART and 98.2% for the CHAID decision tree.
Berent et al. (2017) consider that the focus of research has shifted from maximizing
the accuracy of predictive models to analyzing the informational significance of
individual predictor variables. Berent et al. (2017) consider that the focus of research has
shifted from maximizing the accuracy of predictive models to analyzing the informational
significance of individual predictor variables. Depending on the business conditions,
explanatory variables in models vary from country to country (Kovacova et al., 2019).
Thus observed, the specifics of individual activities may also affect the selection of
variables. Using the decision tree, the relative importance of variables in bankruptcy
prediction first for all sample firms and then individually for manufacturing and trading
companies was examined.
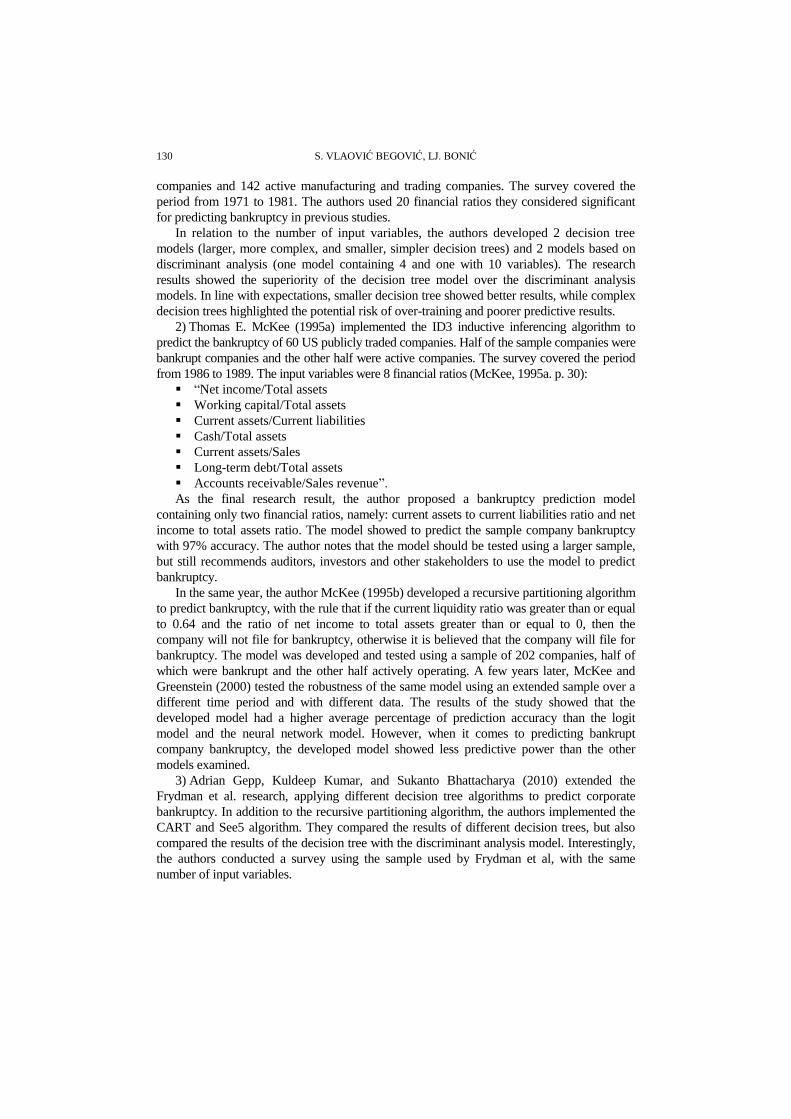
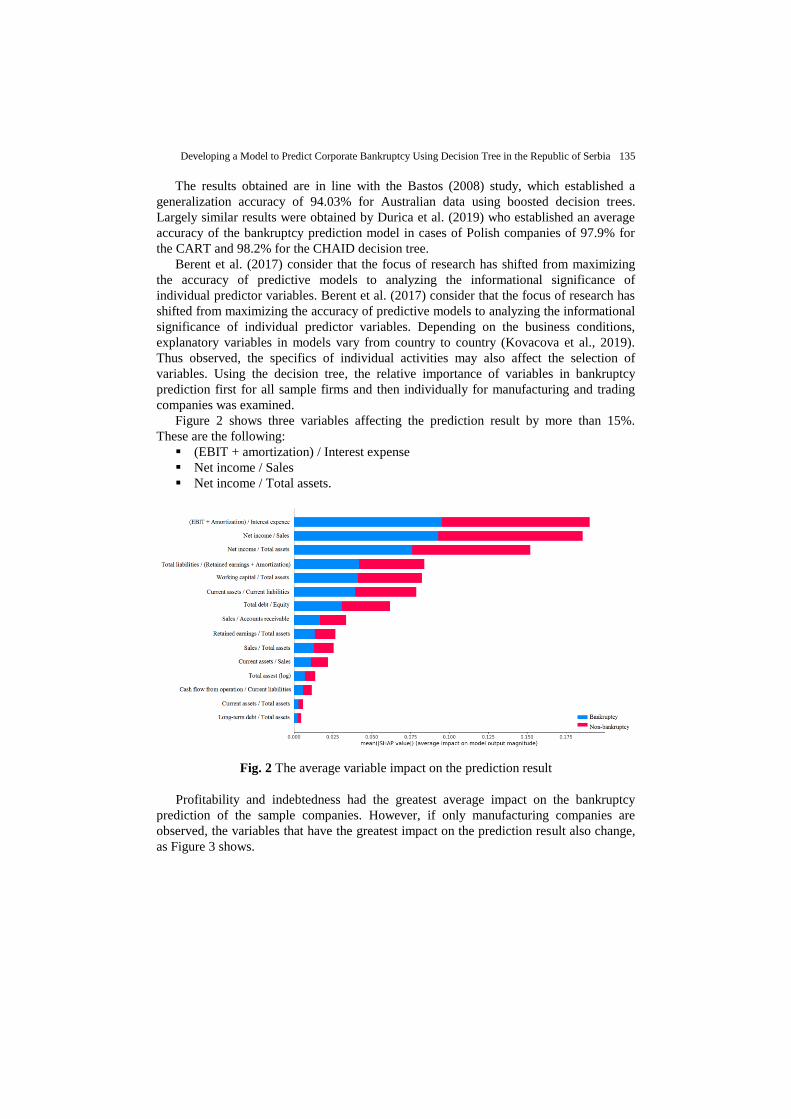
Figure 2 shows three variables affecting the prediction result by more than 15%.
These are the following:
(EBIT + amortization) / Interest expense
Net income / Sales
Net income / Total assets.
Fig. 2 The average variable impact on the prediction result
Profitability and indebtedness had the greatest average impact on the bankruptcy
prediction of the sample companies. However, if only manufacturing companies are
observed, the variables that have the greatest impact on the prediction result also change,
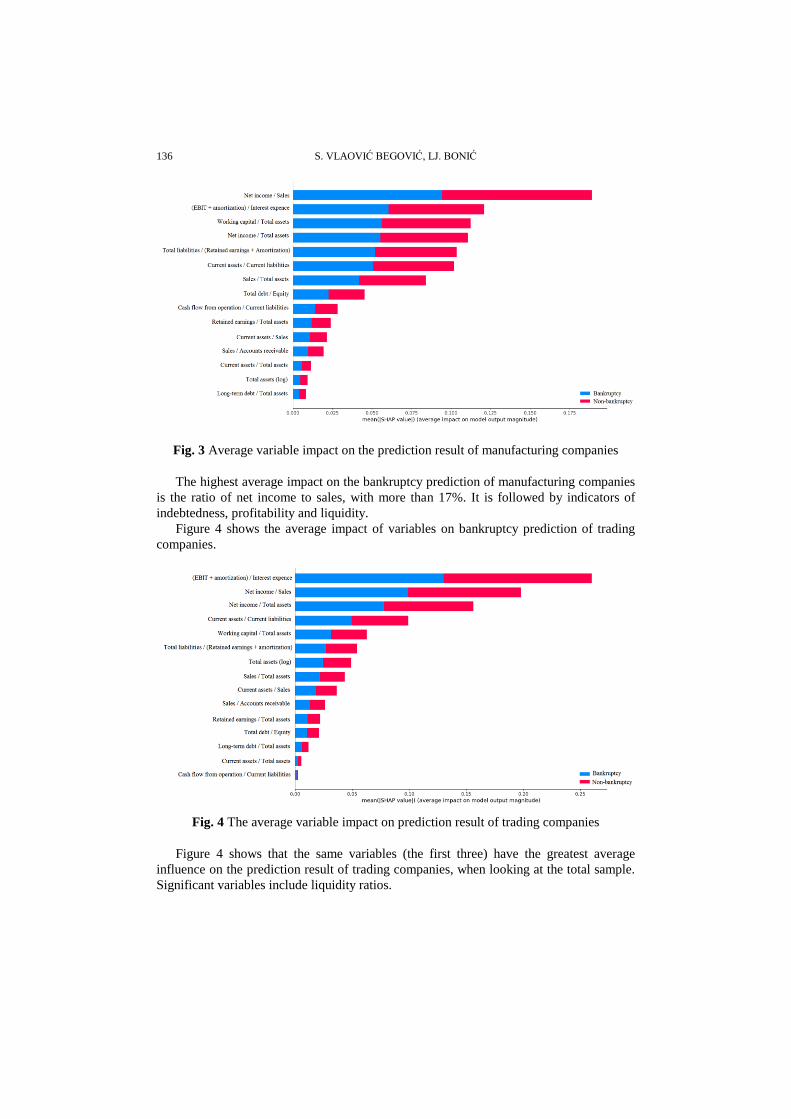
as Figure 3 shows.
136 S. VLAOVIĆ BEGOVIĆ, LJ. BONIĆ
Fig. 3 Average variable impact on the prediction result of manufacturing companies
The highest average impact on the bankruptcy prediction of manufacturing companies
is the ratio of net income to sales, with more than 17%. It is followed by indicators of
indebtedness, profitability and liquidity.
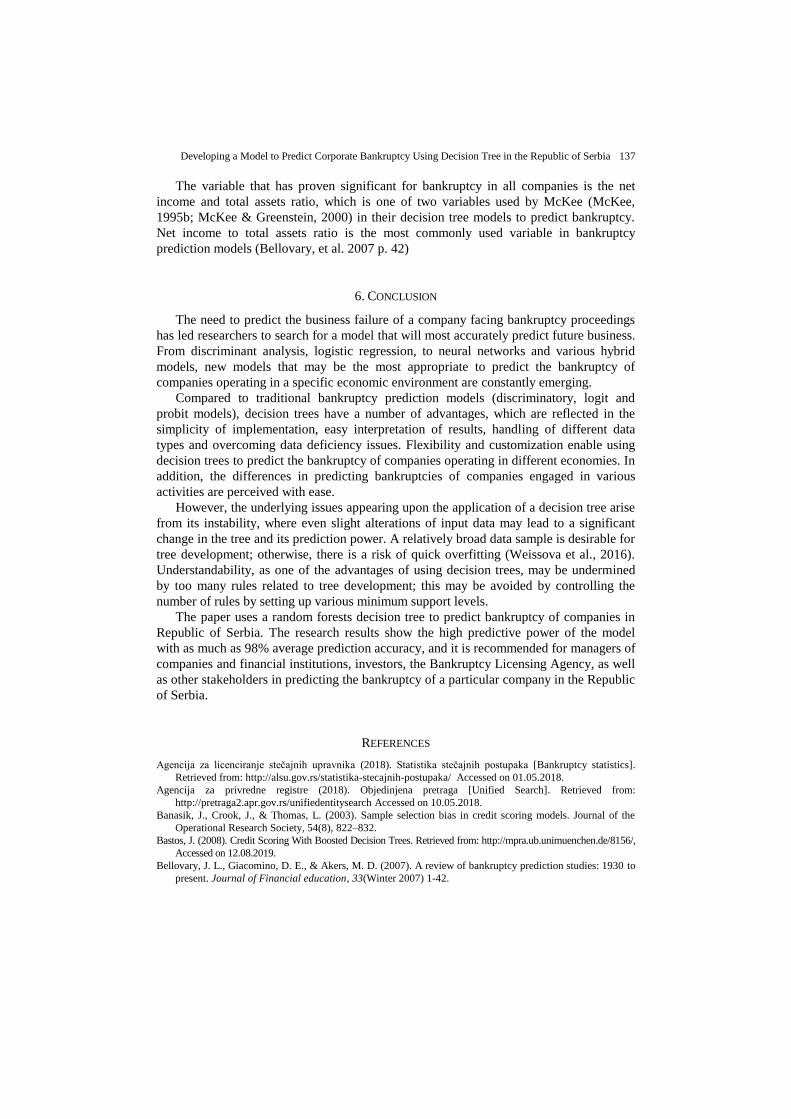
Figure 4 shows the average impact of variables on bankruptcy prediction of trading
companies.
Fig. 4 The average variable impact on prediction result of trading companies
Figure 4 shows that the same variables (the first three) have the greatest average
influence on the prediction result of trading companies, when looking at the total sample.
Significant variables include liquidity ratios.
Developing a Model to Predict Corporate Bankruptcy Using Decision Tree in the Republic of Serbia 137
The variable that has proven significant for bankruptcy in all companies is the net
income and total assets ratio, which is one of two variables used by McKee (McKee,
1995b; McKee & Greenstein, 2000) in their decision tree models to predict bankruptcy.
Net income to total assets ratio is the most commonly used variable in bankruptcy
prediction models (Bellovary, et al. 2007 p. 42)
6. CONCLUSION
The need to predict the business failure of a company facing bankruptcy proceedings
has led researchers to search for a model that will most accurately predict future business.
From discriminant analysis, logistic regression, to neural networks and various hybrid
models, new models that may be the most appropriate to predict the bankruptcy of
companies operating in a specific economic environment are constantly emerging.
Compared to traditional bankruptcy prediction models (discriminatory, logit and
probit models), decision trees have a number of advantages, which are reflected in the
simplicity of implementation, easy interpretation of results, handling of different data
types and overcoming data deficiency issues. Flexibility and customization enable using
decision trees to predict the bankruptcy of companies operating in different economies. In
addition, the differences in predicting bankruptcies of companies engaged in various
activities are perceived with ease.
However, the underlying issues appearing upon the application of a decision tree arise
from its instability, where even slight alterations of input data may lead to a significant
change in the tree and its prediction power. A relatively broad data sample is desirable for
tree development; otherwise, there is a risk of quick overfitting (Weissova et al., 2016).
Understandability, as one of the advantages of using decision trees, may be undermined
by too many rules related to tree development; this may be avoided by controlling the
number of rules by setting up various minimum support levels.
The paper uses a random forests decision tree to predict bankruptcy of companies in
Republic of Serbia. The research results show the high predictive power of the model
with as much as 98% average prediction accuracy, and it is recommended for managers of
companies and financial institutions, investors, the Bankruptcy Licensing Agency, as well
as other stakeholders in predicting the bankruptcy of a particular company in the Republic
of Serbia.
REFERENCES
Agencija za licenciranje stečajnih upravnika (2018). Statistika stečajnih postupaka [Bankruptcy statistics].
Retrieved from: http://alsu.gov.rs/statistika-stecajnih-postupaka/ Accessed on 01.05.2018.
Agencija za privredne registre (2018). Objedinjena pretraga [Unified Search]. Retrieved from:
http://pretraga2.apr.gov.rs/unifiedentitysearch Accessed on 10.05.2018.
Banasik, J., Crook, J., & Thomas, L. (2003). Sample selection bias in credit scoring models. Journal of the
Operational Research Society, 54(8), 822–832.
Bastos, J. (2008). Credit Scoring With Boosted Decision Trees. Retrieved from: http://mpra.ub.unimuenchen.de/8156/,
Accessed on 12.08.2019.
Bellovary, J. L., Giacomino, D. E., & Akers, M. D. (2007). A review of bankruptcy prediction studies: 1930 to
present. Journal of Financial education, 33(Winter 2007) 1-42.
138 S. VLAOVIĆ BEGOVIĆ, LJ. BONIĆ
Berent, T., Bławat, B., Dietl, M., Krzyk, P., & Rejman, R. (2017). Firm’s default — new methodological
approach and preliminary evidence from Poland. Equilibrium. Quarterly Journal of Economics and
Economic Policy, 12(4), 753-773.
Breiman, L., Friedman, J. H., Olshen, R., and Stone, C. J. (1984). Classification and Regression Trees. Wadsworth
& Brooks
Cha, S. H., & Tappert, C. C. (2009). A genetic algorithm for constructing compact binary decision trees.
Journal of pattern recognition research, 4(1), 1-13.
Frydman, H., Altman, E. I., & Kao, D. L. (1985). Introducing recursive partitioning for financial classification:
the case of financial distress. The Journal of Finance, 40(1), 269-291.
Gepp, A., Kumar, K., & Bhattacharya, S. (2010). Business failure prediction using decision trees. Journal of
forecasting, 29(6), 536-555.
Gepp, A., & Kumar, K. (2015). Predicting financial distress: a comparison of survival analysis and decision
tree techniques. Procedia Computer Science, 54, 396-404.
Härdle, W., & Simar, L. (2007). Applied multivariate statistical analysis. Berlin: Springer.
Huarng, K., Yu, H. K., & Chen, C. J. (2005). The application of decision trees to forecast financial distressed
companies. In 2005 International Conference on Intelligent Technologies and Applied Statistics, Taipei, Taiwan.
James, G., Witten, D., Hastie, T., & Tibshirani, R. (2013). An introduction to statistical learning. New York: Springer.
Kim, S. Y., & Upneja, A. (2014). Predicting restaurant financial distress using decision tree and AdaBoosted
decision tree models. Economic Modelling, 36, 354-362.
Kliestik, T., Misankova, M., Valaskova, K., & Svabova, L. (2018). Bankruptcy prevention: new effort to reflect
on legal and social changes. Science and Engineering Ethics, 24(2), 791-803.
Kovacova, M., Kliestik, T., Valaskova, K., Durana, P., & Juhaszova, Z. (2019). Systematic review of variables applied
in bankruptcy prediction models of Visegrad group countries. Oeconomia Copernicana, 10(4), 743-772.
Li, H., Sun, J., & Wu, J. (2010). Predicting business failure using classification and regression tree: An empirical
comparison with popular classical statistical methods and top classification mining methods. Expert Systems with
Applications, 37(8), 5895-5904.
McKee, T. E. (1995а). Predicting bankruptcy via induction. Journal of Information Technology, 10(1), 26-36.
McKee, T. E. (1995b). Predicting bankruptcy via an inductive inference algorithm: an extension. Artificial Intelligence
in Accounting, Finance and Tax, Huelva, 87-98.
McKee, T. E., & Greenstein, M. (2000). Predicting bankruptcy using recursive partitioning and a realistically
proportioned data set. Journal of forecasting, 19(3), 219-230.
Nayab, N. (n.d.). Review of Decision Tree Analysis Advantages. Retrieved from: https://www.brighthubpm.com/
project-planning/106000-advantages-of-decision-tree-analysis/, Accessed on 11.08.2019.
Najab, N. (n.d.). Review of Decision Tree Disadvantages. Retrieved form: https://www.brighthubpm.com/project-
planning/106005-disadvantages-to-using-decision-trees/, Accessed on 11.08.2019.
Nikolić, N., Zarkic-Joksimović, N., Stojanovski, D., & Joksimović, I. (2013). The application of brute force
logistic regression to corporate credit scoring models: Evidence from Serbian financial statements. Expert
Systems with Applications, 40(15), 5932-5944.
Olson, D. L., Delen, D., & Meng, Y. (2012). Comparative analysis of data mining methods for bankruptcy
prediction. Decision Support Systems, 52(2), 464-473.
Quinlan, R. (1986). Induction of decision trees. Machine learning, 1(1), 81-106.
Quinlan, R. (1987). Simplifying decision trees. International journal of man-machine studies, 27(3), 221-234.
Quinlan, R. (1993). C4.5: Programs for Machine Learning. Morgan Kaufmann, San Mateo.
Shirata, C. (1998). Financial ratios as predictors of bankruptcy in Japan: an empirical research (pp. 437–445).
Proceedings of the Second Asian Pacific Interdisciplinary Research in Accounting Conference, Osaka, Japan.
Sikavica, P., Hunjak, T., Begičević Ređep, N., & Hernaus, T. (2014) Poslovno odlučivanje [Business decision
making]. Zagreb: Školska knjiga.
Stanišić, N., Mizdraković, V., & Knežević, G. (2013). Corporate Bankruptcy Prediction in the Republic of
Serbia. Industrija. 41(4), 145-159.
Stanojević, S., Đorđević, N., & Volf, D. (2017). Primena kvantitativnih metoda u predviđanju poslovanja
privrednih društava [Applying the Machine Learning Method in Predicting Business Winners vs. Losers
through Financial Reports]. Oditor-časopis za Menadžment, finansije i pravo, 3(1), 92-101.
Weissova, I., Siekelova, A., & Kramarova, K. (2016). Modeling of company´s default probability in relation to
its credit risk. Global Journal of Business, Economics and Management: Current Issues, 6(2), 130-137.
Developing a Model to Predict Corporate Bankruptcy Using Decision Tree in the Republic of Serbia 139
RAZVIJANJE MODELA ZA PREDVIĐANJE STEČAJA
ZASNOVANOG NA STABLU ODLUČIVANJA
U REPUBLICI SRBIJI
Stabla odlučivanja vizuelizacijom procesa odlučivanja rešavaju problem koji zahteva donošenje
više sukcesivnih odluka. Često se koriste i za rešavanje problema klasifikacije i regresije. Jedan od
problema klasifikacije koji se pojavljuje jeste pravilno klasifikovanje preduzeća u stečaju i aktivnih
preduzeća, na osnovu čega je moguće predviditi verovatnoću pokretanje stečaja. U radu je
primenjeno random forests stablo odlučivanja za predviĎanje stečaja preduzeća u Republici Srbiji.
Rezultati istraživanja pokazuju visoku prediktivnu moć modela sa čak 98% prosečne tačnosti
predviĎanja, te se preporučuje njegovo korišćenje revizorima, investitorima, finansijskim institucijama
i ostalim stejkholderima za predviĎanje stečja preduzeća u Republici Srbiji.
Ključne reči: stabla odlučivanja, stečaj, predviĎanje, model