developing a pollution identification and correction
TRANSCRIPT

Prepared by:
Environmental Policy Matters, LLC Department of
Natural Resources and ParksWater and Land Resources Division
Prepared for: The Environmental Health Services Division of
DEVELOPING A POLLUTION IDENTIFICATION AND CORRECTION PROGRAM IN KING COUNTY
Proviso Response - Supplemental Report
July 2019

July 2019 Proviso Response - Supplemental Reportii
Jay L. Watson, PhDEnvironmental Policy Matters, LLC385 Ericksen Ave NE, Suite 112Bainbridge Island, WA 98110-1886
Julie HorowitzDepartment of Public Health – Seattle King CountyEnvironmental Health Services Division
Debra BouchardDepartment of Natural Resources and ParksWater and Land Resources Division
Date published: July 2019Layout and maps: King County Design and Civic Engagementfile: 1907_9499Lw_oss_pic_report.indd
Alternative formats available. Please call 206-477-4800 or TTY:711.
PREPARED BY
PREPARED FOR
Department of Natural Resources and ParksWater and Land Resources Division

Developing a Pollution Identification and Correction Program in King County 1
Public Health– Seattle & King County, Environmental Health Services Division proviso response – supplemental report:
Developing a Pollution Identification and Correction Program in King County
TABLE OF CONTENTS
List of Figures . . . . . . . . . . . . . . . . . . . . . . . . . . . . . . . . . . . . . . . . . . . . . . . . . . . . . . . . . . . . . . . . . . . . . . . .2
List of Tables . . . . . . . . . . . . . . . . . . . . . . . . . . . . . . . . . . . . . . . . . . . . . . . . . . . . . . . . . . . . . . . . . . . . . . . . .2
Executive Summary . . . . . . . . . . . . . . . . . . . . . . . . . . . . . . . . . . . . . . . . . . . . . . . . . . . . . . . . . . . . . . . . . .31. Introduction . . . . . . . . . . . . . . . . . . . . . . . . . . . . . . . . . . . . . . . . . . . . . . . . . . . . . . . . . . . . . . . . . . . .62. What is the Problem? . . . . . . . . . . . . . . . . . . . . . . . . . . . . . . . . . . . . . . . . . . . . . . . . . . . . . . . . . . . .73. What are the Sources of the Problem? . . . . . . . . . . . . . . . . . . . . . . . . . . . . . . . . . . . . . . . . . . . . .144. How Does the Problem Come to Light? . . . . . . . . . . . . . . . . . . . . . . . . . . . . . . . . . . . . . . . . . . . .215. How Can the Problem be Remedied; What is Successful in Other Counties? . . . . . . . . . . . .266. What is needed in King County, what is already in place and what are the gaps?. . . . . . . . .307. What next steps might be taken to move forward? . . . . . . . . . . . . . . . . . . . . . . . . . . . . . . . . . .36
References . . . . . . . . . . . . . . . . . . . . . . . . . . . . . . . . . . . . . . . . . . . . . . . . . . . . . . . . . . . . . . . . . . . . . . . . .37
AppendicesA. Fecal Bacteria in King County Waters . . . . . . . . . . . . . . . . . . . . . . . . . . . . . . . . . . . . . . . . . . . . . . .xB. Current Status of On-site Sewage Systems in King County, Age, Location and Failure
Mapping Project . . . . . . . . . . . . . . . . . . . . . . . . . . . . . . . . . . . . . . . . . . . . . . . . . . . . . . . . . . . . . . . . .xC. PIC Program Information from Other Counties . . . . . . . . . . . . . . . . . . . . . . . . . . . . . . . . . . . . . .xD. Survey of On-site sewage System Industry Professionals about Operation and
Maintenance of On-site Sewage Systems in King County, Washington . . . . . . . . . . . . . . . . . . .x

July 2019 Proviso Response - Supplemental Report2
Figure 1. Surface water monitoring sites compared to WA State Water Quality Standards and DOH guidelines (data from 2013 to 2017) (King County, Department of Natural Resources and Parks [DNRP], Water and Land Resources Division [WLRD]). . . . . . 9
Figure 2. Beaches and streams that are monitored for bacteria in King County (King County DNRP WLRD) . . . . . . . . . . . . . . . . . . . . . . . . . . . . . . . . . . . . . . . . . . . . . . . . . . . . .11
Figure 3. Seattle faces rising number of side-sewer failures (King County DNRP WLRD) . . . . . . . . . 15
Figure 4. On-site Sewage System failure graphic (King County DNRP WLRD) . . . . . . . . . . . . . . . . . . . 15
Figure 5. Livestock graphic (University of Nebraska - Lincoln) . . . . . . . . . . . . . . . . . . . . . . . . . . . . . . . 17
Figure 6. Child and pet - pathogen graphic (King County DNRP WLRD) . . . . . . . . . . . . . . . . . . . . . . . . 18
Figure 7. People experiencing homelessness along Lake Washington Ship Canal (King County DNRP WLRD) . . . . . . . . . . . . . . . . . . . . . . . . . . . . . . . . . . . . . . . . . . . . . . . . . . . . . 19
Figure 8. King County DNRP, WLRD water pollution complaint response process flow-chart (King County DNRP WLRD) . . . . . . . . . . . . . . . . . . . . . . . . . . . . . . . . . . . . . . . . . . . . . . . . . . . . . 22
Figure 9. Public Health – Seattle and King County OSS complaint response process flow-chart (King County DNRP WLRD) . . . . . . . . . . . . . . . . . . . . . . . . . . . . . . . . . . . . . . . . . . . . . . . . . . . . . 24
Figure 10. PIC Program interagency team model (King County DNRP WLRD) . . . . . . . . . . . . . . . . . . 29
Figure 11. King County interagency PIC Program model (King County DNRP WLRD) . . . . . . . . . . . . 32
Table 1. Illnesses that can result from contact with sewage and associated pathogens (Indiana State Department of Health, Centers for Disease Control and Prevention, and Public Health - Seattle and King County) . . . . . . . . . . . . . . . . . . . . . . . . . . . . . . . . . . . . . . .7
Table 2. Deficiencies identified during OSS inspections (Public Health – Seattle and King County) . . . . . . . . . . . . . . . . . . . . . . . . . . . . . . . . . . . . . . . . 16
Table 3. PIC program components in King County and their status; and table legend (relevant agencies, EPM, LLC) . . . . . . . . . . . . . . . . . . . . . . . . . . . . . . . . . . . . . . . . . . . . . . . . . . 33
LIST OF FIGURES
LIST OF TABLES

Developing a Pollution Identification and Correction Program in King County 3
EXECUTIVE SUMMARY
King County Executive Dow Constantine has made the Clean Waters and Healthy Habitat agenda a priority because the residents of King County value living in clean, safe, healthy places and having a vibrant natural environment around them. They swim, play on beaches and in rivers, boat, river raft and float, and engage in other water-related recreation. They also harvest and eat local shellfish. These activities are dependent on clean, pollution-free waters. To protect those values and activities, he stated, “We will focus on improving water quality and habitat across the region as our population grows.”
One central problem within this water quality context is the pollution of many areas in King County by fecal bacteria and other waterborne pathogens. There are currently 172 waterbodies in King County that are listed as impaired because of these bacteria, but only one-third (59) have some type of pollution control plan in place.
The result of these fecal bacteria and other pathogens in King County waters can be:
• closed swimming beaches,
• contaminated shellfish,
• contaminated drinking water wells, and
• illnesses from direct contact with sewage.
The most prominent sources of this type of pollution in King County are leaking and broken side-sewers, failing on-site sewage systems, poorly managed livestock manure, undisposed of pet wastes, and homeless persons without access to sanitary facilities.
Other, more sporadic sources include breaches of sewage conveyance and treatment infrastructure, combined sewer overflows, spills or unintended discharges from concentrated animal feeding operations, failures of large on-site sewage systems, marine vessel sewage discharges and spills, and wildlife.
“King County has a long history of protecting and restoring clean water and healthy habitat, through land conservation, habitat restoration, wastewater treatment, stormwater management, and clean-up of historic pollution. As this region experiences rapid growth and a changing climate, we must focus our future investments on actions that will bring the greatest gains for orca, salmon, and our quality of life
before it’s too late.”
– King County Executive, Dow Constantine
July 2019 Proviso Response - Supplemental Report4
These bacterial pollution problems come to the attention of government officials through water quality monitoring and referrals by regulatory agencies, citizen complaints, on-site sewage systems and side-sewer failures, and illness reports from physicians.
Even though these pathogen pollution problems are serious and difficult to address, other counties in Washington are successfully addressing them using a Pollution Identification and Correction (PIC) Program approach. A PIC Program approach may include the following components:
• addressing the worst pollution problems first and focusing on specific geographic areas,
• employing an approach that looks at all potential pollution sources,
• using an inter-agency team to coordinate all efforts,
• implementing a broad water quality communications, education, and outreach agenda,
• collecting, managing, and using comprehensive data,
• assigning specific staff to do the work (for highest accountability),
• taking appropriate and measured compliance and enforcement actions,
• adequately regulating relevant industries, and
• supporting the program with the necessary administrative staffing and sufficient and sustainable funding.
While King County has some PIC Program components currently in place, there are significant programmatic gaps that hinder the approach from being implemented and its benefits fully realized.
• There is no formal, standing interagency forum to coordinate a multi-agency effort. That effort would include planning all PIC-related work, identifying and targeting highest-risk geographic areas, jointly reviewing budgets/staffing/resource allocation, and assigning and coordinating interagency work teams.
• There is no coordinated water quality communication, education, and outreach effort in place to address the full range of bacterial pollution sources and to link it to the broader clean water initiative. Each agency conducts outreach related to its own efforts.
• While there are separate social equity strategies in place at different agencies, there is no overall social equity lens that can be applied to these pollution impacts or approaches to address them; however, there are clear disparities in impacts.
• Coordination with the 35 cities in King County that have their own independent water quality programs occurs only on a case-by-case, issue-by-issue, ad hoc basis.

Developing a Pollution Identification and Correction Program in King County 5
Still, King County’s current water quality monitoring and source tracing efforts represent a successful, foundational piece for a County PIC Program. They employ the latest, cutting-edge methodology to identify and track pollution incidents and patterns throughout King County.
The programmatic gaps listed above vary in their importance depending on the specific cause and source of pollution being addressed (that is, on-site sewage systems [OSS], side-sewers, livestock, pets, homeless persons without sanitary facilities, or other sources). However, this variability is, in itself, another complicating factor that more formal coordination through a county wide PIC Program can address.
If a PIC Program approach for King County is considered, it would need to be tailored to the County’s unique challenges and needs. It would also take some time to fully develop and implement the program. Some necessary, preliminary steps to discuss and validate this proposed PIC Program approach might include the following:
• holding meetings with key stakeholders,
• engaging the public,
• approaching current and potential inter-agency partners to form a “PIC Program Alliance,”
• evaluating the proposed process and PIC, Program functional elements through a service equity lens,
• forming an advisory committee to guide PIC Program development and implementation,
• beginning to identify “highest-risk areas” and developing pilot PIC projects in those geographically focused areas,
• working with OSS professionals to build a geographically focused, risk-based pilot project with OSS operation and maintenance reminders, community technical support, and financial incentives, and
• evaluating PIC Program funding and strategy approaches.

July 2019 Proviso Response - Supplemental Report6
1. INTRODUCTION
1 King County Executive Dow Constantine’s third-term agenda (November 8, 2017).2 King County Executive Dow Constantine’s Clean Water, Healthy Habitat agenda.3 Proviso in King County Council’s 2017–2018 Biennial Budget Ordinance 18409, Section 100, p. 1.4 Public Health–Seattle & King County, Environmental Health Services Division, Proviso Response, June 30, 2017.5 Identified by the Puget Sound Partnership, and supported by U.S. EPA, as a key strategy to protect and restore shellfish beds.
King County Executive Dow Constantine has made the Clean Water and Healthy Habitat agenda a priority because the residents of King County value living in clean, safe, healthy places and having a vibrant natural environment around them. They swim, play on beaches and in rivers, boat, river raft and float, and engage in other water-related recreation. They also harvest and eat local shellfish. These activities are dependent on clean, pollution-free waters.
In his third-term agenda, Executive Constantine stated, “In addition to King County’s groundbreaking work to fight climate pollution, we will focus on improving water quality and habitat across the region as our population grows. The Clean Water and Healthy Habitat Agenda will focus our efforts to clean up historic pollution, protect public health and safety, and restore salmon habitat.”1
His Agenda addresses various issues and approaches. In articulating those, he further stated, “King County has a long history of protecting and restoring clean water and healthy habitat, through land conservation, habitat restoration, wastewater treatment, stormwater management, and clean-up of historic pollution. Even with these efforts, orcas remain critically endangered and Puget Sound salmon runs continue to decline. As this region experiences rapid growth and a changing climate, we must focus our future investments on actions that will bring the greatest gains for orca, salmon, and our quality of life before it’s too late.”2
The challenge raised in Executive Constantine’s Agenda is to keep waters in the Puget Sound region free of pollution. This report was developed to help address one of the water pollution elements within the Executive’s Agenda. That element is the chronic pathogen and fecal bacteria pollution of King County’s surface waters, groundwaters, rivers, streams, lakes, and Puget Sound. This report is also intended to respond to related issues raised by the King County Council in their 2017 to 2018 budget3, and to build upon and augment a previously submitted proviso response report.4
While various approaches have been tried throughout Washington state to address chronic pathogen pollution problems, the most effective remedies have been the development and implementation of county-level Pollution Identification and Correction (PIC) Programs.5 This report similarly recommends the development of a PIC Program that is specifically tailored to serve King County’s needs. In doing so, the report describes the pathogen pollution problem in detail, its sources, and how it comes to light. It explains the PIC Program remedy that has been successful in other Washington counties. It then focuses on what is needed in King County, what is already in place, and what gaps exist. Lastly, it proposes some next steps to move the dialogue forward about bacterial pollution and its potential remedy.
Developing a Pollution Identification and Correction Program in King County 7
2. WHAT IS THE PROBLEM?
PathogensPathogens are bacteria, viruses, and other microorganisms that make people ill and, in some cases, cause death. Worldwide, there are an estimated 1,407 species of pathogens that can infect humans. Those pathogens include 538 species of bacteria, 208 types of viruses, 57 parasitic protozoa species, and several fungi and helminths (parasitic worm) species.6
The pathogens are transmitted to humans in a variety of ways, depending on the specific pathogen. Some are transmitted in only one way, whereas others can take multiple pathways to infect humans. This report addresses pathogens that originate from human and animal wastes (fecal bacteria) and are transmitted through water.
Locally, the problem is that a variety of waterborne pathogens are polluting many areas in King County.7 There are 172 water bodies in King County that are listed as impaired because of bacteria, but only one-third (59) have some form of pollution control plan in place.8
Illnesses from PathogensA variety of human illnesses can result from direct contact with sewage. Most pathogens in sewage cause diarrhea, nausea, and vomiting. They can also cause more severe illnesses and long-term health effects, especially among high-risk populations such as infants, the elderly, and people with other diseases. Table 1 lists diseases that can occur in the United States upon contact with sewage or water contaminated with sewage.
6 Pathogens. 2015 June; 4(2), p. 310.7 King County 2018 Fecal Bacteria report, pp. v and 23.8 Ibid.9 Indiana State Department of Health – pathogens Web page.10 Centers for Disease Control and Prevention – diseases information Web page.11 Handbook of Water and Wastewater Microbiology, pp. 185–192.
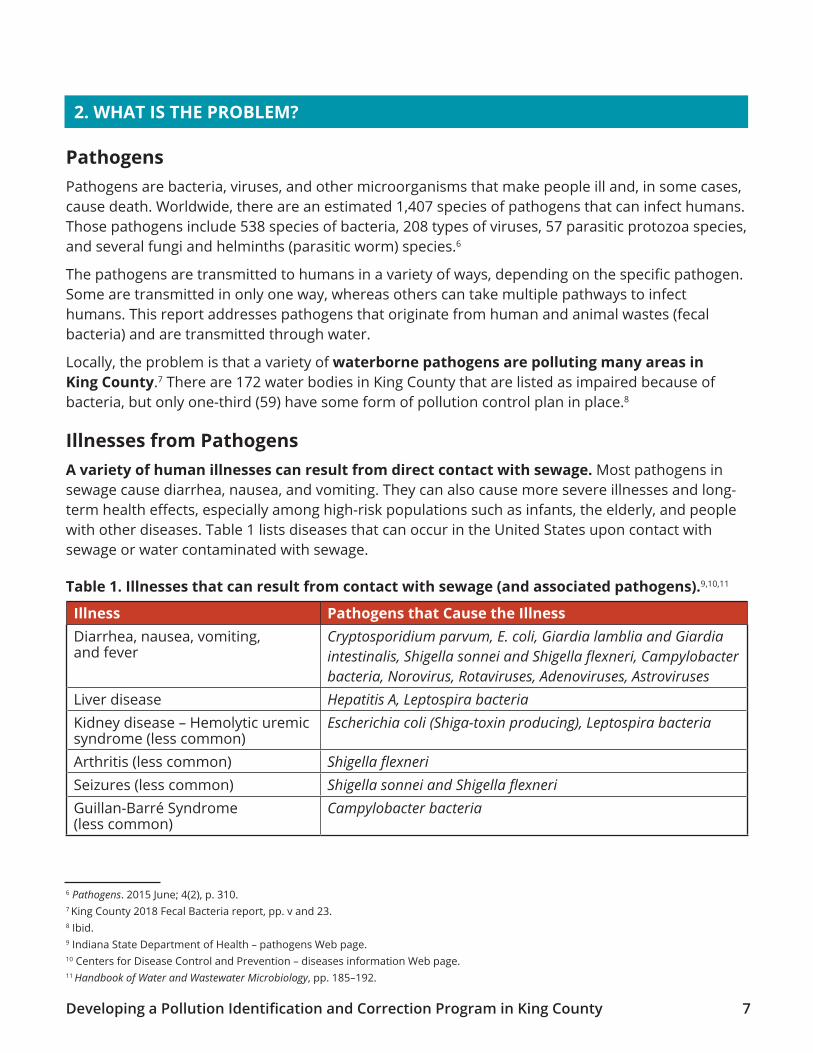
Table 1. Illnesses that can result from contact with sewage (and associated pathogens).9,10,11
Illness Pathogens that Cause the IllnessDiarrhea, nausea, vomiting, and fever
Cryptosporidium parvum, E. coli, Giardia lamblia and Giardia intestinalis, Shigella sonnei and Shigella flexneri, Campylobacter bacteria, Norovirus, Rotaviruses, Adenoviruses, Astroviruses
Liver disease Hepatitis A, Leptospira bacteriaKidney disease – Hemolytic uremic syndrome (less common)
Escherichia coli (Shiga-toxin producing), Leptospira bacteria
Arthritis (less common) Shigella flexneriSeizures (less common) Shigella sonnei and Shigella flexneriGuillan-Barré Syndrome (less common)
Campylobacter bacteria

SNOHOMISH COUNTYKING COUNTY
KING CO.PIERCE COUNTY
KIN
G C
OUN
TY
KITS
AP C
OUN
TY
Lake
Sam
mam
ish
Puget So
und
North Fork
Snoq
ualm
ie R
iver
Middle Fork Snoqualm
ie
Riv
er
S. Fork Snoqualmie River
Cedar River
Green River
Samm
amish
River
Elliott Bay
Snoqualmie R
iver
White River
T
olt
Rive
r
Lake
Was
hin
gto
n
KIRKLAND
REDMOND
SAMMAMISH
DUVALL
WOODINVILLEBOTHELLLAKE
FORESTPARK
KENMORE
MERCERISLAND
RENTON
TUKWILA
SEATTLE
SEATTLE
SEATTLE
BURIENSEATAC
BELLEVUE
NEWCASTLEISSAQUAH
SNOQUALMIE
CARNATION
NORTHBEND
SHORELINE
FEDERALWAY
AUBURN
PACIFIC
KENT
DESMOINES
VashonIsland
BLACKDIAMOND
MAPLEVALLEY
COVINGTON
ENUMCLAW
520
522
5
520
522
202
203
509
167
515
90
405
405
99
99
99
5
5
900
90
164
18
18
516
169
169
410
0 3 6 Miles
2019
N
Map produced by King County IT Design and Civic Engagement.File name: 1903_9499w_kc_wq_standards.ai
KING COUNTYSurface water monitoring sites compared to Washington State Ecology water quality standards and State Department of Health guidelines from 2013-2017
Pass
Fail
Figure 1.
The use of the information in this map is subject to the terms and conditions found at: kingcounty.gov/services/gis/Maps/terms-of-use.aspx. Your access and use is conditioned on your acceptance of these terms and conditions.
July 2019 Proviso Response - Supplemental Report8
Testing for Pathogens with Fecal Indicator BacteriaTesting for each possible pathogen would be extremely complicated and prohibitively expensive. To reduce this cost and complexity, water quality testing focuses on detecting the presence of indicator bacteria (which are used to discover and estimate the amount of fecal contamination in the water). Those indicator bacteria are fecal coliform, Escherichia coli (E. coli), and Enterococci. If these bacteria are present in the environment, the danger of illness from them is present; it is also highly probable that many other harmful pathogens are present as well.
Fecal coliform, a subset of total coliform bacteria, mostly originate in the gut of humans and other mammals. However, this group of bacteria also contains some species that are not necessarily fecal in origin. E. coli originate exclusively in the gut of humans and other warm-blooded animals (for example, pets, livestock, wildlife, marine mammals, waterfowl and other birds, etc.), so they are becoming a preferred indicator bacteria in fresh waters. If E. coli are present, it is clear that fecal matter is present in the water body and that humans and/or animals are the source of the pollution. Enterococci are also commonly found in the gut of humans and warm-blooded animals. They are a preferred indicator of fecal matter pollution at saltwater beaches.12
Through sampling and water quality testing programs, local and state agencies have found elevated levels of fecal coliform and E. coli in King County surface waters, groundwaters, rivers, streams, lakes, and in Puget Sound (as shown in Figure 1). This indicates that human sewage and/or animal excrement have been released into the environment.13
12 U.S. EPA – fecal bacteria information Web page.13 King County 2018 Fecal Bacteria report, pp. v and 23.

SNOHOMISH COUNTYKING COUNTY
KING CO.PIERCE COUNTY
KIN
G C
OUN
TY
KITS
AP C
OUN
TY
Lake
Sam
mam
ish
Puget So
und
North Fork
Snoq
ualm
ie R
iver
Middle Fork Snoqualm
ie
Riv
er
S. Fork Snoqualmie River
Cedar River
Green River
Samm
amish
River
Elliott Bay
Snoqualmie R
iver
White River
T
olt
Rive
r
Lake
Was
hin
gto
n
KIRKLAND
REDMOND
SAMMAMISH
DUVALL
WOODINVILLEBOTHELLLAKE
FORESTPARK
KENMORE
MERCERISLAND
RENTON
TUKWILA
SEATTLE
SEATTLE
SEATTLE
BURIENSEATAC
BELLEVUE
NEWCASTLEISSAQUAH
SNOQUALMIE
CARNATION
NORTHBEND
SHORELINE
FEDERALWAY
AUBURN
PACIFIC
KENT
DESMOINES
VashonIsland
BLACKDIAMOND
MAPLEVALLEY
COVINGTON
ENUMCLAW
520
522
5
520
522
202
203
509
167
515
90
405
405
99
99
99
5
5
900
90
164
18
18
516
169
169
410
0 3 6 Miles
2019
N
Map produced by King County IT Design and Civic Engagement.File name: 1903_9499w_kc_wq_standards.ai
KING COUNTYSurface water monitoring sites compared to Washington State Ecology water quality standards and State Department of Health guidelines from 2013-2017
Pass
Fail
Figure 1.
The use of the information in this map is subject to the terms and conditions found at: kingcounty.gov/services/gis/Maps/terms-of-use.aspx. Your access and use is conditioned on your acceptance of these terms and conditions.
Developing a Pollution Identification and Correction Program in King County 9

July 2019 Proviso Response - Supplemental Report10
Impacts from Bacteria and PathogensBacteria and pathogens in our waters can result in the following impacts (and illnesses associated with those impacts):
• closure of swimming beaches,
• shellfish contamination, and
• drinking water well contamination.
CLOSURE OF SWIMMING BEACHESIllnesses from swimming and similar recreation in polluted water and the closure of swimming beaches has happened in King County. As examples, in 2013, 11 cases of recreational, waterborne Norovirus were reported.14 In 2016, 17 cases of Norovirus, originating from untreated human sewage, were reported. Norovirus is highly contagious and causes an illness commonly referred to as viral gastroenteritis or stomach flu. It causes inflammation of the stomach and intestines, resulting in diarrhea, vomiting, and stomach pain.15
King County, the Washington State Department of Ecology (Ecology), and some cities monitor bacteria at a limited number of beaches. Those beaches are closed when water quality monitoring detects bacteria in amounts that exceed health and safety standards and endanger the public. This often varies by location and time of year. Figure 2 shows marine and freshwater beaches that have exceeded one or both of the criteria for fecal indicator bacteria over a period of nine years.
During the past 18 years, there have been 72 occurrences of elevated bacterial counts at freshwater beaches and water bodies throughout King County. Many of those occurrences resulted in closures to public swimming and recreational uses to prevent illness.
Those freshwater beaches and water bodies in King County that have been affected are as follows:
• Lake Washington: Andrews Bay/Seward Park, Enatai Beach Park, Gene Coulon Memorial Beach Park, Houghton Beach Park, Juanita Beach Park, Luther Burbank Park, Madison Park, Magnuson Park, Marina Park, Matthews Beach Park and Thornton Creek, Medina Beach Park, Meydenbauer Bay, Newcastle Beach Park, Pritchard Island
• Lake Sammamish: Idylwood Park, Lake Sammamish State Park
• Shoreline: Shoreview Park/Hidden Lake
• Maple Valley: Lake Wilderness Park
• Seattle: Green Lake
• Sammamish: Pine Lake Park16
14 Washington State 2016 Communicable Disease Report, pp.36–37.15 Washington State Department of Health – Norovirus in shellfish Web page. 16 King County’s swimming beach closure summaries Web page.

SNOHOMISH COUNTYKING COUNTY
KING CO.PIERCE COUNTY
K IN
G C
OUN
TY
KITS
AP C
OUN
TY
Lake
Sam
mam
ish
Puget So
und
North Fork
Snoq
ualm
ie R
iver
Middle Fork Snoqualm
ie
Riv
er
S. Fork Snoqualmie River
Cedar River
Green River
Samm
amish
River
Elliott Bay
Snoqualmie River
White River
T
olt
Rive
r
Lake
Was
hin
gto
n
KIRKLAND
REDMOND
SAMMAMISH
DUVALL
WOODINVILLEBOTHELLLAKE
FORESTPARK
KENMORE
MERCERISLAND
RENTON
TUKWILA
SEATTLE
SEATTLE
SEATTLE
BURIEN
SEATAC
BELLEVUE
NEWCASTLEISSAQUAH
SNOQUALMIE
CARNATION
NORTHBEND
SHORELINE
FEDERALWAY
AUBURN
PACIFIC
KENT
DESMOINES
VashonIsland
BLACKDIAMOND
MAPLEVALLEY
COVINGTON
ENUMCLAW
520
522
5
520
522
202
203
509
509
167
515
90
405
405
99
99
99
9
5
5
900
90
164
18
18
516
169
169
410
0 3 6 Miles
2019
N
Map produced by King County IT Design and Civic Engagement.File name: 1903_9499w_kc_08-17_beach_mon.ai
KING COUNTYBeaches that are monitored for bacteria in King County
Beaches where fecal bacteria exceed one or both parts of criteria, 2008-2017
Figure 2.
The use of the information in this map is subject to the terms and conditions found at: kingcounty.gov/services/gis/Maps/terms-of-use.aspx. Your access and use is conditioned on your acceptance of these terms and conditions.
Note: Marine Beaches monitored monthlyFreshwater Beaches monitored weekly (May - September)
Developing a Pollution Identification and Correction Program in King County 11

July 2019 Proviso Response - Supplemental Report12
It should be noted that these occurrences are only known because of active monitoring. Many beaches in King County are not monitored, so any incidents of bacterial contamination would only be known if an illness had been contracted and identified as happening because of swimming at a certain beach—and then only if it was reported by a physician. Additionally, exposures and illness can occur during other water-related activities such as boating, river rafting and floating, and wading. There is no current program in King County that tests waters or tracks illnesses related to these activities.
CONTAMINATION OF SHELLFISHContamination of shellfish, closures of commercial shellfish harvesting beds, closures of recreational harvest on beaches, and illnesses from eating contaminated shellfish are also serious concerns. Norovirus, described previously, is also a contaminant prevalent in shellfish. In 2017, KING 5 News reported, “Raw oysters are the suspected source of a norovirus outbreak in King County.” Between January and March of 2017, up to 39 people came down with the symptoms of norovirus, according to the Public Health Department. “Raw oysters have long been recognized as a source of norovirus,” said Dr. Meagan Kay, a Public Health medical epidemiologist. “Raw or undercooked oysters seem to be a particular problem.”17 Although the shellfish described in this news report were probably harvested from a variety of beaches in Puget Sound and on the Washington coast, this threat also exists for shellfish harvested from King County beaches and shellfish beds.
Bacterial contamination has led to the closure of many commercial and recreational shellfish harvest areas in King County. Some examples include the year-round prohibition of harvest from 1,595 acres of commercial shellfish growing areas in King County; a 124-acre area in Poverty Bay where shellfish harvest is prohibited from June 1 to November 30; and the closure of 16 of the 37 public shellfish beaches in King County because they do not meet health standards.18
These cases also have economic consequences in addition to their public health threats. As an example, in the Quartermaster Harbor area (Vashon Island) alone, there are approximately 15 million pounds of geoduck valued at $150 million.19 The Puyallup Tribe has a federally protected treaty right to half of that resource.20 It is estimated that the tribe and its members are potentially forgoing nearly $1 million per year in revenue, or a total of $24 million since their right to harvest shellfish was restored by a federal court decision in 1994.21 There is another $1 million per year of revenue that could potentially be realized by tribal members if the currently unclassified areas were not threatened by bacterial pollution and could be approved. The previous amounts represent only the tribal portion of forgone revenue from this area. The State of Washington, on behalf of its citizens, is entitled to the other half of those resources, which are also not being harvested.
17 “Raw oysters linked to King County norovirus outbreak,” KING 5 TV News report dated Marcy 28, 2017.18 King County 2018 Fecal Bacteria report, pp. 5–6.19 Extrapolated from a partial survey of Quartermaster Harbor conducted by the Puyallup Tribe; information from David Winfrey,
Puyallup Tribal Shellfish Biologist.20 See United States v. Washington “Shellfish I.”21 David Winfrey.

Developing a Pollution Identification and Correction Program in King County 13
CONTAMINATION OF DRINKING WATER WELLSLastly, there is the possibility of bacterial contamination of drinking water wells and resulting illnesses from consuming polluted water. The Washington State Department of Health (DOH) ensures the safety of all wells with 15 or more service connections or that serve 25 or more people for 60 or more days per year. DOH currently maintains a total of 40 active drinking water alerts for various water systems with 15 or more connections across the state. Eighteen of these alerts are for bacterial contamination. There is one current alert in King County, for E. coli contamination, issued for those using water from the Cove Beach Water Association.22
For wells with less than 15 connections, King County officials estimate that there are between 20,000 and 30,000 single-home wells and around 1,700 wells with two to 14 connections in King County.23 For each of these wells, the burden of testing for contamination is wholly on the well owner. Additionally, testing and reporting are entirely voluntary, so it is unknown how many or how often wells with less than 15 connections become contaminated.
22 From Washington State Department of Health – drinking water alerts Web page.23 Estimates from King County Department of Natural Resources and Parks Water and Land Resources Division.

July 2019 Proviso Response - Supplemental Report14
3. WHAT ARE THE SOURCES OF THE PROBLEM?
As previously stated, people and warm-blooded animals generate a number of pathogens in their fecal matter. That fecal matter can enter the environment and become a danger to public health. It can be detected by the presence of several indicator bacteria, including fecal coliform, E. coli, and Enterococci. A recent King County study found increased amounts of these indicator bacteria in areas with greater:
• population density,
• numbers of on-site sewage systems, and
• agricultural/livestock activity.24
In areas with greater population density, a number of pollution contributors might be involved. These could include:
• leaking/breached side-sewers (in areas served by sewers and with fewer OSS),
• pets, and
• homeless persons without access to sanitary facilities.
These sources of pathogen pollution are particularly challenging because they are chronic and ongoing. They are also non-point sources of pollution. Non-point sources are diffuse, come from multiple origins, and are hard to locate and regulate.
There are a number of other potential sources that could contribute to pathogen pollution of our waterways. These include:
• large on-site sewage systems (LOSS),
• combined sewer overflows (CSOs),
• municipal sewer collection/conveyance pipes, infrastructure, and treatment plants,
• dairy and large commercial agricultural operations/concentrated animal feeding operations (CAFOs),
• marine vessel discharges, and
• wildlife.
However, most of these sources are episodic and temporary in nature. They are also more similar to point sources of pollution. Point sources can be thought of as “end-of-pipe” sources. They have some identifiable origin (an industry smoke stack, a sewer plant outfall pipe, etc.). This makes them easier to locate, regulate, and correct than non-point sources. Wildlife and marine-vessel discharges are the exceptions in this group. They more closely resemble non-point-source pollution.
24 King County 2018 Fecal Bacteria report, p. 14 and pp. 20–22.

Developing a Pollution Identification and Correction Program in King County 15
Chronic/Non-Point Sources of Pollution
LEAKING/BREACHED SIDE-SEWERS (the privately owned pipe connecting a home or business to a municipal sewer collection line)“Concrete pipe has a life span of about 80 years on the top end,” explains Parnell Downey, owner of Metropolitan Sewer. “Seattle’s at that magical age where most of the houses are getting up around that age, and the pipes are all original—they’ve never been replaced.” Beneath Seattle’s older homes and apartment buildings, side-sewers are a festering problem. City records show a steady increase in the number of permits for repairing or installing new side-sewers: from 3,255 in 2011 to 4,675 in 2015. Because these pipes can cost many thousands of dollars to repair and can zigzag across properties with different owners, side-sewers are a growing headache for Seattle’s housing market. While some owners fix their side-sewers after discovering a sewage spill, often the issue only surfaces in the course of buying or selling a home. “It’s a huge problem,” said Carol Ard, a Windermere real-estate agent. “We all hold our breath until we know the sewer’s OK.”25
FAILING AND/OR IMPROPERLY OPERATED OSS (also commonly called “septic systems”)King County estimates that there are approximately 85,000 OSS in both the cities and unincorporated areas of King County. Many OSS were originally installed as temporary, short-term treatment methods. It was presumed that municipal sewers would be extended to those housing areas in the future. In many cases, those anticipated sewer services never arrived. Now, the existing OSS are the de facto, permanent sewage treatment system for those areas.
Another fact is that most OSS have a design life of 30 to 50 years, if properly designed, installed, operated, and maintained. However, King County estimates that over 53,000 OSS (62 percent) are 30 years or older (based on the date that the house was built or repaired).26 In addition, if they were installed as a temporary treatment system 25 The Seattle Times “Side-sewers” news story dated February, 17, 2016.26 This estimate was developed by Public Health OSS Program staff using King County Assessor data and Public Health OSS records.
Road Sidewalk
City right of way Private property
PROPERTYLINE
Main Sewer Line
Side Sewer
Property owner’s responsibility
Based on Seattle Times illustration, 2/17/16
Half of Seattle’s housing was built before 1961, and the sewers beneath homes are reaching the end of their lives.
septictank
drinkingwaterwell
groundwater
drainfield
Figure 3. Seattle faces rising number of side-sewer failures
Figure 4. A failing on-site Sewage (Septic) System can contaminate the groundwater

July 2019 Proviso Response - Supplemental Report16
before sewers arrived, they may not have been installed with a reserve area. That means that when they fail or need to be replaced, there is no room for a new drainfield. The new OSS will probably have to be a much more sophisticated system and, consequently, will be far costlier than the previous conventional gravity system because of these constraints.
As an example, installing a new conventional gravity system can cost between $10,000 and $20,000 or more, depending on a variety of factors like design costs, site accessibility, materials/labor costs, permit fees, and so on. Non-conventional systems can cost between $20,000 and $50,000 or more, depending on their size and complexity. There are also additional costs, which will add up over time, because of the more intensive operation and maintenance (O&M) requirements for those systems.27
To provide some sense of looming OSS problems, only about 5,800 (about 7 percent) of the approximately 85,000 OSS in King County were inspected in 2017. However, nearly half of those 5,800 OSS that were inspected (a little over 2,700) had a deficiency. In addition, only about one-quarter (around 680) of those systems with problems were identified as a result of regular maintenance or a complaint. Over 75 percent (a little over 2,000) of those systems with problems were only found as a result of the required inspection before a property sale or transfer. Without pre-sale inspections, those deficient systems might not have been identified and addressed for months or years until they failed or maintenance was performed.28
Table 2. Deficiencies identified during OSS inspections in 2017.29
Type of OSS Deficiency Approximate Number of Inspections with the Deficiency*
Inspection with any type of deficiency 2737Sewage surfacing 53Repair needed 919Pumping needed 1691Required site conditions not met 509Other (e.g., component inaccessible, drainfield lateral partially clogged, etc.)
1713
*Some inspections had multiple deficiencies.
Between 2013 and 2017, King County received reports of 1,335 OSS failures and 1,327 suspected failures, for a total of 2,662 failures.30 It must be noted that this number does not include failures that were not reported, were repaired without a permit, were unknown or ignored by the owner, or escaped detection in other ways. These failures occurred across King County, in most of cities and unincorporated areas (see Appendix B, OSS Failure Map).
Of those 2,662 failures or suspected failures, King County has confirmed that about one-third (730) have been repaired. Many of the other failures might have been repaired during maintenance inspections, but that is uncertain. Public Health, which keeps those records, does not have a robust tracking system that can ensure that repairs are made.
27 Cost estimates from Public Health OSS Program staff.28 Compiled by Public Health OSS Program staff.29 Ibid.30 From Public Health’s Septic System Ages and Failure Mapping Project.
Developing a Pollution Identification and Correction Program in King County 17
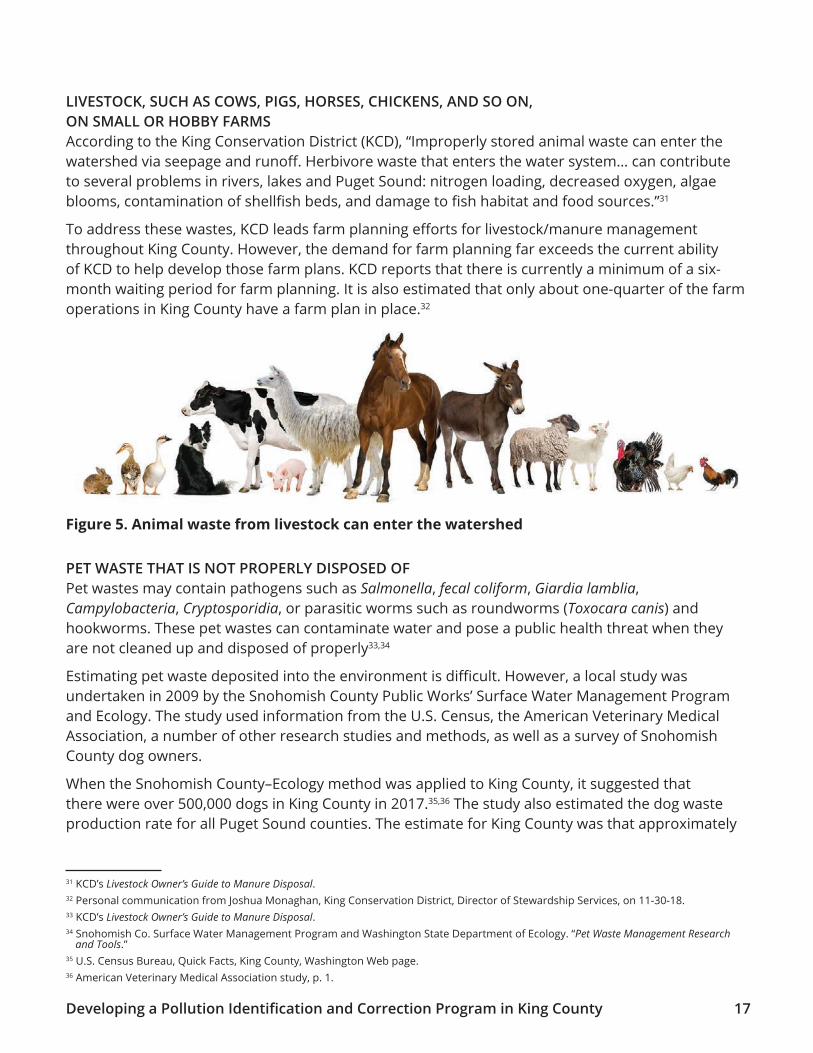
LIVESTOCK, SUCH AS COWS, PIGS, HORSES, CHICKENS, AND SO ON, ON SMALL OR HOBBY FARMS
According to the King Conservation District (KCD), “Improperly stored animal waste can enter the watershed via seepage and runoff. Herbivore waste that enters the water system… can contribute to several problems in rivers, lakes and Puget Sound: nitrogen loading, decreased oxygen, algae blooms, contamination of shellfish beds, and damage to fish habitat and food sources.”31
To address these wastes, KCD leads farm planning efforts for livestock/manure management throughout King County. However, the demand for farm planning far exceeds the current ability of KCD to help develop those farm plans. KCD reports that there is currently a minimum of a six-month waiting period for farm planning. It is also estimated that only about one-quarter of the farm operations in King County have a farm plan in place.32
PET WASTE THAT IS NOT PROPERLY DISPOSED OF Pet wastes may contain pathogens such as Salmonella, fecal coliform, Giardia lamblia, Campylobacteria, Cryptosporidia, or parasitic worms such as roundworms (Toxocara canis) and hookworms. These pet wastes can contaminate water and pose a public health threat when they are not cleaned up and disposed of properly33,34
Estimating pet waste deposited into the environment is difficult. However, a local study was undertaken in 2009 by the Snohomish County Public Works’ Surface Water Management Program and Ecology. The study used information from the U.S. Census, the American Veterinary Medical Association, a number of other research studies and methods, as well as a survey of Snohomish County dog owners.
When the Snohomish County–Ecology method was applied to King County, it suggested that there were over 500,000 dogs in King County in 2017.35,36 The study also estimated the dog waste production rate for all Puget Sound counties. The estimate for King County was that approximately
Figure 5. Animal waste from livestock can enter the watershed
31 KCD’s Livestock Owner’s Guide to Manure Disposal.32 Personal communication from Joshua Monaghan, King Conservation District, Director of Stewardship Services, on 11-30-18.33 KCD’s Livestock Owner’s Guide to Manure Disposal.34 Snohomish Co. Surface Water Management Program and Washington State Department of Ecology. “Pet Waste Management Research
and Tools.”35 U.S. Census Bureau, Quick Facts, King County, Washington Web page.36 American Veterinary Medical Association study, p. 1.

July 2019 Proviso Response - Supplemental Report18
173,000 pounds (or 86.5 tons) of dog excrement were produced per day.37 That amounts to over 31,500 tons of dog excrement produced per year. Another way to understand the magnitude of this waste production rate is in terms of its equivalence to humans. The study method, when applied to King County, estimated that the waste produced daily by those 500,000-plus King County dogs was equivalent to that produced by 130,000 people.38
The Snohomish County study also surveyed dog owners about their waste disposal habits and methods. Survey respondents said that 37 percent of them rarely or never disposed of pet waste, 35 percent usually did, and 26 percent always did. The survey also revealed that a variety of disposal methods were used for the dog waste, including disposal in the trash, composting/burying, and flushing it down the toilet. Of those methods, however, only trash disposal is recommended. The other methods do not protect ground, surface, or marine waters from the pathogens in the pet waste.39 Another consideration is that those estimates do not include the waste produced by other outdoor domestic pets, such as cats or other animals. Those additional rates could make the pollution threat even greater than that of undisposed of dog waste alone.
HOMELESS PERSONS WITHOUT ACCESS TO SANITARY FACILITIESIn March 2018, the Seattle Times reported that King County public health officials are becoming increasingly concerned about a variety of outbreaks of serious infectious diseases among people who are homeless.
“The fact that we’re seeing multiple, different infections now increasing in the homeless population is an indicator of the sheer increase in the number of homeless people (in King County) and the fact that they’re in crowded conditions with poor hygiene and sanitation,” said Dr. Jeff Duchin, health officer for Public Health — Seattle & King County.
The King County Board of Health passed a resolution urging more sanitation and hygiene services for unsheltered homeless people. At the meeting, Seattle officials described their efforts to increase toilets, hot water and hand-washing stations at the city’s six sanctioned encampments, and to bring hand-washing kits to the city’s many unsanctioned camps.40
Figure 6. Pet waste can carry many pathogens
37 Snohomish Co. Surface Water Management Program, “Puget Sound Dog Waste Study,” 3-12-09.38 Ibid.39 Snohomish Co. Surface Water Management Program and Washington State Department of Ecology. “Pet Waste Management Research
and Tools.”40 The Seattle Times “Infectious Disease Outbreaks in Seattle Homeless Population” news story dated 3-15-18.
Roundworms
Hook worms
Cryptosporidium
Giardia
Salmonella
E. coli

Developing a Pollution Identification and Correction Program in King County 19
In December of 2018, the Seattle Times reported that homelessness in the United States has remained almost flat in 2018. However, in Seattle the number of homeless people swelled by more than 10 times the national average, according to new federal data. Seattle remained — as it has since 2015 — third in the nation when it comes to the sheer number of homeless people. Seattle has one of the largest homeless populations in the U.S. (at just over 12,000 in 2018) when counting people living outside (unsheltered) and in shelters (from the U.S. Department of Housing and Urban Development’s 2018 Annual Homeless Assessment Report).
Earlier in 2018, the consulting firm McKinsey & Company estimated that King County needs another 14,000 affordable units for people experiencing homelessness and that annual spending would need to double to $410 million to adequately address the crisis. According to a draft action report from the County’s Regional Affordable Housing Task Force, the County will need more than 100,000 new housing units that are affordable to the region’s lowest-income residents by the year 2040.41
In addition to Seattle, surrounding urban areas and unincorporated King County also suffer the consequences of homelessness. King County field staff take water samples at 74 stream sites around the County on a monthly basis. Homeless encampments have been consistently observed at roughly 31 of the 41 stream sampling sites in the more urbanized western part of the County (Lake Washington, Cedar and Lake Sammamish watersheds); 10 of the 21 sites in the more rural south and southeast part of the County (Green, Duwamish, Central Puget Sound watersheds); and three of the 12 sites in the northeast part of the County (Snoqualmie and Skykomish watersheds).
Figure 7. People experiencing homelessness along Lake Washington Ship Canal
41 The Seattle Times “Homelessness” news story dated 12-17-18.

July 2019 Proviso Response - Supplemental Report20
Episodic and Temporary Point Sources of PollutionIn addition to the previously described chronic and non-point pathogen pollution sources, other pollution sources may contribute to the problem in a more episodic and temporary fashion.43 They are also more like point sources, which are more easily detected and addressed (wildlife and marine-vessel discharges are exceptions to this). These pollution sources include the following:
• Failing and improperly operated LOSS44, which are systems that treat between 3,500 to 100,000 gallons per day.
• CSOs45, which happen in areas with older infrastructure where sewer lines are combined with stormwater catchments. These collection systems can become overwhelmed by rain, which causes them to back up and spill combined sewage and stormwater into the environment.
• Leaking and/or failed municipal sewer collection/conveyance pipes and infrastructure.46
• Failures and spills at municipal sewage treatment plants.47
• Releases from dairy and large commercial agricultural operations and CAFOs48 – these are businesses in which large concentrations of animals require substantial manure management efforts to protect the environment,
• Sewage discharges and spills from the sewage holding tanks on marine vessels.49
• Wildlife, such as terrestrial mammals and birds, and marine mammals and aquatic waterfowl. These animals may concentrate in natural areas (for example, waterfowl at lakes and shorelines, or wooded ravines) or in response to human activity (for example, restaurant dumpsters, picnic areas in parks, stormwater ponds, etc.).
These problem pollution sources are generally required to be addressed by their owners, such as the following: homeowners served by LOSS, municipal owners of combined sewers (for example, Seattle Public Utilities), public sewer service providers (for example, cities and sewer districts), King County’s Wastewater Treatment Division, dairy and farm business owners, and marine-vessel owners. They are also regulated, depending on the issue, by state and federal agencies including DOH, Ecology, the Washington State Department of Agriculture, and/or the Washington Department of Fish & Wildlife; the U.S. Coast Guard and the U.S. Environmental Protection Agency (EPA); and, in some cases, tribal governments.
43 Washington State Department of Ecology – bacteria pollution Web page.44 Washington State Department of Health – LOSS Web page.45 U.S. EPA – CSOs Web page and King County CSOs Web page.46 King County Wastewater Treatment Division, Report a Problem, Sewage Spill webpage.47 King County Wastewater Treatment Division, West Point Treatment Plant, Plant Restoration webpage. 48 Environmental Health Perspectives, 2007 Feb; 115(2): 308–312.49 Washington State Department of Ecology – no discharge zone information Web page.

Developing a Pollution Identification and Correction Program in King County 21
4 - HOW DOES THE PROBLEM COME TO LIGHT?
Bacterial pollution problems come to the attention of state and local agencies in a variety of ways, including the following:
• water quality monitoring and sampling,
• general water quality complaints,
• OSS and side-sewer failure complaints, and
• physician reports.
Water Quality Monitoring and Sampling Water quality monitoring and sampling programs are undertaken by a variety of agencies and organizations, including DOH and Ecology, King County divisions, cities, tribes, and non-governmental organizations. Each agency and organization tests for different reasons based on their mandate, jurisdiction, and needs.
Ecology monitors both marine and fresh waters. Their goal is to protect drinking water supplies, swimming and water recreation opportunities, aquatic life, and other water uses. DOH tests shellfish harvest areas to protect people from a variety of waterborne pathogens, which can make them ill. They do this in both commercial and recreational shellfish harvest areas. Those surveys include water quality monitoring and evaluation of pollution sources in the surrounding area. King County, and some cities within King County, monitor water quality to ensure that local beaches and water bodies are safe for swimming and water-related recreation and to protect aquatic life. Each agency applies the relevant water quality standards from either EPA’s Recreational Water Quality Criteria, Washington state’s Water Quality Criteria, or DOH’s Shellfish Bed Standards.50
General Water Quality ComplaintsGeneral water quality complaints can be received by King County through phone calls, emails, letters, or other agency referrals. When a report or complaint like this is received, it is routed to the water quality complaint program within the King County Department of Natural Resources and Parks Water and Land Resources Division (WLRD) (see Figure 8). That program begins its response by putting the complaint through an assessment process to determine the nature of the problem, whether there is an apparent solution, and which governmental unit or agency has the authority or jurisdiction to address it.
After the complaint is assessed, if it is not routed to another agency, a WLRD inspector is sent to make a site visit. If that inspector can resolve the problem with their initial review, the solution is implemented and the case is closed. If that inspector cannot determine the source of the problem, or if it is not resolvable at that time, the inspector will forward the complaint to a WLRD senior investigator.
50 King County 2018 Fecal Bacteria report, pp. 1-3.

July 2019 Proviso Response - Supplemental Report22
Resident King CountyDNRP/WLRD
King CountyDNRP/WLRD
OtherAgency
Water Quality testing detects
problems
Hands off complaint to other agency
with jusrisdiction
Makes site visit, resolves
complaint
Assesses complaint and assigns an
inspector
Field Inspector
Problem isresolved
Hands off complaint for more in-depth
investigation
Senior Inspector
Recalcitrant polluters
Undertakes source tracing to
specifically identify the problem, works
with polluters
Progressive enforcement is
undertaken (administrative, civil, criminal) as necessary)
Filescomplaint
Figure 8. Water pollution complaint response process flow chart

Developing a Pollution Identification and Correction Program in King County 23
If that senior investigator finds the problem to be bacterial in nature and the source is unknown, the senior investigator will undertake source tracing efforts to determine the source of the pollutant. Once the pollutant source is identified, and it is determined to be the responsibility of another agency or jurisdiction, that agency is contacted to address the problem. If the source is within WLRD’s jurisdiction (depending on the nature of the problem), technical assistance is offered to assist in resolving it. If the property owners or the persons responsible for the pollution are not responsive, WLRD will initiate a progressive enforcement effort including compliance letters requesting, then requiring, that the problem be fixed. If the responsible party is still unwilling to address the pollution problem, civil fines and other enforcement actions may be employed to stop the pollutant discharges.
Ecology also maintains a statewide environmental issue reporting system51 that allows individuals to report a variety of pollution problems. Ecology’s website helps guide individuals to the correct agency for the issue they want to report, and it provides the appropriate phone number(s) to the relevant agencies with jurisdiction over the specific issue being reported. If Ecology has jurisdiction, it will launch its own investigation and enforcement process to resolve the problem.
OSS and Side-Sewer Failure ComplaintsOSS and side-sewer problems can come to King County’s attention in similar ways as other water quality complaints. They can come from citizen phone calls, emails and letters, and agency referrals. OSS and side-sewer failures can also come to official attention when repair permits are sought. Figure 9 summarizes the response to these complaints.
In the event an OSS or side-sewer failure complaint is received, it is routed to the OSS Program supervisor in the Environmental Health Services Division of Public Health. That supervisor prioritizes it and assigns an inspector to investigate the complaint. All Public Health inspectors are primarily OSS permit reviewers; to address complaints, they must be pulled off of their regular work schedule to make non-permit-related inspections. Currently, it takes an inspector one to two weeks to make a non-permit-related field visit to a problem site because of their current permit review workload.
When an inspector makes a field visit, if the occupant is not home, the inspector leaves their business card and a notice that they attempted to make contact. Later, a letter is sent to the occupant requesting that they follow up with the inspector to arrange a time for a site visit. If the occupant is home, or on a return visit, the inspector requests permission to inspect their OSS or side-sewer. If that permission is given, and their OSS is not clearly failing, the inspector may ask to perform a dye tracer test to see if the OSS is functioning properly. If the OSS is functioning properly, the case is closed.
If there are indications that the system has failed, the inspector will require them to contact an OSS industry professional. That industry professional will inspect their system; pump it, if needed; and work with the property owner to seek repair permits and perform the needed repair work. After an OSS fails, the design, permitting, and repairs can often take a year to complete and can cost $30,000 or more, depending on the type of system. These are out-of-pocket costs for the OSS owner and are not normally covered by home or business insurance. In King County, Craft3, a nonprofit lender, offers both market-rate and low-interest loans specifically to OSS owners.
51 Washington State Department of Ecology – Environmental Reporting System Web page.

July 2019 Proviso Response - Supplemental Report24
If the occupant of a property with a failed OSS is not responsive, then a series of letters is sent to the owner of record of the property. Those letters may include an initial request to inspect, a notice of violation, and a notice and order to repair their OSS. If these letters and notices are ignored, then civil action may be taken against the property owner. A similar process can be undertaken with side-sewer leaks and failures. However, enforcement actions against uncooperative or unresponsive property owners can drag on for two to three years or longer, depending on the complexity of the case.
Figure 9. OSS complaint response process flow chart
If OSS owner is not responsive,
progressive enforcement is
undertaken (administrative, civil, criminal) as necessary)
Resident King CountyDNRP/WLRD
Public HealthSeattle & King County
OtherAgency
Water Quality testing detects
problems
Filescomplaint
Applies for OSS repair permit
Works with industry
professional to fix
problem
Assigns OSS permit reviewer/inspector
OSS Inspector
Makessite visit, resolves
complaint
Undertakesdye testingto confirm problem,
works with OSS owner
Problem isresolved
OSSOwner
OSS IndustryProfessional

Developing a Pollution Identification and Correction Program in King County 25
It is important to emphasize that the goal of work on OSS and side-sewer failures is to get the system repaired and into compliance to protect public health; that is, the goal is not enforcement, assessing penalties, or generating fines. It should also be noted that government inspectors generally make only one visit to a site if the property owner is present. Most of the follow-up work is done at the initiative of the property owner with an OSS industry professional.
Other OSS failures are discovered when:
• property owners undertake regular pumping and maintenance activities and those results are reported,
• an OSS repair permit is sought,
• property sales or transfer inspections take place, and
• inspections are triggered by other events.
As noted in Section 2, only about 7 percent of the approximately 85,000 OSS in King County were inspected in 2017.
Reports from PhysiciansIn the state of Washington, health care providers, facilities, laboratories, and other medical practitioners and institutions are legally required to notify public health authorities of suspected or confirmed cases of selected diseases or conditions. These diseases are referred to as “notifiable conditions”52 and include all of the diseases that can be caused by direct contact with human sewage (see Section 2, Table 1, in this report).
This public health surveillance includes reporting, investigation, collection, and distribution of data about illness and death. Reports from that surveillance are summarized in annual DOH Communicable Disease Reports.53 Data and trends from those reports can be used to pinpoint and respond to sewage-related illnesses by targeting geographic hotspots to address current problems and to take protective and preventive actions to forestall future problems.
52 Washington State Department of Health – Notifiable Conditions Web page.53 Washington State Department of Health 2016 Communicable Disease Report.
July 2019 Proviso Response - Supplemental Report26
54 Including RCW 70.118A, WAC 246-272A-0015, DOH No. 332-166 and DOH No. 333-129.
5. HOW CAN THE PROBLEM BE REMEDIED? WHAT IS SUCCESSFUL IN OTHER COUNTIES?
As a part of the research for this report, the approaches other counties in Washington take dealing with chronic pathogen pollution were reviewed. Of these counties, four are generally regarded by DOH as having programs that are successfully reducing bacterial pollution in their waters. As evidence of their successes, they have been able to reopen shellfish beds and beaches by identifying and repairing failed OSS, engaging farms in adopting livestock best management practices (BMPs), and advancing organized efforts to find and fix all sources of bacterial pollution. Those Washington counties include Kitsap, Skagit, Thurston, and Whatcom.
Before the counties’ current successful approaches were developed, pollution was addressed by individual county departments or multiple agencies focusing on single pollution problems and sources. They did this in relative isolation from one another. As a result, issues not within a particular agency’s or county department’s jurisdiction did not get addressed by that agency or department. Those issues not within a single agency or county department’s purview were often not referred to other agencies with jurisdiction (so as not to overstep any bounds) or were referred on an informal staff-to-staff basis. There was no overall coordination or accountability for getting all problematic, contributing sources of pollution stopped. This “siloed”, single-issue approach was much less effective and cost efficient at getting all problems and sources addressed.
Although the siloed approach has proven effective in point-source pollution control, that is less so in cases of non-point or where there is both point and non-point sources of pollution that is less so in cases of non-point, or combined-point and non-point-source, pollution situations. And, because current pollution problems are more often non-point source, or comingled-point and non-point-source problems, solving one aspect of the problem does not always achieve an overall resolution of the problem—hence the need for an approach that addresses multiple pollution sources simultaneously and in a coordinated way.
While the organizational structures and some program specifics of these four successful counties vary, they have shared characteristics that contribute to their success. Those successful program characteristics include the following:
• Applying a “worst-first”/“specific-area” strategy – each program focuses its effort in geographic/target areas that are identified as having the greatest threats to public health and the environment (as identified in state statutes and rules and policies54), and they use formal designations as necessary.
- Kitsap County: Clean Water Kitsap is a countywide water pollution control program that has been in place since 1994.
- Skagit County: Clean Water (countywide shellfish protection) District has been in place since 2005, currently focused on Samish Bay.
- Thurston County: Henderson Inlet and Nisqually Reach shellfish protection districts have been in place since 2001.
Developing a Pollution Identification and Correction Program in King County 27
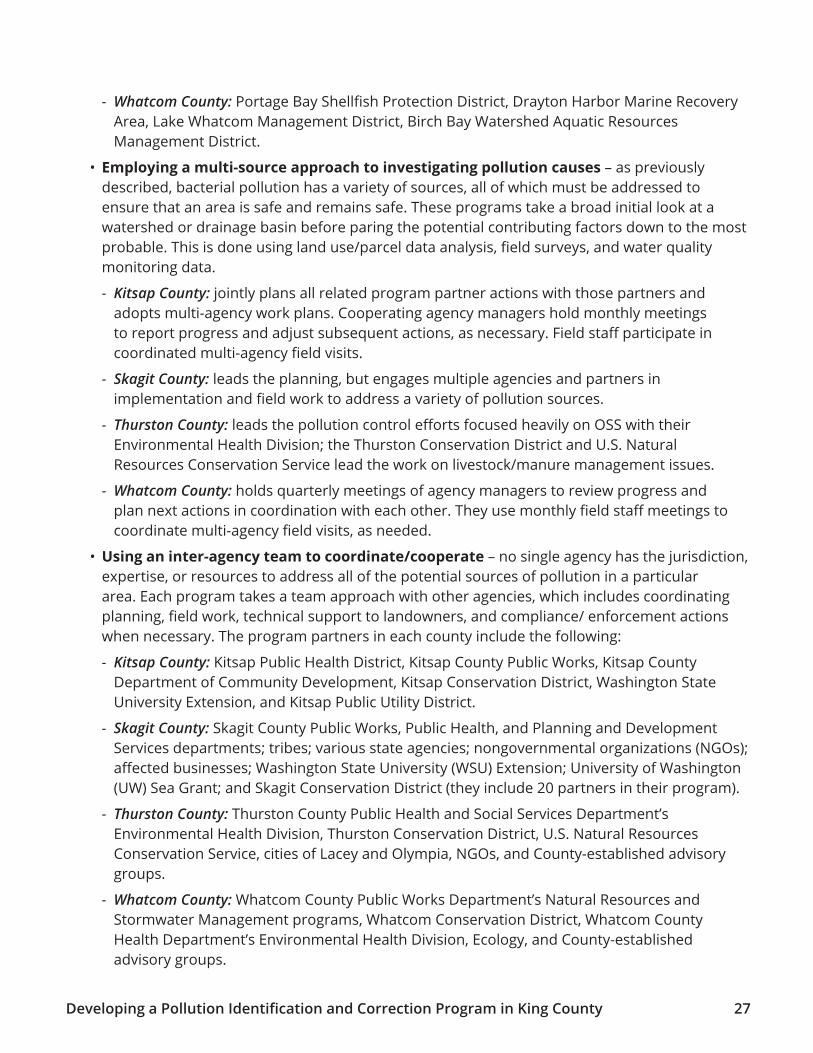
- Whatcom County: Portage Bay Shellfish Protection District, Drayton Harbor Marine Recovery Area, Lake Whatcom Management District, Birch Bay Watershed Aquatic Resources Management District.
• Employing a multi-source approach to investigating pollution causes – as previously described, bacterial pollution has a variety of sources, all of which must be addressed to ensure that an area is safe and remains safe. These programs take a broad initial look at a watershed or drainage basin before paring the potential contributing factors down to the most probable. This is done using land use/parcel data analysis, field surveys, and water quality monitoring data.
- Kitsap County: jointly plans all related program partner actions with those partners and adopts multi-agency work plans. Cooperating agency managers hold monthly meetings to report progress and adjust subsequent actions, as necessary. Field staff participate in coordinated multi-agency field visits.
- Skagit County: leads the planning, but engages multiple agencies and partners in implementation and field work to address a variety of pollution sources.
- Thurston County: leads the pollution control efforts focused heavily on OSS with their Environmental Health Division; the Thurston Conservation District and U.S. Natural Resources Conservation Service lead the work on livestock/manure management issues.
- Whatcom County: holds quarterly meetings of agency managers to review progress and plan next actions in coordination with each other. They use monthly field staff meetings to coordinate multi-agency field visits, as needed.
• Using an inter-agency team to coordinate/cooperate – no single agency has the jurisdiction, expertise, or resources to address all of the potential sources of pollution in a particular area. Each program takes a team approach with other agencies, which includes coordinating planning, field work, technical support to landowners, and compliance/ enforcement actions when necessary. The program partners in each county include the following:
- Kitsap County: Kitsap Public Health District, Kitsap County Public Works, Kitsap County Department of Community Development, Kitsap Conservation District, Washington State University Extension, and Kitsap Public Utility District.
- Skagit County: Skagit County Public Works, Public Health, and Planning and Development Services departments; tribes; various state agencies; nongovernmental organizations (NGOs); affected businesses; Washington State University (WSU) Extension; University of Washington (UW) Sea Grant; and Skagit Conservation District (they include 20 partners in their program).
- Thurston County: Thurston County Public Health and Social Services Department’s Environmental Health Division, Thurston Conservation District, U.S. Natural Resources Conservation Service, cities of Lacey and Olympia, NGOs, and County-established advisory groups.
- Whatcom County: Whatcom County Public Works Department’s Natural Resources and Stormwater Management programs, Whatcom Conservation District, Whatcom County Health Department’s Environmental Health Division, Ecology, and County-established advisory groups.

July 2019 Proviso Response - Supplemental Report28
• Implementing a broad water quality communications agenda to provide information and outreach about the process of addressing the problems and the technical and financial support available to affected property owners. This is done to encourage voluntary actions to address specific aspects of the problem, ensure that property owners know what actions are being taken and why, and to build a case for enforcement actions if voluntary compliance is not forthcoming.
- Each county recognizes a “lead” agency for overall water quality education and outreach; however, they differ from county to county. In Kitsap County, it is the Public Works Department; in Skagit County it is a combination of the County and WSU/UW. Thurston County’s Environmental Health Division is the lead there, and Whatcom County’s Public Work’s Natural Resources Management Program is the outreach lead.
• Collecting, managing, and using comprehensive data to direct immediate action and responses and to strategically plan for future action. Government action must be based on facts and data to be credible/defensible to the public.
• Assigning specific staff to do the necessary work so that staff assigned to other work are not diverted from their existing workloads to respond to emergencies on an ad hoc basis. These programs have dedicated staff for each of their components.
• Taking appropriate and measured compliance and enforcement actions when necessary to ensure fairness and consistency for all homeowners, businesses, and institutions. Each program stresses that they seek compliance not punishment, and that enforcement actions must be applied consistently to be credible and ensure compliance.
• Having the necessary administrative support to make the effort successful. All programs must be organized and responsive to internal staff needs as well as to public inquiries for information and records.
• Adequately regulating industries that might be contributing to the problem or are needed as a part of the solution. This is another case where both the public and local governments have an interest in industry transparency, cooperation, and compliance with regulations.
• Funding the effort sufficiently and sustainably – the source and amount of resources must match the type as well as the amount of work needed to solve the problems. While each program is funded with different combinations of fees and grants, they have established, dedicated funding sources for each component of their programs.
- Kitsap County: enacted stormwater fees in 1994 on all properties countywide (with an equivalent in each city) to fund their pollution control program.
- Skagit County: implemented a Clean Water (shellfish protection) District countywide in 2005. The County has levied a fee on all properties since 2007 to fund that district.
- Thurston County: requires a fee-based operating certificate on all OSS within its two designated shellfish protection districts to address OSS O&M in those districts.
- Whatcom County: implemented a flat fee on all properties with an OSS in 2013.
Each of the four counties has these characteristics, to greater or lesser degrees, depending on their unique circumstances. They all also use the same terminology to identify their approach. That approach is called a Pollution Identification and Correction (PIC) Program.

Developing a Pollution Identification and Correction Program in King County 29
PIC Programs seek to identify all pollution sources and link corrective actions to each of those pollution sources. To achieve this, each PIC Program is organized around a core group of agencies that have the most pertinent jurisdiction, authority, and expertise to address the most probable sources of pollution in a particular county. Other agencies become involved if and when the pollution sources and problems fall outside the jurisdiction of that core group of agencies. The following figure depicts a PIC model with generic agencies (or their equivalents) that are common to all current PIC Programs in other counties.
While this depiction might look straightforward, it must be emphasized that each county’s PIC Program is different. Indeed, after being developed, each program has evolved over time to fit each particular county’s unique pollution problems, governmental structures, political situation, geographic peculiarities, socio-economic circumstances, and historical context. That means that what one agency does in one county may be done by a completely different agency in another county.
Moreover, some agencies in some counties may share a function; in other counties, that function may be addressed exclusively by a single agency. Some counties have extensive federal or state agency participation, depending on the pollution issue at hand, while others may have little to no involvement of federal or state agencies. Counties also vary in the amount of direct involvement by representative or advisory bodies. Some counties involve citizen groups, NGOs, community groups, tribal governments, businesses, and others in their program implementation. In the final analysis, while there is a generic PIC Program model to draw from, for a PIC Program to succeed it must be constructed to suit each county’s unique circumstances.
Figure 10. PIC Program interagency team model
PICProgram
Local Health Jurisdiction
County Stormwater
Utility
Conservation District
Educational Organization
Cities’ Stormwater
Utilities
Other/State/Federal/
Tribal Agencies

July 2019 Proviso Response - Supplemental Report30
6. WHAT IS NEEDED IN KING COUNTY, WHAT IS ALREADY IN PLACE, AND WHAT ARE THE GAPS?
King County agencies are currently undertaking a variety of PIC-type activities and actions to help address bacterial pollution in several drainages, including the Bear-Evans, Juanita, Thornton, and Issaquah creeks, as well as the Puyallup/White watershed. They are also working on Vashon Island and in the Poverty Bay area. Many of these efforts are driven by state and federal regulations to restore resources such as polluted streams and shellfish beds.
Although these current efforts are achieving local successes and have created partnerships across multiple agencies, they are ad hoc. They are also not strategic or equitable from a Countywide perspective. They can, however, form the basis of a more strategic approach. Using these current efforts, and drawing from the generic characteristics of successful PIC Programs in other counties, the following components have been developed for, and adapted to, King County’s specific situation.
Recommended Components of a King County PIC Program:• An interagency team charged with implementing a PIC Program in King County,
composed of the relevant agencies with jurisdiction over the currently identified/anticipated pollution problems; this team would be charged with employing, applying, and implementing all the other components listed herein. (Current County PIC-type efforts are being led by WLRD and Public Health.)
• An over-arching, multi-source, data collection, assembly, and analysis effort to find the worst pollution problems, develop plans to address those problems, and then prioritize future work in other high-priority problem areas.
• Multi-agency water quality sampling, testing, and monitoring to identify problem areas and to ensure current problem areas improve.
• An equity and social justice (ESJ) approach when designing programs to serve diverse populations as well as reviewing racial and economic disparities in the development of infrastructure.
• A water quality communication, education, and outreach campaign to address the full range of bacterial pollution sources and solutions, linked to broader clean water communications and initiatives, to speak to a variety of audiences/cultures and their concerns.
• Support for farm livestock and manure management using farm drainage plans, BMPs, and pollution/drainage control projects as well as information about financing these activities.
• Addressing OSS O&M in the target/problem area through inventorying OSS; providing outreach, technical support, and financing information for repairs; working with sewer districts to allow for OSS-to-sewer conversions in appropriate areas; and regulating the OSS industry to ensure quality control for OSS owners using their services.
• Addressing side-sewer breaches and leaks in the target/problem area by developing protocols between the appropriate agencies and with outreach and technical support to side-sewer owners.

Developing a Pollution Identification and Correction Program in King County 31
• Communications and outreach about pet waste cleanup in the target/problem area as well as developing services/facilities to make cleanup convenient.
• Services and best practices to support homeless persons in the target/problem area to gain access to sanitary facilities.
• A process of identifying other contributing pollution sources in the target/problem area that may be under state or federal jurisdiction, referring those cases to the appropriate agencies and coordinating with them to integrate their work into the overall PIC approach to stop pollution in that area.
• Appropriate administrative, enforcement and compliance, and funding arrangements to ensure the equitable allocation of effort among the participating agencies for the program’s ultimate success.
A Countywide PIC Program is a preferred solution because it is the most effective way to protect the health of King County residents from bacterial and pathogen pollution. It uses a holistic approach, improves interagency coordination, and strengthens partnerships with local communities. By coordinating water quality efforts, it improves the delivery and quality of services provided by King County agencies to their constituents. The approach is also a more efficient use of public resources, as opposed to the past practice of single agencies addressing single sources of pollution in relative isolation from one another. It also maximizes the use of a variety of data to ensure that the “worst-first”/highest-risk areas are addressed to protect public health and the environment.
A King County-specific PIC Program model is depicted in Figure 11. It shows the current County agencies that could participate in and, to varying degrees, are currently participating in, bacterial and pathogen pollution control efforts in King County.

July 2019 Proviso Response - Supplemental Report32
The model depicted in Figure 11 is for illustration only; it does not presume the participation of any agency. If this PIC Program approach is undertaken, discussions with all potential partner agencies will need to be undertaken before a wide-ranging interagency team could be finalized.
King County Current Efforts and Gaps/InadequaciesSome of these recommended components are currently present and active in King County. However, some elements are missing, not funded, not coordinated, or not extensive enough to enable a fully functioning, successful PIC Program. Table 3 lists components that would be needed for a strategic King County PIC Program.
Figure 11. Hypothetical King County interagency PIC Program model
Possible King CountyPIC program organization
Public Health Seattle &
King County
King CountyDepartment
of Local Services
Education Lead
Other/State/Federal/Tribal Agencies
King County WastewaterTreatment Division and
34 local jurisdictions/sewer agencies
King ConservationDistrict andKing CountyAgriculture
King County residents
King County Stormwater Services
and municipal stormwater agencies
King County WLRD Science
Section

Developing a Pollution Identification and Correction Program in King County 33
Table 3. PIC Program components in King County and their status
Problems/ Sources
Relevant Agencies
Necessary PIC Program Components Current Efforts Gaps/Inadequacies
All
Multiple agencies
Interagency forumInformal connections exist, mostly at the staff/field level
There is no formal PIC forum or infrastructure.
Identification/target-ing of the highest risk public health areas
Each agency targets areas based on its own criteria.
Coordination is not uniform.
Strategic planning and coordination of all PIC-related work
Coordinated work is only done in a few areas.
Coordination is ad hoc.
Joint budget/FTE/resource allocation planning and coordination
Coordinated planning is only done for a few areas.
Coordination is ad hoc.
Broad, overall water quality communication/ information campaign
None; each agency works individually, focused on their specific issues. No involvement of UW Sea Grant or WSU Extension, as in other counties.
Complete gap
Coordinated ESJ/ service equity strategy None Complete gap
Coordination with 35 cities’ separate stormwater programs
Source tracing coordination is sporadic depending on the issue.
Coordination is not uniform and varies from city to city.
WLRD-SWSa and -STSb;
cities with storm-water programs
Water quality monitoring and testing
Targeted water quality testing and source tracing sustainably funded through stormwater fees.
Few to none (except OSS-specific testing and testing for illicit connections)
Side-sewers
Public Health; PSSPc;
unknown
Clear agency jurisdiction Case-by-case reaction
Jurisdiction is vague, responsibility for side-sewers rests on the property owner
Compliance: enforcement/case mgt. Case-by-case reaction. No proactive effort in place
Communications: education/outreach/ technical information provision & support; service equity.
No coordinated efforts exist. No proactive effort in place
green = functioning successfully yellow = needs augmentation pink = inadequate or missing
a Water and Land Resources Division Stormwater Services Sectionb Water and Land Resources Division Science and Technical Support Sectionc Public sewer service providers (e.g., cities, sewer districts, King County Wastewater Treatment Division, etc.)

July 2019 Proviso Response - Supplemental Report34
Table 3. continued
Problems/ Sources
Relevant Agencies
Necessary PIC Program Components
Current Efforts Gaps/Inadequacies
OSS Public Health
O&M program for the problem area
King County has no funding to oversee all OSS O&M.
There is no dedicated, sustainable funding source for this effort.
Updated OSS records (data base mgt.) in the problem area.
Progress is being made on OSS records countywide.
More time and funding are needed to complete this work.
Complaint and failure response; sanitary surveys/OSS tracer testing
Responses are ad hoc. Staff are pulled from permit review work.
There is no dedicated, sustainable funding source for this OSS effort. Permit funds are being used for non-permit work.
Non-OSS specific source tracing done by WLRD in their general water quality testing work.
Enforcement/case mgt.
These efforts take years and there is a large backlog of work.
This area is underfunded and understaffed.
Communications: education/outreach/
technical information provision and support; service equity
These efforts are essentially passive – relying on website information.
This area is not funded. OSS industry professionals noted this as a major gap; too many OSS owners do not understand their systems or the need for O&M.
OSS Industry certification/ regulation/quality control
Minimal efforts are being made in this area because of lack of funding/staffing.
This effort is completely inadequate. There is very little funding for this effort. Consumers are not being protected from fraudulent contractors.
OSS Permit Review — this effort is not a part of a PIC Program. It is listed here because its permit funds are being diverted to other/non-permit (PIC-related) OSS work.
Permit review for new OSS installations and OSS remodels and repairs.
Permit review work is sustainably funded by permit fees.
green = functioning successfully yellow = needs augmentation pink = inadequate or missing

Developing a Pollution Identification and Correction Program in King County 35
Problems/ Sources
Relevant Agencies
Necessary PIC Program Components
Current Efforts Gaps/Inadequacies
Livestock/
manure management
KCD;
WLRD-RRSd
Farm drainage plan development
Significant efforts are underway (from 150 up to 300 plans/year), but current 4-month waiting period exists for service.
Additional funding is needed to increase and accelerate these efforts. KCD sees a need for 30% farm plan FTE increase.
Technical support to farmers
Current 4-month wait for service
Additional staffing is needed for KCD staff site visits and/or to reduce the waiting period for service.
Education/outreach to farmers
These efforts are tied to individual farm planning (with 4-month wait).
Multi-agency communications efforts could help accelerate this work.
Financial assistance to farmers.
Current 4-month wait for service
Additional KCD staff are needed for consultations to help fund projects.
Pet waste
Public Health;
SWDe;
govt. property owners
Compliance, enforcement, and case mgt.
There is no over-arching effort in this area. Efforts are sporadic and taken by individual jurisdictions at their discretion.
This problem is not integrated into an overall water quality communications effort.
Homeless access to sanitary facilities
Multiple agencies
Developing new facilities/securing access to existing facilities
This effort is being undertaken sporadically across multiple jurisdictions by multiple agencies.
More funding and coordination are needed.
Other/sporadic (LOSS, CSOs, municipal sewage collection/conveyance and treatment infrastructure, CAFOs, marine vessels, wildlife)
Multiple agencies (Ecology, Agf, DOH, govt. system owners, WDFWg, USCGh)
Specific actions taken by the agencies with jurisdiction and tailored to the specific problem/source
There are a range of responses by different agencies based on their priorities, their resources, and the extent of the problem.
Additional interagency planning and coordination could help ameliorate the response.
Table 3. continued
green = functioning successfully yellow = needs augmentation pink = inadequate or missing
d Water and Land Resources Division Rural Resources Sectione King County Solid Waste Divisionf Washington State Department of Agricultureg Washington Department of Fish and Wildlifeh United States Coast Guard

July 2019 Proviso Response - Supplemental Report36
7. WHAT NEXT STEPS MIGHT BE TAKEN TO MOVE FORWARD?
The interagency team/PIC Program approach described in this report will take some time to fully develop and implement. Additionally, the affected publics would need to be involved to ensure its legitimacy and their acceptance of the actions necessary to address this problem on an ongoing basis.
To begin the transition to a permanent PIC-type program, King County is proposing a phased approach, with this report representing the first phase. A second phase should consist of the following:
• Approaching potential inter-agency partners to form a “PIC Program Alliance” (those potential partners might consist of King County Department of Natural Resources and Parks, Public Health Seattle and King County, King County Department of Local Services, cities with their own stormwater programs, public sewer service providers, and KCD; educational partners; and state, federal, and tribal agencies and others, as applicable).
• Holding meetings with key stakeholders.
• Evaluating the proposed process and functional elements of a PIC Program through an ESJ lens.
• Forming an advisory committee(s) (potentially from a geographically specific pilot area[s]) to guide PIC Program development and implementation. The committee(s) could also work through various funding strategies to ensure that the program is supported and that whatever arrangements are made are fair and equitable.
• Identifying “highest-risk areas” and developing pilot PIC projects in those geographically focused areas.
• Working with OSS professionals to build a geographically focused, risk-based pilot project on OSS O&M reminders, community technical support, and financial incentives.
• Evaluating PIC Program funding and strategy approaches to ensure that all needed elements of a program are funded and can holistically contribute to addressing the full suite of related problems.
Developing a Pollution Identification and Correction Program in King County 37
REFERENCES
American Veterinary Medical Association. U.S. Pet Ownership and Demographics Sourcebook.: https://www.avma.org/Search/results.aspx?k=U%2ES%2E%20pet%20owners%20and%20 demographics%20sourcebook, 2007.
Centers for Disease Control and Prevention – diseases information Web page: https://www.cdc.gov, accessed 1-10-19.
Indiana State Department of Health - pathogens Web page: https://www.in.gov/isdh/22963.htm, accessed 10-16-18.
KING 5 TV News. “Raw oysters linked to King County norovirus outbreak”: https://www.king5.com/article/news/local/raw-oysters-linked-to-king-county-norovirus-outbreak/426197040, report dated 3-28-17.
King Conservation District. Livestock Owner’s Guide to Manure Disposal: http://kingcd.org/wp-content/uploads/2018/05/Manure-Disposal-Fact-Sheet-2016.pdf, accessed 10-15-18.
King County – combined sewer overflows (CSO) Web page: https://www.kingcounty.gov/ services/environment/wastewater/cso.aspx, accessed 11-22-18.
King County Council. 2017-2018 Biennial Budget Ordinance 18409 (Proviso in Section 100, p. 1): https://www.kingcounty.gov/~/media/Council/documents/Budget/2017-18/2017-2018-Adopted-Budget-Book.ashx?la=en.
King County Executive Dow Constantine. Clean Water and Health Habitat agenda: https://www.kingcounty.gov/elected/executive/constantine/initiatives.aspx#water, accessed 1-2-10.
King County Executive Dow Constantine. Third-term agenda (November 8, 2017): https://www.kingcounty.gov/elected/executive/constantine/news/release/2017/November/ 08-executive-priorities.aspx, accessed 1-2-10.
King County. Fecal Bacteria in King County Waters: Current Conditions, Long-term Trends, and Landscape Factors. Prepared by Timothy Clark, Water and Land Resources Division. Seattle, Washington. 2018.
King County’s swimming beach closure summaries: https://www.kingcounty.gov/services/environment/water-and-land/lakes/swimming-beaches/ClosureSummary.aspx, accessed 10-16-18.
King County Wastewater Treatment Division – Report a Problem, Sewage Spill webpage: https://www.kingcounty.gov/depts/dnrp/wtd/response/sewage-spill.aspx
King County Wastewater Treatment Division – West Point Treatment Plant, Plant Restoration webpage: https://www.kingcounty.gov/depts/dnrp/wtd/system/west/west-point-restoration.aspx
Mara, D.D. and N. J. Horan (Ed.), Handbook of Water and Wastewater Microbiology. Cambridge, MA: Academic Press. 2003.
National Institutes of Health. Environmental Health Perspectives; 2007 Feb; 115(2): 308–312.: https://www.ncbi.nlm.nih.gov/pmc/articles/PMC1817674/, accessed 10-17-18.
National Institutes of Health. Pathogens; 2015 Jun; 4(2), p. 310: https://www.ncbi.nlm.nih.gov/pmc/articles/PMC4493476/, accessed 11-2-18.
Public Health – Seattle and King County – marine recovery areas Web page: https://www.kingcounty.gov/depts/health/environmental-health/piping/onsite-sewage-systems/focus.aspx.

July 2019 Proviso Response - Supplemental Report38
Public Health – Seattle and King County, Environmental Health Services Division. Proviso Response: Implementation and Funding Strategies for On-site Sewage System Program Operation & Maintenance Activities, 2017-2018 Biennial Budget Ordinance 18409. June 30, 2017.
Public Health – Seattle and King County. King County Onsite-sewage System Management Plan, September 2016: https://www.kingcounty.gov/depts/health/environmental-health/piping/onsite-sewage-systems/focus/oss-plan-update.aspx.
Public Health – Seattle and King County. Septic System Ages and Failure Mapping Project. November 2018.
Public Health – Seattle and King County. Survey of On-site Sewage System Industry Professionals about Operation and Maintenance of On-site Sewage Systems in King County, Washington (Draft). November 2018.
Revised Code of Washington 70.118A On-site sewage disposal systems – marine recovery areas: https://app.leg.wa.gov/rcw/default.aspx?cite=70.118A.
Seattle Times: https://www.seattletimes.com/business/real-estate/a-dirty-secret-side-sewers-can-become-a-homeowners-nightmare/, news story dated 2-17-16.
Seattle Times: https://www.seattletimes.com/seattle-news/homeless/infectious-disease-oubreaks-in-seattle-homeless-people-concern-health-officials/, news story dated 3-15-18.
Seattle Times: https://www.seattletimes.com/seattle-news/homeless/homelessness-rose-just-a-bit-this-year-in-the-u-s-heres-how-seattle-compares/, news story dated 12-17-18.
Snohomish County Public Works, Surface Water Management Program and Washington State Department of Ecology. “Pet Waste Management Research and Tools – Quantifying the Problem – PowerPoint Slide-set”, 2005.
Snohomish County Public Works, Surface Water Management Program. Diffusion of Landscape-Level Best Management Practices, “Puget Sound Dog Waste Study – PowerPoint Slide-set”, 3-12-09.
Snohomish County Public Works, Surface Water Management Program. “Dog Demography in Snohomish County – White Paper”, 9-22-04.
Snohomish County Public Works, Surface Water Management Program. “Dog and Cat Ownership and Population Estimates for Snohomish County – White Paper”, 6-22-04.
U.S. Census Bureau, Quick Facts, King County, Washington at: https://www.census.gov/quickfacts/fact/table/kingcountywashington,wa/PST045218, accessed 1-15-19.
U.S. Environmental Protection Agency – combined sewer overflow (CSO) Web page: https://www.epa.gov/npdes/combined-sewer-overflows-csos, accessed 11-22-18.
U.S. Environmental Protection Agency – fecal bacteria information Web page: https://archive.epa.gov/water/archive/web/html/vms511.html, accessed 11-2-18.
United States v. State of Washington “Shellfish I”, 873 F. Supp. 1422 (W.D. Wash. 1994): https://law.justia.com/cases/federal/district-courts/FSupp/873/1422/1466184/.
Washington Administrative Code 246-272A-0015 On-site sewage systems, Local management and regulation: https://apps.leg.wa.gov/WAC/default.aspx?cite=246-272A-0015.
Washington State Department of Ecology – bacteria pollution information: https://ecology.wa.gov/Water-Shorelines/Puget-Sound/Issues-problems/Bacteria, accessed 10-18-18.
Washington State Department of Ecology – environmental reporting system: https://ecology.wa.gov/About-us/Get-involved/Report-an-environmental-issue, accessed 11-30-18.

Developing a Pollution Identification and Correction Program in King County 39
Washington State Department of Ecology – no discharge zone information: https://ecology.wa.gov/Water-Shorelines/Puget-Sound/No-discharge-zone, accessed 11-24-18.
Washington State Department of Health – drinking water alerts Web page: https://www.doh.wa.gov/CommunityandEnvironment/DrinkingWater/ActiveAlerts#sect King, accessed 10-16-18.
Washington State Department of Health – LOSS Web page: https://www.doh.wa.gov/ CommunityandEnvironment/WastewaterManagement/LOSSProgram, accessed 11-23-18.
Washington State Department of Health – Norovirus in shellfish Web page: https://www.doh.wa.gov/CommunityandEnvironment/Shellfish/RecreationalShellfish/Illnesses/Norovirus, accessed 10-16-18.
Washington State Department of Health – Norovirus Web page: https://www.doh.wa.gov/YouandYourFamily/IllnessandDisease/Norovirus, accessed 10-16-18.
Washington State Department of Health – notifiable conditions: https://www.doh.wa.gov/ ForPublicHealthandHealthcareProviders/NotifiableConditions, accessed 11-17-18.
Washington State Department of Health – US EPA PIC Program funding Web page: https://www.doh.wa.gov/CommunityandEnvironment/Shellfish/EPAGrants/PathogensGrant/PIC, accessed 1-29.
Washington State Department of Health. 2016 Communicable Disease Report: https://www.doh.wa.gov/Portals/1/Documents/5100/420-004-CDAnnualReport2016.pdf, accessed 11-6-18.
Washington State Department of Health. On-Site Sewage System Management Plan Guidance for the Twelve Puget Sound Counties. DOH No. 333-129: https://www.doh.wa.gov/portals/1/ Documents/Pubs/337-084.pdf, June 2006.
Washington State Department of Health. Puget Sound Septic System Management Programs - Best Management Practices Reference Manual. DOH No. 332-166: https://www.doh.wa.gov/portals/1/Documents/Pubs/337-084.pdf, March 2016.