developing a strong energy savings performance contracting ... · pdf filedeveloping a strong...
TRANSCRIPT

Click To Edit Master Title Style
Developing a Strong Energy Savings Performance Contracting Project
Moderator: Christopher Halpin, Celtic Energy
May 27, 2015
Michael O’Connor Appalachian State University The Investment-Grade Audit

Comprehensive masters-level university Sustainability is core to university 18,800 students, 110 buildings, 5.1 million
GSF Two ESPCs ESPC I: $5.1 M with Pepco Energy Solutions ▪ In 3rd performance year, all savings achieved
ESPC II: $15.9 M with Pepco Energy Solutions ▪ To be complete by July 1, 2015
3
Identify a Champion early! Get Senior Leadership Buy-in
Fully understand your current energy profile Use, demand, growth, seasonal changes,
customer requirements, etc.
Clearly define the goals for your project Energy Reduction, Deferred Maintenance, New
Technology Demonstration, etc.
4
Understand the approval process and build a schedule to include all approval milestones
Develop clear ESCO selection criteria
Actively lead the process
5
A well-thought-out scope of work is key Keep it simple the first time
No esoteric technologies; ice storage, co-gen, etc.
Know your financial limits How much debt will your organization tolerate
How long a term 5, 10, 20 years??
ESCOs will always want to go bigger
6
Drive the train!
Don’t be a passive passenger
Don’t be an uninformed consumer
▪ Know what you are buying
▪ It’s not just about the payment
Have a good 3rd-party owner’s representative
7
The 3rd-Party Owner’s Rep
Balancing savings and costs
Model the options in a spread sheet
Identify tradeoffs
Don’t forget the goals of the project!
8
Understand the annual costs above and beyond debt service
M&V
Maintenance agreements, repair parts
Training, etc.
Other hidden costs
9
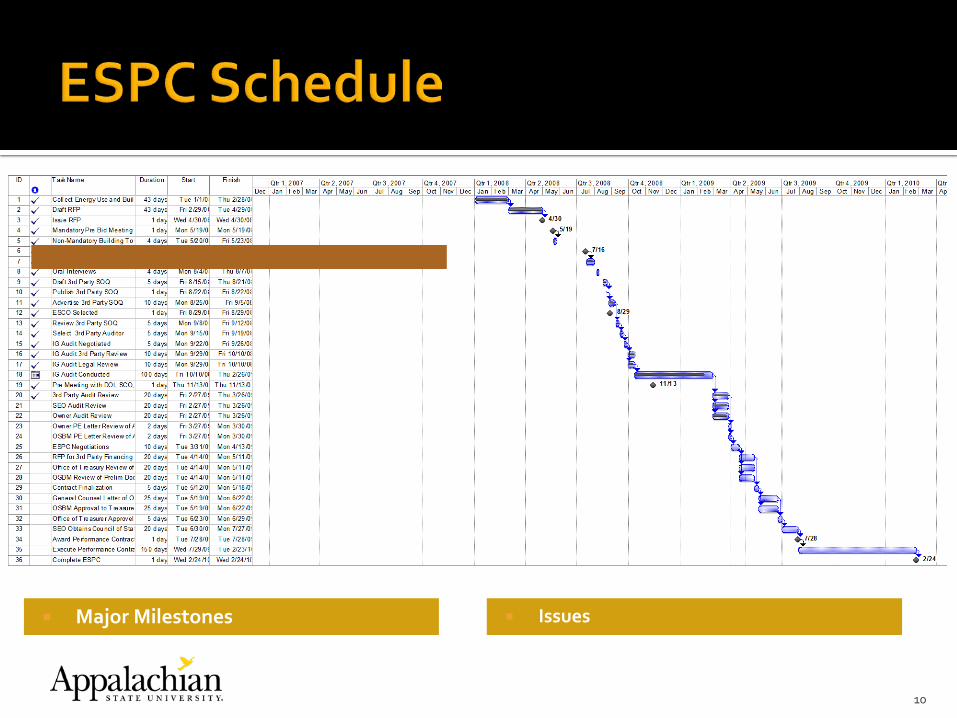
Major Milestones
Issues
10

Getting to yes Pencils Down! Educating your budget office Who owns the tax credits? Time is money Implementation-year savings Can you keep? Return to the State?
11

Have a Champion Understand your energy use profile Have strong project goals Understand what you are buying Trust but verify Questions: Mike O’Connor [email protected]
12
Peter Berger Minnesota Department of Commerce Cost and Pricing
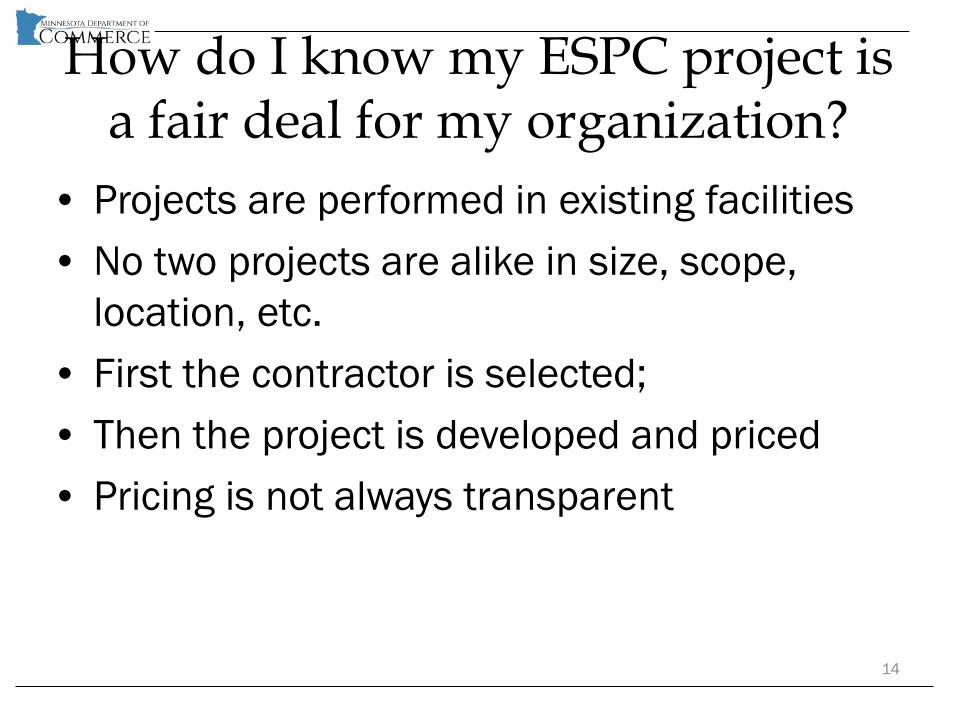
How do I know my ESPC project is a fair deal for my organization?
• Projects are performed in existing facilities • No two projects are alike in size, scope,
location, etc. • First the contractor is selected; • Then the project is developed and priced • Pricing is not always transparent
14
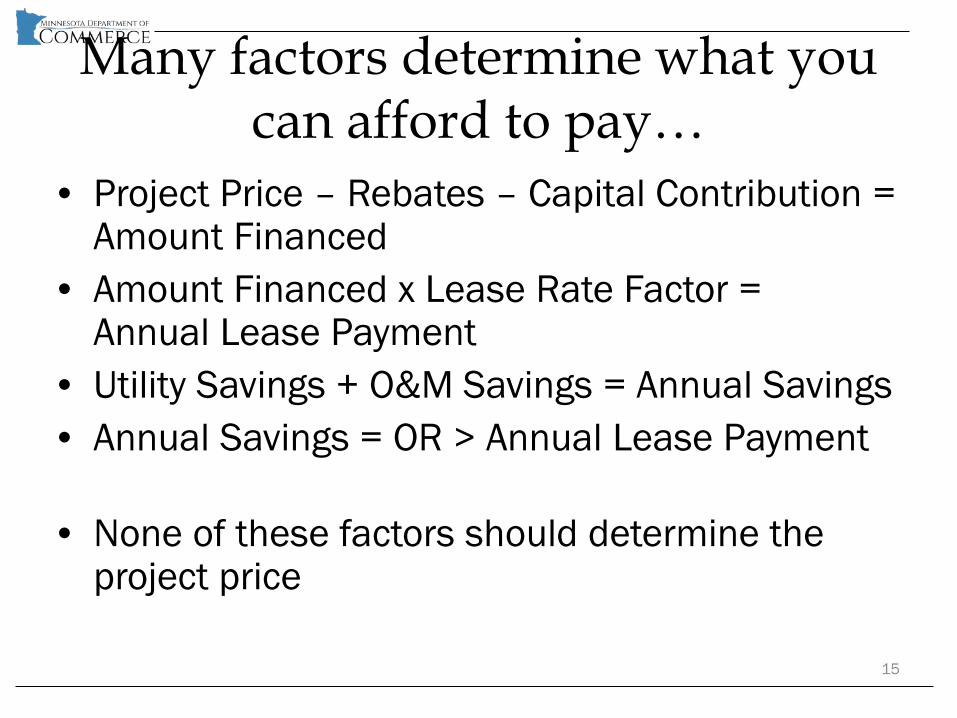
Many factors determine what you can afford to pay…
• Project Price – Rebates – Capital Contribution = Amount Financed
• Amount Financed x Lease Rate Factor = Annual Lease Payment
• Utility Savings + O&M Savings = Annual Savings • Annual Savings = OR > Annual Lease Payment
• None of these factors should determine the
project price
15
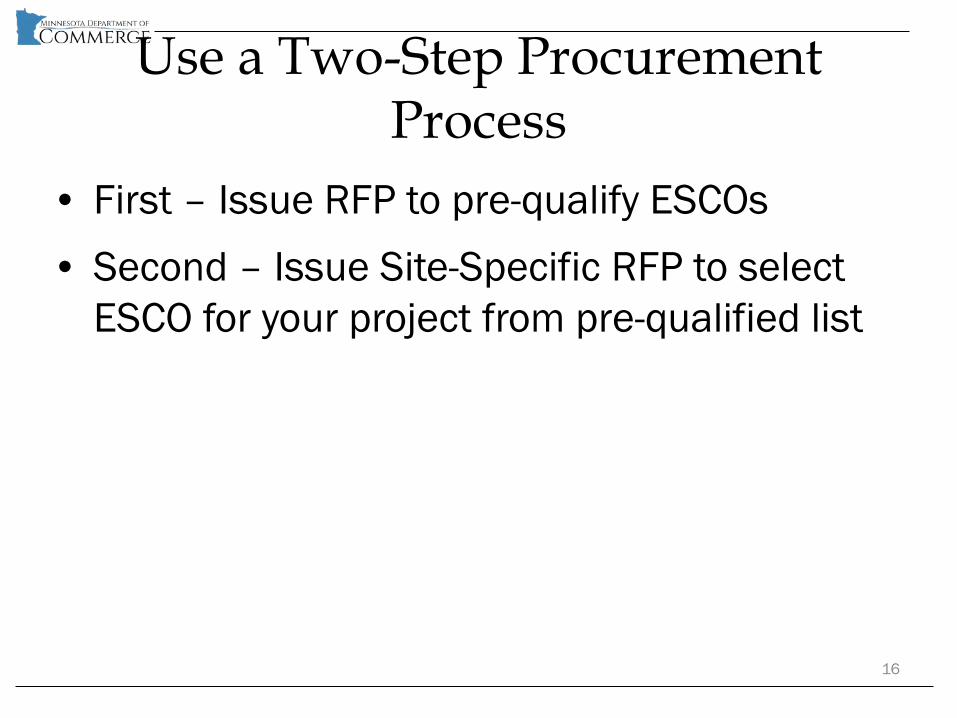
Use a Two-Step Procurement Process
• First – Issue RFP to pre-qualify ESCOs • Second – Issue Site-Specific RFP to select
ESCO for your project from pre-qualified list
16
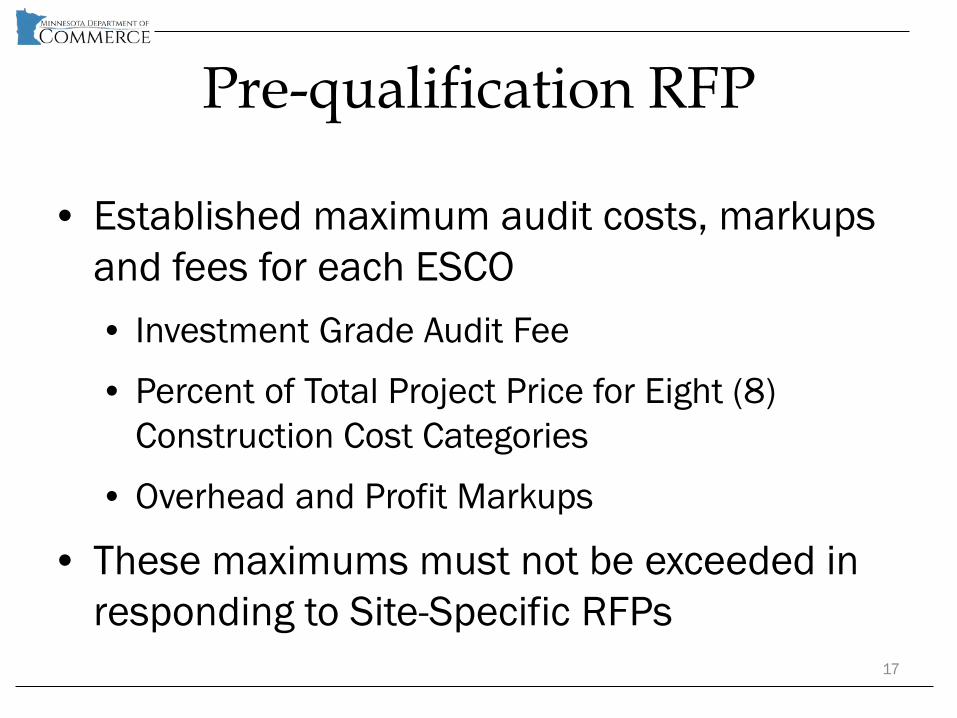
Pre-qualification RFP
• Established maximum audit costs, markups and fees for each ESCO • Investment Grade Audit Fee
• Percent of Total Project Price for Eight (8) Construction Cost Categories
• Overhead and Profit Markups
• These maximums must not be exceeded in responding to Site-Specific RFPs
17
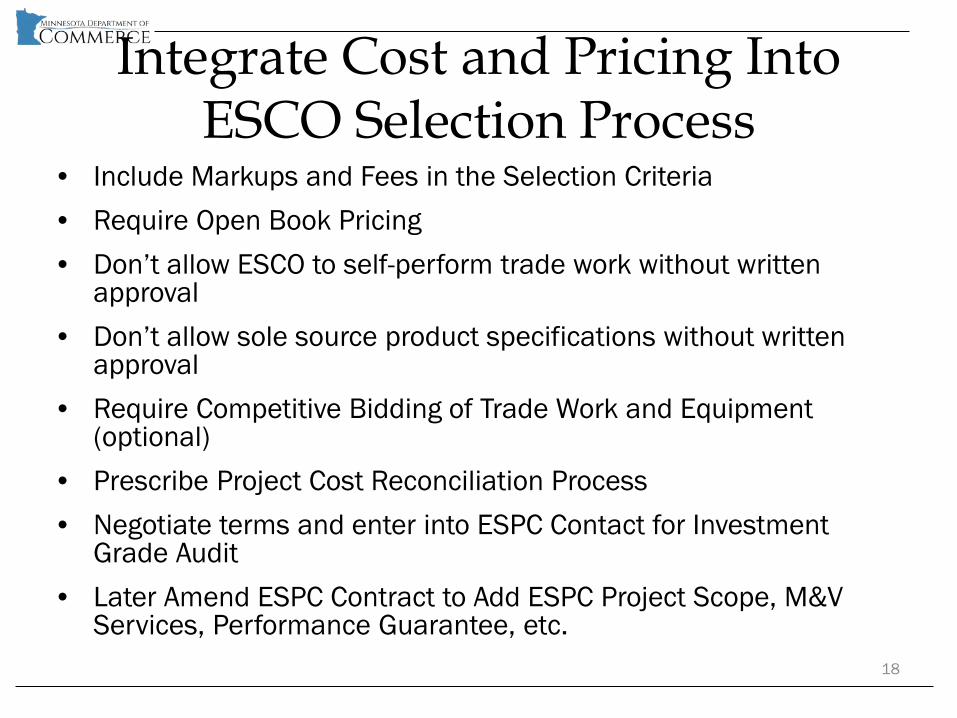
Integrate Cost and Pricing Into ESCO Selection Process
• Include Markups and Fees in the Selection Criteria • Require Open Book Pricing • Don’t allow ESCO to self-perform trade work without written
approval • Don’t allow sole source product specifications without written
approval • Require Competitive Bidding of Trade Work and Equipment
(optional) • Prescribe Project Cost Reconciliation Process • Negotiate terms and enter into ESPC Contact for Investment
Grade Audit • Later Amend ESPC Contract to Add ESPC Project Scope, M&V
Services, Performance Guarantee, etc. 18
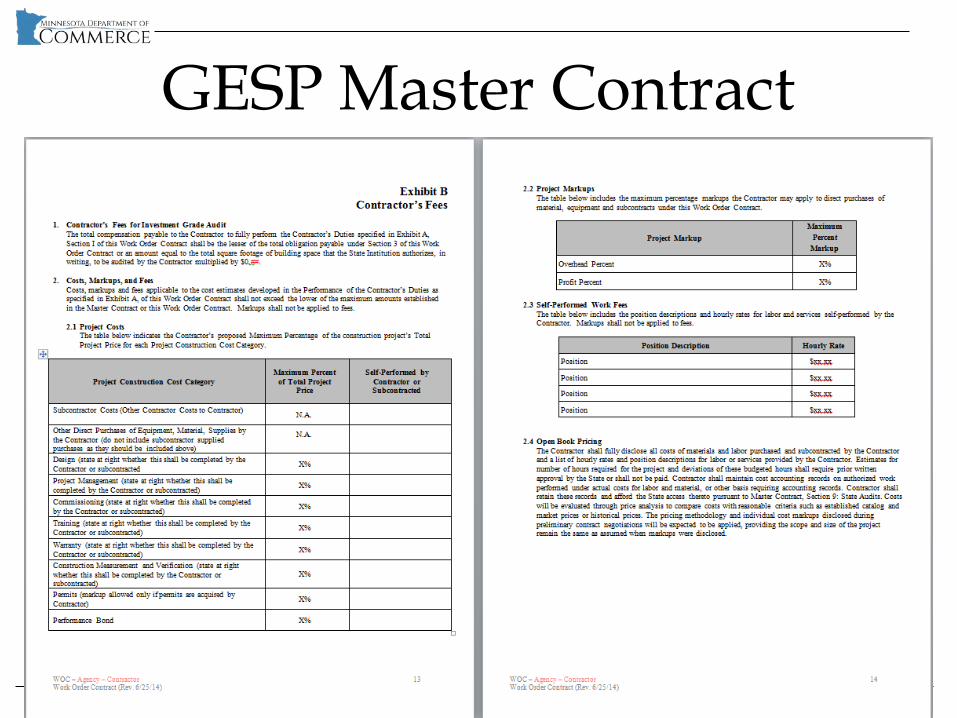
GESP Master Contract
19
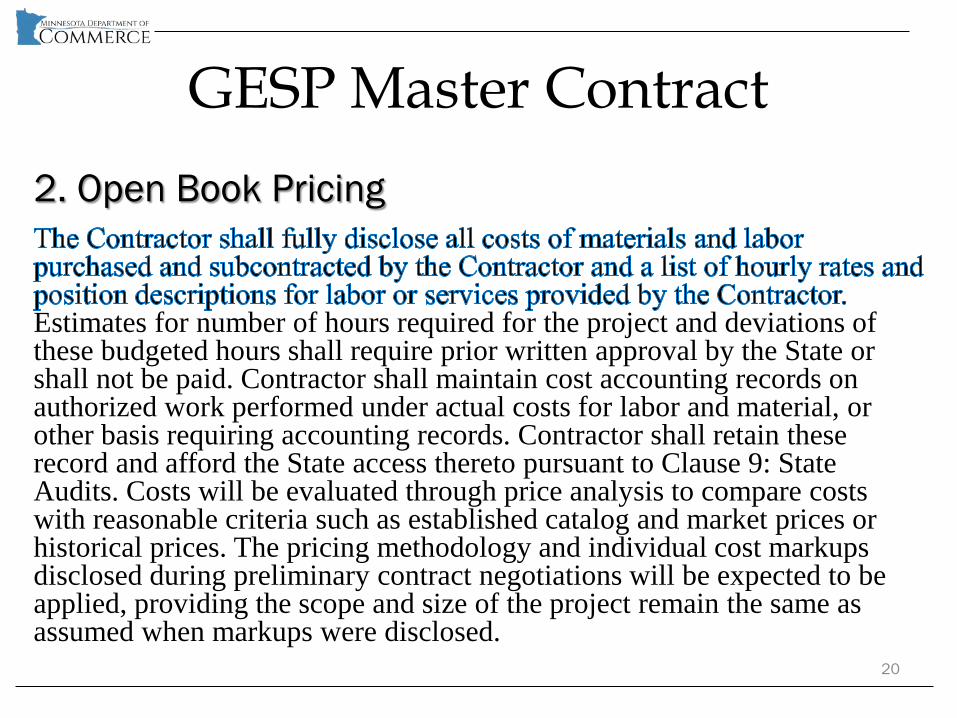
GESP Master Contract 2. Open Book Pricing
Estimates for number of hours required for the project and deviations of these budgeted hours shall require prior written approval by the State or shall not be paid. Contractor shall maintain cost accounting records on authorized work performed under actual costs for labor and material, or other basis requiring accounting records. Contractor shall retain these record and afford the State access thereto pursuant to Clause 9: State Audits. Costs will be evaluated through price analysis to compare costs with reasonable criteria such as established catalog and market prices or historical prices. The pricing methodology and individual cost markups disclosed during preliminary contract negotiations will be expected to be applied, providing the scope and size of the project remain the same as assumed when markups were disclosed.
20
GESP Master Contract
Costs, Markups and Fees • Costs include subcontracted work, direct
purchases of equipment, material and supplies installed on the project
• Fees include ESCO self-performed work, IGA and contingency
• Markups shall not be applied to Fees
21
GESP Project Budget Worksheet
22
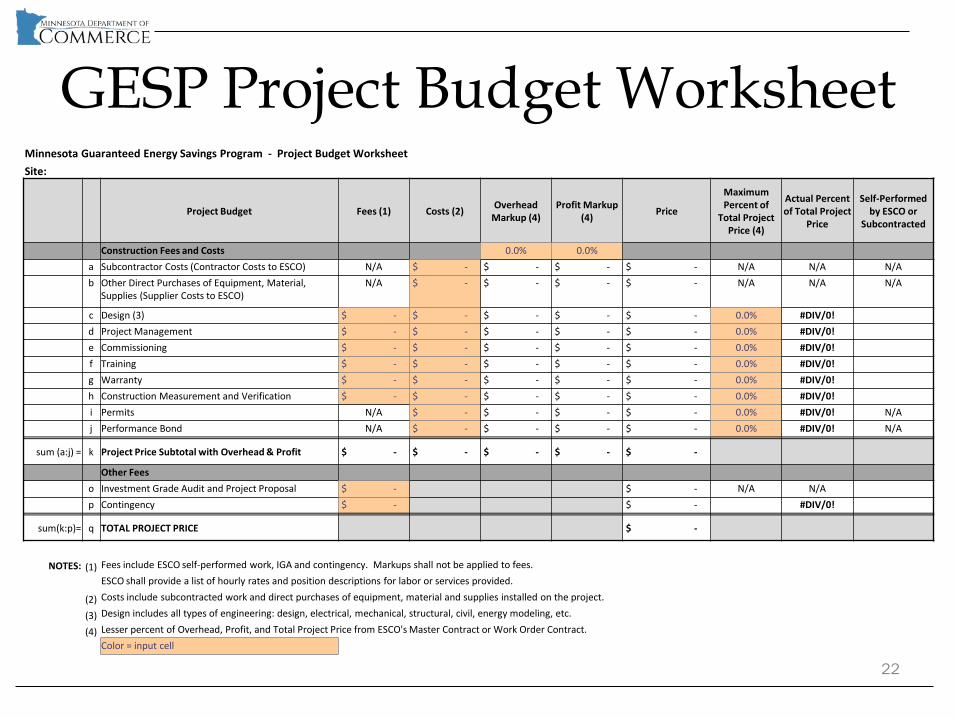
Minnesota Guaranteed Energy Savings Program - Project Budget Worksheet Site:
Project Budget Fees (1) Costs (2) Overhead Markup (4)
Profit Markup (4) Price
Maximum Percent of
Total Project Price (4)
Actual Percent of Total Project
Price
Self-Performed by ESCO or
Subcontracted
Construction Fees and Costs 0.0% 0.0% a Subcontractor Costs (Contractor Costs to ESCO) N/A $ - $ - $ - $ - N/A N/A N/A b Other Direct Purchases of Equipment, Material,
Supplies (Supplier Costs to ESCO) N/A $ - $ - $ - $ - N/A N/A N/A
c Design (3) $ - $ - $ - $ - $ - 0.0% #DIV/0! d Project Management $ - $ - $ - $ - $ - 0.0% #DIV/0! e Commissioning $ - $ - $ - $ - $ - 0.0% #DIV/0! f Training $ - $ - $ - $ - $ - 0.0% #DIV/0! g Warranty $ - $ - $ - $ - $ - 0.0% #DIV/0! h Construction Measurement and Verification $ - $ - $ - $ - $ - 0.0% #DIV/0! i Permits N/A $ - $ - $ - $ - 0.0% #DIV/0! N/A j Performance Bond N/A $ - $ - $ - $ - 0.0% #DIV/0! N/A
sum (a:j) = k Project Price Subtotal with Overhead & Profit $ - $ - $ - $ - $ -
Other Fees o Investment Grade Audit and Project Proposal $ - $ - N/A N/A p Contingency $ - $ - #DIV/0!
sum(k:p)= q TOTAL PROJECT PRICE $ -
NOTES: (1) Fees include ESCO self-performed work, IGA and contingency. Markups shall not be applied to fees. ESCO shall provide a list of hourly rates and position descriptions for labor or services provided.
(2) Costs include subcontracted work and direct purchases of equipment, material and supplies installed on the project.
(3) Design includes all types of engineering: design, electrical, mechanical, structural, civil, energy modeling, etc.
(4) Lesser percent of Overhead, Profit, and Total Project Price from ESCO's Master Contract or Work Order Contract. Color = input cell
Peter Berger, LEED AP BD&C Guaranteed Energy Savings Program Manager
651-539-1850 [email protected]
Website: http://mn.gov/commerce/energy/topics/financial/Energy-Savings-
Programs/Government/Guaranteed-Energy-Savings-Program/Program-Resources/GESP-Program-Master-Contract.jsp

Larry Falkin City of Cincinnati Monitoring & Verification
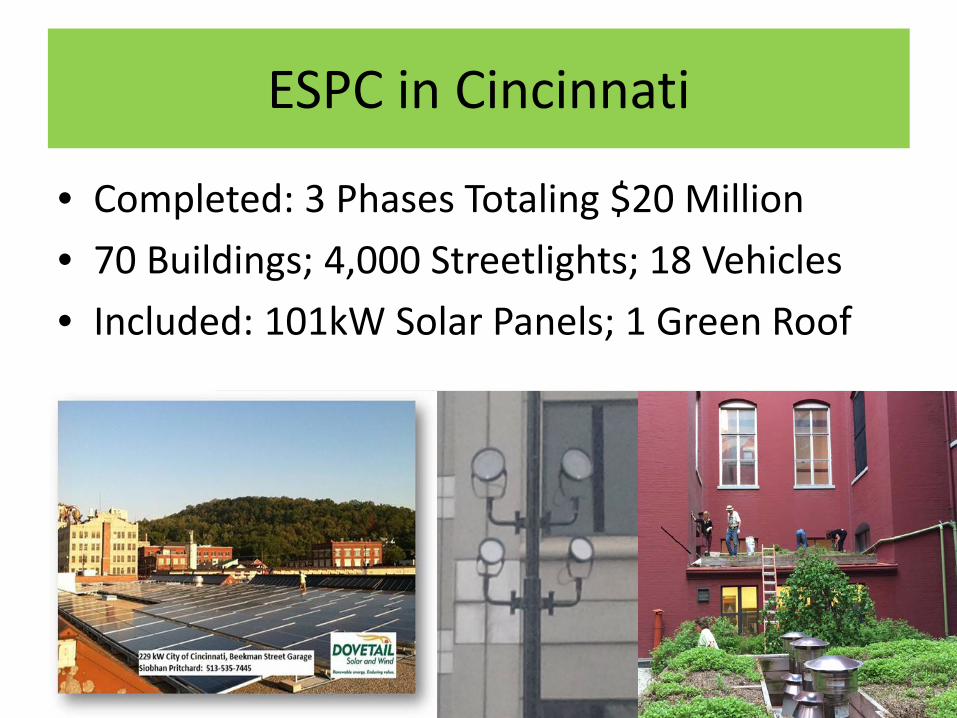
ESPC in Cincinnati
• Completed: 3 Phases Totaling $20 Million • 70 Buildings; 4,000 Streetlights; 18 Vehicles • Included: 101kW Solar Panels; 1 Green Roof

ESPC in Cincinnati
Year Total Project Costs
City Financed w/Energy
Savings
City Capital Duke Energy Rebates/State
Grants
Federal Grant
Funding
State Grant Funding
Annual Energy Reduction
Annual Energy
Generation
Annual GHGE Reduction
City’s Annual Energy Savings
2009 $5,908,691 $4,511,652 $469,000 $190,172
$334,930 $402,937 3.8M kWh/ 116,213 ccf
100,000 kWh 3,437 metric tonnes
$449,344
2010 $8,810,640 $6,515,953 $1,238,737 $253,574 $802,376 $0 6.3M kWh/ 33,907 ccf
0 5,492 metric tonnes
$587,527
2014 $7,893,625 $6,393,564 $0 $481,007* $0 $0 5.0M kWh/ 17,431 ccf
0 3,595 metric tonnes
$367,480
TOTAL $22,612,956 $17,421,169 $1,707,737 $924,753* $1,137,306 $402,937 15.1M kWh/ 167,551 ccf
100,000 kWh 12,524 metric tonnes
$1,404,351
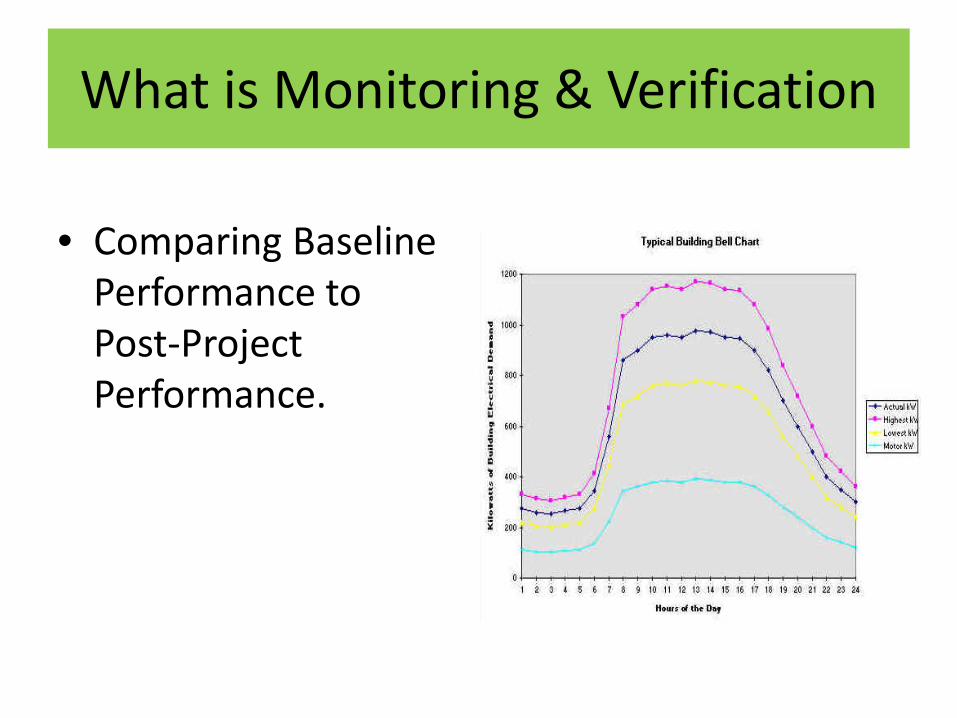
What is Monitoring & Verification
• Comparing Baseline Performance to Post-Project Performance.
Why do Monitoring and Verification?
• Detect and Fix Any Under- Performance in the Project
• Determine Whether the Vendor is Meeting the Guarantee
• Document and Communicate Success
Monitoring and Verification
• When Construction is Finished –
- You’ve Still Got 20 Years to Go.
• Over Time, Things Change
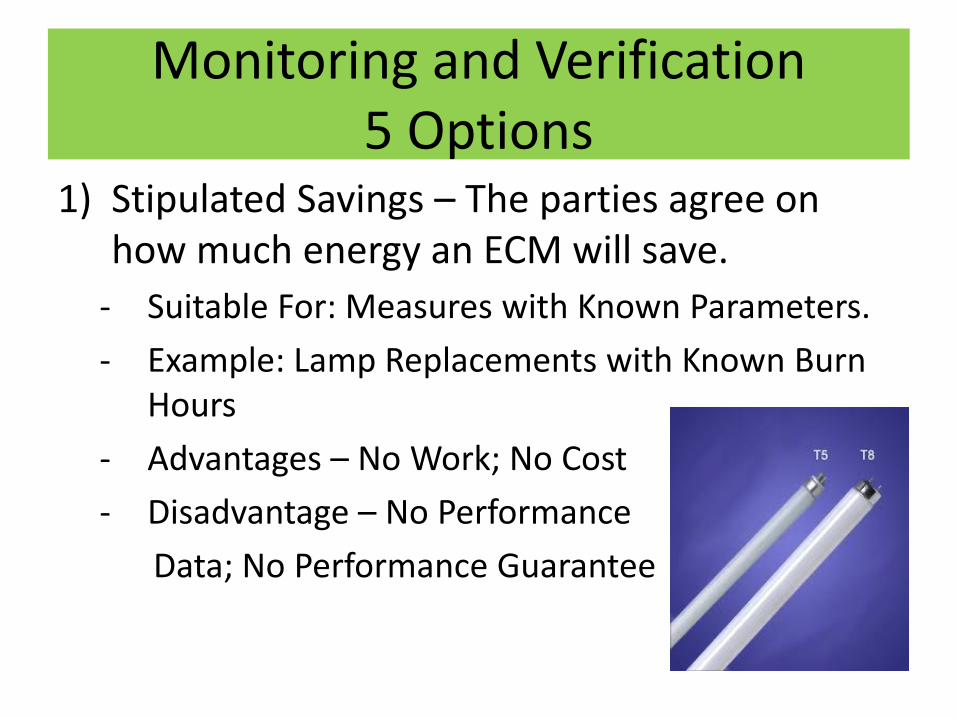
Monitoring and Verification 5 Options
1) Stipulated Savings – The parties agree on how much energy an ECM will save.
- Suitable For: Measures with Known Parameters. - Example: Lamp Replacements with Known Burn
Hours - Advantages – No Work; No Cost - Disadvantage – No Performance Data; No Performance Guarantee
Monitoring and Verification Options
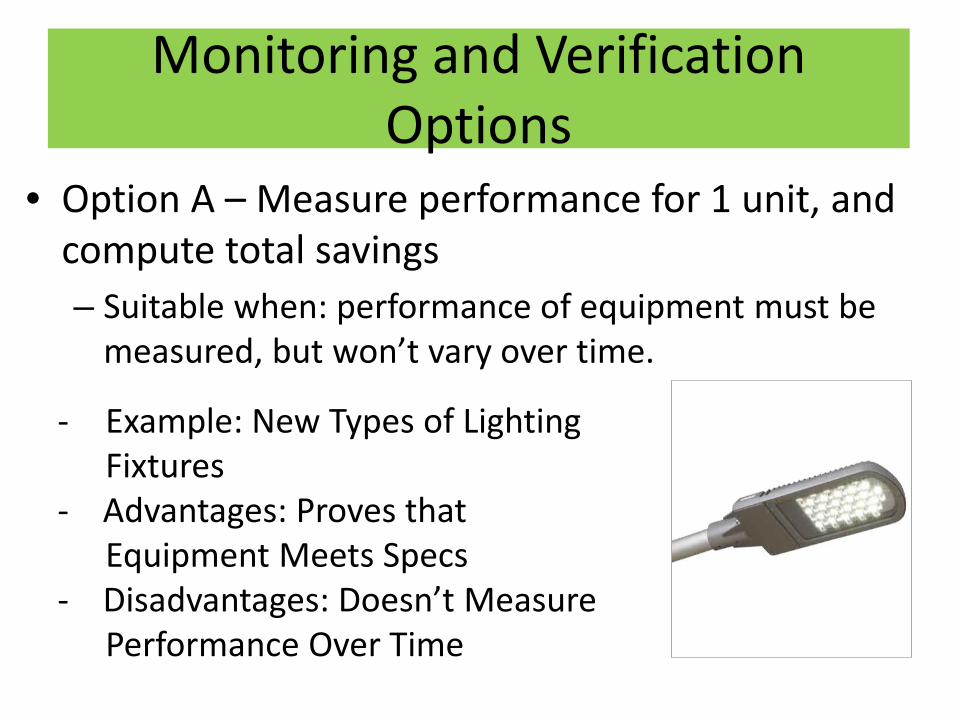
• Option A – Measure performance for 1 unit, and compute total savings – Suitable when: performance of equipment must be
measured, but won’t vary over time.
- Example: New Types of Lighting Fixtures - Advantages: Proves that Equipment Meets Specs - Disadvantages: Doesn’t Measure Performance Over Time

Monitoring and Verification Options
• Option B – Long-term measurement of an ECM’s performance vs. Baseline Data – Suitable When: Performance Data is Needed on a
Specific ECM, and Measurement is Feasible – Example: New Hot Water Heater, with Separate
Meter for Energy Usage. – Cincinnati has Never Used Option B. – Advantages: Documents Value of One ECM – Disadvantages: Requires Dedicated Equip- ment; Often Impractical; Performance Guar- antees are Not Usually Measure-Specific.
Monitoring and Verification Options
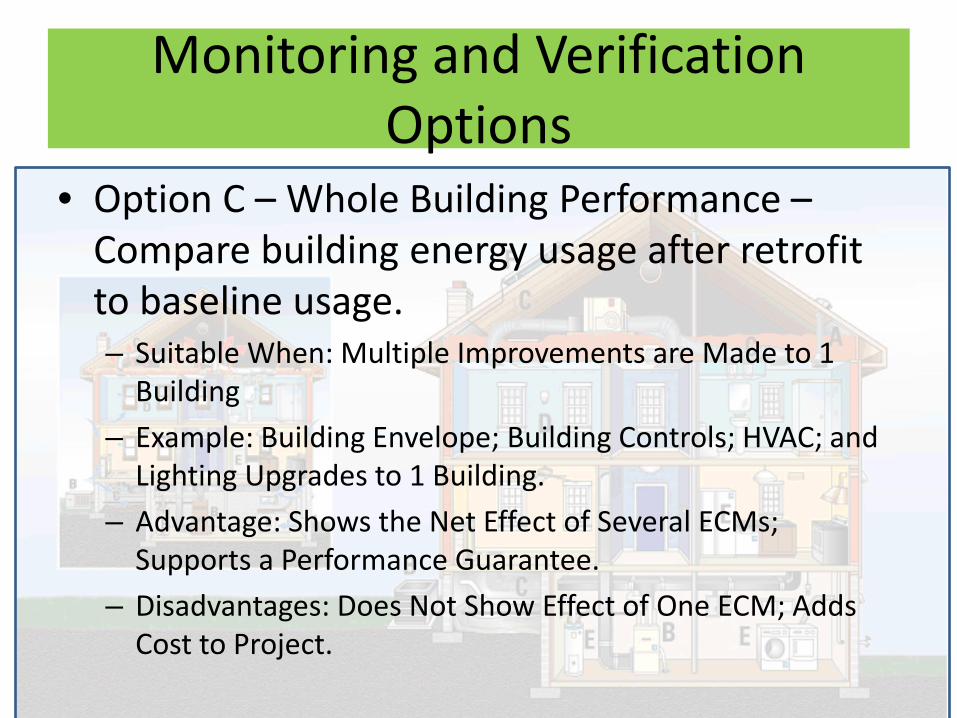
• Option C – Whole Building Performance – Compare building energy usage after retrofit to baseline usage. – Suitable When: Multiple Improvements are Made to 1
Building – Example: Building Envelope; Building Controls; HVAC; and
Lighting Upgrades to 1 Building. – Advantage: Shows the Net Effect of Several ECMs;
Supports a Performance Guarantee. – Disadvantages: Does Not Show Effect of One ECM; Adds
Cost to Project.
Monitoring and Verification Options
• Option D – Computer Models Simulate Measurements – Cincinnati has Never Used Option D
Monitoring and Verification Advice
• Think About M&V Up Front – By the Time You Need It, It’s Too Late.
• Balance: Usefulness vs. Practicality; Value vs. Cost • Ask “What if?” Ask it a lot.
– What if energy costs go up or go down; what if building usage goes up, or goes down; what if better technology arrives, or this technology fails; what if the project is delayed, or scope of work changes; etc.
• Understand what risks you bear; and what risks the vendor bears.

Additional Resources
City of Cincinnati Fact Sheet 2014 Phase 3 Energy Services Performance Contracting
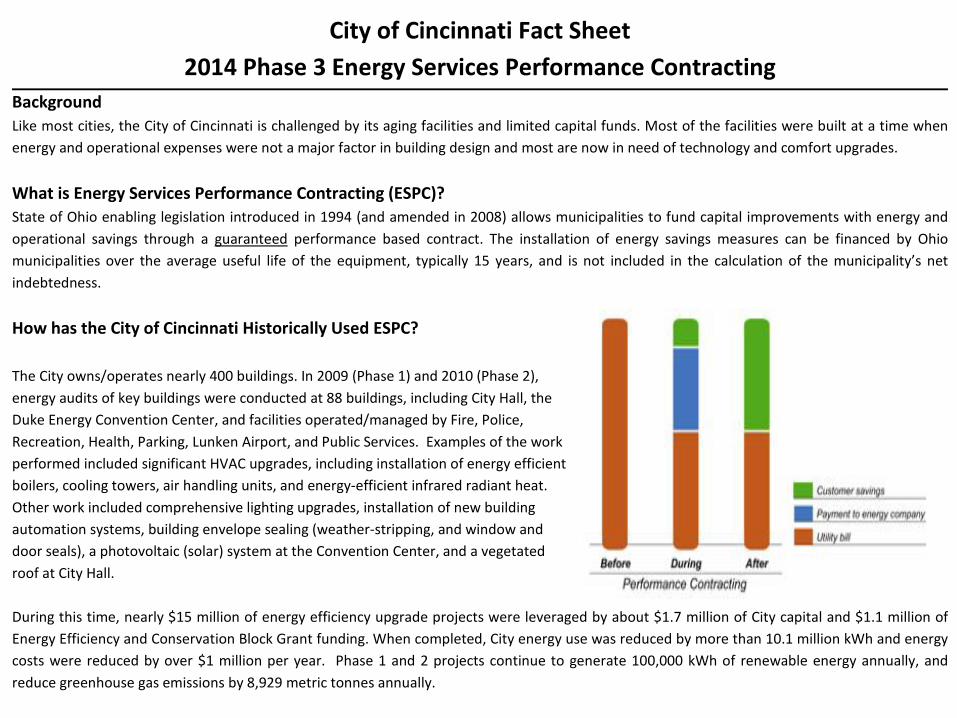
Background Like most cities, the City of Cincinnati is challenged by its aging facilities and limited capital funds. Most of the facilities were built at a time when energy and operational expenses were not a major factor in building design and most are now in need of technology and comfort upgrades. What is Energy Services Performance Contracting (ESPC)? State of Ohio enabling legislation introduced in 1994 (and amended in 2008) allows municipalities to fund capital improvements with energy and operational savings through a guaranteed performance based contract. The installation of energy savings measures can be financed by Ohio municipalities over the average useful life of the equipment, typically 15 years, and is not included in the calculation of the municipality’s net indebtedness. How has the City of Cincinnati Historically Used ESPC? The City owns/operates nearly 400 buildings. In 2009 (Phase 1) and 2010 (Phase 2), energy audits of key buildings were conducted at 88 buildings, including City Hall, the Duke Energy Convention Center, and facilities operated/managed by Fire, Police, Recreation, Health, Parking, Lunken Airport, and Public Services. Examples of the work performed included significant HVAC upgrades, including installation of energy efficient boilers, cooling towers, air handling units, and energy-efficient infrared radiant heat. Other work included comprehensive lighting upgrades, installation of new building automation systems, building envelope sealing (weather-stripping, and window and door seals), a photovoltaic (solar) system at the Convention Center, and a vegetated roof at City Hall. During this time, nearly $15 million of energy efficiency upgrade projects were leveraged by about $1.7 million of City capital and $1.1 million of Energy Efficiency and Conservation Block Grant funding. When completed, City energy use was reduced by more than 10.1 million kWh and energy costs were reduced by over $1 million per year. Phase 1 and 2 projects continue to generate 100,000 kWh of renewable energy annually, and reduce greenhouse gas emissions by 8,929 metric tonnes annually.
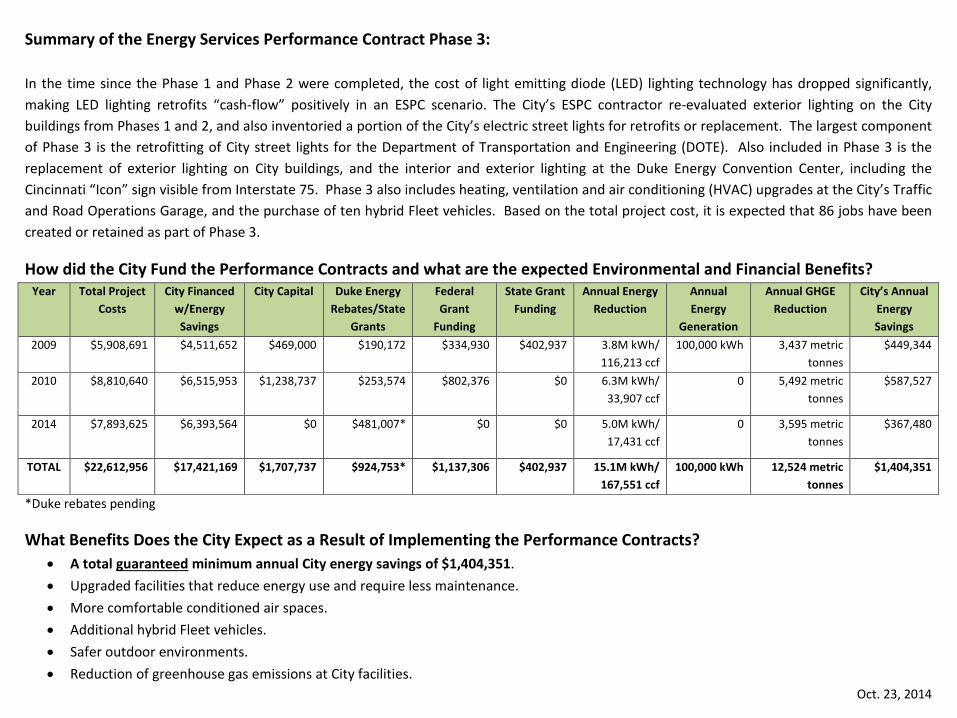
Summary of the Energy Services Performance Contract Phase 3: In the time since the Phase 1 and Phase 2 were completed, the cost of light emitting diode (LED) lighting technology has dropped significantly, making LED lighting retrofits “cash-flow” positively in an ESPC scenario. The City’s ESPC contractor re-evaluated exterior lighting on the City buildings from Phases 1 and 2, and also inventoried a portion of the City’s electric street lights for retrofits or replacement. The largest component of Phase 3 is the retrofitting of City street lights for the Department of Transportation and Engineering (DOTE). Also included in Phase 3 is the replacement of exterior lighting on City buildings, and the interior and exterior lighting at the Duke Energy Convention Center, including the Cincinnati “Icon” sign visible from Interstate 75. Phase 3 also includes heating, ventilation and air conditioning (HVAC) upgrades at the City’s Traffic and Road Operations Garage, and the purchase of ten hybrid Fleet vehicles. Based on the total project cost, it is expected that 86 jobs have been created or retained as part of Phase 3.
How did the City Fund the Performance Contracts and what are the expected Environmental and Financial Benefits? Year Total Project
Costs City Financed
w/Energy Savings
City Capital Duke Energy Rebates/State
Grants
Federal Grant
Funding
State Grant Funding
Annual Energy Reduction
Annual Energy
Generation
Annual GHGE Reduction
City’s Annual Energy Savings
2009 $5,908,691 $4,511,652 $469,000 $190,172
$334,930 $402,937 3.8M kWh/ 116,213 ccf
100,000 kWh 3,437 metric tonnes
$449,344
2010 $8,810,640 $6,515,953 $1,238,737 $253,574 $802,376 $0 6.3M kWh/ 33,907 ccf
0 5,492 metric tonnes
$587,527
2014 $7,893,625 $6,393,564 $0 $481,007* $0 $0 5.0M kWh/ 17,431 ccf
0 3,595 metric tonnes
$367,480
TOTAL $22,612,956 $17,421,169 $1,707,737 $924,753* $1,137,306 $402,937 15.1M kWh/ 167,551 ccf
100,000 kWh 12,524 metric tonnes
$1,404,351
*Duke rebates pending
What Benefits Does the City Expect as a Result of Implementing the Performance Contracts? • A total guaranteed minimum annual City energy savings of $1,404,351. • Upgraded facilities that reduce energy use and require less maintenance. • More comfortable conditioned air spaces. • Additional hybrid Fleet vehicles. • Safer outdoor environments. • Reduction of greenhouse gas emissions at City facilities.
Oct. 23, 2014

Discussion