developing affordable housing on public land in los angeles
TRANSCRIPT

DEVELOPING AFFORDABLE HOUSING ON PUBLIC LAND IN LOS
ANGELES
A Project
Presented to the
Faculty of
California State Polytechnic University, Pomona
In Partial Fulfillment
Of the Requirements for the Degree
Master
In
Urban & Regional Planning
By Abigya Eshete
2021
ii
SIGNATURE PAGE
PROJECT: DEVELOPING AFFORDABLE HOUSING ON PUBLIC LAND IN LOS ANGELES
AUTHOR: Abigya Eshete
DATE SUBMITTED: Spring 2021
Department of Urban & Regional Planning
Dr. Gwen Urey Project Committee Chair Urban and Regional Planning
Richard Zimmer, AICP Urban and Regional Planning
Eve Bachrach Client HCIDLA

iii
ABSTRACT
Cities are attempting to expand their supply of affordable housing by utilizing publicly-owned land
for development. The literature indicates that creating an inventory of sites that qualify for housing
development is the first step to take the most advantage of public land. Using property data from the City
of Los Angeles, this project identifies sites that have the least barriers to development and overlays a
quality-of-life analysis to ensure that future residents will be in locations that are accessible to transit,
grocery stores and schools. The result of this project will enable the client to identify the best
opportunities to deliver affordable housing units in the most cost-effective way.

iv
TABLE OF CONTENTS
SIGNATURE PAGE ................................................................................................................................... ii
ABSTRACT ............................................................................................................................................... iii
LIST OF TABLES ....................................................................................................................................... v
LIST OF FIGURES .................................................................................................................................... vi
INTRODUCTION ....................................................................................................................................... 1
Project Client .............................................................................................................................................. 1
Project Description ..................................................................................................................................... 2
LITERATURE REVIEW ............................................................................................................................. 3
Housing Unaffordability and Its Consequences ......................................................................................... 3
The California Context ............................................................................................................................... 4
Potential of Surplus Land ........................................................................................................................... 6
METHODOLOGY ..................................................................................................................................... 10
FINDINGS ................................................................................................................................................ 15
Size as a Priority ................................................................................................................................... 15
Opportunity Category as a Priority ........................................................................................................ 20
DISCUSSION ........................................................................................................................................... 23
REFERENCES ........................................................................................................................................ 25

v
LIST OF TABLES
Table 1: Parcels greater than 1/4 acre. ....................................................................................................... 16
Table 2: Sites greater than 7,500 sqft, but less than ¼ acres. ................................................................... 18
Table 3 - High Resource Parcels ................................................................................................................ 20
vi
LIST OF FIGURES
Figure 1 - Map of Transit Oriented Communities. Source: ZIMAS. ............................................................ 10
Figure 2 - Glasgow Pl, vacant site. Source: Google Street View. .............................................................. 16
Figure 3 - Sites greater than 1/4 acre. Source: Google Earth. ................................................................... 17
Figure 5 - All sites greater than 7,500 sqft, but less than 1/4 acres. Source: Google Earth. ...................... 20
Figure 6 - Aerial View of High Resource Sites. Source: Google Earth. ...................................................... 21
Figure 7 - Opportunity Map, High Segregation & Poverty. Source: TCAC/HCD. ....................................... 22
Figure 8 - Example of unsuitable site. Dominguez Channel designated as “Vacant.”
Source: Los Angeles County Assessor Map. ............................................................................................. 23

1
INTRODUCTION
Affordable housing continues to be a major issue in California. The shortfall of affordable homes
has led to cost-burdened households, with the historical trend showing the depth of the problem:
from 2014-2018, 80% of extremely low-income renters have experienced severe cost burden, while
the cost burden for very low-income renters remained above 50% for those four years (California
Housing Partnership, 2020). The state has been trying to tackle this problem in a variety of ways.
Recently, the use of surplus land for housing development has been identified as an opportunity to
expand housing production. However, there are challenges that make it difficult to effectively
marshal surplus land. One major challenge is the lack of information and coordination between
entities that own land, the status of what they possess and whether any of it can be developed.
There is no database containing a list of sites that can be used for affordable housing. To facilitate
this, California has introduced new laws that impact land disposal and require agencies to prioritize
available sites for development.
Project Client
The client is Housing + Community Investment Department of Los Angeles (HCIDLA), more
specifically the Housing Strategies & Services Division. HCIDLA is the city’s affordable housing
organization, with a mission to “promote livable and prosperous communities through the
development and preservation of decent, safe, and affordable housing, neighborhood investment
and social services.”1 HCIDLA is vast and, aside from general management and administrative
duties, the organization has three bureaus: Community Services & Development, Regulatory
Compliance & Code, and Housing Development. Each of these bureaus have multiple divisions
that manage various housing and community programs, from rent stabilization, supportive housing
services, to neighborhood improvement projects. The project client is under the Housing
Development Bureau, which administers development financing and asset management, along with
programs ranging from homeownership, preservation of housing for aging residents, lead hazard
mediation and much more.
1 https://hcidla.lacity.org/
2
Project Description
This project seeks to add to that effort by creating an inventory of Los Angeles sites
that have been analyzed and qualified using important indicators, with the end goal of fast
tracking the development of much needed affordable housing on these selected sites. The
major task for this project will be to deliver the land analysis for the City of Los Angeles,
which is detailed in the methods section. This can be used to guide future policy or
research for the client. The proposal begins with a review of the literature on affordable
housing, the impact of housing unaffordability, the underlying issues and provides
background on housing issues specific to California. Following that is a discussion on
surplus land, an outline of methodology to conduct site inventory and analysis of surplus
land.

3
LITERATURE REVIEW
There is expansive literature on the topic of affordable housing, but this review is
organized to provide background on the key ideas around affordable housing, including the
impact of housing unaffordability, and the contributing factors that lead to a mismatch between
housing supply and demand. Particular attention is paid to California and the use of surplus land,
reviewing legislative materials that are critical to understanding how the state is planning on
addressing this issue.
Housing Unaffordability and Its Consequences
Affordable housing is a major challenge for cities across the nation. According to the
2019 ACS data, 48.5% of renter occupied households and 26.6% of homeowners spend 30% or
more of their income on housing costs (U.S. Census Bureau, 2019), categorizing them as “cost-
burdened,” as defined by HUD (U.S. Department of Housing and Urban Development, 2017). A
contributor to housing cost burden is the gap between incomes and cost: the average household
makes a median income of $65,712, while the median value of a home is $240,500 (U.S. Census
Bureau, 2019).
The impact of affordable housing extends beyond providing physical space for shelter.
Affordable housing is linked to crucial quality-of-life outcomes: families that are burdened with
high housing costs make significant trade-offs, like spending less money on health care and food
(Maqbool, Viveiros, & Ault, 2015) which leads to food insecurity and negative health outcomes.
Further, families with financial constraints are more likely to have limited housing options and are
forced to live in substandard housing conditions, which can be a contributor to chronic and
infectious diseases (Robert Wood Johnson Foundation, 2011). The lack of affordable housing
can also influence educational outcomes: students who frequently relocate due to housing
instability are more likely to have poor school performance, compared to their peers (Enterprise
Community Partners, 2014). Another notable impact of affordable housing development is its
contribution to economic revitalization. Developments in low-income areas that are funded by
Low Income Housing Tax Credits (LIHTC) increase the property values of surrounding
neighborhoods, producing large welfare benefits, and even decreasing segregation and crime

4
(Diamond & McQuade, 2019). Studies have shown the stimulating effects of affordable housing
on local economies: the creation of short-term and longer-term jobs; increase in government
revenues; lowered risk of foreclosures (Cohen & Wardrip, 2011); and in reverse, the significant
negative effects of unaffordable housing, which reduces local employment growth (Chakrabarti &
Zhang, 2010).
The mismatch between affordable housing supply and demand is significant, with
metropolitan regions being impacted mostly by a lack of rental housing supply. Nationwide, for
Extremely Low-Income renters (defined as those below 30% of area median income), there is a
deficit of 2.4 million units, leaving only 22 affordable units for every 100 ELI renter families, with
the West having the largest supply gap, leaving 13 affordable units for every 100 ELI families
(Airgood-Obrycki & Molinsky, 2019). One reason that contributes to this mismatch between
supply and demand is density restrictions that require minimum lot sizes, limiting the
development of new housing and contributing to increased land prices (Joint Center for Housing
Studies, 2020). Another contributor is communities mobilizing to oppose affordable housing
development, citing reasons ranging from impact on property values, decreased quality of life
and aesthetic objections (Schively, 2007). Further, these fears are not founded on facts but
mostly driven by a lack of understanding about the benefits of affordable housing (Payton Scally
& Tighe, 2015).These restrictions not only undercut housing supply, but lead to racial and
economic segregation (Greene & Gould Ellen, 2020) by concentrating affordable developments
in low-income areas, and making it difficult for low-income workers to live in areas with a larger
pool of job opportunities (Been, 2018).
The California Context
The problem of housing unaffordability is even more acute in California: 53.3% of renter
households and 37.1% of homeowners are defined as cost-burdened (U.S. Census Bureau,
2019). For renters in California, the gap between income and rent price is substantial: renters
need to earn 2.9 times the state minimum wage to afford average asking rents. What is even
more concerning is the historic trend: from 2000 to 2018, California’s median rent increased 40%
while median renter income increased by only 8% (California Housing Partnership, 2020).This
5
has serious implications, ranging from overcrowding to homelessness—HUD’s 2019
homelessness report indicated a 16.4% increase of homeless persons in one year (U.S.
Department of Housing and Urban Development, 2020).
With a rising population—California has been receiving more than 400,000 residents per year
for over the last seventy-five years (Fulton & Shigley, 2018)—there is a never-ending demand for
affordable housing. To meet this need, the state allocates jurisdictions specific numbers of
housing that they need to provide, based on demographic and economic needs, which is
determined by the state in the Regional Housing Needs Assessment (Fulton & Shigley, 2018).
Further, the state mandates local governments to include a Housing Element in their General
Plan (CA Government Code § 65300) to make “adequate provision for the existing and projected
housing needs of all economic segments of the community.” The Housing Element is also the
only element that is required to be updated periodically (every five to eight years), indicating the
state’s particular attention to the issue of housing. However, California continues to be
challenged with housing availability and affordability.
While there are numerous contributing factors for the shortage of housing, land-use
regulations, development process and limited land supply are significant factors in California.
Measures to control growth—like maximum density and height—affect the supply of housing.
Several California jurisdictions regulate the number of housing units that can be constructed on
specific lots (Mawhorter & Reid, 2018). This is especially heightened in the state’s coastal
metros, with each control measure increasing home prices by up to 5% (Taylor, 2015). Cities
with regulatory prohibitions are strongly associated with less permitting for new construction, and
they especially impede multifamily housing production (Monkkonen, Lens, & Manville, 2020),
which is the kind of development that can meaningfully expand housing availability. Further, the
lack of land zoned for multifamily housing limits opportunities for housing expansion—a majority
of California jurisdictions dedicate most of their available land to single-family housing
(Mawhorter & Reid, 2018). The effect of land use regulations in California cities is considerable:
in Los Angeles housing prices would decrease by 25% if these restrictions were reduced to the
level of other least regulated cities (Lin & Wachter, 2019).

6
Political measures around land-use also limit development: some cities in California require
voter approval or supermajority votes by elected officials to increase densities (Quigley &
Raphael, 2005). Combined with pressures from voters who oppose developments, local leaders
might be compelled to forego affordable housing developments. An additional layer is the state’s
mandate which limits property taxes to 1% of the assessed value, creating an environment where
cities advocate for commercial development rather than residential, as the former allows a much
larger source of revenue (Quigley & Raphael, 2005).
The cost of developing housing is notably high in California. Development fees in California
outpace other states, costing three times the national average and in some cases, these fees
can equal to 18% of a home’s median price (Mawhorter, Sarah; Garcia, David; Raetz, Hayley,
2018). The state does not have a standardized system of implementing development fees,
sometimes leading developers to opt for designs that increase sizes but reduce the number of
units, which impacts housing supply. Further, this system forces builders to rely on estimates
during the planning phase, which can result in project revisions, delays, and additional costs
(Mawhorter, Sarah; Garcia, David; Raetz, Haley, 2018). Land also contributes to total
development costs, with some of the costs being pushed by the potential of how much rent can
be extracted after a site is developed. In areas with high amenities, land can be up to 30% of
total development costs (Hickey & Sturtevant, 2015). This is the case for California’s metro cities,
with land value tripling in Los Angeles from 2000 to 2016 (Terner Center for Housing Innovation,
2020). The increased land cost also means developers are mostly likely to lean towards higher-
end housing (Freddie Mac, 2017).
Potential of Surplus Land
To alleviate housing pressures, localities throughout the country have begun to identify
surplus land as a potential solution. Broadly defined, surplus land is a site that is owned by a
governmental entity, which can range from the federal government to a school district.
California’s code defines surplus as “land owned in fee simple by any local agency for which the
local agency’s governing body takes formal action in a regular public meeting declaring that the
land is surplus and is not necessary for the agency’s use” (CA Government Code § 54221).The
7
idea of using surplus land for housing is not new. The California Surplus Land Act (SLA) was first
enacted in 1968 with the purpose of prioritizing surplus lands for affordable housing, parks and
open space, and schools (Office of Assemblymember Phil Ting, 2019). In 2014, the SLA was
amended to encourage developments with deepest affordability, increase negotiation periods
between a disposing agency and interested entities, and to give first priority to entities that agree
to use the site for affordable housing, over other uses (A.B. 2135, 2014). However, the state has
recognized these measures were not sufficient, as cities were bypassing these requirements
(DeRuy, 2020). To overcome this and facilitate more housing production, California strengthened
laws, with three notable decisions in September 2019:
• Assembly Bill 1486 was passed to expand the SLA. Some of the notable changes are
expanding definitions to include more entities: “local agency” now goes beyond
geographical regions like city or county and covers districts like sewer, water, utility,
and all special districts; “surplus land” is redefined to include land held by former
redevelopment agencies. This is aimed directly at cities that were able to previously
argue against inclusion in the SLA, by stating redevelopment agency land was
exempt (Office of Assemblymember Phil Ting, 2019). The bill also has strict
requirements for property disposition, some of which are: negotiation priority is to be
given to entities that propose units with the "deepest affordability"; prohibiting deals
that would disallow residential uses and maximum density; and introducing severe
penalties—30% to 50% of final sale price of land—and authorizing the state’s
Department of Housing and Community Development to notify the Attorney General if
a local jurisdiction violates provisions (A.B. 1486, 2019). Another notable requirement
is for a city or county planning agency to provide a list of sites that have been
disposed in the previous year, to whom and what the intended use was.
• Assembly Bill 1255 amended the existing law to require each city and county to create
a database of surplus land, with description of parcel and uses, and to provide this list
to the Department of General Services' digital inventory. This will be done annually,
beginning in April 2021 (A.B. 1255, 2019) and all the information will be made public

8
record.
• Governor Newsom signed Executive Order N-06-19 in January 2019 for the
Department of General Services to create a digital inventory of excess parcels that
are owned by the state. The Executive Order also instructed Department of General
Services, Department of Housing and Community Development and California
Housing Finance Agency to develop screening tools that evaluate the feasibility of
housing development on these identified sites and "where underproduction is
impacting housing affordability" (Exec. Order No. N-06-19, 2019). The screened sites
will also be mapped to show where development will be most feasible and impactful.
Further, the Order instructs state agencies and departments to prioritize these sites
for state funding.
While California is rapidly mobilizing to take advantage of surplus land, other states have
made significant progress in utilizing surplus land. In 2018, Washington State passed legislation
that mandates inventory of surplus land and authorizes the discount of land for public benefit
developments (Arabo & Leonard, 2018). Further, the state’s largest county has had an ordinance
in place since 1996 which requires all surplus land to be dedicated to affordable housing (Hickey
& Sturtevant, 2015). Similarly, in 2014 the District of Columbia authorized specific percentages to
be dedicated to affordable housing when public land is disposed for development (Family
Housing Fund, 2018). At the city level, San Francisco’s Surplus Public Lands ordinance has a list
of policies that prioritize surplus land for citywide affordable housing (Family Housing Fund,
2018).
While surplus land affords significant opportunities to increase housing supply, it also comes
with challenges. First, the sites might involve complicated levels of ownership, putting restrictions
on its use and triggering stringent regulations (Spotts, Hale-Case, & Abu-Khalaf, 2017). Another
concern might be the gulf between the goals of public agencies and market needs, including
competing visions and a lack of consensus with private developers (Spotts, Hale-Case, & Abu-
Khalaf, 2017). The process of organizing publicly-owned sites also requires significant
coordination and collaboration between multiple public agencies, which might result in a lengthy
9
and complicated process (Spotts, Hale-Case, & Abu-Khalaf, 2017).
From the literature on use of surplus land for housing, there are key points to take into
consideration. The most crucial step is creating an inventory of surplus land and prioritizing the
inventory for varying use of sites (Hickey & Sturtevant, 2015). California’s amendments and
Executive Order N-06-19 indicate the state is heading in the right path. However, the state
advises that DGS is strictly inventorying state-owned parcels and cautions "local jurisdictions and
other public agencies to identify excess sites in their own property inventory" (CA Department of
General Services, 2018). In addition, the inventory can include co-location opportunities, where
affordable units can be placed above spaces like libraries, parking structures and community
halls (CA Department of General Services, 2018).
Prioritizing sites also means carefully weighing the criteria for site inventory and analysis of
surplus land. The Excess Site Screening Tools criteria created by the CA Department of General
Services, in accordance with Executive Order N-06-19, lists an Economic Feasibility Tool and a
Regional Underproduction Factors Tool (CA Deparment of General Services, 2019), each with
their own specific criteria. The Economic Feasibility Tools lists criteria that evaluate a site’s
suitability using the following factors: physical factors (parcel size, shape, potential for
consolidation); proximity to job centers, education, high-frequency transit; availability of utilities,
and other amenities. The Regional Underproduction Factors Tool aims to assess housing needs
with three criteria: availability of affordable housing in job and commute sheds; gap between
supply and demand (comparing RHNA housing allocation with issued building permits); and rate
of increase in rent (parcels where median gross rent increased by more than 5% in a single
year).
Another example of site analysis is a tool used for searching surplus land in Washington
State’s King County. The tool applies filters that filter sites in a large database based on suitable
zoning, suitable present use (not in a restricted or undevelopable area), lot size, tax exemption
status, and various physical factors, like not being underwater or having topography challenges
(Enterprise Community Partners, 2020). Other site analysis tools included percentage of tree
coverage, purchase agreement and historic resource, among other items (Arlington County,
10
2014). Aside from the criteria mentioned in these tools, it is also important to consider additional
factors like environmental restrictions (floodplains, landslides, seismic activity, fire hazard, toxic
contamination), which will help identify what can be mitigated, as well as evaluating the costs and
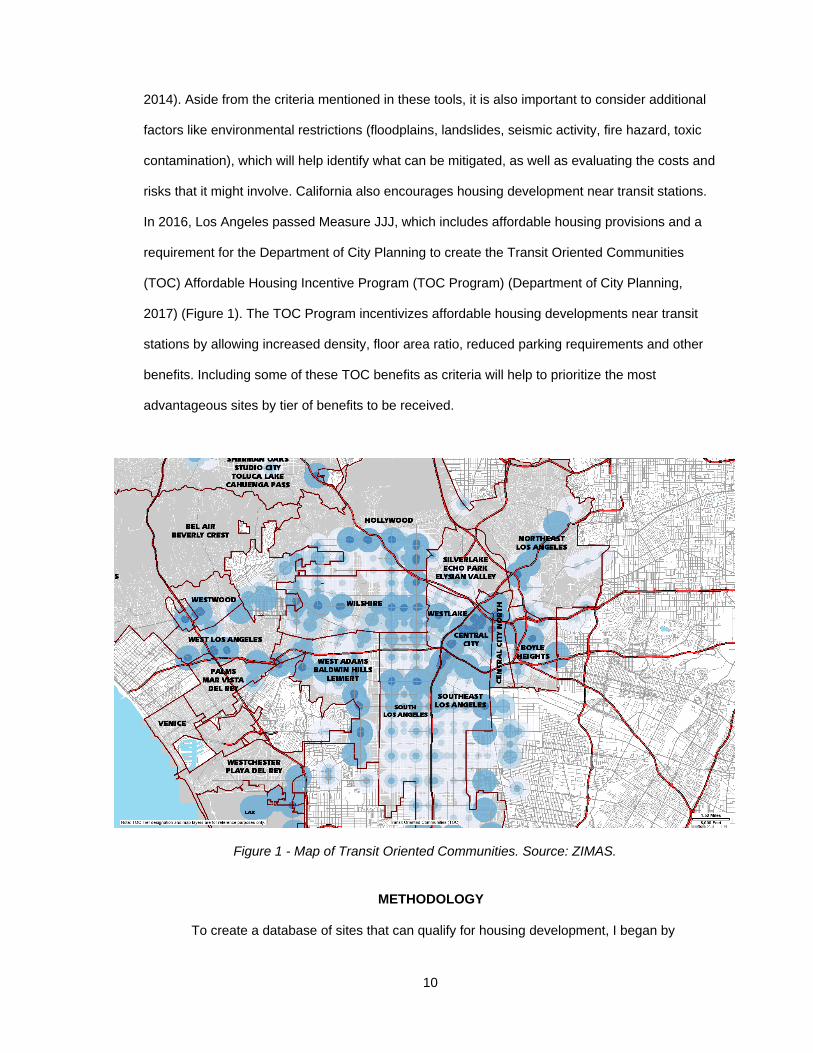
risks that it might involve. California also encourages housing development near transit stations.
In 2016, Los Angeles passed Measure JJJ, which includes affordable housing provisions and a
requirement for the Department of City Planning to create the Transit Oriented Communities
(TOC) Affordable Housing Incentive Program (TOC Program) (Department of City Planning,
2017) (Figure 1). The TOC Program incentivizes affordable housing developments near transit
stations by allowing increased density, floor area ratio, reduced parking requirements and other
benefits. Including some of these TOC benefits as criteria will help to prioritize the most
advantageous sites by tier of benefits to be received.
Figure 1 - Map of Transit Oriented Communities. Source: ZIMAS.
METHODOLOGY
To create a database of sites that can qualify for housing development, I began by

11
identifying publicly-owned parcels from the Los Angeles Controller’s inventory, which includes
property data from six entities: City of Los Angeles, State of California, County of Los Angeles,
Los Angeles County Metropolitan Transportation Authority (LA Metro), LA Unified School District
and the federal government2. As the project needed to be time-bound, the list of properties to be
analyzed was based on the list downloaded from the Controller’s website in January 2021.
Therefore, updates to the Controller’s list after that date have not been considered. The list
contains a total of 13,948 properties with various information for each property, including
ownership, size, shape, and land use code.
The first step was to filter the properties that are vacant, which can be found listed in the
Use Code column of the Controller’s spreadsheet, with “V” next to each code. Following that, I
identified properties that were designated Residential Use—the Use Type category contains
various designations (Commercial, Irrigated Farm etc.)—and then filtered to keep parcels that
had the following descriptions:
▪ Double, Duplex, or Two Units
▪ Three Units
▪ Four Units
▪ Five or More Units or Apartments
Parcels designated for Single Family and Rooming/Boarding House were removed at this
stage. To expand the options available, I also included sites that were labeled under other or non-
residential uses/ownership, namely government, institutional, industrial, miscellaneous, and blank
sites that had no use or description indicator.
To understand the characteristics of these filtered sites in the preliminary stage, I created
a suitability filter, indicating “Yes” or “No” for specific criteria. The criteria for suitability had the
following indicators, and each of the 160 sites were filtered through it by using the Assessor's
Identification Number from the property list.:
▪ Historic Site: Sites that are designated historic and can be found in the
2 Property Panel, LA Controller: https://lacontroller.org/data-stories-and-maps/propertypanel/

12
Department of City Planning, Office of Historic Resources’ database3
▪ Historic Preservation: Sites that require preservation review and/or have been
identified as qualified for historic designation. This information can be found on
the Zone Information Map Access System (ZIMAS)4
▪ Flood Zone: Sites designated flood hazard areas by the Federal Emergency
Management Agency (FEMA), as there is a 1% or greater of a chance. This
information can be accessed on ZIMAS.
▪ Hazardous Waste: Parcels that are close to superfund sites, as defined and
identified by the Environmental Protection Agency (EPA). This information can
be accessed on ZIMAS.
▪ Brownfields: Sites that contain hazardous pollutants or contaminants were
identified using PolicyMap5, which displays brownfield sites designated by local
entities. As I was not able to access PolicyMap’s measuring tools and other
custom features with the version that I had, sites that were too close to the
brownfield point were checked against the California Department of Toxic
Substances Control (DTSC) data management system (EnviroStor)6.
▪ Fire Hazard Zone: Sites that were identified as “Very High Fire Hazard Severity
Zone” by the LA Fire Department. The criteria include fire weather, slope and
other factors. This information can be accessed on ZIMAS.
▪ Land Slide: Sites that were designated by the state and have the potential for
“earthquake-induced rock falls, slope failure, and debris flow.” This information
can be accessed on ZIMAS.
▪ Transit Oriented Communities: The TOC Program increases the maximum
number of units and FAR allowed for affordable housing built near a transit stop.
For each tier, an increase in density is applied, starting with 50% increase of
3 http://historicplacesla.org/ 4 http://zimas.lacity.org/ 5 https://www.policymap.com/maps 6 https://www.envirostor.dtsc.ca.gov/public/

13
density for sites in Tier 1 and increasing by 10% for each following tier, with a
maximum of 80% increase in Tier 4. Similarly, the increase in FAR goes by 5%
points, starting with 40% at Tier 1, and allowing a maximum increase of 55% at
Tier 4. It is important to note that the incentives are attained only by dedicating a
minimum percentage of affordable units for a project. The TOC Guideline
identifies Extremely Low-Income, Very Low Income and Low Income as the
categories for affordability restrictions to access Base Incentives. Each tier has a
requirement for a minimum number of affordable units. The TOC Program has
four tiers, ranked low to high based on distance to transit. The TOC tiers for
each site can accessed on ZIMAS.
▪ Rent Stabilization Ordinance: Sites that are under RSO, which sets limits on rent
amounts. This information is available on ZIMAS
▪ AB 1482 (Tenant Protection Act): Statewide rent cap and eviction legislation.
This information is available on ZIMAS
▪ Schools and Parks: Sites that are within a 500 Ft Radius of a school and/or park.
This is available on ZIMAS.
▪ Opportunity Category: This indicator is based on the California Fair Housing
Task Force Opportunity Maps7, which measures census tracts in the state to
identify areas that support positive educational, health and economic outcomes.
Education outcomes are measured by high school graduation rates, math and
reading proficiency, and student poverty rate. Health outcomes include
indicators on multiple sources of pollution, as well as the quality of drinking
water. Economic outcomes are measured by job proximity, employment rate,
adult education, and income levels being above 200% of poverty line. The
Opportunity Category also identifies areas that are racially segregated and have
concentrated poverty. The indicator has a range from Highest Resource to Low
7 https://www.treasurer.ca.gov/ctcac/opportunity.asp
14
Resource.
▪ Grocery Store Accessibility: The USDA’s Food Access Research Atlas8 identifies
census tracts where people cannot easily access the nearest supermarket. I
used their indicator to identify sites where 33% of population lives more than 1
mile of the closest supermarket. Further, I used PolicyMap’s Limited
Supermarket Accessibility tool to identify parcels that are in low access areas.
Once each property was filtered through these indicators, I removed sites that were
historic, contained environmental hazards, as well as those that were unusable—parcels that
were part of a highway, sports fields, schools, ecological reserve. The Assessor Portal9 provides
a map view of parcels, which enabled me to identify sites that are not usable. If the portal view
was not clear, I also utilized Google Earth to get a clearer view of a particular site.
8 https://www.ers.usda.gov/data-products/food-access-research-atlas/go-to-the-atlas.aspx#.UUHjgLUyT9p 9 https://portal.assessor.lacounty.gov/

15
FINDINGS
There are 34 sites that can be used for development and the suitability or ranking will differ
depending on what is prioritized. To make it easier, I have organized these sites using two significant
factors: size and Opportunity Category.
Size as a Priority
Using a similar size qualifier as the CA Department of General Services’ Site Screening Tool (CA
Department of General Services, 2019), where a minimum of ¼ acre or greater was the required size for
analysis, I divided parcels into two: sites that are equal to or greater than ¼ (10,850 sqft) and sites that
are less than ¼ acre, but not below between 7,500 sqft.
APN Owner Address Zip
code
Size
SqFt
TOC
Tier
Opportunity
Category
Limited
Grocery
Accessibility
4128003900 LA City
Airport
5424
ARBOR
VITAE ST
90045 20,860 3 Low Resource No
6006030901 LA City 5888
CROCKER
ST
90003 20,801 1 Low Resource Partially
4125022910 LA City
Airport
5847 W
93RD ST
90045 14,951 3 Moderate
Resource (RC)
No
7414003900 LA DWP 1744 N
EUDORA
AVE
90744 13,581 - Low Resource No
4128009927 LA City
Airport
5306 W
93RD ST
90045 13,420 3 Moderate
Resource (RC)
No
4128006904 LA City
Airport
9409
GLASGOW
PL
90045 12,983 3 Moderate
Resource (RC)
No
4128004908 LA City
Airport
9308
GLASGOW
PL
90045 11,252 3 Moderate
Resource (RC)
No
4128004907 LA City
Airport
9304
GLASGOW
90045 10,850 3 Moderate
Resource (RC)
No

16
PL
Table 1: Parcels greater than 1/4 acre.
The results show that all available sites that are greater than 7,500 sqft and qualified using the filters
are almost exclusively located in the 90045 zip code.
Figure 2 - Glasgow Pl, vacant site. Source: Google Street View.

17
Figure 3 - Sites greater than 1/4 acre. Source: Google Earth.

18
Table 2: Sites greater than 7,500 sqft, but less than ¼ acres.
APN Owner Address Zip
code
Size TOC
Tier
Opportunity
Category
Limited
Grocery
Accessibility
41280179
06
LA City
Airport
9808
GLASGOW
PL
9004
5
7,500 3 Moderate
Resource
(RC)
No
41280179
05
LA City
Airport
9800
GLASGOW
PL
9004
5
7,501 3 Moderate
Resource
(RC)
No
41280179
11
LA City
Airport
9836
GLASGOW
PL
9004
5
7,509 3 Moderate
Resource
(RC)
No
41280179
21
LA City
Airport
9840
GLASGOW
PL
9004
5
7,510 3 Moderate
Resource
(RC)
No
41280179
10
LA City
Airport
9850
GLASGOW
PL
9004
5
7,558 3 Moderate
Resource
(RC)
No
41250229
14
LA City
Airport
5839 W 93RD
ST
9004
5
7,680 3 Low
Resource
No
41280169
27
LA City
Airport
5211 W 97TH
ST
9004
5
7,719 3 Low
Resource
No
41280229
07
LA City
Airport
5432 W 99TH
PL
9004
5
7,815 4 Low
Resource
No
41280109
08
LA City
Airport
9305 ISIS
AVE
9004
5
7,838 3 Low
Resource
No
41280239
10
LA City 5422 W 99TH
PL
9004
5
7,860 3 Moderate
Resource
(RC)
No
41280099
15
LA City
Airport
9302 ISIS
AVE
9004
5
7,949 3 Low
Resource
No
41280039
15
LA City
Airport
5433 W 99TH
PL
9004
5
7,985 3 Moderate
Resource
(RC)
No

19
41280229
09
LA City
Airport
5466 W 99TH
PL
9004
5
8,031 4 Low
Resource
No
41280229
10
LA City
Airport
5460 W 99TH
PL
9004
5
8,070 4 Low
Resource
No
41280129
08
LA City
Airport
5446 W 96TH
ST
9004
5
8,165 3 Low
Resource
No
41280179
03
LA City
Airport
9742
GLASGOW
PL
9004
5
8,239 3 Moderate
Resource
(RC)
No
41280229
08
LA City
Airport
5452 W 99TH
PL
9004
5
8,317 4 Low
Resource
No
41280199
07
LA City 5301 W 99TH
PL
9004
5
8,326 3 Low
Resource
No
41280109
21
LA City
Airport
9302
AVIATION
BLVD
9004
5
8361 3 Moderate
Resource
(RC)
No
41280229
02
LA City
Airport
5524 98TH
ST
9004
5
8,561 4 Low
Resource
No
41280189
12
LA City
Airport
9847
GLASGOW
PL
9004
5
8,650 3 Moderate
Resource
(RC)
No
41280169
05
LA City
Airport
5216 W 97TH
ST
9004
5
9,085 3 Low
Resource
No
41280099
27
LA City
Airport
5306 W 93RD
ST
9004
5
9,624 3 Moderate
Resource
(RC)
No
41250239
19
LA City
Airport
9624
BELFORD
AVE
9004
5
9,745 3 High
Resource
No
41250239
06
LA City
Airport
9625
BELFORD
AVE
9004
5
10,754 3 High
Resource
No

20
Figure 4 - All sites greater than 7,500 sqft, but less than 1/4 acres. Source: Google Earth.
Opportunity Category as a Priority
Sites that are identified as High Resource indicate areas that provide the best educational,
economic, and environmental opportunities. There are eight parcels in areas that are considered High
Resource:
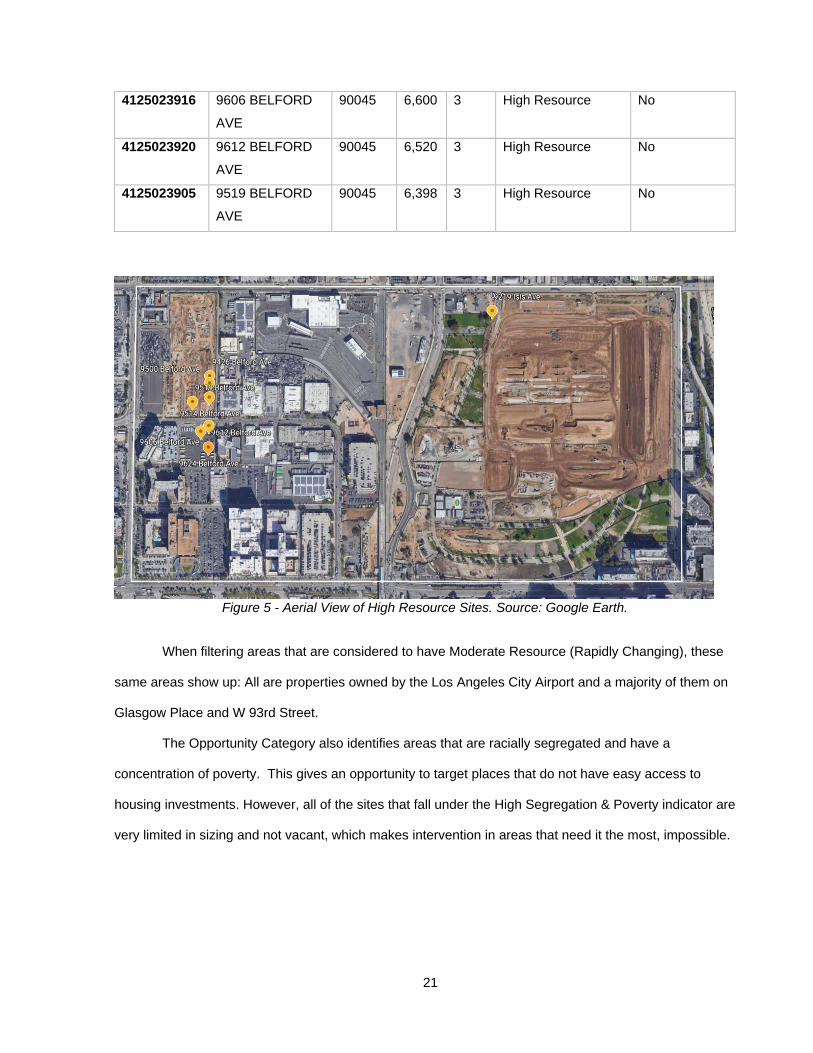
Table 3 - High Resource Parcels
APN Address Zip
code
Size TOC
Tier
Opportunity
Category
Limited
Grocery
Accessibility
4125023919 9624 BELFORD
AVE
90045 9,745 3 High Resource No
4125023908 9500 BELFORD
AVE
90045 7,440 3 High Resource No
4125023915 9426 BELFORD
AVE
90045 7,440 3 High Resource No
4125023917 9514 BELFORD
AVE
90045 7,440 3 High Resource No
4128002908 9219 ISIS AVE 90045 6,985 3 High Resource No
21
4125023916 9606 BELFORD
AVE
90045 6,600 3 High Resource No
4125023920 9612 BELFORD
AVE
90045 6,520 3 High Resource No
4125023905 9519 BELFORD
AVE
90045 6,398 3 High Resource No
Figure 5 - Aerial View of High Resource Sites. Source: Google Earth.
When filtering areas that are considered to have Moderate Resource (Rapidly Changing), these
same areas show up: All are properties owned by the Los Angeles City Airport and a majority of them on
Glasgow Place and W 93rd Street.
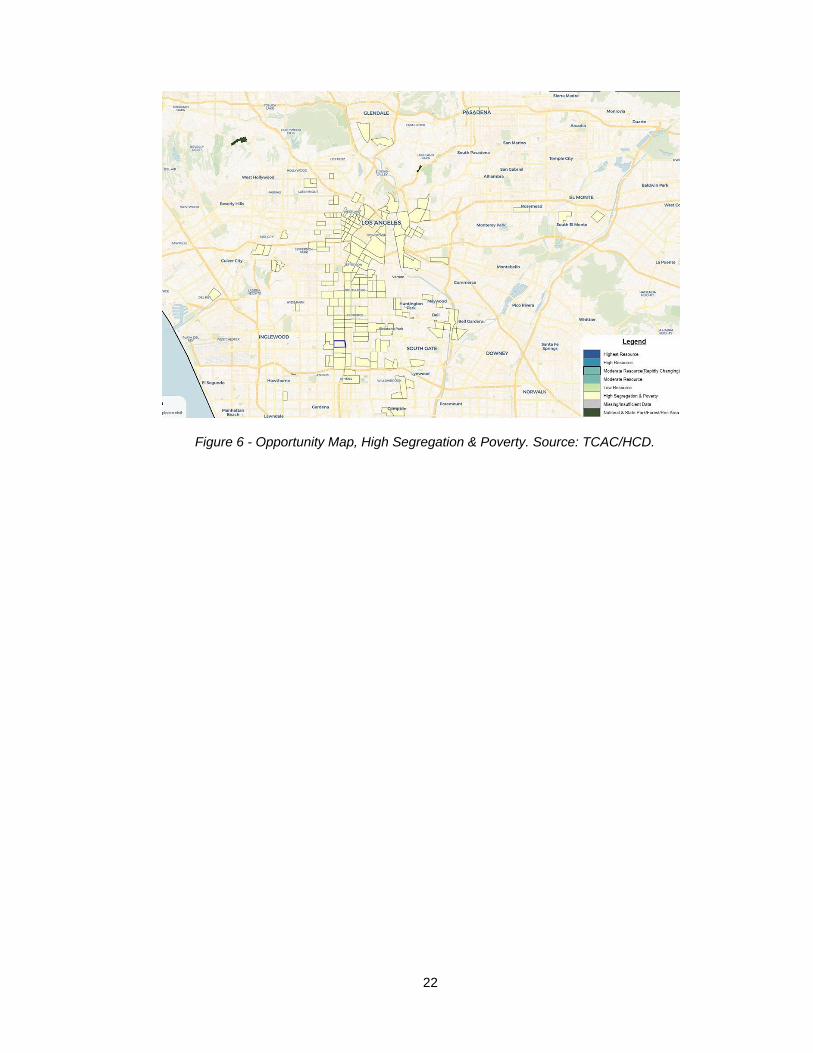
The Opportunity Category also identifies areas that are racially segregated and have a
concentration of poverty. This gives an opportunity to target places that do not have easy access to
housing investments. However, all of the sites that fall under the High Segregation & Poverty indicator are
very limited in sizing and not vacant, which makes intervention in areas that need it the most, impossible.
22
Figure 6 - Opportunity Map, High Segregation & Poverty. Source: TCAC/HCD.

23
DISCUSSION
While there are vacant sites in the City of LA, the findings indicate that the options become
limited when considering their suitability for housing development, and the ones that are available are
concentrated in a specific zip code. Further, some sites that were designated as “vacant” on the
Controller’s sheet were not suitable on close inspection, as they would be train tracks, tower lots,
channels, highways, bike lanes, planting strips or would contain partial structures. This indicates that
there is a need to refine the Controller’s property list, as “vacant” does not necessarily mean tenable for
housing development. This is especially important to note, in light of the preliminary injunction that was
ordered on April 20th10, mandating that the City of LA provide housing for any homeless person in Skid
Row. The order cites “14,000 properties” as being vacant.
10 Oreskes, Benjamin. “Judge Orders L.A. City and County to Offer Shelter to Everyone on Skid Row by Fall.” Los
Angeles Times, April 20, 2021.
https://www.latimes.com/homeless-housing/story/2021-04-20/judge-carter-la-city-county-shelter-skid-row-
homeless-fall
Figure 7 - Example of unsuitable site. Dominguez Channel designated as “Vacant.” Source: Los Angeles County Assessor Map.

24
While this project did not include properties designated for single family homes, it might be worth
for HCIDLA to consider that, in order to expand options, as there are 1,404 single family sites that are
designated “vacant” for single family use. Another option might to remove the size restriction considered
for this project, i.e., looking into properties that are less than 7,500 sqft.
Considering these challenges, HCIDLA might need to consider parking lots to expand options for
housing development. There are a total of 364 parking lots on public land in Los Angeles (330
commercial use lots and 34 industrial use lots), equaling 11,968,696 sqft, dispersed throughout multiple
zip codes. A majority of these lots (48%) are designated as owned by the City of LA, with the remaining
split between the LAUSD (21%), Metro (19.7%), County of LA (5.8%), State of CA (3.3%), and the federal
government (2.1%). There are examples of public-private partnerships in other cities, where agencies are
transferring their parking sites for housing development—Fairfax County in VA transferred a portion of its
surface parking lots to the local housing authority to develop low- and middle-income affordable housing
(Fairfax County, 2021). In January 2020, the Boston Planning & Development Agency approved two
projects, the first converting a surface parking lot for fully income restricted residential development
(Boston Planning & Development Agency, 2020) and the second eliminating all parking spaces from a
mixed-use development, which is also subject to inclusionary development policy to restrict a percent of
the new project for low-income residents (Boston Planning & Development Agency, 2020). Cities in
California are also moving towards utilizing parking lots for housing. The City of Mountain View issued a
RFP to develop housing on a city-owned surface parking lot, with 50 percent of the units to be rest-
restricted (City of Mountain View, 2019). Similarly, the Eureka City Council approved three affordable
housing projects on parking lots owned by the city, creating 107 affordable units (Butler, 2020).

25
REFERENCES
A.B. 1255. (2019). Retrieved from
https://leginfo.legislature.ca.gov/faces/billNavClient.xhtml?bill_id=201920200AB1255
A.B. 1486. (2019). Retrieved from
https://leginfo.legislature.ca.gov/faces/billNavClient.xhtml?bill_id=201920200AB1486
A.B. 2135. (2014).
Airgood-Obrycki, W., & Molinsky, J. (2019). Estimating the Gap in Affordable and Available Rental Units
for Families. Cambridge: Joint Center for Housing Studies.
Arabo, F., & Leonard, M. (2018, March 23). Affordable Housing Wins Big in Washington State's 2018
Legislative Session. Retrieved from Enterprise Community Partners:
https://www.enterprisecommunity.org/blog/affordable-housing-wins-big-washington-states-2018-
legislative-session
Arlington County. (2014). Public Land for Public Good. Arlington: Arlington County Manager.
Been, V. (2018). City NIMBYs. Journal of Land Use & Environmental Law, Vol. 33, No. 2, 217-432.
Boston Planning & Development Agency. (2020, January 16). Retrieved from bostonplans:
http://www.bostonplans.org/projects/development-projects/northampton-street-residences
Boston Planning & Development Agency. (2020, January 16). Boston Plans. Retrieved from
http://www.bostonplans.org/projects/development-projects/1252-1270-boylston-street
Butler, A. (2020, October 21). Times Standard. Retrieved from https://www.times-
standard.com/2020/10/21/eureka-council-oks-affordable-housing-projects-on-3-parking-lots/
CA Deparment of General Services. (2019). Excess Site Screening Tools.
CA Department of General Services. (2018). EO N-06-19 FAQ.
CA Government Code § 54221. (n.d.).
CA Government Code § 65300. (n.d.).
California Housing Partnership. (2020). Affordable Housing Needs Report. San Francisco: California
Housing Partnership. Retrieved from https://chpc.net/resources/2020-statewide-housing-needs-
report/
Chakrabarti, R., & Zhang, J. (2010). Unaffordable Housing and Local Employment Growth. Boston: New

26
England Public Policy Center. Retrieved from https://www.bostonfed.org/publications/new-
england-public-policy-center-working-paper/2010/unaffordable-housing-and-local-employment-
growth.aspx
City of Mountain View. (2019, December 16). City of Mountain View. Retrieved from
https://www.mountainview.gov/depts/comdev/housing/active_projects/lot12/lot_12_rfp.asp
Cohen, R., & Wardrip, K. (2011). The Economic and Fiscal Benefits of Affordable Housing. Planning
Commissioners Journal, 1-3. Retrieved from http://plannersweb.com/wp-
content/uploads/2012/07/501.pdf
Department of City Planning. (2017). Transit Oriented Communities Affordable Housing Incentive
Program Guidelines (TOC Guidelines). Los Angeles: Department of City Planning. Retrieved
from https://planning.lacity.org/ordinances/docs/toc/TOCGuidelines.pdf
DeRuy, E. (2020, March 21). The Mercury News. Retrieved from The Mercury News:
https://www.mercurynews.com/2020/03/12/court-ruling-means-san-jose-other-cities-must-
prioritize-affordable-housing-on-surplus-land/
Diamond, R., & McQuade, T. (2019). Who Wants Affordable Housing in Their Backyard? An Equilibrium
Analysis of Low-Income Property Development. Journal of Political Economy, 1063-1117.
Retrieved from https://www.journals.uchicago.edu/doi/abs/10.1086/701354?af=R&mobileUi=0&
Enterprise Community Partners. (2014). Impact of Affordable Housing on Families and Communities: A
Review of the Evidence Base. Columbia: Enterprise Community Partners. Retrieved from
https://www.enterprisecommunity.org/download?fid=3335&nid=4547
Enterprise Community Partners. (2020). Home & Hope Mapping Tool. Retrieved from
https://www.enterprisecommunity.org/where-we-work/pacific-northwest/home-and-hope-
mapping-tool
Exec. Order No. N-06-19. (2019). Retrieved from https://www.gov.ca.gov/wp-
content/uploads/2019/01/EO-N-06-19.pdf
Fairfax County. (2021, February 4). Retrieved from
https://www.fairfaxcounty.gov/housing/news/2021/board-designates-government-center-parking-
lots-for-affordable-housing
27
Family Housing Fund. (2018). Prioritizing Public Lands for Affordable Housing and Other Public Benefits.
Minneapolis: Family Housing Fund. Retrieved from https://www.fhfund.org/wp-
content/uploads/2018/09/FHF_PublicLands_ModelPolicies.pdf
Freddie Mac. (2017). What is Causing the Lean Inventory of Houses? McLean: Freddie Mac. Retrieved
from http://www.freddiemac.com/fmac-resources/research/pdf/201707-Outlook-04.pdf
Fulton, W., & Shigley, P. (2018). Guide to California Planning. Point Arena: Solano Press Books.
Greene, S., & Gould Ellen, I. (2020). Breaking Barriers, Boosting Supply. Washington DC: Urban
Institute. Retrieved from https://www.urban.org/sites/default/files/publication/102963/breaking-
barriers-boosting-supply_0.pdf
Hickey, R., & Sturtevant, L. (2015). Public Land & Affordable Housing in the Washington DC Region: Best
Practices and Recommendations. Washington DC: Urban Land Institute Washington. Retrieved
from https://lsaplanning.com/wp-
content/uploads/2018/12/PublicLandAndAffordableHousing_WashingtonDCRegion.pdf
Joint Center for Housing Studies. (2020). The State of the Nation's Housing. Cambridge: Joint Center for
Housing Studies. Retrieved from
https://www.jchs.harvard.edu/sites/default/files/reports/files/Harvard_JCHS_The_State_of_the_N
ations_Housing_2020_Report_Revised_120720.pdf
Lin, D., & Wachter, S. (2019). The Effect of Land Use Regulation on Housing Prices: Theory and
Evidence from California. Philadelphia: The Wharton School, University of Pennsylvania.
Retrieved from http://realestate.wharton.upenn.edu/working-papers/the-effect-of-land-use-
regulation-on-housing-prices-theory-and-evidence-from-california/
Maqbool, N., Viveiros, J., & Ault, M. (2015). The Impacts of Affordable Housing on Health: A Research
Summary. Washington DC: Center for Housing Policy. Retrieved from https://nhc.org/wp-
content/uploads/2017/03/The-Impacts-of-Affordable-Housing-on-Health-A-Research-
Summary.pdf
Mawhorter, S., & Reid, C. (2018). Local Housing Policies Across California. Berkeley: Terner Center for
Housing Innovation. Retrieved from
https://californialanduse.org/download/Terner_California_Residential_Land_Use_Survey_Report.
28
Mawhorter, Sarah; Garcia, David; Raetz, Haley. (2018). It All Adds Up: The Cost of Housing
Development Fees in Seven California Cities. Berkeley: Terner Center for Housing Innovation.
Retrieved from https://ternercenter.berkeley.edu/site/it-all-adds-up-the-cost-of-housing-
development-fees-in-seven-california-cit
Mawhorter, Sarah; Garcia, David; Raetz, Hayley. (2018). It All Adds Up: The Cost of Affordable Housing
Development Fees in Seven California Cities. Berkeley: Terner Center for Housing Innovation.
Retrieved from https://ternercenter.berkeley.edu/site/it-all-adds-up-the-cost-of-housing-
development-fees-in-seven-california-cit
Monkkonen, P., Lens, M., & Manville, M. (2020). Built-Out Cities? How California Cities Restrict Housing
Production Through Prohibition and Process. Berkeley: Terner Center for Housing Innovation.
Retrieved from http://californialanduse.org/download/MLM%20Built-Out%20Cities%202020.pdf
Office of Assemblymember Phil Ting. (2019). AB 1486 Fact Sheet. Sacramento: Office of
Assemblymember Phil Ting. Retrieved from http://www.greatcommunities.org/wp-
content/uploads/ab-1486-legislative-fact-sheet.pdf
Office of Assemblymember Phil Ting. (2019). AB 1486 Fact Sheet. AB 1486 Fact Sheet.
Payton Scally, C., & Tighe, J. (2015). Democracy in Action?: NIMBY as Impediment to Equitable
Affordable Housing Siting. Housing Studies, Vol. 30, No. 5, 749-769. Retrieved from
https://papers.ssrn.com/sol3/papers.cfm?abstract_id=2580363
Quigley, J. M., & Raphael, S. (2005). Regulation and the High Cost of Housing in California. The
American Economic Review, 323-328. Retrieved from http://www.jstor.org/stable/4132841
Robert Wood Johnson Foundation. (2011). Exploring the Social Determinants of Health. Princeton:
Robert Wood Johnson Foundation.
Schively, C. (2007). Understanding the NIMBY and LULU Phenomena: Reassessing Our Knowledge
Base and Informing Future Research. Journal of Planning Literature, Vol. 21, No. 3, 255-266.
Retrieved from https://journals.sagepub.com/doi/10.1177/0885412206295845
Spotts, M. A., Hale-Case, G., & Abu-Khalaf, A. (2017). Public Benefit from Publicly Owned Parcels:
Effective Practices in Affordable Housing Development. Columbia: Enterprise Communty

29
Partners. Retrieved from https://www.enterprisecommunity.org/download?fid=3257&nid=3739
Taylor, M. (2015). California's High Housing Costs: Causes and Consequences. Sacramento: The
Legislative Analyst's Office (LAO). Retrieved from
https://lao.ca.gov/reports/2015/finance/housing-costs/housing-costs.pdf
Terner Center for Housing Innovation. (2020). Terner Center Research Series: The Cost of Building
Housing. Retrieved from Terner Center for Housing Innovation:
https://ternercenter.berkeley.edu/construction-costs-series
U.S. Census Bureau. (2019). American Community Survey 1-year Estimate. U.S. Census Bureau.
Retrieved from https://data.census.gov/cedsci/table?text=cost-
burdened&t=Financial%20Characteristics%3AHousing%20Value%20and%20Purchase%20Price
%3ARenter%20Costs&g=0100000US&tid=ACSCP1Y2019.CP04&hidePreview=true
U.S. Department of Housing and Urban Development. (2017). Rent Burden in the Housing Choice
Voucher Program. Washington DC: U.S. Department of Housing and Urban Development.
U.S. Department of Housing and Urban Development. (2020). The 2019 Annual Homeless Assessment
Report (AHAR) to Congress. Washington DC: U.S. Department of Housing and Urban
Development. Retrieved from https://www.huduser.gov/portal/sites/default/files/pdf/2019-AHAR-
Part-1.pdf