developing for android -...
TRANSCRIPT

Developing for Android
Development of an alarm system for the Samsung Galaxy
S4 Mini and the Samsung Gear S for Adobe SiteCatalyst
Seminar Thesis
Course of study: Information Systems
Vienna University of Economics and Business
by
Tanja Simon
Submission date: March 6, 2015
Matriculation number, course: h0851540, 0208 Project Seminar of Information Systems
Supervisor: ao.Univ.Prof. Dr. Rony G. FLATSCHER

Declaration
I do solemnly declare that I have written the presented research thesis
Developing for Android - Development of an alarm system for the Samsung
Galaxy S4 Mini and the Samsung Gear S for Adobe SiteCatalyst
by myself without undue help from a second person others and without using such tools
other than that speci�ed. Where I have used thoughts from external sources, directly or
indirectly, published or unpublished, this is always clearly attributed. Furthermore, I certify
that this research thesis or any part of it has not been previously submitted for a degree or
any other quali�cation at the Vienna University of Economics and Business or any other
institution in Austria or abroad.
Vienna, the March 6, 2015
Tanja Simon
I

Abstract
This paper investigates the creation of a monitoring application for a Samsung Gear S
wristwatch and a Samsung Galaxy S4 Mini mobile device. The emphasis is to show how
both devices can be used together to inform the user about errors in Adobe Analytics to
be able to intervene in a timely manner when dealing with critical values. Therefore, the
external reporting application programming interface is used to get direct access to the
stored Adobe Analytics data. With a REST client, the data is analysed on the Samsung
Galaxy mobile phone and is then sent to the Samsung Gear S to inform the user.
II

Contents
Declaration I
List of Abbreviations IV
List of Figures V
1. Introduction 1
1.1. User Behaviour Analysis with Adobe Analytics . . . . . . . . . . . . . . . 21.2. Adobe Anomaly Detection Reports . . . . . . . . . . . . . . . . . . . . . 6
2. Creating a Gear Application 11
2.1. Development Equipment from Samsung . . . . . . . . . . . . . . . . . . 112.2. Di�erent Types of Gear Applications . . . . . . . . . . . . . . . . . . . . 12
3. Developing an Android Host and a Tizen Client Application 15
3.1. Proof of Concept . . . . . . . . . . . . . . . . . . . . . . . . . . . . . . 153.2. Developing an Alarm System for Adobe SiteCatalyst . . . . . . . . . . . . 21
4. Conclusion and Further Research 33
Bibliography 34
A. Appendix I
A.1. Tizen SDK for Wearables Installation . . . . . . . . . . . . . . . . . . . . IA.2. Eclipse and Android Development Tools Installation . . . . . . . . . . . . VA.3. Generate Android Menu and Layout in Eclipse . . . . . . . . . . . . . . . VIA.4. Make a Request using the REST Protocol in Eclipse . . . . . . . . . . . . IX
III

List of Abbreviations
API Application Programming Interface
CSS Cascading Style Sheets
HTML Hypertext Markup Language
IDE Integrated Development Environment
JSON JavaScript Object Notation
OS Operating System
REST Representational State Transfer
SDB Smart Development Device
SDK Software Development Kit
SOAP Simple Object Access Protocol
TV Television
URL Uniform Ressource Locator
USB Universal Serial Bus
WSDL Web Service Description Language
WU Vienna University of Economics and Business
XML Extensible Markup Language
IV

List of Figures
1.1. Parts of Adobe Marketing Cloud (Systems 2015a). . . . . . . . . . . . . . 31.2. Process of data collection from a website to the Adobe servers (Systems
2015a). . . . . . . . . . . . . . . . . . . . . . . . . . . . . . . . . . . . . 41.3. Sample report from Adobe Analytics that shows the number of called URLs
for February (Systems 2015b). . . . . . . . . . . . . . . . . . . . . . . . 51.4. An Anomaly Detection Report from Adobe Analytics that shows if a time
series contains values that are out of the norm (Systems 2015b). . . . . . 71.5. Sample alert report that is sent as an email to the responsible person, the
number of page calls are below 11,745 (Systems 2015a). . . . . . . . . . 9
2.1. The Samsung Galaxy S4 Mini mobile phone (Samsung 2015a). . . . . . . 122.2. The Samsung Gear S wristwatch (Samsung 2015b). . . . . . . . . . . . . 12
3.1. Virtual device settings for an emulator that substitues a Samsung Gear S. 163.2. Output of a simple Tizen Gear application that displays 'Hello developers'. 173.3. Output of a simple Eclipse application that displays 'Hello developers'. . . 183.4. SDK Manager from Eclipse to install other or additional API levels. . . . . 203.5. Process diagram shows the sequence of the individual steps to generate an
alarm system. . . . . . . . . . . . . . . . . . . . . . . . . . . . . . . . . 223.6. The diagram shows two di�erent types to generate a Gear application. The
main di erence is that if no user interface is needed on the wristwatch, then
no Tizen consumer widget needs to be created. . . . . . . . . . . . . . . 233.7. A simple user interface created with the online tool moqups without writing
any code. . . . . . . . . . . . . . . . . . . . . . . . . . . . . . . . . . . 243.8. The picture demonstrates the use of the RichNoti�cation SDK provided
by Samsung in combination with alerts. The image on the left shows the
Android application on the mobile phone that contains the logic for the no-
ti�cations. The other two pictures demonstrate how the messages displayed
on a Samsung Gear (Systems 2015a). . . . . . . . . . . . . . . . . . . . . 253.9. The left picture shows the prede ned user interface for the start page and
the right picture the user interface for the start page put into practice. . . 283.10. The content from variables can be displayed in a console application. The
picture shows the structure of the response from the Adobe Reporting API 29
V

3.11. The picture on the left side shows a design for the page that should display
the values from the Adobe Anomaly Detection reports. Whereas the picture
on the right side shows the user interface for the display of the Adobe
Anomaly Detection reports put into practise with the HelloCharts library. . 30
A.1. The function 'Enable hardware-assistent virtualization' in the Avast settings. IIA.2. Tizen SDK Installation. The 'Advanced' button must be activated. . . . . IIIA.3. The location to the folder of the image must be entered. . . . . . . . . . IIIA.4. Tizen License Agreement acception. . . . . . . . . . . . . . . . . . . . . IVA.5. Install type is Web App Development. . . . . . . . . . . . . . . . . . . . IVA.6. Path to storage location must be speci�ed. . . . . . . . . . . . . . . . . . V
VI

1. Introduction
Adobe Analytics is an online tool that combines various digital marketing solutionsand supports the marketer in understanding user interaction with a website or anapplication. Marketing defines a process until a product or service is received by theconsumer. The different ways to inform or convince the user are summarized by theterm “channel” which groups similar advertising methods and processes. Examplesare TV or radio advertisements. The main goal of Marketing is to satisfy the needsof the customer. According to an article from Douglas Idugboe, Digital Marketingis an important tool for businesses, because it combines electronic technology withpsychology in the marketplace. With its help it is possible to interact with the cus-tomer on a new digital channel in addition to traditional channels like print. Themain advantage from digital marketing is the real time feedback from the user that isused to interact and communicate quicker and it helps to create a better experiencefor the user (Idugboe 2014). It becomes more important to differentiate the productfrom those of the competitors by combining the traditional and the digital market-ing channels. Kates discusses in his article how to achieve a working combinationof these two parts. Digital experience can be created by using traditional marketingthat enables the marketer to reach a larger clientele to establish a deep relationshipwith the user via digital marketing. One of the examples shown in the article is a TVadvertisement broadcast during the Super Bowl that is used to motivate the watcherto like their Facebook page. This deeper interaction with the user is known as activeengagement and it leads to a greater outcome of an advertisement with the help of adigital channel. Personalized Experience describes the way of how information is tai-lored based on specific characteristics. In the area of marketing, content is changedbased on the user information entered into a registration form. Or the user gets aspecific landing page on the website based on his interests or search results. Ad-ditional information from social media websites, like Facebook, makes it easier formarketers to target users based on their given data. Therefore, digital marketing is animportant tool to - in combination with traditional channels - generate a reasonableway to gain bigger results in marketing (Kates 2013). The collected behavior datacan be collected and analysed by a Web Analytics Software. It is a browser basedprogram to create statistics to get deeper insights of the usage of websites. Kausikdescribes in a book that Web Analytics is the “objective tracking, collection, measure-ment, reporting, and analysis of quantitative Internet data to optimize websites andweb marketing initiatives” (Kaushik 2007).
1

Developing for Android
1.1. User Behaviour Analysis with Adobe Analytics
To better understand the behavior of the user on the websites, web-based softwarelike Adobe Analytics is available for larger companies. A cheaper option for smallerfirms, sole traders or private individuals is Google Analytics. The standard versionis for free, but if the hits increase to 1 billion hits per month, a premium account witha tailored fee must be paid. The disadvantage about Google Analytics is the fact thata user consents to the usage of the collected data by Google by accepting the GoogleAnalytics terms of service.
“Google and its wholly owned subsidiaries may retain and use, subject to theterms of its privacy policy (located at www.google.com/privacy.html), informationcollected in Your use of the Service.“ (Google 2014)
Although special consent of the customer is needed so that Google is allowedto share the information with other companies, the data is used and analysed byGoogle itself. This enables Google to collect more and more data about the peopleand its habits and therefore to eliminate the customers’ privacy. This work usesAdobe Analytics, which according to a review by G2 Crowd, is a leader in the areaof Web Analytics software in 2015. A tool is placed in this category if the users of G2Crowd have rated the product highly enough. A thusly nominated leader also hasa substantial scale, market share and global support and service resources. AdobeAnalytics provides a well-established external access to the stored data with a highauthentication standard (Crowd 2015).
Adobe Systems was founded in 1982 by John Warnock and Chuck Geschkeand started with two employees. It focused on the creation and interaction withDigital Media. Omniture was founded in 1996 by Josh James and John Pestana,has an emphasis on Web Analytics and was taken over by Adobe Systems in 2009.This allowed Adobe to expand Digital Media by Digital Marketing. Such extensionadds additional features like experience management, social capabilities and contentcombination. In 2012 the Adobe Marketing Cloud has started to arrange the varioustopics and to provide a platform for hosting data. Summarily, it is a collection ofvarious tools which include Adobe Analytics and other areas.
2 Tanja Simon

Developing for Android
Figure 1.1.: Parts of Adobe Marketing Cloud (Systems 2015a).
Figure 1.1 shows a list of the provided tools of the Adobe Marketing Cloud. Theadvantages are that the marketer can easily combine data between the tools. For ex-ample, email campaigns are connected with Facebook campaigns to allow for bettercoordination. A campaign is a set of advertisement messages that relate to an issueand are communicated to the customer. Adobe Analytics is used for the analysis ofuser behaviour on the pages of the website. It helps in identifying high-performancechannels and gives a general review of the homepage. This package includes SiteCat-alyst that is the main tool to show and analyse reports. Every other Adobe Market-ing product can be connected with SiteCatalyst. Another tool is Adobe Campaign.It supports traditional channels like email with an automation and execution pro-cess. Messages or weekly newsletters are sent to the customers without any manualinteraction . Adobe Experience Manager simplifies the creation of a uniform userexperience across different media like mobile and desktop. Therefore, a user is pre-sented with a consistent layout whether they see the website on the mobile phoneor the computer. Adobe’s Media Optimizer concentrates on the construction of themedia mix. It supports the marketer in dealing with various videos, advertisementson Facebook, search keywords and feeds. With Adobe Social it is possible to controlthe publishing process of social media. If enough data is collected, the tool is able tocreate a prediction if a campaign will be successful or not. The last tool in the AdobeMarketing Cloud is Adobe Target, which can change personal settings in real-time.It also includes A/B testing that is used to compare elements with each other. Forexample, a marketer would like to know if the customers prefer a green backgroundor a red one. Through an A/B test, a group is split up into two parts based on pre-defined percentages. Each user group gets a different background colour. Via thereaction of the users one can then draw conclusions about which colour they aremore satisfied with (Systems 2015a). The analysis of the behaviour of the users as-
3 Tanja Simon

Developing for Android
sumes a huge collection of data. This is achieved by embedding a specific AnalyticsJavaScript code into the website for each page that sends the data to the Data Centerfrom Adobe.
Figure 1.2.: Process of data collection from a website to the Adobe servers (Systems2015a).
The figure 1.2 shows how the data collection process works. First, the user opensa page from the website that contains the Analytics JavaScript code. In the back-ground, a request is sent to the servers where the website is located, whereupon theywill return the corresponding page with the HTML and Analytics JavaScript code.Then an image request - a 1x1 pixel image that is not visible -transmits data from thatpage to the servers from Adobe. This request contains a query string that is a part ofthe URL (uniform resource locator) which contains parameters that are analysed bythe system. So the Adobe JavaScript code collects the needed information from thepage and sends the data to the Adobe servers inside the query string. A parameteris characterised as follows: field1=value1&field2=value2 (Wikipedia 2015c). Thefield is the name of the parameter and the value contains the information that shouldbe saved in it. The capacity and size of the sent data in an image request dependson the rules that are inside the Adobe code. For example the page name and thetimestamp of the request are commonly included. In the sent query string the pagename is called ‘pagename’, the variable is ‘s.pageName’ and it contains the nameof page that the user visits. This process goes through every time a page with anactivated Adobe JavaScript code is called (Systems 2012).
The existing data in the Adobe Data Center can be analysed in the graphical
4 Tanja Simon

Developing for Android
user interface Adobe Analytics. Therefore, data must be categorized in report suitese.g. to enable a separate reporting for a website. It is also possible to combinevarious websites in one suite if they belong together. This is done to be able to viewdata only for one specific website or group. It is also possible to compare reportsuites among each other. In Adobe Analytics the data is displayed in the form ofreports.
Figure 1.3.: Sample report from Adobe Analytics that shows the number of calledURLs for February (Systems 2015b).
The image 1.3 shows an example report from Adobe Analytics. Under numberone, the user can choose between different report suites. If the suites are set tospecific websites, then the dropdown field will show their names. To its right,the time period for the report can be adjusted. Below, the number three and fourmark the configurations of the representation of the report. The report type defineswhether the data should be displayed per date (trended) or aggregated for thewhole time period (ranked). “Metrics are quantitative information about visitoractivity, such as Views, Click-Troughs, Reloads, Average Time spent, Units, Orders,and Revenue.” (Systems 2015b). The given report shows instances as a metric. It
5 Tanja Simon

Developing for Android
is used to display how often a variable is set. On account of the fact that the reportshows URLs, the given metric sums up how often an URL was invoked for the giventime period. The values are displayed as column in the report and are marked withthe number six. The next important setting in the header is the data filter. By usingit a user can quickly find a specific entered term. It has some advanced features toexclude or include search words as well. In the red rectangle of number four the firstsetting is to choose another report suite. The report below will then show the figuresnext to each other, enabling the marketer to easily compare figures. A segment is afilter that creates a subset of the shown data of the report at hand. For example auser would like to see only the URLs from a user who speaks English. To achievethis output, a filter for the language English must be implemented in the segment.Afterwards, the segment can be selected in the URLs report. The other settings ofthe report enables the marketer to choose whether the percentages shown should bedisplayed as a graphic or not and if realtime or current data is needed. The URLs,upon which the instances are grouped, are shown in the field number 5. Each linkappears only once and the Instances are summed up per entry.
Various circumstances lead to a wrong data collection. This can be caused byerrors in the code integration process from an internal or external frontend devel-opment team, a wrong campaign or redirected traffic from the marketing and theimplementation of new technologies like Tag Management tools, which help tointegrate JavaScript code to read information from the website without writing asingle line of code. Therefore, it is advisable to monitor the amount of incomingtraffic and events on the website.
1.2. Adobe Anomaly Detection Reports
As there is always the possibility that errors occur in the data collection process, itis important that a system is monitored. At the time of this work’s creation, Adobeprovides standard reports to monitor a trend over a longer time period, realtimereports to check the current incoming traffic, and Anomaly Detection reports. Thelatter report additionally has the ability to use statistical methods to check if the givenvalue has changed or not based on previous data.
6 Tanja Simon

Developing for Android
Figure 1.4.: An Anomaly Detection Report from Adobe Analytics that shows if a timeseries contains values that are out of the norm (Systems 2015b).
Figure 1.4 shows an example Anomaly Detection report for the number of calledpages of a specific website or report suite. With this report it is possible to checkwhether a fluctuation is critical and must be checked or not. The figures are basedon results from a training period that can be 30, 60 or 90 days of length, dependingon the selection of the user. The same options are available for the reporting period.In this example, both periods are set to 30 days. Therefore the report learns fromthe last 30 days and predicts the data for the next 30 days reporting period. Forexample, the viewed period is from 19th January 2015 to 17th February 2015. So thereport’s training period is 30 days before from 20th December 2014 to 18th January2015. Each day of the reporting period is calculated by checking the sum of the page
7 Tanja Simon

Developing for Android
views per day with the training period by using these algorithms: Holt Winters Mul-tiplicative (Triple Exponential Smoothing), Additive (Triple Exponential Smoothing)and Holt’s Trend Corrected or Double Exponential Smoothing (Systems 2015c).
Prajakta S. Kalekar explains Holt-Winters Exponential Smoothing as a solutionfor seasonal forecasting problems and to help analysts to understand the trendsand seasonality changes of values. The various models are verified or validated byhistorical data and calculated error measures like MAPE (mean absolute percentageerror). For Adobe’s Anomaly Detection reports the additive, multiplicative andtrend corrected algorithms are used to determine the smallest SSE (sum of squarederrors). Afterwards, the MAPE and current Standard Error are applied to controlthe validation. For example, the page views for a specific website increase by onethousand euros in January every year. So this value can be added to the forecastsfor each January to the annual average and is described as additive method. On theother side, the page views of a specific registration page on this website increaseby 20% or a factor of 1.2 every January. This means that even if there is an annualoverall increase of page views over the years, only the absolute values changebut the percentages remain constant. Therefore the factor 1.2 is a multiplicativecharacter. Summarily, it can be said that the additive method demonstrates asteady seasonal variation and is independent of the overall level. Whereas with themultiplicative method the variability depends on the overall level (Kalekar 2004).The third algorithm of the Anomaly Detection is Holt’s Trend Corrected that is used,if the growth rate varies over time.
Time series analysis uses smoothing to better recognize trends. Exponentialsmoothing weights recent values higher than older values. For example, if a yearhas 100% then the 4-month moving average is 25% each month. By contrast, theexponential smoothing adds a higher weight to recent values because it has a higherimpact on the values. As mentioned before, two types of trends are importantfor Adobe Analytics: a long-term (Double Exponential Smoothing) and a seasonal(Triple Exponential Smoothing). For the Anomaly Detection, all algorithms arecalculated to get a forecast and the one with the minimum error is chosen. Atthe end three main values are returned: upperbound, lowerbound and forecast.Upperbound is the top limit and if the figure is above it, it is an anomaly. Thelowerbound is the lower limit and if the figure is beneath it, it is an anomaly. Theforecast is right in the middle between the upper and lower limit and prognoses thedata based on the calculations. The sample report shows that most outliers are abovethe upper bound. They are marked as a circle or square and they change the thecolour to green the farther away they are from the normal area. The disadvantageis that this report must be called manually for the values to be analysed. For acompany that has more than one website with a lot of different metrics, this is a
8 Tanja Simon

Developing for Android
time consuming task. An application that automatically checks the anomalies forthe previous day would help to reduce the working hours of the employees and todiscover errors more effectively. If an anomaly is detected, a message will be sent tothe Samsung Gear to inform the user about it. Adobe Analytics has a function called’Alerts’ that has the ability to send automatic emails if a metric has a certain value.For example, if the page views of a website are below 11,745, then an email will besent to ’[email protected]’.
Figure 1.5.: Sample alert report that is sent as an email to the responsible person, thenumber of page calls are below 11,745 (Systems 2015a).
9 Tanja Simon

Developing for Android
The picture 1.5 shows an automatic alert notification from Adobe Analytics inform of an email. On December 18th of 2014 the overall page views of a specific web-site were below 11,745. The disadvantage is that the notification is only sent by email.This requires access to a client email program like Microsoft Office Outlook. More-over, the message includes only figures or text and no diagram or charts to visualizeit. In this example, an additional chart that shows the page views of the last weekin combination with the forecast, upper and lower bounds would provide a betterunderstanding, if there is an error or not. Thus, there is a need for an application thatautomatically sends a notification if an anomaly is detected. The wearables fromSamsung like the Samsung Gear S wristwatch can assist this process by presentingand providing the necessary information in a compact form.
10 Tanja Simon

2. Creating a Gear Application
This chapter explores the different types of interaction between an application of anAndroid mobile phone and a wristwatch from Samsung. The creation of an applica-tion that communicates with both devices implies that some sort of connection mustexist between them. In the scope of this thesis, the different operating systems of theSamsung mobile phone and the Samsung wristwatch will be be examined as well.
2.1. Development Equipment from Samsung
The notification application uses the following two devices: Samsung Gear S and theSamsung Galaxy S4 Mini mobile phone. The Samsung Gear S that is shown in picture2.2 is a wristwatch that has an arched surface and it provides the basic functionalitiesof a mobile device. like the ability to receive messages and to answer calls. To beidentified in a network and to get access to the Internet, a SIM (subscriber identitymodule) is used by the mobile provider. It is possible to add this card to the watch touse its features without a consistent connection to a mobile phone. Without the card,the Samsung Gear S is connected with the mobile phone which is used for wirelessdata communications via Bluetooth 4.1 . It utilises radio frequency links as opposedto wires to allow flexibility of user (AES 2002). The watch supports Wi-Fi as welland it enables the user to make use of Internet features by connecting to a wirelessnetwork, additionally to the established Bluetooth connection. The Samsung Gear Suses the operating system Tizen. The mobile phone used in this work is the SamsungGalaxy S4 Mini which is displayed in the picture 3.9. The screen size is 10,85 cm andit has a resolution of 960x540 pixels. The batteries allow an internet usage time of 9hours, if the 3G (third generation of mobile communications technology) is used. Incontrast to 2G (second generation of mobile communications technology), 3G enablesthe user to surf the net faster, though it consumes more energy. The mobile phonemakes use of the operating system Android 4.2 and Bluetooth 4.0. It is possible toconnect the device with a computer by using an USB cable; for example to developan application.
11

Developing for Android
Figure 2.1.: The Samsung Galaxy S4 Mini mobile phone (Samsung 2015a).
Figure 2.2.: The Samsung Gear S wristwatch (Samsung 2015b).
2.2. Di�erent Types of Gear Applications
A Gear application has two parts. The mobile phone contains a software calledthe Gear Manager that can communicate with the watch. Its main function is toprovide the service by sending information and files to the Samsung Gear S andis called the ‘host-side’. On the other hand, the watch takes a consumer role andreceives or displays the sent data from the mobile phone. This is also referred to as‘wearable-side’. Both devices can interact with each other or exchange data througha Bluetooth connection and the Samsung Accessory Framework.
There are three types of applications that can be created: Linked (Master-Follower),
12 Tanja Simon

Developing for Android
Developing for Android Integrated and Standalone. The first one is used if the hostand the wearable application are installed separately and not together. Use of thistype is made if the host program is not mandatory. If an Integrated application isdownloaded, it installs the host-side application and the wearable widget at thesame time. This type should be used if both parts are dependent on each other.For example, the host-side application connects to the internet to get the necessaryinformation and sends them to the wearable widget of the Samsung Gear. The thirdpossibility is the Standalone version. This type does not require a connection to anyother device. An example of this is an application that shows a clock.
For this work, an Integrated type will be used. The Samsung Galaxy S4 Minigets the host-side application and it is responsible for retrieving the necessary datafrom Adobe Analytics. The Samsung Gear S receives the wearable-side widgetand has the main task to inform the user if an anomaly or alert is detected. Theapplication for the mobile phone can be created by using a tool for developing anAndroid program. To create a wearable-side widget, a tool for the construction of aprogram for a Samsung Gear S must be used (Co 2015).
Tizen is an open-source and Linux-based operating system that has been cre-ated by a community of developers with mobile and connected devices as targets.The main infrastructure is Tizen Common , which is separated into various profilesbased on the purpose. For the Samsung Gear S, Tizen Wearable is used. Otherexamples of this are Tizen TV or Tizen IVI (in-vehicle infotainment). As the Tizenproject is open, developers can contribute to it and its focus is on the platform inde-pendent HTML5 (hyptertext markup language). For the layout of the applications,Tizen contains a Web engine with an integrated rendering engine to display HTML,images and formatted content with CSS (cascading style sheets). An additionalJavaScript engine interprets and executes JavaScript (Tizen 2014).
There are two ways to create a Samsung Gear application. First, a standaloneprogram. Its use implies that the application on the watch does not need an activeconnection to any other device for its functions. So the program is created only forthe Tizen-based device. The display of an analogue clock is one example. Anotheris a companion program which developers can create. The mobile device takes onthe role of host and is responsible to provide and to run services for the watch. Thisis also called ’hostside spplication’. Whereas the Samsung Gear has a consumerfunction. In this work the second mentioned method is used.
As mentioned before the Tizen SDK for wearables is used to create applica-tions with JavaScript for the Samsung Gear S. But a companion application needs ahost-side part for the mobile phone as well. The Samsung Galaxy S4 Mini has the
13 Tanja Simon

Developing for Android
operating system Android JB (Jelly Bean) installed. Two tools for the developmentwere on the shortlist: Android Studio and Eclipse. Google’s Android Studio shallbe taken when the focus is on the creation on applications for Android mobiledevices and it automatically supports devices from Google. With Eclipse, platformindependent programs are created and the programming language used is Java.This means that the application will work on different operating systems like Linux,Windows or Mac OS. The creation of two simple example projects showed thatEclipse Java EE IDE (integrated development environment) for Web Developershas better usability and structure. Additionally, the Tizen SDK for wearables is anEclipse-based IDE that facilitates the interaction between the two programs. Eclipsemust have the Android plugin installed in order to be used for the developmentof an Android application. More information about the installation processes forthe Tizen SDK for Wearables and the Eclipse Java EE IDE are available in theappendix. For the development of a Gear application, the Samsung AccessorySDK (Software Development Kit) for a host-side provider application and theTizen SDK for a wearable-side consumer are used. An application programminginterface (API) contains the rules of how to deal with an application whereasa software development kit (SDK) has the components to make an application.With an Integrated type of application, the host-side provider controls the con-sumer widget. If the Samsung mobile phone has a provider and the Samsungwatch a consumer service of the same profile, the Samsung Accessory Frameworkcan generate a connection between them. The profile must be implemented inthe XML (Extensible Markup Language) file and contains the connection detailslike application name and role to define if it is a consumer or a provider. Thehost-side application contains the SASocket subclass to establish the connectionbetween the devices and is integrated in the SAAgent class that contains the mainfunctionalities. The wearable-side widget searches and connects with the SAAgentfrom the provider and the communication is settled via the SASocket (Nadoba 2014).
The design of an user interface must provide a high usability. A commonmethod to create a first model of the application is called a mockup. It displays onlysome or the most important functions, should give a first overview of the programand facilitates the testing process. Online tools like mockups provide a platformwhere an example application can be created without programming a line of code.So the main advantage is that an application can be created quicker by visualisingthe idea in a graphical form before starting to create it. In her article about theusability engineering lifecycle, Mayhew discusses the fact that people want to havea powerful functionality and a simple and clear interface. She sees the design of themodel mockups right after the settings of the design and goals (Mayhew 1999).
14 Tanja Simon
3. Developing an Android Host and a
Tizen Client Application
The next examples show how a basic Tizen and Android application is created. Basedon these programs, the used features and concepts are explained in detail. The corre-sponding code is attached in the appendix. The first simple application demonstrateshow to display text on the wristwatch and the second one shows the display on anAndroid mobile phone.
3.1. Proof of Concept
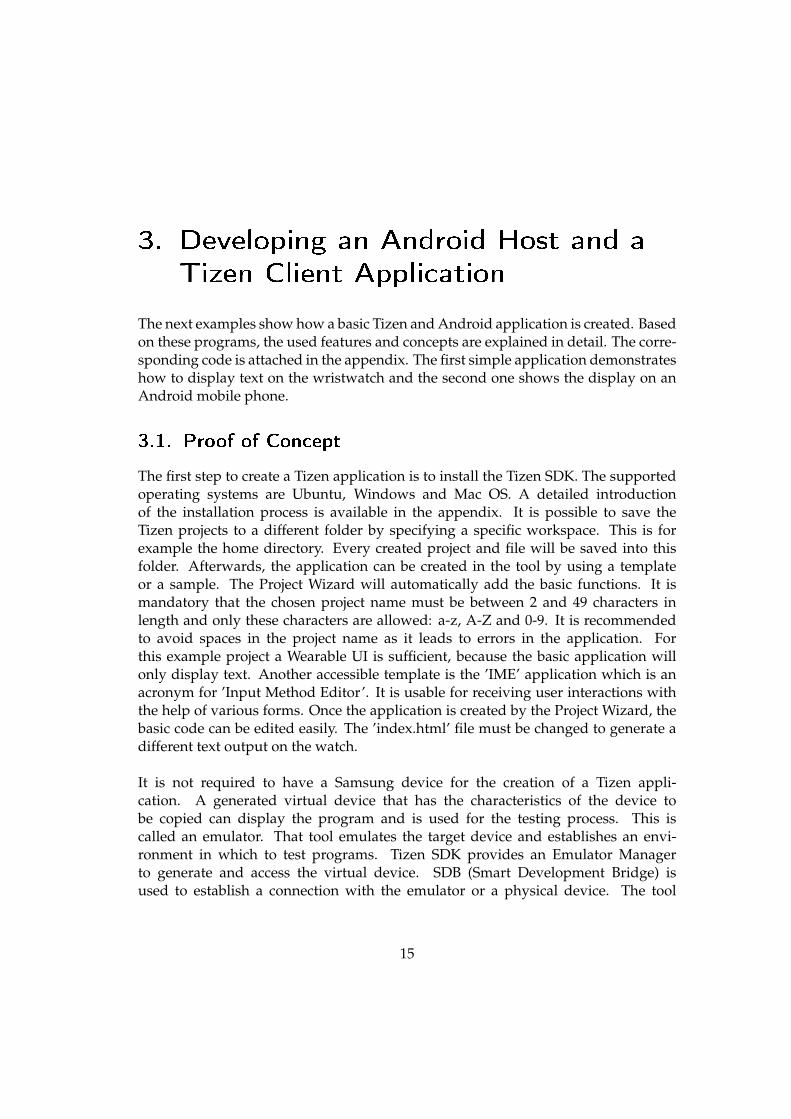
The first step to create a Tizen application is to install the Tizen SDK. The supportedoperating systems are Ubuntu, Windows and Mac OS. A detailed introductionof the installation process is available in the appendix. It is possible to save theTizen projects to a different folder by specifying a specific workspace. This is forexample the home directory. Every created project and file will be saved into thisfolder. Afterwards, the application can be created in the tool by using a templateor a sample. The Project Wizard will automatically add the basic functions. It ismandatory that the chosen project name must be between 2 and 49 characters inlength and only these characters are allowed: a-z, A-Z and 0-9. It is recommendedto avoid spaces in the project name as it leads to errors in the application. Forthis example project a Wearable UI is sufficient, because the basic application willonly display text. Another accessible template is the ’IME’ application which is anacronym for ’Input Method Editor’. It is usable for receiving user interactions withthe help of various forms. Once the application is created by the Project Wizard, thebasic code can be edited easily. The ’index.html’ file must be changed to generate adifferent text output on the watch.
It is not required to have a Samsung device for the creation of a Tizen appli-cation. A generated virtual device that has the characteristics of the device tobe copied can display the program and is used for the testing process. This iscalled an emulator. That tool emulates the target device and establishes an envi-ronment in which to test programs. Tizen SDK provides an Emulator Managerto generate and access the virtual device. SDB (Smart Development Bridge) isused to establish a connection with the emulator or a physical device. The tool
15
Developing for Android
is responsible to manage more device connections and to provide some basiccommands, like a file transfer. To enable SDB e.g. for a mobile device, the USBdebugging and the needed drivers must be activated or installed. Mostly, these arefound automatically if the device is accessed with the computer. USB debuggingmoves the mobile phone into a debugging-mode by connecting it via USB cable.This enables the creation or changing of files on the phone, and applications like’MyPhoneExplorer’ can be managed from the computer. It is recommended todisable this feature after usage, because it can be used to crack the phone based onpatterns. Android gives no warning whether it is activated or not (Wekenborg 2013).
Figure 3.1 demonstrates the example settings for the Tizen Emulator Managerfor a Samsung Gear S watch. The following picture 3.2 shows an example output ofthe program.
Figure 3.1.: Virtual device settings for an emulator that substitues a Samsung Gear S.
16 Tanja Simon

Developing for Android
Figure 3.2.: Output of a simple Tizen Gear application that displays ’Hellodevelopers’.
This second example demonstrates the utilization of the software developmenttool Eclipse in combination with a simple application that displays ’Hello devel-opers’ on a mobile device. Additional information about the installation of Eclipseis located in the appendix. In preparing the program, the API level has importantinfluence. It validates if the application is compatible with other Android platforms,because the level between Android devices can vary. Eclipse provides an assistantto prepare a quick application and various templates. The Android application iscreated as a project and must be assigned to a minimum required SDK and a targetSDK. The difference between these two versions is that the minimum SDK versionis mandatory for the user to be able to install the application. Whereas the targetSDK states the API level that is aimed by the application and that is successfullytested. An API level is an integer and is supported by only one Android platform.Therefore, an application can run with every API level between the minimumand the target SDK. If the given target SDK version is lower than the API level ofthe platform, the application remains operational via the automatic compatibilityfeature. During the installation of an application, the minimum SDK version that issaved inside the program is checked. If the value is lower than the minimum SDKversion, the application will not be allowed to install (Developer 2015a).
For example, the Gingerbread or Android 2.3 platform is available for down-load and contains new features like a multiple camera support. Android 2.3 isassigned to the identifier API level 9 that is used to check, if the applications arecompatible with this platform. A crash of the program is avoided, because the checkis executed during the installation. Before a software development tool is selectableit must be downloaded. Eclipse provides the SDK Manager for an automatic
17 Tanja Simon

Developing for Android
download of the necessary files. Each application must have a unique identifierwhich is called package name. It is set during the creation of the project and is noteditable afterwards.
A simple Android application can be created by using an assistant that auto-matically generates the needed files based on the entered data. For an Androiddevice, like Samsung Galaxy S4 Mini, an Android project must be created. It islocated inside the ’Project...’ menu item. The needed project type for a simpleapplication that displays only ’Hello developers!’ is ’Android Application Project’.Another option is ’Android Sample Project’, but this type requires that the package’Samples for SDK’ is installed. These SDK samples provide various examples thatshow some special features for Android. For beginners, it is recommended to createthe a project with the sample called ’ApiDemos’ and to launch it on the mobilephone to see the output of the various examples. Once all settings are entered, theproject can be tested.
Figure 3.3.: Output of a simple Eclipse application that displays ’Hello developers’.
The picture 3.3 shows the generated sample program for the Samsung Galaxy S4Mini. It displays ’Hello developers!’ if the application is executed. The application istestable on a virtual or physical device. The first option implies some previously con-ducted installations and settings. Firstly, the device must be added to the computerand all the drivers must be installed. A driver establishes a connection between thecomputer and any other hardware device. For example, a computer needs a specificprinter driver to be able to send and receive documents from the printer. Secondly,the mobile phone must have ’USB debugging’ enabled to receive the applicationand to run it. This is a hidden feature and must be enabled manually to avoidthat a user activates it accidentally. The following process must be successfullycompleted in order to enable the feature: With a Samsung Galaxy S4 Mini the userneeds to navigate to the settings for developers. Inside this section, ’USB debugging’can be activated by enabling the checkbox. Thirdly, the OEM (original equipment
18 Tanja Simon

Developing for Android
manufacturers) USB Driver must be installed on the computer. It is required if anapplication needs to be tested on an Android device. Once all three adjustmentshave been effected, the mobile phone will appear in the Android device selector if itis connected with the computer via a Bluetooth connection. The second option is torun the application in an emulator. The Samsung Galaxy S4 Mini is a newer type ofmobile phone and is not preinstalled in Eclipse. Therefore, developer Cyril createdsome emulators for newer mobile phone models. It is possible to download them forfree and to then make use of them in Eclipse (Real 2014). In the run configuration,the target is set to the appropriate virtual device. If the needed mobile phone is notlisted, it can be imported with the Virtual Device Manager. There is also a clonefunction available, if a new device cannot be created.
During the creation of this example, three errors occurred. First, an error wasshown when a new application is created. The author Lazy discusses the appearanceof a ’parseSdkContent failed’ message on the question and answer website StackOverflow. It is advised to delete the ’home/.android’ folder which can be foundin Windows at this location: ’C:/User/User’. Lazy draws the conclusion that theerror message occurred because of two existing SDKs on the computer. If oneversion is opened, then the other version will receive the error, because both usethe same .android file. This file is created after an installation of an Android SDKand is the default location for the configuration files of the Android Virtual Devices(Lazy 2014).
The size of an Android SDK version is very large. Therefore, the author Dar-iuszB discusses the relocation of the storage location from the different AndroidSDKs to a different drive. If a computer for example has more than one activatedstorage disk, a user can choose on which storage the data should be saved. Butit is important to inform the system where the new file is located. Therefore, anenvironment variable called ’ANDROID SDKHOME’ must be created and its valueshould be set to the new path like ’E:Android’. Environment variables give programs information like the computername or the current working directory. A common variable that is used by a lotof programs to check the location of needed sources is ’PATH’. The programsautomatically search through the listed paths inside this variable (DariuszB 2010).
Secondly, there was yet another error published after the import of an externalapplication. Existing programs that are organized and have the structure like Eclipseprojects are opened in Eclipse with the import function in the main menu. Thetool compares the SDK version from Eclipse and from the imported application. Ifboth versions do not fit together, an error occurs. For example, the loaded programuses the API level 20, but Eclipse uses version 18. Then the error states: “Unable
19 Tanja Simon
Developing for Android
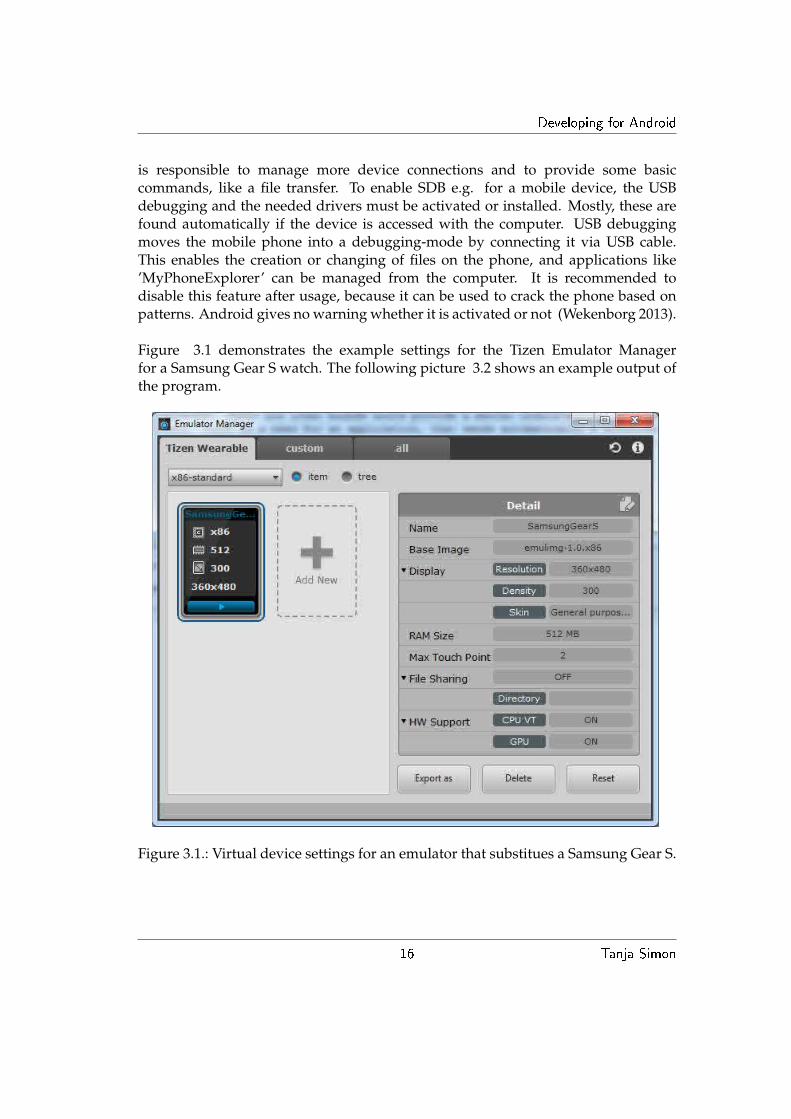
to resolve target ’android20’”. To solve the problem, the SDK Manager ( a separateapplication and available in the ’Window’ item of the menu) must be opened. Withthis tool, the SDK version with the appropriate API level can be updated or installed.This enables the user to install the ’Android 4.4W.2 (API20)’ and the error in theexample will not show up again.
Figure 3.4.: SDK Manager from Eclipse to install other or additional API levels.
The image 3.4 shows the SDK Manager from Android. As described in theprevious paragraph, the tool is exists apart from Eclipse. Therefore, it is also possibleto open it in the Android SDK folder by starting ’SDK Manager.exe’. A package orSDK is downloadable by enabling the respective checkbox of the item and clickingthe ’Install’button. It is important to download specific tools and packages to beable to develop for Android with Eclipse. Further information can be read in theappendix.
Thirdly, the last shown error is \T1\textquotedblleft...\HelloWorldExample\
res\values\styles.xml:7:error:Errorretrievingparentforitem:
Noresourcefoundthatmatchesthegivenname'Theme.AppCompat.Light'\T1\
textquotedblright. The solution of this problem is discussed by Andr-oidEric in an article for Android development beginners. He explains the use of a
20 Tanja Simon

Developing for Android
support library. An Android support library is mostly used to make older AndroidAPI versions available. This is an advantage if the project uses more APIs to usespecific layout features and to reach more customers. For example, the author ofthe article wants to use the ActionBar. This is a feature that provides navigationand user action functions. According to Android developers, “The ActionBarAPIs were first added in Android 3.0 (API level 11) but they are also available inthe Support Library for compatibility with Android 2.1 (API level 7) and above.”(Developer 2015b) Therefore, the author of the article recommends to add the’appcompat v7’ Support Library to the project in order to be able to make use of theActionBar. Inside the SDK Manager, the package for the ’Android Support Library’must be downloaded to be able to make use of support libraries (Eric 2013). There isa possibility to check afterwards if the inserted project is a library. If this is the case,then inside the Android settings the project is marked as ’Is Library’, proving that itwas successfully added as a library. But adding a support library to Eclipse does notautomatically imply that the main project recognizes it. Therefore, a reference mustbe created. A connection between these two items is generated by adding a libraryin the Android settings of the main project. Afterwards, the error is solved and theadditional features can be used.
3.2. Developing an Alarm System for Adobe SiteCatalyst
The previous subchapters displayed sample applications in order to give a first in-troduction of the creation of a Tizen and Android program. This chapter is about thecreation of an Android host and Tizen client application to generate an alarm systemfor the Anomaly Detection reports from Adobe Analytics for the devices SamsungGalaxy S4 Mini and the Samsung Gear S wristwatch. The course of events for theapplication can be divided roughly into these phases 3.5.
21 Tanja Simon

Developing for Android
Figure 3.5.: Process diagram shows the sequence of the individual steps to generatean alarm system.
The user needs to install the app and then to open it. The application accessesthe data from a specific report suite from Adobe Analytics. Additional informationabout how to generate and enable an external access to the data is indicated in theAppendix. Afterwards, the data from Anomaly Detection reports is gathered toprocess the data thereafter. On the one hand, the received information is graphicallydisplayed on the mobile phone for a specific time period. On the other hand, if anerror in the dataset is detected or calculated, an alert must be sent to the SamsungGear S wristwatch to inform the consumer.
In conjunction with a Gear application, the main program is split into two pieces: theAndroid host and the Tizen or Gear client part. The Samsung mobile phone containsthe Gear Manager that is connected with the WearableManagerService on thewristwatch. The Manager also sends the wearable-side widget that is saved insidethe host application to the Samsung Gear. Afterwards, the WearableManagerServiceinstalls the widget on the watch. A widget is a program that provides informationfor or retrieves information from the user. For example, upcoming calendar eventsare widgets. On one hand, the provider for example contains the service thatconnects with the widget, the widget itself, the settings for the service and layout.On the other hand, the client includes the settings and functions of the widget, theapplication and the layout of the project for the watch. The next picture sums up theprocess of the construction of a Gear application.
22 Tanja Simon

Developing for Android
Figure 3.6.: The diagram shows two different types to generate a Gear application.The main di erence is that if no user interface is needed on the wristwatch,then no Tizen consumer widget needs to be created.
Picture 3.6 shows two different ways of how a Gear application can be created. Itdepends on whether the client part contains a separate application with a user inter-face or not. This work does not focus on the creation of a consumer widget, because aspecial notification feature from Samsung is used. Nevertheless, if a user interface isto be created with Tizen SDK for Wearables, it is mandatory to build the applicationfirst. Only then, a suitable wgt (widget) consumer file is generated. This file must beimported into the assets folder in the Android project from Eclipse, if the developerwants to have it installed automatically with the installation of the host application.Samsung provides the feature Rich Notifications for the Gear S model. This enablesthe developer to inform the customer about specific events. Additionally it is possi-ble to personalize the occurrence of the notifications. With this SDK it is also feasible
23 Tanja Simon

Developing for Android
to receive a response from the user and the customer can interact with the providerserver. The appearance of the notification is changeable and additional options canbe added to it. To make use of the Samsung Rich Notifications, three libraries mustbe added to the Java project in Eclipse: richnotification-v1.0.0.jar, sdkv1.0.0.jar andgson-2.2.4.jar(or later version of gson) file. The first compressed library file containsthe main libraries for the client and the second one is needed to use the SamsungSDK. Gson is used to transform Java objects into JSON (JavaScript Object Notation)and back. JSON is used to bring code in a readable form. If the SDK Rich Notifica-tions is chosen and the developer does not need a separate widget on the watch, itis not necessary to develop a Tizen application. It is sufficient to add the previouslymentioned libraries to the Java application in Eclipse to get access to the requiredfeatures like the notifications. Mockups are a useful aid for creative purposes like thedesign.
Figure 3.7.: A simple user interface created with the online tool moqups without writ-ing any code.
The pattern 3.7 shows an example of how to design an alert for a Samsung Gear Swristwatch. Various elements are available to support the developer during the de-sign phase. With the online tool moqups, it is also possible to add functions behindsome elements. Consequently, not only a single page can be modelled, but also a pro-cess. For example, if the consumer clicks on the button, an automatic redirect takesthe user to the notification overview page. Once the design is set, the application canbe created in Eclipse with Java.
24 Tanja Simon

Developing for Android
Figure 3.8.: The picture demonstrates the use of the RichNotification SDK providedby Samsung in combination with alerts. The image on the left showsthe Android application on the mobile phone that contains the logic forthe notifications. The other two pictures demonstrate how the messagesdisplayed on a Samsung Gear (Systems 2015a).
The images in figure 3.8 show a sample Rich Notification program based on theexplanations from the Samsung Developers platform. The service provider is theAndroid host application that contains the main logic. It must be installed on theSamsung Galaxy S4 Mini and automatically sends a notification to the SamsungGear S. Once the message is received, it is opened and displayed immediately. Thesecond picture shows that the message is placed in the section where all notificationof the watch are displayed after the message was ignored or inspected. In this area,it can be deleted too. The third Image shows the content of the notification. The littlepicture in the bottom right with the three dots opens a settings menu with the choiceto delete the notification immediately. The content of it contains an alert from thetool Adobe Analytics, that states that the overall page calls from a website are de-creased by 10% based on the Anomaly Detection from Adobe. Further informationabout the calculation of the anomalies are available in the chapter (Developers 2014).
The path now heads from the notification creation to the creation of a host ap-
25 Tanja Simon

Developing for Android
plication that should provide the main service. The first step is to create an Androidapplication in Eclipse that generates an external access to the stored data fromAdobe Analytics which should be monitored. For this purpose, the software systemAnalytics Reporting API exists. The method to interact with it over the Internet iscalled Web services. In order to access Web services, two main protocols are oftenused: SOAP (Simple Object Access Protocol) and REST (Representational StateTransfer). A protocol has a combination of rules for requesting servers to set up astandard, for example to exchange information. SOAP is a platform independentprotocol that enables the communication between different applications. It dependson XML and it is possible to enlarge it with security features to authenticate on asecure website. An important file that is always listed together with SOAP is WSDL(Web Services Description Language). This XML document at issue among otherthings also describes the web service and the way of access. A Web service thus usesXML to describe data, SOAP to transfer a message and finally WSDL to describethe availability of services (Noabeb 2015). The main disadvantage of SOAP is thatit is necessary to write the XML structure for every task. As far as the preventionof complexity is concerned, REST provides a simpler solution because it uses anURL-based approach and therefore, does not need XML for the communication. Thenext two code examples will show how to use these protocols.
Mueller discusses two simple examples based on the free Web service ’geocoder.us’.The provider retrieves the specific information of a location like latitude andlongitude for the United States. The data it retrieved was collected by the US CensusBureau, which is among other responsibilities accountable for the United StatesCensus (Wikipedia 2015d). The first example shows a simple REST application. AnURL is generated with the necessary parameters and values to limit the requesteddata.
http://rpc.geocoder.us/service/csv?address=1600+Pennsylvania+Ave,
+Washington+DC
If the URL is entered in the browser, the response will be in a CSV (comma-separated value) format and contain the latitude and then the longitude. With thesetwo values, any place on the earth can be localized precisely. The same example isexplained for SOAP in combination with a WSDL file from Wickstrom.
26 Tanja Simon
Developing for Android
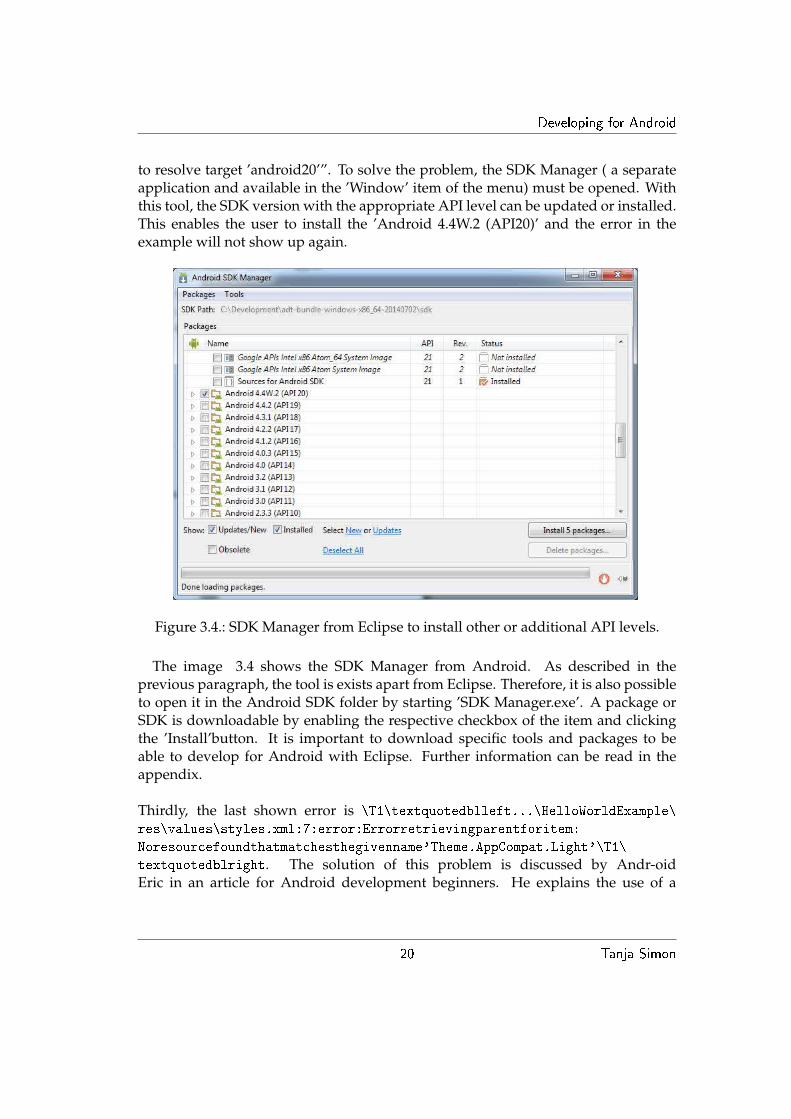
1 // Tested with PHP 5.2.423 // The address to convert4 $address = ’1600 Pennsylvania Av, Washington, DC’;5 printf("Get geocode for address: %s\n",$address);67 // Chose your method, with or without user info8 $wsdl = ’http://geocoder.us/dist/eg/clients/GeoCoderPHP.wsdl’;9 //$wsdl = ’http://username:[email protected]/dist/eg/clients/GeoCoderPHP.wsdl’;
1011 // Make the connection12 $client = new SoapClient($wsdl);1314 // Use this to see what services are available15 //var_dump($client−>__getFunctions());1617 // Actually call the service18 $result = $client−>geocode($address);19 var_dump($result);
The author creates a simple PHP (Hypertext Preprocessor) file. It is a scripting lan-guage and used for creating websites or web applications. The example script savesthe address, adds the location of the WSDL file and opens a connection with thehelp of the WSDL file to the server from ’geocoder.us’. The following function fromWickstrom shows how to list all available functions from the web service. At theend of the script, the function geocode() returns a list with the results from the querythat again contains the latitude and longitude of the given address (Wickstrom 2005).
The author Mueller makes a summary of the significant differences betweenSOAP and REST in his article based on their comparative advantages. On onehand, SOAP does not need a specific transport protocol like HTTP (HypertextTransfer Protocol) that is responsible for the transfer of data between applica-tions. Additionally, it has a built-in error handling and is standardized. Furtherextensions enable the usage of special features based on the WS standard like WS-Security. Web Services with SOAP/WSDL uses the industrial standards from WS-*classes to add functionality. On the other hand, REST is easier to use and it has asmaller format, because it does not need XML for the communication (Mueller 2013).
Based on the given facts and results, the REST method is used in this work toaccess the data from Adobe Analytics. It is not only more readable than SOAP, butthe structure is also less confusing. The next step after down from the Web servicedecision is to build the service provider application in Eclipse. The following imagesshow the predefined design for the main page that appears after the application iscalled up as well as the real page.
27 Tanja Simon

Developing for Android
Figure 3.9.: The left picture shows the prede ned user interface for the start page andthe right picture the user interface for the start page put into practice.
3.9 The user needs to install the app and then to open it. The first page showsa list of the available report suites that should be examined in order to detect anyabnormalities in the data. Located in the menu’s upper right corner is a symbolwith three dots. A click on this item opens the page where the adjustment of thealerts are situated. For example, a click on one of the buttons will start and stopthe notification application. This feature is not mandatory, because the consumercan quit the application anytime. But if the application should be executed in thebackground for a longer period of time, this feature will have a higher degree ofimportance.
Once the application is opened, it starts to make the first requests to AdobeAnalytics. At the bottom, a green rectangle with the text ’You are connected’ isplaced. This element gives information about if there is a working Internet connec-tion or not. If the data is successfully received, a pop-up message is displayed toinform the developer. This type of notification is called a toast and its characteristicis that it does not contain any buttons and that it disappears after a specific periodof time. The received data needs to be converted before it can be used. The type ofthe returned information is JSON.
28 Tanja Simon

Developing for Android
Figure 3.10.: The content from variables can be displayed in a console application.The picture shows the structure of the response from the Adobe Report-ing API
The figure 3.10 shows the example response from the Adobe Reporting API. Thelong text next to the tag ’resultREST2’ has the format JSON and must be convertedfor further usage. An article from the website ’secretgeek.net’ discusses the use andfunction of JSON (JavaScript Object Notation). As the picture demonstrates, it isused to send an object in a nested structure. The author explains that the curvedbrackets are used as a container and square brackets include arrays. As separatorbetween values a colon is used whereas arrays are separated by commas. An array isa collection of indexed variables (Secretgeek 2006). To deal with this data responsetype, an external JSON library is added from Java2s. If it is implemented in the code,the predefined functions make the conversion between the formats easier and thecode gets shorter (Java2s 2015). After the data is transformed, it can be displayed ina diagram.
29 Tanja Simon

Developing for Android
Figure 3.11.: The picture on the left side shows a design for the page that should dis-play the values from the Adobe Anomaly Detection reports. Whereasthe picture on the right side shows the user interface for the display ofthe Adobe Anomaly Detection reports put into practise with the Hel-loCharts library.
The above pictures 3.11 show the appearance of the data from the AdobeAnomaly Detection in a chart. To display the data in a diagram, a tool or externallibrary for an Android device is needed. The search for an appropriate solutionrevealed open source and commercial charting software. Examples for open sourcesoftware are: Holo Graph Library, ChartView and HelloCharts and for commercialsoftware are: Rchart, Orson Charts and Telerik Rad Chart.
It is necessary to know the requirements of the information display to take adecision for the appropriate software or library. For this work, the targets areseparated into more parts. For example, the charts should be able to automatically
30 Tanja Simon

Developing for Android
adjust their size based on the screen resolution of the mobile phone. The function-ality should remain the same and the colours should not differ too much in orderto create a higher recognition value to Adobe Analytics. Another main factor isthe availability of line charts, as it is the most effective way to display data of atime series. For such purposes, the x-axis will display the date and the y-axis willdisplay the figures based on the report. As the received data from Adobe’s AnomalyDetection contains four different values, four different lines must be created. A lotof charts have a limit of the lines in a chart. But a consumer needs to see past andfuture data to make a sound decision. Because it is very difficult to make an es-timation about the performance of value, if only one figure is given without a context.
A charting software must provide a lot of different chart types and should ex-hibit the feature to change the chart type without any big effort, because companyguidelines can rapidly change. If the library does not support the new chart types, anew kind of data visualisation must be integrated. This inevitably increases costs, asdevelopment and staff expenditure for the new charting software are incremented.Unfortunately, some people believe that they can see how much the graphic toolis worth based on its appearance and presentation. Graphs that look as if theyhave been created with old and cheap tools are often refused due to this way ofthinking. In addition, there are different types of guidelines for a more efficientcreation of reports. Companies like HICHERT+FAISST AG are specialised in thisarea. One of the recent findings is the avoidance of pie charts as steadily moremanagers are not able to correctly evaluate the range of the elements within them(HICHERT+FAISST 2015).
The final requirement is the easy handling of the charts from a developmentand an end-user point of view. Due to the fact that the code should be easy to readand to extend, it is important that no massively cumbersome techniques are used forthe creation of the charts. Thus, a new developer can easily understand the code andthe functionality without any previous knowledge. Moreover, it reduces the amountof time that is needed to begin the learning process of the structure of the code fromscratch.
Based on the given requirements, the library HelloCharts was chosen, becauseit provides special features like to swipe through register cards. It is possible tochange the type of the chart from a pie to a line chart by merely changing its nameAlso, the library contains some interactive features like an immediate change ofa diagram, if the connected diagram changes. For example, a column and a linediagram are connected with each other. If one day of the column chart is chosen,the line chart can display the values for this day per hour. The fact that it doesonly work with an API Level greater than or equal to eight is not an obstacle as the
31 Tanja Simon

Developing for Android
recent API level is 21 and the project will likewise be created with the most recentlevel. Its terms and conditions of use are listed under the Apache License Version2.0. Based on the terms, the software can be combined with other products andsold as packages. HelloCharts is used as a charting library by defining the chartview in the layout XML file. Alternatively, the view can be created and the layoutassociated later. The necessary diagram methods or functions are accessible viathe chart classes and the appearance is changeable with the methods from the datamodel. Every point in the chart is set with a an array-list. Therefore, every point isaccessible via an x-axis and and y-axis value (Wach 2015).
Therefore, the service provider uses this library as a charting software for thevalues of the Anomaly Detection from Adobe. The picture shows three differentvalues: page views, started games and bounces. To display the second verticalcategory that displays the started games, the consumer only needs to swipe fromright to the left side or tap on the tab. These three different values were selectedbecause they reflect the performance of the website. A page view is triggered everytime if a page with implemented Adobe Analytics code is loaded. Valela discussesin his article the use of page views and their importance in the marketing area.According to his writing, page views are used to validate an advertising media.A marketing manager’s task is to increase the number of page views in order toincrease the value advertisement views (Valela 2014). The second tab containsa figure that displays the performance of the sold product. As the success of acompany is tied to sales of the core product, the achievement of this goal mustbe monitored. The last value that is displayed graphically is bounces. This valueindicates how the number of single requests behave on the website. For example, ifa consumer opens the website and does not interact any further with it than to leaveit, then this single request is calculated as a bounce. A high number of bounces canbe an indicator of wrong marketing strategies, because the users which have been tothe website are leaving right after the first page view.
32 Tanja Simon

4. Conclusion and Further Research
In summary, the available final results show that it is possible to create a workingGear application with moderate resource requirements. The target of this work wasto develop an Android Host client that can retrieve the information from the exter-nal tool Adobe Analytics via web services and to send errors or alerts to a Gear. Thisprogram will help to manage the process of data collection, because the created alertapplication monitors the incoming traffic. Building on this point, it would be usefulto add additional features to application. For example, a consumer is more flexiblein the data analysis, if the monitored variables are not defined as fix, but selectable.The connection between the Samsung Gear S watch and the Samsung Galaxy S4Mini revealed no problems and has always worked well. The main reason of this un-problematic coupling of the two devices is the straightforward Gear Manager whichprovides a simple user interface to organize applications on the watch.
33

Bibliography
AES (2002), ‘Bluetooth and wireless networking a primer for audio engineers’. http://www.aes.org/journal/sampleissue/JAESV5011PG979.pdf.
Androidxda (2015), ‘Download samsung usb drivers’. http://androidxda.com/
download-samsung-usb-drivers.
Avast (2015), ‘avast! be free’. https://www.avast.com/index.
Co, S. E. (2015), ‘Samsung gear application, hello accessory developer’s guide,’.http://developer.samsung.com/technical-doc/view.do?v=T000000160.
Crowd, G. (2015), ‘Digital analytics scale score’. https://www.g2crowd.com/
categories/digital-analytics/.
DariuszB (2010), ‘Moving default avd configuration folder (.an-droid)’. http://stackoverflow.com/questions/3109473/
moving-default-avd-configuration-folder-android.
Developer, A. (2015a), ‘Api levels’. https://developer.android.com/guide/
topics/manifest/uses-sdk-element.html.
Developer, A. (2015b), ‘Action bar’. https://developer.android.com/guide/
topics/ui/actionbar.html.
Developer, A. (2015c), ‘Installing the eclipse plugin’. http://developer.android.
com/sdk/installing/installing-adt.html.
Developers, S. (2014), ‘Basic rich notification development’.http://developer.samsung.com/what-is-new/blog/2014/
Tutorial-Basic-Rich-Notification-Development.
Eclipse (2015), ‘Eclipse ide for java ee developers’. https://eclipse.org/
downloads/packages/eclipse-ide-java-ee-developers/lunasr2.
Eric, A. (2013), ‘Create library project with the appcompat v7 sup-port library’. http://android-er.blogspot.co.at/2013/12/
create-library-project-with-appcompat.html.
34

Developing for Android
Google (2014), ‘Google analytics terms’. http://www.google.com/analytics/
terms/us.html.
HICHERT+FAISST (2015), ‘Chamber of horrors > charts > circles’. http://www.
hichert.com/en/_media.html?id=74.
Idugboe, D. (2014), ‘What is digital marketing and what you need to know about ittoday’. http://www.smedio.com/what-is-digital-marketing/.
Java2s (2015), ‘Download link’. http://www.java2s.com/Code/JarDownload/java/
java-json.jar.zip.
Kalekar, P. S. (2004), ‘Anomaly detection’. http://labs.omniti.com/people/jesus/papers/holtwinters.pdf.
Kates, M. (2013), ‘Making digital and traditional market-ing work together’. http://econsultancy.com/au/blog/
62546-making-digital-and-traditional-marketing-work-together.
Kaushik, A. (2007), ‘Web analytics: An hour a day.’. None.
Lazy (2014), ‘parsesdkcontent failed could not initialize class andr-lid.graphics.typeface’. http://stackoverflow.com/questions/24636393/
parsesdkcontent-failed-could-not-initialize-class-android-graphics-typeface.
Mayhew, D. J. (1999), ‘The usability engineering lifecycle.’. In: CHI’99 ExtendedAbstracts on Human Factors in Computing Systems. ACM, 1999. S. 147-148.
Mueller, J. (2013), ‘Understanding soap and rest basics’. http://blog.smartbear.
com/apis/understanding-soap-and-rest-basics/.
Nadoba, A. (2014), ‘Developing your first tizen galaxy gear2 app – tips’. http:
//blog.scalac.io/2014/07/30/developing-your-first-galaxy-gear-app.
html.
Noabeb, L. (2015), ‘Anatomy of a web service: Xml, soap and wsdl for platform-independent data exchange’. http://www.webreference.com/authoring/web_service/index.html.
Real, C. (2014), ‘Android virtual device skins’. http://sourceforge.net/projects/android-emulator-skins/files/.
Samsung (2015a), ‘Samsung galaxy s4 mini lte i9195.’. http://www.samsung.com/
at/consumer/mobile-phone/mobile-phone/smartphones/GT-I9195ZWAATO?
subsubtype=galaxy.
35 Tanja Simon

Developing for Android
Samsung (2015b), ‘Samsung gear s.’. http://www.samsung.com/global/microsite/gears/gears_design.html.
Secretgeek (2006), ‘What is json: The 3 minute json tutorial’. http://www.
secretgeek.net/json_3mins.
Systems, A. (2012), ‘Data collection’. https://marketing.adobe.com/developer/
get-started/enterprise-api/c-data-collection-overview.
Systems, A. (2015a), ‘Fast facts’. http://wwwimages.adobe.com/content/dam/
Adobe/en/company/pdfs/fast-facts.pdf.
Systems, A. (2015a), ‘The most comprehensive set of digital marketing solutions.’.http://www.adobe.com/solutions/digital-marketing.html.
Systems, A. (2015b), ‘Metric description’. https://marketing.adobe.com/
resources/help/reference/metrics.html.
Systems, A. (2015b), ‘Welcome to reports and analytics.’. https://www3.omniture.
com/login/.
Systems, A. (2015c), ‘Anomaly detection’. https://marketing.adobe.com/
resources/help/reference/anomaly.html.
Tizen (2014), ‘Tizen web application development for beginners, ver-sion 1.0.’. https://www.tizen.org/sites/default/files/page/
tizenwebapplicationdevelopmentforbeginners.pdf.
Valela, A. (2014), ‘What’s more important: Page views or uniquevisitors?’. http://blog.agilitycms.com/content-managers/
what-s-more-important-page-views-or-unique-visitors.
Wach, L. (2015), ‘Github – lecho/hellocharts-android’. https://github.com/lecho/hellocharts-android.
Wekenborg, J. (2013), ‘Was ist usb-debugging – und wie lässt es sich ak-tivieren?’. http://www.giga.de/extra/android-spezials/specials/
was-ist-usb-debugging-und-wie-laesst-es-sich-aktivieren/.
Wickstrom, K. (2005), ‘Calling the member service with php and the pear library’.http://geocoder.us/help/php_kenny.shtml.
Wikipedia (2015a), ‘Eclipse (software) - wikipedia, the free encyclopedia’. http://
en.wikipedia.org/wiki/Eclipse.
36 Tanja Simon

Developing for Android
Wikipedia (2015b), ‘Hardware virtualization - wikipedia, the free encyclopedia’.http://en.wikipedia.org/wiki/Hardwarevirtualization.
Wikipedia (2015c), ‘Query string — Wikipedia, the free encyclopedia’. http://en.
wikipedia.org/wiki/Querystring.
Wikipedia (2015d), ‘United states census bureau - wikipedia, the free ency-clopedia’. http://http://http://en.wikipedia.org/wiki/United_States_
Census_Bureau.
37 Tanja Simon

A. Appendix
This chapter goes into more detail on how the different tools are installed, seeing ashow this can lead to various errors. In addition, this section will provide the samplecode for the main applications that are generated as part of this work.
A.1. Tizen SDK for Wearables Installation
There are are three possibilities to install the Tizen SDK: network, SDK image orcommand line interface installation. In this example, the software will be installedusing the provided SDK image. Before the software is installed on the computer, thefollowing system requirements must be checked:
• Ubuntu® 12.04 or 14.04 (32- or 64-bit), Microsoft Windows® 7/8 (32- or 64-bit),Apple Mac OS® X 10.8(Mountain Lion) 64-bit, 10.9(Mavericks) 64-bit.
• At least dual-core 2 GHz of CPU
• At least 3 GB of RAM memory
• At least 6 GB of free disk space
• Local administrator authority
• Oracle Java v7 or higher
The first step to install the Tizen SDK for Wearable is to open the Tizen Develop-ers website. Two different files must be downloaded: the Install Manager and theSDK Image. The image file consists of all SDK files that are needed for an offlineenvironment. If the operating system of the computer is Windows, then the appro-priate version must be chosen in the displayed tables. Once the manager is executed,the installation process starts. If the computer has an enabled anti-virus programthat prevents spam or viruses to harm the device, then the installation process maybe interrupted. Its abortion depends on whether the hardware-assistent virtualiza-tion is activated or not. This means that with the use of hardware, a platform canbe virtualized by hiding physical characteristics and showing another abstract com-puting platform (Wikipedia 2015b). It is also known as hardware virtual machine
I
Developing for Android
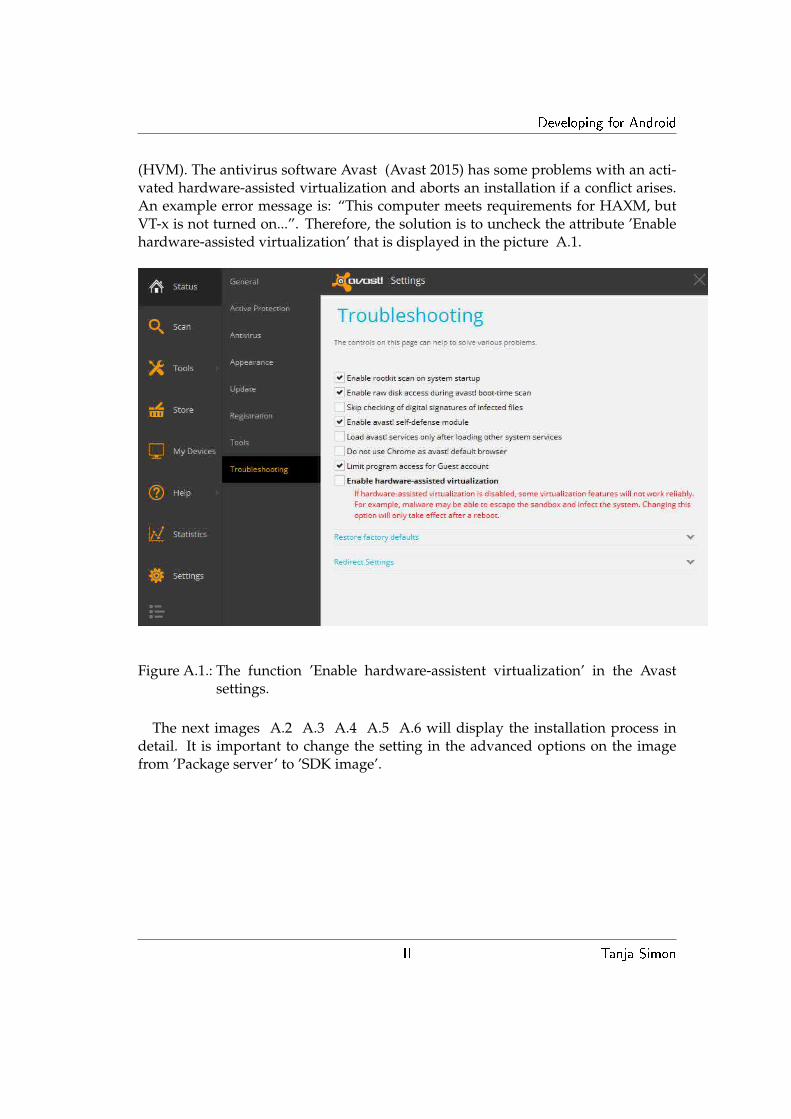
(HVM). The antivirus software Avast (Avast 2015) has some problems with an acti-vated hardware-assisted virtualization and aborts an installation if a conflict arises.An example error message is: “This computer meets requirements for HAXM, butVT-x is not turned on...”. Therefore, the solution is to uncheck the attribute ’Enablehardware-assisted virtualization’ that is displayed in the picture A.1.
Figure A.1.: The function ’Enable hardware-assistent virtualization’ in the Avastsettings.
The next images A.2 A.3 A.4 A.5 A.6 will display the installation process indetail. It is important to change the setting in the advanced options on the imagefrom ’Package server’ to ’SDK image’.
II Tanja Simon

Developing for Android
Figure A.2.: Tizen SDK Installation. The ’Advanced’ button must be activated.
Figure A.3.: The location to the folder of the image must be entered.
III Tanja Simon

Developing for Android
Figure A.4.: Tizen License Agreement acception.
Figure A.5.: Install type is Web App Development.
IV Tanja Simon

Developing for Android
Figure A.6.: Path to storage location must be specified.
A.2. Eclipse and Android Development Tools Installation
The development of the sample and the host-side application will be in Java. Eclipseis an IDE (integrated development environment) that enables developers to gener-ate software and the tool has various plugins to extend its functionality. Therefore,a specific plugin for Android applications exist. It is called ADT (Android Devel-opment Tools) and enables the developer to create and execute Android projects(Wikipedia 2015a). In this project, a specific Eclipse package is used that containsthe necessary features like Eclipse Java Development Tools and it works very well incombination with the Gear application. It is downloadable from the main website ofEclipse for the different system types (Eclipse 2015).
Once the tool is downloaded and installed, various features must be installed withthe tool SDK Manager from Eclipse. The most important plugin is the ADT to enablethe developer to create Android applications. It is important that Eclipse is alreadyinstalled before the plugin is added. The following requirements must be given toinstall ADT successfully:
• Eclipse 3.7.2 (Name: Indigo) or greater
• Eclipse JDT (Java Development Tools) plugin
V Tanja Simon

Developing for Android
• JDK 6
Eclipse 3.6 (Helios) is not supported and the JDT plugin, that enables the cre-ation of any Java application and makes Eclipse a development environment, is al-ready implemented in the most Eclipse IDE packages. Additionally, JRE alone is notenough and JDK is needed.
Once the tool is started, the point ’Install New Software’ inside the ’Help’-sectionmust be clicked. Afterwards, the ’Add’ button must be enabled to define the nameof the remote site. In this case „Android Plugin“ should be entered. Inside the ’Loca-tion’ field the URL \T1\textquotedbllefthttps://dl-ssl.google.com/android/
eclipse/\T1\textquotedblright is put to generate a reference to the plugin. If anerror occurs, it might help to exchange the ’https’ with ’http’. After accepting the set-tings, the „Developer Tools“ list entry will appear. Next, the ’Developer Tools’ mustbe marked, because they include the tools ’Android DDMS’ and ’Android Develop-ment Tools’. These two will be listed in the following dialog and after accepting thelicense agreement and the installation of any additional (Developer 2015c).
The tool Eclipse will be used to create an Android application for the SamsungGalaxy S4 Mini. In order to connect the mobile phone with the computer, a SamsungUSB driver is needed. It contains for example software that enables to synronizefiles between the two devices and establishes a connection. Androidxda providesa website that contains the Samsung Galaxy USB Drivers for all Samsung models(Androidxda 2015).
A.3. Generate Android Menu and Layout in Eclipse
This program shows the first step of creating an Android application and itscomponents. It generates the menu of the application and the layout. The examplealso demonstrates how to pass values between components.
12 @Override3 //Initialize Activity4 protected void onCreate(Bundle savedInstanceState) {5 super.onCreate(savedInstanceState);6 setContentView(R.layout.activity_main);78 // Reference Views9 IsConnected = (TextView) findViewById(R.id.tvIsConnected);
101112 // Update connection state13 if(isConnected()){14 IsConnected.setBackgroundColor(0xFF00CC00);15 IsConnected.setText("You are connected");16 }17 else{18 IsConnected.setText("Sorry, you are not connected");19 }
VI Tanja Simon

Developing for Android
202122 try {23 Thread.sleep(1000);24 } catch (InterruptedException e) {25 e.printStackTrace();26 }2728 // Call AsynTask to perform network operation on separate threads to get the data faster29 new HttpAsyncTaskS7PageViews().execute("www3.omniture.com");30 new HttpAsyncTaskS7CalledPages().execute("www3.omniture.com");31 new HttpAsyncTaskS7Bounces().execute("www3.omniture.com");3233 new HttpAsyncTaskS7PageViewsAlert().execute("www3.omniture.com");3435 //An activity contains more fragments that are responsible for the actions of the user interface.36 //Use of transactions to add or remove fragments. For example, if the surface must change during runtime.37 if (savedInstanceState == null) {38 getSupportFragmentManager().beginTransaction().add(R.id.container, new PlaceholderFragment()).commit();39 }40 }4142 /*43 * Android: Menu44 */4546 @Override47 public boolean onCreateOptionsMenu(Menu menu) {48 // Check if menu exists, then add items.49 getMenuInflater().inflate(R.menu.main, menu);50 return true;51 }5253 @Override54 public boolean onOptionsItemSelected(MenuItem item) {55 // Action bar has automatic features like the click on the home button.56 int id = item.getItemId();57 if (id == R.id.action_about) {58 //Intent is used to send data between the components of this app.59 Intent intent = new Intent(this, AboutActivity.class);60 startActivity(intent);61 return true;62 }63 return super.onOptionsItemSelected(item);64 }6566 /*67 * Android: Layout68 */6970 public static class PlaceholderFragment extends Fragment implements OnItemClickListener {7172 private ListView listView;73 private ChartSamplesAdapter adapter;7475 public PlaceholderFragment() {76 }7778 @Override79 //Create the main site80 public View onCreateView(LayoutInflater inflater, ViewGroup container, Bundle savedInstanceState) {81 View rootView = inflater.inflate(R.layout.fragment_main, container, false);82 listView = (ListView) rootView.findViewById(android.R.id.list);83 adapter = new ChartSamplesAdapter(getActivity(), 0, generateSamplesDescriptions());84 listView.setAdapter(adapter);85 listView.setOnItemClickListener(this);86 return rootView;87 }8889 @Override90 public void onItemClick(AdapterView<?> adapter, View view, int position, long id) {91 Intent intent;9293 switch (position) {94 case 0:95 // One Item is added to the list96 // Intent is used to activate another activity: ViewPagerChartsActivitySkill797 intent = new Intent(getActivity(), ViewPagerChartsActivitySkill7.class);
VII Tanja Simon
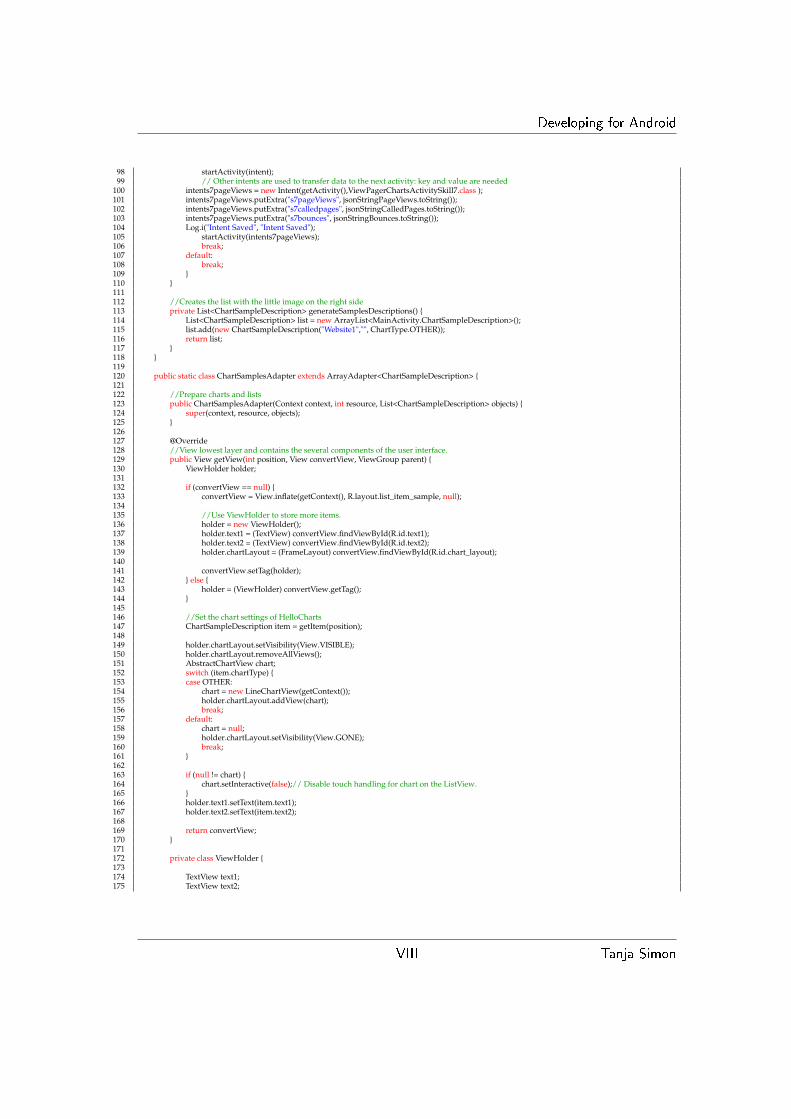
Developing for Android
98 startActivity(intent);99 // Other intents are used to transfer data to the next activity: key and value are needed
100 intents7pageViews = new Intent(getActivity(),ViewPagerChartsActivitySkill7.class );101 intents7pageViews.putExtra("s7pageViews", jsonStringPageViews.toString());102 intents7pageViews.putExtra("s7calledpages", jsonStringCalledPages.toString());103 intents7pageViews.putExtra("s7bounces", jsonStringBounces.toString());104 Log.i("Intent Saved", "Intent Saved");105 startActivity(intents7pageViews);106 break;107 default:108 break;109 }110 }111112 //Creates the list with the little image on the right side113 private List<ChartSampleDescription> generateSamplesDescriptions() {114 List<ChartSampleDescription> list = new ArrayList<MainActivity.ChartSampleDescription>();115 list.add(new ChartSampleDescription("Website1","", ChartType.OTHER));116 return list;117 }118 }119120 public static class ChartSamplesAdapter extends ArrayAdapter<ChartSampleDescription> {121122 //Prepare charts and lists123 public ChartSamplesAdapter(Context context, int resource, List<ChartSampleDescription> objects) {124 super(context, resource, objects);125 }126127 @Override128 //View lowest layer and contains the several components of the user interface.129 public View getView(int position, View convertView, ViewGroup parent) {130 ViewHolder holder;131132 if (convertView == null) {133 convertView = View.inflate(getContext(), R.layout.list_item_sample, null);134135 //Use ViewHolder to store more items.136 holder = new ViewHolder();137 holder.text1 = (TextView) convertView.findViewById(R.id.text1);138 holder.text2 = (TextView) convertView.findViewById(R.id.text2);139 holder.chartLayout = (FrameLayout) convertView.findViewById(R.id.chart_layout);140141 convertView.setTag(holder);142 } else {143 holder = (ViewHolder) convertView.getTag();144 }145146 //Set the chart settings of HelloCharts147 ChartSampleDescription item = getItem(position);148149 holder.chartLayout.setVisibility(View.VISIBLE);150 holder.chartLayout.removeAllViews();151 AbstractChartView chart;152 switch (item.chartType) {153 case OTHER:154 chart = new LineChartView(getContext());155 holder.chartLayout.addView(chart);156 break;157 default:158 chart = null;159 holder.chartLayout.setVisibility(View.GONE);160 break;161 }162163 if (null != chart) {164 chart.setInteractive(false);// Disable touch handling for chart on the ListView.165 }166 holder.text1.setText(item.text1);167 holder.text2.setText(item.text2);168169 return convertView;170 }171172 private class ViewHolder {173174 TextView text1;175 TextView text2;
VIII Tanja Simon

Developing for Android
176 FrameLayout chartLayout;177 }178179 }180 //Prepare description of the chart181 public static class ChartSampleDescription {182 String text1;183 String text2;184 ChartType chartType;185186 public ChartSampleDescription(String text1, String text2, ChartType chartType) {187 this.text1 = text1;188 this.text2 = text2;189 this.chartType = chartType;190 }191 }192193 public enum ChartType {194 LINE_CHART, COLUMN_CHART, OTHER195 }
A.4. Make a Request using the REST Protocol in Eclipse
This example demonstrates how to use Web services to access an external applica-tion with the REST protocol. In this program, the page views from the AnomalyDetection report from Adobe SiteCatalyst are requested and are re-utilised.
1 /*2 * REST: Requests S7 Page Views3 */45 public static String GETS7PageViews(String url){6 String result = "";7 try {89 // Create the string that includes the necessary data with StringBuilder
10 StringBuilder data = new StringBuilder();11 data.append("&client_id=" + applicationIDStr); //Use the client id from the Adobe SiteCatalyst Account12 data.append("&client_secret=" + clientSecretStr); //Use the client secret from the Adobe SiteCatalyst Account13 data.append("&grant_type=" + grantTypeStr);14 URL url2 = new URL(url2Str);1516 //Establish connection17 HttpsURLConnection con = (HttpsURLConnection) url2.openConnection();18 //Add request header19 con.setRequestMethod("POST");20 //Send post request, not GET21 con.setDoOutput(true);22 DataOutputStream wr = new DataOutputStream(con.getOutputStream());23 wr.writeBytes(data.toString());24 wr.flush();25 wr.close();2627 //BufferedReader is used to get the input stream data28 BufferedReader in = new BufferedReader(29 new InputStreamReader(con.getInputStream()));30 String inputLine;31 //Stringbuffer is used to read each line of the response and the result is saved as a string32 StringBuffer response = new StringBuffer();3334 while ((inputLine = in.readLine()) != null) {35 response.append(inputLine);36 }3738 //The response includes the access token for the request39 String token = response.toString();40
IX Tanja Simon
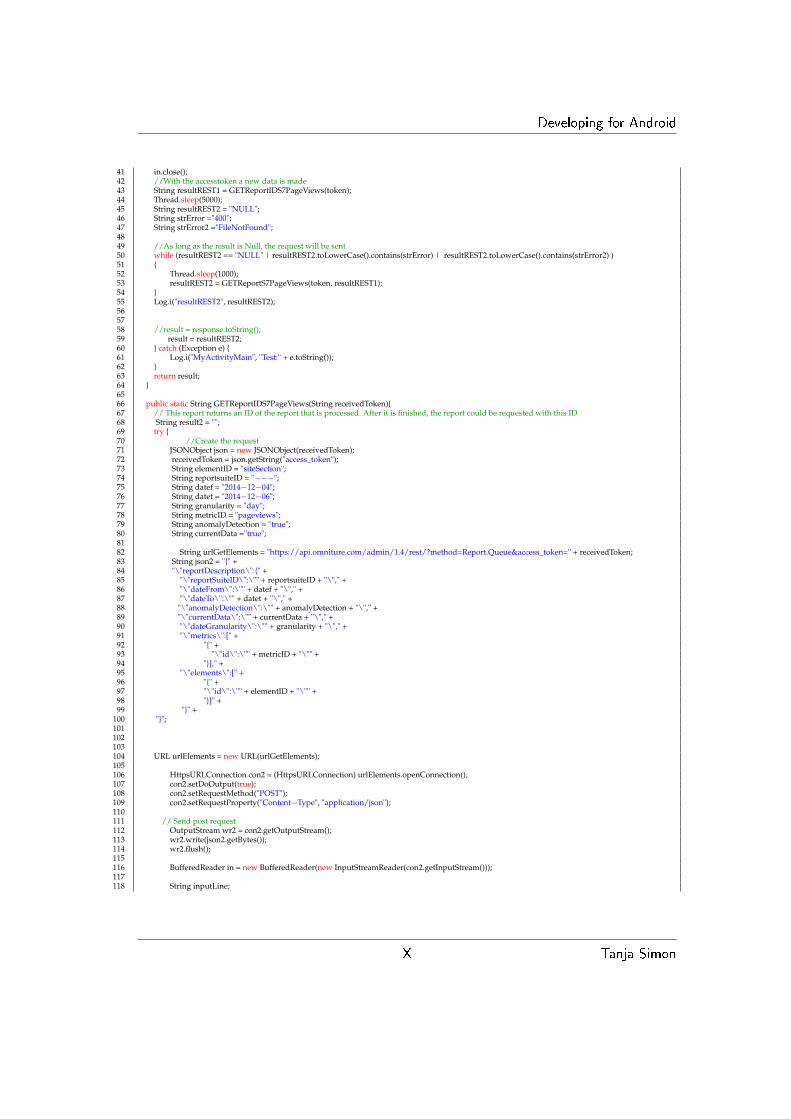
Developing for Android
41 in.close();42 //With the accesstoken a new data is made43 String resultREST1 = GETReportIDS7PageViews(token);44 Thread.sleep(5000);45 String resultREST2 = "NULL";46 String strError ="400";47 String strError2 ="FileNotFound";4849 //As long as the result is Null, the request will be sent50 while (resultREST2 == "NULL" | resultREST2.toLowerCase().contains(strError) | resultREST2.toLowerCase().contains(strError2) )51 {52 Thread.sleep(1000);53 resultREST2 = GETReportS7PageViews(token, resultREST1);54 }55 Log.i("resultREST2", resultREST2);565758 //result = response.toString();59 result = resultREST2;60 } catch (Exception e) {61 Log.i("MyActivityMain", "Test:" + e.toString());62 }63 return result;64 }6566 public static String GETReportIDS7PageViews(String receivedToken){67 // This report returns an ID of the report that is processed. After it is finished, the report could be requested with this ID68 String result2 = "";69 try {70 //Create the request71 JSONObject json = new JSONObject(receivedToken);72 receivedToken = json.getString("access_token");73 String elementID = "siteSection";74 String reportsuiteID = "−−−";75 String datef = "2014−12−04";76 String datet = "2014−12−06";77 String granularity = "day";78 String metricID = "pageviews";79 String anomalyDetection = "true";80 String currentData ="true";8182 String urlGetElements = "https://api.omniture.com/admin/1.4/rest/?method=Report.Queue&access_token=" + receivedToken;83 String json2 = "{" +84 "\"reportDescription\":{" +85 "\"reportSuiteID\":\"" + reportsuiteID + "\"," +86 "\"dateFrom\":\"" + datef + "\"," +87 "\"dateTo\":\"" + datet + "\"," +88 "\"anomalyDetection\":\"" + anomalyDetection + "\"," +89 "\"currentData\":\"" + currentData + "\"," +90 "\"dateGranularity\":\"" + granularity + "\"," +91 "\"metrics\":[" +92 "{" +93 "\"id\":\"" + metricID + "\"" +94 "}]," +95 "\"elements\":[" +96 "{" +97 "\"id\":\"" + elementID + "\"" +98 "}]" +99 "}" +
100 "}";101102103104 URL urlElements = new URL(urlGetElements);105106 HttpsURLConnection con2 = (HttpsURLConnection) urlElements.openConnection();107 con2.setDoOutput(true);108 con2.setRequestMethod("POST");109 con2.setRequestProperty("Content−Type", "application/json");110111 // Send post request112 OutputStream wr2 = con2.getOutputStream();113 wr2.write(json2.getBytes());114 wr2.flush();115116 BufferedReader in = new BufferedReader(new InputStreamReader(con2.getInputStream()));117118 String inputLine;
X Tanja Simon

Developing for Android
119 StringBuffer response = new StringBuffer();120121 while ((inputLine = in.readLine()) != null) {122 response.append(inputLine);123 }124 in.close();125126 result2 = response.toString();127128 } catch (Exception e) {129 Log.i("REST Report Call 1", "Test:" + e.toString());130 }131 return result2;132133 }134135 public static String GETReportS7PageViews(String receivedTokenJSON, String reportIDJSON){136 //It is responsible to use the report ID to get the report data from Adobe Analytics137 String result2 = "";138 try {139 JSONObject json = new JSONObject(receivedTokenJSON);140 String receivedToken = json.getString("access_token");141 JSONObject jsonReportID = new JSONObject(reportIDJSON);142 String reportID = jsonReportID.getString("reportID");143 Log.i("MyActivity", "reportID:" + reportID);144145 String urlGetElements = "https://api.omniture.com/admin/1.4/rest/?method=Report.Get&access_token=" + receivedToken;146 String json2 = "{" +147 "\"reportID\":\"" + reportID + "\"" +148 "}";149150 URL urlElements = new URL(urlGetElements);151152 HttpsURLConnection con2 = (HttpsURLConnection) urlElements.openConnection();153 con2.setDoOutput(true);154 con2.setRequestMethod("POST");155 con2.setRequestProperty("Content−Type", "application/json");156157 // Send post request158 OutputStream wr2 = con2.getOutputStream();159 wr2.write(json2.getBytes());160 wr2.flush();161162 BufferedReader in = new BufferedReader(163 new InputStreamReader(con2.getInputStream()));164165 String inputLine;166 StringBuffer response = new StringBuffer();167168 while ((inputLine = in.readLine()) != null) {169 response.append(inputLine);170 }171 in.close();172 //print result173 Log.i("REST Report Call 2", "ResponseCode:" + con2.getResponseCode());174 result2 = response.toString();175176 } catch (Exception e) {177 Log.i("REST Report Call 2", "Error" + e.toString());178 result2 = e.toString();179 }180 return result2;181 }
XI Tanja Simon