developing industrial trip generation model for himatnagar ......gidc, and sabar dairy, trips by...
TRANSCRIPT

Developing Industrial Trip Generation Model for
Himatnagar Industrial Area
B. V. Patel1,
1M. E. Student,
Tatva Institute of Technological,
Modasa.
D. K. Kadiya2, 2Assistant Engineer R&B Department
Himatnagar.
H. R. Varia3 3Principal,
Tatva Institute of Technological,
Modasa.
Abstract—This work is to determine the factors affecting trip
generation for the selected groups of industries within the
region and to develop trip generation model. To develop trip
generation model considering all the affecting parameters for
the future trips estimation, the industries are classified based
on the plot area and numbers of employee. The model has
been developed using several regression analyses by means of
Statistical Package for the Social Sciences (SPSS), which
establishes relationship between numbers of trips each
activity produce or attract by the employees. A model for trip
generation has been developed. The model result gave an
effective value of R2 equal to 0.99, indicating that the
explanatory variables such as area of industries, income of
employee, travel distance, travel time, raw material and
finished material included in the model explain 99% of the
dependent variable. Income of employee and raw material are
the main factors affecting trip generation. A detailed work is
necessary to use this model for planning purpose. Reliable
forecasting of future trips using this model can be done.
Keywords— Regression, Trip Generation, SPSS
I. INTRODUCTION
Urban transportation covers the movement of both people
and goods within an urban area. At the individual level,
urban\transportation can be characterized by a trip Personal
trips are commonly classified based on their main purpose
(Barber, 1995); work trips, shopping trips, social trips,
recreational trips, school trips, home trips and business
trips. This study focuses on industrial trips, and the factors
that determine the aggregate number of industrial trips
generated in urban areas. The transportation planning
process can be split up into four stages like trip generation,
trip distribution, mode choice, and route assignment. As on
date majority of the research on trip generation have been
concentrated on home based person trip generation, using
either regression analysis or cross classification analysis as
the mathematical technique.
Due to urbanization process developing cities are
surrounded by different types of industrial and recreational
activities. These activities giving impact on existing road
network by increased vehicular trips. It can create traffic
congestion, delay, air and noise pollution etc. Hence, it is
necessary to estimate these types of vehicular trips
generated by industrial or recreational activities. In India
few researches have been carried out to develop the
industrial trip generation model. Keeping this in view the
study is aimed to develop industrial trip generation model
for the developing city like Himatnagar. Himatnagar city is
facing urbanization problems due to increased outer growth
of the area. Due to ceramic industries, packaging
industries, laminates industries, agriculture industries,
GIDC, and Sabar Dairy, trips by industrial employees,
goods vehicle trips for raw material (in coming trips) and
finished material (outgoing trips) creating traffic
congestion on existing road network.
The scope of the work is confined to development of
trip generation model for the Himatnagar city area. The
following are the objectives:
To get the information of the existing locations of the
industries near by the Himatnagar. Their types, numbers of
workers, floor area, details of raw materials and finished
material. To understand the trip making characteristics of
various industrial workers and generating trip attraction
model (employee trips).To determine the independent
variables for the trips generated by goods/freight transport
vehicles for the different types of industries and developing
their trip generation models.
The study is mainly focused on industrial trip
generation behavior of the employees and goods/freight
transport vehicles for the different types industries near by
the Himmatanar city. This study enables to understand the
significant parameters for the industrial trip generation.
This study also facilitates to understand the tendency of trip
makers for choosing particular time, route, location, cost
etc. This study also enables to estimate the workers trips
and goods/freight vehicle trips for any new industry
established in future.
II METHODOLOGY AND DATA COLLECTION
The study region for this paper is Himatnagar Industrial
region, one of the most important industrial estates of
Gujarat, located in district Sabarkatha of Gujarat state in
India.
International Journal of Engineering Research & Technology (IJERT)
ISSN: 2278-0181http://www.ijert.org
IJERTV6IS040670(This work is licensed under a Creative Commons Attribution 4.0 International License.)
Published by :
www.ijert.org
Vol. 6 Issue 04, April-2017
768

Fig.1: Methodology chart for study
Employees Trips Data collection
Industrial survey had taken at five categories of industries
divided into study area. The process consist collection of
origin and destination data. The information on the travel
pattern includes number of trips made, their origin and
destination, purpose of trip, travel mode, travel time and so
on. The information on industrial employee interview
survey characteristics includes type of Employee name,
age, salary, vehicle ownership and so on. Based on these
data it is possible to relate the amount of travel to industry
and zonal characteristics and develop equations for trip
generation rates.
The sections are described below:
Category 1: Ceramic Industries
Category 2: Agriculture Industries
Category 3: GIDC Industries and Sabar Diary
Category 4: Packaging Industries
Category 5: Laminates Industries
Fig.2: Distribution of daily trips to Ceramics industries.
Fig.3: Distribution of daily trips to Agriculture Industries.
Fig.4: Distribution of daily trips to GIDC &Sabar dairy industries
Fig.5: Distribution of daily trips to Packaging industries.
1. Employees
Trips Survey
2. Goods Trips
Survey
3. Land/floor
area Data
collection
Survey
1. Trip Model
of Employees.
2. Trip Model
of Goods
Vehicle
International Journal of Engineering Research & Technology (IJERT)
ISSN: 2278-0181http://www.ijert.org
IJERTV6IS040670(This work is licensed under a Creative Commons Attribution 4.0 International License.)
Published by :
www.ijert.org
Vol. 6 Issue 04, April-2017
769
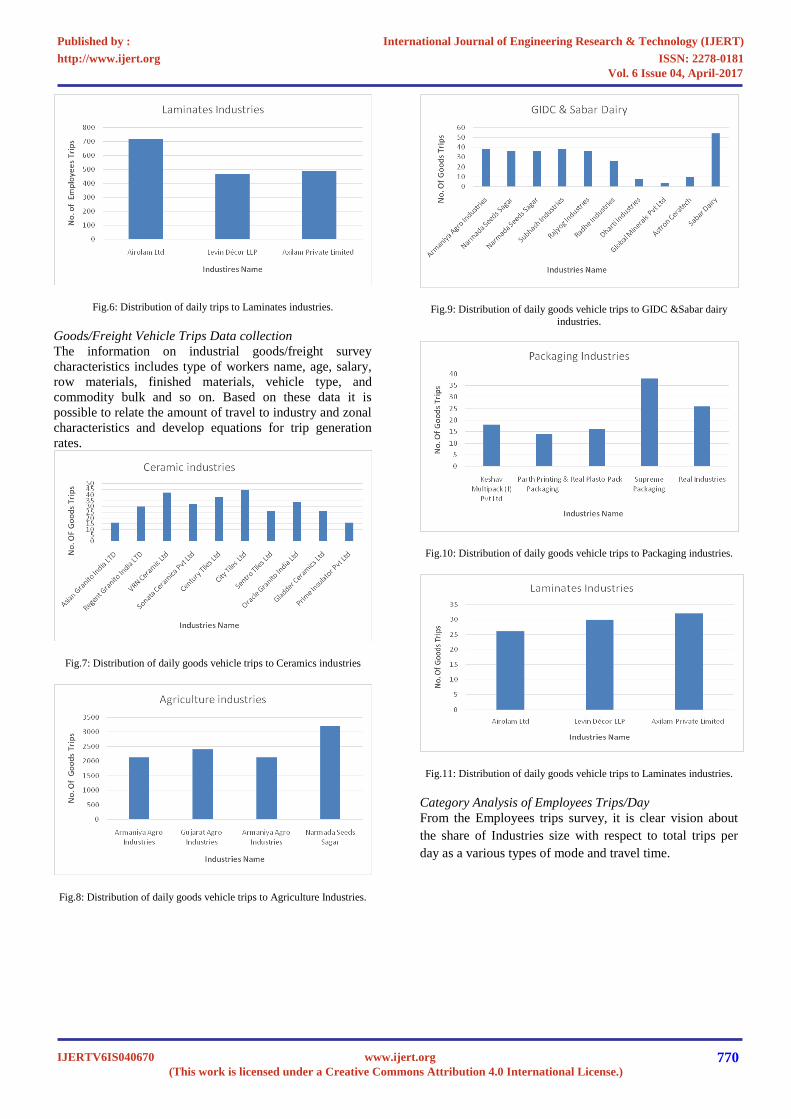
Fig.6: Distribution of daily trips to Laminates industries.
Goods/Freight Vehicle Trips Data collection
The information on industrial goods/freight survey
characteristics includes type of workers name, age, salary,
row materials, finished materials, vehicle type, and
commodity bulk and so on. Based on these data it is
possible to relate the amount of travel to industry and zonal
characteristics and develop equations for trip generation
rates.
Fig.7: Distribution of daily goods vehicle trips to Ceramics industries
Fig.8: Distribution of daily goods vehicle trips to Agriculture Industries.
Fig.9: Distribution of daily goods vehicle trips to GIDC &Sabar dairy
industries.
Fig.10: Distribution of daily goods vehicle trips to Packaging industries.
Fig.11: Distribution of daily goods vehicle trips to Laminates industries.
Category Analysis of Employees Trips/Day
From the Employees trips survey, it is clear vision about
the share of Industries size with respect to total trips per
day as a various types of mode and travel time.
International Journal of Engineering Research & Technology (IJERT)
ISSN: 2278-0181http://www.ijert.org
IJERTV6IS040670(This work is licensed under a Creative Commons Attribution 4.0 International License.)
Published by :
www.ijert.org
Vol. 6 Issue 04, April-2017
770

Fig.12: Ceramic industries trips/day (Mode wise)
Fig.13: Agriculture industries trips/day (Mode wise)
Fig.14: GIDC & Sabar Dairy industries trips/day (Mode wise)
Fig.15: Packaging industries trips/day (Mode wise)
Fig.16: Laminates industries trips/day (Mode wise)
Fig.17: Ceramic industries trips/day (Time wise)
Fig.18: Agriculture industries trips/day (Time wise)
Fig.19: GIDC & Sabar Diary industries trips/day (Time wise)
International Journal of Engineering Research & Technology (IJERT)
ISSN: 2278-0181http://www.ijert.org
IJERTV6IS040670(This work is licensed under a Creative Commons Attribution 4.0 International License.)
Published by :
www.ijert.org
Vol. 6 Issue 04, April-2017
771

Fig.20: Packaging industries trips/day (Time wise)
Fig.21: Laminates industries trips/day (Time wise)
Ceramic Industries Design line Diagram
Figure Design line diagram to indicate the origin and
destination of the employees trips for ceramic industries.
Agriculture Industries Design line Diagram
Figure Design line diagram to indicate the origin and
destination of the employees for agriculture industries.
GIDC & Sabar dairy Industries Design line Diagram
Figure Design line diagram to indicate the origin and
destination of the employees for GIDC and Sabar dairy
industries.
Packaging Industries Design line Diagram
Figure Design line diagram to indicate the origin and
destination of the employees for packaging industries
Laminates Industries Design line Diagram
Figure Design line diagram to indicate the origin and
destination of the employees for laminates industries
International Journal of Engineering Research & Technology (IJERT)
ISSN: 2278-0181http://www.ijert.org
IJERTV6IS040670(This work is licensed under a Creative Commons Attribution 4.0 International License.)
Published by :
www.ijert.org
Vol. 6 Issue 04, April-2017
772
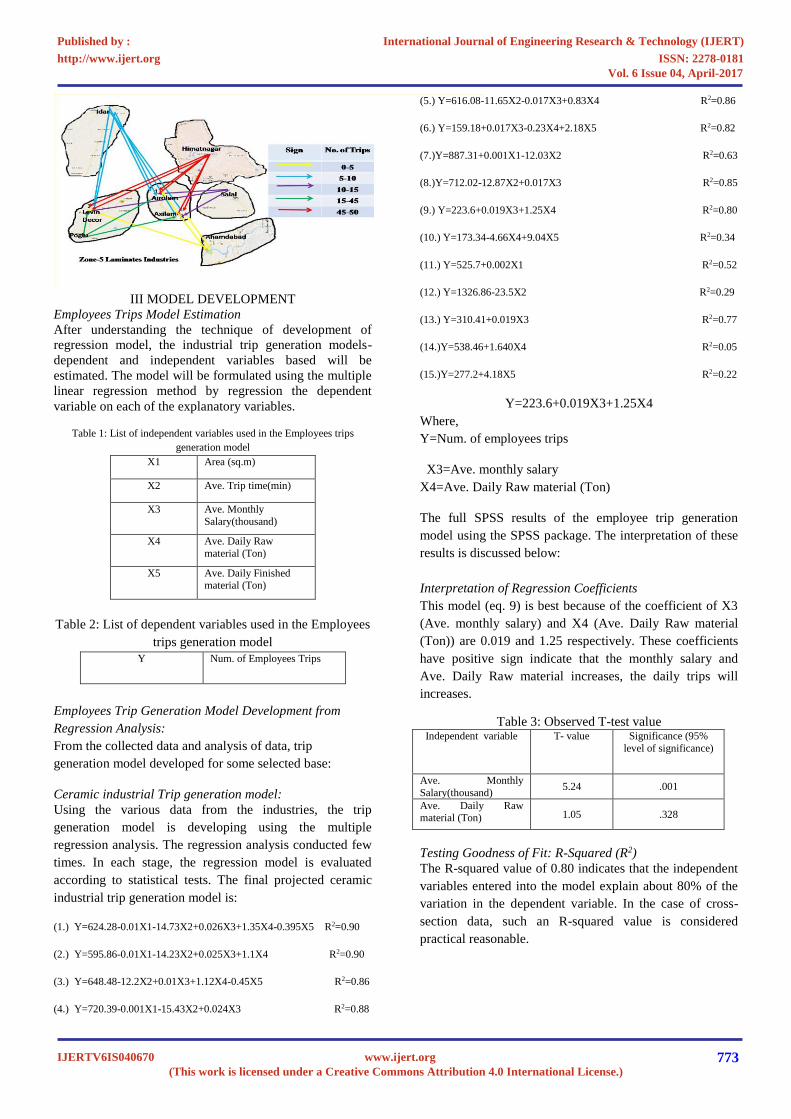
III MODEL DEVELOPMENT
Employees Trips Model Estimation
After understanding the technique of development of
regression model, the industrial trip generation models-
dependent and independent variables based will be
estimated. The model will be formulated using the multiple
linear regression method by regression the dependent
variable on each of the explanatory variables.
Table 1: List of independent variables used in the Employees trips
generation model
X1 Area (sq.m)
X2 Ave. Trip time(min)
X3 Ave. Monthly
Salary(thousand)
X4 Ave. Daily Raw
material (Ton)
X5 Ave. Daily Finished material (Ton)
Table 2: List of dependent variables used in the Employees
trips generation model
Y Num. of Employees Trips
Employees Trip Generation Model Development from
Regression Analysis:
From the collected data and analysis of data, trip
generation model developed for some selected base:
Ceramic industrial Trip generation model:
Using the various data from the industries, the trip
generation model is developing using the multiple
regression analysis. The regression analysis conducted few
times. In each stage, the regression model is evaluated
according to statistical tests. The final projected ceramic
industrial trip generation model is:
(1.) Y=624.28-0.01X1-14.73X2+0.026X3+1.35X4-0.395X5 R2=0.90
(2.) Y=595.86-0.01X1-14.23X2+0.025X3+1.1X4 R2=0.90
(3.) Y=648.48-12.2X2+0.01X3+1.12X4-0.45X5 R2=0.86
(4.) Y=720.39-0.001X1-15.43X2+0.024X3 R2=0.88
(5.) Y=616.08-11.65X2-0.017X3+0.83X4 R2=0.86
(6.) Y=159.18+0.017X3-0.23X4+2.18X5 R2=0.82
(7.)Y=887.31+0.001X1-12.03X2 R2=0.63
(8.)Y=712.02-12.87X2+0.017X3 R2=0.85
(9.) Y=223.6+0.019X3+1.25X4 R2=0.80
(10.) Y=173.34-4.66X4+9.04X5 R2=0.34
(11.) Y=525.7+0.002X1 R2=0.52
(12.) Y=1326.86-23.5X2 R2=0.29
(13.) Y=310.41+0.019X3 R2=0.77
(14.)Y=538.46+1.640X4 R2=0.05
(15.)Y=277.2+4.18X5 R2=0.22
Y=223.6+0.019X3+1.25X4
Where,
Y=Num. of employees trips
X3=Ave. monthly salary
X4=Ave. Daily Raw material (Ton)
The full SPSS results of the employee trip generation
model using the SPSS package. The interpretation of these
results is discussed below:
Interpretation of Regression Coefficients
This model (eq. 9) is best because of the coefficient of X3
(Ave. monthly salary) and X4 (Ave. Daily Raw material
(Ton)) are 0.019 and 1.25 respectively. These coefficients
have positive sign indicate that the monthly salary and
Ave. Daily Raw material increases, the daily trips will
increases.
Table 3: Observed T-test value Independent variable T- value Significance (95%
level of significance)
Ave. Monthly
Salary(thousand) 5.24 .001
Ave. Daily Raw material (Ton) 1.05 .328
Testing Goodness of Fit: R-Squared (R2)
The R-squared value of 0.80 indicates that the independent
variables entered into the model explain about 80% of the
variation in the dependent variable. In the case of cross-
section data, such an R-squared value is considered
practical reasonable.
International Journal of Engineering Research & Technology (IJERT)
ISSN: 2278-0181http://www.ijert.org
IJERTV6IS040670(This work is licensed under a Creative Commons Attribution 4.0 International License.)
Published by :
www.ijert.org
Vol. 6 Issue 04, April-2017
773
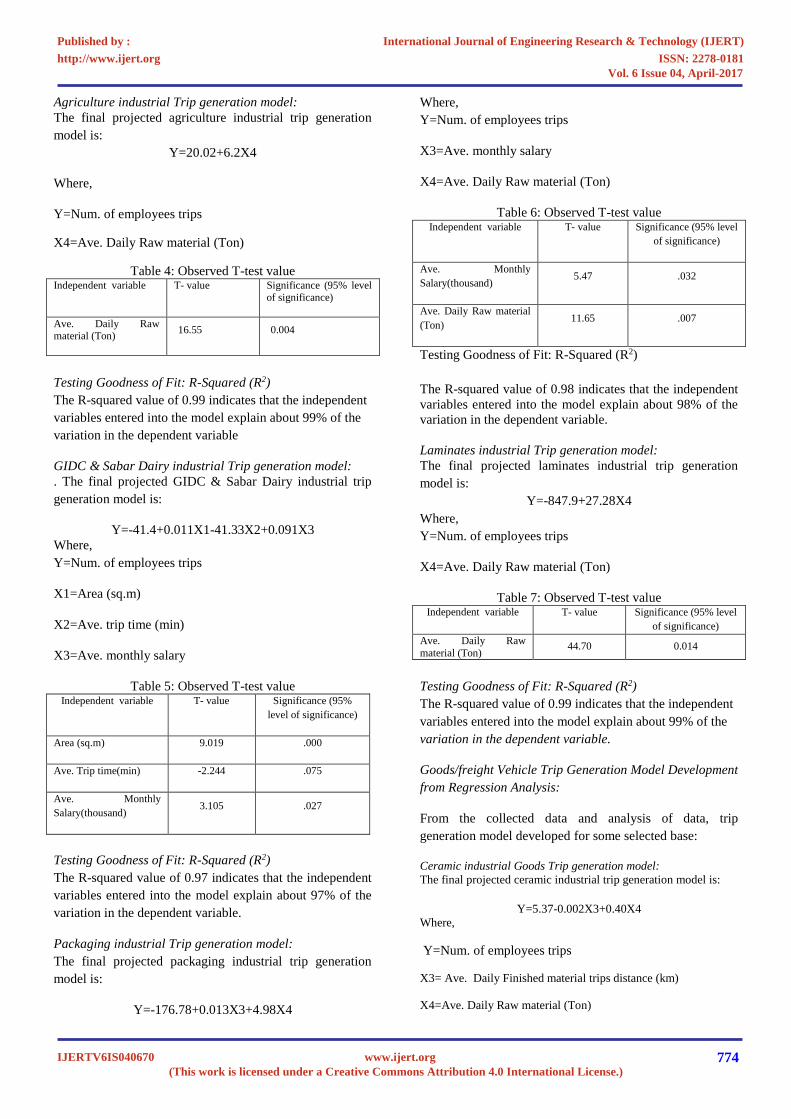
Agriculture industrial Trip generation model:
The final projected agriculture industrial trip generation
model is:
Y=20.02+6.2X4
Where,
Y=Num. of employees trips
X4=Ave. Daily Raw material (Ton)
Table 4: Observed T-test value Independent variable T- value Significance (95% level
of significance)
Ave. Daily Raw material (Ton)
16.55 0.004
Testing Goodness of Fit: R-Squared (R2)
The R-squared value of 0.99 indicates that the independent
variables entered into the model explain about 99% of the
variation in the dependent variable
GIDC & Sabar Dairy industrial Trip generation model:
. The final projected GIDC & Sabar Dairy industrial trip
generation model is:
Y=-41.4+0.011X1-41.33X2+0.091X3
Where,
Y=Num. of employees trips
X1=Area (sq.m)
X2=Ave. trip time (min)
X3=Ave. monthly salary
Table 5: Observed T-test value Independent variable T- value Significance (95%
level of significance)
Area (sq.m) 9.019 .000
Ave. Trip time(min) -2.244 .075
Ave. Monthly
Salary(thousand) 3.105 .027
Testing Goodness of Fit: R-Squared (R2)
The R-squared value of 0.97 indicates that the independent
variables entered into the model explain about 97% of the
variation in the dependent variable.
Packaging industrial Trip generation model:
The final projected packaging industrial trip generation
model is:
Y=-176.78+0.013X3+4.98X4
Where,
Y=Num. of employees trips
X3=Ave. monthly salary
X4=Ave. Daily Raw material (Ton)
Table 6: Observed T-test value Independent variable T- value Significance (95% level
of significance)
Ave. Monthly
Salary(thousand) 5.47 .032
Ave. Daily Raw material
(Ton) 11.65 .007
Testing Goodness of Fit: R-Squared (R2)
The R-squared value of 0.98 indicates that the independent
variables entered into the model explain about 98% of the
variation in the dependent variable.
Laminates industrial Trip generation model:
The final projected laminates industrial trip generation
model is:
Y=-847.9+27.28X4
Where,
Y=Num. of employees trips
X4=Ave. Daily Raw material (Ton)
Table 7: Observed T-test value Independent variable T- value Significance (95% level
of significance)
Ave. Daily Raw
material (Ton) 44.70 0.014
Testing Goodness of Fit: R-Squared (R2)
The R-squared value of 0.99 indicates that the independent
variables entered into the model explain about 99% of the
variation in the dependent variable.
Goods/freight Vehicle Trip Generation Model Development
from Regression Analysis:
From the collected data and analysis of data, trip
generation model developed for some selected base:
Ceramic industrial Goods Trip generation model: The final projected ceramic industrial trip generation model is:
Y=5.37-0.002X3+0.40X4
Where,
Y=Num. of employees trips
X3= Ave. Daily Finished material trips distance (km)
X4=Ave. Daily Raw material (Ton)
International Journal of Engineering Research & Technology (IJERT)
ISSN: 2278-0181http://www.ijert.org
IJERTV6IS040670(This work is licensed under a Creative Commons Attribution 4.0 International License.)
Published by :
www.ijert.org
Vol. 6 Issue 04, April-2017
774

Table 8: Observed T-test value
Independent variable T- value Significance (95% level
of significance)
Ave. Daily Finished material trips distance
(km)
-2.084 0.076
Ave. Daily Raw
material (Ton) 4.458 0.003
Testing Goodness of Fit: R-Squared (R2)
The R-squared value of 0.75 indicates that the independent
variables entered into the model explain about 75% of the
variation in the dependent variable.
GIDC & Sabar Dairy industrial Trip generation model: The final projected GIDC & Sabar Dairy industrial trip
generation model is:
Y=20.81-0.032X3+0.498X4
Where,
Y=Num. of employees trips
X3= Ave. Daily Finished material trips distance (km)
X4=Ave. Daily Raw material (Ton)
Table 9: Observed T-test value
Independent
variable
T- value Significance (95%
level of significance)
Ave. Daily Finished
material trips
distance (km) -2.002 .092
Ave. Daily Raw material (Ton) 2.975 .025
Testing Goodness of Fit: R-Squared (R2)
The R-squared value of 0.671 indicates that the
independent variables entered into the model explain about
67% of the variation in the dependent variable.
Conclusion
In this study industrial trips calculated from the employee
trips survey and goods/freight survey. The sample size of
industries is 31 i.e., approx 1063 employees. Another
sample size is also 31 industries for goods trips survey.
The multiple regression method, which is one of the
popular methods used to predict the trip generation, was
used in this study. The relevant conclusions are as follows:
Employees trip generation model
Industries
Zone
R2
value
Independent
variable
T-
value
Significance
(95% level of significance)
Ceramic
industries 0.80
Ave. Monthly
Salary(thousand) 5.24 .001
Agriculture industries
0.99 Ave. Daily Raw material (Ton)
16.55 0.004
GIDC & Sabar dairy
0.97 Ave. Monthly
Salary(thousand) 3.105 .027
Packaging
industries 0.98
Ave. Monthly Salary(thousand)
5.47 .032
Ave. Daily Raw
material (Ton) 11.65 .007
Laminates
industries 0.99
Ave. Daily Raw
material (Ton) 44.70 0.014
Goods Vehicle trip generation model
Industries
Zone
R2
value
Independent
variable
T-
value
Significance (95%
level of significance)
Ceramic
industries 0.75
Ave. Daily Raw
material (Ton)
4.45
8 0.003
GIDC &
Sabar dairy
0.67 Ave. Daily Raw
material (Ton)
2.97
5 .025
REFERENCES
[1] Comi F. and Russo A., (2011). “Measures for Sustainable Freight
Transportation at Urban”, Journal of Urban Planning and Development.
[2] Divya Priya C., (2014). “Freight Trip Generation Models for Chennai,
India”, Transportation Research Board Conference. [3] Eggett D.L., Jin T.G. and Mitsuru S., (2012). “Developing Country-
Level Commodity-flow Models Incorporating Land-Use
Characteristics and Economic Factors for Utah”, Journal of Urban Planning and Development.
[4] Koppelman and Pas, (1984). “Linear regression and categorical
analysis techniques are widely used in estimating the aggregate models” (FHWA, 1975; Hobbs, 1979; Koppelman and Pas, 1984;
Bruton, 1986; Sheppard, 1995). Discrete choice models are used for
disaggregate models (Vickerman and Barmby, 1985). [5] Leake G.R. and Gray J.E., (1979). “Trip generation of Selected
Industrial Groups”, Institute of Transport Studies, University of Leeds,
Leeds, UK, Paper No.113. [6] Mirjam H.E., Wilhelm J. and Lóri A., (2002). “Freight trip generation
by firms” Transportation Research University of Groningen European,
Paper No.113. [7] Munuzuri J., Pablo C. and Luis O., (2009). “Modeling Freight Delivery
Flows: Missing Link of Urban Transport Analysis”, Journal of Urban
Planning and Development. [8] Nadezda Z. and Arkady B., (2013). “Regression analysis for transport
trip generation evaluation” Transportation Management System Riga Technical University.
[9] Qiuping W., Siying W. and Yifan Y., (2013). “Research on slow
traffic forecast based on land use”, Transportation Research, Xi’an University of Architecture and Technology study Xi’an city in China.
[10] Starkie D.N.M., (1964). “Industrial trip generation models in
transportation”, Transportation Research University of South East England in Medway town.
[11] Vinodkumar R., Varia H. R. and Rajpara G., (2016). “Development of
Regional Industrial Trip Generation Model”, Indian Journal of Transportation Management system.
[12] Williams T.E.H. and Latchford J.C.R., (1962). “Industrial multiple
regress models”, Institute of Transport Studies, University of North East England.
International Journal of Engineering Research & Technology (IJERT)
ISSN: 2278-0181http://www.ijert.org
IJERTV6IS040670(This work is licensed under a Creative Commons Attribution 4.0 International License.)
Published by :
www.ijert.org
Vol. 6 Issue 04, April-2017
775