development and assessment of an elearning course on ... · (inesc), the author started in 2010 a...
TRANSCRIPT

Development and assessment of an eLearning course on senology for radiographers: a stratified randomised controlled trial
Sílvia Inês de Castro Moreira
SET|2012
5a ed


i
Development and assessment of an eLearning course on senology for radiographers: a stratified randomised controlled trial
Sílvia Inês de Castro Moreira
SET|2012
Professor Doutor Pedro Pereira Rodrigues
Faculdade de Medicina do Porto, Universidade do Porto
Professora Doutora Sandra Rua Ventura
Escola Superior de Tecnologia da Saúde do Porto, Politécnico do Porto
5a ed

ii

iii
«My world will always be yours, and yours will always be ours.»
To my fiancée, Paulo.

iv

v
Acknowlegdements
“As we express our gratitude, we must never forget that the highest appreciation is not to
utter words, but to live by them.”
John F. Kennedy
I am extremely grateful to all that participated in this thesis:
- My supervisors, Pedro Pereira Rodrigues and Sandra Rua Ventura, which in addition to all the guidance and help I also show my gratitude for all the sharing of knowledge and wisdom, empathy, friendship, understanding and patience;
- Susy Costa, António Cardoso and Bruno Araujo, for the friendship and availability to review the course content;
- Isabel Ramos, for giving me the opportunity to develop this work and also by the reading and the useful comments, and José Luis Fougo for the availability and acceptance in doing this work at the Breast Centre;
- All colleagues and friends who agreed to help me promptly by being part of the pilot-study inserted in this project;
- All participants, students and radiographers involved in this research study, for the willingness to learn more thus enhancing our professional category; without them this study would not have been possible and would not have the same success;
- Rui Sousa and Vera Gonçalves, for the greatest friendship and availability to contribute in a fundamental way to improve the thesis writing;

vi
- All colleagues from the Breast Centre of Centro Hospitalar S. João, EPE, for the friendship and support given to me throughout these four years of work;
- My dearest family, for the unconditional support, patience, understanding and affection shown and for never ceasing to believe in me;
- Paulo Ferreira, which in addition to participate directly in this project
by developing the course, I am also truly indebted for being always
there for me.
It is a great pleasure to thank everyone who helped me write my dissertation
successfully. Thank you all!

vii
Context
Being graduated in Radiology in 2006 at Escola Superior de Tecnologia da Saúde
do Porto (ESTSP), Politécnico do Porto, and working at the Breast Centre of
Centro Hospitalar S. João, EPE and at ESTSP, as well as being part of the Breast
Research Group at the Instituto Nacional de Engenharia de Software e Computadores
(INESC), the author started in 2010 a master’s degree in Medical Informatics at
Faculdade de Medicina do Porto, Universidade do Porto.
Due to specific training needs in senology within the professional context,
and due to the necessity of sharing knowledge with other colleagues, the author
took the opportunity to develop an easy-to-use eLearning environment course,
combining her two professional components of radiographer and teaching.
In addition, during her academic journey, the author was involved in the
following publications:
- Inês C. Moreira, Igor Amaral, Inês Domingues, António Cardoso, Maria
João Cardoso, Jaime S. Cardoso. INbreast: Toward a Full-field Digital
Mammographic Database. Academic Radiology, Volume 19, Issue 2, February
2012, Pages 236-248;
- Moreira I. C., Bacelar-Silva G. and Pereira Rodrigues P. February 2012.
Compliance of Publicly available mammographic databases with
established case selection and anotation requirements. In Proceedings of the
International Conference on Health Informatics, pages 337-340;
- Travassos C., C. Moreira I., Ferreira P. and Bacelar-Silva G. February
2012. Security and Privacy in European EHRs - Should Portugal Follow
Denmark and Sweden’s Examples? In Proceedings of the International
Conference on Health Informatics, pages 354-357.

viii

ix
Abstract
Breast cancer is a serious public health problem, and screening is a critical
tool to combat the mortality rate of the disease. Mammography technique is
considered the best imaging examination for this screening and the
radiographer plays a crucial role in this process. For this, the radiographer must
be properly prepared and should therefore be subject to specific training and
continuing education. Therefore, there should be training programmes, and
eLearning has been revealed a useful tool and an alternative to the traditional
education method.
The objectives of this work include the knowledge promotion and
understanding of all aspects related to the breast illness and patient care
required to radiographers. To achieve this, we proposed to develop an easy-to-
use course in eLearning environment and assess about its efficacy, effectiveness
and the users’ satisfaction, according to evaluation levels 1 and 2 from
Kirkpatrick’s framework. A randomised controlled trial was performed with
radiographers and radiology students, using as instruments individual
satisfaction questionnaires and pre and post-knowledge tests for further
comparisons, respectively. Intention-to-treat and per-protocol analysis were
considered in the statistical analysis.
As result, a total of 54 participants were included in the intervention group
(20 students and 34 radiographers) and 53 in the control group (19 students
and 34 radiographers). The intention-to-treat analysis showed a mean
improvement of 21 percentual points (pp) in the intervention group, compared
with 4 pp in the control group (p<0.001). Radiographers clearly improved with
the intervention (23pp vs 4pp.; p=0.004). Although the effect was not clear in
students (18pp vs 5pp; p=0.098), we found differences in post-test results
between intervention and control (88% vs 63%; p=0.003) whereas such
difference was absent in pre-test (63% vs 63%; p=0.106). Therefore, an
additional per-protocol analysis was applied to reduce the influence of lost to
follow-up individuals, which resulted in a higher effect (26pp vs 2pp; p<0.001),

x
both in students (25pp vs 3pp; p=0.004) and radiographers (27pp vs 2pp;
p<0.001). Regarding effectiveness, the majority of participants (81%) in the
intervention group agreed to take the course, although 9% of them did not
attend the full course. Considering users’ satisfaction, 85% are satisfied with the
eLearning system and 88% consider that the system is successful.
The students that performed the course have improved their knowledge,
although the participants who did not attend the course had also some
improvement. This result could be explained because some students can
achieve more knowledge by self-learning or that there was interest from
students in the control group in learning more after performing the pre-test.
Regarding the radiographers, the positive evolution observed after the course
performance reveals the importance of continuing education throughout their
working lives. The per-protocol analysis enhances the influence of the course,
revealing a notorious effect on the students’ group. Real effect is probably in
between the two analysis.
As the main finding we consider the improvement of knowledge on
senology that the eLearning course provided to radiographers. The course is
efficacious, especially for radiographers, which highlights the need for
continuing education, foreseeing also eLearning as an increasingly viable
alternative to the traditional method. The course is also effective, since only
10% of the learners dropped out during its performance. Moreover, the course
showed to have a great level of satisfaction, mainly at the level of interface and
contents topics.
Regarding the future work, the ultimate goal may be to proceed to an overall
improvement and accreditation of the course, realize a nationwide study in the
same way that this project was developed and in a more challenging long-term
perspective, to explore the evaluation of the course towards levels 3 and 4 of
the Kirkpatrick’s platform, studying the efficiency and costs aspects.
Keywords: Breast cancer, mammography, radiographer, evaluation,
eLearning.

xi
Resumo
O cancro da mama é um grave problema de saúde pública, constituindo-se a
implementação de programas de rastreio uma ferramenta fundamental para
combater a taxa de mortalidade da doença. Devido às suas características, a
mamografia é considerado o melhor exame imagiológico para este tipo de
rastreio. O Técnico de Radiologia tem, neste processo, um papel crucial, por
meio de inúmeras funções para as quais deve estar devidamente preparado,
devendo por isso ser submetido a formação específica. Entre os diversos
programas de formação existentes, o eLearning tem-se evidenciado como uma
ferramenta muito útil, alternativa ao método tradicional.
No contexto deste trabalho foi desenvolvido um curso em ambiente
eLearning e sujeito à avaliação da eficácia, efetividade e satisfação do utilizador,
de acordo com a plataforma de avaliação de Kirkpatrick. Neste sentido, foi
realizado um estudo randomizado controlado, onde os participantes foram
técnicos de radiologia e estudantes de radiologia e os recursos utilizados foram
ferramentas de avaliação tais como pré e pós-testes e um questionário de
avaliação da satisfação do utilizador.
Como resultado, globalmente foram obtidos 54 participantes no grupo de
intervenção (20 estudantes e 34 técnicos de radiologia) e 53 no grupo de
controlo (19 estudantes e 34 técnicos de radiologia). De acordo com a análise
estatística intention-to-treat, no geral observou-se uma melhoria de 21 pontos
percentuais (pp) no grupo de intervenção, em comparação com 4pp no grupo
de controlo (p<0.001). Os técnicos de radiologia apresentaram uma clara
melhoria no grupo de intervenção (23pp vs 4pp; p=0.004). Apesar do efeito não
ter sido claro nos estudantes (18pp vs 5pp; p=0.098), encontraram-se diferenças
nos resultados do pós-teste entre os grupos de intervenção e controlo (88% vs
63%; p=0.003), não existindo diferenças nos resultados do pré-teste (63% vs
63%; p=0.106). Por conseguinte, foi realizada uma análise por protocolo que
revelou um aumento do efeito do curso (26pp vs 2pp; p<0.001), tanto nos
estudantes (25pp vs 3pp; p=0.004) como nos técnicos (27pp vs 2pp; p<0.001).
xii
Em relação à efetividade, 81% dos participantes aceitaram fazer o curso e 9%
não fizeram o curso na sua totalidade. Em relação à satisfação dos utilizadores,
85% revelaram-se bastante satisfeitos com o curso e 88% consideraram o curso
bem-sucedido.
O facto de os estudantes no grupo de intervenção não terem tido uma
evolução no conhecimento que seja estatisticamente significativa, prender-se-á
com o facto de os estudantes desenvolverem uma melhor autoaprendizagem, e
aqueles que fizeram parte do grupo de controlo terem desenvolvido algum
interesse pela área após terem feito o pré-teste procurando depois por sua
iniciativa aumentar o seu conhecimento. Em relação aos técnicos de radiologia,
a evolução positiva realça a importância da educação contínua no âmbito
profissional. A análise por protocolo realçou a influência do curso nos
resultados, revelando efeito no grupo dos estudantes.
Como principal resultado, consideramos a melhoria do conhecimento na
área da Senologia que o curso proporcionou aos técnicos. O estudo provou que
o curso é eficaz, especialmente para os técnicos, realçando desta forma a
formação contínua e o eLearning enquanto uma viável alternativa ao método
tradicional. Para além da eficácia, este estudo provou também que o curso é
efetivo e tem alto grau de satisfação por parte do utilizador, principalmente a
nível de interface e de conteúdo. Em relação a trabalho futuro, o grande
objetivo será proceder a uma melhoria global do curso e à respetiva creditação.
Seria interessante alargar este estudo randomizado controlado ao âmbito
nacional. Numa perspetiva mais arrojada e a longo prazo, seria importante
também avaliar o curso segundo os níveis 3 e 4 da plataforma de Kirkpatrick,
de forma a estudar a sua eficiência.
Palavras-chave: Cancro da mama, mamografia, técnico de radiologia,
avaliação, eLearning.

xiii
«Learning is finding out what you already know. Doing is demonstrating that you know
it. Teach is reminding others that they know just as well as you.
You are all learners, doers, teachers.»
Richard Bach

xiv

xv
Contents
Acknowlegdements ................................................................................... v
Context .................................................................................................... vii
Abstract .................................................................................................... ix
Resumo..................................................................................................... xi
List of abbreviations and acronyms ...................................................... xvii
List of figures ......................................................................................... xix
List of tables ........................................................................................... xxi
1. Introduction............................................................................................ 1
1.1. Research problem ......................................................................................... 1
1.2 Research question .......................................................................................... 2
1.3 Objectives ....................................................................................................... 2
1.4 Thesis structure .............................................................................................. 2
1.5. Research contributions ................................................................................ 3
2. Basic concepts of senology .................................................................... 5
2.1 Breast cancer .................................................................................................. 5
2.2 Mammography ............................................................................................... 8
2.3 Radiographer role ........................................................................................ 11
2.4 The need for continuing education .......................................................... 12
3. The eLearning system in higher education and professional world .... 15
3.1 ELearning concepts .................................................................................... 16
3.2 Technology and tools .................................................................................. 17
3.3 Benefits and barriers ................................................................................... 17
xvi
3.4 Evaluation: related literature ...................................................................... 20
4. Study design and methodology ........................................................... 25
4.1 Target population ........................................................................................ 25
4.2 Sampling strategy and recruitment ........................................................... 25
4.3 Randomisation ............................................................................................. 26
4.4 Implementation ............................................................................................ 26
4.5 Pre and post-tests ........................................................................................ 28
4.5.1 Pilot study......................................................................................... 28
4.5.2 Final format ..................................................................................... 29
4.6 The Course description .............................................................................. 29
4.6.1 Course’s characteristics .................................................................. 29
4.6.2 Website learning development ...................................................... 30
4.7 Assessment of outcomes ............................................................................ 31
4.7.1 Main outcomes ................................................................................ 31
4.7.2 User’s satisfaction questionnaire .................................................. 31
4.7.3 Statistical analysis ............................................................................ 32
5. Results from the course’s evaluation ................................................... 35
5.1 Sample description ...................................................................................... 37
5.2 Efficacy ......................................................................................................... 37
5.2.1 Intention-to-treat analysis .............................................................. 38
5.2.2 Per-protocol analysis ...................................................................... 41
5.2.3 Query regarding specificity ............................................................ 42
5.3 Effectiveness and satisfaction .................................................................... 43
6. Discussion ........................................................................................... 46
7. Conclusion ........................................................................................... 50
7.1 Main findings ................................................................................................ 50
7.2 Main recommendations .............................................................................. 51
References ............................................................................................... 52
Appendix ................................................................................................. 58
Appendix I: final pre and post-tests ................................................................ 60
Appendix II: original satisfaction questionnaire ........................................... 66
Appendix III: translated satisfaction questionnaire ...................................... 70

xvii
List of abbreviations and acronyms
ACR American College of Radiology
AIR Australian Institute of Radiography
BIRADS Breast Imaging Report and Data System
CI Confidence Interval
CHSJ Centro Hospitalar S. João, E.P.E
CSS Cascading Style Sheets
CT Computed Tomography
EUSOMA European Society of Breast Cancer Specialists
FDA Food and Drug Administration
FFDM Full Field Digital Mammography
FTP File Transfer Protocol
HTML HyperText Markup Language
HSJ Hospital S. João, E.P.E
IT Information Technology
Md Median
MRI Magnetic Resonance Imaging
PHP Hypertext Preprocessor
pp Percentual points
P25 Percentile 25
P75 Percentile 75
RCT Randomised Control Trial
UK United Kingdom
US Ultrassound
USA United States of America
XML Extensible Markup Language
µ Average

xviii

xix
List of figures
Figure 1: Incidence and mortality rates of breast cancer around the world. ....... 6
Figure 2: Mammogram example. ................................................................................ 9
Figure 3: Standard patterns of breast tissue, according to the ACR. .................. 10
Figure 4: Comparison between tomosynthesis and digital mammography in
detecting a breast nodule in ACR3 pattern tissue. ................................................. 11
Figure 5: Study design: randomisation and implementation. ............................... 27
Figure 6: Study design and post-implementation. .................................................. 35
Figure 7: Diagram showing the sample enrolled and respective dropouts. ....... 36
Figure 8: Error bar of the "evolution" variable stratified by intervention and
control groups.. ............................................................................................................ 38
Figure 9: Error bar of the "evolution" variable, stratified by "professional
status" (students and radiographers). . ..................................................................... 41
Figure 10: Error bar of the "evolution" variable stratified by "professional
status" (students and radiographers) in the per-protocol analysis.. ..................... 42

xx

xxi
List of tables
Table 1: Organisational and economical barriers related to eLearning. ............. 18
Table 2: Barriers of eLearning relative to hardware, software and support
issues.. ............................................................................................................................ 19
Table 3: Pedagogical, phychological and skills barriers in eLearning. ................. 19
Table 4: Evaluation Checklist. ................................................................................... 20
Table 5: Kirkpatrick's plataform. .............................................................................. 22
Table 6: Course's main contents. .............................................................................. 30
Table 7: Sample's description and comparison between groups ......................... 40
Table 8: Satisfaction questionnaire results. .............................................................. 44

xxii
Introduction 1
1. Introduction
This initial chapter comprises a global approach of this thesis, and outlines
the research problem and question, the objectives purposed, its structure and
the contributions that this work can bring to the scientific research.
1.1. Research problem
Breast cancer has become a serious public health problem worldwide, being
responsible for about 1500 deaths in Portugal each year. Therefore, screening
programmes are crucial to reduce this mortality rate, and mammography
technique is currently considered the best imaging method for breast cancer
screening and the most effective tool for early detection of this disease.
The radiographer has a key role in the performance of mammographic
examinations, and is therefore responsible for a set of functions and processes
that require a more specific knowledge in the area of senology. Beyond
radiation exposure, positioning techniques and technical aspects of X-ray
equipment, the organisation of a breast cancer screening programme, the
management of breast disease and treatment options, as well as the image
quality assurance and interpretation are a few examples of other important
topics that can be lead to a good professional performance.
Education and training programmes are crucial so that these professionals
can improve their professional skills. Besides this educational need it is worth
mentioning several others, like the availability of learning resources and a
greater convergence of information, without interference in the work routine.
Another inherent element is the cost related to the training, such as travel
expenses, lodging, and registration fees for events, including congresses or
conferences.
In this perspective, distance learning (eLearning) has emerged in this area to
meet these needs and therefore provide new skills and new knowledge to health

2 Introduction
professionals at a lower cost and without requiring a high degree of computer
knowledge.
1.2 Research question
In the context abovementioned, the research question for this work is
whether an eLearning system improves the knowledge of radiographers and
radiology students on senology.
1.3 Objectives
The objectives of this work include the knowledge promotion and
understanding of all aspects related to the breast illness and patient care
required to radiographers. To achieve this, we proposed:
To develop an easy-to-use course in eLearning environment;
Assess about its efficacy and effectiveness;
Assess about the satisfaction of users.
1.4 Thesis structure
The thesis is organised in seven chapters and outlined as follows:
Chapter two – presents basic senology concepts, the relevance of
mammography as the best imaging technique for breast cancer
screening and the radiographer role in this process;
Chapter three – describes the eLearning as the new trend of education
as well as its advantages and disadvantages;
Chapter four – presents the study design and implementation;
Chapter five – reports the results of the implementation;
Chapter six – discusses the results attained and some research
limitations of this work;
Chapter seven – presents the main findings and proposes some
recommendations and directions of future work.

Introduction 3
1.5. Research contributions
This work provides a new easy-to-use eLearning course, thus contributing
to the senology teaching, emphasising the continuing education and
professional development in this way.
Also, it fills the lack of randomised control trials in the evaluation systems,
assessing about its efficacy and effectiveness. In addition, research articles are
being prepared for submission.

4 Introduction

Basic concepts of senology 5
2. Basic concepts of senology
Senology is defined as a multidisciplinary science that studies the human
breast and related pathology. This medicine field covers all topics related to
prevention, diagnosis, prognosis and treatment of breast pathology, which
implies the involvement of various specialities of the healthcare area, such as
surgery, radiology, pathology, genetics, psychology, nuclear medicine, oncology,
radiation therapy and nursing (Alto Comissariado da Saúde, 2009). It has
become an increasingly important area within research community due to the
high incidence of breast cancer and its mortality rate, particularly in western
countries.
2.1 Breast cancer
In 2008, breast cancer was the most common cause of cancer-related death
in women worldwide (Boyle P, 2008). Even before, in 2004 breast cancer alone
was responsible for approximately 519 million deaths, comprising 16% of all
cancer incidences among women (World Health Organization, 2009). In
Portugal, breast cancer related mortality incidence reaches 1500 women every
year. It is estimated that one in every 10 women will develop breast cancer at
any time in her life. In the Europe Union breast cancer is responsible for one in
every six deaths from cancer in women (Eurostat, 2009; Jemal et al., 2011).
6 Basic concepts of senology
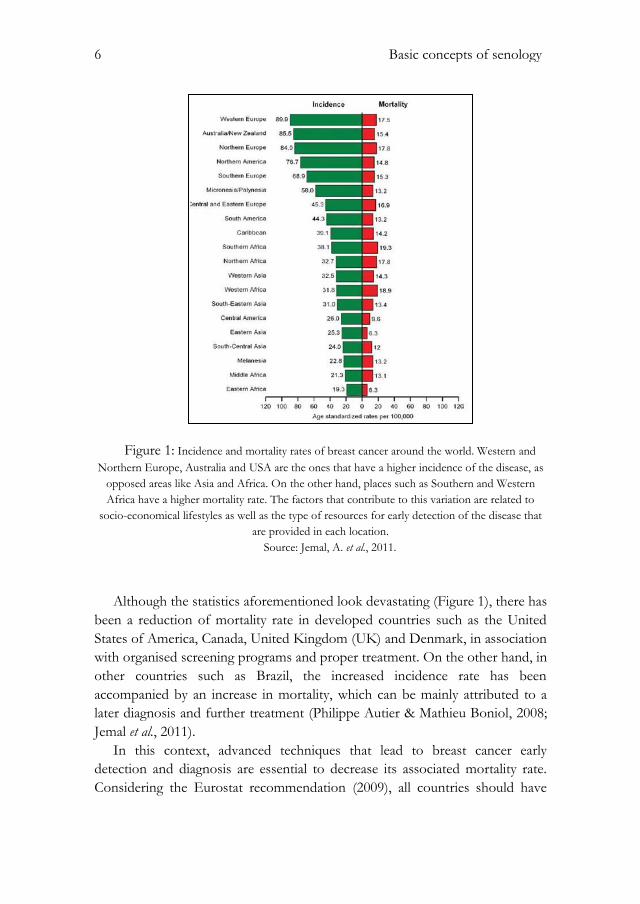
Figure 1: Incidence and mortality rates of breast cancer around the world. Western and
Northern Europe, Australia and USA are the ones that have a higher incidence of the disease, as
opposed areas like Asia and Africa. On the other hand, places such as Southern and Western
Africa have a higher mortality rate. The factors that contribute to this variation are related to
socio-economical lifestyles as well as the type of resources for early detection of the disease that
are provided in each location.
Source: Jemal, A. et al., 2011.
Although the statistics aforementioned look devastating (Figure 1), there has
been a reduction of mortality rate in developed countries such as the United
States of America, Canada, United Kingdom (UK) and Denmark, in association
with organised screening programs and proper treatment. On the other hand, in
other countries such as Brazil, the increased incidence rate has been
accompanied by an increase in mortality, which can be mainly attributed to a
later diagnosis and further treatment (Philippe Autier & Mathieu Boniol, 2008;
Jemal et al., 2011).
In this context, advanced techniques that lead to breast cancer early
detection and diagnosis are essential to decrease its associated mortality rate.
Considering the Eurostat recommendation (2009), all countries should have

Basic concepts of senology 7
screening programmes to deal with this illness. Mammography technique is
currently considered the best imaging method for breast cancer screening and
the most effective tool for early detection of this disease (Misra et al., 2010).
Screening mammographic examinations are performed on asymptomatic
women in order to detect early and clinically unsuspected lesions. In the United
States of America, the age range at which mass screening mammography is
generally recommended is between 40 and 74 years old, every two years,
although recently state organisations were debating the possibility of changing
the lower age limit to 50 years (Lee et al. 2010). According to European
guidelines on quality assurance in mammography, the screening should be
performed every two years in women aged 50 to 69 years. However, despite
broad consensus of having a breast cancer screening, these programs differ
depending on each country, its policies, economy, population and higher or
lower incidence rates of the disease in the corresponding country. For example,
in France the screening applies to women between 50 and 74 years old, and in
Malta screening is performed every three years (L. von Karsa et al., 2008; Ponti
& Psaila, 2010; Perry et al., 2006; Misra et al., 2010).
Regarding Portugal, the screening mammography is organised by the Liga
Portuguesa Contra o Cancro institution, which invites every two years women with
ages between 45 and 69 years old (in Azores the range is extended up to 74
years) who are enrolled in the National Health Service. The doubtful cases are
recalled for a better diagnosis and are sent to the hospital if needed (Liga
Portuguesa Contra o Cancro, 2009).
Specially, in women with genetic mutations or with a significant family
history of breast cancer, screening should start usually 10 years earlier than the
age of diagnosis of the youngest relative (although never before 25 years old)
(Lee et al., 2010).
Breast cancer in men is extremely rare; it corresponds to 30% of the cases in
which the disease is inherited and is less than 1% of all cancers that affect
humans. It affects most commonly people at the age of 65 and it is rarely
bilateral (Lee et al., 2010; U. Fischer & Luftner-Nager, 2008).
Although there are screening programmes already implemented all over the
world, the anxiety motivated by the possibility of existence of the disease and
the existence of known cases of breast cancer by the patient lead to some
specialists believing that screening should start earlier and/or carry out the
breast evaluation annually. For this reason, concerning women under 40 years,
although is not considered screening, the first intended exam is the ultrasound

8 Basic concepts of senology
(US), since mammography for this age group has lower sensitivity and
specificity (Misra et al., 2010; Lee et al., 2010).
Besides mammography there are other imaging techniques for breast
diagnosis, including US and Magnetic Resonance Imaging (MRI). Breast lesion
biopsy should preferably be guided by US, but when the lesion is not visible it
is recommended that the biopsy should be guided by X-ray or MRI (Alto
Comissariado da Saúde, 2009; Lee et al., 2010).
The treatment options include surgery, chemotherapy, radiotherapy and
hormonal therapy. The proper treatment choice depends on the stage of the
disease, the type of tumour and the general health status of the patient (Perry et
al., 2006; Alto Comissariado da Saúde, 2009).
2.2 Mammography
Due to its sensitivity and specificity (66% and 94%, respectively (FMUP,
2004; Kavanagh et al. 2000)), through spatial resolution and performance
features such as breast compression, mammography can detect lesions with less
than 1cm, no palpable or visible in other imaging methods, such as US
(Mahesh, 2004). It is less costly when compared to other types of imaging
techniques (e.g. MRI ) (Schueler et al., 2008; Lee et al., 2010). For these reasons,
mammography is currently considered the best imaging technique for breast
cancer screening and therefore the most effective tool to early detection of this
disease. It is a way of reducing the mortality of the disease and thus increasing
the treatment options (Lee et al., 2010; Misra et al., 2010; N. M. Perry, 2001).
Mammography technique comprises the radiographic acquisition of two
views or projections for each breast: the craniocaudal (CC) view, which is a
‘head-to-feet’ view, and a mediolateral oblique (MLO) view, which is a side-
view (Figure 2) (Misra et al., 2010). The images can be recorded on x-ray film,
such as a film-screen mammogram, or in digital format, such as a digital
mammography (Full Field Digital Mammography – FFDM – and Computed
Radiography) (Karellas, 2006; Mahesh, 2004). Some breast screening
programmes, such as the National Health Service (NHS) of England
encompass a single MLO view of each breast (Ponti & Psaila, 2010).

Basic concepts of senology 9
Figure 2: Mammogram examples: (a) CC view of the right breast; (b) CC view of the left
breast; (c) MLO view of the right breast; (d) MLO view of the left breast.
Source: Breast Centre, Hospital S. João (HSJ), 2009.
Besides screening, mammography is also used in diagnosis and intervention,
and subsequent follow-up of benign and malign lesions. In this kind of
situations other type of X-ray projections are performed in order to clarify the
lesion description. Also the mammography equipment allows the use of a
stereotaxic device, which allows performing the biopsy and the localization of
impalpable lesions which are going to be removed by surgery and are only
visible on X-ray. Mammography also provides the radiography of chirurgical
breast specimen, in order to confirm the total resection of the lesion (Mahesh,
2004).
Mammography shows the morphological aspects of the breast, such as the
anatomical structures and all the breast tissues, namely glandular, fibrous and
adipose tissues. However, there is one major problem concerning breast
radiography: these three types of tissue have similar density among them (there
is no bone tissue or air to provide high contrast). The relative density of the
breast is primarily affected by the inherent characteristics of the patient, by their
hormonal status, age and pregnancy (Williams et al., 1995; U. Fischer &
Luftner-Nager, 2008). Generally speaking, and according to the American
College of Radiology (ACR, 2003), a mammogram can be classified into one of
four existing standard patterns as the relative amounts of fibro-glandular tissue
as opposed to fatty tissue (Figure 3): fat (less dense), fat-fibrous, fibro-glandular
and glandular (denser) (ACR1 to ACR4).

10 Basic concepts of senology
Figure 3: Standard patterns of breast tissue, according to the ACR.
Source: Breast Centre, HSJ, 2010.
With the increase density of the breast it becomes more difficult to detect
pathology due to the overlapping tissues effect, being also harder to make a
correct diagnosis, which decreases the sensitivity and specificity of the exam.
Usually this type of pattern is found in younger women; in this case the first
advised exam is US, as previously described. To contest this decline in the
quality of the diagnostic examination, several improvements such as in the
image acquisition - as FFDM-, in the material composition of the equipment
and in the technical parameters and automatic exposure have been upgraded in
order to create a better visualization of dense breast tissue (Karellas, 2006).
Tomossynthesis, another recent mammographic progress, is a tomographic
application of digital mammography. It includes a three-dimensional imaging
technology that involves the acquisition of images from a stationary
compressed breast at multiple angles during a short scan. The individual images
are then reconstructed into a series of thin high-resolution slices that can be
displayed individually or in a dynamic ‘cine mode’. The aim of this technique is
to reduce or eliminate the tissue overlapping effect thus detecting lesions with
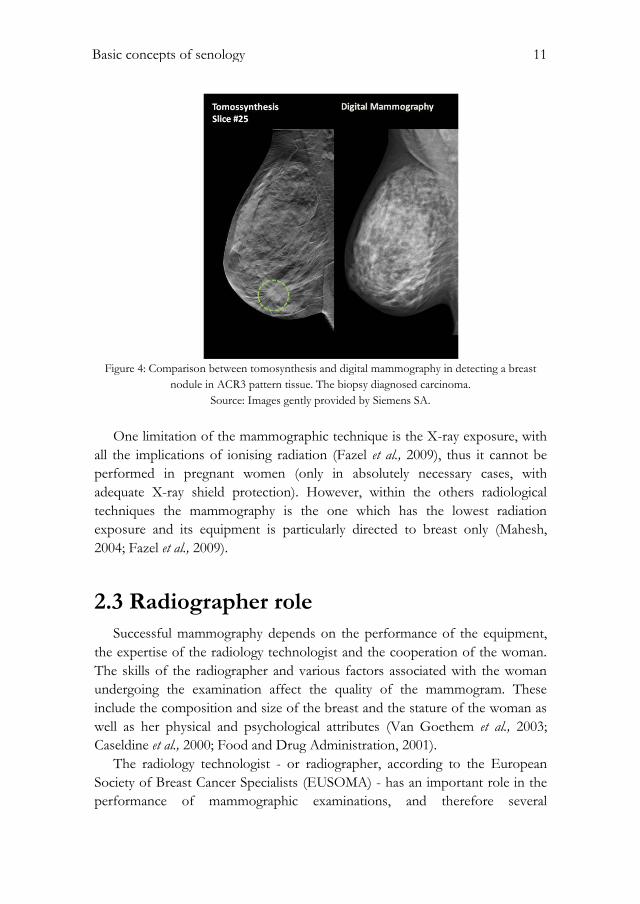
more sensitivity (Figure 4) (Park et al., 2007).
Basic concepts of senology 11
Figure 4: Comparison between tomosynthesis and digital mammography in detecting a breast
nodule in ACR3 pattern tissue. The biopsy diagnosed carcinoma.
Source: Images gently provided by Siemens SA.
One limitation of the mammographic technique is the X-ray exposure, with
all the implications of ionising radiation (Fazel et al., 2009), thus it cannot be
performed in pregnant women (only in absolutely necessary cases, with
adequate X-ray shield protection). However, within the others radiological
techniques the mammography is the one which has the lowest radiation
exposure and its equipment is particularly directed to breast only (Mahesh,
2004; Fazel et al., 2009).
2.3 Radiographer role
Successful mammography depends on the performance of the equipment,
the expertise of the radiology technologist and the cooperation of the woman.
The skills of the radiographer and various factors associated with the woman
undergoing the examination affect the quality of the mammogram. These
include the composition and size of the breast and the stature of the woman as
well as her physical and psychological attributes (Van Goethem et al., 2003;
Caseldine et al., 2000; Food and Drug Administration, 2001).
The radiology technologist - or radiographer, according to the European
Society of Breast Cancer Specialists (EUSOMA) - has an important role in the
performance of mammographic examinations, and therefore several

12 Basic concepts of senology
requirements related to this knowledge field must be taken into account,
beyond the radiation exposure, the positioning techniques and the equipment
used. Image quality assurance and interpretation of mammographic images,
additional imaging techniques and the localization and biopsy techniques for
impalpable lesions are other important issues for a good professional
performance (Cataliotti et al., 2007; Perry, 2001; Caseldine et al., 2000).
The radiographer is part of a multidisciplinary team, whether in screening or
in diagnosis and intervention environment, making him be aware of the clinical
information as well as previous breast exams of the patient. Also, it is important
that the radiographer establishes a direct contact with the radiologist in order to
transmit relevant information and therefore guide and contribute to a proper
diagnosis. The radiographer is also responsible for the availability and
accessibility of images (Cataliotti et al., 2007; Perry, 2001).
Beyond these technical issues, the radiographer is usually the first
professional to be consulted by women in primary health care needs, at the
time of breast cancer screening, and therefore he should be able to answer
questions about the examination and the implications of its results, if the
patient asks. Moreover, the correct understanding of Senology concepts such as
breast cancer statistics and family history, and the knowledge of breast disease
symptoms and treatment options are also important. Also the examination
demands a fair degree of sensitivity of the radiographer, since this is an exam
that causes great anxiety for most women (Cataliotti et al., 2007; Van Goethem
et al., 2003).
This role extension is needed in order to fulfil the ultimate goal of
decreasing the mortality rate of breast cancer and thus improving the health
care needs (Caseldine et al., 2000; Perry et al., 2006).
2.4 The need for continuing education
In order to improve their professional competences, education and training
programmes are demanded for radiographers. Both Food and Drug
Administration (FDA) and EUSOMA declare that to work in mammography
radiographers must have professional certification and at least 40 hours of
mammography specific training (Cataliotti et al., 2007; Food and Drug
Administration, 2001).
For senology there are training programmes, for example the NHS Breast
screening program (NHSBSP) developed in 2000, which provides a framework

Basic concepts of senology 13
for radiographers to develop their performance in all areas inside senology, with
specific training centres and associated universities (Caseldine et al., 2000) . The
Australian Institute of Radiography (AIR) has a professional accreditation
program that ensures the necessary training to work as a health professional in
the country. In addition, since 1999 the same institution has a programme that
promotes continuing professional education, the Continuing Professional
Development (CPD), in order to help the “benefit practitioners, their patients
and the public through a better educated, better trained and more proficient
workforce” (AIR, 2011).
In general, there is a large interest of these professionals in acquiring
professional training and continuous education. Shanahan (2010) found that
94% of the Australian radiographers that collaborated in the study use the
Internet as a resource for self-learning. Additionally, these radiographers
showed to be receptive to new technologies and training. In Denmark,
Johansen & Brodersen (2011) described the Danish radiographers to be able to
upgrade their skills and get the role extension described above.
According to Norman et al. (2004), continuing education is defined as the
systematic maintenance, improvement and expansion of knowledge skills and
personal qualities in order to perform professional duties throughout his
working life. With this educational need, not only for health professionals but
also for health students, education and training programmes are required
(Schrader & Kldiashvili, 2008). In this field, other concerns must be taken into
account, namely available learning resources, the inherent costs for obtaining
professional training, such as travel, lodging expenses and registration fees for
events or conferences. In addition, it must be considered the time spent out of
the work, which represents an important factor in the decision process so as to
obtain knowledge and training in the health area, for both students and
professionals (Ruiz et al., 2006). Therefore, Masys (2002) claimed that is
increasingly necessary that these professionals are aware and familiar with
Information Technology (IT) so that they are in 'constant' continuing
education.

14 Basic concepts of senology

The eLearning system in higher education and professional world 15
3. The eLearning system in higher education and professional world
With the continuous technology development and global spread of
computer networks, in particular the Internet, new challenges emerge
constantly in several areas, namely in education. Increasingly the education
relies on computer resources to attract students through the multimedia
integration and interactivity, providing equal or even better results in the
knowledge dissemination and skills development when compared to the
traditional classroom learning method (Sun et al., 2008).
The eLearning or ‘learning through the Internet’ has emerged in the 1960s
and has become a promising alternative to the traditional face-to-face method,
helping not only the students but also professionals to move towards a vision
of lifelong and continuous learning (Liao & Hsieh, 2011). Regarding Healthcare
sector, the continuing education is necessary in order to obtain the highest
performance possible from professionals and thus providing better healthcare
services (A. Pinto et al., 2011). The National Health Service University (NHSU)
identified eLearning as a central strategic delivery mechanism for all its
professionals (Childs et al., 2005).
ELearning has then become one of the fastest-moving trends and aims to
provide a configurable infrastructure which integrates learning material, tools
and services. Moreover, the unique goal is to create and deliver training or
educational content in a quick, effective, and economical way, without requiring
too much IT knowledge. Besides, it gives the learner the opportunity of to
manage his own learning materials from the information resources. This
concept fits the constructivist learning theory, where learners search out and
create their own knowledge bases (Ruiz et al., 2006; R. D. Johnson et al., 2008).

16 The eLearning system in higher education and professional world
3.1 ELearning concepts
The “eLearning” expression can also be portrayed by e-learning, online
learning, web-based learning (WBL), distributed learning, computer-assisted
instruction or internet-based learning. Nowadays, all these expressions mean
the same: the use of Internet technologies to deliver a broad array of solutions
that enhance knowledge and performance, with a strong pedagogical effect
(Ruiz et al., 2006; McKimm et al., 2003).
Creating an eLearning system requires the development of four main
components:
1. A “digital learning object” which is defined as a collection of digital
contents organised in an ordered way, based on an educational
objective. Some examples include lessons, modules, tutorials and case-
based learning;
2. “Content management” is needed in order to make the teaching
material available to learners in a continuous way. Some examples
include storing, updating, delivery and maintenance of the software;
3. “Content delivery” is defined as the way the information is transmitted;
it can be either synchronous or asynchronous. Synchronous delivery is
related to real-time, where the information is received by all elearners
at the same time, and provide the opportunity to contact
instantaneously the teacher and other colleagues, e.g. through
videoconferencing and chat forums; this require the presence of the
elearner at the course at some specific date and time. Meanwhile,
asynchronous delivery transmits a self-instruction and learning,
offering the learner the opportunity to take his learning in an adaptive
and personalised way; it does not require the presence at any specific
instance; the teacher and learner communicate using e-mail or feedback
technologies, but not in real time;
4. Standardisation has become an increasing need for the creation of new
eLearning materials, in order to support the compatibility and usability
of the system across the various computer systems, facilitating the
widespread use of it (Ruiz et al., 2006; McKimm et al., 2003).

The eLearning system in higher education and professional world 17
3.2 Technology and tools
Several online courses are currently being offered. With the looming
development of Information Technology, there is much software that can be
used to implement eLearning systems, and offer many alternatives of
multimedia and interactive teaching solutions.
ELearning Web sites, email, blogs with education material, Wiki (a type of
web-site that allows users to easily edit and change its content, and thus features
the collaborative creation of content by several authors), discussion forums
(providing communication between the elearners and the teacher) and Learning
Management Systems (LMS) appear, in order to plan, organise and access a
specific learning process (A. Pinto et al., 2011; a Pinto et al., 2008; McKimm et
al., 2003). Among the various LMS, there is the Moodle (Modular object oriented
dynamic learning environment) platform, which is considered the most appropriate
LMS for the implementation of eLearning courses (A. Pinto et al., 2011;
McKimm et al., 2003; Núñez et al., 2011). Such technologies are valuable tools
for collaboration, interactivity, simulation, and self-testing.
3.3 Benefits and barriers
There are various references in literature about the benefits and barriers of
eLearning (McKimm et al., 2003; Ruiz et al., 2006; Wutoh et al., 2004). The
potential advantages are related to:
The ability to learn at any time from any location without having to
travel or spend time away from work;
Cost-savings – beyond medical literature there is strong evidence that
eLearning can result in significant cost-savings, sometimes higher than
50%, compared with traditional face-to-face learning. Savings are
related to reduced instructor training time, travel and labour costs,
reduced institutional infrastructure, and the possibility of expanding
programmes with new educational technologies;
An individualised approach that allow learners to skip information they
already know and move on to less familiar issues;
Learning delivery which increases the accessibility to information, and
ease of distribution (internet technologies allow the widespread
distribution of digital content to many users simultaneously anytime
and anywhere);

18 The eLearning system in higher education and professional world
The possibility of easily and quickly update content (updating
electronic content is easier than updating printed material).
Childs et al. (2005) stated that the institution, administrators and learners
find that multimedia eLearning enhances both teaching and learning. A
multimedia approach, which supports individual learning styles, may lead to
increased comprehension of the teaching contents. Moreover, outcomes
assessment should be included in the eLearning system design to determine
whether learning has occurred.
On the other hand, in literature there are some negative comments
concerning barriers to use eLearning techniques, such as time constraints and
ease of use (Baumlin et al., 2000; Komolpis & Johnson, 2002; Pinto et al.,
2008). Childs et al., (2005) presented a systematic review that include a
compilation of all the barriers found in literature concerning eLearning
systems, for students and health professionals, and suggested some adequate
solutions. These are described in Tables 1, 2 and 3.
Table 1: Organisational and economical barriers related to eLearning. Source: Childs et al., 2005.
Issue Barrier Solution
Organisational Time is needed to develop eLearning programs and to evaluate material;
No dedicated time for this purpose is made available;
Learners ask for the time consuming nature of eLearning, and how to manage their time properly;
Learners needed advice on organizing eLearning tasks.
ELearning needs to be integrated into all aspects of the institution and into the curriculum;
At the trainer level the collaboration between content, pedagogy and technology must be ensured;
Need of incentives for trainers;
Trainers need time to master the technology, to convert materials and to prepare teaching sessions;
Learners need flexible eLearning that can suit their individual work-life balance.
Economical There is a need for cost effectiveness/cost benefit evidence;
Learners are concerned about the costs of courses and the requirements needed;
If learners are required to pay then sufficient materials need to be provided to justify it.
Evidence for the true costs of eLearning and associated cost-effectiveness and cost benefits;
Cheap or free courses and materials, although paying up front may contribute to a higher involvement of the learner in the outcome of the contents.

The eLearning system in higher education and professional world 19
Table 2: Barriers of eLearning relative to hardware, software and support issues. Source: Childs et
al., 2005.
Issue Barrier Solution
Hardware and
Software
Costs, specially concerning software licenses;
Lack of, or inadequate, technology at both work and home, e.g. computers, printers, applications, internet access, access speed;
Technology can be poorly concerning transportability and compatibility problems;
Learners experience technical and practical problems with hardware and software.
National approach of delivery channels and broadband strategy;
Appropriate location of equipment;
Suggestions on effective use of specific items of hardware should be available;
Hardware needs to be reliable;
Learners need an easy access to computers, and to be comfortable in using them;
Evaluation and feedback of the equipment and software.
Support Lack of technical support staff;
Lack of suitable support materials;
Learners may need support from their trainer the needed feedback may be lacking;
Hardware and software support can be costly.
Continuous technical support;
Quick solutions to technological problems;
Access to technical expertise;
Trainers need to provide support for learners, including information, guidance and feedback.
Table 3: Pedagogical, phychological and skills barriers in eLearning. Source: Childs et al., 2005;
Clark, 2002.
Issue Barrier Solution
Pedagogical Some eLearning packages have poor
quality, and are inappropriate or insufficient for the task;
Creation of myths including: it is a passing fad; it is only for knowledge acquisition; it is ineffective and inefficient; ‘the lonely learner’; ‘the redundant teacher’; ‘technology is king’; ‘an unrealistic dream’.
Standardisation;
Integration into the curriculum;
Regular evaluation and feedback;
Accreditation and outcomes should be equivalent to traditional methods;
Demystifying the myths by evaluating effectiveness and efficiency.
Psychological Resistance to change;
“Technophobia” (lack of IT confidence);
Negative views of the value of eLearning
Preference for personal contact;
How to motivate trainers to undertake eLearning.
A blended approach mixing face-to-face with eLearning methods;
Trainers need to provide a safe environment for failure;
Learners can learn from mistakes in an informal atmosphere;
Integration into the curriculum.
Skills Trainers lack appropriate skills and
need training;
Learners need skill training in computers use and the Internet.
Promote training in IT skills, eLearning techniques and management skills;
Establish a policy so learners can take either a basic computer literacy course or demonstrate computer skills as requirement for admission to the eLearning course;
Develop user friendly interfaces.

20 The eLearning system in higher education and professional world
3.4 Evaluation: related literature
The potential eLearning advantages described above may not translate into
significant improvements in educational outcomes (Chumley-Jones et al., 2002).
So, as with any new implementation project, eLearning needs to be justified by
its effectiveness and relevance. This evaluation requires the students’
participation and the professionals involved in the training and the education
programmes (Wutoh et al., 2004).
An evaluation should help making the learning experience more efficient
and effective and its feedback is used to improve the system. Before conducting
an evaluation it is important to define what is going to be investigated and how
this is going to be achieved (Horton, 2001). Crompton (1992) suggested a
checklist to plan the evaluation procedure in order to fulfil all the requirements
of its process (see Table 4).
Table 4: Evaluation Checklist. Source: (Aitken & Tabakov, 2005; Crompton, 1992).
Who?
(Know your target audience)
Who is the evaluation for?
What?
(Understand what is to be evaluated)
Process
Outcome
Combination of both
Purpose
Why?
(Rational for evaluation)
To improve quality
To determine if aims are fulfiled
To prove accountability
When?
(Timing – being ready to start)
Have you defined a question?
Will the findings have any effect?
Benefits outweigh costs
How?
(Choosing an appropriate technique)
Questionnaires
Interviews
Confidence logs
Observations
Student profiles
Pre-tests and post-tests
Inventory learning checklists

The eLearning system in higher education and professional world 21
One of the best methods considered in literature to evaluate a learning
system is the framework developed by Kirkpatrick (Alliger & Janak, 1989). It
consists of four categories from level 1 - the easiest and least resource-intensive
- to level 4 - the most difficult and expensive. Moving from level 1 to 4, the
evaluation process becomes more difficult and time-consuming, although it
provides information of increasingly significant results. Each successive level of
evaluation stays upon of the previous level.
The four levels are outlined in Table 5 and described below.
Level 1: Reaction. This can be the easiest assessment but also reveals
the importance and impact that the eLearning system could have. This
level measures how learners react to learning, gaining knowledge about
whether the learners enjoyed the training and if it was relevant to their
work. In fact, positive learner’s reactions do not ensure that objectives
are met, but negative reactions guarantee a less successful transfer of
knowledge and skills, and reduce the possibility of learning. Evaluation
tools for this level include programme evaluation sheets, interviews,
learners’ comments throughout the training and the course’s ability to
keep learner’s interest (Aitken & Tabakov, 2005; Horton, 2001);
Level 2: Learning. At this level is assessed whether learner’s
knowledge and/or skills are changed by the eLearning programme.
Evaluation methods range from self-assessment to team assessment;
examples include individual pre and post-training tests for
comparisons, assessment of action based learning such as work-based
projects and role-plays, and observations and feedback from peers,
managers and instructors. Ruiz et al. (2006) stated that the best
evaluation method at this level is to conduct an experimental study, in
which the learners are divided into two similar subgroups. Prior to the
intervention (the eLearning system), both subgroups can be tested on
the topics of interest during a pre-test, performing equally. Then only
one of the subgroups, the experimental one, is subject to the
intervention. After that, both subgroups are retested with a post-test. If
the experimental group now performs better than the control group,
the eLearning system can be identified as the cause of the
improvement;
Level 3: Behaviour. At this level, the question whether the training
has been transferred back to the job or not is trying to be answered.
This evaluation is typically performed three to six months after
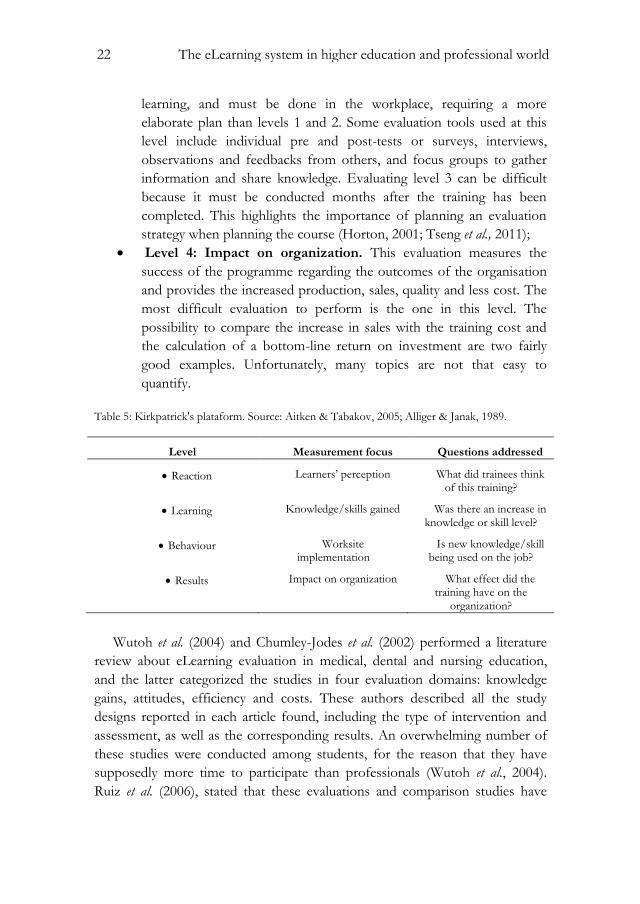
22 The eLearning system in higher education and professional world
learning, and must be done in the workplace, requiring a more
elaborate plan than levels 1 and 2. Some evaluation tools used at this
level include individual pre and post-tests or surveys, interviews,
observations and feedbacks from others, and focus groups to gather
information and share knowledge. Evaluating level 3 can be difficult
because it must be conducted months after the training has been
completed. This highlights the importance of planning an evaluation
strategy when planning the course (Horton, 2001; Tseng et al., 2011);
Level 4: Impact on organization. This evaluation measures the
success of the programme regarding the outcomes of the organisation
and provides the increased production, sales, quality and less cost. The
most difficult evaluation to perform is the one in this level. The
possibility to compare the increase in sales with the training cost and
the calculation of a bottom-line return on investment are two fairly
good examples. Unfortunately, many topics are not that easy to
quantify.
Table 5: Kirkpatrick's plataform. Source: Aitken & Tabakov, 2005; Alliger & Janak, 1989.
Level Measurement focus Questions addressed
Reaction Learners’ perception What did trainees think of this training?
Learning Knowledge/skills gained Was there an increase in knowledge or skill level?
Behaviour Worksite implementation
Is new knowledge/skill being used on the job?
Results Impact on organization What effect did the training have on the
organization?
Wutoh et al. (2004) and Chumley-Jodes et al. (2002) performed a literature
review about eLearning evaluation in medical, dental and nursing education,
and the latter categorized the studies in four evaluation domains: knowledge
gains, attitudes, efficiency and costs. These authors described all the study
designs reported in each article found, including the type of intervention and
assessment, as well as the corresponding results. An overwhelming number of
these studies were conducted among students, for the reason that they have
supposedly more time to participate than professionals (Wutoh et al., 2004).
Ruiz et al. (2006), stated that these evaluations and comparison studies have

The eLearning system in higher education and professional world 23
limitations, especially because the variability of the research design and the
evaluation tools used, resulting in inconsistent results for many outcomes.
Concerning knowledge gains, the most common research design was the pre
and post-tests self controlled study, with multiple-choice test scores, which
results showed significant improvements after WBL intervention; there were
also semi experimental and randomised controlled trials (RCTs) whose WBL
intervention was given to a group while the other group had no intervention or,
on the other way, had traditional training, such as classroom or a combination
of WBL and traditional learning. Generally, authors found that WBL is superior
to no education method (as in Stark et al., 2011), but equivalent to traditional
education method (as in Nkenke et al.,2012); alternatively, WBL proved to be
more effective when combined with traditional learning (as in Núñez et al.,
2011), although there are three studies that found no differences in exam scores
(Perryer et al., 2000; AJ et al., 2001; Komolpis & R. a Johnson, 2002). Nkenke et
al. (2012) and Mahnken et al. (2011) recognised that eLearning should be a
contribution and a complement for education and not a replacement for face-
to-face learning.
Regarding learner’s attitudes, there is a strong evidence that learners prefer
WBL to other educational methods – in Ludlow & Platin (2000) 71% of
students preferred WBL - and claim for higher user’s satisfaction. The
specifications of an eLearning system for user’s satisfaction evaluation related
to web technology are: accessibility, navigation (specially downloads speed) and
attractiveness (Sun et al., 2008).
There are very few studies about efficiency and costs of eLearning
programmes. Bell et al. (2000) performed a RCT to compare eLearning to text-
based learning and reported that learners achieved equivalent test scores with
shorter time using WBL contents. On the other hand, Komolpis & Johnson
(2002) through a RCT did not find differences between mean test times
between conventional and web-based groups. Regarding costs, Cimino et al.
(1995) resumed that the printing and distribution of educational materials is less
costly than creating and disseminating e-learning content; however they
assumed that hardware, software and other equipment were available and they
did not consider study design costs. There is a need to determine whether lower
distribution costs offset the costs of technical support, and whether eLearning
systems saves or costs money in terms of faculty time (Chumley-Jones et al.,
2002).
Both authors admitted that there is no evidence that students learn more
from WBL than traditional learning, but they can learn more effectively and

24 The eLearning system in higher education and professional world
WBL combined with traditional learning is the best way to obtain better gain
knowledge. They also refer that is crucial to have more RCTs in order to get
more strong evidence, especially in the efficiency and costs domains.
Study design and methodology 25
4. Study design and methodology
In order to promote a better knowledge about senology and Mammography,
and according to the recent learning and educational trends described in the
previous chapters, an asynchronous eLearning system was developed
specifically to radiographers and health professionals who get in touch with this
area.
The course was intended to be evaluated for its efficacy and effectiveness,
according to evaluation levels 1 and 2 from Kirkpatrick’s framework (Alliger &
Janak, 1989), through a RCT, using as instruments individual satisfaction
questionnaires and pre and post-knowledge tests for further comparisons,
respectively.
4.1 Target population
The target population in this study was radiographers and radiology
students. The radiographers who were contacted work at public health
institutions that perform breast cancer screening and diagnosis, surrounding the
Porto’s city area. The students are attending the 3rd and 4th years of the
radiology course, enrolled in the present academic year (2011-2012), students at
the Escola Superior de Tecnologia da Saúde do Porto, who already had mammography
training.
4.2 Sampling strategy and recruitment
The sample was stratified by “professional status” – students and
radiographers. The public institutions in Porto’s city area were filtered from a

26 Study design and methodology
list of radiology public institutions of Porto’s metropolitan area that was
obtained from a Portuguese source, namely Administração Regional de Saúde do
Norte website, a National Health Service institution.
The target population described above was invited to participate in the
study, through their email contact.
In respect to radiographers, in order to obtain the email contact of each
individual, it was asked individually, by telephone or email to each public
institution, since a public list of radiographers it is not available. It was
requested to the Coordinator’ radiographers the permission to ask the email
contacts of the radiographers. In the event of failure to contact each one of
them, it was suggested that the Coordinator could disseminate the study and
everyone who was interested in participating was invited to provide the email
contact.
Regarding students, email contacts were obtained through their personal
records, available at Secretaria Online, an online framework which gathers
information about all students and professors from the institution.
4.3 Randomisation
After the sample strategy, it was asked to radiographers and students to
perform the pre-test.
Randomisation was performed with the number of elements in each group
who accepted and effectively took the pre-test. Therefore, 50% of the elements
of each group were randomly selected and contacted to participate in the
intervention. Randomisation was performed using IBM SPSS Statistics®
software, version 17.0. The remaining sample was subsequently contacted to
participate in a second test.
4.4 Implementation
It was sent an email with a diagnostic test concerning Mammography and
Breast Cancer to those who have been contacted. This diagnostic test
corresponds to the pre-test. For instance, if there is no response within seven
days from the request for collaboration, another attempt is made, by sending a
second email with a new request, and then after seven days a third one is sent if
there is still no response. Finally, after seven days have elapsed from the date of

Study design and methodology 27
the third e-mail and a reply is not received, the individual participants under
discussion are not included in the study.
After 21 days, the sampling was randomly divided into two groups. The
intervention group is contacted in order to perform the online course, and a
similar process to pre-test enrolment occurred; after 21 days if there is no
response the individual under discussion was not allocated to intervention. A
private access of 20 days period was defined to those that accepted to perform
the course in an asynchronous way, through an individual login and password.
After this time it was given a final assessment test to be answered within 5 days.
On the other hand, the control group is contacted after 41 days to make
another diagnostic test. Those who were not allocated to intervention and those
who did not conclude the course were requested to perform the post-test, thus
following the intention-to-treat analysis. The study design is shown trough a
diagram in Figure 5.
It was given individual code identification to each participant to further
comparison between pre and post-tests. The same code was used to access the
online course as username, for those who were allocated to intervention. It was
asked to all participants to answer in honest manner, without consulting
external sources.
Figure 5: Study design: randomisation and implementation. The interval days that are shown
correspond to the maximum period for each phase.
Captions: N: Total participants assessed; N1: Radiographers assessed; N2: Students assessed; O1:
pre-test; n1: technologist enrolled; n2: students enrolled; R1: randomised intervention group; R2:
randomised control group; X: intervention; O2: post-test.

28 Study design and methodology
4.5 Pre and post-tests
Each test was structured with eight different multiple-choice questions
related to the course modules: the first two questions were related to the
anatomy and physiology of the breast, the third and fourth questions addressed
breast cancer and multidisciplinary approach, the fifth and sixth questions
concerned breast pathology and the last two questions were related to
radiological technique.
All the questions were different and had the same level of difficulty. To
ensure this condition, a pilot study was made and described below. The
technology that was used to provide this evaluation tool to the individuals was
GoogleDocs®, a free web-based office suite and data storage service offered by
Google.
4.5.1 Pilot study
A convenience sample of eight radiographers agreed to participate in a pilot
study to ensure that all questions presented in pre and post tests had the same
level of difficulty. It was asked to all participants to answer in a honest manner,
without consulting external sources.
This study comprised two phases; in the first step four individuals received
one test, and the other four received the other test. The random delivery of the
tests was accomplished, highlighting the independence of the questionnaires in
relation to be the first or the second test to be answered. Then, in a second
step, when an individual submitted the answers 24 hours later, the other test
was sent. This pilot study was made between 18th February and the 1st March
2012.
The focus of the data analysis was to determine whether there was a
significant difference between the questions presented in the first and the
second tests. For this observation, we used paired Wilcoxon tests to compare
the number of incorrect answers of each individual between the first and the
second test. As the questions are organised by themes, related to the modules
of the course, the tests were also organised for each set of questions. The
statistical analysis was performed using IBM SPSS Statistics® software version
17.0, and the considered significance level was 5%.

Study design and methodology 29
4.5.2 Final format
Through the data analysis, we can conclude that there are no differences
among the modules in one test and the other: module 1 (p=0.083), module 2
(p=0.096), module 3 (p=1.000) and module 4 (p=0.317). However, some
questions and multiple choices were readjusted in order to make them clearer.
Also, a question concerning the definition of specificity was decided to be
kept in the two tests, replacing a question in one of the tests. This option was
because 86% of the individuals did not answer correctly and therefore it can be
an indicator of knowledge increase due to the intervention.
The tests also included questions about demographic information such as
age, gender, academic qualifications, years of professional experience and
routine mammography, and it was also assessed the need for continuing
education as well as the receptivity of eLearning programmes in any topic of
professional interest.
The final pre and post-tests can be seen in Appendix 1.
4.6 The Course description
4.6.1 Course’s characteristics
The course was developed between October 2011 and January 2012 and
was written in Portuguese language. The instructions for conducting the course
were available on the website, along with a glossary, and it was structured into
four modules, taking in consideration the following topics described in Table 6.
The presentation of the contents comprised text, images, videos and
presentations using Prezy®, a free web-based presentation software. Diagnostic
images were collected directly from the Breast Centre at the Centro Hospitalar S.
João, EPE (CHSJ)1, accordingly with the proper authorisation from the Breast
Centre medical chairman and the Radiology Department chairman. The
contents were reviewed by specialists from the proper institution.
The images appear anonymised and isolated only in the context of the
course, to illustrate examples of various types of mammographic patterns of
breast tissue and benign and malignant lesions, without any association with
data from patients who can identify them.
1 Previoulsy known as Hospital S. João (until April 2011).
30 Study design and methodology
Table 6: Course's main contents.
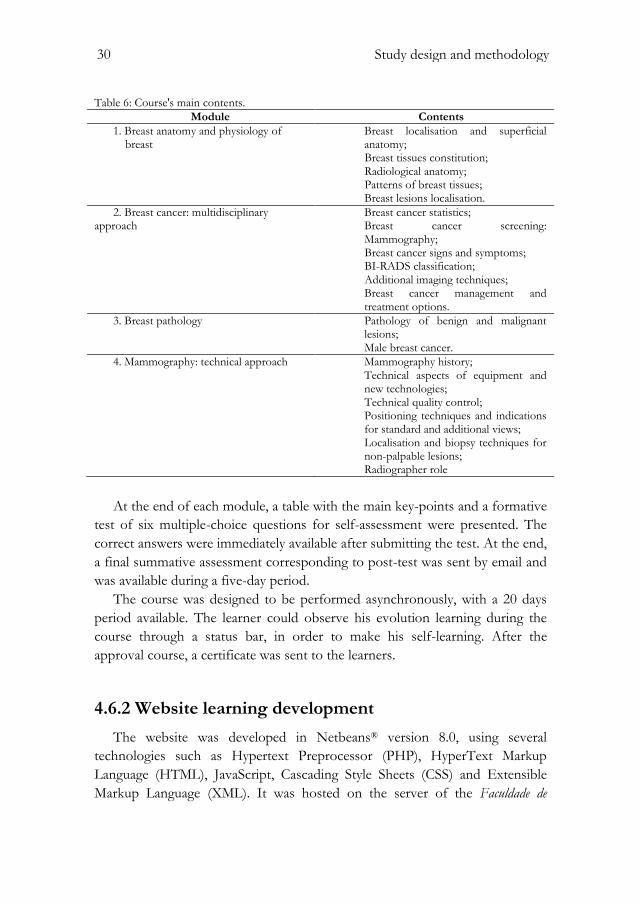
Module Contents
1. Breast anatomy and physiology of breast
Breast localisation and superficial anatomy; Breast tissues constitution; Radiological anatomy; Patterns of breast tissues; Breast lesions localisation.
2. Breast cancer: multidisciplinary approach
Breast cancer statistics; Breast cancer screening: Mammography; Breast cancer signs and symptoms; BI-RADS classification; Additional imaging techniques; Breast cancer management and treatment options.
3. Breast pathology Pathology of benign and malignant lesions; Male breast cancer.
4. Mammography: technical approach Mammography history; Technical aspects of equipment and new technologies; Technical quality control; Positioning techniques and indications for standard and additional views; Localisation and biopsy techniques for non-palpable lesions; Radiographer role
At the end of each module, a table with the main key-points and a formative
test of six multiple-choice questions for self-assessment were presented. The
correct answers were immediately available after submitting the test. At the end,
a final summative assessment corresponding to post-test was sent by email and
was available during a five-day period.
The course was designed to be performed asynchronously, with a 20 days
period available. The learner could observe his evolution learning during the
course through a status bar, in order to make his self-learning. After the
approval course, a certificate was sent to the learners.
4.6.2 Website learning development
The website was developed in Netbeans® version 8.0, using several
technologies such as Hypertext Preprocessor (PHP), HyperText Markup
Language (HTML), JavaScript, Cascading Style Sheets (CSS) and Extensible
Markup Language (XML). It was hosted on the server of the Faculdade de
Study design and methodology 31
Medicina da Universidade do Porto, and its content was transferred by File Transfer
Protocol (FTP). Regarding website security, it was guaranteed through an
authentication mechanism with username and password.
The data of the eLearners, as well as their evolution during the course and
the answers given in the intermediate tests were recorded in XML files. The
user through a progress bar that updates dynamically could consult this
evolution at any time. The intermediate tests allowed immediate consultation of
its results shortly after its performance. In addition, all references were made
available through direct links inserted on the corresponding page.
The user was only allowed to click in a new page of the course if he had
already consulted the immediately preceding page. This check led to a
progressive way of the course performance, thus being an essential point for a
correct learning. The forward or backward options to any page already
consulted were however allowed.
4.7 Assessment of outcomes
The course was intended to be evaluated as described below.
4.7.1 Main outcomes
For the purpose of evaluating the course for its efficacy (level 2 from
Kirkpatrick’s framework), the primary outcome under study was the evolution
in the knowledge observed between pre-test and post-test for those who were
allocated to intervention, through the assessment of the percentage of correct
answers in each test and further comparison with the control group.
In order to assess the learner’s perception (level 1) a satisfaction
questionnaire was given to participants who performed the course; for instance,
to assess its effectiveness it was observed the number of participants who
discontinued the intervention.
4.7.2 User’s satisfaction questionnaire
There are many studies in literature about user’s satisfaction in eLearning
systems, and therefore there are several user satisfaction questionnaires. One of
the most cited in literature is the one performed by Wang (2003), who
considered four factors to fulfil the eLearner satisfaction measurement –
content, learner interface, personalization and learning community.

32 Study design and methodology
The satisfaction instrument developed by Wang consists in 26 items related
to the abovementioned factors, using a seven-point Likert-type scale, with
anchors ranging from “strongly disagree” to “strongly agree”. The latter two
questions reflect the two global measures related with overall satisfaction and
success of the eLearning system. The questionnaire was shown as a reliability
(Cronbach alpha) of 0.95 (Wang, 2003; Chen et al., 2011).
For our study purpose and considering the inexistence of a questionnaire in
Portuguese language, a bilingual expert translator carried out the translation of
the questionnaire proposed by Wang. In addition, it was asked if participants
had already any eLearning experience before, and if it was related to health area.
The original questionnaire and corresponding translation can be found in
Appendix II and III, respectively.
4.7.3 Statistical analysis
The statistical analysis was performed according to the intention-to-treat
condition, involving all the participants allocated to intervention whether they
have not agreed to take part or even have not completed the whole course.
To test the normality of the sample, Kolmogorov-Smirnov test (Marsaglia et
al., 2003) was used for the total sample and subsequently the Shapiro-Wilk test
(Shapiro & Wilk, 1965) to each group analysis, beyond the visual analysis of
histograms with normal curve.
To describe the sample it was used measures of central tendency, as the
average (µ) for the variable “evolution” and the median (Md) for the others;
and dispersion, such as confidence intervals (CI) and percentiles 25 and 75 (P25
and P75), respectively.
To analyse possible relations between variables it was used the Pearson’s
correlation coefficient for continuous variables (Rodgers & Nicewander, 1988)
and Spearman’s correlation coefficient for discrete variables (Corder &
Foreman, 2009).
To compare possible gain in knowledge between pre-test and post-test
(corresponding to the percentage of correct answers) inside each group a paired
analysis was conducted through the variable “evolution”, which is the
difference between pre and post-test percentage of correct answers.
For the two groups’ comparison, in order to verify the homogeneity
between them, it was used the following analysis:
- The Mann-Whitney U test for independent samples (Kruskal, 1957) to
verify the homogeneity between the groups;
Study design and methodology 33
- The Student’s t-test for means for independent samples (Fisher Box,
1987) for the variable “evolution”;
- The Chi-square test (Corder & Foreman, 2009) to examine the
association between nominal variables. One of the conditions to use
this test is that each cell does not provide the expected frequencies
below one and more than 20% are expected frequencies lower than 5.
When this is not possible, we used Fisher's exact test (Fisher, 1922).
The variables were categorized into two values, when necessary.
For all this statistical analysis, we considered a significance level of 5%, and
it was used the IBM SPSS Statistics® software, version 17.0.

34 Study design and methodology

Results from the course’s evaluation 35
5. Results from the course’s evaluation
The course was created and revised between October 2011 and January
2012. The implementation of the study took place between the 7th March and
the 31st May, and the contacts have been obtained between the February 1st and
the 7th March. Globally were obtained 120 contacts from the radiographers and
70 from the students, resulting in a total sample of 190 individuals.
Following the same principle of the pilot study described in the previous
chapter, the delivery of tests was made randomly. After performing the pre-test,
we are left with 68 radiographers and 39 students, for a total of 107 individuals
enrolled. These individuals were then randomised, getting a total of 54 in the
intervention group (20 students and 34 radiographers) and 53 in the control
group (19 students and 34 radiographers). The average of time spent (measured
in days) between the answers obtained from the tests and the course’s
performance, can be observed in Figure 6.
Figure 6: Study design and post-implementation. The time-interval in days that is shown
corresponds to the average period of each phase.
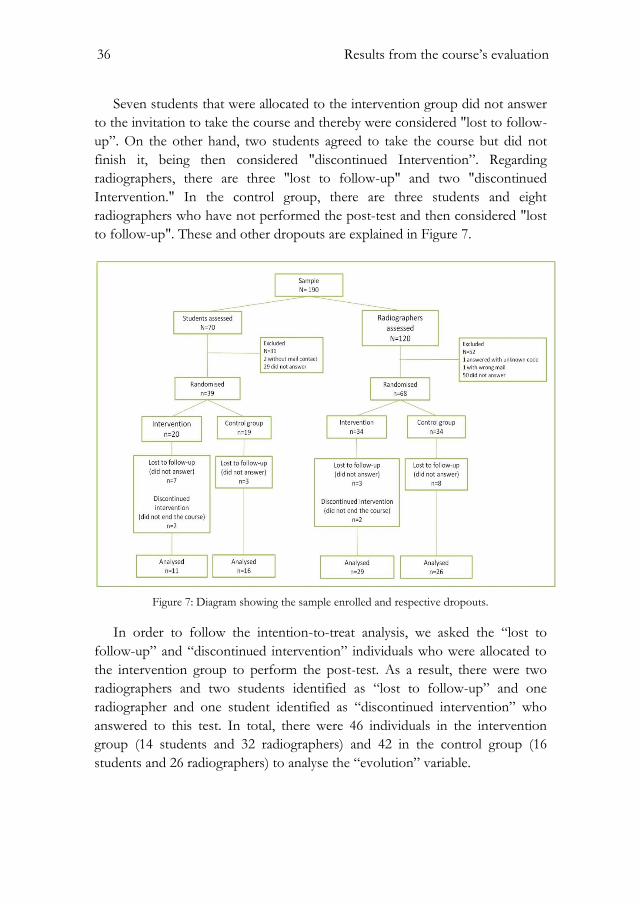
36 Results from the course’s evaluation
Seven students that were allocated to the intervention group did not answer
to the invitation to take the course and thereby were considered "lost to follow-
up”. On the other hand, two students agreed to take the course but did not
finish it, being then considered "discontinued Intervention”. Regarding
radiographers, there are three "lost to follow-up" and two "discontinued
Intervention." In the control group, there are three students and eight
radiographers who have not performed the post-test and then considered "lost
to follow-up". These and other dropouts are explained in Figure 7.
Figure 7: Diagram showing the sample enrolled and respective dropouts.
In order to follow the intention-to-treat analysis, we asked the “lost to
follow-up” and “discontinued intervention” individuals who were allocated to
the intervention group to perform the post-test. As a result, there were two
radiographers and two students identified as “lost to follow-up” and one
radiographer and one student identified as “discontinued intervention” who
answered to this test. In total, there were 46 individuals in the intervention
group (14 students and 32 radiographers) and 42 in the control group (16
students and 26 radiographers) to analyse the “evolution” variable.
Results from the course’s evaluation 37
5.1 Sample description
Considering demographic variables, globally within 107 individuals 39 (36%)
are students and 68 (64%) are radiographers, of whom 85 (79%) are female and
the remaining 22(21%) individuals are male; regarding radiographers, in the
control group there are more seven male individuals than in the intervention
group (p=0.041).
The median age for students is 21 years old (21; 22), and 33 years old (28;
40) for radiographers. Overall, 11 (10%) are 3rd year students, 28 (28%) are 4th
year students, 1 (1%) is identical due to professional experience, 8 (8%) have
bachelor degree, 54 (51%) are graduated and 5 (5%) have master's degree.
In the radiographers group, the median years of professional experience is
12 (5; 17); 21 (31%) individuals do not perform mammography, 36 (53%)
perform less than 30 per week, 4 (6%) perform between 30 and 40 per week
and 7 (10%) perform more than 40 per week.
Regarding the percentage of correct answers, in the pre-test there was a
failure rate of 14% (n=15). We observed that 51% (n=55) of the results were
between 50-75% and 35% (n=37) had better results than 75%. In the post-test,
the failure rate was of 7% (n=6), 31% (n=27) of the results were between 50-
75% and 62% (n=55) had better results than 75%.
Concerning the query of radiographers need for continuing education,
during their professional life, all radiographers answered positively; beyond 48
(71%) individuals showed to be receptive to eLearning programmes in any
topic of professional interest (19 (28%) answered “maybe” and 1 (2%)
answered “don’t know”).
The description of the sample dully stratified and divided into groups is
presented in Table 7.
5.2 Efficacy
As mentioned above, the efficacy was assessed according to the intention-
to-treat analysis. However, to better expose the results, we also considered the
per-protocol analysis, thus allocating the individuals that in the invention group
did not end or did not perform the course in the control group.
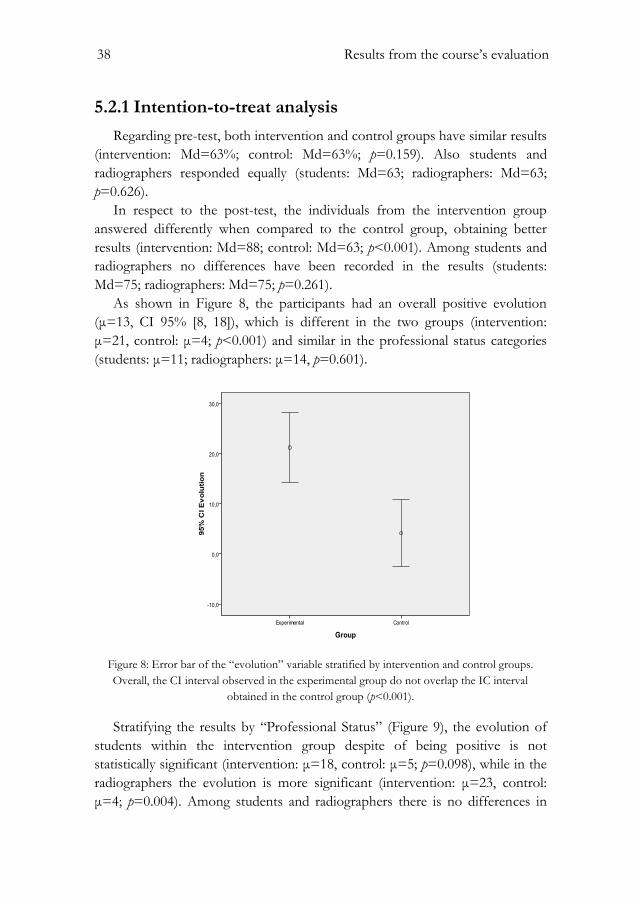
38 Results from the course’s evaluation
5.2.1 Intention-to-treat analysis
Regarding pre-test, both intervention and control groups have similar results
(intervention: Md=63%; control: Md=63%; p=0.159). Also students and
radiographers responded equally (students: Md=63; radiographers: Md=63;
p=0.626).
In respect to the post-test, the individuals from the intervention group
answered differently when compared to the control group, obtaining better
results (intervention: Md=88; control: Md=63; p<0.001). Among students and
radiographers no differences have been recorded in the results (students:
Md=75; radiographers: Md=75; p=0.261).
As shown in Figure 8, the participants had an overall positive evolution
(μ=13, CI 95% [8, 18]), which is different in the two groups (intervention:
μ=21, control: μ=4; p<0.001) and similar in the professional status categories
(students: μ=11; radiographers: μ=14, p=0.601).
Figure 8: Error bar of the “evolution” variable stratified by intervention and control groups.
Overall, the CI interval observed in the experimental group do not overlap the IC interval
obtained in the control group (p<0.001).
Stratifying the results by “Professional Status” (Figure 9), the evolution of
students within the intervention group despite of being positive is not
statistically significant (intervention: μ=18, control: μ=5; p=0.098), while in the
radiographers the evolution is more significant (intervention: μ=23, control:
μ=4; p=0.004). Among students and radiographers there is no differences in

Results from the course’s evaluation 39
the evolution both in the intervention group (students: μ=18; radiographers:
μ=23; p=0.531) and in the control group (students: μ=5; radiographers: μ=4
p=0.905).

40 Results from the Course’s Evaluation Table 7: Sample's description and comparison between groups. Acronyms and symbols: S – Students; R – Radiographers; G – Global; I – Intervention group; C – Control group; CI – Confidence Interval; P25 – Percentile
25; P75 – Percentile 75; ; ‡ Chi-Square test; †: Fisher’s exact test; ∆ - Mann Whitney’s test; * - T test Student.
Intervention
Control
Global
I vs C (p value)
S vs R (p value)
S
(n=20)
R
(n=34)
G
(n=54)
S
(n=19)
R
(n=34)
G
(n=53)
S
(n=39)
R
(n=68)
G
(n=107)
S
(n=39)
R
(n=68)
G
(n=107)
I
(n=54)
C
(n=53)
G
(n=107)
Age, median
(P25; P75)
21
(21;22)
31
(27;38)
27
(21;3)
21
(21;22)
37 (29;40) 29
(22;40)
21
(21;22)
33
(28;40)
28
(22;38)
0.390∆ 0.06∆ 0.124∆ <0.001∆ <0.001∆ <0.001∆
Professional Status,
n(%)
Student
Technologist
20 (37)
34 (63)
19 (36)
34 (64)
39 (36)
68 (64)
0.898‡
0.898‡
Sex, n(%)
Male
Female
2 (10)
18 (90)
4 (12)
30 (88)
6 (11)
48 (89)
5 (26)
14 (74)
11 (32)
23 (68)
16 (30)
37 (70)
7 (18)
32 (82)
15 (22)
53 (78)
22 (21)
85 (79)
0.235†
0.041‡ 0.015‡ 1.000† 0.646† 0.613†
Academic
qualifications, n(%)
3rd year
4th year
Equivalent
Bachelor
Graduation
Master
7 (35)
13 (65)
3 (9)
28 (82)
3 (9)
7 (13)
13 (24)
0
3 (6)
28 (52)
3 (6)
4 (21)
15 (79)
1 (3)
5 (15)
26 (77)
2 (6)
4 (8)
15 (28)
1(2)
5 (9)
26 (49)
2 (4)
11 (28)
28 (72)
1 (2)
8 (12)
54 (79)
5 (7)
11 (10)
28 (26)
1 (1)
8 (8)
54 (51)
5 (5)
0.333‡
Years of profession,
median
(P25; P75)
8
(4;17)
15
(7;17)
12
(5;17)
0.091∆
Routine
Mammography, n(%)
0
<30 per week
30-40 per week
>40 per week
12 (35)
16 (47)
3 (9)
3 (9)
9 (17)
20 (59)
1 (3)
4 (12)
21 (31)
36 (53)
4 (6)
7 (10)
1.000†
Pre-test, median
(P25; P75)
63
(63;75)
63
(50;75)
63
(50;75)
63
(50;63)
63
(50;75)
63
(50;75)
63
(50;75)
63
(50;75)
63
(50;75)
0.106∆ 0.509∆ 0.159∆ 0.544∆ 0.766∆ 0.626∆
n= 14 n= 32 n= 46 n= 16 n= 26 n= 42 n= 30 n= 58 n=88 n=30 n=58 n=88 n=46 n=42 n=88
Post-test, median
(P25; P75)
88
(72;100)
88
(88;100)
88
(75;100)
63
(50;75)
63
(59;75)
63
(50;75)
75
(63;88)
75
(63;88)
75
(63;88)
0.003∆ <0.001∆ <0.001∆ 0.596∆ 0.696∆ 0.261∆
Evolution, mean
(CI)
18
(5;30)
23
(14;32)
21
(14;28)
5
(-6;15)
4
(-5;13)
4
(-3;11)
11
(3;19)
14
(8;21)
13
(8;18)
0.098* 0.004* <0.001* 0.531* 0.905* 0.601*
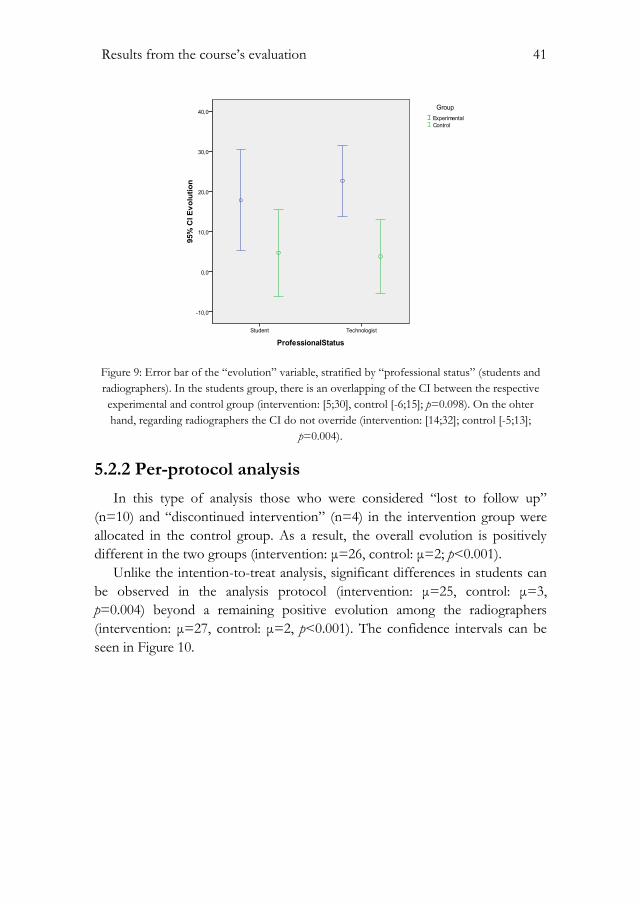
Results from the course’s evaluation 41
Figure 9: Error bar of the “evolution” variable, stratified by “professional status” (students and
radiographers). In the students group, there is an overlapping of the CI between the respective
experimental and control group (intervention: [5;30], control [-6;15]; p=0.098). On the ohter
hand, regarding radiographers the CI do not override (intervention: [14;32]; control [-5;13];
p=0.004).
5.2.2 Per-protocol analysis
In this type of analysis those who were considered “lost to follow up”
(n=10) and “discontinued intervention” (n=4) in the intervention group were
allocated in the control group. As a result, the overall evolution is positively
different in the two groups (intervention: μ=26, control: μ=2; p<0.001).
Unlike the intention-to-treat analysis, significant differences in students can
be observed in the analysis protocol (intervention: μ=25, control: μ=3,
p=0.004) beyond a remaining positive evolution among the radiographers
(intervention: μ=27, control: μ=2, p<0.001). The confidence intervals can be
seen in Figure 10.

42 Results from the course’s evaluation
Figure 10: Error bar of the “evolution” variable stratified by “professional status” (students and
radiographers) in the per-protocol analysis. The CI observed between the experimental and
control group in students do not overlap (intervention: [13;37]; control [-7;12]; p=0.004), in the
same way as radiographers (intervention: [19;35]; control [-7;10]; p<0.001).
5.2.3 Query regarding specificity
The query regarding the definition of specificity comprised the following
structure:
“The Mammography is considered the best screening exam for breast
cancer, because it has a high specificity, which means:
1. It is a painless and harmless exam to the women;
2. It has a good ability to detect cases without malignancy;
3. It has a good ability to detect a malignant lesion;
4. Allows better distinction of lesions in young women.”
The answer which was considered correct was b). Overall, the failure rate
associated to this query was 94% (n=100) in the pre-test and 55% (n=48) in the
pos-test, reflecting an improvement of 41% (p<0.001).
In the pre-test, 89 (83%) individuals selected the option c), concerning the
definition of sensitivity, and in the post-test there were 43 (40%) (intervention:
pre-test - 42 (78%) and post-test - 12 (22%); p<0.001; control: pretest – 48
(89%) and post-test - 31 (59%); p=0.125).

Results from the course’s evaluation 43
The students presented a failure rate of 95% (n=37) in the pre-test and 43%
(n=13) in the post test, thus reflecting an overall improvement of 43%. The
respective intervention group had a failure rate of 90% (n=18) in the pre-test
and 36% (n=5) in the post-test, thus reflecting an improvement of 64%.
Regarding the control group, the rate failure represented 100% (n=19) in pre -
test and 75% (n=12) in post-test, with an improvement of 25% (intervention vs
control: p=0.030).
The radiographers presented a failure rate of 93% (n=63) in the pre-test and
53% (n=31) in the post-test, presenting an overall improvement of 40%. In the
intervention group, there was a 91% (n=31) in pre-test and 25% (n=8) in the
post-test, thus reflecting an improvement of 66%, and in the control group the
failure rate was 94% (n=32) in the pre-test and 69% (n=18) in the post-test,
thus demonstrating an improvement of 7%. (intervention vs control: p<0.001).
Regarding the difference of improvement between the two professional
categories, were not found significant values.
5.3 Effectiveness and satisfaction
The majority of participants (81%) in the intervention group agreed to take
the course (13 students and 31 radiographers) and four (9%) did not attend the
full course, being considered “discontinued intervention” (two (10%) students
and two (6%) radiographers).
Every participant that concluded the eLearning course answered the
satisfaction questionnaire (n=40). The answers can be observed in Table 8.
Considering global measures (Q25 and Q26), 85% are satisfied with the
eLearning system and 88% consider that the system is successful (between six
and seven-point; students vs. radiographers: p=0.660).
Concerning content (Q1-Q4), 38 (95%) learners think that the system
provides useful, up-to-date and sufficient content. Regarding interface (Q5-
Q15), almost all the participants consider the system user-friendly, easy to use
and to understand.
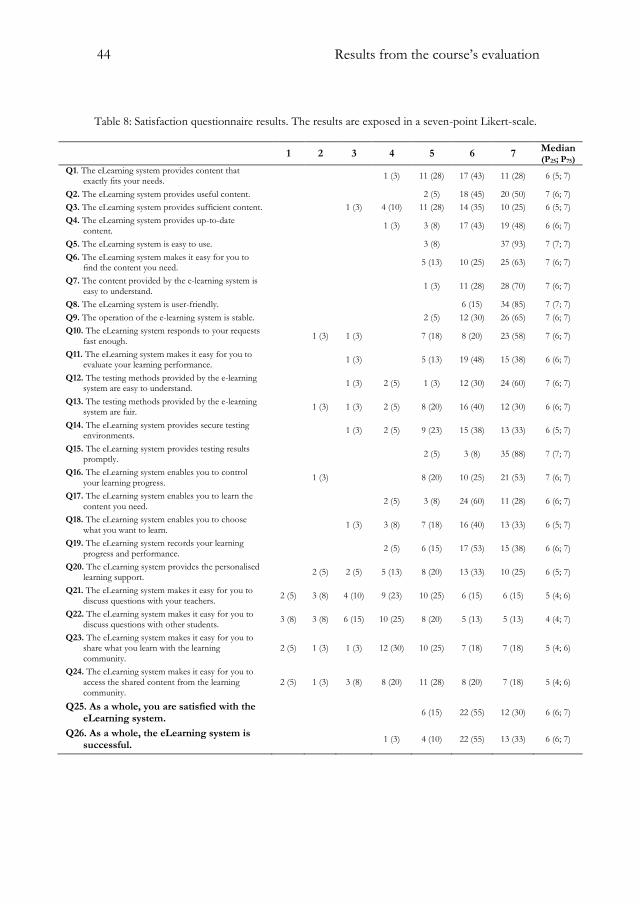
44 Results from the course’s evaluation
Table 8: Satisfaction questionnaire results. The results are exposed in a seven-point Likert-scale.
1 2 3 4 5 6 7 Median (P25; P75)
Q1. The eLearning system provides content that exactly fits your needs.
1 (3) 11 (28) 17 (43) 11 (28) 6 (5; 7)
Q2. The eLearning system provides useful content. 2 (5) 18 (45) 20 (50) 7 (6; 7)
Q3. The eLearning system provides sufficient content. 1 (3) 4 (10) 11 (28) 14 (35) 10 (25) 6 (5; 7)
Q4. The eLearning system provides up-to-date content.
1 (3) 3 (8) 17 (43) 19 (48) 6 (6; 7)
Q5. The eLearning system is easy to use. 3 (8) 37 (93) 7 (7; 7)
Q6. The eLearning system makes it easy for you to find the content you need.
5 (13) 10 (25) 25 (63) 7 (6; 7)
Q7. The content provided by the e-learning system is easy to understand.
1 (3) 11 (28) 28 (70) 7 (6; 7)
Q8. The eLearning system is user-friendly. 6 (15) 34 (85) 7 (7; 7)
Q9. The operation of the e-learning system is stable. 2 (5) 12 (30) 26 (65) 7 (6; 7)
Q10. The eLearning system responds to your requests fast enough.
1 (3) 1 (3) 7 (18) 8 (20) 23 (58) 7 (6; 7)
Q11. The eLearning system makes it easy for you to evaluate your learning performance.
1 (3) 5 (13) 19 (48) 15 (38) 6 (6; 7)
Q12. The testing methods provided by the e-learning system are easy to understand.
1 (3) 2 (5) 1 (3) 12 (30) 24 (60) 7 (6; 7)
Q13. The testing methods provided by the e-learning system are fair.
1 (3) 1 (3) 2 (5) 8 (20) 16 (40) 12 (30) 6 (6; 7)
Q14. The eLearning system provides secure testing environments.
1 (3) 2 (5) 9 (23) 15 (38) 13 (33) 6 (5; 7)
Q15. The eLearning system provides testing results promptly.
2 (5) 3 (8) 35 (88) 7 (7; 7)
Q16. The eLearning system enables you to control your learning progress.
1 (3) 8 (20) 10 (25) 21 (53) 7 (6; 7)
Q17. The eLearning system enables you to learn the content you need.
2 (5) 3 (8) 24 (60) 11 (28) 6 (6; 7)
Q18. The eLearning system enables you to choose what you want to learn.
1 (3) 3 (8) 7 (18) 16 (40) 13 (33) 6 (5; 7)
Q19. The eLearning system records your learning progress and performance.
2 (5) 6 (15) 17 (53) 15 (38) 6 (6; 7)
Q20. The eLearning system provides the personalised learning support.
2 (5) 2 (5) 5 (13) 8 (20) 13 (33) 10 (25) 6 (5; 7)
Q21. The eLearning system makes it easy for you to discuss questions with your teachers.
2 (5) 3 (8) 4 (10) 9 (23) 10 (25) 6 (15) 6 (15) 5 (4; 6)
Q22. The eLearning system makes it easy for you to discuss questions with other students.
3 (8) 3 (8) 6 (15) 10 (25) 8 (20) 5 (13) 5 (13) 4 (4; 7)
Q23. The eLearning system makes it easy for you to share what you learn with the learning community.
2 (5) 1 (3) 1 (3) 12 (30) 10 (25) 7 (18) 7 (18) 5 (4; 6)
Q24. The eLearning system makes it easy for you to access the shared content from the learning community.
2 (5) 1 (3) 3 (8) 8 (20) 11 (28) 8 (20) 7 (18) 5 (4; 6)
Q25. As a whole, you are satisfied with the eLearning system.
6 (15) 22 (55) 12 (30) 6 (6; 7)
Q26. As a whole, the eLearning system is successful.
1 (3) 4 (10) 22 (55) 13 (33) 6 (6; 7)

Results from the course’s evaluation 45
Regarding personalisation (Q16-120), 28 (70%) participants are satisfied
with the control the learning progress, activating the content that the learner
needs and choosing what the learner wants to learn. Also it records the learning
progress and performance. However, 12 (30%) learners disagree about the
personalised learning support. “Learning community” (Q21-Q24) was the
category which learners showed less satisfaction; 27 (68%) learners agree that
the eLearning system is not structured to facilitate knowledge sharing and
contents discussion by elearners with their teachers and colleagues.
Of the 40 elearners, 4 (10%) had previous eLearning experience, and 2 (5%)
performed it in the health area. However, the overall satisfaction did not differ
between these participants and those who had no previous experience of
eLearning (Q25: p=0.191; Q26: p=0.144). For all other questions only one
difference was found in Q11, concerning the evaluation of the learning process
(p=0.027).
46 Discussion
6. Discussion
According to the literature review aforementioned in Chapter 2, the
evaluation of eLearning systems has proved to be important for teaching and
learning quality assurance purpose in these systems, thereby promoting
eLearning at the expense of traditional method. Increasingly, the continuing
education is valued within the professional scope and it is a fact that eLearning
is increasingly sought and used, even in current days due to the budgetary
constraints and economic crisis we are facing.
In the various studies reported in literature, the evaluation of these systems
is based mainly on its efficacy and user satisfaction, filling the requirements for
the assessment of levels I and II of the Kirkpatrick‘s platform. In this project,
the same approach was performed through a randomized controlled trial. There
are some RCTs, but as aforementioned more studies are needed. Concerning
the senology area, only a few eLearning courses can be found (one Brazilian
and the others in English) but the respective evaluation methods and validation
were not encountered in literature. For this reason, a comparative analysis
between the results of the eLearning courses and our work cannot be carried
out.
Through the analysis of the results attainted and in respect to the
description of the sample we noticed that there are no statistically significant
differences between control and intervention groups, which highlight the effect
of randomisation. Regarding students and radiographers, besides age and
academic qualifications, we did not find significant differences, which lead us to
conclude that it was not necessary to stratify the sample. After studying the
association between variables it was verified that there was no significant
relationship between them.
Applying the “intention-to-treat” analysis overall it was observed an
improvement of 21 percentual points (pp) due to the course performance. The
evolution in students was not statistically different between the control and the
intervention groups. Although the effect was not clear in students (intervention:
Discussion 47
18pp vs control: 5pp; p=0.098), we found differences in post-test results
between intervention and control (88% vs 63%; p=0.003) whereas such
difference was absent in pre-test (63% vs 63%; p=0.106). This result could be
explained by the fact that not all students that performed the pre-test did the
post-test, being seven students in the intervention and three in the control
group considered “lost to follow-up”. In addition, probably some students can
achieve more knowledge by self-learning or that there was interest from
students in the control group in learning more after performing the pre-test.
Regarding the radiographers, those who were allocated to the intervention
group have acquired better results at the post-test (23pp vs 4 pp), which can be
explained by the positive evolution observed after the course performance. This
reveals the importance of continuing education throughout their working lives.
The per-protocol analysis enhances the influence of the course, exposing a
notorious effect on the students’ group. Considering that the real course effect
is probably in between the two statistical analysis, we can conclude that this
RCT showed that the course is efficacious, since it brought improvement of
knowledge to those who attended part of the intervention group.
Considering that the correct definitions of sensitivity and specificity are an
important factor for a correct diagnosis of breast cancer and given that the
radiographer participates in this process, it is essential to be aware about these
definitions, as well as awareness of their role. Through this study we observed
that a large number of students and radiographers failed in the definition of
these terms. In this thesis the definitions were stated in accordance with the
literature review in line with to Kavanagh et al. (2000) and FMUP (2004) in
which the authors consider that mammography have a high sensitivity and
specificity. However, recent studies have demonstrated that the specificity is
lower in denser breasts (Ravert & Huffaker, 2010).
Beyond the fact that the course is efficacious, this RCT also demonstrated
to be effective. In fact, only a minor percentage of the participants did not
complete the course and those who concluded it revealed to be very satisfied
with the eLearning system, across the satisfaction questionnaire. Concerning
this topic, the success of the course has been shown mainly at the “interface”
and “content” topics with a high degree of satisfaction, rather than in the topic
of “learning community” which has a low degree of satisfaction. The
construction design of the course consisted of an asynchronous eLearning
system, simple and user friendly, not taking into consideration a teacher-student
and student-student interaction; hence we can consider the low level of
satisfaction in this segment as an expected result.

48 Discussion
During this work we have encountered some situations that may be
considered as limitations or biases to obtain the described results. In fact, if the
time was not a constraint we could have extended the sample, and even
designed a more complete course, thus possibly obtaining more significant
results. In addition, user satisfaction questionnaires for the eLearning systems
shown a lack of validation concerning the Portuguese language, however due to
deadlines and timescales this procedure was not performed. Nevertheless, it
should be noted that it was not possible to find in the literature any satisfaction
questionnaire for eLearning systems in Portuguese, which suggests that a
validation of the questionnaire used in this work can be taken as future work,
taking advantage of the translation already carried out by a language skilled
professional.
Another restraint is related with the manner how the study design was
performed resulting in a time consuming process; due to the required accuracy
not only in the selection and randomisation of the sample but also by the need
of rigorous monitorisation. Furthermore we faced the risk of individuals
resorting to external sources in order to provide correct answers to the tests,
even if the authenticity was requested. This situation creates a slight bias which
is difficult to control considering the study design. Following the study design,
the randomisation was performed after completing the pre-test, i.e., only those
who attended the pre-test were randomly allocated to intervention and control
groups; though it can be considered as a positive fact because the same
willingness of participants entering the study was clearly demonstrated,
regardless of the group where they were allocated.

Discussion 49

Conclusion 50
7. Conclusion
Breast cancer has become a serious public health problem relying on trusted
diagnostic methods as the mammography, which is considered the best imaging
technique for the screening of this disease. The radiographer has a key role in
the screening and diagnosis of the disease, and participates in the process of
reducing the mortality rate of breast cancer.
Despite some limitations, we consider that very satisfactory results were
obtained, even overcoming expectations. Globally, this study underlines the
importance of the radiographer as the first health care professional which
interacts with the woman during the breast cancer screening process. In this
context, the knowledge of senology concepts is an essential strength to the
health professional, highly considered in some countries (such as in England,
Denmark, Australia and USA). Unlike these countries, the breast cancer
screening in Portugal is not organised by the government but by a private
institution; this can be one of the reasons why there are no existing specific
training programmes, and the role of the radiographer is not as differentiated
and valued as in the previously mentioned countries. Another factor that may
contribute to this situation in Portugal is the absence of a radiographers
association, existing only private associations, such as trade unions, not directly
related to radiographers.
7.1 Main findings
As the main finding we consider the improvement of knowledge on
senology that the eLearning course provided to radiographers.
Overall, from this study it can be concluded that the course is efficacious,
especially for radiographers, which highlights the need for continuing
education, foreseeing also eLearning as an increasingly viable alternative to the
traditional method.

Discussion 51
This RCT also allowed to prove that the course is effective, since only 9%
(4/44) of the learners dropped out during its performance. Moreover, the
course showed to have a great level of satisfaction for both radiographers and
students, mainly at the level of interface and contents topics.
Also, the high rate of participation in the study based in the sample assessed
is an important aspect (57% of radiographers and 56% of students), which
reflects the great interest shown by these professionals to participate in
scientific research, thereby promoting their professional category. We consider
that the motivation of these professionals and students to increase their skills
and knowledge was remarkable. They took advantage of learning opportunities,
namely this area of knowledge, which dignifies the radiographers’ role as health
care professionals committed to respond to the constant challenges that the
profession provides them.
7.2 Main recommendations
We believe that this study highlights the importance of eLearning as a
training platform increasingly sought and used, mainly due to budget
constraints associated with the current economic context. ELearning should be
the next trend for continuing education, and directors should invest in it thus
improving the skills of their professionals and consequently enhancing
healthcare services provided.
Regarding the future work, the ultimate goal may be to proceed to an overall
improvement of the course, which could be, for example, the development of a
practical training component, transforming the eLearning system from a web-
based learning into a blended learning, consequently adding more credibility
and effectiveness. Moreover, the accreditation of the course would be a crucial
step for the certification of its quality. To cover the international market, the
translation of the course into the English language could also be an achievable
goal.
In addition, it would be interesting to realize a nationwide study in the same
way that this project was developed.
In a more challenging long-term perspective, and even taking into account
the development effort that this would imply, it could be interesting to explore
the evaluation of the course towards levels 3 and 4 of the Kirkpatrick’s
platform, through the measurement of worksite implementation and the impact
of organisation, and also studying the efficiency and costs aspects.
References 52
References
AJ, L. et al., 2001. The incremental value of internet-based instruction as an
adjunct to classroom instruction: a prospective randomized study.
Academic medicine: journal of the Association of American Medical Colleges, 76(10),
pp.1060–4.
Aitken, V. Tabakov, S., 2005. Evaluation of the e-Learning material developed
by EMERALD and EMIT for diagnostic imaging and radiotherapy.
Medical engineering & physics, 27(7), pp.633–9.
Alliger, G. & Janak, E., 1989. Kirkpatrick’s levels of training criteria: thirty years
later. Personnel Psychology, 42(2), pp.331–342.
Alto Comissariado da Saúde, Comissão Nacional para as Doenças Oncológicas,
2009. Recomendações nacionais para diagnóstico e tratamento do cancro da mama.
American College of Radiology, 2003. BI-RADS, Breast Imaging and Reporting
Data System. Breast Imaging Atlas. Mammography, Breast Ultrasound, Magnetic
Ressonance Imaging. 4th ed., American College of Radiology.
Australian Institute of Radiography, 2011. Continuing Professional
Development (CPD).
Autier, P. & Boniol, M, 2008. Disparities in breast cancer mortality trends
between 30 European countries: retrospective trend analysis of WHO.
pp.1–7.
Baumlin, M. et al., 2000. EMCyberSchool: an evaluation of computer-assisted
instruction on the Internet. Academic emergency medicine: official journal of the
Society for Academic Emergency Medicine, 7(8), pp.959–62.
Bell, S. et al., 2000. Self-Study from Web-Based and Printed Guideline
Materials: A Randomized, Controlled Trial among Resident Physicians.
Annals of Internal Medicine, 132(12), pp.938–946.
Boyle P, 2008. World cancer report, Lyon, France.
Caseldine, J. et al., 2000. Quality Assurance Guidelines For Radiographers, Publication
No 30.

References 53
Cataliotti, L. et al., 2007. Guidelines on the standards for the training of
specialised health professionals dealing with breast cancer. European journal
of cancer (Oxford, England: 1990), 43(4), pp.660–75.
Chen, L. et al., 2011. Influence of dentistry students’ e-Learning satisfaction: a
questionnaire survey. Journal of medical systems, 35(6), pp.1595–603.
Childs, S. et al., 2005. Effective e-learning for health professionals and students-
-barriers and their solutions. A systematic review of the literature--
findings from the HeXL project. Health information and libraries journal, 22
(2), pp.20–32.
Chumley-Jones, H, Dobbie, A. & Alford, C., 2002. Web-based learning: sound
educational method or hype? A review of the evaluation literature.
Academic medicine: journal of the Association of American Medical Colleges, 77(10),
pp.86–93.
Cimino, C., Reichel, J. & Serrano, M., 1995. Cost efficient management of
educational material. Proceedings the Annual Symposium on Computer
Application in Medical Care. Symposium on Computer Applications in Medical
Care, 00, pp.493–7.
Clark, D., 2002. Psychological myths in e-learning. Medical teacher, 24(6), pp.598–
604.
Corder, G. & Foreman, D., 2009. Nonparametric Statistics for Non-Statisticians: A
Step-by-Step Approach. Hoboken, ed.
Crompton, P., 1992. Evaluation: A practical guide to methods. pp.66–73.
Eurostat, 2009. Health statistics – Atlas on mortality in the European Union
2009.
Faculdade de Medicina da Universidade do Porto, 2004. Sensibilidade e
Especificidade da Mamografia.
Fazel, R. et al., 2009. Exposure to Low-Dose Ionizing Radiation from the
Medical Imaging Procedures. The New England Journal of Medicine, 361(9),
pp.849–857.
Fischer, U. & Luftner-Nager, S., 2008. Direct Diagnosis in Radiology: Breast Imaging
Thieme, New York.
Fisher Box, J., 1987. Guinness, Gosset, Fisher, and Small Samples. Statistical
Science 2, 1, pp.45–52.
Fisher, R, 1922. On the interpretation of χ2 from contingency tables, and the
calculation of p. Journal of the Royal Statistical Society, 85(1), pp.87–94.
Fitzpatrick, P., Winston, a & Mooney, T., 2008. Radiographer gender and
breast-screening uptake. British journal of cancer, 98(11), pp.1759–61.

54 References
Food and Drug Administration, 2001. The Mammography Quality Standards Act
Final Regulations: Preparing for MQSA Inspections; Final Guidance for Industry
and FDA.
Guidelines, A.C.R., Mammography Accreditation Program Requirements.
Program, pp.1–22.
Horton, W., 2001. Evaluating e-learning,
Jemal, A., Bray, F. & Ferlay, J., 2011. Global Cancer Statistics. CA Cancer, 61(2),
pp.69–90.
Johansen, L. & Brodersen, J. 2011. Reading screening mammograms--attitudes
among radiologists and radiographers about skill mix. European journal of
radiology, 80(3), pp.325–30.
Johnson, R., Hornik, S. & Salas, E., 2008. An empirical examination of factors
contributing to the creation of successful e-learning environments.
International Journal of Human-Computer Studies, 66(5), pp.356–369.
Karellas, A., 2006. Digital Mammography – An Emerging Technology Digital
Mammography – An Emerging Technology. 351(July 2004), pp.2004–
2007.
Karsa, L. et al., 2008. Cancer screening in the European Union Report on the
implementation of the Council Recommendation on cancer screening, Luxembourg.
Kavanagh, M. et al., 2000. The sensitivity, specificity, and positive predictive
value of screening mammography and symptomatic status. Journal of
medical screening, 7(2), pp.105–10.
Komolpis, R. & Johnson, R. a, 2002. Web-based orthodontic instruction and
assessment. Journal of dental education, 66(5), pp.650–8.
Kruskal, W., 1957. Historical Notes on the Wilcoxon Unpaired Two-Sample
Test. Journal of the American Statistical Association, 52(279), pp.356–360.
Lee, C. et al., 2010. Breast cancer screening with imaging: recommendations
from the Society of Breast Imaging and the ACR on the use of
mammography, breast MRI, breast ultrasound, and other technologies for
the detection of clinically occult breast cancer. Journal of the American College
of Radiology, 7(1), pp.18–27.
Liao, P. & Hsieh, J.Y., 2011. What Influences Internet-Based Learning? Social
Behavior and Personality: an international journal, 39(7), pp.887–896.
Liga Portuguesa Contra o Cancro, 2009. Liga Portuguesa Contra o Cancro.
Available at: http://www.ligacontracancro.pt/gca/index.php?id=42.
Ludlow, J. & Platin, E., 2000. A comparison of Web page and slide/tape for
instruction in periapical and panoramic radiographic anatomy. Journal of
dental education, 64(4), pp.269–275.

References 55
Mahesh, M., 2004. Digital Mammography: An Overview 1. Radiographics: a
review publication of the Radiological Society of North America, Inc, pp.1747–1760.
Mahnken, A. et al., 2011. Blended learning in radiology: is self-determined
learning really more effective? European journal of radiology, 78(3), pp.384–7.
Marsaglia, G., Tsang, W. & Wang, J., 2003. Evaluating Kolmogorov’s
Distribution. Journal of Statistical Software, 8(18), pp.1–4.
Masys, D., 2002. Effects Of Current And Future Information Technologies On
The Health Care Workforce. Health Affairs, 21(5), pp.33–41.
McKimm, J., Jollie, C. & Cantillon, P., 2003. ABC of learning and teaching -
Web based learning. BMJ, pp.870–873.
Misra, S. et al., 2010. Screening Criteria for Breast Cancer. Advances in Surgery,
44(1), pp.87–100.
Nkenke, E. et al., 2012. Acceptance of technology-enhanced learning for a
theoretical radiological science course: a randomized controlled trial. BMC
medical education, 12, p.18.
Norman, G., Shannon, S. & Marrin, M.L., 2004. Learning in practice education.
Main, pp.999–1001.
Núñez, J. et al., 2011. Implementation of training programs in self-regulated
learning strategies in Moodle format: results of a experience in higher
education. Psicothema, 23(2), pp.274–81.
Park, J. et al., 2007. Breast tomosynthesis: present considerations and future
applications. Radiographics : a review publication of the Radiological Society of
North America, Inc, 27 (1), pp.S231–40.
Perry, N. et al., 2006. European guidelines for quality assurance in breast cancer screening
and diagnosis, Luxembourg.
Perry, N., 2001. Multi-disciplinary aspects of quality assurance in the diagnosis
of breast disease. , 2001, pp.159–172.
Perryer, G. et al., 2000. Development and evaluation of a stand-alone Web-
based CAL program. European Journal of Dental Education, 4, pp.118–123.
Pinto, A. et al., 2008. E-learning tools for education: regulatory aspects, current
applications in radiology and future prospects. La Radiologia medica, 113(1),
pp.144–57.
Pinto, A. et al., 2011. E-learning and education in radiology. European journal of
radiology, 78(3), pp.368–71.
Ponti, A. & Psaila, J., 2010. Breast Cancer Screening across the EU. NHS Breast
Screening Programme Annual Review 2010.

56 References
Ravert, P. & Huffaker, C., 2010. Breast cancer screening in women: An
integrative literature review. Journal of the American Academy of Nurse
Practitioners, 22(12), pp.668–73.
Rodgers, J. & Nicewander, W., 1988. Thirteen ways to look at the correlation
coefficient. American Statistical Association, 42(1), pp.59–66.
Ruiz, J, Mintzer, & Leipzig, R., 2006a. The impact of E-learning in medical
education. Academic medicine : journal of the Association of American Medical
Colleges, 81(3), pp.207–12.
Schrader, T. & Kldiashvili, E., 2008. Virtual health care center in Georgia.
Diagnostic pathology, 3 Suppl 1, p.S4.
Schueler, K., Chu, P. & Smith-Bindman, R., 2008. Factors associated with
mammography utilization: a systematic quantitative review of the
literature. Journal of women’s health (2002), 17(9), pp.1477–98.
Shanahan, M., 2010. Radiographers and the internet: an Australian perspective.
Radiologic technology, 81(3), pp.223–32.
Shapiro, S. & Wilk, M., 1965. An analysis of variance test for normality
(complete samples). Biometrika, 52(3), pp.591–611.
Stark, C. et al., 2011. Online course increases nutrition professionals’
knowledge, skills, and self-efficacy in using an ecological approach to
prevent childhood obesity. Journal of nutrition education and behavior, 43(5),
pp.316–22.
Sun, P. et al., 2008. What drives a successful e-Learning? An empirical
investigation of the critical factors influencing learner satisfaction.
Computers & Education, 50(4), pp.1183–1202.
Tseng, M., Lin, R. & Chen, H., 2011. Evaluating the effectiveness of e-learning
system in uncertainty. Industrial Management & Data Systems, 111(6),
pp.869–889.
Van Goethem, M. et al., 2003. Influence of the radiographer on the pain felt
during mammography. European radiology, 13(10), pp.2384–9.
Wang, Yi-shun, 2003. Assessment of learner satisfaction with asynchronous
electronic learning systems. Information and Management, 41, pp.75–86.
Williams, P. et al., 1995. Gray Anatomia 37th ed., Rio de Janeiro: Guanabara
Koogan.
World Health Organization, 2009. Fact sheet No. 297: Cancer. Available at:
http://www.who.int/mediacentre/factsheets/fs297/en/.
Wutoh, R., Boren, S. & Balas, E., 2004. eLearning: a review of Internet-based
continuing medical education. The Journal of continuing education in the health
professions, 24(1), pp.20–30.


58 Appendix
Appendix

Appendix 59

60 Appendix
Appendix I: final pre and post-tests

Appendix 61

62 Appendix

Appendix 63

64 Appendix

Appendix 65

66 Appendix
Appendix II: original satisfaction questionnaire

Appendix 67

68 Appendix
Measurement of electronic learner satisfaction
Q1. The e-learning system provides content that exactly fits your needs.
Q2. The e-learning system provides useful content.
Q3. The e-learning system provides sufficient content.
Q4. The e-learning system provides up-to-date content.
Q5. The e-learning system is easy to use.
Q6. The e-learning system makes it easy for you to find the content you
need.
Q7. The content provided by the e-learning system is easy to understand.
Q8. The e-learning system is user-friendly.
Q9. The operation of the e-learning system is stable.
Q10. The e-learning system responds to your requests fast enough.
Q11. The e-learning system makes it easy for you to evaluate your learning
performance.
Q12. The testing methods provided by the e-learning system are easy to
understand.
Q13. The testing methods provided by the e-learning system are fair.
Q14. The e-learning system provides secure testing environments.
Q15. The e-learning system provides testing results promptly.
Q16. The e-learning system enables you to control your learning progress.
Q17. The e-learning system enables you to learn the content you need.
Q18. The e-learning system enables you to choose what you want to learn.
Q19. The e-learning system records your learning progress and
performance.
Q20. The e-learning system provides the personalized learning support.
Q21. The e-learning system makes it easy for you to discuss questions with
your teachers.
Q22. The e-learning system makes it easy for you to discuss questions with
other students.
Q23. The e-learning system makes it easy for you to share what you learn
with the learning community.
Q24. The e-learning system makes it easy for you to access the shared
content from the learning community.
Q25. As a whole, you are satisfied with the e-learning system.
Q26. As a whole, the e-learning system is successful.

Appendix 69

70 Appendix
Appendix III: translated satisfaction questionnaire

Appendix 71

72 Appendix
Avaliação da satisfação do estudante e-learning
Q1. O sistema de e-learning fornece conteúdos que se adequam exatamente
às suas necessidades.
Q2. O sistema de e-learning fornece conteúdos úteis.
Q3. O sistema de e-learning fornece conteúdos suficientes.
Q4. O sistema de e-learning fornece conteúdos atualizados.
Q5. O sistema de e-learning é fácil de utilizar.
Q6. O sistema de e-learning permite que aceda facilmente aos conteúdos de
que necessita.
Q7. Os conteúdos fornecidos pelo sistema de e-learning são de fácil
compreensão.
Q8. O sistema de e-learning é de fácil utilização.
Q9. O sistema de e-learning apresenta um funcionamento estável.
Q10. O sistema de e-learning responde com rapidez suficiente aos seus
pedidos.
Q11. O sistema de e-learning facilita a avaliação do seu desempenho na
aprendizagem.
Q12. Os métodos de teste fornecidos pelo sistema de e-learning são de fácil
compreensão.
Q13. Os métodos de teste fornecidos pelo sistema de e-learning são justos.
Q14. O sistema de e-learning proporciona um ambiente de teste seguro.
Q15. O sistema de e-learning disponibiliza os resultados dos testes
rapidamente.
Q16. O sistema de e-learning permite-lhe controlar o seu processo de
aprendizagem.
Q17. O sistema de e-learning permite-lhe aprender os conteúdos de que
necessita.
Q18. O sistema de e-learning permite-lhe selecionar o que pretende
aprender.
Q19. O sistema de e-learning grava o seu progresso e desempenho na
aprendizagem.
Q20. O sistema de e-learning fornece um apoio à aprendizagem
personalizado.
Q21. O sistema de e-learning permite-lhe esclarecer dúvidas com os seus
professores facilmente.
Q22. O sistema de e-learning permite-lhe esclarecer dúvidas com outros
alunos facilmente.

Appendix 73
Q23. O sistema de e-learning facilita a partilha dos conhecimentos
adquiridos com a comunidade de estudantes.
Q24. O sistema de e-learning permite-lhe aceder facilmente aos conteúdos
partilhados da comunidade de estudantes.
Q25. No geral, está satisfeito com o sistema de e-learning.
Q26. No geral, o sistema de e-learning é bem sucedido.