development and evaluation of devices designed to …
TRANSCRIPT

DEVELOPMENT AND EVALUATION OF DEVICES DESIGNED TO MINIMIZE
DEER-VEHICLE COLLISIONS
by
GINO JUDE D’ANGELO
(Under the Direction of Karl V. Miller and Robert J. Warren)
ABSTRACT
Deer-vehicle collisions are an increasingly common occurrence throughout the range of
white-tailed deer (Odocoileus virginianus), resulting in human injury and death, damage to
vehicles, and waste of deer as a wildlife resource. Most states attempt to minimize deer-vehicle
collisions through a variety of techniques. However, few research efforts have sufficiently
examined the efficacy of such techniques, and a distinct paucity of information exists on deer
behavior relative to these mitigation efforts. A more thorough understanding of the
physiological processes driving deer behavior may aid in the development and implementation of
strategies designed to minimize the incidence of deer-vehicle collisions. In this study, I
evaluated the behavioral responses of white-tailed deer relative to a common commercial device
for prevention of deer-vehicle collisions, wildlife warning reflectors. I also examined the
anatomy and physiology of the hearing and visual systems of deer that may prove integral to the
invention of economically effective strategies to minimize deer-vehicle collisions. I observed
deer behaviors relative to roads before and after individual installations of 4 colors of wildlife
warning reflectors (red, white, blue-green, and amber) during 90 observation nights. My data
indicated that wildlife warning reflectors did not alter deer behavior such that deer–vehicle

collisions might be prevented. Using auditory brainstem response testing, I determined that
white-tailed deer hear within the range of frequencies we tested, from 0.25-30 kHz, with best
sensitivity between 4-8 kHz. The upper limit of human hearing lies at about 20 kHz, whereas
we demonstrated that deer detected frequencies to at least 30 kHz. This difference suggests that
research on the use of ultrasonic (frequencies >20 kHz) auditory deterrents is justified as a
possible means of reducing deer-human conflicts. To gain knowledge of visual specializations
influencing the behavior of white-tailed deer, we examined gross eye characteristics, structural
organization of the retina, and the density and distribution of cone photoreceptors. White-tailed
deer possess a horizontal slit pupil, reflective tapetum lucidum, cone photoreceptors concentrated
in a horizontal visual streak, and typical retinal structure. The visual system of white-tailed deer
is similar to other ungulates and is specialized for sensitivity in low light conditions and
detection of predators.
INDEX WORDS: Deer, Deer-vehicle collisions, Deterrents, Hearing, Vision, White-tailed
deer, Wildlife warning reflectors

DEVELOPMENT AND EVALUATION OF DEVICES DESIGNED TO MINIMIZE
DEER-VEHICLE COLLISIONS
by
GINO JUDE D’ANGELO
B.S., The Pennsylvania State University, 2001
M.S., The University of Georgia, 2003
A Dissertation Submitted to the Graduate Faculty of The University of Georgia in Partial
Fulfillment of the Requirements for the Degree
DOCTOR OF PHILOSOPHY
ATHENS, GEORGIA
2007

© 2007
GINO JUDE D’ANGELO
All Rights Reserved
DEVELOPMENT AND EVALUATION OF DEVICES DESIGNED TO MINIMIZE
DEER-VEHICLE COLLISIONS
by
GINO JUDE D’ANGELO
Major Professors: Karl V. Miller Robert J. Warren
Committee: Steven B. Castleberry Albert R. De Chicchis Michael T. Mengak Electronic Version Approved: Maureen Grasso Dean of the Graduate School The University of Georgia May 2007

iv
ACKNOWLEDGEMENTS
This study was funded by the Georgia Department of Transportation through the
Governor’s Office of Highway Safety and the National Highway Traffic Safety Administration.
I thank Mr. David M. Jared of Georgia Department of Transportation for serving as liaison
among Georgia Department of Transportation, Berry College, and University of Georgia. His
interest in my research and work on this project was integral to its success. This project was also
supported by a grant from the Jack H. Berryman Institute and received financial and logistical
support from the University of Georgia Daniel B. Warnell School of Forestry and
Natural Resources.
I would like to thank my advisors, Dr. Karl V. Miller and Dr. Robert J. Warren, for
providing me with the opportunity to conduct this research. They went above and beyond the
confines of our professional relationship to ensure that I developed as a researcher, person of
value to our profession, and as an individual. Dr. George R. Gallagher made significant
contributions of expertise and enthusiasm to this research effort. Mr. David A. Osborn was
integral in the planning and execution of all aspects of this research, but especially in working
tirelessly to guarantee that the Whitehall Deer Research Facility met all of my research needs.
Dr. Albert R. De Chicchis stepped bounds out of his normal area of research to
collaborate with me on this project. His enthusiasm was refreshing and the knowledge he
contributed was invaluable. I thank Dr. Gary A. Williams for his time, patience, and expertise. I
greatly appreciate the thoughtful advice and direction of Dr. Machelle T. Pardue. As committee
members, Drs. Steven B. Castleberry and Michael T. Mengak served as careful reviewers and

v
provided me with professional and academic guidance. Ms. Sharon A. Valitzski enthusiastically
took the reins on important aspects of our research, for which I am grateful.
I thank C. Gilroy, D. Hestad, K. Miller, R. Norton, D. Sellers, and T. Turner for assisting
with reflector trials. Georgia Department of Natural Resources Wildlife Resources Division
provided housing during the reflector study. I acknowledge the assistance of Berry College staff
from the Police Department, Department of Animal Science, and Land Resources. Mr. J. P.
Bond was highly accommodating in the production of graphics. Mr. Greg Ollick donated his
time, advice and audio equipment. Ms. Sallie J. Dahmes of Wildlife Artist Supply Company
provided use of her facilities and equipment, a welcome place for me to hunt, and friendship. I
thank Dr. R. Larry Marchinton and Mrs. Betty L. Marchinton for providing me with a hospitable
respite from my studies to chase rabbits and hunt with the finest hounds I have ever shared
company with.
Perhaps offering the greatest contribution to me and this project was my brother Mr.
Joseph G. D’Angelo. He and his wife, Mrs. Karen L. D’Angelo and now my lovely young niece,
Ms. Geralynn M. D’Angelo, totally altered their lives and relocated to Georgia at my request for
help. Joe’s engineering, craftsmanship, and ingenuity added technical flare to our experiments.
The works you will read in this dissertation were made possible because of Joe’s involvement.
My parents, Mr. Joseph M. D’Angelo and Mrs. Elaine J. D’Angelo, are the most
supportive parents I could hope for. Their love, encouragement, understanding, and prayers
motivated me throughout this effort. I am also grateful for the support of my friends and
extended family, including my late grandparents, Mr. Joseph R. D’Angelo and Mrs. Anna N.
D’Angelo. I only regret not spending more time with them before their passing. My father-in-

vi
law, Mr. James S. Falzone, and mother-in-law, Mrs. Linda T. Falzone, provided me with not
only their daughter, but also loving encouragement.
Finally, my wife, Mrs. Jamie L. D’Angelo, deserves distinct recognition for being my
source of strength and sanity. Her love, friendship, and advice motivated me throughout this
trial. The patience that Jamie displayed transcends anything that one person should be required
to give another, and she did it without hesitation.

vii
TABLE OF CONTENTS
PAGE
ACKNOWLEDGEMENTS........................................................................................................... iv
CHAPTER
1 INTRODUCTION AND LITERATURE REVIEW ......................................................1
Introduction..................................................................................................................1
Literature Review.........................................................................................................2
Objectives ..................................................................................................................10
Literature Cited ..........................................................................................................11
2 EVALUATION OF WILDLIFE WARNING REFLECTORS FOR ALTERING
WHITE-TAILED DEER BEHAVIOR ALONG ROADWAYS...............................20
Abstract ......................................................................................................................21
Introduction................................................................................................................21
Study Area .................................................................................................................23
Methods......................................................................................................................24
Results........................................................................................................................29
Discussion..................................................................................................................32
Management Implications..........................................................................................35
Acknowledgements....................................................................................................36
Literature Cited ..........................................................................................................37

viii
3 VISUAL SPECIALIZATION OF AN HERBIVORE PREY SPECIES,
THE WHITE-TAILED DEER...................................................................................53
Abstract ......................................................................................................................54
Introduction................................................................................................................54
Materials and Methods...............................................................................................57
Results........................................................................................................................60
Discussion..................................................................................................................61
Acknowledgements....................................................................................................68
References..................................................................................................................68
4 HEARING RANGE OF WHITE-TAILED DEER AS DETERMINED BY
AUDITORY BRAINSTEM RESPONSE..................................................................86
Abstract ......................................................................................................................87
Introduction................................................................................................................87
Study Area .................................................................................................................88
Methods......................................................................................................................89
Results........................................................................................................................91
Discussion..................................................................................................................91
Management Implications..........................................................................................94
Acknowledgements....................................................................................................94
Literature Cited ..........................................................................................................95
5 CONCLUSIONS.........................................................................................................105
Conclusions..............................................................................................................105
Recommendations....................................................................................................106

ix
APPENDICES ...................................................................................................................108
A VISUAL ACUITY OF WHITE-TAILED DEER AS DETERMINED BY
DISCRIMINATION LEARNING...................................................................108

1
CHAPTER 1
INTRODUCTION AND LITERATURE REVIEW
INTRODUCTION
Deer (Odocoileus spp.)-vehicle collisions result in human injury and death, damage to
vehicles, and waste of deer as a wildlife resource (Romin and Bissonette 1996). Sullivan and
Messmer (2003) estimated that 1.5 million deer-vehicle collisions occur annually in the United
States at a cost of nearly $1 billion in damages and resulting in over 200 human fatalities.
Within the state of Georgia alone, approximately 51,000 deer-vehicle collisions occur annually
(Georgia Department of Natural Resources, personal communication). Most states attempt to
minimize deer-vehicle collisions through a variety of techniques including vehicle-mounted
devices, installation of deterrents along roads, alteration of roadside habitats, and driver
education campaigns (Romin and Bissonette 1996). However, few research efforts have
sufficiently examined the efficacy of such techniques, and a distinct paucity of information exists
on deer behavior relative to these mitigation efforts.
Many deer deterrent devices were designed with little reference to the sensory
capabilities of deer, as evidenced by a lack of published information on the subjects. A more
thorough understanding of the physiological processes driving deer behavior may aid in the
successful development and implementation of strategies designed to minimize the incidence of
deer-vehicle collisions. Despite an abundance of scientific research focusing on the senses of
domestic species, relatively little is known about the visual and auditory capabilities of white-
tailed deer (Odocoileus virginianus). Designers of livestock facilities routinely use knowledge

2
of anatomical and physiological components that influence animal behavior to achieve effective
handling and containment (Rehkämper and Görlach 1997). Yet, mechanisms intended to alter
deer movements in relation to roadways continue to be engineered without consideration for
standard deer sensory processes. In this study, I evaluated the behavioral responses of white-
tailed deer relative to one of the most common commercially sold devices for prevention of deer-
vehicle collisions, wildlife warning reflectors. I also sought to develop a clear understanding of
the anatomy and physiology related to the hearing and visual capabilities of deer that may prove
integral to the invention of economically effective strategies to minimize
deer-vehicle collisions.
LITERATURE REVIEW
Strategies for Reducing Deer-vehicle Collisions
Wildlife warning reflectors.–Studies of wildlife warning reflectors have used a diversity
of testing methods of various levels of scientific validity, ultimately resulting in a limited
understanding of reflector efficacy. Most reflector evaluations were based on counts of deer
carcasses within test sections, either pre- and post-installation of reflectors (Ingebrigtsen and
Ludwig 1986, Pafko and Kovach 1996); when reflectors were covered versus uncovered
(Schafer and Penland 1985, Armstrong 1992, Reeve and Anderson 1993); or within reflectorized
sections as compared to adjacent control sections (Reeve and Anderson 1993). Such methods
failed to consider changes in deer densities, seasonal movements, or traffic patterns. Beyond
differences in experimental design, comparison of results among different reflector studies was
confounded further by the variety of reflector models tested and the distinct spectral properties of
those devices.

3
Little is known about how deer react to reflector activation along roadways or if
individual animals become habituated to the devices over time. Ujvári et al. (1998)
demonstrated that in the absence of vehicles and their associated noise and light, free-ranging
fallow deer (Dama dama) visiting a bait site became increasingly habituated to light reflections
from WEGU wildlife-warning reflectors (Walter Dräbing KG, Kassel, Germany) over a period
of 17 nights. Additionally, electrophysical measurements of the spectral mechanisms of white-
tailed deer (Odocoileus virginianus) showed that peak sensitivity of deer color vision was well
below the long wavelength of red (Jacobs et al. 1994), which was the most commonly marketed
color of wildlife-warning reflectors. The developers of wildlife warning reflectors may have
lacked the underlying physiological and behavioral information necessary for developing devices
from the perspective of deer.
Fences and wildlife crossing structures.–Roadside fencing has been the most studied
device implemented to reduce the incidence of deer-vehicle collisions. Most research indicated
that fences were not an absolute barrier to deer, and only served to reduce the number of animals
entering the roadway (Bellis and Graves 1978, Falk et al. 1978). Conventional wire fencing
must be at least 2.4 m high to limit the ability of deer to jump over it. Construction of fencing is
prohibitively expensive for many applications. Alternative low-in-height fence designs, such as
solid barrier fencing (Gallagher et al. 2003) and non-traditional configurations of electric fence
(Palmer et al. 1985, Seamans et al. 2003, Fenster and Knight 2006) and barbed-wire (Knight et
al. 1997), may provide a less-expensive fencing option to exclude deer from roadways and other
areas.
Regular maintenance of fences is both costly and necessary for effectiveness (McKnight
1969). Gaps created by weather events, humans, and animals are quickly exploited by deer, and

4
may create “hotspots” for deer-vehicle collisions when deer enter the roadway corridor and are
unable to locate an escape point. Although fencing is not a complete barrier to deer, its presence
may severely limit the natural movements and gene flow of deer populations and other wildlife.
Fencing coupled with a variety of underpasses (Reed et al. 1975, Clevenger and Waltho 2000,
Brudin 2003, Gordon and Anderson 2003, Quinn and Smith 2003, Servheen et al. 2003),
overpasses (Reed et al. 1979), road-level crosswalks (Lehnert et al. 1996, Lehnert et al. 1997),
one-way gates (Reed et al. 1974, Ford 1980, Ludwig and Bremicker 1983), and other strategies
were tested to allow animals to cross roadways at controlled areas along fenced highways.
Crossing structures were most successful when used where traditional migratory routes of mule
deer (Odocoileus hemionus), elk (Cervus elaphus), and other migratory species intersect
highways. An intimate understanding of the proper physical design, location, and integration
into the habitat of crossing structures at a particular location is necessary to encourage utilization
by the targeted wildlife species.
Motorist warning devices.–Active and passive driver warning devices were largely
ineffective at reducing vehicle speeds and preventing deer-vehicle collisions. Drivers ignored
the common “deer crossing” sign, perhaps because of its overuse (Pojar et al. 1975). Reduced
vehicle speed was the most common method used for assessing the effectiveness of warning
devices, even though this response was not the primary desired effect of warning drivers about
site-specific dangers associated with wildlife crossings (Pojar et al. 1971, Pojar et al. 1972, Pojar
et al. 1975, Reed et al. 1979). No studies to date have assessed driver alertness or other changes
in driver behavior relative to warning devices through surveys directed at motorists actually
exposed to such strategies.

5
The effectiveness of recently developed active warning systems, which only alert drivers
when animals are present near the roadway, was unclear despite the high cost of such devices
(Huijser and McGowen 2003, Newhouse 2003, Gordon et al. 2004). Researchers indicated that
non-redundant command type messages impact driver behavior more than notification style
messages (Lee et al. 1999), which suggests that educating drivers during periods when they are
most likely to encounter roadway dangers (i.e., during the fall and spring when deer-vehicle
collisions are most common) may be most effective. Such techniques should be evaluated
through direct communication with drivers.
Time and location of deer-vehicle collisions.–Most research indicated that peaks in deer-
vehicle collision rates occurred late in the evening, at night, and in the early morning on a diurnal
basis, and seasonally in the spring and fall (Bellis and Graves 1971, Bellis et al. 1971, Carbaugh
et al. 1975, Allen and McCullough 1976, Case 1978). Modern analyses of deer-vehicle collision
sites typically involved Global Information Systems (GIS) technology combined with regression
modeling to identify areas likely to experience an elevated deer-vehicle collision rate. GIS
modeling also was used to select areas for implementation of mitigation strategies based on
landscape features, economic feasibility, and other criteria. However, models designed to predict
hotspots for deer-vehicle collisions may not be applicable among different regions. For example,
in a Pennsylvania study, a model developed by Bashore et al. (1985) suggested that increased
line of sight for motorists (i.e., open habitats) in an area increased the probability of the
occurrence of deer-vehicle collisions. Contrasting this finding, a model developed by Finder et
al. (1999) for roads in Illinois predicted that a reduction in distance to forest edge along a road
segment increased deer-vehicle collisions.

6
Many predictive models show corresponding results relative to the influence of humans
on ecosystems. Models including increased landscape fragmentation, number of buildings,
bridges, and human population density, which are all indicative of development by humans,
showed positive correlation with the number of deer-vehicle collisions across the range of white-
tailed deer (Finder et al. 1999, Hubbard et al. 2000, Farrell and Tappe 2003, Nielson et al. 2003).
Likewise, drivers experienced higher rates of deer-vehicle collisions on road segments in and
near areas closed to hunting, such as public parks and recreation areas (Finder et al. 1999,
Nielson et al. 2003). Premo and Rogers (2001) used data from deer-vehicle collision sites to
formulate an adaptive strategy for averting deer-vehicle collisions in an urbanized area, including
modification of driver behavior at times of greatest risk, and periodic control of deer populations.
Human dimensions associated with deer-vehicle collisions.–The general public greatly
values deer as a public resource. Surveys showed, however, that public opinion about deer
management and deer-vehicle collision mitigation was affected significantly by human
perception of personal risk and cost of implementation (Stout et al. 1993). Conover (1997)
hypothesized that as deer populations increase, the negative monetary values of deer will
increase at a faster rate than the deer population. Correspondingly, Conover (1997)
recommended that the goal of modern deer management should be to maintain deer populations
at levels where the net positive benefit of deer is highest.
Human dimensions researchers suggested that professionals involved with wildlife
management and roadway management should combine public risk-assessment data with
biological data to make decisions about alternative management strategies (Stout et al. 1993,
Johnson 2003). Their rationale seems justified as Drake et al. (2003) noted that although the
majority of citizens from suburban New Jersey felt that deer control measures were necessary,

7
most were unaware of options for management. Professionals from wildlife management and
transportation agencies are charged with the responsibility to institute measures to reduce the risk
of deer-vehicle collisions. Future research should focus on methods to effectively communicate
with the public regarding strategies for reduction of deer-vehicle collisions.
Alternative mitigation strategies.–Although no “alternative strategy” has proven effective
in reducing vehicle collisions with white-tailed deer, the high incidence of deer-vehicle collisions
warrants research in new areas. Intercept feeding for migratory mule deer proved marginally
effective in reducing the incidence of deer-vehicle collisions in Utah, however successful
adaptation of this technique to white-tailed deer in the eastern U.S. is unlikely (Wood and Wolfe
1988). Other alternative approaches included variations of highway lighting (Reed 1981) and
even placing imitations of deer with raised tails along roadways (Graves and Bellis 1978).
Although not successful in reducing deer-vehicle collisions, such approaches provide evidence
that future research on strategies for reduction of deer-vehicle collisions may require a departure
from typical study designs.
Deer Hearing and Sound Deterrents
Despite the popular use of sound deterrents for the attempted resolution of deer-human
conflicts, information on the hearing abilities of white-tailed deer is limited in the scientific
literature. Research on deer hearing was mainly preliminary in nature. However, separate
unpublished studies by Stattelman (A. Stattelman, University of Georgia, unpublished data) and
Risenhoover et al. (K. Risenhoover, Texas A&M University, unpublished data) demonstrated
similar results regarding deer hearing. Both studies suggested that hearing by white-tailed deer
was best in the 1-8 kHz range with a marked peak at 4 kHz, well below the sounds produced by
wildlife-warning whistles. Likewise, in a behavioral study of reindeer (Rangifer tarandus),

8
frequency range of hearing was relatively flat from 1 kHz to 16 kHz, with best sensitivity at 8
kHz (Flydal et al. 2001). The aforementioned studies suggested that the range of deer hearing is
similar to humans and does not extend into ultrasonic frequencies. The upper limit of human
hearing lies at about 20 kHz (Durrant and Lovrinic 1995), and ultrasonic frequencies are those
>20 kHz. Yet, vehicle-mounted sound deterrents (Shu Roo, Ermington, Australia; International
Resources Inc., Altoona, Indiana, USA) were advertised by their manufacturers as being
effective at dispersing deer from roadways by producing ultrasonic sounds in the 16-22 kHz
range, which they claimed were audible to deer, but not to humans.
Contrary to claims by manufacturers, behavioral responses by deer to sound deterrents
may be unpredictable or nonexistent. Warning whistles were reported to be ineffective in
eliciting any response in free-ranging mule deer (Romin and Dalton 1992). Belant et al. (1998)
concluded that motion-activated, acoustic frightening systems operating at 1.4 kHz and in the 20-
35 kHz range were ineffective in deterring white-tailed deer from preferred feeding areas.
Gilsdorf et al. (2004) developed a device with an infrared system to detect the presence of deer
entering the edge of a cornfield, which activated an audio alarm system designed to broadcast
deer distress calls. They noted that the device elicited a flight response in deer. However deer
were observed to both run away from or into the fields that the device was intended to protect.
Unpredictable behavioral responses by deer to sound deterrents in roadway situations may have
adverse consequences, including human injury and death.
Bomford and O’Brien (1990) reviewed literature on sonic devices used as animal
deterrents. They concluded that although numerous devices had been developed and assessed,
many reported tests were inconclusive because of inadequate experimental design. Further
research on the hearing physiology of deer and behavioral responses by deer to sound are

9
necessary. Deterrent strategies should be designed to produce sounds within the hearing range of
deer and should be implemented to elicit known and repeatable behavioral responses by deer in
the actual conditions in which conflicts occur.
Deer Vision
White-tailed deer possess eyes of the basic mammalian form (Ali and Klyne 1985).
However, the specific anatomical structures and function of the white-tailed deer eye have not
been studied. The mostly crepuscular and nocturnal habitats of deer (Marchinton and Hirth
1984) lead many to surmise that the deer retina contained only rod photoreceptors for vision in
low-light conditions. The lack of cone photoreceptors would likely render deer incapable of
color vision as suggested by Dalrymple (1975). However, Witzel et al. (1978) established that
the retina of white-tailed contained cones. Jacobs et al. (1994) used electroretinogram flicker
photometry to study the spectral mechanisms in the retinas of white-tailed deer and fallow deer
(Dama dama). Both species appeared to possess a maximum rod pigment sensitivity of about
497 nm and two classes of photopic receptors. Both species also shared a common short-
wavelength-sensitive cone mechanism in the region of 450-460 nm (blue). The white-tailed deer
peak medium wavelength cone sensitivity was about 537 nm (yellow-green), and the fallow deer
peak medium wavelength cone sensitivity was about 542 nm. They concluded that deer
resemble other ungulates and many other types of mammals in having two classes of cone
pigment, and, thus, the retinal basis for dichromatic color vision. Subsequent to the findings of
Jacobs et al. (1994), Yokoyama and Radlwimmer (1998, 1999) identified the molecular genetics
of photopigments necessary for color perception in white-tailed deer.
Although the retina of deer contains cones, the density and distribution of cones
throughout the retina were not studied. Müller-Schwarze (1994) speculated that all species of

10
deer have a visual streak corresponding to a horizontal band of increased cone density in the
central retina, because of which, “day or night, a deer’s acuity is excellent” (Müller-Schwarze
1994:60). Regardless of the possible distribution of cones, white-tailed deer acuity may be
limited by the overall density of their cones. Visual acuity increases directly with density of
cones by enhancing the fineness of the retinal grain (Walls 1942). Witzel et al. (1978) estimated
that cones were present at densities of about 10,000 cones/mm2 at the locations they sampled in
the deer retina. In contrast, Curcio et al. (1990) found cones in the human optic fovea at
densities much greater than deer between 100,000-324,000 cones/mm2. This difference among
cone densities in deer and humans suggests that deer visual acuity may be limited.
Developing an understanding of the density and distribution of cones in the white-tailed
deer would provide insight into the role their vision plays in intraspecific communication,
avoidance of predators, and deer-human interactions. The presence of a visual streak would
afford white-tailed deer with enhanced ability to monitor a broad area and to detect movement.
Information on other ocular components (e.g., cornea, pupil, lens) of the deer eye would
demonstrate the treatment of light in preparation for absorption by the deer retina (Walls 1942).
Together, these data would enable comparison among the visual abilities of deer and
other species. More comprehensive knowledge of the visual system of deer may enable the
exploitation of their visual differences (versus humans) for the development of effective visual
deterrent strategies.
OBJECTIVES
Based on our review of the literature, I designed a series of research projects to
accomplish the following objectives, which were examined in individual chapters:
11
1. Determine the effect of Strieter-Lite (Strieter Corp., Rock Island, Illinois) wildlife
warning reflectors in altering the behavior of white-tailed deer along roadways in the
presence vehicles–Chapter 2.
2. Investigate the visual physiology of white-tailed deer, including mapping the density and
distribution of cones, and describing the anatomical features of the deer eye–Chapter 3.
3. Investigate the hearing range of white-tailed deer–Chapter 4.
LITERATURE CITED
Ali, M.A., and M. A. Klyne. 1985. Vision in vertebrates. Plenum Press, New York,
New York, USA.
Allen, R. E., and D. R. McCullough. 1976. Deer-car accidents in southern Michigan.
Journal of Wildlife Management 40:317-325.
Armstrong, J. J. 1992. An evaluation of the effectiveness of Swareflex deer reflectors.
Ontario Ministry of Transportation Research and Development Branch
Report No. MAT-91-12.
Bashore, T. L., W. M. Tzilkowski, and E. D. Bellis. 1985. Analysis of deer-vehicle
collision sites in Pennsylvania. Journal of Wildlife Management 49:769-774.
Belant, J. L., T. W. Seamans, and L. A. Tyson. 1998. Evaluation of electronic
frightening devices as white-tailed deer deterrents. Wildlife Society
Bulletin 26:264-268.
Bellis, E. D., and H. B. Graves. 1971. Deer mortality on a Pennsylvania interstate
highway. Journal of Wildlife Management 35:232-237.

12
_____, _____, B. T. Carbaugh, and J. P. Vaughan. 1971. Behavior, ecology, and mortality of
white-tailed deer along a Pennsylvania interstate highway. The Pennsylvania State
University Institute for Research on Land and Water Resources Research
Publication No. 71.
_____, _____. 1978. Highway fences as deterrents to vehicle-deer collisions. Transportation
Research Record 674:53-58.
Bomford, M., and P. H. O’Brien. 1990. Sonic deterrents in animal damage control: a review of
device tests and effectiveness. Wildlife Society Bulletin 18:411-422.
Brudin, C. O. 2003. Wildlife use of existing culverts and bridges in northcentral
Pennsylvania. Pages 344-352 in C. L. Irwin, P. Garrett, and K. P. McDermott, editors.
Proceedings of the International Conference on Ecology and Transportation. Center for
Transportation and the Environment, North Carolina State University, Raleigh, USA.
Carbaugh, B. T., J. P. Vaughan, E. D. Bellis, and H. B. Graves. 1975. Distribution and
activity of white-tailed deer along an interstate highway. Journal of Wildlife
Management 39:570-581.
Case, R. M. 1978. Interstate highway road-killed animals: a data source for biologists.
Wildlife Society Bulletin 6:8-13.
Clevenger, A. P., and N. Waltho. 2000. Factors influencing the effectiveness of wildlife
underpasses in Banff National Park, Alberta, Canada. Conservation Biology 14:47-56.
Conover, M. R. 1997. Monetary and intangible valuation of deer in the United States. Wildlife
Society Bulletin 25:298-305.
Curcio, C. A., K. R. Sloan, R. E. Kalina, and A. E. Hendrickson. 1990. Human photoreceptor
topography. Journal of Comparative Neurology 292:497-523.

13
Dalrymple, B. W. 1975. When can your quarry see you? Outdoor Life 156:61-65, 143-144.
Drake, D., D. Derr, M. Hartley, and P. Maas. 2003. Suburban residents’ perceptions about deer
and deer management. Proceedings of The Wildlife Society Annual Conference 10:110.
Durrant, J. D., and J. H. Lovrinic. 1995. Bases of hearing science. Williams and Wilkins,
Baltimore, Maryland, USA.
Falk, N. W., H. B. Graves, and E. D. Bellis. 1978. Highway right-of-way fences as deer
deterrents. Journal of Wildlife Management 42:646-650.
Farrell, M. C., and P. A. Tappe. 2003. A multivariate analysis of county-level factors
that contribute to deer-vehicle collisions in Arkansas. Proceedings of The Wildlife
Society Annual Conference 10:117.
Fenster, R. L., and J. E. Knight. 2006. Effectiveness of modifying existing fence to deter
ungulate use of high value pastures and croplands. Proceedings of The Wildlife Society
Annual Conference 13:58.
Finder, R. A., J. L. Roseberry, and A. Woolf. 1999. Site and landscape conditions at
white-tailed deer/vehicle collision locations in Illinois. Landscape and Urban
Planning 44:77-85.
Flydal, K., A. Hermansen, P. S. Enger, and E. Reimers. 2001. Hearing in reindeer
(Rangifer tarandus). Journal of Comparative Physiology A 187:265-269.
Ford, S. G. 1980. Evaluation of deer kill mitigation on SIE/LAS-395 (1976-1979). U.S.
Department of Transportation, Federal Highway Administration Report No.
FHWA-CA-TP-80-01.

14
Gallagher, G. R., H. A. Keen, and R. H. Prince. 2003. Effectiveness of a perceived solid barrier
as an exclusion fence to prevent white-tailed deer damage. Proceedings of the Wildlife
Damage Management Conference 10:23-29.
Gilsdorf, J. M., S. E. Hygnstrom, K. C. VerCauteren, G. M. Clements, E. E. Blankenship, and
R. M. Engeman. 2004. Evaluation of a deer-activated bio-acoustic frightening device for
reducing deer damage in corn fields. Wildlife Society Bulletin 32:515-523.
Gordon, K. M., and S. H. Anderson. 2003. Mule deer use of underpasses in western
and southwestern Wyoming. Pages 246-252 in C. L. Irwin, P. Garrett, and K. P.
McDermott, editors. Proceedings of the International Conference on Ecology and
Transportation. Center for Transportation and the Environment, North Carolina State
University, Raleigh, USA.
_____, M. C. McKinstry, and S. H. Anderson. 2004. Motorist response to a deer-sensing
warning system. Wildlife Society Bulletin 32:565-573.
Graves, H. B., and E. D. Bellis. 1978. The effectiveness of deer flagging models as deterrents to
deer entering highway rights-of-way. Institute for Research on Land and Water esources,
Pennsylvania State University, University Park, USA.
Hubbard, M. W., B. J. Danielson, and R. A. Schmitz. 2000. Factors influencing the location of
deer-vehicle accidents in Iowa. Journal of Wildlife Management 64:707-713.
Huijser, M. P., and P. T. McGowen. 2003. Overview of animal detection and animal warning
systems in North America and Europe. Pages 368-382 in C. L. Irwin, P. Garrett, and
K. P. McDermott, editors. Proceedings of the International Conference on Ecology and
Transportation. Center for Transportation and the Environment, North Carolina State
University, Raleigh, USA.

15
Ingebrigtsen, D. K., and J. R. Ludwig. 1986. Effectiveness of Swareflex wildlife warning
reflectors in reducing deer-vehicle collisions in Minnesota. Minnesota Department of
Natural Resources, Wildlife Report No. 3.
Jacobs, G. H., J. F. Deegan, J. Neitz, B. P. Murphy, K. V. Miller, and R. L. Marchinton. 1994.
Electrophysical measurements of spectral mechanisms in the retinas of two cervids:
white-tailed deer (Odocoileus virginianus) and fallow deer (Dama dama). Journal of
Comparative Physiology 174:551-557.
Johnson, S. W. 2003. Determining criteria to evaluate mitigation measures to reduce
wildlife-vehicle collisions: Teton County, Wyoming. Pages 654-656 in C. L. Irwin, P.
Garrett, and K. P. McDermott, editors. Proceedings of the International Conference on
Ecology and Transportation. Center for Transportation and the Environment, North
Carolina State University, Raleigh, USA.
Knight, J. E., E. J. Swensson, and H. Sherwood. 1997. Elk use of modified fence-crossing
designs. Wildlife Society Bulletin 25:819-822.
Lee, J. D., B. F. Gore, and J. L. Campbell. 1999. Display alternatives for in-vehicle warning
and sign information: message style, location, and modality. Transportation Human
Factors 1:347-375.
Lehnert, M. E., L. A. Romin, and J. A. Bissonette. 1996. Mule deer-highway mortality in
northeastern Utah: causes, patterns, and a new mitigative technique. Pages 113-120 in
G. L. Evink, P. Garrett, D. Zeigler, and J. Berry, editors. Proceedings of the International
Conference on Ecology and Transportation. Center for Transportation and the
Environment, North Carolina State University, Raleigh, USA.

16
_____, and J. A. Bissonette. 1997. Effectiveness of highway crosswalk structures at reducing
deer-vehicle collisions. Wildlife Society Bulletin 25:809-818.
Ludwig, J., and T. Bremicker. 1983. Evaluation of 2.4-m fences and one-way gates for reducing
deer-vehicle collisions in Minnesota. Transportation Research Record 913:19-22.
Marchinton, R.L., and D. H. Hirth. 1984. Behavior. Pages 129-168 in L.K. Halls, editor.
White-tailed deer ecology and management. Stackpole Books, Mechanicsburg,
Pennsylvania, USA.
McKnight, T. L. 1969. Barrier fencing for vermin control in Australia. Geographic Review
59:330-347.
Müller-Schwarze, D. 1994. The senses of deer. Pages 58-65 in D. Gerlach, S. Atwater, and
J. Schnell, editors. Deer. Stackpole Books, Mechanicsburg, Pennsylvania, USA.
Newhouse, N. 2003. The Wildlife Protection System: early successes and challenges using
infrared technology to detect deer, warn drivers, and monitor deer behavior. Pages 390-
391 in C. L. Irwin, P. Garrett, and K. P. McDermott, editors. Proceedings of the
International Conference on Ecology and Transportation. Center for Transportation and
the Environment, North Carolina State University, Raleigh, USA.
Nielson, C. K., R. G. Anderson, M. D. Grund. 2003. Landscape influences on deer-vehicle
accident areas in an urban environment. Journal of Wildlife Management 67:46-51.
Pafko, F., and B. Kovach. 1996. Minnesota experience with deer reflectors. Pages 130-139 in
G. L. Evink, P. Garrett, D. Zeigler, and J. Berry, editors. Proceedings of the International
Conference on Ecology and Transportation. Center for Transportation and the
nvironment, North Carolina State University, Raleigh, USA.

17
Palmer, W. L., J. M. Payne, R. G. Wingard, and J. L. George. 1985. A practical fence to
reduce deer damage. Wildlife Society Bulletin 13:240-245.
Pojar, T. M., T. C. Reseigh, and D. F. Reed. 1971. Lighted deer crossing signs and vehicular
speed. U.S. Department of Transportation Federal Highway Administration Interim
Report No. 1478.
_____, _____, _____. 1972. Deer crossing signs may prove valuable in reducing accidents and
animal deaths. Highway Research News 46:20-23.
_____, Prosence, D. F. Reed, and T. N. Woodard. 1975. Effectiveness of a lighted, animated
deer crossing sign. Journal of Wildlife Management 39:87-91.
Premo, D. B., and E. I. Rogers. 2001. Creating an urban deer-vehicle accident management plan
using information from a town’s GIS project. Pages 549-555 in L. Coryell, L.
Terrwilliger, C. McCrackan, K. Yandora, A. Peppers, and D. Zeigler, editors.
Proceedings of the International Conference on Ecology and Transportation.
Center for Transportation and the Environment, North Carolina State University,
Raleigh, USA.
Quinn, L. J., and D. J. Smith. 2003. Evaluation of animal passage through highway drainage
culverts and designing wildlife underpasses. Proceedings of The Wildlife Society Annual
Conference 10:221.
Reed, D. F., T. M. Pojar, and T. N. Woodard. 1974. Use of one-way gates by mule deer.
Journal of Wildlife Management 38:9-15.
_____, T. N. Woodard, and T. M. Pojar. 1975. Behavioral response of mule deer to a highway
underpass. Journal of Wildlife Management 39:361-367.

18
_____, _____, and T. D. Beck. 1979. Regional deer-vehicle accident research. U.S.
Department of Transportation, Federal Highway Administration Final Report No.
FHWA-CO-79-11.
_____. 1981. Mule deer behavior at a highway underpass exit. Journal of Wildlife
Management 45:542-543.
Reeve, A. F., and S. H. Anderson. 1993. Ineffectiveness of Swareflex reflectors at reducing
deer-vehicle collisions. Wildlife Society Bulletin 21:127-132.
Rehkämper, G., and A. Görlach. 1997. Visual discrimination in adult dairy bulls. Journal of
Dairy Science 80:1613-1621.
Romin, L. A., and L. B. Dalton. 1992. Lack of response by mule deer to wildlife whistles.
Wildlife Society Bulletin 20:382-384.
_____, and J. A. Bissonette. 1996. Deer-vehicle collisions: status of state monitoring activities
and mitigation efforts. Wildlife Society Bulletin 24:276-283.
Schafer, J. A., and S. T. Penland. 1985. Effectiveness of Swareflex reflectors in reducing
deer-vehicle accidents. Journal of Wildlife Management 49:774-776.
Seamans, T. W., Z. J. Patton, and K. C. VerCauteren. 2003. Electrobraid fencing for use as a
deer barrier. Page 657 in C. L. Irwin, P. Garrett, and K. P. McDermott, editors.
Proceedings of the International Conference on Ecology and Transportation. Center for
Transportation and the Environment, North Carolina State University, Raleigh, USA.
Servheen, C., R. Shoemaker, and L. Lawrence. 2003. A sampling of wildlife use in relation to
structure variables for bridges and culverts under Interstate 90 between Alberton and St.
Regis, Montana. Pages 331-341 in C. L. Irwin, P. Garrett, and K. P. McDermott, editors.

19
Proceedings of the International Conference on Ecology and Transportation. Center for
Transportation and the Environment, North Carolina State University, Raleigh, USA.
Stout, R. J., R. C. Stedman, D. J. Decker, and B. K. Knuth. 1993. Perceptions of risk from deer-
related vehicle accidents: implications for public preferences for deer herd size. Wildlife
Society Bulletin 21:237-249.
Sullivan, T. L. and T. A. Messmer. 2003. Perceptions of deer-vehicle collision management by
state wildlife agency and department of transportation administrators. Wildlife Society
Bulletin 31:163-173.
Ujvári, M., H. J. Baagøe, and A. B. Madsen. 1998. Effectiveness of wildlife warning reflectors
in reducing deer-vehicle collisions: a behavioral study. Journal of Wildlife Management
62:1094-1099.
Walls, G.L. 1942. The vertebrate eye and its adaptive radiation. Cranbrook Institute of Science,
Bloomfield Hills, Michigan, USA.
Witzel, D. A., M. D. Springer, and H. H. Mollenhauer. 1978. Cone and rod photoreceptors
in the white-tailed deer, Odocoileus virginianus. American Journal of Veterinary
Research 39:699-701.
Wood, P., and M. L. Wolfe. 1988. Intercept feeding as a means of reducing deer-vehicle
collisions. Wildlife Society Bulletin 16:376-380.
Yokoyama, S., and F. B. Radlwimmer. 1998. The “five-sites” rule and the evolution of red and
green color vision in mammals. Molecular Biology and Evolution 15:560-567.
_____, _____. 1999. The molecular genetics of red and green color vision in mammals.
Genetics 153:919-932.

20
CHAPTER 2
EVALUATION OF WILDLIFE WARNING REFLECTORS FOR ALTERING
WHITE-TAILED DEER BEHAVIOR ALONG ROADWAYS1
D’Angelo, G. J., J. G. D’Angelo, G. R. Gallagher, D. A. Osborn, K. V. Miller, and R. J. Warren. 2006. Evaluation
of wildlife warning reflectors for altering white-tailed deer behavior along roadways. Wildlife Society Bulletin 34:1175-1183.
Reprinted here with permission of publisher.

21
ABSTRACT
We evaluated the behavioral responses of white-tailed deer (Odocoileus virginianus) to 4
colors of wildlife warning reflectors (red, white, blue-green, and amber) that are purported to
reduce the incidence of deer–vehicle collisions. We observed deer behaviors relative to roads
before and after installation of wildlife warning reflectors using a forward-looking infrared
camera during 90 observation nights. Our data indicate that wildlife warning reflectors did not
alter deer behavior such that deer–vehicle collisions might be prevented.
Key words: behavior, deer–vehicle collision, forward-looking infrared camera, Odocoileus
virginianus, road kill, white-tailed deer, wildlife warning reflectors.
INTRODUCTION
Deer (Odocoileus spp.)–vehicle collisions are a major concern throughout much of the
United States, accounting for human injury and death, damage to vehicles, and waste of deer as a
wildlife resource (Romin and Bissonette 1996). Most states attempt to minimize deer–vehicle
collisions through a variety of techniques, including signage, modified speed limits, highway
lighting, roadside fencing, over- or underpasses, warning whistles, habitat alteration, deer hazing,
driver awareness programs, and reflective devices (Romin and Bissonette 1996). However, few
studies have examined the efficacy of such techniques, and a distinct lack of information exists
concerning deer behavior relative to mitigation efforts.
Strieter-Lite® (Strieter Corp., Rock Island, Ill.) wildlife warning reflectors are marketed
as a proven and humane technique for reducing wildlife–vehicle collisions (www.strieter-
lite.com). These reflectors are mounted on posts along roadsides and consist of a plastic housing

22
with 2 reflective mirrors with plastic elements, which redirect light through colored lenses
(Fig. 2.1). The manufacturer claims that the reflectors deter deer from attempting road-crossings
by altering and distributing light from oncoming vehicle headlights across the road and into
roadside corridors to “provide an optical warning fence to deer” (Strieter Corp., unpublished
instruction manual:3).
Investigations of the effectiveness of wildlife warning reflectors have produced variable
results for a variety of reflector models (Gilbert 1982, Armstrong 1992, Reeve and Anderson
1993, Pafko and Kovach 1996). However, these earlier studies often were limited by sample size
and insufficient experimental design. Most studies used counts of deer carcasses along roadways
to assess reflector effectiveness, and rarely used quality controls such as video surveillance of
test sections or driver surveys to account for collisions that resulted in injured deer wandering
from the roadside. Further, previous reflector studies provided little data on the behavioral
reactions of free-ranging deer to reflector activation by the headlights of oncoming vehicles.
This is a significant omission, given that these behavioral reactions constitute the very basis for
the purported effectiveness of these reflectors.
Schafer and Penland (1985) documented a decrease in vehicle collisions with white-tailed
deer (O. virginianus) and mule deer (O. hemionus) when Swareflex® reflectors (D. Swarovski &
Co., Wattens, Austria) were used in an experiment that alternated covering and uncovering the
devices. Alternatively, Reeve and Anderson (1993) used a similar study design and concluded
that Swareflex reflectors were ineffective at reducing mule deer road kills in a migratory
corridor. Waring et al. (1991) reported that Swareflex reflectors did not alter white-tailed deer
crossing behavior; however, this conclusion was based on observations of only 14 attempted
road crossings by deer in the presence of vehicles at night. Our objective was to determine the

23
effect of 4 colors (red, white, blue-green, and amber) of Strieter-Lite reflectors in altering white-
tailed deer roadway behavior in the presence of vehicles at night.
STUDY AREA
We conducted our study at the Berry College Wildlife Refuge (BCWR) within the
11,340-ha Berry College Campus in northwestern Georgia, USA. The 1,215-ha BCWR, located
in Floyd County, lies within the Ridge and Valley physiographic province (Hodler and Schretter
1986) with elevations ranging from 172–518 m. The BCWR was characterized by campus-
related buildings and facilities interspersed with pastures, woodlots, and larger forested tracts.
Forested areas were dominated by oaks (Quercus spp.), hickories (Carya spp.), and pines (Pinus
spp.). Hunting was prohibited on BCWR and deer were abundant with an approximate density
of 40 deer/km2 (J. Beardon, Georgia Department of Natural Resources, personal
communication). The BCWR contained approximately 24 km of 2-lane paved roads (M.
Hopkins, Berry College Physical Plant, personal communication). In the past decade, 12–24
deer–vehicle collisions were reported annually on these roads (Berry College Police Department,
unpublished data). The BCWR was open to public traffic during daylight hours. After dark, only
vehicles with Berry College permits were allowed access through a gate staffed by campus
police. Vehicle traffic at night was still a regular occurrence with approximately 1,600 students
and staff residing on campus. Average traffic volume on BCWR roads was 28.8 (SE = 9.1)
vehicles/hour for the 5-hour period after sunset during our study.
We selected 2 test areas on BCWR separated by >5 km. The main campus test area was
characterized as a campus-to-farm transition area. The test section of roadway separated a <2.5-
cm-high groomed lawn of orchard grass (Dactylis glomerata), fescue (Lolium arundinaceum),

24
and white clover (Trifolium repens) from a 6-m-wide mowed roadside area of white clover,
which transitioned into a Bermuda grass (Cynodon dactylon) field used for hay production. The
mountain campus test area was composed of a groomed lawn similar in plant composition to that
on the main campus test area and was interspersed with <20 hardwood and conifer trees. The
mountain campus test area was bordered by several campus buildings, parking lots, and ponds.
METHODS
Test Area Establishment
The Strieter-Lite instruction manual indicates that the reflectors should emit light to
linear distances of ≥38.1 m. Based on this information, physical characteristics of our study
area, and equipment limitations, we defined an “area of influence” (Taylor and Knight 2003),
centered on the sections of roadway we selected for reflector testing (Fig. 2.2). The area of
influence extended 27.4 m perpendicular from the paved edges of the roadway and was 182.9 m
in length centered on the mid-line of each test area. According to the manufacturer’s claims, all
deer within the area of influence should have detected light transmitted by reflectors. Within this
area we also were able to accurately record specific deer behaviors and estimate deer
movement distances.
We installed a 3-m-high elevated observation platform located 6 m from the roadway
edge near the mid-line of each test area. We constructed 1.2-m-high plywood walls around the
seating area of the observation platform to conceal the observer and equipment from the deer.
We mounted a forward-looking infrared (FLIR) ThermaCAM B1 camera with a 12° lens (FLIR
Systems, Inc., Boston, Mass.) to the safety rail of the observation platform. The observer was
able to manipulate the FLIR in 360° rotation and ≥90° of vertical tilt. We connected the FLIR to
a 33-cm black and white monitor to ease viewing, and placed the monitor on the floor of the
25
observation platform in front of the observer. We powered the monitor with a 12-V, deep-cycle
marine battery and a 750-W direct current to alternating-current electrical power inverter.
We developed distance markers to aid our estimation of distances and to delineate the
area of influence within test areas. We designed the distance markers to collect heat during the
day, store and subsequently radiate more heat than the surrounding environment at night, thus
making the markers detectable in the FLIR. To create the distance markers, we filled 591-ml
plastic drink bottles with automobile windshield washer fluid and coated the filled bottles with
black rubberized automobile undercoating (Bondo Corp., Atlanta, Ga.). We used rot-resistant
braided nylon twine (Wallace Cordage Co., Covington, Tenn.) to attach the bottles to 102-cm-
long plastic fence posts with a steel shaft for step-in installation. On both sides of the road, we
established 5 transects on each side of the mid-line of the test area at a spacing of 18.3-m. The
transect length was perpendicular to the roadway with a starting point 9.1 m from the road edge.
Along transects, we installed 5 distance markers spaced 4.6 m apart. We determined our
distance estimation error under normal observation conditions at night by estimating distances to
random locations (n = 60) of co-workers standing within test areas. We pooled estimates from
both test areas and calculated mean estimation errors for perpendicular distances from the road as
1.57 m (SE =1.64 m) and 1.83 m (SE = 1.58 m) for lateral distances from the mid-line of the
test areas.
At each test area, we installed 15 steel U-posts (Midwest Air Technologies Inc.,
Lincolnshire, Ill.) on each side of the roadway according to installation instructions for the
Strieter-Lite Wild Animal Highway Warning Reflector System. Spacing between posts on the
same side of the road was 15.2 m with a 15.2-m perpendicular distance between lines of posts on

26
opposite sides of the road. We evenly staggered posts on opposite sides of the roadway in a
diagonal fashion. This configuration ensured total reflector coverage of the area of influence
because we installed reflectors 19 m beyond its endpoints. To facilitate deer accommodation to
study-related objects in the test areas other than the reflectors, we installed the observation
platforms, steel U-posts, and distance markers >2 weeks prior to the start of pretreatment
observations. During pretreatment phases, no reflectors were present on the posts. We installed
reflectors in daylight >8 hours prior to collecting the first observations for respective treatment
phases. On each post, we directed an upper reflector toward the roadway and directed a lower
reflector 180° opposite the roadway with the bottom of each reflector 61.0–76.2 cm above the
crown of the road. We cleaned reflectors once per week using water and lens paper. A
representative from Strieter Corporation inspected and approved our placement of reflectors on
both test areas. Animal use procedures were approved by the Institutional Animal Care and Use
Committees of the University of Georgia (IACUC # A2004-10102-0) and Berry
College (IACUC # 2003/04-06).
Behavioral Observations
We observed deer–vehicle interactions for 4 hours per night beginning 30 minutes after
sunset. The observer entered the observation platform >30 minutes prior to the start of recording
observations to reduce disturbance to deer in the area. We cancelled observation nights during
times of precipitation and heavy fog to reduce possible interference of light transmission by
water particles in the air or on reflector lenses.
We conducted 15 nights of pretreatment observations in both test areas from 18
November 2004–25 January 2005. On the main campus test area, we installed the red reflectors
on 26 January 2005 and conducted observations on 15 nights from 26 January–10 March 2005.

27
We removed the red reflectors on 11 March 2005. We installed the white reflectors on 24 March
2005 on the main campus test area and conducted observations on 15 nights from 24 March–18
April 2005. On the mountain campus test area, we installed the blue-green reflectors on 8
February 2005 and conducted observations on 15 nights from 8 February–18 March 2005. We
removed the blue-green reflectors on 19 March 2005, installed the amber reflectors on 8 April
2005, and conducted observations on 15 nights from 8 April–1 May 2005. Whereas seasonal
variations in deer behavior related to breeding occur, this source of error likely would have had
minimal effect on this experiment because we observed behavioral reactions of deer along our
test sections of roadway after peak rutting season and before fawning season occurred.
For each deer–vehicle interaction observation, the observer selected a focal animal within
the area of influence but outside of a 9-m buffer on both sides of the midline of the test area. We
established this buffer to exclude animals from observation, which, because of their proximity,
were most likely to be influenced by the presence of the observer. We chose focal animals to
examine responses of individuals at different perpendicular and lateral distances within the area
of influence and in different positions within groups of deer. We observed deer–vehicle
interactions during normal traffic, which included small- to medium-sized passenger vehicles.
We excluded observations, which included tractor trailers, buses, and other nonpassenger
vehicles because travel by these types of vehicles was rare during the night on BCWR. When
traffic was not available and deer were present in the area of influence, the observer used a 2-
way radio to instruct a co-worker in a waiting vehicle to drive through the test area. We
instructed the driver to maintain a continuous speed of about 48 km/hour and to use the vehicle’s
high-beam headlights unless other vehicles were in the test section of road. We set these
28
conditions to simulate a typical vehicle traveling on BCWR (J. Baggett, Berry College Police
Department, personal communication).
We grouped specific deer behaviors into 5 general categories, which were integral for
assessment of deer–vehicle collision risk: 1) passive, 2) active toward the road, 3) active away
from the road, 4) active parallel to the road, and 5) within the road (all behaviors within the
paved surface of the road). At 2 periods during each observation, the observer classified the
behavior of the focal animal and estimated the focal animal’s perpendicular distance from the
road edge and lateral distance from the mid-line of the test area. The observer recorded
information for period 1 as the vehicle reached a point 50-m from the beginning of the area of
influence. We selected this vehicle location for period 1 because curvatures of the test sections
of roadway ensured that the headlights of the moving vehicle did not shine on the areas of
influence until after that point. The observer recorded information for period 2 as the vehicle
passed the focal animal or as the focal animal and vehicle interacted in the roadway (Fig. 2.3).
We separated individual observations by ≥3 minutes.
Data Analysis
We scored changes in general behavior categories (responses) from period 1 to period 2
for each focal animal observation. The scoring scale ranged from those responses that had a high
likelihood of causing a deer–vehicle collision (negative responses) to those that lessened the risk
of a deer–vehicle collision (positive responses; Table 2.1). We used Chi-square tests (Sokal and
Rolf 1995) to make comparisons of behavior score categories among pretreatment and treatment
phases within individual test areas. We calculated total distance moved and perpendicular
distance moved from observation period 1 to observation period 2. We used paired t-tests (Sokal
and Rohlf 1995) to determine differences in total and perpendicular distances moved within

29
positive and negative response categories among pretreatment and treatment phases within
individual test areas.
RESULTS
From 18 November 2004–1 May 2005, we recorded 1,370 deer responses to vehicles
during 90 nights of observations (4 hrs each; Table 2.2). Irrespective of experimental phase or
reflector color, we classified the largest proportion of behavioral responses as neutral. Changes
in behavior were similar within the defined levels of positive and negative responses; thus, we
present results as responses of the respective groups.
Main Campus Test Area
Behavioral responses.—Comparing the pretreatment to the red-reflector treatment, we
observed a decrease in the proportion of positive behavioral responses and an increase in the
proportion of negative responses (Table 2.2; χ42 = 25.99, P ≤ 0.001). From pretreatment to the
white reflector treatment, we observed a decrease in the proportion of neutral behavioral
responses and an increase in the proportion of negative and positive
responses (χ42 = 42.65, P ≤ 0.001).
Distance moved.—The perpendicular distance of the focal animal from the roadway for
period 1 was less during pretreatment than during the red reflector treatment (Table 2.3; t =
−5.77, df = 341, P ≤ 0.001). However, for deer demonstrating positive responses, we detected
no differences in total distance moved (t = −0.94, df = 74, P = 0.348) or perpendicular distance
moved from the roadway (t = −1.31, df = 74, P = 0.193). For deer demonstrating negative
responses, total distance moved was greater during pretreatment than during the red reflector
treatment (t = 3.39, df = 52, P = 0.001) and we detected no difference in perpendicular distance
moved toward the roadway (t = 1.90, df = 52, P = 0.063).

30
The perpendicular distance of the focal animal from the roadway for period 1 was less
during pretreatment than during the white reflector treatment (Table 2.3; t = −2.12, df = 454, P =
0.035). However, for deer demonstrating positive responses, we detected no difference in the
total distance moved (t = 0.180, df = 81, P = 0.858) or perpendicular distance moved away from
the roadway (t = 0.055, df = 79, P = 0.956). For negative responses, total distance moved (t =
3.58, df = 24, P = 0.002) and perpendicular distance moved toward the roadway (t = 3.05, df =
25, P = 0.005) were greater during pretreatment than during the white reflector treatment.
Mountain Campus Test Area
Behavioral responses.—From pretreatment to the blue-green reflector treatment, the
proportion of behavioral responses increased in the neutral and negative behavior categories and
correspondingly decreased in the positive response category (Table 2.2; χ42 = 14.37, P = 0.006).
From pretreatment to the amber reflector treatment, we observed a decrease in the proportion of
neutral behavioral responses and increases in the proportion of negative and positive responses
(Table 2.2; χ42 = 52.69, P ≤ 0.001).
Distance moved.—The perpendicular distance of the focal animal from the roadway for
period 1 was similar (t = 1.04, df = 525, P = 0.301) during the pretreatment and blue-green
reflector treatment (Table 2.3). For deer demonstrating positive responses, total distance moved
(t = 2.40, df = 102, P = 0.018) and perpendicular distance moved from the roadway (t = 1.66, df
= 100, P ≤ 0.001) were greater during pretreatment than during the blue-green reflector
treatment. For deer demonstrating negative responses, we detected no difference in total
distance moved (t = 1.48, df = 80, P = 0.143) or perpendicular distance moved toward the
roadway (t = 0.417, df = 80, P = 0.678) among the pretreatment and blue-green reflector
treatment (Table 2.3). During the blue-green reflector treatment, we observed a deer–vehicle

31
collision within the area of influence. The deer initially moved at a trot toward the roadway and
stopped at a perpendicular distance of 10 m from the roadway before running into the path of the
vehicle. The deer was struck in the hindquarters and moved >150 m from the roadway out of
sight of the observer. The vehicle stopped immediately after the collision and then
continued driving.
The perpendicular distance of the focal animal from the roadway for period 1 was less
(t = 2.23, df = 500, P = 0.026) during the amber reflector treatment than during the pretreatment
(Table 2.3). However, for deer demonstrating positive responses, the total distance moved (t =
3.98, df = 108, P ≤ 0.001) and perpendicular distance moved from the roadway (t = 4.29, df =
98, P ≤ 0.001) were greater during the pretreatment. For deer demonstrating negative responses,
there was no difference in the total distance moved (t = 1.28, df = 107, P = 0.203) among the
pretreatment and the amber reflector treatment. However, deer demonstrating negative
responses during the pretreatment moved a greater perpendicular distance toward the
roadway (t = 2.21, df = 107, P = 0.029).
Effect on Animals Moving Toward the Road
To further assess the potential of wildlife warning reflectors to reduce deer–vehicle
collisions, we separately analyzed a subset of 221 observations where the focal animals were
actively moving (i.e., walking or running) toward the road before the vehicle entered the test
area. These observations represent those most likely to have resulted in a deer-vehicle collision.
During the pretreatment phase when no reflectors were in place, the focal animal reacted in a
positive manner and stopped moving toward the road in 64% of the observations (n = 36, pooled
for both test areas). In comparison, the proportion of positive behavioral responses was lower
for all reflector treatments than for the pretreatments (red reflector treatment = 13%, n = 24, χ12

32
= 25.60, P ≤ 0.001; white reflector treatment = 55%, n = 92, χ12 = 3.02, P = 0.082;
blue-green reflector treatment = 14%, n = 21, χ12 = 12.50, P < 0.001; amber reflector
treatment = 50%, n = 48, χ12 = 4.46, P = 0.035).
DISCUSSION
Descriptions of deer behavior relative to roadways are limited in the literature. Our
pretreatment observations of deer responses to vehicles indicated that deer tend to avoid crossing
roads in the presence of vehicles. Our data were consistent with observations by Waring et al.
(1991) of white-tailed deer road-crossing behavior in Crab Orchard National Wildlife Refuge,
Illinois. Before Swareflex reflectors were installed, Waring et al. (1991) observed that 71.4% (n
= 89) of crossings by white-tailed deer were completed without a deer–vehicle interaction on a 2-
lane highway, which experienced heavy traffic. Although deer–vehicle collisions are common
and problematic (Sullivan and Messmer 2003), when considering the abundance of deer and the
density of roads throughout their range (Federal Highway Administration 1998), deer–vehicle
collisions likely are rare compared to the frequency of crossings attempted by deer. However,
the road-crossing success of deer in localized areas may be impacted by factors including vehicle
speed, traffic volume and patterns, vehicle types, motorist awareness of deer, weather conditions,
ambient and vehicle-produced light levels, characteristics of the habitat–roadway interface, and
mitigation strategies.
Our study questions claims that wildlife warning reflectors “deter deer from crossing the
highway when reflecting vehicle headlights” (Strieter Corp., unpublished instruction manual:27).
Our results demonstrated that deer exposed to each of the 4 colors of reflectors we tested were
more likely to be involved in negative deer–vehicle interactions than without the devices present.
Further, any increase in the proportion of positive behavioral responses was coincident with an

33
equal or greater increase in the proportion of negative responses within a given treatment phase.
Likewise, when we observed an increase in neutral responses, similar decreases in positive and
negative responses were evident. Our analysis focusing only on deer moving toward the
roadway indicated that the wildlife warning reflectors appeared to provide no reduction in the
potential of a negative deer–vehicle interaction.
Although group size may affect flight response in deer (LaGory 1987) and road-crossing
behavior, we chose not to evaluate its effect on deer in our study because highway departments
that use reflectors have no control over whether deer attempt road crossings singly or as a
member of a group. Determining age and sex of focal animals was not always possible using
FLIR, so we did not consider the effects of these variables in our analyses. However, >90% of
the deer we observed probably were does.
In the only previous study of deer behavior near roads, Waring et al. (1991) also reported
that roadside reflectors (Swareflex) had no impact on the crossing behavior of white-tailed deer
or the incidence of road kills. Ujvári et al. (1998) examined the habituation of fallow deer
(Dama dama) to repeatedly occurring light reflections from a red WEGU reflector (Walter
Dräbing KG, Kassel, Germany) placed directly in front of a bait site. During the first
experimental night, fallow deer fled from the stimulus in 99% of cases, but over the remaining
16 experimental nights, deer exhibited increasing indifference to reflections, which was
explained by habituation to the stimulus. To examine for possible acclimatization, we made
comparisons of behavior score categories among entire pretreatment phases and successive 5-
night blocks of each treatment phase (i.e., nights 1–5, 5–10, and 10–15) within individual test
areas (G. J. D’Angelo, unpublished data). Generally, during our treatment phases, we observed
the greatest differences in behavioral responses from pretreatment to treatment nights 1–5, but

34
these differences were not indicative of flight and alarm as in Ujvári et al. (1998). Rather, we
observed similar changes in positive and negative responses, which corresponded to an opposite
shift in neutral responses. We detected the greatest shifts in behavioral responses from
pretreatment levels during the white and amber reflector treatments. Since we tested these
reflector treatments during spring versus autumn and winter when the red and blue-green
reflectors were tested, it is possible that deer responses to reflectors may be influenced by
seasonal differences.
Electrophysical measurements of the spectral mechanisms in white-tailed deer have
shown that peak sensitivity of deer color-vision is well below the long wavelength of red (Jacobs
et al. 1994), which is the most commonly marketed color of wildlife warning reflectors.
VerCauteren et al. (2003) concluded that deer were not frightened by 2 models of red laser
beams because deer could not detect the red color or the intense brightness of the lasers. Based
on characteristics of deer color-vision (Jacobs et al. 1994) and the assumption that reflectors
would be effective, we hypothesized that the ranked order of effectiveness in deer–vehicle
collision risk prevention would follow a gradient with short-wavelength reflector-lens colors
being most effective and long-wavelength lens colors being least effective: 1) blue-green
reflectors (short wavelengths), 2) white reflectors (short, medium, and long wavelengths), 3)
amber reflectors (medium and long wavelengths), and 4) red reflectors (long wavelengths), and
5) pretreatment (no wavelengths reflected). Our experiments demonstrated nearly opposite
results with individual reflector treatments apparently increasing deer–vehicle collision risk from
pre treatment levels. We observed the highest level of deer–vehicle collision risk during the
blue-green reflector treatment phase with slightly lower levels of risk during the amber, red, and

35
white reflector phases in respective order of decreased risk. This suggests that negative
responses by deer may directly increase with greater perception of light from the reflectors.
Evidence for nocturnal mammals with visual systems comparable to white-tailed deer
(i.e., tapetum lucidum, retina dominated by rod photoreceptors, and oval-shaped pupil with a
large opening) suggests that the rapidity of their visual adaptation from darkness to abrupt
increases in light (e.g., vehicle headlights) may be considerably slower than that of diurnal
species like humans (Ali and Klyne 1985). A possible explanation for the increase in negative
deer-vehicle interactions from pretreatment levels during each of the reflector treatments in our
study may be that light from reflectors in combination with vehicle headlights overwhelmed the
deer visual system. However, Sielecki (2001) reported that the primary reflected light intensity
of Swareflex and Strieter-Lite reflectors was minimal. Sielecki (2001) found that all models,
regardless of lens color, reflected <0.1 lux at a distance of 2 m, which is an illumination level
less than that of a full Moon on a clear night (0.1 lux). Alternatively, Sielecki (2001) also
observed a more intense white surface reflection from the external lens surface of the Swareflex
and Strieter-Lite reflectors, which had a luminance value “several times to several hundred times
higher than that of coloured light from the coloured lenses” (Sielecki 2001:484). During our
trials, we also observed the white surface reflection described by Sielecki (2001). However, this
reflection occurred as the vehicle passed an individual reflector, which logically is too late to
prevent deer from entering the path of an oncoming vehicle. In our observations the white
surface reflection transmitted no detectable light to diagonally or laterally adjacent reflectors.
MANAGEMENT IMPLICATIONS
We concluded that the wildlife warning reflectors we tested did not alter deer behavior
such that deer–vehicle collisions might be prevented. Our data indicated that deer exhibit an

36
increase in negative behavioral responses toward vehicles in the presence of reflectors. We
suggest that until further research on deer–vehicle collision reduction strategies becomes
available, management efforts should focus on 1) implementing proper deer-herd management
programs, 2) controlling roadside vegetation to minimize its attraction to deer and maximize
visibility for motorists, 3) increasing motorist awareness of the danger associated with deer–
vehicle collisions, 4) thoroughly monitoring deer–vehicle collision rates, and 5) encouraging
communication and cooperation among governments, wildlife researchers, highway managers,
motorists, and others involved in issues of deer–human conflict.
Although many aspects of deer biology are well studied, we lack basic knowledge of
anatomy and physiology related to the sensory capabilities of deer. Advancing this information
may prove integral to the development of effective and economically feasible strategies to
minimize deer–vehicle collisions. Further, our understanding of deer behavior related to most
mitigation strategies is inadequate. Future development of deer-deterrent devices and strategies
should be guided by knowledge of deer senses and behavior. Prior to extensive deployment of
mitigation strategies in the field, researchers should empirically test their effectiveness in altering
deer road-crossing behavior and ultimately the potential of such techniques for preventing deer–
vehicle collisions.
ACKNOWLEDGEMENTS
This study was funded by the Georgia Department of Transportation (GDOT) through the
Governor’s Office of Highway Safety and the National Highway Traffic Safety Administration
under GDOT Task Order # 01-03, Project # 2008. D. Jared of GDOT and S. Castleberry, A. De
Chicchis, and M. Mengak of the University of Georgia provided helpful comments on this
manuscript. We thank C. Gilroy, D. Hestad, K. Miller, R. Norton, D. Sellers, and T. Turner for

37
assisting with reflector trials. Georgia Department of Natural Resources Wildlife Resources
Division provided housing during the study. We acknowledge the assistance of Berry College
staff from the Police Department, Department of Animal Science, and Land Resources. Berry
College Land Resources also provided an observation platform for use during the study.
C. Killmaster of the University of Georgia provided technical advice. We gratefully thank R.
Cooper of the University of Georgia and R. Prince of Berry College for statistical advice.
J. Bond of the University of Georgia created Fig. 2.1. This manuscript does not constitute an
endorsement or censure of any of the products mentioned.
LITERATURE CITED
Ali, M. A., and M. A. Klyne. 1985. Vision in vertebrates. Plenum, New York,
New York, USA.
Armstrong, J. J. 1992. An evaluation of the effectiveness of Swareflex deer reflectors. Ontario
Ministry of Transportation, Research and Development Branch, Report No. MAT-91-12,
Downsview, Canada.
Federal Highway Administration. 1998. Our nation’s highways: selected facts and figures.
United States Department of Transportation, Federal Highway Administration,
Publication FHWA-PL-98-015, Washington, D.C., USA.
Gilbert, J. R. 1982. Evaluation of deer mirrors for reducing deer–vehicle collisions. U.S.
Federal Highway Administration Report No. FHWA-RD-82-061,
Washington, D.C., USA.
Hodler, T. W., and H. A. Schretter. 1986. The atlas of Georgia. University of Georgia,
Athens, USA.

38
Jacobs, G. H., J. F. Deegan, J. Neitz, B. P. Murphy, K. V. Miller, and R. L. Marchinton. 1994.
Electrophysical measurements of spectral mechanisms in the retinas of two cervids:
white-tailed deer (Odocoileus virginianus) and fallow deer (Dama dama). Journal of
Comparative Physiology 174:551–557.
LaGory, K. E. 1987. The influence of habitat and group characteristics on the alarm and flight
response of white-tailed deer. Animal Behaviour 35:20–25.
Pafko, F., and B. Kovach. 1996. Minnesota experience with deer reflectors. Pages 130–139 in
G. L. Evink, P. Garrett, D. Zeigler, and J. Berry, editors. Proceedings of the International
Conference on Ecology and Transportation. Center for Transportation and Environment,
North Carolina State University, Raleigh, USA.
Reeve, A. F., and S. H. Anderson. 1993. Ineffectiveness of Swareflex reflectors at reducing
deer–vehicle collisions. Wildlife Society Bulletin 21:127–132.
Romin, L. A., and J. A. Bissonette. 1996. Deer–vehicle collisions: status of state monitoring
activities and mitigation efforts. Wildlife Society Bulletin 24:276–283.
Schafer, J. A., and S. T. Penland. 1985. Effectiveness of Swareflex reflectors in reducing deer–
vehicle accidents. Journal of Wildlife Management 49:774–776.
Sielecki, L. E. 2001. Evaluating the effectiveness of wildlife accident mitigation installations
with the Wildlife Accident Reporting System (WARS) in British Columbia. Pages 473–
489 in Proceedings of the international conference on ecology and transportation. Center
for Transportation and the Environment, North Carolina State University, Raleigh, USA.
Sokal, R. R., and F. J. Rohlf. 1995. Biometry. Third edition. W. H. Freeman, New York,
New York, USA.
39
Sullivan, T. L., and T. A. Messmer. 2003. Perceptions of deer–vehicle collision management by
state wildlife agency and department of transportation administrators. Wildlife
Society Bulletin 31:163–173.
Taylor, A. R., and R. L. Knight. 2003. Behavioral responses of wildlife to human activity:
terminology and methods. Wildlife Society Bulletin 31:1263–1271.
Ujvári, M., H. J. Baagøe, and A. B. Madsen. 1998. Effectiveness of wildlife warning reflectors
in reducing deer–vehicle collisions: a behavioral study. Journal of Wildlife
Management 62:1094–1099.
VerCauteren, K. C., S. E. Hygnstrom, M. J. Pipas, P. B. Fioranelli, S. J. Werner, and B. F.
Blackwell. 2003. Red lasers are ineffective for dispersing deer at night. Wildlife
Society Bulletin 31:247–252.
Waring, G. H., J. L. Griffis, and M. E. Vaughn. 1991. White-tailed deer roadside behavior,
wildlife warning reflectors, and highway mortality. Applied Animal Behaviour
Science 29:215–223.
Associate editor: Jacob Bowman

40
Figure 2.1. Wildlife warning reflectors mounted on a steel U-post within the area of influence,
Berry College Campus and Wildlife Refuge, Mount Berry, Georgia, during 2004–2005.

41

42
Figure 2.2. Experimental section of roadway established for evaluating the effect of wildlife
warning reflectors on the behavior of white-tailed deer along roadways on Berry College
Campus and Wildlife Refuge, Mount Berry, Georgia, during 2004–2005.

43

44
Figure 2.3. Deer–vehicle interaction as captured using a forward-looking infrared camera on 19
April 2005 during the amber-colored wildlife warning reflector treatment phase on Berry College
Campus and Wildlife Refuge, Mount Berry, Georgia.

45
46
Table 2.1. White-tailed deer behavior scores for wildlife warning reflector testing based on
changes in deer behavior near roads from before a vehicle entered the test area (period 1) to as
the vehicle passed the deer or interacted with the deer in the roadway (period 2) on the Berry
College Campus and Wildlife Refuge, Mount Berry, Georgia, during 2004–2005. Negative
scores indicated increased risk of a deer–vehicle collision (DVC), neutral scores indicated no
change in DVC risk, and positive scores indicated decreased DVC risk.

47
Behavior score Period 1 Period 2
−2 Passive Within road
−2 Active toward road Within road
−2 Active away from road Within road
−2 Active parallel to road Within road
−2 Within road Within road
−1 Passive Active toward road
−1 Active toward road Active toward road
−1 Active away from road Active toward road
−1 Active away from road Active parallel to road
−1 Active parallel to road Active toward road
0 Passive Passive
0 Passive Active parallel to road
0 Active away from road Passive
0 Active parallel to road Active parallel to road

48
Behavior score Period 1 Period 2
+1 Passive Active away from road
+1 Active toward road Passive
+1 Active toward road Active parallel to road
+1 Active away from road Active away from road
+1 Active parallel to road Passive
+1 Active parallel to road Active away from road
+2 Active toward road Active away from road
+2 Within road Passive
+2 Within road Active away from road
+2 Within road Active parallel to road
+2 Within road Active toward road

49
Table 2.2. Proportions (%) of white-tailed deer behavioral response scores exhibited during
each of the experimental phases of wildlife warning reflector testing on Berry College Campus
and Wildlife Refuge, Mount Berry, Georgia, during 2004–2005.

50
Behavior score
Negative responses Neutral Positive responses
Test area Experimental phase n −2 −1 0 +1 +2
Main campus Pretreatment 161 3.73 2.48 70.81 18.01 4.97
Red reflectors 182 6.04* 7.14* 69.78 16.48* 0.55*
White reflectors 295 7.12* 10.50* 51.10* 21.02* 10.20*
Mountain campus Pretreatment 307 2.61 3.58 72.96 16.94 3.91
Blue-green reflectors 226 3.09** 6.63** 80.00** 8.85** 1.33**
Amber reflectors 199 9.04* 7.54* 54.77* 20.10* 8.54*
* P ≤ 0.001 for differences observed in behavioral responses among pretreatment and treatment phases as determined by
Chi-square analysis.
** P ≤ 0.01 for differences observed in behavioral responses among pretreatment and treatment phases as determined by
Chi-square analysis.

51
Table 2.3. Mean (SE) perpendicular distance of the focal animal from the road as the vehicle
entered the test area (period 1), and mean (SE) perpendicular and total distances moved from
period 1 to when the vehicle passed the deer or the deer and vehicle interacted in the roadway
(period 2), for negative and positive behavioral responses of white-tailed deer during
experimental phases of wildlife warning reflector testing on Berry College Campus and Wildlife
Refuge, Mount Berry, Georgia, during 2004–2005.

52
Perpendicular
distance
Perpendicular distance
moved Total distance moved
Test area Experimental phase n Period 1
Negative
responses
Positive
responses
Negative
responses
Positive
responses
Main campus Pretreatment 161 10.4 (7.8) 8.9 (7.1) 4.8 (4.2) 13.1 (10.4) 5.6 (4.9)
Red reflectors 182 15.5 (8.6)* 5.9 (4.4) 6.0 (3.8) 6.0 (4.6)* 6.4 (3.9)
White reflectors 295 12.1 (8.0)** 4.2 (3.7)** 4.8 (3.4) 5.2 (4.3)** 5.5 (4.1)
Mountain campus Pretreatment 307 13.6 (7.9) 4.7 (3.7) 6.4 (5.0) 9.3 (8.3) 7.8 (6.3)
Blue-green reflectors 226 12.9 (7.8) 4.4 (3.0) 3.6 (2.4)* 6.7 (6.7) 4.9 (3.1)**
Amber reflectors 199 11.9 (8.2)** 3.3 (2.9)** 3.6 (1.9)* 6.8 (10.8) 4.4 (2.9)*
* P ≤ 0.001 for differences observed in perpendicular distances for period 1 and perpendicular and total distances moved among
pretreatment and treatment phases as determined by Chi-square analysis.
** P ≤ 0.05 for differences observed in perpendicular distances for period 1and perpendicular and total distances moved among
pretreatment and treatment phases as determined by Chi-square analysis.

53
CHAPTER 3
VISUAL SPECIALIZATION OF AN HERBIVORE PREY SPECIES,
THE WHITE-TAILED DEER2
D’Angelo, G. J., G. A. Williams, M. T. Pardue, D. A. Osborn, G. R. Gallagher , R. J. Warren., and K. V. Miller. To
be submitted to Canadian Journal of Zoology.
54
ABSTRACT
To gain knowledge of visual specializations influencing the behavior of white-tailed deer
(Odocoileus virginianus (Zimmerman, 1780)), we examined gross eye characteristics, structural
organization of the retina, and the density and distribution of cone photoreceptors. White-tailed
deer possess ocular features similar to other ungulates including a horizontal slit pupil, reflective
tapetum lucidum, typical retinal structure, and cone photoreceptors concentrated in a horizontal
visual streak. The tapetum improves sensitivity in low-light conditions. The visual streak
provides deer with enhanced surveillance of a broad area. In daylight, the spatial association of
the visual streak and tapetum likely improves the contrast of visual scenes and perception of
color. The horizontal slit pupil protects the retina of deer in bright light conditions and
concentrates light on the visual streak for improved acuity. As expected for a crepuscularly
active prey species, the visual system of white-tailed deer is specialized for sensitivity in low
light conditions and detection of predators.
INTRODUCTION
White-tailed deer (Odocoileus virginianus (Zimmerman, 1780)) are widely extant from
the tropics to the arctic in a variety of habitats ranging from densely vegetated coastal wetlands
to open prairies (Geist 1998). Their circadian activity patterns are typically described as
arrhythmic with peaks in activity near dawn and dusk (Marchinton and Hirth 1984). In diverse
habitats and lighting conditions, whitetails must rely on vision for avoidance of predators,
foraging, intraspecific communication, and general negotiation of their home ranges. Although
many aspects of their biology have been studied thoroughly, the visual abilities of white-tailed
deer continue to be the subject of much discussion and conjecture within the scientific and deer
hunting communities. Knowledge of deer vision may provide a foundation toward

55
understanding deer behavior and anti-predation strategies, and may be useful for developing
physiologically based strategies to reduce deer-human conflicts.
The basic structure of the eye of white-tailed deer is of the typical mammalian form
(Walls 1942). An image in its most basic composition, photons of light, enters the mammalian
eye through the cornea, passes through the aqueous humor into the pupil opening of the iris and
into the lens. Light from the lens passes through the vitreous body, and strikes the retina. The
cornea is the first mechanism to refract light. The pupil restricts the amount of light entering the
rest of the eye, and the lens inverts and focuses the image on the retina (Ali and Klyne 1985).
The retina is an extension of the optic brain, and is organized in layers of interconnected cells,
the most prominent of which are the rod and cone photoreceptors. The rods are responsible for
vision in low-light conditions, whereas the cones enable color vision and distinguish fine detail.
Light forming the image is absorbed by the photoreceptors in the retina and is sent via the optic
nerve to the brain for interpretation (Ali and Klyne 1985). The other cells composing the retina
are designed to transmit information from and support the function of the photoreceptors. These
include the ganglion cells, bipolar cells, horizontal cells, Müller glial cells, and amacrine
cells (Cohen 1992).
There are 3 nuclear layers in the mammalian retina, including the ganglion cell layer, the
inner nuclear layer, and the outer nuclear layer. The ganglion cells form the nerve layer closest
to the vitreous chamber. The inner nuclear layer contains the nuclei of the horizontal, bipolar
and amacrine cells. The outer nuclear layer, containing the nuclei of the rods and cones, is the
outermost nerve layer, which light reaches as it passes through the eye. Between the inner
nuclear layer and the ganglion cell layer is the inner plexiform layer. Within the inner plexiform

56
layer, synaptic connections are made involving bipolar neurons, amacrine cells, and ganglion
cells (Cohen 1992). Between the outer nuclear layer and the inner nuclear layer, lies the outer
plexiform layer in which synaptic connections are made among the horizontal cells, bipolar
neurons, and the photoreceptors (Cohen 1992). The photoreceptors transmit information to the
ganglion cells via synaptic connections with bipolar cells (Ali and Klyne 1985). Ganglion cells
can have extensively spreading dendrites, so each ganglion cell may receive information from
many rods and cones (Cohen 1992). Further lateral transmissions are facilitated by the
horizontal and amacrine cells (Ali and Klyne 1985). The axons of the ganglion cells form the
optic nerve fibers, which are routed throughout the retina and leave the eye at the optic nerve
head (Cohen 1992). The retinal structures are bound by the Müller glial cells, which extend in
height the full thickness of the retina (Cohen 1992). Characteristics of the nuclear layers can
reflect retinal adaptations among species.
Witzel et al. (1978) confirmed the presence of rods and cones in the white-tailed deer
retina. They found cones at densities of about 10 000/mm2 in the central retina, however their
examination did not include systematic surveys across the entire retina or classification of
different types of cones. With electroretinogram flicker photometry, Jacobs et al. (1994)
detected the presence of 2 classes of cone photopigments in white-tailed deer. Staknis and
Simmons (1990) failed to identify the presence of cones, but rods were readily visible at all
locations they sampled with scanning and transmission electron microscopy. The discrepancies
among the aforementioned studies suggest that cones may not be evenly distributed throughout
the retina of white-tailed deer.
Based on data from other ungulates, Müller-Schwarze (1994) speculated that all species
of deer have a visual streak corresponding to a horizontal band of increased cellular density in

57
the retina, which affords them increased acuity. Recently, Ahnelt et al. (2006) found that 2
species of cervids, red deer (Cervus elaphus (Linnaeus 1758)) and roe deer (Capreolus capreolus
(Linnaeus 1758)), have an arrangement of medium-wavelength cones characteristic of a
horizontal visual streak. No data exist on the density and distribution of cones throughout the
white-tailed deer retina. Our objectives were: 1) to describe the gross morphology of the white-
tailed deer eye integral to understanding retinal function, 2) to examine the microscopic structure
of the white-tailed deer retina, 3) to determine the density and distribution of cones in the white-
tailed deer retina to identify whether they possess a visual streak.
MATERIALS AND METHODS
Study Area and Animals
White-tailed deer were collected on the Daniel B. Warnell School of Forestry and Natural
Resources Whitehall Experimental Forest (WEF), an 337-ha property on the campus of the
University of Georgia, Athens, Georgia. WEF was located in the Piedmont Uplands
physiographic province, and was bordered on 3 sides by the Oconee River. The topography of
WEF was characterized by rolling hills separated by small creek drainages. Dominant cover
types included pine (Pinus spp.) plantations of various ages, and mixed pine and deciduous
forests. Forested areas were interspersed with hay fields, small ponds, roads and buildings.
Dissection and Gross Measurements
All animal procedures were performed following the Canadian Journal of Zoology
guidelines, with prior approval from the University of Georgia Institutional Animal Care and Use
Committee (#A2004-10102-0), and under the authorization of a Georgia Department of Natural
Resources Wildlife Resources Division scientific collection permit (#29-WSF-05-115).

58
Free-ranging white-tailed deer were euthanized by sharpshooting with a high-powered
rifle. Gross eye measurements were made with digital vernier calipers (Mitutoyo Corporation,
Japan) accurate to +0.2 mm. Immediately post-mortem, interocular distance was measured, a
dorsal orientation mark was created in the cornea with a heated dissecting needle, and the eyes
were enucleated. The external gross eye measurements included: axial length, vertical and
horizontal equatorial diameters, vertical and horizontal corneal diameters, depth of the anterior
chamber, and depth of the vitreous chamber.
One eye of each deer was used for gross external measurements and then dissected to
obtain measurements of corneal thickness (central and peripheral), and lens diameter and
thickness. The remaining eyecups were post-fixed in 4% paraformaldehyde for 24 hours. The
retina was then dissected from the eyecup and the tapetum lucidum, and radial incisions were
made to flatten the retina in preparation for subsequent mounting on slides. Following
processing of the eyes, we aged deer by tooth wear and replacement criteria
(Severinghaus 1949).
Histology
For the opposite eye of each deer, gross external measurements were made and then a
solution of 2% paraformaldehyde/2.5% glutaraldehyde was injected into the anterior and vitreous
chambers with a syringe and small gauge needle. The whole eye was immersed in a solution of
2% paraformaldehyde/2.5% glutaraldehyde for >24 hours. Subsequently, each eye was
equatorially bisected. Orientation of all tissue samples were noted throughout processing.
From the posterior segment of the eye, a 4-5 mm wide vertical band centered on the optic
nerve head was dissected. From this band, 5 2-mm2 tissue samples were excised from sites
centered: 1) 4 mm superior of the optic nerve head, 2) centered on the optic nerve head, 3) 2 mm
59
inferior of the optic nerve head, 4) 2 mm temporal of the optic nerve head, and 5) 4 mm temporal
of the optic nerve head. Tissue samples were dehydrated through a graded series of alcohols,
embedded in plastic, and serially sectioned (thickness = 0.5 µm) on an ultramicrotome using a
diamond knife. All tissue sections were stained with toluidine blue.
Using a light microscope (Leica Microsystems Inc., Bannockburn, USA) and CCD
camera (Leica Microsystems Inc., Bannockburn, USA) tissue sections were photographed.
Micrographs were imported into Image-Pro Plus software (Media Cybernetics, Bethesda, USA),
and the thickness of each individual retinal layer measured.
Immunohistochemistry
All immunohistochemical steps were performed at 4 C° on a rotator. Retinas were
immersed in phosphate buffered saline (PBS) for 3 5-minute rinses followed by a 1-hour rinse.
Retinas were immersed for 12 hours in 10% normal goat serum diluted in a solution of PBS,
bovine serum albumin, Triton X, and sodium azide (PBTA). Primary antibodies diluted in
PBTA were applied to retinas for 72 hours. Primary antibodies consisted of either antisera
JH455 (1:5000 dilution) to label the short wavelength cone (S cone) opsin or antisera JH492
(1:5000 dilution) to label the medium wavelength cone (M cone) opsin. Following incubation in
the primary antibody, retinas were again rinsed in PBTA, followed by incubated in goat anti-
rabbit biotinylated secondary antibody diluted in PBTA for 24 hours. Before mounting, retinas
were rinsed and then flat-mounted in mounting medium (Vectashield Laboratories, Inc.,
Burlingame, USA). A coverslip was applied and nail polish was used to seal the coverslip.
Shrinkage of retinal tissue was considered to be negligible.
To count cones, 1-mm intervals were surveyed across the retina in 0.0024-mm2 sampling
windows using a fluorescent light microscope (Nikon, Melville, USA) and a CCD camera

60
(Princeton Scientific Instruments, Monmouth Junction, USA). Cone distribution maps were
developed for densities of S cones and M cones of individual retinas.
Data Analyses
Mean gross eye measurements were calculated for fawns (0.5 years old) and adults (>1.0
years old). We calculated lens thickness ratio by dividing lens thickness by axial length. Gross
eye measurements were compared between fawns and adults with a Student’s t test.
Measurements were pooled from all sample locations to calculate mean retinal layer
thickness. To examine age effects on the thickness of retinal layers, a linear regression was
conducted using Statistix Version 8.0 software (Analytical Software, Tallahassee, USA) with age
specified as the independent variable and layer thickness specified as the dependent variable.
The mean photoreceptor density/mm2 for each retina labeled in immunohistochemical
experiments was calculated and the photoreceptor density/mm2 was averaged for all retinas
labeled with either S cone opsin or M cone opsin.
RESULTS
From 22-28 November 2006, eyes from 6 free-ranging female white-tailed deer were
obtained, including 3 fawns (approximately 0.5 years old) and 3 adults (2.5-years old, n = 1; 3.5-
years old, n = 1; 6.5-years old, n = 1). All deer included in our sample appeared healthy with no
signs of ocular disease. The eyes of deer we examined were approximately spherical (Table 3.1,
Figure 3.1). The corneas were oval with the length of the horizontal corneal diameter exceeding
the length of the vertical corneal diameter (t[22] = -4.20, P = 0.0002, n = 12). With the exception
of central and peripheral corneal thicknesses, all gross measurements of the eyes of adult deer
exceeded those of fawns. However, lens thickness ratio did not differ among fawns and adults
(pooled mean = 0.3, SE = 0.01, t[4] = -1.76, P = 0.08, n = 6). The pupil was a horizontal slit.

61
The tapetum lucidum was a prominent half moon shape radiating from a point on its
inferior border centered approximately 1 mm superior of the optic nerve head, and extending
about two-thirds into the superior retina (Figure 3.2). The inferior border of the tapetum was
nearly horizontal. The tapetum was iridescent, and reflected an azure blue color centrally
transitioning to blue-green and yellow in its periphery.
The thickness of the outer nuclear layer decreased with age (r2 = 0.686, P = 0.042, df =
5)(Figures 3.3, 3.4). But, the thickness of other retinal layers was not related to age (ganglion
cell layer: r2 = 0.081, P = 0.584, df = 5; inner plexiform layer: r2 = 0.113, P = 0.514, df = 5;
inner nuclear layer: r2 = 0.539, P = 0.096, df = 5; outer plexiform layer: r2 = 0.008, P = 0.865, df
= 5; outer and inner segments of photoreceptors: r2 = 0.202, P = 0.371, df = 5). Mean total
retinal thickness for all deer was 227.1 micrometers (SE = 48.9, n = 6).
The density of M cones averaged 16 414/mm2 (range = 4717, n = 3) ranging from an
average minimum of 7322/mm2 (range = 500, n = 3) to an average maximum of 35 700/mm2
(range = 12 832, n = 3; Figure 3.5). The area of maximum density of M cones was characteristic
of a horizontal visual streak approximately 2-3 mm superior of the optic nerve head.
We found S cones at densities lower than the density of M cones (Figure 3.6). The
density of S cones averaged 1602/mm2 (range = 317, n = 2) ranging from an average minimum
of 442/mm2 (range = 50, n = 2) to an average maximum of 4883/mm2 (range = 1433, n = 2).
DISCUSSION
The size and spherical shape of the white-tailed deer eye was similar to the human eye
(Markowitz and Morin 1985, Howland et al. 2004). In comparison to other vertebrates, white-
tailed deer have a large eye relative to their body size and in absolute terms (Walls 1942, Ali and
Klyne 1985, Howland et al. 2004). Larger eyes have increased distance between the cornea/lens
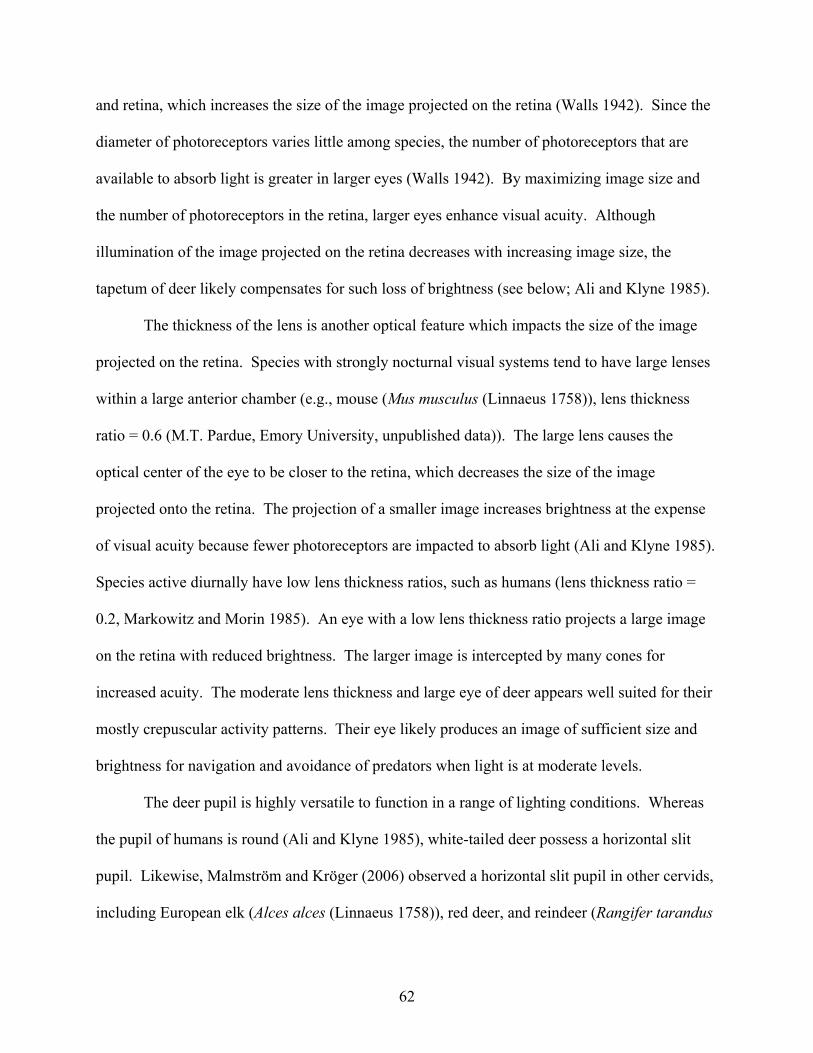
62
and retina, which increases the size of the image projected on the retina (Walls 1942). Since the
diameter of photoreceptors varies little among species, the number of photoreceptors that are
available to absorb light is greater in larger eyes (Walls 1942). By maximizing image size and
the number of photoreceptors in the retina, larger eyes enhance visual acuity. Although
illumination of the image projected on the retina decreases with increasing image size, the
tapetum of deer likely compensates for such loss of brightness (see below; Ali and Klyne 1985).
The thickness of the lens is another optical feature which impacts the size of the image
projected on the retina. Species with strongly nocturnal visual systems tend to have large lenses
within a large anterior chamber (e.g., mouse (Mus musculus (Linnaeus 1758)), lens thickness
ratio = 0.6 (M.T. Pardue, Emory University, unpublished data)). The large lens causes the
optical center of the eye to be closer to the retina, which decreases the size of the image
projected onto the retina. The projection of a smaller image increases brightness at the expense
of visual acuity because fewer photoreceptors are impacted to absorb light (Ali and Klyne 1985).
Species active diurnally have low lens thickness ratios, such as humans (lens thickness ratio =
0.2, Markowitz and Morin 1985). An eye with a low lens thickness ratio projects a large image
on the retina with reduced brightness. The larger image is intercepted by many cones for
increased acuity. The moderate lens thickness and large eye of deer appears well suited for their
mostly crepuscular activity patterns. Their eye likely produces an image of sufficient size and
brightness for navigation and avoidance of predators when light is at moderate levels.
The deer pupil is highly versatile to function in a range of lighting conditions. Whereas
the pupil of humans is round (Ali and Klyne 1985), white-tailed deer possess a horizontal slit
pupil. Likewise, Malmström and Kröger (2006) observed a horizontal slit pupil in other cervids,
including European elk (Alces alces (Linnaeus 1758)), red deer, and reindeer (Rangifer tarandus

63
(Linnaeus 1758)). The slit pupil of white-tailed deer extends nearly the entire horizontal width
of the cornea and is capable of vertical adjustment from a narrow slot in bright light conditions
dilating to a broad oval when light is limited (G.J. D’Angelo unpublished data). The eyes in our
study likely demonstrated the maximum dilation of the white-tailed deer pupil since we obtained
the measurements post-mortem. The slit pupil allows species like deer with highly light-
sensitive visual systems to function in full daylight without overwhelming the retina (Ali and
Klyne 1985).
The horizontal slit pupil may facilitate color vision during full daylight. In a sample of
terrestrial vertebrates, Malmström and Kröger (2006) found that species with slit pupils also had
multifocal lenses. Ocular media (e.g., cornea, lens, etc.) have different refractive indices for
different wavelengths of color causing different wavelengths of color to focus at different
distances within the eye (i.e., linear chromatic aberration; Walls 1942). Multifocal lenses have
concentric zones of different refractive indices, with each zone designed to create a well-focused
image on the retina for one of the spectral types of cones (Malmström and Kröger 2006). In
conditions of bright light, the pupil constricts to protect the retina. When round pupils constrict,
the periphery of the lens is obstructed. The slit pupil, even when constricted, enables the use of
the full diameter of the lens such that all wavelengths of color may be focused on the
retina (Malmström and Kröger 2006).
The tapetum lucidum is a membrane attached to the retina to enhance vision in low light.
Reflections from the tapetum lucidum produce the characteristic eye shine of deer and other
species with light-sensitive visual systems when they are alighted by bright sources of light
(Walls 1942). Like most ungulates, the tapetum of white-tailed deer is composed of regularly
arranged collagen fibers (Ollivier et al. 2004). The tapetum reflects light that has already passed

64
through the eye back to the photoreceptors a second time to increase the absorption of light and
improve interpretation of visual images (Ali and Klyne 1985).
Ollivier et al. (2004) concluded that the tapetum of herbivores was less evolved than
carnivores, with tapetal variations in herbivores being more suited for maximal reflectance rather
than use of specific wavelengths. However, we found that the coloration of the tapetum of
white-tailed deer was of short-wavelength blues and medium-wavelength yellows, which is
consistent with the photopigments shown to be most sensitive to deer (Jacobs et al. 1994). Since
scattering of light during reflection may reduce the ability of the eye to resolve the details of an
image (Walls 1942), the specialized coloration of the tapetum may preserve acuity by reducing
the total amount of light reflected to include only the wavelengths most perceptible to deer.
We found that the tapetum of white-tailed deer was restricted to the superior retina.
Miller and Murphy (1995) suggested that a superiorly oriented tapetum in dogs (Canis familiaris
(Linnaeus 1758)) functioned during both night and day. They reasoned that the superior retina
receives light mostly from the ground, and the inferior retina receives light from the sky, so the
tapetum probably improves the ability of animals to decipher details of the darker ground by
increasing the contrast of the entire scene. Tapetal function during daytime would enhance the
visual acuity of deer, especially in dense vegetation and closed canopy forests where light
infiltration is reduced and much of the visual scene is in shadow. In conditions of intense
reflectivity from the ground (e.g., snow), the deer eye must adjust for tapetal function to avoid
overwhelming the retina. Two such protective mechanisms are a reduction in pupil size and
alteration of the sensitivity of photoreceptors in different regions of the retina (Ali and
Klyne 1985).
65
The structural organization of the white-tailed deer retina was similar to other vertebrates
(Ali and Klyne 1985). However, the deer retina appears to be thicker compared to many
terrestrial mammals. For example, the total thickness of the white-tailed deer retina was greater
than that of the horse (Equus caballus (Linnaeus 1758), total retinal thickness = 80 to 130 µm,
Ehrenhofer et al. 2002), ferret (Mustela putorius (Linnaeus 1758), total retinal thickness = 138-
160 µm, Wen et al.1985), dog (total retinal thickness = 151-184 µm, Wen et al.1985), and cat
(Felis catus (Linnaeus 1758), total retinal thickness = 145-150 µm, Wen et al.1985). Yet, similar
to the white-tailed deer in our study, Chan et al. (2006) estimated that the total thickness of the
human retina was about 260 µm with the outer retinal complex (outer nuclear layer and inner and
outer segments of the photoreceptors) occupying about 95 µm. This contradicts some
comparisons of the retinas of diurnal (e.g. humans) versus arrhythmic species (e.g., deer)(Walls
1942, Ali and Klyne 1985). Cones are thicker than rods, so fewer rows of cones can be
accommodated in a retinal area. Therefore, diurnal species generally possess a thinner outer
nuclear layer because the preponderance of cones in their retina limits the number of cell layers.
However, with the exception of the human optic fovea, the density of cones in the human retina
is generally less than we observed in deer (Ahnelt et al. 2006). An evaluation of the number of
photoreceptor cell layers in different regions of the retina may reveal differences among humans
and deer.
Although our sample of deer was limited, we included a representation of ages typical of
many wild populations. Our observation of a reduction in the thickness of the outer nuclear layer
of deer with age was consistent with studies of other species. In human subjects from 6 to 79
years old, Alamouti and Funk (2003) observed a reduction in both the retinal nerve fiber layer
and total retinal thickness. An age-related thinning of the outer nuclear layer of the mouse was

66
shown by Li et al. (2001), but they concluded that the changes were not related to a reduction in
the number or structural integrity of rod and cone photoreceptors. In contrast, DiLoreto et al.
(1994) observed degeneration of photoreceptors and a concomitant decrease in outer nuclear
layer thickness with age in rats (Fischer 344 strain) known previously to exhibit age-related
retinal degeneration. Unknown are the cellular and molecular processes responsible for age-
related neural loss (DiLoreto et al. 1994, Li et al. 2001).
Ahnelt et al. (2006) observed M cone patterns in red deer and roe deer similar to the
visual streak in the retina of white-tailed deer. In contrast, Ahnelt et al. (2006) demonstrated that
the human retina contains a fovea centralis, a small circular area with M cone density
>150 000/mm2. The visual streak of white-tailed deer likely has far less acuity than the fovea in
humans because the density of cones is relatively limited in the deer retina. Humans have close
set eyes that are active, moving regularly within the orbit. Human eyes scan in conjunction
across visual scenes to maximize the visual acuity of the fovea and to use binocular vision for
perception of three dimensions. In contrast, deer have laterally directed eyes that are relatively
immobile within the orbit (Walls 1942). As a prey species, deer must constantly monitor their
surroundings to avoid predation, but also must minimize movement to avoid detection by
predators. The visual streak of deer in combination with their wide set eyes likely provides them
with enhanced ability to monitor the horizon and to detect movement with a wide field of view
while keeping their head and eyes stationary.
Advantages of the visual streak are not limited to motion detection by sedentary animals.
Ahnelt et al. (2006) suggested that the visual streak of cheetahs (Acinonyx jubatus (Schreber
1775)) was an adaptation to optimize visual sampling during chases in the savannah. The
contrast of vertical habitat features against the visual streak probably aids navigation of white-

67
tailed deer through intricate habitats when fleeing danger. Likewise, the flagging motion of their
characteristic white tail across the visual streak likely helps maintain herd cohesion of deer
in flight.
The visual streak and the tapetum of deer occur in the superior retina. This spatial
association supports the theory that the tapetum also functions to enhance vision in daylight.
Within the visual streak cones are densely packed, therefore, rods are likely limited or absent
within this region (Walls 1942). Cones do not function in low light conditions, thus the
alignment of the tapetum and visual streak would only be useful when light is sufficient to
stimulate function of the cones. Visual acuity and color perception of deer probably improves
with increasing light intensity because the horizontal slit pupil is more constricted and
concentrates the image on the central and most sensitive portion of the cone-rich visual streak.
When light is limited, the reflectance of color is suppressed. Accordingly, the pupil of deer is
dilated to project light onto a broad area of the retina for light absorption by many rods to
enhance image interpretation without regard to color.
Although we found S cones at densities lower than M cones, the presence of S cones
corroborates the basis for dichromatic color vision of white-tailed deer (Jacobs et al. 1994,
Calderone et al. 2003). Spatial coincidence of the maximum areas of S cones and M cones did
not occur in the white-tailed deer retina. The ventral bias of the distribution of S cones in deer
may be a mechanism which enables their detection of predators silhouetted against the short-
wavelength colors of the sky (Ahnelt et al. 2006). Such detection would be important to deer
susceptible to ambushes by feline predators in trees or to bedded fawns, which are sought by
ground-searching predators such as coyotes (Canis latrans (Say 1823)) and black bears (Ursus
americanus (Pallas Year unknown)).

68
Eyes of white-tailed deer are specialized for function in a variety of habitats and lighting
conditions. The visual streak of deer is similar to other cervids, and provides deer with enhanced
surveillance of a broad area. The tapetum lucidum improves sensitivity in low-light conditions.
The spatial association of the visual streak and tapetum and the color reflectance of the tapetum
likely improves the contrast of visual scenes and perception of color in daylight. The horizontal
slit pupil of deer serves to protect their light-sensitive retina in bright light conditions and
concentrate light on the visual streak for improved acuity. The visual system of white-tailed deer
is similar to other ungulates and is well suited for sensitivity in low light conditions and detection
of predators.
ACKNOWLEDGEMENTS
This study was funded by the Georgia Department of Transportation through the
Governor’s Office of Highway Safety and the National Highway Traffic Safety Administration.
We acknowledge the technical support of J.G. D’Angelo, J.L. D’Angelo, J.M. D’Angelo, J.S.
Falzone, A.E. Faulkner, S. Geva, and M.K. Kim. We thank G.H. Jacobs for his advice and use
of laboratory facilities. J.C. Carroll, B.C. Faircloth, and R.N. Winn provided laboratory
equipment. J. Nathans provided JH455 and JH492 antisera. S.B. Castleberry, A.R. De Chicchis,
and M.T. Mengak provided helpful comments on this manuscript.
REFERENCES
Ali, M.A., and Klyne, M.A. 1985. Vision in vertebrates. Plenum Press, New York, NY.
Alamouti, B, and Funk, J. 2007. Retinal thickness decreases with age: an OCT study. British
Journal of Ophthalmology 87:899-901.
69
Ahnelt, P.K., Schubert, C., Kübber-Heiss, A., Schiviz, A., and Anger, E. 2006. Independent
variation of retinal S and M cone photoreceptor topographies: a survey of four families
of mammals. Visual Neuroscience 23:429-435.
Calderone, J.B., Reese, B.E., and Jacobs, G.H. 2003. Topography of photoreceptors and retinal
ganglion cells in the spotted hyena (Crocuta crocuta). Brain Behavior and
Evolution 62:182-192.
Chan, A., Duker, J.S., Ishikawa, H., Ko, T.H., Schuman, J.S., and Fujimoto, J.G. 2006.
Quantification of photoreceptor layer thickness in normal eyes using optical coherence
tomography. Retina 26(6):655-660.
Cohen, A.I. 1992. The retina. In Adler’s physiology of the eye. Ninth edition. Edited by W.M.
Hart. Mosby-Year Book, Inc., St. Louis. pp. 579-615.
DiLoreto, D., Cox, C., Grover, D.A., Lazar, E., del Cerro, C., del Cerro, M. 1994. The
influences of age, retinal topography, and gender on retinal degeneration in the Fischer
344 rat. Brain Research 647:181-191.
Ehrenhofer, M.C.A., Deeg, C.A., Reese, S., Liebich, H., Stangassinger, M., and Kaspers, B.
2002. Normal structure and age-related changes of the equine retina. Veterinary
Ophthalmology 5(1):39-47.
Geist, V. 1998. Deer of the world: their evolution, behaviour, and ecology. Stackpole Books,
Mechanicsburg, P.A.
Howland, H.C., Merola, S., and Basarab, J.R. 2004. The allometry and scaling of the size of
vertebrate eyes. Vision Research 44:2043-2065.
Jacobs, G.H., Deegan, J.F., Neitz, J., Murphy, B.P., Miller, K.V., and Marchinton, R.L. 1994.
Electrophysical measurements of spectral mechanisms in the retinas of two cervids:

70
white-tailed deer (Odocoileus virginianus) and fallow deer (Dama dama). Journal of
Comparative Physiology A 174:551-557.
Li, C, Cheng, M., Yang, H., Peachey, N.S., and Naash, M.I. 2001. Age-related changes in the
mouse outer retina. Optometry and Vision Science 78(6):425-430.
Malmström, T., and Kröger, R.H.H. 2006. Pupil shapes and lens optics in the eyes of terrestrial
vertebrates. Journal of Experimental Biology 209:18-25.
Marchinton, R.L., and Hirth, D.H. 1984. Behavior. In White-tailed deer ecology and
management. Edited by L.K. Halls. Stackpole Books,
Mechanicsburg, P.A. pp. 129-168.
Markowitz, S.N., and Morin, J.D. 1985. The ratio of lens thickness to axial length for biometric
standardization in angle-closure glaucoma. American Journal of
Ophthalmology 99:400-402.
Miller, P.E., and Murphy, C.J. 1995. Vision in dogs. Journal of the American Veterinary
Medical Association 207(12):1623-1634.
Müller-Schwarze, D. 1994. The senses of deer. In Deer. Edited by D. Gerlach, S. Atwater, and
J. Schnell. Stackpole Books, Mechanicsburg, P.A. pp. 58-65.
Ollivier, F.J., Samuelson, D.A., Brooks, D.E., Lewis, P.A., Kallberg, M.E., and Komáromy.
2004. Comparative morphology of the tapetum lucidum (among selected species).
Veterinary Ophthalmology 7(1):11-22.
Severinghaus, C.W. 1949. Tooth development and wear as criteria of age in white-tailed deer.
Journal of Wildlife Management 13:195-216.
Staknis, M.A., and Simmons, D.M. 1990. Ultrastructural evaluation of the eastern whitetail deer
retina for color perception. Journal of the Pennsylvania Academy of Science 64(1):8-10.

71
Walls, G.L. 1942. The vertebrate eye and its adaptive radiation. Cranbrook Institute of Science,
Bloomfield Hills, M.I.
Wen, G.Y., Sturman, J.A., and Shek, J.W. 1985. A comparative study of the tapetum, retina and
skull of the ferret, dog and cat. Laboratory Animal Science 35(3):200-210.
Witzel, D.A., Springer, M.D., and Mollenhauer, H.H. 1978. Cone and rod photoreceptors in the
white-tailed deer Odocoileus virginianus. American Journal of Veterinary
Research 39(4):699-701.

72
Table 3.1. Measurements of anatomical features of eyes of white-tailed deer (Odocoileus
virginianus (Zimmerman, 1780), n = 6) collected at Daniel B. Warnell School of Forestry and
Natural Resources Whitehall Experimental Forest, University of Georgia, Athens, Georgia
during 22-28 November 2006.

73
Fawns Adults Mean SE Mean SE t df P Interocular distance 81.1 0.2 94.9 1.9 -3.521 4 0.012 Axial length 25.3 0.2 27.8 0.2 -7.082 10 <0.0001 Vertical equatorial diameter 26.5 0.2 28.7 0.2 -5.420 10 0.0001 Horizontal equatorial diameter 27.0 0.2 28.6 0.2 -4.159 10 0.0009 Anterior chamber depth 5.1 0.3 6.7 0.3 -2.963 10 0.007 Vitreous chamber depth 20.9 0.2 23.1 0.5 -2.761 10 0.010 Vertical corneal diameter 17.7 0.2 19.7 0.3 -3.729 10 0.002 Horizontal corneal diameter 19.9 0.2 22.0 0.2 -4.491 10 0.0006 Central corneal thickness 0.6 0.1 0.6 0.1 0.417 4 0.349 Peripheral corneal thickness 0.5 0.1 0.5 0.0 -0.277 4 0.398 Vertical pupil diameter 12.8 0.3 15.4 0.3 -4.307 10 0.0008 Horizontal pupil diameter 14.2 0.1 15.6 0.3 -2.908 10 0.008 Lens diameter 13.0 0.1 14.3 0.3 -2.697 4 0.027 Lens thickness 7.4 0.2 9.2 0.4 -2.659 4 0.028
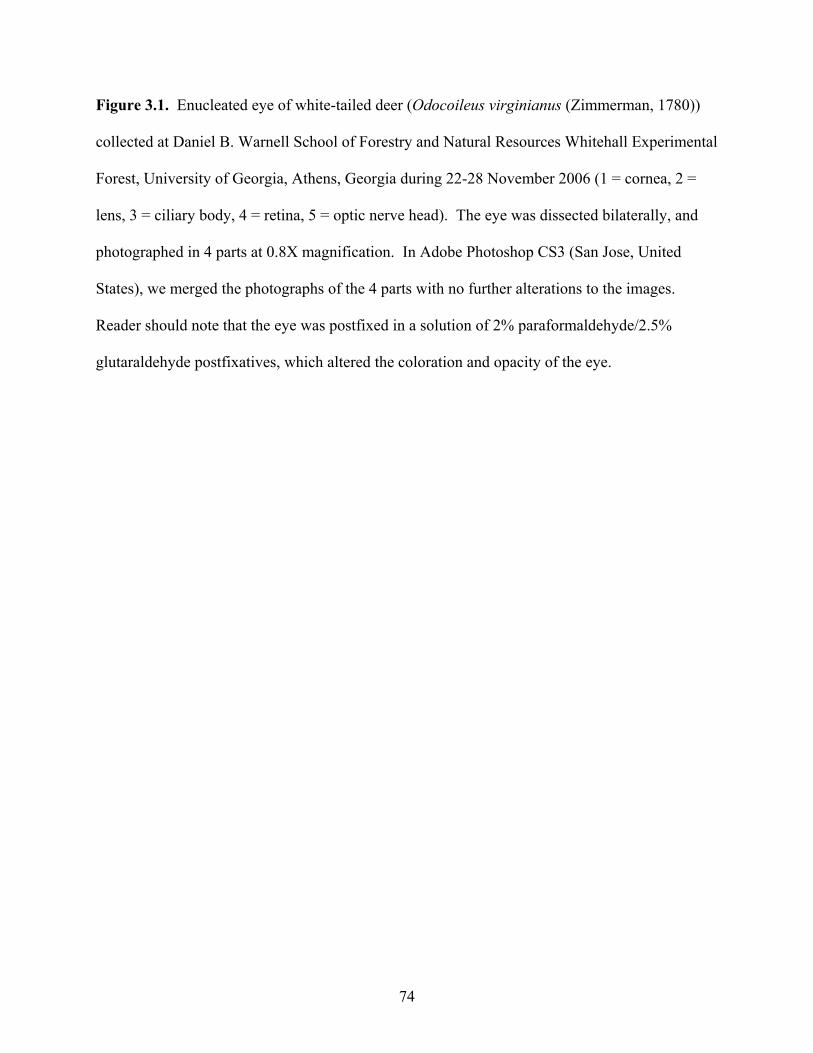
74
Figure 3.1. Enucleated eye of white-tailed deer (Odocoileus virginianus (Zimmerman, 1780))
collected at Daniel B. Warnell School of Forestry and Natural Resources Whitehall Experimental
Forest, University of Georgia, Athens, Georgia during 22-28 November 2006 (1 = cornea, 2 =
lens, 3 = ciliary body, 4 = retina, 5 = optic nerve head). The eye was dissected bilaterally, and
photographed in 4 parts at 0.8X magnification. In Adobe Photoshop CS3 (San Jose, United
States), we merged the photographs of the 4 parts with no further alterations to the images.
Reader should note that the eye was postfixed in a solution of 2% paraformaldehyde/2.5%
glutaraldehyde postfixatives, which altered the coloration and opacity of the eye.

75

76
Figure 3.2. Radially flattened ocular fundus of white-tailed deer (Odocoileus virginianus
(Zimmerman, 1780)) collected at Daniel B. Warnell School of Forestry and Natural Resources
Whitehall Experimental Forest, University of Georgia, Athens, Georgia during 22-28 November
2006. The eye was postfixed in 4% paraformaldehyde, which slightly altered the coloration of
the ocular fundus. The white circle indicates the location of the optic nerve head.

77
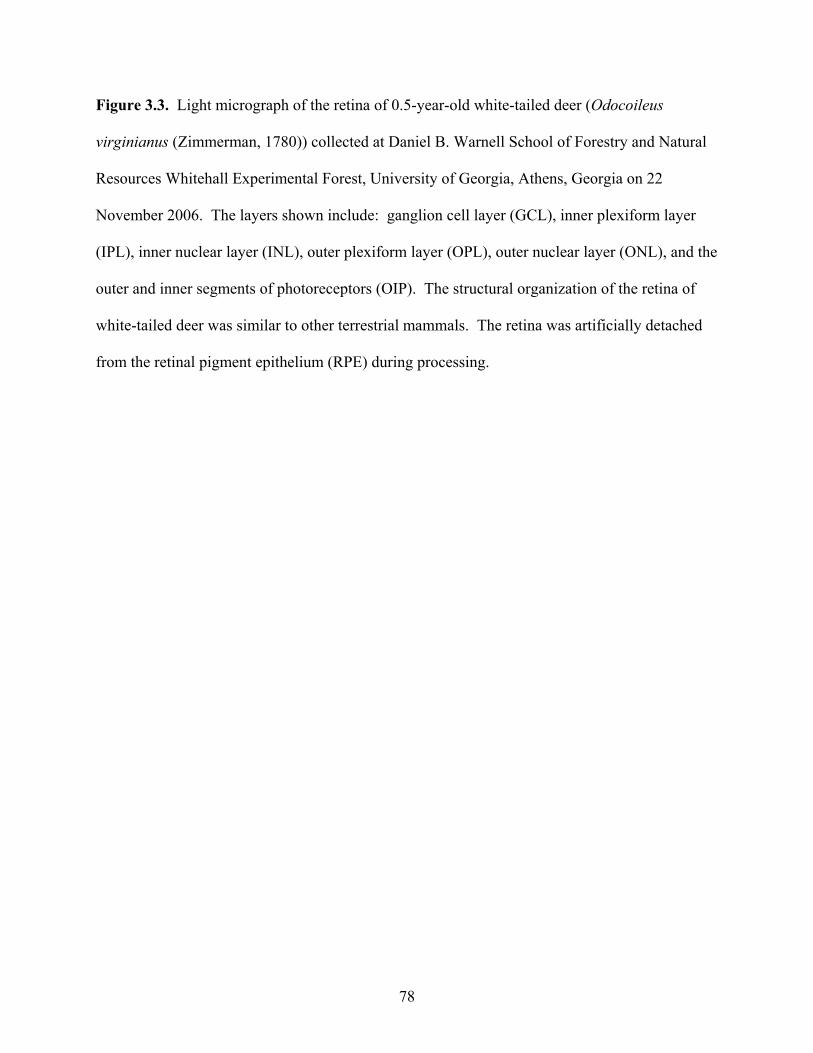
78
Figure 3.3. Light micrograph of the retina of 0.5-year-old white-tailed deer (Odocoileus
virginianus (Zimmerman, 1780)) collected at Daniel B. Warnell School of Forestry and Natural
Resources Whitehall Experimental Forest, University of Georgia, Athens, Georgia on 22
November 2006. The layers shown include: ganglion cell layer (GCL), inner plexiform layer
(IPL), inner nuclear layer (INL), outer plexiform layer (OPL), outer nuclear layer (ONL), and the
outer and inner segments of photoreceptors (OIP). The structural organization of the retina of
white-tailed deer was similar to other terrestrial mammals. The retina was artificially detached
from the retinal pigment epithelium (RPE) during processing.

79

80
Figure 3.4. Thickness of individual retinal layers of white-tailed deer (Odocoileus virginianus
(Zimmerman, 1780), n = 6) collected at Daniel B. Warnell School of Forestry and Natural
Resources Whitehall Experimental Forest, University of Georgia, Athens, Georgia during 22-28
November 2006. Thickness of the outer nuclear layer decreased with age, but the thickness of
other retinal layers was not related to age.

81
Ganglion cell layer
010203040506070
0.5 2.5 3.5 6.5
Age (years)
Laye
r thi
ckne
ss (µ
m)
Inner plexiform layer
0
10
20
30
40
50
60
0.5 2.5 3.5 6.5
Age (years)
Laye
r thi
ckne
ss (µ
m)
Inner nuclear layer
05
10152025303540
0.5 2.5 3.5 6.5
Age (years)
Laye
r thi
ckne
ss (µ
m)
Outer plexiform layer
0
2
4
6
8
10
12
0.5 2.5 3.5 6.5
Age (years)
Laye
r thi
ckne
ss (µ
m)
Outer nuclear layer
0
10
20
30
40
50
60
0.5 2.5 3.5 6.5
Age (years)
Laye
r thi
ckne
ss (µ
m)
Outer and inner segments of photoreceptors
01020304050607080
0.5 2.5 3.5 6.5
Age (years)
Laye
r thi
ckne
ss (µ
m)

82
Figure 3.5. Density map of medium wavelength cones of white-tailed deer (Odocoileus
virginianus (Zimmerman, 1780)) collected at Daniel B. Warnell School of Forestry and Natural
Resources Whitehall Experimental Forest, University of Georgia, Athens, Georgia during 22-28
November 2006. Cones were labeled immunohistochemically using JH492 antisera. The
density of M cones averaged 16 414/mm2 (range = 4717, n = 3) ranging from an average
minimum of 7322/mm2 (range = 500, n = 3) to an average maximum of 35 700/mm2
(range = 12 832, n = 3). The area of maximum density of M cones was characteristic of a
horizontal visual streak approximately 2-3 mm superior of the optic nerve head. The location of
the optic nerve head is indicated by a gray circle.

83

84
Figure 3.6. Density map of short wavelength cones of white-tailed deer (Odocoileus virginianus
(Zimmerman, 1780)) collected at Daniel B. Warnell School of Forestry and Natural Resources
Whitehall Experimental Forest, University of Georgia, Athens, Georgia during 22-28 November
2006. Cones were labeled with JH455 antisera. We found S cones at densities lower than the
density of M cones. The density of S cones averaged 1602/mm2 (range = 317, n = 2) ranging
from an average minimum of 442/mm2 (range = 50, n = 2) to an average maximum of 4883/mm2
(range = 1433, n = 2).

85

86
CHAPTER 4
HEARING RANGE OF WHITE-TAILED DEER AS DETERMINED BY AUDITORY
BRAINSTEM RESPONSE3
D’Angelo, G. J., A. R. De Chicchis, D. A. Osborn, G. R. Gallagher, R. J. Warren, and K. V. Miller. 2007. Hearing
range of white-tailed deer as determined by auditory brainstem response. Journal of Wildlife Management:in press.
Reprinted here with permission of publisher.

87
ABSTRACT
Using Auditory Brainstem Response (ABR) testing, we determined that white-tailed deer
(Odocoileus virginianus) hear within the range of frequencies we tested, from 0.25-30 kHz, with
best sensitivity between 4-8 kHz. The upper limit of human hearing lies at about 20 kHz,
whereas we demonstrated that white-tailed deer detected frequencies to at least 30 kHz. This
difference suggests that research on the use of ultrasonic (frequencies >20 kHz) auditory
deterrents is justified as a possible means of reducing deer-human conflicts.
Key words: auditory brainstem response, deterrent, hearing, Odocoileus virginianus, sound,
white-tailed deer
Although the hearing abilities of white-tailed deer (Odocoileus virginianus) have been
the subject of speculation and debate, especially related to the reduction of deer-human conflicts
using auditory alarms, no scientific evidence has been published on the hearing range of the
species. Several studies characterized the hearing abilities of other ungulates to examine the
possible effects of human-produced noise on animal behavior. Flydal et al. (2001) used
behavioral training experiments to determine the hearing range of captive reindeer (Rangifer
tarandus tarandus), and DeYoung et al. (1993) generated baseline auditory brainstem response
(ABR) data for desert mule deer (O. hemionus eremicus) and bighorn sheep (Ovis canadensis).
Krausman et al. (2004) used ABR to assess the auditory characteristics of desert ungulates that
were exposed to sound from military activities.
ABR testing is the accepted protocol for diagnosis of hearing for noncooperative
subjects, including animals (Jacobson 1994). ABRs are electrophysiologic responses generated

88
when sound stimulates the ear, auditory nerve, and regions of the auditory brainstem (Hall 1992).
The differences in electrical potentials elicited by an auditory stimulus are recorded via
electrodes placed strategically on the head. Acquisition of the neural response is time-locked to
stimulus onset. The stimulus is presented repeatedly and the responses are averaged by
computer to extract the auditory-related response from the background electrical activity. These
auditory-evoked responses are then displayed on a monitor as a series of waves having distinct
peaks and valleys. The amplitudes, latencies, and relationship of those waveforms are analyzed
by an experienced clinician to determine the lowest threshold of hearing at that frequency.
Proper ABR assessment requires that the subject remain immobile and in a state of quiet rest.
ABR is not affected by many anesthetic drugs, and those used to induce muscle paralysis may
actually enhance ABR readings by reducing muscle related artifact (Hall 1992,
Hall and Harris 1994).
Basic knowledge of white-tailed deer hearing can improve understanding of deer
behavior and may assist in the development of effective deterrent strategies. Our objective was
to determine the hearing range of white-tailed deer using ABR.
STUDY AREA
We conducted our research at the Daniel B. Warnell School of Forestry and Natural
Resources, Whitehall Deer Research Facility at the University of Georgia, Athens. The facility
was 2.4 ha in area and was encompassed by 3-m high woven-wire fencing. Deer were housed in
outdoor paddocks (0.4-0.8 ha) and 3 x 6-m covered barn stalls with food and water provided ad
libitum. The animals we used were raised in captivity, were in good general health, and had no
known exposure to abnormally high levels of noise.

89
METHODS
We constructed a sound-testing booth (height = 2.3 m, width = 2.2 m, length = 4.7 m)
with plywood, 2.5-cm thick insulating foam and 2 layers of indoor carpeting on all surfaces to
minimize ambient noise. We moved deer from outside paddocks to individual stalls >12 hours
before testing. We removed feed from the stall >12 hours before sedating deer with a xylazine
hydrochloride (HCL) and ketamine HCL mixture of 1:7. We administered lesser doses of the 1:7
xylazine HCL to ketamine HCL mixture as necessary throughout each testing session to maintain
adequate sedation and to reduce physiological interference in the evoked responses. Depending
on the tameness of each deer, we delivered the initial sedative by hand-injecting deer
intramuscularly or by remote delivery using a tranquilizer dart. Once immobilized, we carried
deer into the sound-testing booth and placed them in a wooden cradle, which supported the deer
on its sternum 90 cm above the floor. We applied ophthalmic ointment (Paralube® Vet
Ointment, Pharmaderm, Melville, New York, USA) to prevent corneal desiccation and covered
their eyes with an opaque cloth to avoid arousal by light. We placed sandbags and cloth towels
under the head and neck of the deer to provide stability and to level the head along its
lateral axis.
We used an Intelligent Hearing Systems Smart EP (Miami, Florida, USA) evoked-
potential system to produce auditory stimuli and to assess hearing thresholds. We placed 3 sub-
dermal electrodes at locations corresponding to points on the sinus, vertex and dorsal border of
the left zygomatic arch in the skull of the deer. The auditory stimuli consisted of tone bursts (1.5
msec rise/fall; 3 msec duration) gated with Blackman filters and delivered at a rate of
29.9/second to 1 of 2 types of transducers. For frequencies 0.25-2 kHz, we delivered acoustic
stimuli through a Hi-tex speaker (Hong Kong, China); we delivered frequencies 4-30 kHz via a

90
Radioshack super tweeter (Forth Worth, Texas, USA). We controlled intensity levels by a
Yamaha model 2050 2-channel amplifier (Buena Park, California, USA). We mounted the
speakers on tripods to provide tilt and height adjustments, and leveled and centered the speaker
with the opening of the left ear canal of the deer at a distance of 15.2 cm from the tragus. We
amplified the electroencephalogram activity 100,000 times and bandpass filtered from 0.1 to 3
kHz. We measured the ABRs from the averaged responses to 1,024 tone-burst stimuli of
alternating phase. We employed an analysis time of 10.24 msec. At each frequency and
intensity level, we measured >2 ABRs to ensure that the response replicated. Before testing, we
measured stimulus output levels using a Quest model 1900 sound level meter having peak hold
capability and a model QE4110 0.85-cm microphone (Oconomowoc, Wisconsin, USA). We
measured ambient noise levels using a Quest model 1700 sound level meter with a 1/3 octave
band OB-300 filter and a model 4936 1.3-cm prepolarized condenser microphone(Oconomowoc,
Wisconsin, USA). We verified attenuation linearity for the range of intensities employed, until
sound levels fell into the noise floor.
We obtained ABR thresholds for the frequencies 0.25, 0.5, 1, 2, 4, 8, 12, 16, 20 and 30
kHz. Initially, we presented auditory stimuli to deer at 70 decibels (dB) Sound Pressure Level
(SPL) and gradually decreased auditory intensity in 10 dB SPL steps until we no longer detected
a reliable response. Once we approximated the hearing threshold at an individual frequency, we
tested at intensities +5 dB SPL to refine our threshold estimate. If we obtained no response at 70
dB SPL, we gradually increased the stimulus level in 5 dB SPL steps up to 90 dB SPL, at which
time we terminated testing for that frequency. We performed all animal use procedures in a
humane manner, and received prior approval from the University of Georgia Institutional Animal
Care and Use Committee (#A2004-10102-0).

91
RESULTS
From 29 October 2004 to 29 April 2005, we conducted ABR testing on 13 deer. Average
testing time to determine minimum hearing thresholds at all frequencies for an individual deer
was 178 min (SE = 8). Included in the experiments were 3 deer <1 yr old (2 female, 1 male), 3
deer 1.5 to 2.0 yr old (1 female, 2 male), 3 deer 2.5 to 3.0 yr old (2 female, 1 male), and 4 deer
3.5 to 4.0 yr old (3 female, 1 male). A typical ABR recording in our deer sample showed a series
of four waves (Fig. 4.1). We determined the ABR threshold by tracking wave III in the complex
because this wave was most consistently reproduced at the lowest intensity levels. The mean
latencies for wave III at 70 dB SPL were 4.85 msec (SE = 0.07) and 4.86 msec (SE = 0.07) at 4
kHz and 8 kHz, respectively. All hearing thresholds were above the ambient noise levels we
recorded (Fig. 4.2; Tables 4.1, 4.2). We were unable to collect frequency specific information on
ambient noise for 20 to 30 kHz because of equipment limitations at the time of measurement.
DISCUSSION
Our results suggest that white-tailed deer hear within the range of frequencies we tested,
from 0.25 to 30 kHz, with best sensitivity between 4 and 8 kHz. DeYoung et al. (1993) used
ABR to determine mean hearing thresholds for bighorn sheep and desert mule deer for
frequencies from 1 to 4 kHz and obtained similar results. Likewise, Krausman et al. (2004)
observed similar hearing thresholds for pronghorn (Antilocapra americana) and desert mule deer
for the frequencies they tested from 0.5 to 8 kHz.
Flydal et al. (2001) used behavioral training to determine that the hearing ability of 2
yearling reindeer ranged from 0.07 kHz to 38 kHz with best sensitivity at 8 kHz. They found
that the reindeer detected sounds at lower thresholds than we recorded in white-tailed deer, and
concluded that the hearing of reindeer was similar to that of cattle, horse, goat, pig, and sheep as

92
determined by behavioral tests. It should be noted, however, that behavioral testing may be more
sensitive at determining minimum hearing thresholds than ABR. For example, in an experiment
with normally hearing human subjects, thresholds determined by behavioral experiments were
lower than those determined by ABR (Gorga et al. 1988). This is not surprising given the ear’s
ability to integrate energy over time. Previous psychophysical research showed that as the
duration of a tone increases up to about 200 msec, hearing threshold decreases in direct
proportion to time (Garner and Miller 1947). Although, ABR can be in good agreement with
behavioral threshold assessments of hearing at 0.5 kHz and 2 to 4 kHz (Stapells et al. 1995).
Differences in hearing thresholds on the order of 10 dB SPL have been reported between the two
procedures (Gorga et al. 1984, Gorga et al. 1988). Nevertheless, ABR can be used effectively to
estimate relative sensitivity among frequencies, and can be used to compare sensitivity
among species.
We found that best hearing sensitivity of deer from 4 to 8 kHz corresponds to the
dominant features of their vocalizations. Atkeson et al. (1988) described 12 vocalizations of
white-tailed deer using sonagraphic analysis. They demonstrated that most calls were composed
of frequencies between 1 and 8 kHz with the strongest intensities of individual calls between 3
and 6.5 kHz. The relationship among hearing sensitivity and vocalizations of deer suggests that
auditory deterrent devices may be heard most reliably by deer at frequencies similar to
their vocalizations.
Our estimate of best hearing sensitivity of deer from 4 to 8 kHz overlaps with the range
of frequencies which humans hear best, from 2 to 5 kHz (Durrant and Lovrinic 1995). The upper
limit of human hearing lies at about 20 kHz (Durrant and Lovrinic 1995), whereas we
demonstrated that white-tailed deer detected frequencies to at least 30 kHz. This difference

93
suggests that research on the use of ultrasonic (frequencies >20 kHz) auditory deterrents is
justified as a possible means of reducing deer-human conflicts such as deer-vehicle collisions
and depredation of plants in residential areas without being intrusive to the human auditory
system. Given our estimate of white-tailed deer hearing at 30 kHz and with consideration for the
temporal integration factors discussed above, it appears that ultrasonic auditory deterrents would
need to emit sounds at moderate intensities (45 to 60 dB SPL at the deer’s ear) to be heard
reliably by deer.
Auditory devices marketed to deter wildlife may not produce ultrasonic sounds at
sufficient intensities as claimed by the manufacturers. Scheifele et al. (2003) evaluated the
sound produced by 2 designs of vehicle-mounted deer whistles and determined that the primary
frequency of operation was 3.3 kHz for closed-end whistles, and 12 kHz for open-end whistles.
Bender (2003) analyzed sound produced by 2 models of the ROO-Guard®, a device marketed to
deter kangaroos (Macropus spp.) and other wildlife, and found that sound outputs were
composed mostly of audible frequencies and some ultrasonic frequencies. In field tests, the
ROO-Guard® failed to alter the behavior of kangaroos.
The physical properties of sound waves and safety concerns relative to human hearing
may limit the feasibility of generating sounds from a moving vehicle at intensities sufficient to
provide adequate warning distance for deer to react and avoid a collision. The intensity of sound
is governed in part by the inverse square law, which states that in an environment with no
obstructions, sound intensity is inversely proportional to the distance squared from the sound
source (Ratcliff 1999). Therefore, if an auditory device emitted sound stimuli at an intensity of
100 dB SPL at 1 m (based on maximum permissible noise exposure level for 2 hours/day for
employees in the USA; Occupational Safety and Health Administration 2006), under ideal

94
conditions and without consideration for the effects of vehicle speed, we would expect the sound
intensity to be approximately 60 dB SPL at 100 m from the vehicle. Whether this hypothetical
warning distance of 100 m would provide deer with adequate time to react to an approaching
vehicle in a range of roadway conditions is unknown.
Although the possibility may exist to produce ultrasonic sounds at intensities to be heard
reliably by deer, consideration must be given to white-tailed deer hearing physiology and
practical field application in the development of such strategies. Further, controlled field
experiments should be conducted to assess whether auditory deterrents alter white-tailed deer
behavior as desired.
MANAGEMENT IMPLICATIONS
Our data provide a basis for the development of auditory deterrents throughout the
hearing range of white-tailed deer. To be consistently audible to deer, however, auditory
deterrents must be of adequate sound intensity at specific frequencies.
ACKNOWLEDGEMENTS
This study was funded by the Georgia Department of Transportation through the
Governor’s Office of Highway Safety and the National Highway Traffic Safety Administration.
G. Ollick donated his time, advice and audio equipment. We acknowledge the technical support
of J. G. D’Angelo, especially in the construction of the sound-testing booth. We thank S. J.
Dahmes and Wildlife Artist Supply Company for use of their facilities and equipment. S. B.
Castleberry and M. T. Mengak of the University of Georgia and 2 anonymous reviewers
provided helpful comments on this manuscript. J. Hall III and N. Decker assisted with
data interpretation.

95
LITERATURE CITED
Atkeson, T. D., R. L. Marchinton, and K. V. Miller. 1988. Vocalizations of white-tailed
deer. American Midland Naturalist 120:194-200.
Bender, H. 2003. Deterrence of kangaroos from agricultural areas using ultrasonic
frequencies: efficacy of a commercial device. Wildlife Society Bulletin 31:1037-1046.
DeYoung, D. W., P. R. Krausman, L. E. Weiland, and R. C. Etchberger. 1993. Baseline ABRs
in mountain sheep and desert mule deer. International Congress on Noise as a Public
Health Problem 6:251-254.
Durrant, J. D., and J. H. Lovrinic. 1995. Bases of hearing science. Williams and Wilkins,
Baltimore, Maryland, USA.
Flydal, K., A. Hermansen, P. S. Enger, and E. Reimers. 2001. Hearing in reindeer (Rangifer
tarandus). Journal of Comparative Physiology A 187:265-269.
Garner, W. R., and G. A. Miller. 1947. The masked threshold of pure tones as a function
of duration. Journal of Experimental Psychology 37:293-303.
Gorga, M. P., K. A. Beauchaine, J. K. Reiland, D. W. Worthington, and E. Javel. 1984. The
effects of stimulus duration on ABR and behavioral thresholds. Journal of the Acoustical
Society of America 76:616-619.
Gorga, M. P., J. R. Kaminski, K. A. Beauchaine, and W. Jesteadt. 1988. Auditory brainstem
responses to tone bursts in normally hearing subjects. Journal of Speech and Hearing
Research 31:87-97.
Hall, J. W. 1992. Handbook of auditory evoked responses. Allyn and Bacon, Boston,
Massachusetts, USA.

96
_____, and D. P. Harris. 1994. Auditory evoked responses in acute brain injury and
rehabilitation. Pages 477-516 in J. T. Jacobson, editor. Principles and applications in
auditory evoked potentials. Allyn and Bacon, Boston, Massachusetts, USA.
Jacobson, J. T. 1994. Prelude to auditory evoked potentials. Pages 3-22 in J. T. Jacobson,
editor. Principles and applications in auditory evoked potentials. Allyn and Bacon,
Boston, Massachusetts, USA.
Krausman, P. R., L. K. Harris, C. L. Blasch, K. K. G. Koenen, and J. Francine. 2004. Effects of
military operations on behavior and hearing of endangered Sonoran pronghorn. Wildlife
Monographs No. 157.
Occupational Safety and Health Administration. 2006. OSHA Technical Manual TED
01-00-015. United States Department of Labor, Washington, DC, USA.
Ratcliff, J. 1999. Mathematics, formulae and equations. Pages 2-10 in M. T. Smith, editor.
Audio engineer’s reference book. Focal Press, Woburn, Massachusetts, USA.
Scheifele, P. M., D. G. Browning, and L. M. Collins-Scheifele. 2003. Analysis and
effectiveness of deer whistles for motor vehicles: frequencies, levels, and animal
threshold responses. Acoustics Research Letters Online 4:71-76.
Stapells, D. R., J. S. Gravel, and B. A. Martin. 1995. Thresholds for auditory brainstem
responses to tones in notched noise from infants and young children with normal hearing
or sensioneural hearing loss. Ear and Hearing 16:361-371.
Associate editor: Mason

97
Figure 4.1. Sample auditory brainstem response waveform for one white-tailed deer at 4 kHz
during a testing session on 01 Jan 2005 at the Daniel B. Warnell School of Forestry and Natural
Resources, Whitehall Deer Research Facility at the University of Georgia, Athens. “III”
indicates Wave III as it was tracked to hearing threshold at 35 dB Sound Pressure Level.
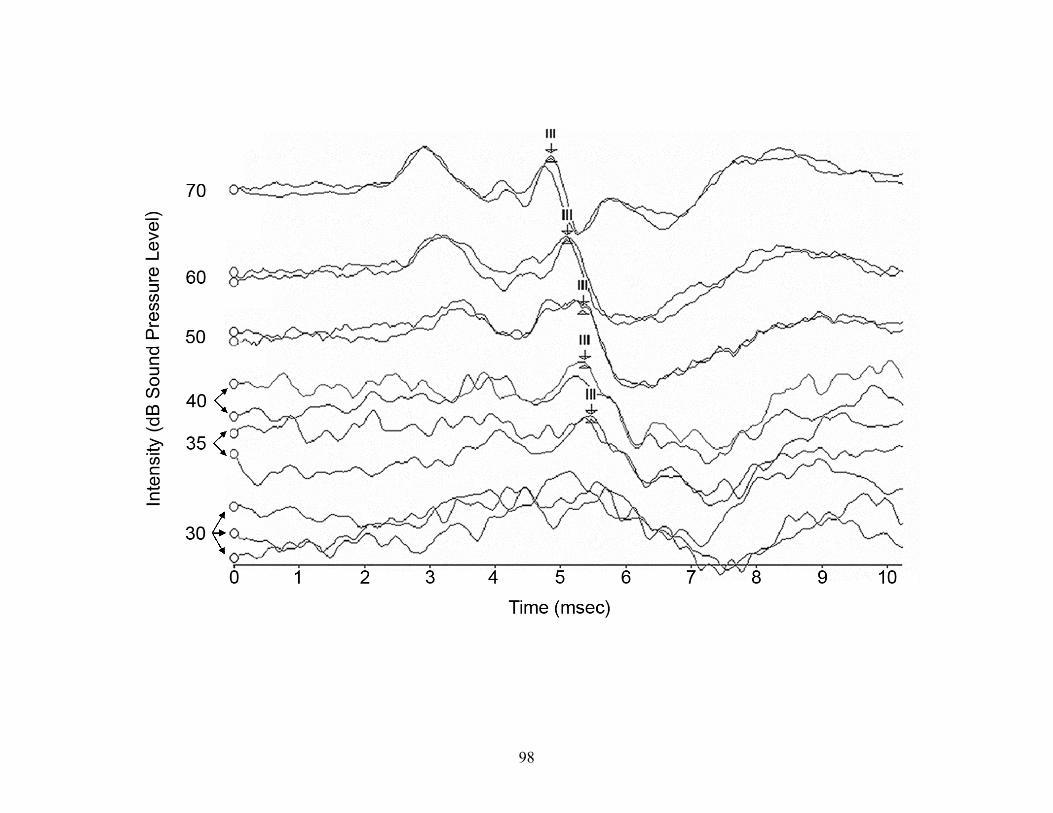
98

99
Figure 4.2. Audiogram of mean (error bars = + SE) frequency specific thresholds of hearing for
13 white-tailed deer as determined by auditory brainstem response at the Daniel B. Warnell
School of Forestry and Natural Resources, Whitehall Deer Research Facility at the University of
Georgia, Athens, 2004-2005. Also included are mean frequency specific thresholds of hearing
for reindeer as determined by behavioral testing (Flydal et al. 2001), for desert mule deer (A) and
mountain sheep as determined by auditory brainstem response testing (DeYoung et al. 1993),
and for pronghorn and desert mule deer (B) as determined by auditory brainstem response
testing (Krausman et al. 2004).

100

101
Table 4.1. Mean (SE) frequency specific thresholds of hearing for 13 white-tailed deer as
determined by auditory brainstem response at the Daniel B. Warnell School of Forestry and
Natural Resources, Whitehall Deer Research Facility at the University of Georgia, Athens,
2004-2005.

102
Frequency (kHz) Mean (dB SPL) Standard error (dB SPL)
0.25 62.7 1.8 0.5 64.2 2.6 1 61.9 1.8 2 55.8 1.7 4 41.9 2.2 8 41.9 3.0 12 46.5 4.1 16 53.8 4.7 20 53.5 4.5 30 70.0 3.7

103
Table 4.2. Frequency specific ambient noise levels recorded during auditory brainstem response
testing at the Daniel B. Warnell School of Forestry and Natural Resources, Whitehall Deer
Research Facility at the University of Georgia, Athens, 2004-2005.
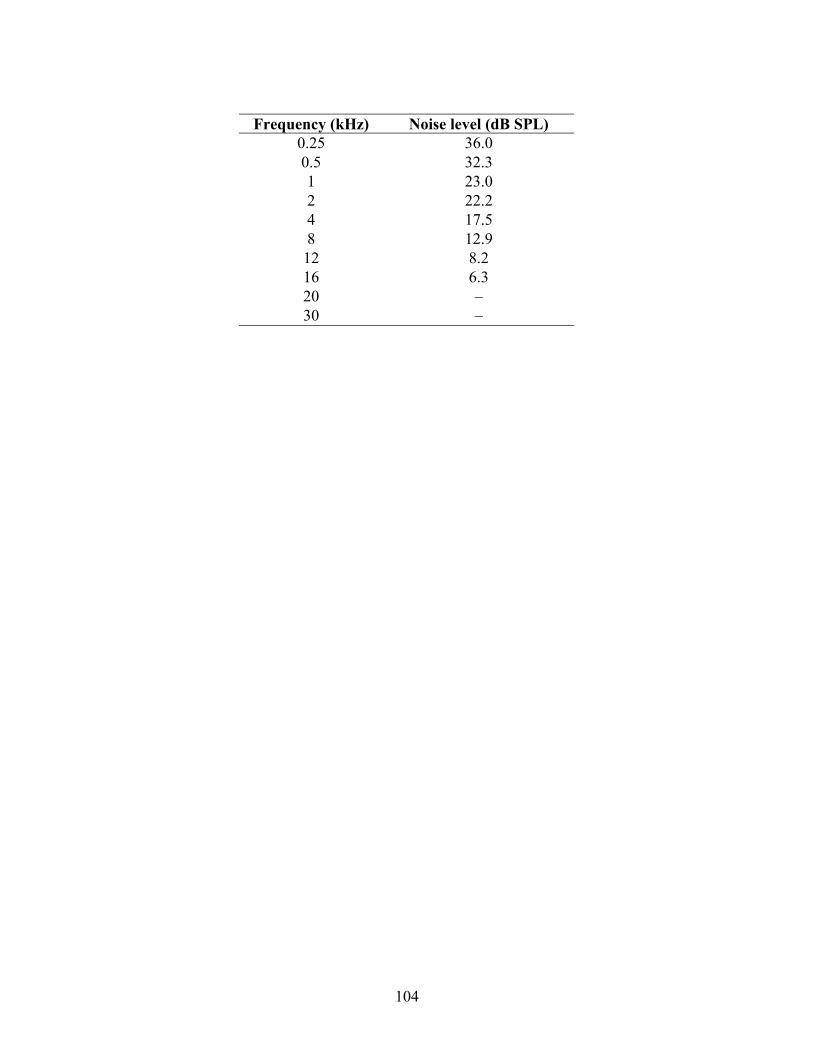
104
Frequency (kHz) Noise level (dB SPL)
0.25 36.0 0.5 32.3 1 23.0 2 22.2 4 17.5 8 12.9 12 8.2 16 6.3 20 – 30 –
105
CHAPTER 5
CONCLUSIONS
CONCLUSIONS
Literature Review
1. Most states utilize strategies in attempts to reduce deer-vehicle collisions. However few
research efforts have sufficiently examined the efficacy of such techniques and
information on deer behavior relative to these mitigation efforts was limited.
2. Information on the physiology of the auditory and visual systems of white-tailed deer is
limited in the scientific literature.
Evaluation of Wildlife-warning Reflectors
1. We concluded that the wildlife warning reflectors we tested did not alter deer behavior
such that deer–vehicle collisions might be prevented.
2. Our data indicated that deer exhibit an increase in negative behavioral responses toward
vehicles in the presence of reflectors.
Examination of the White-tailed Deer Visual System
1. The visual system of white-tailed deer is similar to other ungulates and is well suited for
sensitivity in low light conditions and detection of predators in a variety of habitats.
2. The visual streak of deer is similar to other cervids, and provides deer with enhanced
surveillance of a broad area.

106
3. The horizontal slit pupil of deer serves to protect their light-sensitive retina in bright light
conditions and concentrate light on the visual streak for improved acuity.
4. The tapetum lucidum improves sensitivity in low-light conditions. The spatial
association of the visual streak and tapetum and the color reflectance of the tapetum
likely improves the contrast of visual scenes and perception of color in daylight.
Determination of the Hearing Range of White-tailed Deer
1. We determined that white-tailed deer hear within the range of frequencies we tested,
from 0.25-30 kHz.
2. Best hearing sensitivity of deer is 4-8 kHz.
3. We demonstrated that white-tailed deer detected frequencies to at least 30 kHz, whereas
the upper limit of human hearing lies at about 20 kHz.
4. The difference between deer and human hearing in ultrasonic frequencies (>20 kHz)
suggests that research on the use of ultrasonic auditory deterrents is justified as a possible
means of reducing deer-human conflicts.
RECOMMENDATIONS
1. Future development of strategies for reducing the incidence of deer-vehicle collisions
should be based on the physiological and behavioral characteristics of white-tailed deer.
2. Transportation agencies should only deploy strategies that have undergone extensive
testing in actual roadway conditions, and have been shown to consistently alter deer
behavior as desired over time.

107
3. Until such strategies become available, management efforts to minimize deer-vehicle
collisions should focus on:
A. Implementation of proper deer herd management programs
B. Control of roadside vegetation to minimize its attraction to deer and to maximize
visibility for motorists
C. Increasing motorist awareness of the danger associated with
deer-vehicle collisions
D. Thorough monitoring of deer-vehicle collision rates
E. Encouraging communication and cooperation among governments, wildlife
researchers, highway managers, motorists, and others involved in the issue of
deer-vehicle collisions

108
APPENDIX A
VISUAL ACUITY OF WHITE-TAILED DEER AS ESTIMATED BY
DISCRIMINATION LEARNING4
D’Angelo, G. J., J. G. D’Angelo, D. A. Osborn, G. R. Gallagher, R. J. Warren, and K.V. Miller.

109
INTRODUCTION
Despite an abundance of scientific research focusing on the senses of domestic species,
relatively little is known about the visual capabilities of white-tailed deer (Odocoileus
virginianus). Designers of livestock facilities routinely use knowledge of anatomical and
physiological components that influence animal behavior to achieve effective handling and
containment (Rehkämper and Görlach 1997). Yet, mechanisms intended to alter deer
movements in relation to human-altered landscapes continue to be engineered without
consideration for standard deer sensory processes. A clear understanding of the visual
capabilities of deer may prove integral to the invention of economically effective strategies to
reduce deer-human conflicts.
The ability to resolve visual details is limited by optics of the eye, size and brightness of
the retinal image, the density of photoreceptors, and connections among photoreceptors and
higher order neurons (Timney and Keil 1992). Cone photoreceptors are responsible for color
vision and the ability to distinguish fine detail (Ali and Klyne 1985). D’Angelo et al.
(unpublished data) found that the distribution of medium wavelength cones in the deer retina was
characteristic of a horizontal visual streak and maximum density of medium wavelength cones
averaged 35,700/mm2. In contrast, Ahnelt et al. (2006) demonstrated that the human retina
contains a fovea centralis, a small circular area with medium wavelength cone density
>150,000/mm2. The fovea centralis affords humans with visual acuity superior to many species
(Ali and Klyne 1985). The visual streak of deer in combination with their wide set eyes likely
provides them with enhanced ability to monitor the horizon and to detect movement, however
deer likely have far less acuity than humans because the density of cones is relatively limited in
the deer retina.

110
Larger eyes have increased distance between the cornea/lens and retina, which increases
the size of the image projected on the retina (Walls 1942). Since the diameter of photoreceptors
varies little among species, the number of photoreceptors that are available to absorb light is
greater in the large eye (Walls 1942). By maximizing image size and the number of
photoreceptors in the retina, the large eye enhances visual acuity. D’Angelo et al. (unpublished
data) demonstrated that the thickness of the deer lens and the spatial arrangement of their eye
likely projects an image on the retina which is moderate in size and brightness as compared to
the human eye (Walls 1942, Howland et al. 2004). The density of cones and the morphological
characteristics of the deer eye suggest that deer may have reduced visual acuity as compared
to humans.
Discrimination trials have been used to estimate visual acuity in a variety of ungulates
(Blakeman and Friend 1986, Entsu et al. 1992, Timney and Keil 1992, Harman et al. 2001).
Our objective was to estimate the visual acuity of white-tailed deer by discrimination trials with
a hand-reared captive deer.
STUDY AREA AND ANIMAL
We conducted our research at the Daniel B. Warnell School of Forestry and Natural
Resources, Whitehall Deer Research Facility at the University of Georgia, Athens. The facility
was 2.4 ha in area and was encompassed by 3-m high woven-wire fencing. We hand reared the
female subject deer used in this study from 3 days of age until weaning to accommodate her to
humans. During this study, the subject deer was housed individually or with 1-7 other human-
accommodated deer. We began the procedures described in this study when the subject deer was
approximately 2 years old. However, on a regular basis throughout her life, the subject deer was

111
used in other experiments in close association with human handlers and involving the deer she
was housed with.
METHODS
Apparatus and Test Gratings
We constructed a testing apparatus within a 0.1-ha paddock which the subject deer was
housed in (Figure A.1). The apparatus consisted of 2 parallel corridors 2 m in length and 0.5 m
in width constructed with wooden frames and opaque silt-fence fabric. The corridors were
attached to a 2.4 m x 3.6 m platform made of 1.9-cm thick plywood. At the end of each corridor
was a plywood wall 2 m in height with a rectangular cutout 23 cm x 29 cm centered in the
corridor at 1 m in height. On the back surface of the wall below each cutout, we mounted a
plastic well for placement of food during visual acuity trials. We constructed panels to be
mounted within the rectangular cutouts to hold the test targets. The panels consisted of a 22 cm
x 28 cm clear acrylic sheet mounted on a 22 cm x 28 cm polypropylene sheet with a 0.2 cm
space between the sheets for insertion of test targets. We secured the panels within the cutouts
with hinges centered on the upper edge of the cutout and test panel. We designed test targets
with Adobe Illustrator 9.0 software (Adobe Systems Inc., San Jose, California, USA) and printed
the test targets with a bubble jet printer on white photo paper (Figure A.2). The test targets were
spatial acuity gratings with vertical black bars evenly spaced against a white background in
spatial frequencies of 2, 4, 6, 8, and 30 cycles/degree. We presented the 30 cycles/degree acuity
grating to the subject deer as the negative target. Based on visual acuity information on other
species, we assumed that the visual acuity of white-tailed deer was less than 30 cycles/degree
and would appear gray to the subject deer (Harman et al. 2001). We designated a plain sheet of
white photo paper as the positive training target.

112
Testing Procedures
We accommodated the subject deer to the apparatus by placing her food ad libitum in the
wells with the testing panels secured open. Once she became accustomed to receiving her food
in the apparatus, we closed the panels and placed food only behind the positive training target.
The other panel contained the 30 cycles/degree negative target. The subject deer readily
obtained her food by pushing open the panels with her nose. Over 2 weeks, we alternated daily
which corridor received the positive training target. Once this behavior was established, we
relocated the deer’s primary food to an alternate location in the paddock. Behind the panel with
the positive training target, we placed a small food reward which the deer preferred over her
normal ration (e.g., fresh fruit, pelleted food sweetened with molasses, prunes). We were able to
conduct multiple trials per session by restricting access of the deer to the apparatus between trials
so the observer could change panels and replenish the food reward.
We conducted trials several days per week for a duration determined by the willingness
of the subject deer to participate each day. We used random numbers generated previously to
determine the placement of the positive target for each trial. A trial consisted of the subject deer
entering the apparatus, viewing the testing panels from the end of the corridors, and walking
down a corridor and pushing open the testing panel to receive the food reward (Figure A.5). To
ensure that the subject deer was making the visual discrimination at the appropriate distance at
the end of the corridor, we excluded trials in which the subject deer walked partially down one
corridor, and exited that corridor without obtaining the food reward. After each trial, the
observer encouraged the deer to exit the apparatus, closed doors at the ends of the corridors, and
changed the testing targets as necessary, and replaced the food reward. Once the subject deer
achieved >70% discrimination of the positive training target, we began to include the spatial

113
acuity gratings as positive targets. For each trial, we assigned randomly the positive training
target or 2, 4, 6, or 8 cycles/degree acuity gratings as the positive target versus the 30
cycles/degree negative target. We set 70% of trials correct as the threshold below which we
assumed the subject deer was no longer discriminating between the negative and positive
targets. We performed all animal use procedures in a humane manner, and received prior
approval from the University of Georgia Institutional Animal Care and Use
Committee (#A2004-10102-0).
RESULTS AND DISCUSSION
From May-August 2006 we conducted 150 visual acuity trials. We estimated the visual
acuity of the deer as approximately 6 cycles/degree-the spatial frequency beyond which
discrimination fell below 70% correct (Figure A.6). Our estimate suggests that the ability of
white-tailed deer to discern fine visual details is limited relative to humans with normal vision
which possess visual acuity of 30 cycles/degree (Ali and Klyne 1985). Visual acuity of white-
tailed deer appears to be similar to the domestic cat (Felis domesticus) which was estimated to
have visual acuity between 6-9 cycles/degree (Jacobson et al. 1976, Bloom and Berkely 1977,
Hall and Mitchell 1991). Using methods similar to those in our study, Harman et al. (2001)
estimated visual acuity of the Bactrian camel (Camelus bactrius) as 10 cycles/degree. The horse
(Equus caballus), an ungulate common to open habitats, was estimated to have visual acuity of
23.3 cycles/degree, much greater than our estimate for white-tailed deer (Timney and Keil 1992).
Timney and Keil (1992) attributed the high visual acuity of the horse in part to their size of their
eyes which are one of the largest of all mammals.
The limited visual acuity of white-tailed deer as compared to humans and other species
suggests that deer may rely more on their other senses to fulfill their life requisites. Olfaction is

114
likely the dominant sense utilized by deer to navigate their home ranges while using established
travel routes. Deer appear to use olfaction and touch to select food items while keeping their
eyes fixed at further distances for detection of potential sources of danger (G. J. D’Angelo
unpublished data). Correspondingly, white-tailed lack trichromatic color vision (Jacobs et al.
1994), a trait characteristic of primates which visually select foods based on coloration (Surridge
et al. 2003). Further research on the accommodation abilities of white-tailed deer and the
abundance of ganglion cells in the deer retina may further elucidate factors limiting their
visual acuity.
The properties of the deer eye which limit their visual acuity (e.g., moderate eye size and
lens thickness, limited density of cones) provide deer with greater sensitivity to light. Such a
trade-off enables deer to exploit an ecological niche inaccessible to many other species (Miller
and Murphy 1995).
LITERATURE CITED
Ahnelt, P. K., C. Schubert, A. Kübber-Heiss, A. Schiviz, and E. Anger. 2006. Independent
variation of retinal S and M cone photoreceptor topographies: a survey of four families
of mammals. Visual Neuroscience 23:429-435.
Ali, M. A., and M. A. Klyne. 1985. Vision in vertebrates. Plenum Press, New York, NY.
Blakeman, N. E., and T. H. Friend. 1986. Visual discrimination at varying distances in Spanish
goats. Applied Animal Behaviour Science 16:279-283.
Bloom, M., and M. A. Berkeley. 1977. Visual acuity and the near point of accommodation in
cats. Vision Research 17:723-730.
Entsu, S., H. Dohi, and A. Yamada. 1992. Visual acuity of cattle determined by the method of
discrimination learning. Applied Animal Behaviour Science 34:1-10.

115
Hall, S. E., and D. E. Mitchell. 1991. Grating acuity of cats measured with detection and
discrimination tasks. Behavioural Brain Research 44:1-9.
Harman, A., J. Dann, A. Ahmat, T. Macuda, K. Johnston, and B. Timney. 2001. The retinal
ganglion cell layer and visual acuity of the camel. Brain, Behavior and Evolution
58:15-27.
Howland, H. C., S. Merola, and J. R. Basarab. 2004. The allometry and scaling of the size of
vertebrate eyes. Vision Research 44:2043-2065.
Jacobs, G. H., J. F. Deegan, J. Neitz, B. P. Murphy, K. V. Miller, and R. L. Marchinton. 1994.
Electrophysical measurements of spectral mechanisms in the retinas of two cervids:
white-tailed deer (Odocoileus virginianus) and fallow deer (Dama dama). Journal of
Comparative Physiology A 174:551-557.
Jacobson, S. G. K. B. Franklin, and W. I. McDonald. 1976. Visual acuity of the cat. Vision
Research 16:1141-1143.
Miller, P. E., and C. J. Murphy. 1995. Vision in dogs. Journal of the American Veterinary
Medical Association 207:1623-1634.
Rehkämper, G., and A. Görlach. 1997. Visual discrimination in adult dairy bulls. Journal of
Dairy Science 80:1613-1621.
Surridge, A. K., D. Orsorio, and N. I. Mundy. 2003. Evolution and selection of trichromatic
vision in primates. Trends in Ecology & Evolution 16:198-205.
Timney, B., and K. Keil. 1992. Visual acuity in the horse. Vision Research 32:2289-2293.
Walls, G.L. 1942. The vertebrate eye and its adaptive radiation. Cranbrook Institute of Science,
Bloomfield Hills, MI.

116
Figure A.1. Apparatus used to estimate visual acuity of the white-tailed deer (Odocoileus
virginianus) at the Daniel B. Warnell School of Forestry and Natural Resources, Whitehall Deer
Research Facility at the University of Georgia, during May-August 2006. The panels for
mounting the test targets are visible at the ends of the 2 corridors. The photograph was taken
approximately at the point in the apparatus that the subject deer made her choice as to which
corridor to enter during each trial.
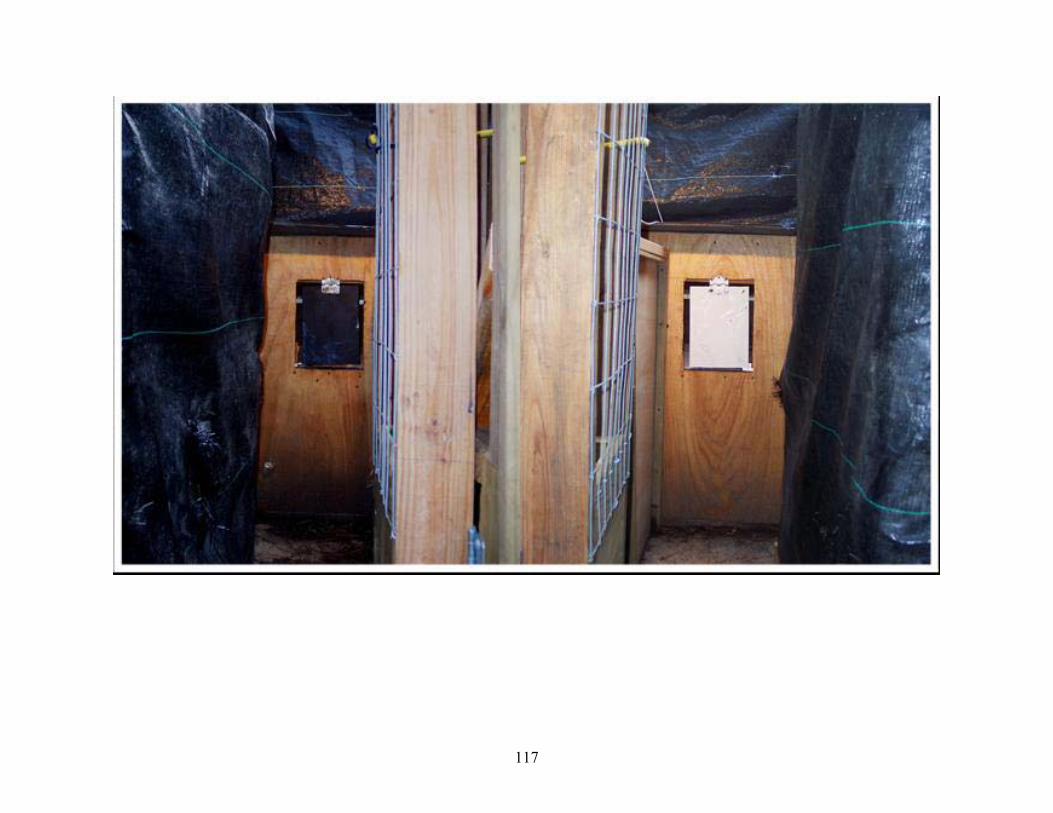
117

118
Figure A.2. Spatial frequency grating created with Adobe Illustrator 9.0 software (Adobe
Systems Inc., San Jose, California, USA) and used in visual acuity trials of white-tailed deer
(Odocoileus virginianus) at the Daniel B. Warnell School of Forestry and Natural Resources,
Whitehall Deer Research Facility at the University of Georgia, during May-August 2006.

119

120
Figure A.3. Subject white-tailed deer (Odocoileus virginianus) entering apparatus used to
estimate her visual acuity at the Daniel B. Warnell School of Forestry and Natural Resources,
Whitehall Deer Research Facility at the University of Georgia, during May-August 2006.
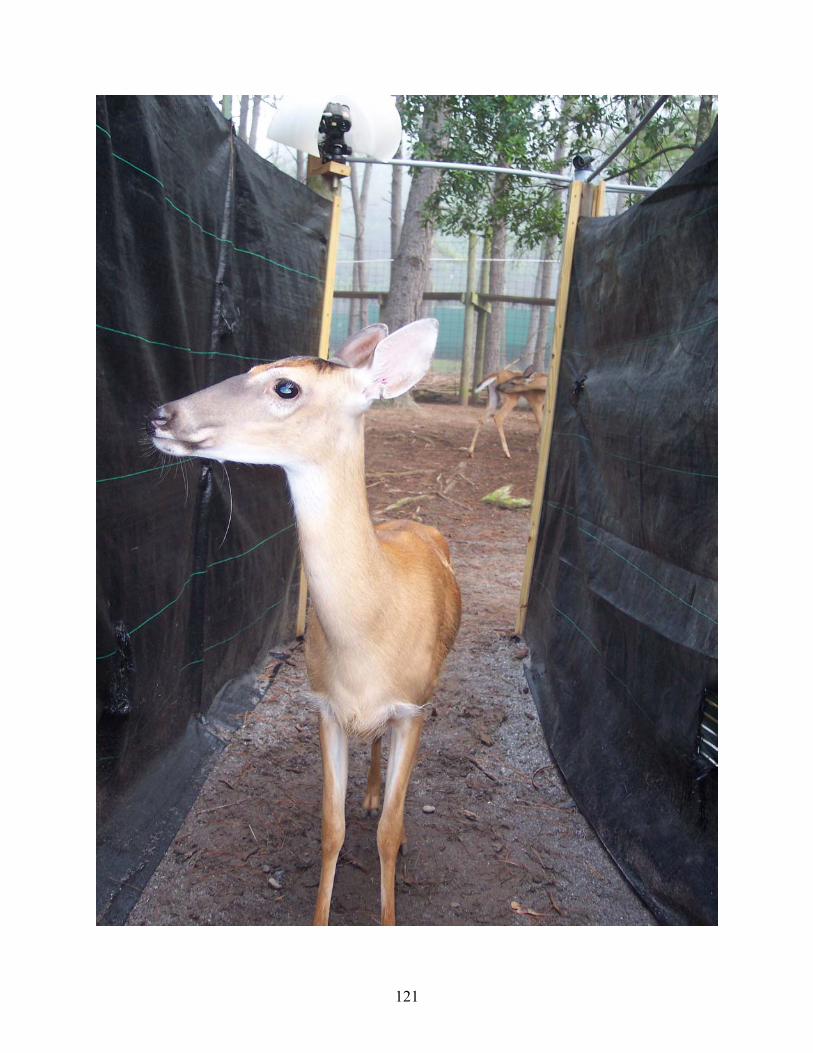
121

122
Figure A.4. Discrimination of test targets by a white-tailed deer (Odocoileus virginianus)
during experiments to estimate the deer’s visual acuity at the Daniel B. Warnell School of
Forestry and Natural Resources, Whitehall Deer Research Facility at the University of Georgia,
during May-August 2006.

123
50
60
70
80
90
100
Whitetarget
2 cyc/deg 4 cyc/deg 6 cyc/deg 8 cyc/deg
Test grating (spatial frequency)
Perc
ent c
orre
ct o
f 30
tria
ls