development and validation of the australian aboriginal...
TRANSCRIPT
Development and validation of the Australian Aboriginal racialidentity and self-esteem survey for 8-12 year old children(IRISE_C)Kickett-Tucker, C., Christensen, D., Lawrence, D., Zubrick, S., Johnson, D., & Stanley, F. (2015).Development and validation of the Australian Aboriginal racial identity and self-esteem survey for 8-12 yearold children (IRISE_C). International Journal for Equity in Health , 14(1), 1-13. [103]. DOI: 10.1186/s12939-015-0234-3
Published in:International Journal for Equity in Health
DOI:10.1186/s12939-015-0234-3
Document VersionPublisher's PDF, also known as Version of record
Link to publication in the UWA Research Repository
General rightsCopyright owners retain the copyright for their material stored in the UWA Research Repository. The University grants no end-userrights beyond those which are provided by the Australian Copyright Act 1968. Users may make use of the material in the Repositoryproviding due attribution is given and the use is in accordance with the Copyright Act 1968.
Take down policyIf you believe this document infringes copyright, raise a complaint by contacting [email protected]. The document will beimmediately withdrawn from public access while the complaint is being investigated.
Download date: 30. May. 2018

RESEARCH Open Access
Development and validation of theAustralian Aboriginal racial identity andself-esteem survey for 8–12 year oldchildren (IRISE_C)CS Kickett-Tucker1*, D. Christensen2, D. Lawrence2, SR Zubrick2, DJ Johnson3 and F. Stanley2
Abstract
Introduction: In Australia, there is little empirical research of the racial identity of Indigenous children and youth asthe majority of the current literature focuses on adults. Furthermore, there are no instruments developed withcultural appropriateness when exploring the identity and self-esteem of the Australian Aboriginal population,especially children. The IRISE_C (Racial Identity and Self-Esteem of children) inventory was developed to explore theelements of racial identity and self-esteem of urban, rural and regional Aboriginal children. This paper describes thedevelopment and validation of the IRISE_C instrument with over 250 Aboriginal children aged 8 to 12 years.
Methods: A pilot of the IRISE C instrument was combined with individual interviews and was undertaken with 35urban Aboriginal children aged 8–12 years. An exploratory factor analysis was performed to refine the survey andreduce redundant items in readiness for the main study. In the main study, the IRISE C was employed to 229Aboriginal children aged 6–13 years across three sites (rural, regional and urban) in Western Australia. Anexploratory factor analysis using Principal axis factoring was used to assess the fit of items and survey structure. Aconfirmatory factor analysis was then employed using LISREL (diagonally weighted least squares) to assess factorstructures across domains. Internal consistency and reliability of subscales were assessed using Cronbach’s co-efficient alpha.
Results: The pilot testing identified two key concepts - children’s knowledge of issues related to their racialidentity, and the importance, or salience, that they attach to these issues. In the main study, factor analyses showedtwo clear factors relating to: Aboriginal culture and traditions; and a sense of belonging to an Aboriginalcommunity. Principal Axis Factoring of the Knowledge items supported a 2-factor solution, which explained 38.7 %of variance. Factor One (Aboriginal culture) had a Cronbach’s alpha of 0.835; Factor 2 (racial identity) had aCronbach’s alpha of 0.800, thus demonstrating high internal reliability of the scales.
Conclusion: The IRISE_C has been shown to be a valid instrument useful of exploring the development of racialidentity of Australian Aboriginal children across the 8–12 year old age range and across urban, rural and regionalgeographical locations.
Keywords: Instrument development, Racial identity, Self-esteem, Australian Aboriginal children
* Correspondence: [email protected] Catholic University & Pindi Pindi, Centre for Research Excellencein Aboriginal Wellbeing, 20 William Street, Midland, WA 6935, AustraliaFull list of author information is available at the end of the article
© 2015 Kickett-Tucker et al. Open Access This article is distributed under the terms of the Creative Commons Attribution 4.0International License (http://creativecommons.org/licenses/by/4.0/), which permits unrestricted use, distribution, andreproduction in any medium, provided you give appropriate credit to the original author(s) and the source, provide a link tothe Creative Commons license, and indicate if changes were made. The Creative Commons Public Domain Dedication waiver(http://creativecommons.org/publicdomain/zero/1.0/) applies to the data made available in this article, unless otherwise stated.
Kickett-Tucker et al. International Journal for Equity in Health (2015) 14:103 DOI 10.1186/s12939-015-0234-3
IntroductionIt is generally accepted that having a positive view ofoneself is beneficial to health and wellbeing. Thosewith a high self-esteem (or self-concept) can copemore efficiently with life's challenges; they feel valued,respected and generally lead happy and productivelives [1]. Those “who feel good about themselves andtheir abilities are likely to be more effective than indi-viduals with low self-concepts” and are less likely tohave anxiety or depression [2].Links between racial identity (also referred to as cultural
identity, ethnic identity, or racial-ethnic identity) and posi-tive self-esteem have been explored by various researchersaround the world. Corenblum [3] states that “racial-ethnicidentity and self-esteem are important indicators of posi-tive mental health and adjustment among low status andminority group members”, and that positive racial identityprovides a buffer against the negative impacts of prejudiceand discrimination often experienced by minority groups.In general, the extent to which one’s cultural group isrecognised and clearly defined in one’s mind is positivelyrelated to a clear definition of one’s self and subsequently,one’s self-esteem [4–6].Since the 1960’s, researchers have developed measures
of self-esteem. These encompass relatively long scales,such as the Piers-Harris Children’s Self-Concept Scale [7]and the Coopersmith Self-Esteem Inventory [8] as well asthe shorter Rosenberg Self-Esteem Scale [9] originally de-signed to measure self-esteem in high school students.In Australia, Marsh [10] developed a Self-DescriptionSurvey which measures nine factors specific to physicalself-concept: Activity, Appearance, Body Fat, Coordin-ation, Endurance, Flexibility, Health, Sport and Strength,as well as measures of Global Physical and GlobalEsteem.Other researchers have moved away from generic mea-
sures of self-esteem to measures more explicitly centeredon racial and cultural identity. The “Multi-dimensionalModel of Māori Identity and Cultural Engagement” [11]was designed specific for Māori populations in NewZealand. It was developed to measure identity and culturalengagement, but does not specifically focus on the link be-tween racial identity and self-esteem. It was also designedand tested on adults aged 18–74 years.The link however between self-esteem and racial iden-
tity for Australian Aboriginal children has never beenmade or rarely estimated. Historically, health and well-being frameworks have been developed using researchbased on general population groups. Many of the con-cepts in existing scales do not align themselves with Abo-riginal worldview and particularly concepts of health andwellbeing. For Australian Aboriginal populations, the def-inition of health “is not just the physical wellbeing of anindividual, but the social, emotional and cultural wellbeing
of the whole community” [12]. Hence, it is important todevelop instruments specifically for the Australian Abori-ginal experience, with Aboriginal involvement in all stagesof research. This is “a matter of both ethics and rigor and… is considered vital if health inequalities are to be ad-dressed” [13]. Furthermore, any programs developed fromthe findings of studies using the instrument are unlikely tobe effective if there is not a “high level of Indigenous own-ership and community support” [14].The measurement of self-esteem across cultures can be
difficult, particularly when one culture places a highervalue on particular issues than others. For example,Western cultures tend to place a higher value on issues ofindependence and self-reliance, whereas more traditionalsocieties (such as Aboriginal groups) more commonlyvalue collectivism and a strong reliance on social support[15]. School achievement is a good example. Self-esteemmight be more valued in Western society where the em-phasis is less on family and community extensions of selfbut on individualism and competition [15].A measure of self-esteem developed in Western cultures
will not necessarily be valid in other societies. Purdie &McCrindle [15] discuss a range of potential sources oferror that can occur when using an instrument developedin a different culture. Firstly, concepts may be interpreteddifferently across cultures. Secondly, there may be a de-gree of method bias introduced, in terms of how the in-strument is administered and whether it is culturallyappropriate. Response errors increase when the instru-ment is designed and administered by a person from a dif-ferent culture [16]. Responses could be affected by readingability (which may not be particularly strong in some cul-tures), by expected cultural norms (some societies areknown to always answer in the affirmative, so as not todisagree with the interviewer) and by the race of the inter-viewer (if different to the respondent) [15]. Finally, itembias may occur if questions can have different meaningsfor different cultural groups, for example, the use of collo-quialisms may affect a respondent’s understanding [15].Aside from needing an instrument that is specifically de-
signed for Aboriginal populations, the instrument needsto be suitable for children and use language that Aborigi-nal children will relate to. Racial identity is formed grad-ually, starting from as young as 4 years of age anddeveloping more fully as a child grows. Byrd [17] identifiesthree aspects of racial identity: a) awareness (the ability todistinguish between members of different races); b) identi-fication (the ability to name one’s own race); and c) atti-tudes (beliefs about the characteristics between differentracial groups). Awareness and identification become stableby adolescence, so studies that deal with racial issues inadults focus mainly on attitudes. However, in childrenawareness and identification are also important. The ageat which awareness develops varies, but most children are
Kickett-Tucker et al. International Journal for Equity in Health (2015) 14:103 Page 2 of 13
not able to correctly classify individuals by race until theyare four or five, although awareness begins as soon as theycan notice differences in people’s skin colour, hair, eyecolour, which can be distinguished as young as 2–3 yearsold [18, 19]. Ability to self-identify comes by around fourto six years of age. Knowing that one’s race will not change(racial constancy) develops somewhat later, at around tento twelve years. Children gradually increase the complex-ity of their understanding of racial differences as theygrow older.It is important to be able to track how racial identity
and self-esteem develop over childhood and adolescentyears. Currently, most available tools for measuring self-esteem have been developed for adults or adolescents(with some modified for children) and lack specificity toAboriginal populations. A self-report survey is not bestsuited to younger children who are still developing liter-acy skills. We report here on a self-esteem scale calledthe IRISE-C, designed by an Aboriginal researcher basedon a literature review and Aboriginal community con-sultation, and using terms that would be well understoodby Aboriginal children. It was administered by Aborigi-nal Community Research Assistants (ACRA) asking andrecording the children’s answers, eliminating the needfor literacy proficiency. The terminology used in the IRI-SE_C mirrors the language Aboriginal children use andthereby reducing misunderstanding of questions. Abori-ginal Community Research Assistants asked each ques-tion and used visual score charts for the participants toindicate their responses. The purpose, content and pro-cedures for the IRISE_C have been developed in accord-ance with the wider Aboriginal community’scommunication protocols and culturally safe and securepractices deemed appropriate for Australian Aboriginalchildren aged 8–12 years.
MethodsDesignThis research employed a mixed methods design toallow the pilot and main study procedures and findingsto support and complement each other. In the pilotstudy, data were gathered from several sources includingin-depth personal interviews, surveys and students’school reports. For the main study, data were collectedfrom surveys.Ethical approval was obtained from the Human Research
Ethics Committee at Murdoch University (Approval 2009/163), Western Australian Health Ethics Committee(Approval 244 06/09) and the Western Australian Depart-ment of Education (Approval D10/0358138).
Pilot studyThe IRISE_C was employed in a pilot study whereby theinstrument consisted of 71 items and explored the
following themes (subscales): 1. Knowledge and/or experi-ence of identity; 2. Salience placed upon identity; 3. Know-ledge and/or experience of culture and; 4. Salience placedupon culture. The IRISE_C utilised a four point Likertscale with subjective responses ranging from ‘none’, ‘a littlebit’, ‘some’ and ‘a lot.’ The purpose of the pilot study was totrial the IRISE_C inventory with a larger sample acrossthe expected age range of 8–12 year olds. The objective ofthe pilot study was to gather preliminary data to helpguide the main study.
Recruitment of participantsIn the pilot study, the participants consisted of 35 urbanAboriginal children aged 8 to 12 years old attending co-educational State Primary schools in metropolitan Perth,Western Australia. Five schools were randomly selected.Individual participants were identified as Aboriginal usinginformation supplied on the school enrolment form. Thisform was completed by carers upon their child’s enrol-ment at the commencement of the school year. Carersvoluntarily reported their child’s Aboriginal identity. Ofthe total number of participants, 16 were male (45.7 %)and 19 were female (54.2 %). Pilot study participants werein grades ranging from 2 to 7, with the majority in grades5 and 6.
AdministrationA combination of survey and taped interviews were con-ducted with each Aboriginal child and were administeredby trained Aboriginal Community Research Assistants atthe school site. Telephone surveys were then conductedwith the primary carer for each child. This process wasnecessary to collect family demographic information.Other data sources collected included student academicreports, behaviour reports and student profiles, whichwere provided by the respective schools.
ProcedureThe IRISE_C is a paper survey which was verbally admin-istered one on one to school children by a trained, localAboriginal Community Research Assistant (ACRA). Thescoring key was placed in front of the child participant.The scoring key is A4 in size and contains the Likert scalewith images of “smiley faces.” The pre-pilot and subse-quent pilot of the scoring key revealed that school chil-dren, who are the target group were very familiar with theuse of smiley faces on the IRISE_C scoring chart as it wasan acceptable, recognisable symbol.Aboriginal Community Research Assistants asked each
child to read the scoring chart so that they could assess ifthe child: 1. was able to read the words; 2. understoodwhat the words meant; 3. was familiar with the scale evenif they could not read the words; and 4. were confidentand comfortable in making a decision. This step was
Kickett-Tucker et al. International Journal for Equity in Health (2015) 14:103 Page 3 of 13

repeated until the ACRA made an assessment that eachchild could without reservation (i.e., without stalling, with-out taking more than 5 s to respond to exercise questions,non-response, looking away, or looking directly at theACRA for more than 5 s) provide a verbal answer or indi-cate their response by pointing to the answer on the IRI-SE_C Scoring chart. In the pilot study, no child wasturned away from participation because of the assessmentmade by the ACRA. Young children (8–9 years) weremore likely to point to the chart, whereas older children(10–12 years) provided a verbal response to survey items.After reading each question to the participant, the ACRArecorded the child’s response by marking the appropriateanswer on the survey form.An SPSS [20] database was developed and all individ-
ual responses were recorded accordingly. The databasealso included secondary data such as school attendancerecords, achievement, school behavior records andschool health records.
Scale revisionThe pilot data were used to refine the items containedin the survey. An exploratory factor analysis was under-taken to identify redundant items, items with little or novariability, and items that had minimal relationship tothe underlying concepts of racial identity and self-esteem. This resulted in the 71 items used in the pilotversion of the scale being reduced to 40 items. The 40-item version was then employed in the main study.
Main studyAcceptability of instrumentConsisted with the principles, values and ethics for main-taining cultural security when working with AustralianAboriginal communities [21], selected Aboriginal commu-nity members and professionals working with Aboriginalchildren were invited to assess the acceptability of the IRI-SE_C instrument.Consequently, this group of individuals deemed the
IRISE_C an acceptable survey in which to capture the el-ements of Aboriginal identity and related self-esteemwhich is evidenced in their contributions during stages 3and 4 of instrument development and their participationduring the dissemination of results and of which, thecarers and parents of children also contributed. Furtherevidence of the instrument acceptability is provided inthe response rates for the pilot and main study whichwere 70 % and 91.7 % respectively. These numbers re-veal parents’ and carers’ acceptability in allowing theirchildren to participate. No issues were reported duringthe study in relation to acceptability or use of thesurvey.
Use of instrumentLocal Aboriginal protocols were observed when employ-ing the IRISE_C instrument. More specifically, being re-spectful of each individual Aboriginal child and showingthat the interviewer is genuine (using appropriate verbaland non-verbal language) are key ingredients in growingrapport and eventually a ‘working relationship’ withAboriginal children. These elements are vital to the suc-cess of this project in achieving authentic and reliabledata and these were maintained by:
� Recruiting Aboriginal Community researchassistants from the local area of the study site andtraining them in interviewing and survey techniques.
� Surveys being administered on a one-on-one basiswith each participant.
� Verbally asking each individual survey item ofparticipants and recording the response accordinglyon the paper survey
� Using a visual (image) score card.
Scientific protocols were also observed and maintained(underpinned by Aboriginal community protocols) andthese were very important to ensuring children’s under-standing of survey items:
� Provision of 2 practice questions at thecommencement of the survey.
� Placing a visual score card in front of the child inwhich they used to indicate, by pointing or verbalcommunication of their answers.
� ACRA observed the participant’s eyes as theytracked the visual score card for their responses,thus demonstrating their willingness to seek ananswer to items.
� Reading body language and taking note of verbalcues help to ascertain any difficulties as well as thelevel of engagement of participants during thesurvey. Key characteristics that were recognisablewhen participants were not engaged or had difficultywere: a) gazing elsewhere, b) slouching, c) headdown, d) fidgety, e) blank look, f ) silent or shruggingshoulders when asked a question, g) responding with“what?” when asked a question and h) generalinattentiveness.
RecruitmentThe sample was recruited from 28 schools located in 3locations including rural (Goldfields in Goldfield dis-trict), regional, (Peel in south metro district) and metro-politan (Swan in north metro district).Most participants attended co-educational State Primary
schools however; one independent school was included inthis study. Schools were randomly selected and 10
Kickett-Tucker et al. International Journal for Equity in Health (2015) 14:103 Page 4 of 13
accounted for Swan schools, 16 in Peel and a further 4schools in the Goldfields. Similarly to the pilot study, indi-vidual participants were identified as Aboriginal using in-formation supplied on the school enrolment form.
ParticipantsParticipants in the main study consisted of 229 childrenaged 6 to 13 years of age (mean age, 10 years), and year3 to 7 (mean = year 5) (Table 1).
AdministrationThe IRISE_C survey was verbally administered to chil-dren by the Aboriginal Community Research Assistants(ACRA). A vital element of the main study was the se-lection and recruitment of ACRAs. Successful selection
was based on ACRA’s knowledge of family networks, ac-cess to schools and demonstrated rapport with children.Participants’ responses to individual survey items wererecorded by the ACRA on paper forms and subsequentlyentered onto a SPSS database [20].
ProcedureThe items were tested on 229 children from the Swan(n = 87), Peel (n = 71) and Kalgoorlie (n = 71) regions ofWestern Australia. Two hundred and twenty seven (227)children acknowledged some form of Aboriginal identity,with the other 2 children having missing data. Childrenalso varied in their rate of acknowledgement of non-Aboriginal heritage. Children were able to indicate theirAboriginal group name, with 164 children indicatingat least 1 group identity, 47 indicating membership ofat least 2 groups, and 6 children indicating member-ship of 3 groups. Response rates to IRISE-C questionsvaried (n = 210–226), giving a ratio of approximately 6children per item. Although guidance on adequatesample for exploratory factor analysis varies, Costelloand Osborne [22] would deem this an adequate sam-ple for confirmatory factor analysis.
Methods of analysisThe fit of items and structure of the survey was firstassessed using Exploratory Factor Analysis and then vali-dated using Confirmatory Factor Analysis. The explora-tory factor analysis was undertaken in SPSS [20].Principal axis factoring was used, with an oblique(promax) rotation, as there was no a priori basis for as-suming that different aspects of racial identity and self-esteem would be independent. The internal consistencyand reliability of each sub-scale was assessed usingCronbach’s co-efficient α.Following identification of a similar factor structure in
both the knowledge and salience items of the IRISE_C, aconfirmatory factor analysis was used to assess the fit ofa consistent structure across both knowledge and sali-ence domains. The confirmatory factor analysis wasundertaken using LISREL, using the method of diag-onally weighted least squares.
ResultsExploratory factor analysisKnowledge questionsA visual inspection of the correlations matrix for theknowledge questions identified several correlations above0.3 in the dataset, with each item (other than Q.26. ‘Howmuch do you get ‘shame’ because you are Aboriginal?’)having correlations above 0.3 with other items. The KMOwas 0.873 and Bartlett’s test of sphericity was significant(chi-square (171) = 1127.3, p < 0.001), supporting factor-ability of the dataset.
Table 1 Sample characteristics
Gender
Frequency Percent Male Female
Age 6 1 .4 0 1
7 8 3.5 4 4
8 35 15.3 13 22
9 47 20.5 22 24
10 45 19.7 24 19
11 46 20.1 25 20
12 38 16.6 19 19
13 7 3.1 4 3
Missing 2 .9
School grade 3 41 17.9
4 49 21.4
5 44 19.2
6 52 22.7
7 37 16.2
Missing 6 2.6
Major Aboriginal orTorres Strait IslanderGroup
Noongar 110 48.0
Wongi 28 12.2
Yamatji 16 7.0
Koori 4 1.7
Gooniyanati 1 .4
Yeroo 2 .9
Pulku 2 .9
Torres StraitIslander
1 .4
Missing 65 28.4
Non-AboriginalHeritage
Yes 83 36.2
No 91 39.7
Don’t know 24 10.4
Sometimes 1 .4
Missing 30 13.1
Kickett-Tucker et al. International Journal for Equity in Health (2015) 14:103 Page 5 of 13
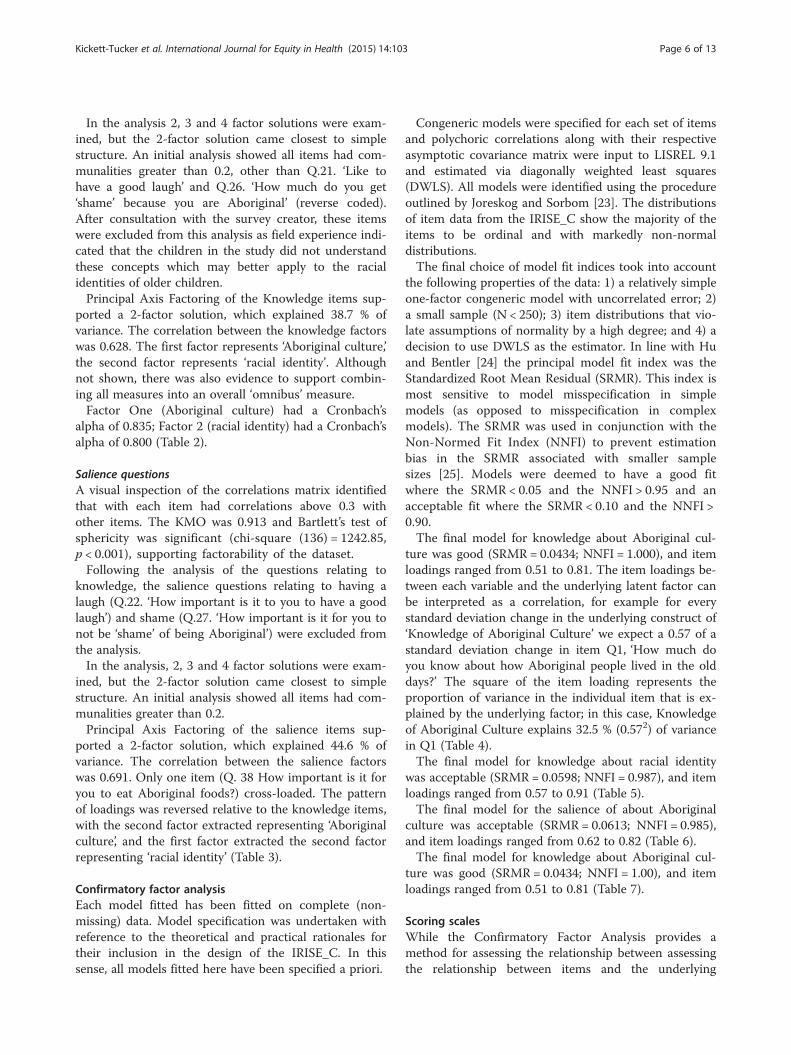
In the analysis 2, 3 and 4 factor solutions were exam-ined, but the 2-factor solution came closest to simplestructure. An initial analysis showed all items had com-munalities greater than 0.2, other than Q.21. ‘Like tohave a good laugh’ and Q.26. ‘How much do you get‘shame’ because you are Aboriginal’ (reverse coded).After consultation with the survey creator, these itemswere excluded from this analysis as field experience indi-cated that the children in the study did not understandthese concepts which may better apply to the racialidentities of older children.Principal Axis Factoring of the Knowledge items sup-
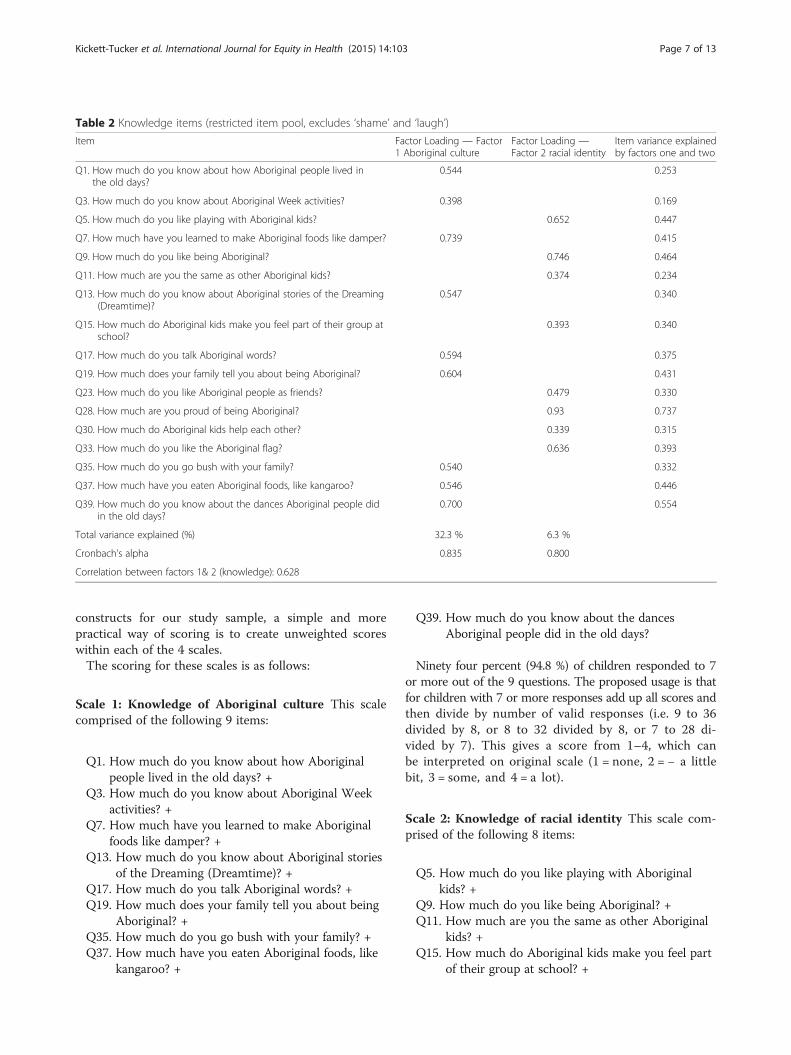
ported a 2-factor solution, which explained 38.7 % ofvariance. The correlation between the knowledge factorswas 0.628. The first factor represents ‘Aboriginal culture,’the second factor represents ‘racial identity’. Althoughnot shown, there was also evidence to support combin-ing all measures into an overall ‘omnibus’ measure.Factor One (Aboriginal culture) had a Cronbach’s
alpha of 0.835; Factor 2 (racial identity) had a Cronbach’salpha of 0.800 (Table 2).
Salience questionsA visual inspection of the correlations matrix identifiedthat with each item had correlations above 0.3 withother items. The KMO was 0.913 and Bartlett’s test ofsphericity was significant (chi-square (136) = 1242.85,p < 0.001), supporting factorability of the dataset.Following the analysis of the questions relating to
knowledge, the salience questions relating to having alaugh (Q.22. ‘How important is it to you to have a goodlaugh’) and shame (Q.27. ‘How important is it for you tonot be ‘shame’ of being Aboriginal’) were excluded fromthe analysis.In the analysis, 2, 3 and 4 factor solutions were exam-
ined, but the 2-factor solution came closest to simplestructure. An initial analysis showed all items had com-munalities greater than 0.2.Principal Axis Factoring of the salience items sup-
ported a 2-factor solution, which explained 44.6 % ofvariance. The correlation between the salience factorswas 0.691. Only one item (Q. 38 How important is it foryou to eat Aboriginal foods?) cross-loaded. The patternof loadings was reversed relative to the knowledge items,with the second factor extracted representing ‘Aboriginalculture’, and the first factor extracted the second factorrepresenting ‘racial identity’ (Table 3).
Confirmatory factor analysisEach model fitted has been fitted on complete (non-missing) data. Model specification was undertaken withreference to the theoretical and practical rationales fortheir inclusion in the design of the IRISE_C. In thissense, all models fitted here have been specified a priori.
Congeneric models were specified for each set of itemsand polychoric correlations along with their respectiveasymptotic covariance matrix were input to LISREL 9.1and estimated via diagonally weighted least squares(DWLS). All models were identified using the procedureoutlined by Joreskog and Sorbom [23]. The distributionsof item data from the IRISE_C show the majority of theitems to be ordinal and with markedly non-normaldistributions.The final choice of model fit indices took into account
the following properties of the data: 1) a relatively simpleone-factor congeneric model with uncorrelated error; 2)a small sample (N < 250); 3) item distributions that vio-late assumptions of normality by a high degree; and 4) adecision to use DWLS as the estimator. In line with Huand Bentler [24] the principal model fit index was theStandardized Root Mean Residual (SRMR). This index ismost sensitive to model misspecification in simplemodels (as opposed to misspecification in complexmodels). The SRMR was used in conjunction with theNon-Normed Fit Index (NNFI) to prevent estimationbias in the SRMR associated with smaller samplesizes [25]. Models were deemed to have a good fitwhere the SRMR < 0.05 and the NNFI > 0.95 and anacceptable fit where the SRMR < 0.10 and the NNFI >0.90.The final model for knowledge about Aboriginal cul-
ture was good (SRMR = 0.0434; NNFI = 1.000), and itemloadings ranged from 0.51 to 0.81. The item loadings be-tween each variable and the underlying latent factor canbe interpreted as a correlation, for example for everystandard deviation change in the underlying construct of‘Knowledge of Aboriginal Culture’ we expect a 0.57 of astandard deviation change in item Q1, ‘How much doyou know about how Aboriginal people lived in the olddays?’ The square of the item loading represents theproportion of variance in the individual item that is ex-plained by the underlying factor; in this case, Knowledgeof Aboriginal Culture explains 32.5 % (0.572) of variancein Q1 (Table 4).The final model for knowledge about racial identity
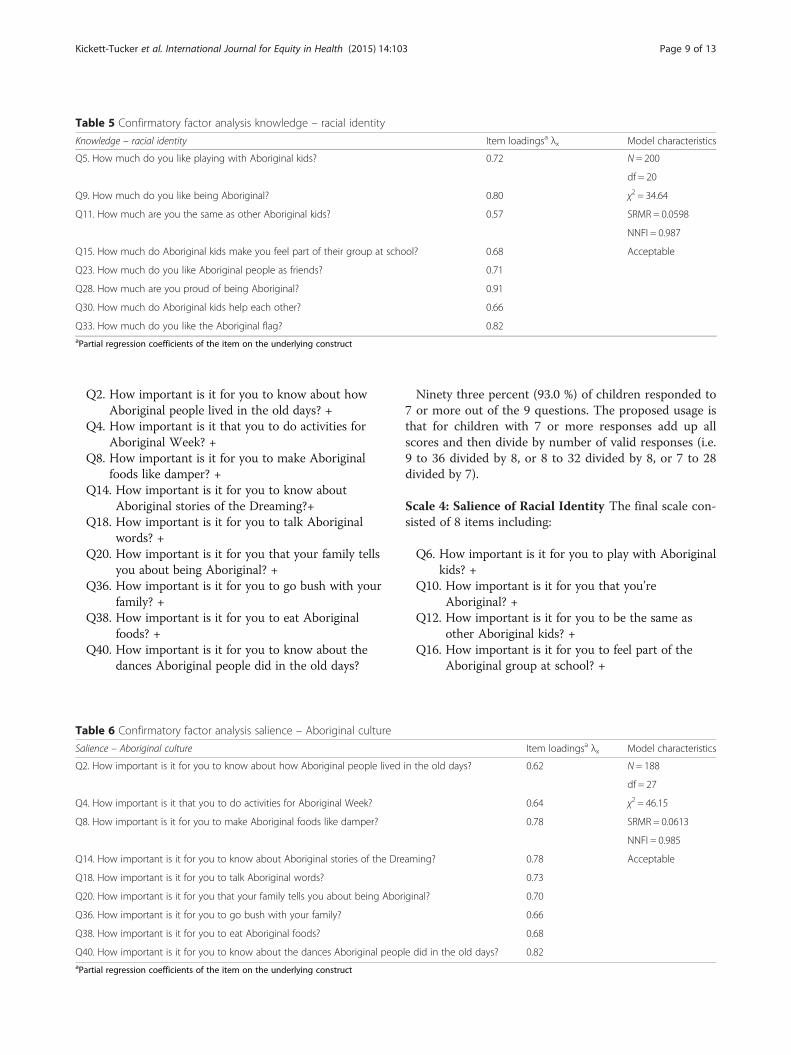
was acceptable (SRMR = 0.0598; NNFI = 0.987), and itemloadings ranged from 0.57 to 0.91 (Table 5).The final model for the salience of about Aboriginal
culture was acceptable (SRMR = 0.0613; NNFI = 0.985),and item loadings ranged from 0.62 to 0.82 (Table 6).The final model for knowledge about Aboriginal cul-
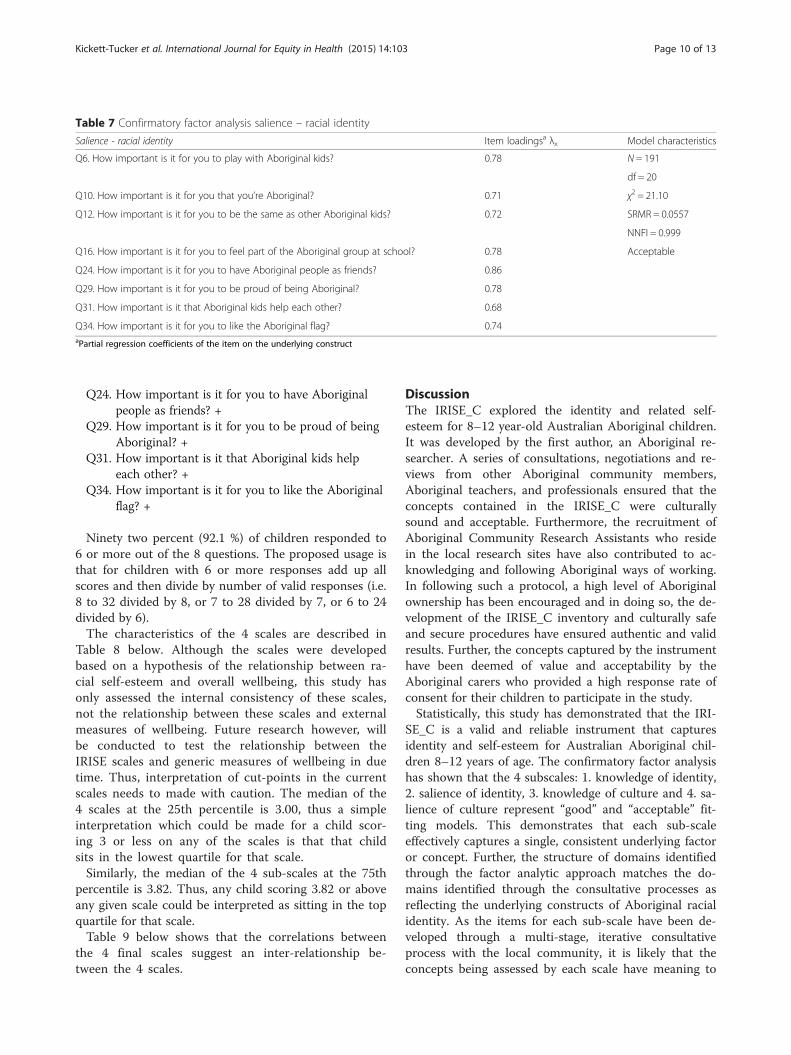
ture was good (SRMR = 0.0434; NNFI = 1.00), and itemloadings ranged from 0.51 to 0.81 (Table 7).
Scoring scalesWhile the Confirmatory Factor Analysis provides amethod for assessing the relationship between assessingthe relationship between items and the underlying
Kickett-Tucker et al. International Journal for Equity in Health (2015) 14:103 Page 6 of 13
constructs for our study sample, a simple and morepractical way of scoring is to create unweighted scoreswithin each of the 4 scales.The scoring for these scales is as follows:
Scale 1: Knowledge of Aboriginal culture This scalecomprised of the following 9 items:
Q1. How much do you know about how Aboriginalpeople lived in the old days? +
Q3. How much do you know about Aboriginal Weekactivities? +
Q7. How much have you learned to make Aboriginalfoods like damper? +
Q13. How much do you know about Aboriginal storiesof the Dreaming (Dreamtime)? +
Q17. How much do you talk Aboriginal words? +Q19. How much does your family tell you about being
Aboriginal? +Q35. How much do you go bush with your family? +Q37. How much have you eaten Aboriginal foods, like
kangaroo? +
Q39. How much do you know about the dancesAboriginal people did in the old days?
Ninety four percent (94.8 %) of children responded to 7or more out of the 9 questions. The proposed usage is thatfor children with 7 or more responses add up all scores andthen divide by number of valid responses (i.e. 9 to 36divided by 8, or 8 to 32 divided by 8, or 7 to 28 di-vided by 7). This gives a score from 1–4, which canbe interpreted on original scale (1 = none, 2 = − a littlebit, 3 = some, and 4 = a lot).
Scale 2: Knowledge of racial identity This scale com-prised of the following 8 items:
Q5. How much do you like playing with Aboriginalkids? +
Q9. How much do you like being Aboriginal? +Q11. How much are you the same as other Aboriginal
kids? +Q15. How much do Aboriginal kids make you feel part
of their group at school? +
Table 2 Knowledge items (restricted item pool, excludes ‘shame’ and ‘laugh’)
Item Factor Loading — Factor1 Aboriginal culture
Factor Loading —Factor 2 racial identity
Item variance explainedby factors one and two
Q1. How much do you know about how Aboriginal people lived inthe old days?
0.544 0.253
Q3. How much do you know about Aboriginal Week activities? 0.398 0.169
Q5. How much do you like playing with Aboriginal kids? 0.652 0.447
Q7. How much have you learned to make Aboriginal foods like damper? 0.739 0.415
Q9. How much do you like being Aboriginal? 0.746 0.464
Q11. How much are you the same as other Aboriginal kids? 0.374 0.234
Q13. How much do you know about Aboriginal stories of the Dreaming(Dreamtime)?
0.547 0.340
Q15. How much do Aboriginal kids make you feel part of their group atschool?
0.393 0.340
Q17. How much do you talk Aboriginal words? 0.594 0.375
Q19. How much does your family tell you about being Aboriginal? 0.604 0.431
Q23. How much do you like Aboriginal people as friends? 0.479 0.330
Q28. How much are you proud of being Aboriginal? 0.93 0.737
Q30. How much do Aboriginal kids help each other? 0.339 0.315
Q33. How much do you like the Aboriginal flag? 0.636 0.393
Q35. How much do you go bush with your family? 0.540 0.332
Q37. How much have you eaten Aboriginal foods, like kangaroo? 0.546 0.446
Q39. How much do you know about the dances Aboriginal people didin the old days?
0.700 0.554
Total variance explained (%) 32.3 % 6.3 %
Cronbach’s alpha 0.835 0.800
Correlation between factors 1& 2 (knowledge): 0.628
Kickett-Tucker et al. International Journal for Equity in Health (2015) 14:103 Page 7 of 13

Q23. How much do you like Aboriginal people asfriends? +
Q28. How much are you proud of being Aboriginal? +Q30. How much do Aboriginal kids help each other?+Q33. How much do you like the Aboriginal flag?
Ninety five percent (95.6 %) of children responded to6 or more out of the 8 questions. The proposed usage is
that for children with 6 or more responses add up allscores and then divide by number of valid responses (i.e.8 to 32 divided by 8, or 7 to 28 divided by 7, or 6 to 24divided by 6).
Scale 3: Salience of Aboriginal culture This scale con-sisted of the following 9 items:
Table 3 Salience items (complete item pool, excludes ‘shame’ and ‘laugh’)
Item Factor Loading — Factor2 Aboriginal culture)
Factor Loading — Factor 1racial identity
Item variance explainedby factors one and two
Q2. How important is it for you to know about how Aboriginalpeople lived in the old days?
0.591 0.356
Q4. How important is it that you to do activities for AboriginalWeek?
0.667 0.383
Q6. How important is it for you to play with Aboriginal kids? 0.743 0.552
Q8. How important is it for you to make Aboriginal foods likedamper?
0.751 0.468
Q10. How important is it for you that you’re Aboriginal? 0.446 0.262
Q12. How important is it for you to be the same as otherAboriginal kids?
0.63 0.463
Q14. How important is it for you to know about Aboriginal storiesof the Dreaming?
0.551 0.515
Q16. How important is it for you to feel part of the Aboriginalgroup at school?
0.787 0.488
Q18. How important is it for you to talk Aboriginal words? 0.723 0.462
Q20. How important is it for you that your family tells you aboutbeing Aboriginal?
0.396 0.462
Q24. How important is it for you to have Aboriginal people asfriends?
0.871 0.678
Q29. How important is it for you to be proud of beingAboriginal?
0.62 0.454
Table 4 Confirmatory factor analysis knowledge – Aboriginal culture
Knowledge – Aboriginal culture Item loadingsa λx Model characteristics
Q1. How much do you know about how Aboriginal people lived in the old days? 0.57 N = 195b
df = 27c
Q3. How much do you know about Aboriginal Week activities? 0.51 χ2 = 27.15d
Q7. How much have you learned to make Aboriginal foods like damper? 0.74 SRMRe = 0.0434
NNFIf = 1.00
Q13. How much do you know about Aboriginal stories of the Dreaming (Dreamtime)? 0.65 Good
Q17. How much do you talk Aboriginal words? 0.67
Q19. How much does your family tell you about being Aboriginal? 0.69
Q35. How much do you go bush with your family? 0.67
Q37. How much have you eaten Aboriginal foods, like kangaroo? 0.79
Q39. How much do you know about the dances Aboriginal people did in the old days? 0.81
a. Partial regression coefficients of the item on the underlying constructbN = Analytic sample sizecdf = Degrees of freedomdχ2 = Chi squareeSRMR = Standardized Root Mean ResidualfNNFI = Non-Normed Fit Index
Kickett-Tucker et al. International Journal for Equity in Health (2015) 14:103 Page 8 of 13
Q2. How important is it for you to know about howAboriginal people lived in the old days? +
Q4. How important is it that you to do activities forAboriginal Week? +
Q8. How important is it for you to make Aboriginalfoods like damper? +
Q14. How important is it for you to know aboutAboriginal stories of the Dreaming?+
Q18. How important is it for you to talk Aboriginalwords? +
Q20. How important is it for you that your family tellsyou about being Aboriginal? +
Q36. How important is it for you to go bush with yourfamily? +
Q38. How important is it for you to eat Aboriginalfoods? +
Q40. How important is it for you to know about thedances Aboriginal people did in the old days?
Ninety three percent (93.0 %) of children responded to7 or more out of the 9 questions. The proposed usage isthat for children with 7 or more responses add up allscores and then divide by number of valid responses (i.e.9 to 36 divided by 8, or 8 to 32 divided by 8, or 7 to 28divided by 7).
Scale 4: Salience of Racial Identity The final scale con-sisted of 8 items including:
Q6. How important is it for you to play with Aboriginalkids? +
Q10. How important is it for you that you’reAboriginal? +
Q12. How important is it for you to be the same asother Aboriginal kids? +
Q16. How important is it for you to feel part of theAboriginal group at school? +
Table 5 Confirmatory factor analysis knowledge – racial identity
Knowledge – racial identity Item loadingsa λx Model characteristics
Q5. How much do you like playing with Aboriginal kids? 0.72 N = 200
df = 20
Q9. How much do you like being Aboriginal? 0.80 χ2 = 34.64
Q11. How much are you the same as other Aboriginal kids? 0.57 SRMR = 0.0598
NNFI = 0.987
Q15. How much do Aboriginal kids make you feel part of their group at school? 0.68 Acceptable
Q23. How much do you like Aboriginal people as friends? 0.71
Q28. How much are you proud of being Aboriginal? 0.91
Q30. How much do Aboriginal kids help each other? 0.66
Q33. How much do you like the Aboriginal flag? 0.82aPartial regression coefficients of the item on the underlying construct
Table 6 Confirmatory factor analysis salience – Aboriginal culture
Salience – Aboriginal culture Item loadingsa λx Model characteristics
Q2. How important is it for you to know about how Aboriginal people lived in the old days? 0.62 N = 188
df = 27
Q4. How important is it that you to do activities for Aboriginal Week? 0.64 χ2 = 46.15
Q8. How important is it for you to make Aboriginal foods like damper? 0.78 SRMR = 0.0613
NNFI = 0.985
Q14. How important is it for you to know about Aboriginal stories of the Dreaming? 0.78 Acceptable
Q18. How important is it for you to talk Aboriginal words? 0.73
Q20. How important is it for you that your family tells you about being Aboriginal? 0.70
Q36. How important is it for you to go bush with your family? 0.66
Q38. How important is it for you to eat Aboriginal foods? 0.68
Q40. How important is it for you to know about the dances Aboriginal people did in the old days? 0.82aPartial regression coefficients of the item on the underlying construct
Kickett-Tucker et al. International Journal for Equity in Health (2015) 14:103 Page 9 of 13
Q24. How important is it for you to have Aboriginalpeople as friends? +
Q29. How important is it for you to be proud of beingAboriginal? +
Q31. How important is it that Aboriginal kids helpeach other? +
Q34. How important is it for you to like the Aboriginalflag? +
Ninety two percent (92.1 %) of children responded to6 or more out of the 8 questions. The proposed usage isthat for children with 6 or more responses add up allscores and then divide by number of valid responses (i.e.8 to 32 divided by 8, or 7 to 28 divided by 7, or 6 to 24divided by 6).The characteristics of the 4 scales are described in
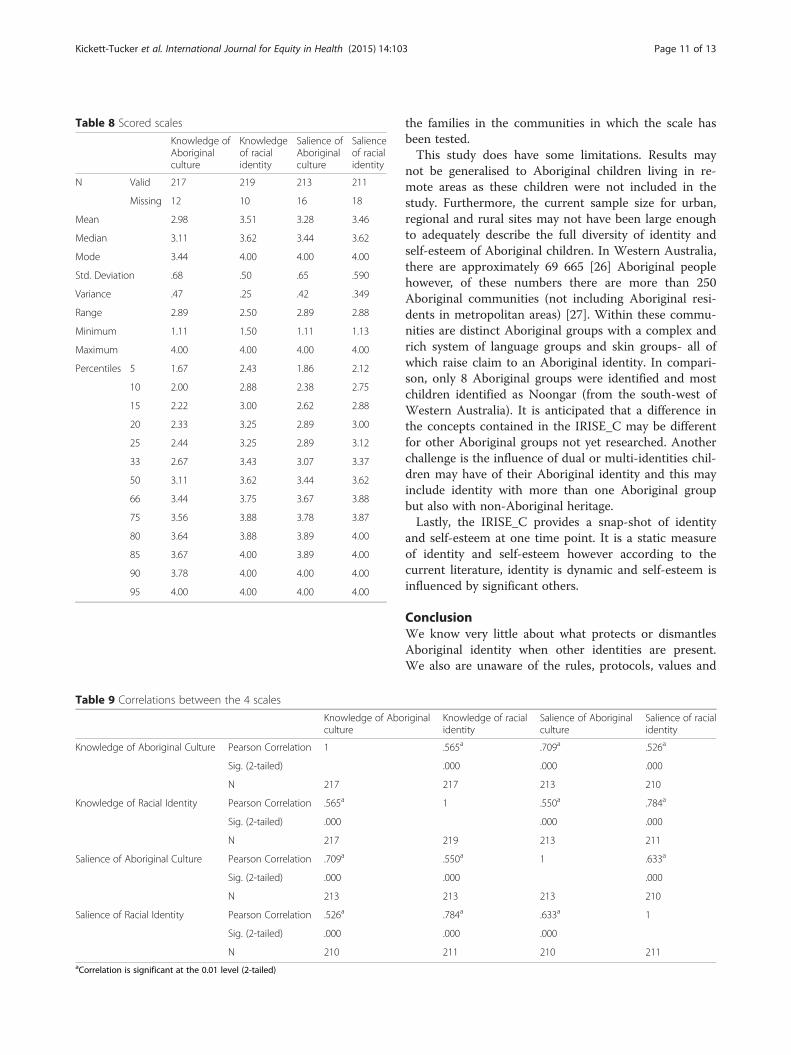
Table 8 below. Although the scales were developedbased on a hypothesis of the relationship between ra-cial self-esteem and overall wellbeing, this study hasonly assessed the internal consistency of these scales,not the relationship between these scales and externalmeasures of wellbeing. Future research however, willbe conducted to test the relationship between theIRISE scales and generic measures of wellbeing in duetime. Thus, interpretation of cut-points in the currentscales needs to made with caution. The median of the4 scales at the 25th percentile is 3.00, thus a simpleinterpretation which could be made for a child scor-ing 3 or less on any of the scales is that that childsits in the lowest quartile for that scale.Similarly, the median of the 4 sub-scales at the 75th
percentile is 3.82. Thus, any child scoring 3.82 or aboveany given scale could be interpreted as sitting in the topquartile for that scale.Table 9 below shows that the correlations between
the 4 final scales suggest an inter-relationship be-tween the 4 scales.
DiscussionThe IRISE_C explored the identity and related self-esteem for 8–12 year-old Australian Aboriginal children.It was developed by the first author, an Aboriginal re-searcher. A series of consultations, negotiations and re-views from other Aboriginal community members,Aboriginal teachers, and professionals ensured that theconcepts contained in the IRISE_C were culturallysound and acceptable. Furthermore, the recruitment ofAboriginal Community Research Assistants who residein the local research sites have also contributed to ac-knowledging and following Aboriginal ways of working.In following such a protocol, a high level of Aboriginalownership has been encouraged and in doing so, the de-velopment of the IRISE_C inventory and culturally safeand secure procedures have ensured authentic and validresults. Further, the concepts captured by the instrumenthave been deemed of value and acceptability by theAboriginal carers who provided a high response rate ofconsent for their children to participate in the study.Statistically, this study has demonstrated that the IRI-
SE_C is a valid and reliable instrument that capturesidentity and self-esteem for Australian Aboriginal chil-dren 8–12 years of age. The confirmatory factor analysishas shown that the 4 subscales: 1. knowledge of identity,2. salience of identity, 3. knowledge of culture and 4. sa-lience of culture represent “good” and “acceptable” fit-ting models. This demonstrates that each sub-scaleeffectively captures a single, consistent underlying factoror concept. Further, the structure of domains identifiedthrough the factor analytic approach matches the do-mains identified through the consultative processes asreflecting the underlying constructs of Aboriginal racialidentity. As the items for each sub-scale have been de-veloped through a multi-stage, iterative consultativeprocess with the local community, it is likely that theconcepts being assessed by each scale have meaning to
Table 7 Confirmatory factor analysis salience – racial identity
Salience - racial identity Item loadingsa λx Model characteristics
Q6. How important is it for you to play with Aboriginal kids? 0.78 N = 191
df = 20
Q10. How important is it for you that you’re Aboriginal? 0.71 χ2 = 21.10
Q12. How important is it for you to be the same as other Aboriginal kids? 0.72 SRMR = 0.0557
NNFI = 0.999
Q16. How important is it for you to feel part of the Aboriginal group at school? 0.78 Acceptable
Q24. How important is it for you to have Aboriginal people as friends? 0.86
Q29. How important is it for you to be proud of being Aboriginal? 0.78
Q31. How important is it that Aboriginal kids help each other? 0.68
Q34. How important is it for you to like the Aboriginal flag? 0.74aPartial regression coefficients of the item on the underlying construct
Kickett-Tucker et al. International Journal for Equity in Health (2015) 14:103 Page 10 of 13
the families in the communities in which the scale hasbeen tested.This study does have some limitations. Results may
not be generalised to Aboriginal children living in re-mote areas as these children were not included in thestudy. Furthermore, the current sample size for urban,regional and rural sites may not have been large enoughto adequately describe the full diversity of identity andself-esteem of Aboriginal children. In Western Australia,there are approximately 69 665 [26] Aboriginal peoplehowever, of these numbers there are more than 250Aboriginal communities (not including Aboriginal resi-dents in metropolitan areas) [27]. Within these commu-nities are distinct Aboriginal groups with a complex andrich system of language groups and skin groups- all ofwhich raise claim to an Aboriginal identity. In compari-son, only 8 Aboriginal groups were identified and mostchildren identified as Noongar (from the south-west ofWestern Australia). It is anticipated that a difference inthe concepts contained in the IRISE_C may be differentfor other Aboriginal groups not yet researched. Anotherchallenge is the influence of dual or multi-identities chil-dren may have of their Aboriginal identity and this mayinclude identity with more than one Aboriginal groupbut also with non-Aboriginal heritage.Lastly, the IRISE_C provides a snap-shot of identity
and self-esteem at one time point. It is a static measureof identity and self-esteem however according to thecurrent literature, identity is dynamic and self-esteem isinfluenced by significant others.
ConclusionWe know very little about what protects or dismantlesAboriginal identity when other identities are present.We also are unaware of the rules, protocols, values and
Table 8 Scored scales
Knowledge ofAboriginalculture
Knowledgeof racialidentity
Salience ofAboriginalculture
Salienceof racialidentity
N Valid 217 219 213 211
Missing 12 10 16 18
Mean 2.98 3.51 3.28 3.46
Median 3.11 3.62 3.44 3.62
Mode 3.44 4.00 4.00 4.00
Std. Deviation .68 .50 .65 .590
Variance .47 .25 .42 .349
Range 2.89 2.50 2.89 2.88
Minimum 1.11 1.50 1.11 1.13
Maximum 4.00 4.00 4.00 4.00
Percentiles 5 1.67 2.43 1.86 2.12
10 2.00 2.88 2.38 2.75
15 2.22 3.00 2.62 2.88
20 2.33 3.25 2.89 3.00
25 2.44 3.25 2.89 3.12
33 2.67 3.43 3.07 3.37
50 3.11 3.62 3.44 3.62
66 3.44 3.75 3.67 3.88
75 3.56 3.88 3.78 3.87
80 3.64 3.88 3.89 4.00
85 3.67 4.00 3.89 4.00
90 3.78 4.00 4.00 4.00
95 4.00 4.00 4.00 4.00
Table 9 Correlations between the 4 scales
Knowledge of Aboriginalculture
Knowledge of racialidentity
Salience of Aboriginalculture
Salience of racialidentity
Knowledge of Aboriginal Culture Pearson Correlation 1 .565a .709a .526a
Sig. (2-tailed) .000 .000 .000
N 217 217 213 210
Knowledge of Racial Identity Pearson Correlation .565a 1 .550a .784a
Sig. (2-tailed) .000 .000 .000
N 217 219 213 211
Salience of Aboriginal Culture Pearson Correlation .709a .550a 1 .633a
Sig. (2-tailed) .000 .000 .000
N 213 213 213 210
Salience of Racial Identity Pearson Correlation .526a .784a .633a 1
Sig. (2-tailed) .000 .000 .000
N 210 211 210 211aCorrelation is significant at the 0.01 level (2-tailed)
Kickett-Tucker et al. International Journal for Equity in Health (2015) 14:103 Page 11 of 13

practices children engage in to identify in the first place.What interaction do children have with their carers/kin/parents in determining identity? Who else plays a signifi-cant role and how is identity transmitted? Furthermore,since identity is dynamic, then the feelings children ex-perience daily need to be taken into account on the dayof data collection. Future research therefore, needs totake into account the environment, setting (community),cultural protocols, significant others and the dynamicnature of identity and related self-esteem. Hence, a lon-gitudinal study is warranted that explores the growth ofidentity and self-esteem over time and in particular set-tings and environments. In this way, we can truly under-stand what protects and harms the identity and relatedself-esteem of Australian Aboriginal children over time.Importantly, the methods used in this study have en-
sured Aboriginal participants and their families were notjust spectators or ‘a part’ of the research process. Abori-ginal participants, their families, Aboriginal reviewersand Aboriginal community research assistants were thehub of the research wheel and who determined how fastand which direction to proceed. More specifically, theywere integral from the inception to dissemination andtranslation of the research process. The outcome is anauthentic and culturally responsive instrument that hasscientific validation but importantly it has cultural valid-ation and acceptance from the Aboriginal community.Aboriginal cultural knowledge combined with Aboriginalownership using culturally secure methods will result inauthentic and sustainable outcomes when Aboriginal re-search is in the hands of Aboriginal people…this is thedirection that future research needs to journey.
Competing interestsThe authors declare that they have no competing interests.
Authors’ contributionsCKT conceived the study, developed the research design, coordinated thedata collection, performed the qualitative analyses, assisted in thequantitative analyses and contributed to the drafting of the manuscript. DCcarried out the quantitative analyses and contributed the drafting of themanuscript. DL assisted in the quantitative analysis and drafting of themanuscript. SZ assisted in the quantitative analysis. DJJ provided criticalediting and a review of the manuscript. FS reviewed the manuscript. Allauthors read and approved the final manuscript.
AcknowledgmentsThis project is partly funded by the National Health and Medical ResearchCouncil’s Centre for Research Excellence in Aboriginal Health and Wellbeing(Application 1000886) and the City of Swan with in kind support from PindiPindi, The Centre for Research Excellence in Aboriginal Wellbeing. Kickett-Tucker is supported with a NHMRC Fellowship (Application 546713). DavidLawrence, Daniel Christenson and Stephen Zubrick are supported by theAustralian Research Council Centre of Excellence for Children and Familiesover the Life Course (CE140100027). The Aboriginal families and theirchildren have inspired this project and without their unconditional support,this project would not have been possible. A team of wonderful CommunityResearch Assistants have ensured we honoured the wishes and considerationsof the Aboriginal community. A heartfelt thank you is extended to PriscillaElward, Kerry Hunt, Cheryl Hayden, Sharon Loo, Jay Tucker, Amanda Christou,Matthew Hughes and Nikki Shaw. I also would like to acknowledge Sue
Renshaw for her assistance and persistence in data entry. Thank you also toGabriela Lawrence, Tara Reid and Samantha Wright, Amy Hoogenboom, SvenSilburn, the Pindi Pindi staff and Murdoch University interns. I acknowledge thegenerous support and time provided by Professor David Lawrence over theyears.
Author details1Australian Catholic University & Pindi Pindi, Centre for Research Excellencein Aboriginal Wellbeing, 20 William Street, Midland, WA 6935, Australia.2Telethon Kids Institute, The University of Western Australia, 100 RobertsRoad Subiaco, Western Australia 6008, Australia. 3Michigan State University,552 W. Circle Drive, East Lansing, MI 48824, USA.
Received: 10 April 2015 Accepted: 5 October 2015
References1. Heatherton TF, Wyland CL. Assessing self-esteem. In: Lopez S, Snyder R, editors.
Assessing positive psychology. Washington, DC: APA; 2003. p. 219–33.2. Craven RG, Marsh HW. The centrality of the self-concept construct for
psychological wellbeing and unlocking human potential: Implications for childand educational psychologists. Educ Child Psych. 2008;25(2):104–18.
3. Corenblum B. Relationships between racial-ethnic identity, self-esteem and in-group attitudes among first nation children. J Youth Adolesc. 2013;43:387–404.
4. Usborne E, Taylor DM. The role of cultural identity clarity for self-conceptclarity, self-esteem and subjective wellbeing. Personal Soc Psychol Bull.2010;36(7):883–97.
5. Dockery AM. Traditional culture and the wellbeing of IndigenousAustralians: An analysis of the 2008 NATSISS. Perth, Western Australia: CurtinUniversity, Centre for Labour Market Research; 2011. CLMR DISCU.
6. Kickett-Tucker CS. Moorn (Black)? Djardak (White)? How come I don’t fit inMum? Exploring the racial identity of Australian Aboriginal children andyouth. Health Sociol Rev. 2009;18(1):119–36.
7. Piers EV, Harris DB. Age and other correlates of self-concept in children.J Educ Psychol. 1964;55(2):91.
8. Coopersmith S. Self-esteem inventories: School Form. ConsultingPsychologists Press; 1987.
9. Rosenberg M. Rosenberg self-esteem scale (RSE). Acceptance andcommitment therapy. Measures package 61. 1965.
10. Marsh HW. Self-description survey (SDQ) II: A theoretical and empirical basis forthe measurement of multiple dimensions of adolescent self-concept. A testmanual and research monograph. New South Wales, Australia: University ofWestern Sydney; 1992.
11. Houkamau CA, Sibley CG. The multi-dimensional model of māori identityand cultural engagement. N Z J Psychol. 2010;39(1):8–28.
12. Priest N, Mackean T, Davis E, Brigss L, Waters E. Aboriginal perspectives ofchild health and wellbeing in an urban setting: Developing a conceptualframework. Health Sociol Rev. 2012;21(2):180–95.
13. Priest N, Mackean T, Davis E, Waters E, Briggs L. Strengths and challenges forKoori kids: Harder for Koori kids, Koori kids doing well-Exploring Aboriginalperspectives on social determinants of Aboriginal child health and wellbeing.Health Sociol Rev. 2012;21(2):165–79.
14. Welfare AIoHa, Studies AIoF. Strategies and practices for promoting the socialand emotional wellbeing of Aboriginal and Torres Strait Islander people. In:Welfare AIoHa, Studies AIoF, editors. Canberra: Closing the Gap Clearinghouse;2013. p. 1–16.
15. Purdie N, McCrindle A. Measurement of self-concept among Indigenousand non-Indigenous Australian students. Aust J Psychol. 2004;56(1):50–62.
16. Goodnow JJ. Issues and changes in the assessment of people from minoritygroups. In: Davidson G, editor. Ethnicity and assessment: Australianperspectives. Darwin: University of Darwin Press; 1988. p. 15–26.
17. Byrd CM. The measurement of racial/ethnic identity in children: A criticalreview. J Black Psych. 2012;38(1):3–31.
18. Spencer M. Children’s cultural values and parental child rearing strategies.Dev Rev. 1983;3(4):351–70.
19. Aboud F. Children and prejudice. London: Blackwell Publishers; 1988.20. Corporation I. SPSS 2011, IBM SPSS Statistics for Windows. 200th ed.
Armonk, NY: IBM Corporation; 2011.21. Kickett-Tucker CS. Maintaining Aboriginal Cultural Protocols when
Conducting Research with Urban Australian Aboriginal Children. Int SocStud Behav Dev Newsl. 2007;23–6.
Kickett-Tucker et al. International Journal for Equity in Health (2015) 14:103 Page 12 of 13
22. Costello AB, Osborne JW. Best Practices in Exploratory Factor Analysis: FourRecommendations for getting the most from your data. PracticalAssessment, Research & Evaluation [Internet]. 2005; 10(7):1–9 pp. Availablefrom: http://pareonline.net/pdf/v10n7.pdf.
23. Joreskog KG, Sorbom D. Lisrel 7: A guide to the program andapplications. Chicago, IL: SPSS Inc. 1988.
24. Hu LT, Bentler PM. Cut-off criteria for fit indexes in covariance structureanalysis: Conventional criteria versus new alternatives. Struct Equ Model.1999;6(1):1–55.
25. Hu LT, Bentler PM. Fit indices in covariance structure modelling: Sensitivityto under parameterised model misspecification. Psychol Methods.1998;3(4):424–53.
26. Statistics ABo. Census of Population and Housing - Counts of Aboriginaland Torres Strait Islander Australians, 2011. Canberra: Australian Bureau ofStatistics; 2011.
27. Education Do. Aboriginal Perspectives Across the Curriculum: Departmentof Education; 2010. [updated 04 May 2015; cited in 2015 15 October].Available from: http://www.det.wa.edu.au/aboriginaleducation/apac/detcms/navigation/apac/.
Submit your next manuscript to BioMed Centraland take full advantage of:
• Convenient online submission
• Thorough peer review
• No space constraints or color figure charges
• Immediate publication on acceptance
• Inclusion in PubMed, CAS, Scopus and Google Scholar
• Research which is freely available for redistribution
Submit your manuscript at www.biomedcentral.com/submit
Kickett-Tucker et al. International Journal for Equity in Health (2015) 14:103 Page 13 of 13