development in us states, economic freedom, and the 'resource … · development in us states,...
TRANSCRIPT

www.fraserinstitute.org / Fraser Institute
Studies inMining PolicySeries editor: Fred McMahon
December 2009
Development in US States, Economic Freedom, and
the “Resource Curse”
by Joab Corey

Fraser Institute / www.fraserinstitute.org

www.fraserinstitute.org / Fraser Institute
Contents Executivesummary / 1
1 Introduction / 6
2 Theimportanceofeconomicfreedom / 8
3 Theimpactofresourcedependenceongrowth / 11
4 ExaminingtheresourcecurseintheUnitedStates / 15
5 Dataforeconomicfreedomandothervariables / 17
6 Empiricalmodelandresults—overcomingtheresourcecursewitheconomicfreedom / 23
7 Conclusion / 32
Appendix Descriptionofthedataanditssources / 33
References / 35
Aboutthispublication / 39

Fraser Institute / www.fraserinstitute.org

Development in US States, Economic Freedom, and the “Resource Curse” / 1
www.fraserinstitute.org / Fraser Institute
Executive summary
This paper uses the index published in Economic Freedom of North America (Karabegović and McMahon, 2008) to examine the impact of the relation-ship between resource dependence and institutional quality on economic development in US states. A vast amount of literature supports the existence of a seemingly paradoxical negative correlation between natural resources and economic development, which has come to be known as the “resource curse.” Much of the recent literature on the resource curse has been focused on the possible causes of this economic phenomenon. Sachs and Warner (2001) summarized the various explanations of the resource curse by say-ing that an abundance of natural resources will crowd out certain factors that are conducive to growth. Studies have shown that resources can indeed crowd out such factors as investment, education, and the economy’s efforts at industrialization, a situation now known as Dutch Disease, named after the experience of the Netherlands when the discovery of natural-gas fields led to a decline of the manufacturing sector.
Institutions and the resource curse Recently, there have been several institutional explanations for the resource curse that emphasize how the quality of government combined with a resource-dependent economy can affect economic development. Previous research has concluded that an abundance of natural resources, especially point resources, which are those that can only be taken from a narrow geo-graphic or economic area, tend to be highly correlated with increased levels of rent-seeking and government involvement in the economy, and it is through this channel that resources affect growth negatively. In an international study, Mehlum Moene and Torvik (2006) use an interaction term between insti-tutional quality and resource abundance to find that resources only affect countries with intrusive governments negatively, while those economies with more economically free governments tend to benefit from the presence of natural resources. This conclusion was further supported by Béland and Tiagi (2009), who used the index published in Economic Freedom of the World as their measure of institutional quality to obtain a similar result.
Institutions consistent with economic freedom as characterized by private-property rights, a fair and unbiased legal system, and low taxes have repeatedly been shown to provide a cornerstone for economic development. Economies with these sound institutions encourage high levels of productive entrepreneurship characterized by innovation, specialization, and increased levels of mutually beneficial exchange. Economies with intrusive and corrupt
2 / Development in US States, Economic Freedom, and the “Resource Curse”
Fraser Institute / www.fraserinstitute.org
governments characterized by heavy taxes, politically influenced courts, and a lack of property rights tend to encourage high levels of lobbying and rent-seeking efforts designed to use the political process to take wealth from oth-ers rather than have it created from more productive pursuits. Therefore, eco-nomic freedom has always been a crucial component for growth, and it may be even more critical in those economies with considerable natural resources.
Research on the resource curse in the United StatesMost of the studies on the resource curse have been performed at the inter-national level and only recently has there been research on the resource curse across US states. This is somewhat surprising given that the United States provides fertile ground for studying this interesting economic correlation. The homogeneity of American data, history, and culture across states can aid researchers in isolating the presence and cause of the resource curse. Papyrakis and Gerlaugh (2006) published the first study on the resource curse in the United States and concluded that resource dependence can have a nega-tive impact on economic development through multiple indirect channels. In this paper, I extend the results found by Mehlum, Moene and Torvik (2006) to the subnational level by applying an interaction term that combines insti-tutional quality, as measured by Economic Freedom of North America (EFNA index), and the traditional measure for resource dependence to a growth model similar to the one provided by Papyrakis and Gerlaugh (2006) in their original study of the resource curse across the United States. The paper con-firms the results of Mehlum, Moene, and Torvik (2006) and Béland and Tiagi (2009) by concluding that the resource curse only exists in those states with poor institutions as characterized by low levels of economic freedom. Those states with high levels of economic freedom tend to benefit from the presence of natural resources. This result is largely driven by point resources that are immobile and, therefore, unable to leave when faced with an economically intrusive state government. It is the immobility characteristic of this type of resource that makes it vulnerable to rent-seeking and politically driven eco-nomic environments that have been shown to stunt economic development.
This study examines the empirical results in greater detail by deriving the level of economic freedom at which natural resources go from having a negative to a positive effect on the economy and analyzes the history of economic growth for two states, Wyoming and West Virginia, which are similar in many ways including their possessing an abundance of the point resource, coal, but differ in that Wyoming has an economic freedom score that is above the critical level necessary for resources to encourage growth while West Virginia has an economic freedom score below this critical level. This comparison confirms the empirical results, as Wyoming has grown faster and enjoys a significantly higher level of per-capita Gross State Product (GSP) than West Virginia.

Development in US States, Economic Freedom, and the “Resource Curse” / 3
www.fraserinstitute.org / Fraser Institute
ConclusionInstitutional quality, as measured by a high score in the EFNA index, can turn the resource curse into a blessing. It extends the results of Mehlum, Moene, and Torvik (2006) to the subnational level and shows that only those states with low-quality institutions will suffer from the resource curse, while those states with high-quality institutions will actually benefit from the presence of natural resources. Economic freedom is important, especially for those economies with natural resources, and high-quality institutions can lift the resource curse.
4 / Development in US States, Economic Freedom, and the “Resource Curse”
Fraser Institute / www.fraserinstitute.org

www.fraserinstitute.org / Fraser Institute
Development in US States,
Economic Freedom, and
the “Resource Curse”
6 / Development in US States, Economic Freedom, and the “Resource Curse”
Fraser Institute / www.fraserinstitute.org
1 Introduction
Evidence throughout the world suggests that there is an inverse relation-ship between an abundance of natural resources and economic development known as the “resource curse.” Many find this surprising as it is commonly thought that a greater amount of natural resources would be consistent with higher levels of growth and a wealthier economy. Sachs and Warner (1995; 2001) popularized this seemingly paradoxical correlation and their research has been followed with extensive scholarship aimed at unraveling the puz-zle of this mysterious connection. While some of these studies have been designed to confirm or deny the existence of the resource curse, yielding mixed results, a majority of recent research has been focused on understand-ing the mechanism through which the resource curse operates. Sachs and Warner (2001) tried to summarize the various explanations for the resource curse by saying that an abundance of natural resources will crowd out certain factors, which are conducive to growth. However, because there exist vari-ous explanations for what drives economic growth, there also exists various explanations of the mechanism driving the resource curse.
One explanation is institutional quality. Considerable scholarship is focused on the connection between institutional quality and growth: those economies with institutions that are consistent with free markets, private-property rights, and a stable and fair legal system tend to experience higher levels of economic development. Therefore, when analyzing the nature of the resource curse it is appropriate to examine the relationship between resources and institutional quality. There have been many such studies, including the one most central to this analysis by Mehlum, Moene, and Torvik (2006). They were interested in the fact that the negative relationship between natural-resource abundance and economic growth did not extend equally across all countries; rather some countries with considerable natural resources expe-rienced low levels of economic growth while others experienced high levels of growth. In an effort to find why some economies responded better to hav-ing abundant natural resources than others, they looked at the connection between resources and institutional quality and found that countries with abundant resources and poor institutional quality suffered from the resource curse while those countries with high levels of resource abundance and high institutional quality experienced greater economic growth.
These results of this study by Mehlum, Moene, and Torvik (2006) are consistent with other research that emphasizes the importance of good institutions for economic growth. However, like most studies concerning the resource curse, it was conducted on an international level, examining the

Development in US States, Economic Freedom, and the “Resource Curse” / 7
www.fraserinstitute.org / Fraser Institute
differences across countries. Only recently has research on the resource curse been focused on the subnational level. This is surprising, given that data from the United States provides fertile ground for examining the effect of resources on growth as all of the states have varying levels of natural resources but are similar in many ways where differences among countries make the examina-tion of the resource curse on the international level difficult. Some of the challenges that exist with an international analysis include accounting for different cultures and military backgrounds, inaccurate and inconsistent data, and the confounding effects of exchange-rate fluctuations. The examination of data from the United States avoids many of these challenges and helps iso-late possible causes of the resource curse with greater precision. This study is designed to examine the effect of the relationship between resource intensity and institutional quality on economic growth across US states and extend the findings of Mehlum, Moene, and Torvik (2006) to the subnational level. It highlights once again the importance of institutional quality by showing that those states with abundant resources but low levels of economic freedom suffer from the resource curse while states with abundant resources and high levels of economic freedom experience higher levels of economic growth.
8 / Development in US States, Economic Freedom, and the “Resource Curse”
Fraser Institute / www.fraserinstitute.org
2 The importance of economic freedom
While there are many factors that have been shown to be conducive to eco-nomic growth, none may be more important than high-quality institutions consistent with free trade, secure private-property rights, a sound legal environment, and a stable monetary system consistent with low inflation. Institutions have been a crucial component of growth throughout the history of the world. Research has shown that the institutions set up by settlers in the early European colonies were influential in the future growth and prosperity of the country in which the colony was established. Acemoglu, Johnson, and Robinson (2001) provided an interesting study where they found that coun-tries such as New Zealand, Canada, and the United States, whose settlement conditions provided a habitable colony for the Europeans, exhibited higher rates of economic development. This is because the colonizers stayed in these areas and set up long-lasting, high-quality institutions designed to maximize future growth and development. In other settlements, such as the Congo and other African countries, a harsh environment and high mortality rates among settlers (usually due to the presence of diseases like malaria) caused the colonizers to set up institutions that were consistent with expropriating wealth, usually in a brutal and coercive way. These institutions, which were designed only for short-term gain rather than long-term economic success, resulted in the slower future growth of these nations.
Due to the importance of institutional quality in analyzing growth, there have been attempts to measure institutional quality both worldwide and at the subnational level. The index published in the annual reports, Economic Freedom of the World, (EFW index) is a measure of institutional quality that is made up of a composite of five areas of government: [1] Size of Government: Expenditures, Taxes, and Enterprises; [2] Legal Structure and Security of Property Rights; [3] Access to Sound Money; [4] Freedom to Trade Internationaly; and [5] Regulation of Credit, Labor, and Business (Gwartney and Lawson, 2002, 2009). The EFW index has been used on an international level to consistently show that countries with more economi-cally free institutions experience higher rates of economic growth than those countries with less economic freedom.
In one study, the EFW index was used in an examination of communist-era countries to show that engaging in more economically free policies would likely cause these countries to experience remarkable levels of economic growth and a much higher standard of living (Easton and Walker, 1997). Powell

Development in US States, Economic Freedom, and the “Resource Curse” / 9
www.fraserinstitute.org / Fraser Institute
(2003) concluded that Ireland experienced its highest levels of growth when the country adopted policies that increased its economic-freedom scores, making economic freedom the critical component in the recipe for its recent impressive economic development. Overall, a generally positive relationship between economic freedom and development has been established across several different specifications, including a neoclassical growth model and a model with geographic variables (Cole 2003, 2005; Gwartney and Lawson, 2002). This research established the correlation between economic freedom and growth but it was Dawson (2002) who examined the causal relationship and found that the level of economic freedom Granger-causes5 differences in economic growth in different countries.
Economic freedom and development at the subnational levelThe connection between economic freedom and development has also been well established at the subnational level using the EFNA index pub-lished in the reports, Economic Freedom of North America (Karabegović and McMahon, 2008). This measurement of economic freedom is a little different from the EFW index as there is little to no variance in many of the categories used in the world index. For example, factors such as freedom to own foreign currency, overall monetary policy, private ownership of banks, and the right to international exchange are the same across US states. However, there are differences in institutional quality across states for factors such as the size and role of the government in the economy, takings and discriminatory taxation, and labor-market freedom.
There have been several studies that show the importance of institu-tional quality across states as measured by the EFNA index. Karabegović et al. (2003, 2008) use the EFNA index to find a positive correlation between economic freedom and economic development, which supports the results found on the international level. As it turns out, both the levels of economic freedom and the growth of freedom are positively and significantly related to a higher standard of living as measured by per-capita GDP. Kreft and Sobel (2005) show empirically that the connection between economic freedom and development is the result of increased private-sector entrepreneurship, which is more likely to occur in states with policies supporting a free market. Those states that have less government involvement in the economy, lower taxes, and freer labor markets foster an environment that provide an incen-tive for increased innovation. This innovative activity makes everyone better
5 “A second time series is said to ‘Granger-cause’ another if its past values improve the pre-diction one would get just from the past values of the first time series. Granger causality is related to cointegration. Granger and Engle demonstrated that when two variables are cointegrated, then at least one of them must Granger-cause the other” (Henderson, 1999–2009: s.v. Clive W. J. Granger, <http://www.econlib.org/library/Enc/bios/Granger.html>.

10 / Development in US States, Economic Freedom, and the “Resource Curse”
Fraser Institute / www.fraserinstitute.org
off as it leads to anything from more efficient transportation to better tasting food and more comfortable chairs. A good entrepreneur knows that provid-ing better goods and doing so more cheaply is the key to persuading people to buy these goods. It is this manner of productive entrepreneurship that drives growth. Those responsible for this innovation will be more encouraged to undertake this wealth-producing activity in jurisdictions with higher levels of economic freedom as they will face fewer bureaucratic barriers to engaging in creative activity, and they will also be encouraged by the fact that they can keep more of their profits.
In economies without these free-market policies, the rules of success are different. These economies encourage people to use the government or the legal system to take the wealth of others. Therefore, people devote more energy to activities that transfer wealth, and less activity to innovation that creates wealth and moves an economy forward (Baumol, 1990). In other words, economies with less economic freedom are more geared towards encouraging people take someone else’s piece of the economic pie rather than making the pie bigger.
There is empirical evidence to support the relation between economic freedom and productive entrepreneurship across the United States. Sobel (2008b) showed that institutional quality, as measured by the EFNA index, was positively related to several different measures of productive entrepre-neurship. The birth rate for large firm establishment, the birth rate for total firm establishment, venture-capital investment per capita, patents per capita, and birth rate of sole proprietorships are all positively related with high levels of economic freedom while measures of “rent-seeking” 6 such as lobbying organizations per capita are negatively related to economic freedom.
There is clear evidence that institutional quality, as measured by eco-nomic freedom, helps to foster an environment conducive to innovative wealth-producing activity and that this activity is the backbone of economic development. This may be even more important in those economies with a great deal of natural resources because, as the next section illustrates, these economies tend to suffer from lower levels of development.
6 “ ‘Rent-seeking’, that is, efforts and resources spent on securing wealth through wealth redistribution (Sobel, 2008a), can take two different forms: legal and illegal. Legal rent-seeking refers to activities such as lobbying and may, for example, result in import restrictions in the tradable resource sector (Gylfason, 2001a). Illegal rent-seeking refers to activities such as bribes, which lead to corruption, usually defined as ‘the misuse of public authority to private advantage’ (Gylfason, 2001a: 561)” Karabegović, 2009: 9.
Development in US States, Economic Freedom, and the “Resource Curse” / 11
www.fraserinstitute.org / Fraser Institute
3 The impact of resource dependence on growth
It may seem counterintuitive that an abundance of natural resources could actually cause countries to grow at a slower rate; however, the link between an abundance of natural resources and low levels of economic develop-ment —the “resource curse”—has been studied extensively and supported at both the international and subnational level. Sachs and Warner (1995, 2001) provided the foundational research that demonstrated that high levels of resource-based exports do lead to lower levels of growth. This negative relationship holds true even after controlling for income inequality, initial income levels, investment, bureaucracy, and volatility in terms of trade (Sachs and Warner, 1995). They later found that, even when controlling for the potentially confounding effects of geography and climates, this relationship still holds. Resource abundance has even been labeled one of the ten most empirically robust variables when analyzing international growth (Sachs and Warner, 2001). Currently, most of the interest in the resource curse is aimed at explaining this seemingly paradoxical phenomenon.
Explaining the resource curseOne explanation of the resource curse is that, when abundant natural resources are found, resource-investment projects sprout up and, like a mag-net, attract all of the country’s other scarce resources, which can prevent further development within the economy (Stevens, 2005). However, this explanation is limited because it only applies to small countries with large resource-investment projects. Also, most of the support for this explanation is theoretical, with little empirical evidence.
Another explanation of the resource curse is “Dutch Disease,” named after the experience of the Netherlands where the discovery of natural-gas fields led to a decline in the manufacturing sector (Stevens, 2005). Dutch Disease occurs when there is a sudden and extreme increase in a nation’s wealth that leads to an appreciation of the real exchange rate, causing the country to import more and export less because its goods are more expensive relative to those produced in the rest of the world. This lower level of exports means less production in the home country, which could hurt the country’s industrialization efforts. The examination of Dutch Disease as a cause of the resource curse has met with mixed results, and only some studies have found it to be the primary cause (Stevens, 2005).

12 / Development in US States, Economic Freedom, and the “Resource Curse”
Fraser Institute / www.fraserinstitute.org
Institutional explanations for the resource curse have also been sug-gested: an abundance of natural resources may cause the government to adopt policies that deter growth. One such theory is that the presence of natural resources will generate higher expectations from the populace of that coun-try and this will put more pressure on the government, eventually leading to hasty policies with a negative impact upon the economy (Stevens, 2005). Natural-resource abundance may also entice the government to channel investment away from other profitable sectors, restrict trade, establish sub-sidies and transfers, and engage in poor industrial policy (Stevens, 2005).
“Point resources,” corruption and rent-seekingResource abundance has also been shown to be related to corruption and rent-seeking and it is through these channels that resources negatively affect growth. This is especially true in those countries that are less developed and, therefore, have institutions that may be weaker and less adaptable. Leite and Weidmann (1999) provide both theoretical and empirical support for the idea that natural resources lead to higher levels of corruption and rent-seeking and that it is though these channels that it hurts growth. Isham, Woolcock, Pritchett, and Busby (2005) define two types of resources: “point resources,” such as fuels and minerals, that can only be taken from a narrow geographic or economic area; and “diffuse resources” like food and agricultural prod-ucts. They find that the increase in rent-seeking associated with resource abundance is much more prevalent when the nation is exporting point resources rather than diffuse resources, a result that echoes the research on the resource curse by Auty (2007), who also highlighted the differing impacts that point resources and diffuse resources have on economic development. Bulte, Damania, and Deacon (2005), conclude that point resources are more susceptible to rent-seeking and corruption because, unlike diffuse resources, they are immobile and cannot leave a jurisdiction in response to the negative impact of these factors. Therefore, the negative effect of government policies on growth as the result of the presence of natural resources is more likely to be affected by point resources than by diffuse resources, which can more eas-ily move to other jurisdictions in response to adverse changes in government actions. The mobility of diffuse resources constrains government in a way that enforces better public policy. In another study, Easterly and Levine (2003) provide an international analysis concluding that, in general, crop produc-tion and geography only adversely affect development through their impact on institutional quality and have little to no direct adverse impact on growth.
Institutional quality and the resource curseThe research mentioned so far has been largely aimed at showing a causal rela-tionship where resource abundance leads to low institutional quality, which then leads to lower economic growth rates. However, in an international

Development in US States, Economic Freedom, and the “Resource Curse” / 13
www.fraserinstitute.org / Fraser Institute
analysis, Mehlum, Moene, and Torvik (2006) provide both theoretical and empirical evidence that the resource curse does not affect all countries uni-versally but that this curse only exists in those countries with poor institu-tions.7 They explain that, in some cases, resource abundance can be a bless-ing rather than a curse. For example, Botswana enjoys a significant resource wealth in the form of diamonds, a point resource, and yet still has high growth rates. Asking why Botswana has been able to succeed, despite their resource wealth, the researchers discovered that Botswana has the best score among African countries on the Grongingen Corruption Perception Index used to measure institutional quality. Similarly, Norway’s growth has been incred-ible, causing it to go from one of the poorest countries in the early 1900s to currently one of the richest, despite having a considerable amount of both point resources (oil and natural gas) and diffuse resources (timber and fish). Again, it appears that the secret ingredient is institutional quality as Norway is considered to be one of the least corrupt countries in the world (Mehlum, Moene, and Torvik, 2006). On the other hand, the experiences of Nigeria, Venezuela, and Mexico have been very different. All of these countries suf-fered from low economic growth rates after oil was discovered. A look at the institutional quality of these countries reveals that all have expropriative governments (Lane and Tornell, 1996; Tornell and Lane, 1999).
In their paper, Mehlum, Moene, and Torvik (2006) classify low-quality institutions as “grabber-friendly” and high-quality institutions as “producer-friendly.” These are measured by an index of institutional quality that is the non-weighted average of five different indexes: an index of corruption in government; an index of rule of law; an index of bureaucratic quality; an index of the risk of expropriation; and an index of government repudiation of contracts. They use this composite index and the typical measure for resource abundance, which is the share of primary exports in GDP, to create an inter-action term to find how the relationship between resources and institutions affects economic development. They found the interaction term to be posi-tive and significant, indicating that the resource curse only exists in those countries with low-quality institutions. Those countries with resources and good institutions experience higher levels of economic growth.
A second study was conducted to test the results found at the inter-national level by Mehlum, Moene, and Tovik, (2006). In this study (Béland and Tiagi, 2009), the researchers used the Economic Freedom of the World (EFW) index as the measure of institutional quality and created a similar interaction term between institutions and resources. They tested this inter-action term across multiple specifications and their results confirmed those previously found by Mehlum, Moene, and Torvik (2006) in that the resource
7 For a description of the theoretical model and their empirical results, please see the paper “Institutions and the Resource Curse” by Mehlum, Moene, and Torvik (2006).

14 / Development in US States, Economic Freedom, and the “Resource Curse”
Fraser Institute / www.fraserinstitute.org
curse only exists on those countries with poor institutions as measured by a low score in the EFW index. Those countries with higher scores in the EFW index actually benefit from having abundant resources. Béland and Tiagi concluded that it is important for all countries, but particularly those with an abundance of natural resources, to adopt policies that are consistent with economic freedom so that the resource curse can be turned into a resource blessing. They also took the analysis a step forward by concluding that point resources, such as metals and ores, are more susceptible to appropriation and rent-seeking than other types of natural resources.
Similarly, in a recent study by Collier and Hoeffler (2009), the researchers found that the rent-seeking behavior in resource-rich economies undermined the democratic process and was responsible for damaging eco-nomic growth. The authors concluded that, when resources were absent, then democracies tended to out-perform autocracies but that, in the presence of resource abundance, autocracies out-performed democracies because of the destructive rent-seeking behavior associated with these resources. Further examination by the researchers suggested that intensified checks and bal-ances to control government power was the key means by which democracies could overcome the resource curse.
These three studies are important in that they show how institutional quality can greatly influence the impact that natural resources have on devel-opment. The failure to look for such a link was perhaps the greatest criticism of the resource-curse literature in a review of the studies that examine the connection between resource abundance and growth (Karabegović, 2009). In this review, the authors note that, increasingly, research has shown that institutions are the decisive factor in whether natural-resource abundance will help or hinder economic development. This is a crucial result as it shows that each economy has the power to overcome the resource curse through the adoption of free-market economic policies and that no economy is “victim-ized” by the presence of natural resources.

Development in US States, Economic Freedom, and the “Resource Curse” / 15
www.fraserinstitute.org / Fraser Institute
4 Examining the resource curse in the United States
Most of the research conducted on the resource curse has been performed on the international level but recently the focus has turned to the subnational level, particularly within the United States. The United States provides an ideal setting for the examination of the resource curse as US data has many advantages over international data. The US states are similar to countries in that they have differing levels of natural resources and institutional quality and they exhibit different growth patterns. However, what makes the United States such an important and interesting case study is that, unlike countries, US states are similar in many ways that help alleviate data problems where differences among countries make the examination of the resource curse on the international level problematic, and reduce the effects of the confounding variables that are typically present when performing a cross-country exami-nation of the resource curse. For example, all states use the same currency so it is unlikely that the exportation of resources from any one state is going to lead to volatility in the exchange rate and a reduction in terms of trade that has been previously mentioned as a possible cause of the resource curse. This is important as Sachs and Warner (2001) dismissed the institutional explanations of the resource curse as they found evidence that resource-rich countries tend also to be high-priced economies and, as such, unable to take advantage of export-oriented growth. However, in conducting a subnational analysis, the likelihood of this being the correct explanation for the resource curse is severely reduced as each state uses the same currency (the US dollar) and this currency is unlikely to be affected by the actions of any one state.
Another advantage of US data is the greater homogeneity of culture and military history among the states. The military histories of US states are more closely related to each other than that of different countries, so it is unlikely that differences in growth across states are the result of differences in military background, which would be difficult to model empirically. This same claim cannot be made for countries. A similar argument can be made about the cultural differences found within the states. For example, while it is the true that there are cultural differences between New York and California, these pale in comparison to those between Norway and Nigeria or Botswana and Mexico. Again, localizing the study of the resource curse within a sin-gle country helps nullify any cultural explanations for growth and prosper-ity and further isolate the effect of the relationship between resources and institutions on prosperity. Finally, US data tends to be more consistent since

16 / Development in US States, Economic Freedom, and the “Resource Curse”
Fraser Institute / www.fraserinstitute.org
variables tend to be measured in the same way over the same time period for all states, while international data more often has inaccurate or missing records and is subject to various other measurement problems.
Given these empirical advantages, it is surprising that so little research has been conducted on the resource curse across the United States. Recently, Papyrakis and Gerlaugh (2006) provided the first study of the resource curse on the United States by analyzing the indirect transmission channels by which resource abundance negatively affects growth. The authors find that resource abundance increases corruption and decreases investment, schooling, open-ness, and expenditure on research and development. Recent research has also provided both theoretical and empirical support for the notion that resource-rich states have a higher level of rent-seeking through the use of severance taxes (i.e., taxes imposed by a state on a company extracting ores, oil, or gas for export to other states) for both point and diffuse resources (Dunn, 2007).
This study will add to the limited research conducted on the resource curse across US states by applying the empirical framework used by Mehlum, Moene, and Torvik (2006) to analyze how the relationship between resource abundance and institutional quality, as measured by the EFNA index, affects development on the subnational level.

Development in US States, Economic Freedom, and the “Resource Curse” / 17
www.fraserinstitute.org / Fraser Institute
5 Data for economic freedom and other variables
In order to analyze the connection among resources, institutions, and devel-opment across US states, this study will use an interaction term similar to that created by Mehlum, Moene, and Torvik (2006). The EFNA index published in Economic Freedom of North America (Karabegović et al., 2008) will serve as the measure of institutional quality (EFNA).8 The EFNA index has been repeatedly used as a way to measure institutional differences and has been shown to be related to development across states in multiple studies. This index comprises three areas, all of which are calculated for the 50 US states and ten Canadian provinces (Karabegović et al., 2003; Karabegović et al., 2008). However, this study will focus on the United States and so the use of the EFNA index will not include the Canadian provinces.
EFNA indexArea 1: Size of governmentThe first area of measurement of the EFNA index is size of government. Calculation of Area 1 includes general consumption expenditures by govern-ment, subsidies and transfers, and social-security payments as a percentage of Gross State Product (GSP).9 This represents the government’s involvement in a state’s economy. A minimal level of government spending is necessary for proper economic growth: a good government should protect citizen’s rights from criminals and foreign aggressors, while providing a transpar-ent legal institution to enforce contracts. These are goods and services that have unique characteristics that may make them difficult for the market to provide. For example, one person’s consumption of national defense does not interfere with another person’s consumption of national defense and it is nearly impossible to exclude anyone from its consumption once it is provided. This makes national defense a public good that, if left up to the market, would likely be underprovided due to the tendency for people to try and free-ride on others. That is, many people would want to consume
8 There is a list of the variables used in appendix A. Throughout the text, the names of the variables appear like this: EFNA. The most recent edition of Economic Freedom of North America and the most recent data set, which was used in this study, is available at <http://www.freetheworld.com/efna.html>.
9 Gross state product (GSP) is called gross domestic product (GDP) in editions of Economic Freedom of North America.
18 / Development in US States, Economic Freedom, and the “Resource Curse”
Fraser Institute / www.fraserinstitute.org
it without paying for it in hopes that others would be willing to supply an efficient amount. The fact that people cannot be excluded from these pub-lic goods gives everyone the same incentive to avoid paying for the good themselves and so it may be better for the government to enforce payment through taxes and provide these goods. There may also be other situations where it is appropriate for the government to spend money, such as subsidiz-ing those activities that benefit non-consenting third parties (like education, recycling, and flu-vaccinations, for example) in an effort to make sure that there are more of these types of activities.
However, the arguments for government spending tend to be overused, so that the government ends up providing goods that could easily, and often more efficiently, be provided by the market and using subsidies to trans-fer wealth rather than encourage transactions that benefit non-consenting third parties. The more involved the government gets, the more it encour-ages people to use the political process to transfer wealth rather than cre-ate wealth through innovative improvements. Therefore, while a minimal level of government spending may be necessary, heavy state involvement in the economy could retard growth by crowding out private-sector entrepre-neurship. Subsidies and transfers are also included in this area as they can affect an economy negatively through the removal or dissolution of property in an effort to redistribute wealth, again reducing the incentive to engage in wealth-producing activities. This type of activity is representative of the actions taken by what Mehlum, Moene, and Torvik (2006) labeled “grabber-friendly” institutions.
Area 2: Takings and discriminatory taxationArea 2 includes takings and discriminatory taxation and consists of total government revenue as a percentage of GSP, the top marginal income-tax rate, the income level at which that top marginal tax rate applies, indirect taxes as a percentage of GSP, and sales taxes collected as a percentage of GSP. High taxes can hobble an economy because they discourage people from the production, innovation, and trade necessary for growth since, by high taxation, the government extracts a greater amount of the reward for these activities. A higher tax burden reduces economic efficiency by restricting private choice and is, thus, represented by a lower score in this component of the EFNA index.
Area 3: Labor market freedomThe third area of economic freedom measured in the EFNA index is labor market freedom. This includes government employment as a percentage of total state employment, minimum wage legislation, and union density. A high level of government employment as a percentage of total state employment affects economic freedom adversely because this indicates the public sector
Development in US States, Economic Freedom, and the “Resource Curse” / 19
www.fraserinstitute.org / Fraser Institute
is engaged in producing goods and services beyond the minimum level nec-essary for economic efficiency. The minimum wage component is measured as the annual income of minimum wage workers divided by per-capita GSP. A higher minimum wage as a percentage of productivity will limit the ability of employers and employees to formulate contracts and reach agreements concerning employment. Unions can also lower freedom because they often make it difficult for workers and employers to negotiate labor contracts and, in an effort to protect their own employment and bargaining power, try to limit the competition necessary for prosperity. Therefore, greater union den-sity will lead to a lower score in this component of the index (Karabegović et al., 2003; Karabegović et al., 2008).
Constructing the indexThe three areas on the EFNA index are measured on a scale of 0 to 10 with 10 being the most free and 0 being the least free. These three areas are equally weighted and then averaged together to get the total freedom score for the state, which is also measured on a scale of 0 to 10 with 10 being the most free (Karabegovic et al., 2003; Karabegovic et al, 2008). Those states with higher EFNA scores have high-quality, producer-friendly institutions con-ducive to growth in resource-rich areas discussed by Mehlum, Moene, and Torvik (2006; p. 13 above), while those states with lower economic freedom have low-quality, grabber-friendly institutions prone to suffering from the resource curse.
The EFNA index is calculated both with the inclusion of federal gov-ernment spending for each US state and without it. This study will use the measure that excludes federal government spending for US states since it is primarily concerned with the effect of the relationship between a state’s gov-ernment institutions and resources on development. The research conducted by Mehlum, Moene, and Torvik (2006) at the international level consists of a combination of multiple indexes to form a measure of institutional quality. In this study, the EFNA index by itself provides an adequate measure of insti-tutional quality across US states because the state governments still operate under an overarching federal government that applies the same rule of law and macroeconomic policies across every state. Since there is little varia-tion in these other measures, it is appropriate to use the EFNA index as the only measure of institutional quality since it captures most of the remaining important variation among US state institutions.
Other variablesResource DependenceIn previous studies, a distinction has been made between resource abundance (having a considerable level of natural resources) and resource dependence (when the primary resource sector makes up a large part of Gross Domestic
20 / Development in US States, Economic Freedom, and the “Resource Curse”
Fraser Institute / www.fraserinstitute.org
Product). For example, as a country the United States is resource abundant as it has considerable natural resources but is not resource dependent because resources do not make up a large part of the nation’s GDP. There are also some countries, such as Tanzania and Burundi, that are resource dependent but are not considered resource abundant (Ding and Field, 2005). Ding and Feld (2005) defined “resource abundance” as natural resources per population and
“resource dependence” as natural resources as a share of total capital. They found that resource abundance had a positive impact on growth and that it was resource dependence that affected economic development adversely.
The measure of natural resources used in this study, Resource Dependence, is the total share of agriculture, forestry, fishing, and mining as a percentage of the economy, a measure of the dependence of an economy on natural resources rather than the actual abundance of natural resources within the state. This definition for resources was chosen because it is the same type of measure for natural resources that Mehlum, Moene, and Torvik (2006) used in their international analysis and the same measure that Papyrakis and Gerlaugh (2006) used in the first paper to examine the resource curse across the United States. It is also important to note that all states have experienced a reduction in their reliance on natural resources as a share of GSP when measured in this way over the time period examined in this study.
GrowthThe growth model used in this study will be similar to that used by Papyrakis and Gerlaugh (2006) in their subnational study of the resource curse across the United States, which analyzes the effect of resource intensity as measured in 1986 on the effect of growth from 1986 to 2000. It is common to include a lag when measuring the effect of resource intensity on growth because resources in one year are not expected to affect growth in the same year but rather are likely to affect growth in subsequent years. In this study, the same measure of resource intensity is used and it is multiplied by the subnational composite score (calculated without the inclusion of federal spending) for 1986 from the EFNA index to develop an interaction term similar to the one used by Mehlum, Moene, and Torvik (2006). The dependent variable, Growth, is the average annual growth rate in real GSP per capita between the years 1986 and 2005 measured as (ln(Y2005/Y1986)/19)×100%.
Additional variablesThe control variables used in this paper are similar to those used by Papyrakis and Gerlaugh (2006) but also includes some additional variables that have been shown in previous literature to be related to growth. To control for conditional convergence (the idea that poor countries tend to grow faster than richer countries), Initial Income, measured as the log of GSP per capita in 1986, is incorporated in this study. A measure for Investment that consists

Development in US States, Economic Freedom, and the “Resource Curse” / 21
www.fraserinstitute.org / Fraser Institute
of the proportion of industrial machinery production in GSP for the year 1986 is also included as empirical evidence demonstrates that machinery production is more strongly associated with productivity growth than other forms of investments (De Long and Summers, 1991). An educational vari-able used as a proxy for human capital, Schooling, consists of the contri-butions to educational services as a share of GSP in 1986 (Papyrakis and Gerlaugh, 2006).
The next variable borrowed from the Papyrakis and Gerlaugh (2006) model is Openness, which is measured differently when comparing the open-ness of two US states than when comparing the openness of two nations. Openness for US states is defined as the ratio of net international immigration from 1990 to 1999 relative to the population of the each state in 1990. It is expected that being an open economy will contribute positively to growth as incoming people will bring their various abilities to innovate and create. A measure for research and development (R&D) is also included to represent the innovative ability within states. This variable is measured as the share of research and development in GSP for 1987 (Papyrakis and Gerlaugh, 2006).
The remaining variables in this discussion were not in the original study by Papyrakis and Gerlaugh (2006) but empirical evidence suggests that the growth model should include these additional measures. Gallup, Mellinger, and Sachs (1998) looked at the connection between the level of development and the geography of economies across the world and have concluded that some geographic variables do affect growth. For example, the researchers found that nearly all tropical climates tend to be poor and the more temperate climates tend to be more wealthy. They have also found that coastal economies tend to be wealthier than those of landlocked areas and that there exists a weakly positive relationship between income and popula-tion density. When analyzed empirically, their results indicate that countries with a coastline and countries with more temperate climates do tend to per-form better economically than landlocked and tropical countries. They have also found that population density is positively related to growth, but only in coastal areas.
There are several possible explanations for why these geographic vari-ables are important in the analysis of development. Landlocked countries tend to develop more slowly than other countries because they lack access to waterways, which serve to reduce transaction costs when developing the economy’s infrastructure and make migration easier. Therefore, it is expected that having a coast will contribute positively growth and so this study includes a dummy variable (Coast), which is equal to 1 if the state has any coastline at all and equal to zero if the state is landlocked. Population Density (Pop Density) is measured as population divided by square mile for each state in 1986. This variable is expected to have a positive impact on development, as econo-mies with high population density tend to have increasing returns to scale

22 / Development in US States, Economic Freedom, and the “Resource Curse”
Fraser Institute / www.fraserinstitute.org
in infrastructure networks and increased specialization and division of labor. Tropical climates may have led to low growth rates because they have a higher prevalence of certain diseases and may result in lower agricultural output. This study uses the average number of annual heating-degree days from 1971 to 2000 as a measure for Climate. The more heating-degree days, the more temperate the climate, and so this variable is expected to be positively cor-related with growth. The next section will look at the empirical model and the results it yields.

Development in US States, Economic Freedom, and the “Resource Curse” / 23
www.fraserinstitute.org / Fraser Institute
6 Empirical model and results—overcoming the resource curse with economic freedom
In this study an Interaction term is created by multiplying the subnational composite score from the index in Economic Freedom of North America (Karabegović and McMahon, 2008)10 and the measure for Resource Dependence. Using this interaction term, the following model is analyzed:
Growth=a0+b1 EFNA +b2 Resource Dependence +b3Interaction+b4Z (1)
where Z is the list of control variables mentioned in the previous section. Table 1 provides the results where regression 1 uses the equation above.
First regressionThe results show that resource dependence is negatively correlated with growth, which is evidence of the resource curse and consistent with the pre-vious literature concerning the effects of resources on economic development. Economic freedom (EFNA) has a positive and significant effect on growth, which is consistent with the previous literature on the connection between freedom and growth. The Interaction term, which is the variable of interest, is both positive and significant indicating that the resource curse only exists in those states with low levels of economic freedom as measured by the EFNA index. Those states with higher levels of economic freedom actually benefit from the presence of natural resources. These results are consistent with those found on the international level by Mehlum, Moene, and Torvik (2006) and Béland and Tiagi (2009). The results from this study also coincide with those found by Collier and Hoeffler (2009), who found that resource-intense economies with democratic governments need checks and balances to avoid the resource-associated rent-seeking that negatively affects the economy. This study finds that, in the United States, where each state is democratically gov-erned, natural resources can have a positive impact on states with high levels of economic freedom, while states with low levels of economic freedom con-sistent with rent-seeking behavior will suffer from the resource curse.
10 The most recent edition of Economic Freedom of North America and the most recent data set, which was used in this study, is available at<http://www.freetheworld.com/efna.html>.

24 / Development in US States, Economic Freedom, and the “Resource Curse”
Fraser Institute / www.fraserinstitute.org
Table 1: Resource dependence
DependentVariable TheaverageannualgrowthrateinGSPpercapita,1986–2005
(1) (2)
Constant 16.8528*** 18.9003***
(4.95) (5.06)
EFNA 0.1213* 0.1137
(1.74) (1.27)
ResourceDependence −0.1150** −0.1573**
(2.14) (2.26)
Interaction 0.0185** 0.0229**
(2.49) (2.44)
InitialIncome −1.4384*** −1.6228***
(4.00) (4.09)
Investment −0.0007 −0.0009
(0.02) (0.03)
Schooling 0.0429 −0.0035
(0.39) (−0.03)
Openness 7.6747** 8.4316**
(2.50) (2.38)
R&D −0.0316 −0.0373
(1.02) (1.05)
Coast −0.0460 −0.0216
(0.45) (0.20)
PopDensity 0.0004** 0.0004**
(2.19) (2.17)
Climate 0.0001*** 0.0001***
(4.10) (4.17)
Observations 49 49
R2 0.6127 0.5740
F-statistic 4.98*** 4.14***
Prob>F 0.0001 0.0005
Note: The absolute t-ratios for the independent variables are shown in parenthesis. The symbols *, **, and *** denote a 10%, 5%, and 1% level of significance, respectively. Joint tests are also significant for the interaction term. The Huber / White Sandwich estimator of variance was used in every regression to report robust standard errors.

Development in US States, Economic Freedom, and the “Resource Curse” / 25
www.fraserinstitute.org / Fraser Institute
To find out what level of economic freedom is necessary for resources to have a positive effect of further enhancing growth, it is appropriate to use equation 1 to take the derivate of growth with respect to resource intensity. Given that the interaction term is equal to the economic freedom score mul-tiplied by resource dependence, equation 1 turns into the following:
Growth=a0+b1 EFNA +b2 Resource Dependence +b3Resource Dependence × EFNA +b4Z
If we take the derivative of growth with respect to resource intensity we get:
∂Growth=B2+B3EFNA
∂Resource Intensity
where B2 is the coefficient for the resource abundance variable and B3 is the coefficient for the Interaction term. To find out what level of economic free-dom is necessary for the effect of resource abundance on growth to turn positive, this equation is set equal to zero:
B2+B3EFNA=0
To solve for economic freedom, subtract B2 to the other side and divide both sides by B3 to get:
EFNA=−B2/B3
Using the results from the first column in table 1, one can see that the effect of resources on growth turns positive when economic freedom rises above 6.22(EFNA=−(0.1150/0.0185)=6.22). The coefficient of the interaction term indi-cates the relationship between a change in economic freedom and the posi-tive effect of resources on growth. The results indicate that every one-point increase in economic freedom will increase the positive effect of resources on growth by 0.0185 percentage points.
Analysis of resource-dependent statesIn order to analyze this result effectively, the eight most resource-dependent states, according to the measure used in this study (total share of agriculture, forestry, fishing, and mining as a percentage of the economy), are isolated from the rest of the data. Three of these states (Alaska, Montana, and West Virginia) have a level of economic freedom below 6.22, which is the critical level necessary to overcome the resource curse. The remaining five resource-dependent states (Louisiana, New Mexico, North Dakota, South Dakota, and

26 / Development in US States, Economic Freedom, and the “Resource Curse”
Fraser Institute / www.fraserinstitute.org
Wyoming) have an EFNA score above the 6.22 threshold. These five states average a growth rate over the time period examined that is 0.84 percentage points higher than the three states with a lower level of economic freedom, a difference made more astonishing by the fact that the difference between the highest growth rate and the lowest growth rate across all 50 states from 1986 to 2005 was a mere 2.66 percentage points. This difference in growth compounded annually over a large time span will lead to a vast difference between the standard of living in the states with a higher level of economic freedom and those with a lower level.
Wyoming and West VirginiaAs a case study that emphasizes these empirical results, consider the two resource-dependent states of Wyoming and West Virginia (table 2). These two states are similar in many ways but their biggest similarity, and the critical reason for this comparison, is that these states are known for being the main producers of the same point resource, coal: Wyoming is the largest producer of coal in the United States and West Virginia is second. While both states are among the most resource dependent, Wyoming is far more so in that the primary sector accounts for nearly 34% of all GSP while, in West Virginia, it is just over 14%. According to the traditional resource-curse literature, this would suggest that Wyoming should suffer from lower growth rates.
However, Wyoming had a higher level of economic freedom over the time period examined: its subnational composite EFNA score is 6.5, which is higher than the 6.22 threshold necessary for growth found by the empiri-cal model. It is also much higher than West Virginia’s EFNA score, which is 5.3, a score that is both lower than the threshold necessary for growth and the lowest in the entire nation. In fact, West Virginia is the only US state whose economic freedom ranks below that of some of the Canadian prov-inces included in the EFNA index.
This low level of economic freedom has been problematic for West Virginia as it continually ranks near, or at the bottom of, all US States when it comes to economic growth. In fact, in the 2006 Forbes Magazine report on the best states for doing business, West Virginia ranked 49th out of 50
Table 2: Wyoming and West Virginia compared
State Resourceintensity
EFNAScore
Growth 1986GSPpercapita
2005GSPpercapita
Wyoming 33.80% 6.5 4.59% US$22,358 US$53,528
WestVirginia 14.35% 5.3 4.37% US$12,752 US$29,267
Sources: Bureau of Economic Analysis, 2007; Karabegović et al., 2008: data set, available at <http://www.freetheworld.com/efna.html>.
Development in US States, Economic Freedom, and the “Resource Curse” / 27
www.fraserinstitute.org / Fraser Institute
states, only beating Louisiana in the wake of the destruction caused by Hurricane Katrina. Wyoming ranked 23rd out of the 50 states in the same study (Badenhausen, 2006, August 16). This higher level of economic free-dom has helped Wyoming experience an average growth rate of 4.59% in the period examined by this study. Although Wyoming’s growth is only slightly higher than the 4.37% exhibited by West Virginia, this slight difference com-pounded over a number of years will add up to huge differences in prosper-ity. The difference between Wyoming and West Virginia’s per-capita GSP was slightly less than US$10,000 in 1986 but, due to its slightly higher level of growth, Wyoming has more than doubled the gap and now enjoys a per-capita GSP that is more than US$24,000 higher than its less economically free coal-producing counterpart. This comparison provides a clear demon-stration of the effect revealed by the empirical analysis of economic freedom on growth in resource-dependent states.
Control variables Initial Income is negative and significant, an expected result that supports the fact that convergence is taking place. Schooling has an expectedly posi-tive impact on growth where every increase of 1% in the share of total GSP spent on education increases the growth rate by 0.05%; however, this result is insignificant. Investment and R&D both have an unexpectedly negative sign, indicating that a 1% increase in the share of total GSP spent on industrial-machinery production will reduce the average growth rate by 0.0007% and a 1% increase in the share spent on research and development will reduce the average growth rate by 0.0316%; both variables, however, are insignificant. Openness has an expected positive and significant impact on growth and appears to have the largest economic impact on growth, highlighting the importance of human capital and a fresh variety of entrepreneurial ideas from different backgrounds. Every 1% increase in net international migra-tion as a ratio of population will result in a 7.67% increase in the average growth rate. The Coastal variable is unexpectedly negative, indicating that having a coastline reduces the average growth rate by 0.46%, though this result is also insignificant. The insignificance of this variable may be related to the existence of a large number of river systems in the United States navi-gable by ocean-going ships, which was an advantage of the United States highlighted by Gallup, Mellinger, and Sachs (1998). The variable measuring population density (Pop Density) and Climate were both positive and signifi-cant, although the economic impact of these variables on growth is very small. A one-unit increase in the number of people per square mile will increase the average annual growth rate by only 0.0004% and an increase of one day in the average number of annual heating degree days will only increase the average annual growth rate by 0.0001%. This indicates that

28 / Development in US States, Economic Freedom, and the “Resource Curse”
Fraser Institute / www.fraserinstitute.org
while these variables are statistically significant, they are not major deter-minants of the economic growth of US states. The model itself is significant at the 1% level.11
Second regressionThe second regression in table 1 measures growth over the same time period, but uses a 5-year average from 1986 to 1991 for the variables EFNA, Resource Dependence, Initial Income, Investment, Schooling, and Pop Density. A new Interaction term using these new measures for resources and economic freedom was also created. All other control variables remained the same. The purpose behind this regression is to reduce the possibility that an aberration in a single year was driving the results in the first regression. The results were largely unchanged. The variable that measures schooling changed signs, but remained insignificant, and the effect of economic freedom on growth remained positive, but lost some of its significance. The interaction term, which remains the variable of interest, is still significant at the 5% level and the model itself remains significant at the 1% level.
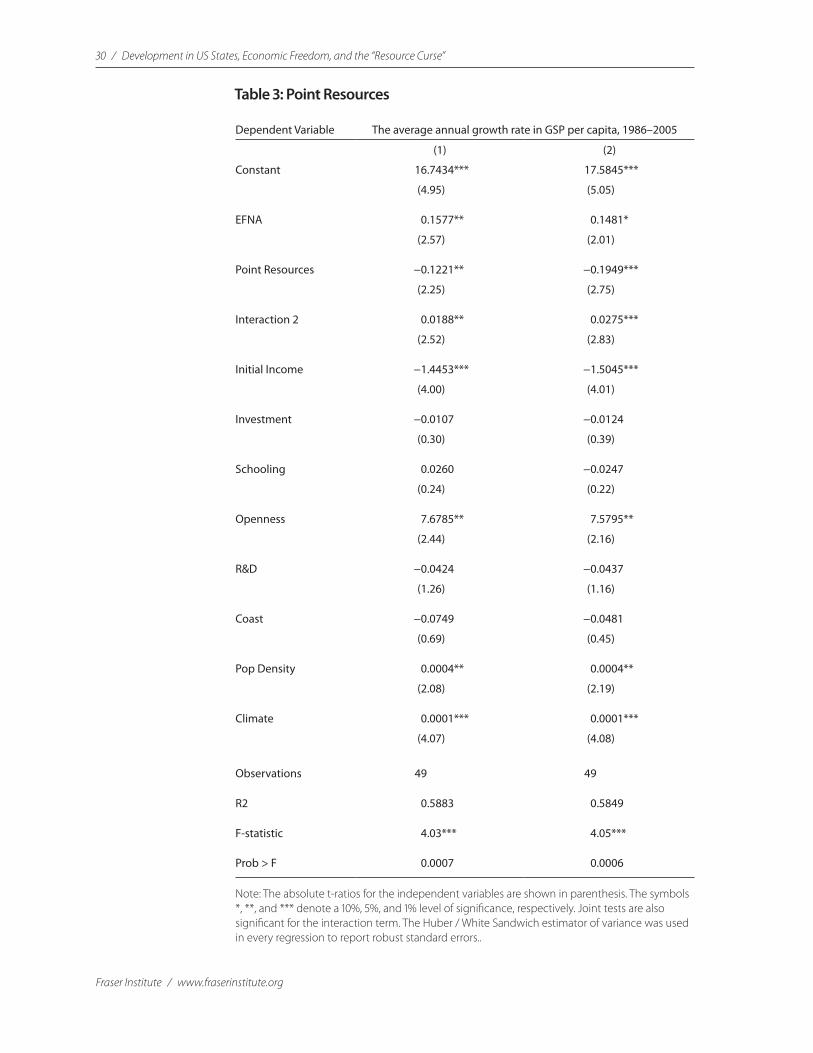
Point resourcesTo differentiate between the effects of point resources and diffuse resources, the two types are isolated and run separately across both specifications. Table 3 presents the results of the aforementioned model using point resources, which are natural resources that are immobile and related to min-ing. The variable, Point Resources, is measured as mining as a share of GSP in 1986 and the new interaction term, labeled Interaction 2, is formed by multi-plying the EFNA composite score and this new measure for point-resource dependence. The results from this new model are similar across both specifi-cations to the results found when all resources were included. This indicates that most of the effect of the relationship between natural resources and institutional quality on growth occurs through point resources. The effect of point resources on development is still negative and significant, while the effect of economic freedom and the Interaction term are both still positive and significant. There is little change among the significance and economic impact of the control variables.
11 Each table consists of two regressions that analyze 49 of the 50 US States. Delaware was eliminated from the regressions due to data limitations regarding the R&D variable. However, to include Delaware, regressions were run without the R&D variable. While the significance of some of the control variables was affected, the Interaction term, which is the variable of interest, remained positive and significant, supporting the result that only states with low economic freedom suffer from the resource curse. These regression results are available upon request ([email protected]).

Development in US States, Economic Freedom, and the “Resource Curse” / 29
www.fraserinstitute.org / Fraser Institute
Diffuse resourcesTable 4 presents the results when only diffuse resources, measured as the share of agriculture, forestry, and fishing in GSP in 1986 (Diffuse Resources), are used in the analysis. Diffuse resources are different from point resources in that they are more mobile and, therefore, more free to leave a state in response to an unfavorable political climate. A third interaction term, Interaction 3, was created where the EFNA composite score is multiplied by this measure for diffuse resource dependence. These results are drastically different across both specifications. The variables measuring diffuse resources and the inter-action between institutional quality and diffuse resources both change signs and become insignificant. Economic freedom by itself continues to have a positive effect on growth. The fact that point resources are the driving force behind the relationship between resource dependence, institutional quality, and development makes intuitive sense as the immobility of point resources makes them more susceptible to political policy. This result is consistent with that found by Bulte, Damania, and Deacon (2005) on the international level.
30 / Development in US States, Economic Freedom, and the “Resource Curse”
Fraser Institute / www.fraserinstitute.org
Table 3: Point Resources
DependentVariable TheaverageannualgrowthrateinGSPpercapita,1986–2005
(1) (2)
Constant 16.7434*** 17.5845***
(4.95) (5.05) EFNA 0.1577** 0.1481*
(2.57) (2.01) PointResources −0.1221** −0.1949***
(2.25) (2.75) Interaction2 0.0188** 0.0275***
(2.52) (2.83) InitialIncome −1.4453*** −1.5045***
(4.00) (4.01) Investment −0.0107 −0.0124
(0.30) (0.39) Schooling 0.0260 −0.0247
(0.24) (0.22) Openness 7.6785** 7.5795**
(2.44) (2.16) R&D −0.0424 −0.0437
(1.26) (1.16) Coast −0.0749 −0.0481
(0.69) (0.45) PopDensity 0.0004** 0.0004**
(2.08) (2.19) Climate 0.0001*** 0.0001***
(4.07) (4.08)
Observations 49 49
R2 0.5883 0.5849
F-statistic 4.03*** 4.05***
Prob>F 0.0007 0.0006
Note: The absolute t-ratios for the independent variables are shown in parenthesis. The symbols *, **, and *** denote a 10%, 5%, and 1% level of significance, respectively. Joint tests are also significant for the interaction term. The Huber / White Sandwich estimator of variance was used in every regression to report robust standard errors..

Development in US States, Economic Freedom, and the “Resource Curse” / 31
www.fraserinstitute.org / Fraser Institute
Table 4: Diffuse Resources
DependentVariable TheaverageannualgrowthrateinGSPpercapita,1986–2005
(1) (2)
Constant 13.1656*** 13.4625***
(3.06) (3.28) EFNA 0.1801** 0.2202***
(2.63) (2.77) DiffuseResources 0.0908 0.1958
(0.55) (1.06) Interaction3 −0.0063 −0.0205
(0.28) (0.81) InitialIncome −1.08** −1.1327**
(2.33) (2.58) Investment −0.0056 0.0011
(0.18) (0.04) Schooling 0.1083 0.1220
(1.03) (1.19) Openness 4.824 5.3772
(1.34) (1.50) R&D −0.0124 −0.0169
(0.36) (0.49) Coastal −0.0766 −0.0533
(0.72) (0.51) PopDensity 0.0004** 0.0004**
(2.37) (2.54) Climate 0.0001* 0.0001*
(1.75) (1.88)
Observations 49 49
R2 0.5761 0.5699
F-statistic 6.59*** 5.40***
Prob>F 0.0000 0.0000
Note: The absolute t-ratios for the independent variables are shown in parenthesis. The symbols *, **, and *** denote a 10%, 5%, and 1% level of significance, respectively. Joint tests are also significant for the interaction term. The Huber / White Sandwich estimator of variance was used in every regression to report robust standard errors.

32 / Development in US States, Economic Freedom, and the “Resource Curse”
Fraser Institute / www.fraserinstitute.org
7 Conclusion
The relationship between institutions and economic development has been established by numerous studies. This publication shows that institutional quality may be even more important in those economies with a significant degree of resource dependence. While there are various possible causes behind the inverse relationship between resource dependence and growth known as the resource curse, it appears that this seemingly paradoxical phe-nomenon only exists in those economies with poor institutions. Mehlum, Moene, and Torvik (2006) first established this at the international level by examining the effect of the interaction between resources and institutional quality on development.
This study applies the methodology used by Mehlum, Moene, and Torvik (2006) to the growth model analyzed by Papyrakis and Gerlaugh (2006), who were the first to examine the resource curse across the United States. It concludes that resources only have a negative impact on growth in states with poor institutions as measured by a low score on the index published in Economic Freedom of North America. This supports the evi-dence found at the international level and adds to the limited research of the resource curse on the subnational level.
This study further extends this analysis by separating resource depen-dence into point and diffuse resources to demonstrate that this effect comes largely through immobile point resources, such as those that have to be mined out of geographically narrow areas. This is consistent with the results of Beland and Tiagi (2009), who also found that point resources may be more susceptible to rent-seeking behavior than diffuse resources. This result can have important policy implications as it demonstrates that the impor-tance of free-market policies may be enhanced for states with a heavy reli-ance on natural resources, especially if these resources are immobile. By increasing economic freedom, resource-rich states can turn the resource curse into a blessing.
Development in US States, Economic Freedom, and the “Resource Curse” / 33
www.fraserinstitute.org / Fraser Institute
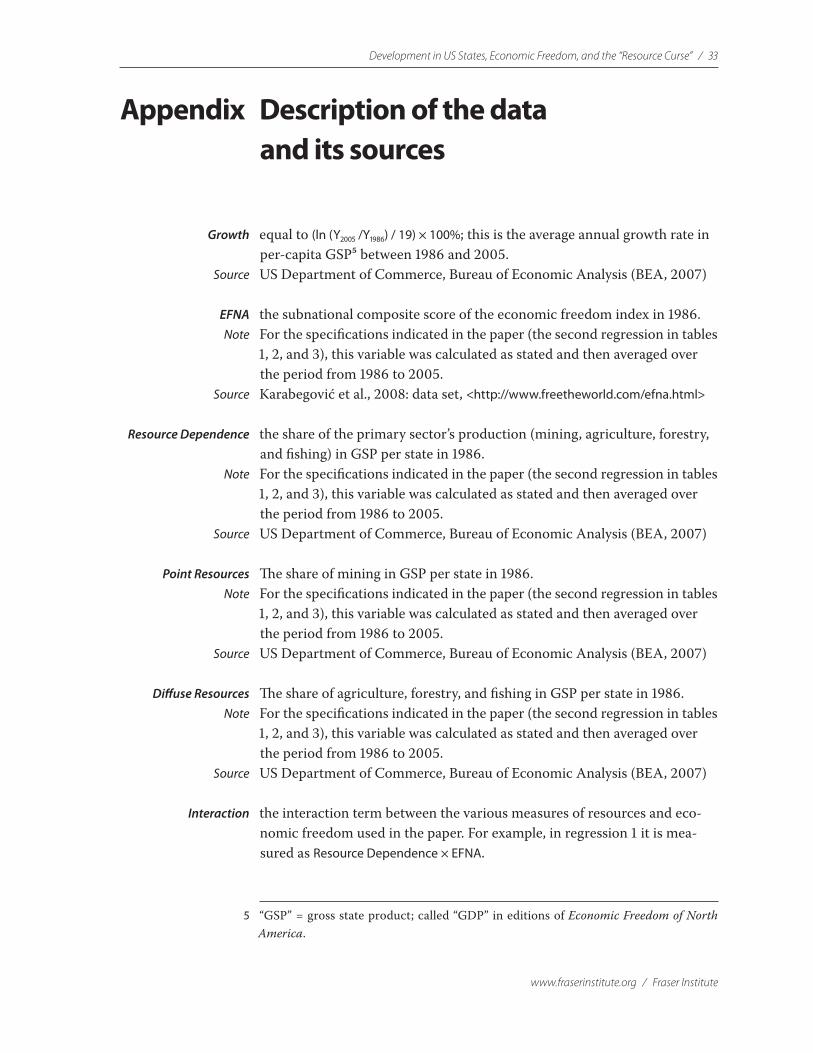
Appendix Description of the data and its sources
Growth equal to (ln(Y2005/Y1986)/19)×100%; this is the average annual growth rate in per-capita GSP5 between 1986 and 2005.
Source US Department of Commerce, Bureau of Economic Analysis (BEA, 2007)
EFNA the subnational composite score of the economic freedom index in 1986. Note For the specifications indicated in the paper (the second regression in tables
1, 2, and 3), this variable was calculated as stated and then averaged over the period from 1986 to 2005.
Source Karabegović et al., 2008: data set, <http://www.freetheworld.com/efna.html>
Resource Dependence the share of the primary sector’s production (mining, agriculture, forestry, and fishing) in GSP per state in 1986.
Note For the specifications indicated in the paper (the second regression in tables 1, 2, and 3), this variable was calculated as stated and then averaged over the period from 1986 to 2005.
Source US Department of Commerce, Bureau of Economic Analysis (BEA, 2007)
Point Resources The share of mining in GSP per state in 1986. Note For the specifications indicated in the paper (the second regression in tables
1, 2, and 3), this variable was calculated as stated and then averaged over the period from 1986 to 2005.
Source US Department of Commerce, Bureau of Economic Analysis (BEA, 2007)
Diffuse Resources The share of agriculture, forestry, and fishing in GSP per state in 1986. Note For the specifications indicated in the paper (the second regression in tables
1, 2, and 3), this variable was calculated as stated and then averaged over the period from 1986 to 2005.
Source US Department of Commerce, Bureau of Economic Analysis (BEA, 2007)
Interaction the interaction term between the various measures of resources and eco-nomic freedom used in the paper. For example, in regression 1 it is mea-sured as ResourceDependence×EFNA.
5 “GSP” = gross state product; called “GDP” in editions of Economic Freedom of North America.

34 / Development in US States, Economic Freedom, and the “Resource Curse”
Fraser Institute / www.fraserinstitute.org
Initial Income The log of real GSP per capita in 1986. Note For the specifications indicated in the paper (the second regression in tables
1, 2, and 3), this variable was calculated as stated and then averaged over the period from 1986 to 2005.
Source US Department of Commerce, Bureau of Economic Analysis (BEA, 2007)
Investment the share of industrial machinery production in GSP in 1986. Note For the specifications indicated in the paper (the second regression in tables
1, 2, and 3), this variable was calculated as stated and then averaged over the period from 1986 to 2005.
Schooling The contribution of educational services in GSP in 1986. Note For the specifications indicated in the paper (the second regression in tables
1, 2, and 3), this variable was calculated as stated and then averaged over the period from 1986 to 2005.
Source US Department of Commerce, Bureau of Economic Analysis (BEA, 2007)
R&D the share of research and development in GSP for 1987. Source National Science Foundation (NSF, 2003)
Openness net international migration from 1990 to 1999 divided by the population in 1990 for each state.
Source US Department of Commerce, Census Bureau (2008)
Coast a dummy variable equal to 1 if the state has any coastline or equal to zero if the state is landlocked.
Pop Density the population divided by number of square miles in 1986. Note For the specifications indicated in the paper (the second regression in tables
1, 2, and 3), this variable was calculated as stated and then averaged over the period from 1986 to 2005.
Source US Department of Commerce, Census Bureau (2008)
Climate the average number of annual heating degree days from 1971 to 2000. Source US Department of Commerce (2008). Historical Climatography Series No.
5-1.
Development in US States, Economic Freedom, and the “Resource Curse” / 35
www.fraserinstitute.org / Fraser Institute
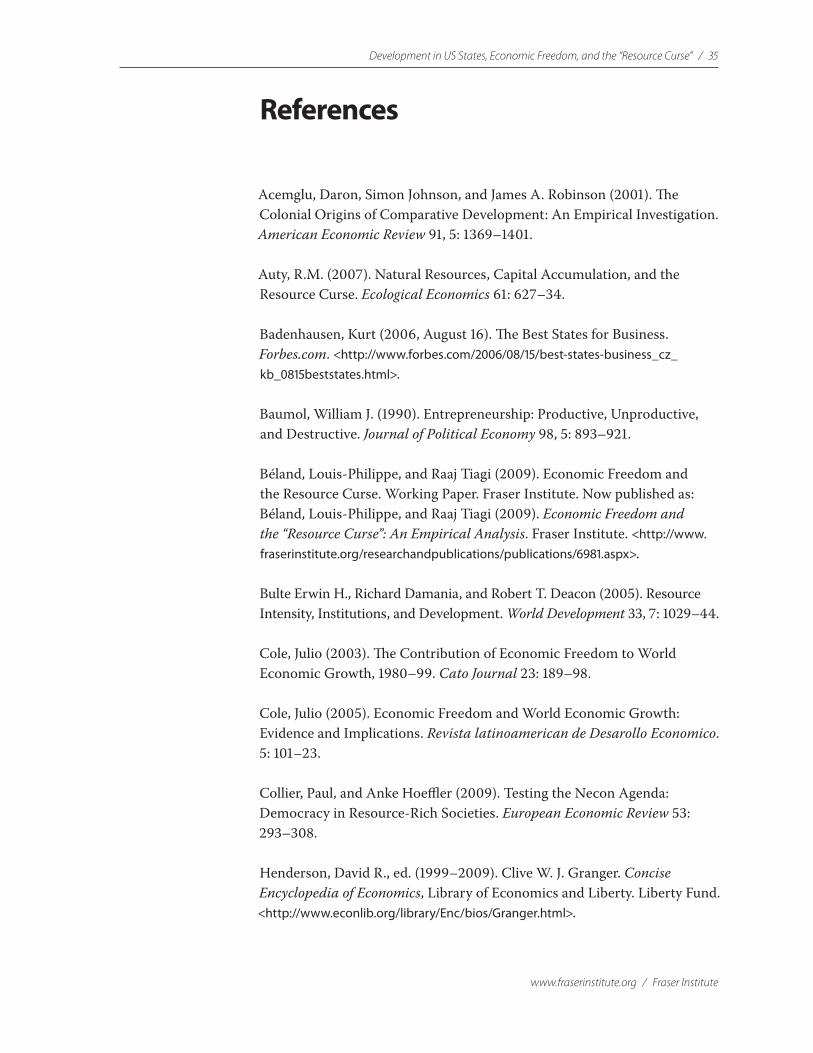
References
Acemglu, Daron, Simon Johnson, and James A. Robinson (2001). The Colonial Origins of Comparative Development: An Empirical Investigation. American Economic Review 91, 5: 1369–1401.
Auty, R.M. (2007). Natural Resources, Capital Accumulation, and the Resource Curse. Ecological Economics 61: 627–34.
Badenhausen, Kurt (2006, August 16). The Best States for Business. Forbes.com. <http://www.forbes.com/2006/08/15/best-states-business_cz_kb_0815beststates.html>.
Baumol, William J. (1990). Entrepreneurship: Productive, Unproductive, and Destructive. Journal of Political Economy 98, 5: 893–921.
Béland, Louis-Philippe, and Raaj Tiagi (2009). Economic Freedom and the Resource Curse. Working Paper. Fraser Institute. Now published as: Béland, Louis-Philippe, and Raaj Tiagi (2009). Economic Freedom and the “Resource Curse”: An Empirical Analysis. Fraser Institute. <http://www.fraserinstitute.org/researchandpublications/publications/6981.aspx>.
Bulte Erwin H., Richard Damania, and Robert T. Deacon (2005). Resource Intensity, Institutions, and Development. World Development 33, 7: 1029–44.
Cole, Julio (2003). The Contribution of Economic Freedom to World Economic Growth, 1980–99. Cato Journal 23: 189–98.
Cole, Julio (2005). Economic Freedom and World Economic Growth: Evidence and Implications. Revista latinoamerican de Desarollo Economico. 5: 101–23.
Collier, Paul, and Anke Hoeffler (2009). Testing the Necon Agenda: Democracy in Resource-Rich Societies. European Economic Review 53: 293–308.
Henderson, David R., ed. (1999–2009). Clive W. J. Granger. Concise Encyclopedia of Economics, Library of Economics and Liberty. Liberty Fund. <http://www.econlib.org/library/Enc/bios/Granger.html>.

36 / Development in US States, Economic Freedom, and the “Resource Curse”
Fraser Institute / www.fraserinstitute.org
Dawson, John (2002). Causality in the Freedom-Growth Relationship. European Journal of Political Economy 19: 479–95.
De Long, B.J., and L.H. Summers (1991). Equipment, Investment, and Economic Growth. Quarterly Journal of Economics 106: 445–502.
Ding, Ning, and Barry C. Field, Barry (2005). Natural Resource Abundance and Economic Growth. Land Economics 81, 4: 496–502.
Dunn, Leslie, 2008. The Resource Curse in U.S. States: A Rent-Seeking Model. Working Paper. Department of Economics, West Virginia University.
Easterly, William and Ross Levine (2003). Tropics, Germs, and Crops: How Endowments Influence Economic Development. Journal of Monetary Economics 50: 3–39.
Easton, Stephen, and Michael Walker (1997). Income, Growth, and Economic Freedom. American Economic Review 87, 2: 328–32.
Gallup, John L., Andrew D. Mellinger, and Jeffrey D. Sachs (1998). Geography and Economic Development. Working Paper No. 6849. National Bureau of Economic Research.
Gwartney, James, and Robert Lawson (2002). The Concept and Measurement of Economic Freedom. European Journal of Political Economy 19: 405–30.
Gwartney, James D., and Robert Lawson; with Joshua C. Hall, with Herbert Grubel, Jakob de Haan, Jan-Egbert Sturm, and Eelco Zandberg (2009). Economic Freedom of the World: 2009 Annual Report. Fraser Institute. <www.fraserinstitute.org>; <www.freetheworld.com>.
Gylfason, Thorvaldur (2001a). Nature, Power and Growth. Scottish Journal of Political Economy 48, 5: 558–88.
Isham, Jonathan, Michael Woolcock, Lant Pritchett, and Gwen Busby (2005). The Varieties of Resource Experience: Natural Resource Export Structures and the Political Economy of Economic Growth. World Bank Economic Review 19, 2: 141–74.
Karabegović, Amela (2009). Institutions, Economic Growth, and the “Curse” of Natural Resources. Studies in Mining Policy. Fraser Institute. <http://www.fraserinstitute.org/researchandpublications/publications/6797.aspx>.

Development in US States, Economic Freedom, and the “Resource Curse” / 37
www.fraserinstitute.org / Fraser Institute
Karabegović, Amela, and Fred McMahon (2009). Institutions, Economic Growth, and the “Curse” of Natural Resources. Working Paper. Fraser Institute.
Karabegović, Amela, and Fred McMahon, with Nathan Ashby, Alan W. Dowd, and Russell Sobel (2008). Economic Freedom of North America: 2008 Annual Report (US Edition). Fraser Institute. <http://www.fraseramerica.org/researchandpublications/publications/5730.aspx>. The most recent data set, which was used in this study, is available at <http://www.freetheworld.com/efna.html>.
Karabegović, Amela, Dexter Samida, Chris Schlegel, and Fred McMahon (2003). North American Economic Freedom: An Index of 10 Canadian Provinces and 50 U.S. States. European Journal of Political Economy 19: 431–52.
Kreft, Stephen F., and Russell S. Sobel (2005). Public Policy, Entrepreneurship, and Economic Freedom. Cato Journal 25, 3: pg. 595–616.
Lane, P.R., and A. Tornell (1996). Power, Growth and the Voracity Effect. Journal of Economic Growth 1: 213–41.
Leite, Carlos, and Jens Weidmann (1999). Does Mother Nature Corrupt? Natural Resources, Corruption, and Economic Growth. IMF Working Paper No. WP/99/85. International Monetary Fund.
Mehlum, Halvor, Karl Moene, and Ragnar Torvik (2006). Institutions and the Resource Curse. Economic Journal 116, 508 (January): 1–20.
National Science Foundation (NSF) (2003). Industry, Research and Development System (IRIS), Arlington, VA.
Papyrakis, Elissaios, and Reyer Gerlagh (2006). Resource-Abundance and Economic Growth in the United States. European Economic Review 51: 1011–39.
Powell, Benjamin (2003). Economic Freedom and Growth: The Case of the Celtic Tiger. Cato Journal 22: 431–48.
Sachs, Jeffrey D., and Andrew M. Warner (1995). Natural Resource Abundance and Economic Growth. NBER Working Paper No. 5398. National Bureau of Economic Research.

38 / Development in US States, Economic Freedom, and the “Resource Curse”
Fraser Institute / www.fraserinstitute.org
Sachs, Jeffrey, and Andrew Warner (2001). The Curse of Natural Resources. European Economic Review 45, 4–6: 827–38.
Sobel, Russell S. (2008a). Economic Freedom, Entrepreneurship, and Economic Growth at the Subnational Level. In Amela Karabegović and Fred McMahon (eds.) with Nathan J. Ashby and Russell S. Sobel, Economic Freedom of North America: 2008 Annual Report (Canadian Edition) (Fraser Institute): 31–48.
Sobel, Russell S. (2008b). Testing Baumol: Institutional Quality and the Productivity of Entrepreneurship. Journal of Business Venturing 23: 641–55.
Stevens, Paul (2005). Resource Impact: Curse or Blessing? A Literature Survey. Journal of Energy and Development 31, 1 (Autumn): 1–20.
Tornell, A., and P.R. Lane (1999). The Voracity Effect. American Economic Review 89: 22–46.
US Department of Commerce, Bureau of Economic Analysis (2007). State and Local Area Data.
US Department of Commerce, Census Bureau (2008).
US Department of Commerce (2008). Historical Climatography Series, No. 5-1.

www.fraserinstitute.org / Fraser Institute
Development in US States, Economic Freedom, and the “Resource Curse”
About this publication
40 / Development in US States, Economic Freedom, and the “Resource Curse”
Fraser Institute / www.fraserinstitute.org
About the author
Joab CoreyJoab Corey was born and raised in Charleston, West Virginia, and received his B.A, M.A., and Ph.D in Economics from West Virginia University. Growing up in West Virginia, he had always wondered why his home state, which was so rich in natural resources, was consistently among the states with the worst economic development. Learning that West Virginia also had the lowest economic freedom score among all US states according to the index published in Economic Freedom of North America (Fraser Institute, 2008) inspired his current line of research examining the relationship between eco-nomic freedom, resources, and development across the United States from which this study emerged. Dr. Corey is currently a Lecturer at Florida State University, where he works in the Gus A. Stavros Center for the Advancement of Free Enterprise and Economics Education. He has also published a chapter about the destructive effects of the regulatory climate in West Virginia on business in the book, Unleashing Capitalism: Why Prosperity Stops at the West Virginia Border and How to Fix It (Russell S. Sobel, ed., Public Policy Foundation of West Virginia, 2007).
Acknowledgments
The author would like to thank Russell Sobel, Tami Gurley-Calvez, Chris Coyne, Peter Leeson, Santiago Pinto, Leslie Dunn, Fred McMahon, and the anony-mous referees at the Fraser institute for helpful comments and suggestions.

Development in US States, Economic Freedom, and the “Resource Curse” / 41
www.fraserinstitute.org / Fraser Institute
Publishing information
Periodically, the Fraser Institute publishes timely and comprehensive studies of current issues in economics and public policy. This study is one such example belonging to a series of related publications.
DistributionThese publications are available from <http://www.fraserinstitute.org> and <http://www.fraseramerica.org>in Portable Document Format (PDF) and can be read with Adobe Acrobat® 7 or later or with Adobe Reader® 7 or later. Adobe Reader® 9, the most recent version, is available free of charge from Adobe Systems Inc. and may be down-loaded from: <http://get.adobe.com/reader/>. We encourage you to install the most recent version.
Ordering publicationsFor information about ordering the printed publications of the Fraser Institute, please contact the publications coordinator
• e-mail: [email protected] • telephone: 604.688.0221 ext. 580 or, toll free, 1.800.665.3558 ext. 580 • fax: 604.688.8539.
MediaFor media inquiries, please contact our Communications Department
• 604.714.4582 • e-mail: [email protected].
DisclaimerThe author of this publication has worked independently and opinions expressed by him are, therefore, his own, and do not necessarily reflect the opinions of the supporters, trustees, or other staff of the Fraser Institute. This publication in no way implies that the Fraser Institute, its trustees, or staff are in favor of, or oppose the passage of, any bill; or that they support or oppose any particular political party or candidate.
CopyrightCopyright© 2009 by the Fraser Institute. All rights reserved. No part of this pub-lication may be reproduced in any manner whatsoever without written permis-sion except in the case of brief passages quoted in critical articles and reviews.

42 / Development in US States, Economic Freedom, and the “Resource Curse”
Fraser Institute / www.fraserinstitute.org
ISSNISSN 1920-3314 Studies in Mining Policy (print version)ISSN 1920-3322 Studies in Mining Policy (online version)
Date of issueDecember 2009
Editing and designKristin McCahon and Lindsey Thomas Martin.
Cover designBill Ray
Images for coverMining for copper © Arno Massee, iStockphoto
High resolution gold nuggets © Bill Noll, iStockphoto
Precious stones © weim, Fotolia
Coal-heap © Sally Wallis, Fotolia
Salt mine © radarreklama, Fotolia
Gold seeker © TMAX, Fotolia
Supporting the Fraser Institute
To learn how to support the Fraser Institute, please contact • Development Department, Fraser Institute
Fourth Floor, 1770 Burrard Street Vancouver, British Columbia, V6J 3G7 Canada
• telephone, toll-free: 1.800.665.3558 ext. 586 • e-mail: [email protected].

Development in US States, Economic Freedom, and the “Resource Curse” / 43
www.fraserinstitute.org / Fraser Institute
About the Fraser Institute
Our vision is a free and prosperous world where individuals benefit from greater choice, competitive markets, and personal responsibility. Our mission is to measure, study, and communicate the impact of competitive markets and government interventions on the welfare of individuals.
Founded in 1974, we are an independent research and educational organization with locations throughout North America and international partners in over 70 countries. Our work is financed by tax-deductible con-tributions from thousands of individuals, organizations, and foundations. In order to protect its independence, the Institute does not accept grants from government or contracts for research.
菲沙研究所的願景乃一自由而昌盛的世界,當中每個人得以從更豐富的選
擇、具競爭性的市場及自我承擔責任而獲益。我們的使命在於量度、研
究並使人知悉競爭市場及政府干預對個人福祉的影響。
Nous envisageons un monde libre et prospère, où chaque personne bénéfi-cie d’un plus grand choix, de marchés concurrentiels et de responsabilités individuelles. Notre mission consiste à mesurer, à étudier et à communiquer l’effet des marchés concurrentiels et des interventions gouvernementales sur le bien-être des individus.
Nuestra visión es un mundo libre y próspero donde los individuos se benefi-cien de una mayor oferta, la competencia en los mercados y la responsabi-lidad individual. Nuestra misión es medir, estudiar y comunicar el impacto de la competencia en los mercados y la intervención gubernamental en el bienestar de los individuos.
تتمثل رؤيتنا يف وجود عامل حر ومزدهر يستفيد فيه األفراد من القدرة عىل أما رسالتنا . االختيار بشكل أكرب، واألسواق التنافسية، واملسؤولية الشخصية
فهي قياس، ودراسة، وتوصيل تأثري األسواق التنافسية والتدخالت الحكومية .املتعلقة بالرفاه االجتامعي لألفراد

44 / Development in US States, Economic Freedom, and the “Resource Curse”
Fraser Institute / www.fraserinstitute.org
Prof. Armen Alchian
Prof. Terry Anderson
Prof. Robert Barro
Prof. Michael Bliss
Prof. James M. Buchanan†
Prof. Jean-Pierre Centi
Prof. Thomas J. Courchene**
Prof. John Chant
Prof. Bev Dahlby
Prof. Erwin Diewert
Prof. Stephen Easton
Prof. J.C. Herbert Emery
Prof. Jack L. Granatstein
Prof. Herbert G. Grubel
Prof. Friedrich A. Hayek* †
Prof. James Gwartney
Prof. H.G. Johnson*
Prof. Ronald W. Jones
Dr. Jerry Jordan
Prof. David Laidler**
Prof. Richard G. Lipsey**
Prof. Ross McKitrick
Prof. Michael Parkin
Prof. F.G. Pennance*
Prof. Friedrich Schneider
Prof. L.B. Smith
Prof. George Stigler* †
Mr. Vito Tanzi
Sir Alan Walters
Prof. Edwin G. West*
Editorial Advisory Board
*deceased; **withdrawn; †NobelLaureate