development indicators 2014 min jeff radebe mp 20 september 2015 gcis, tshedimosetso house
TRANSCRIPT
Development Indicators 2014Min Jeff Radebe MP20 September 2015GCIS, Tshedimosetso House
2
3
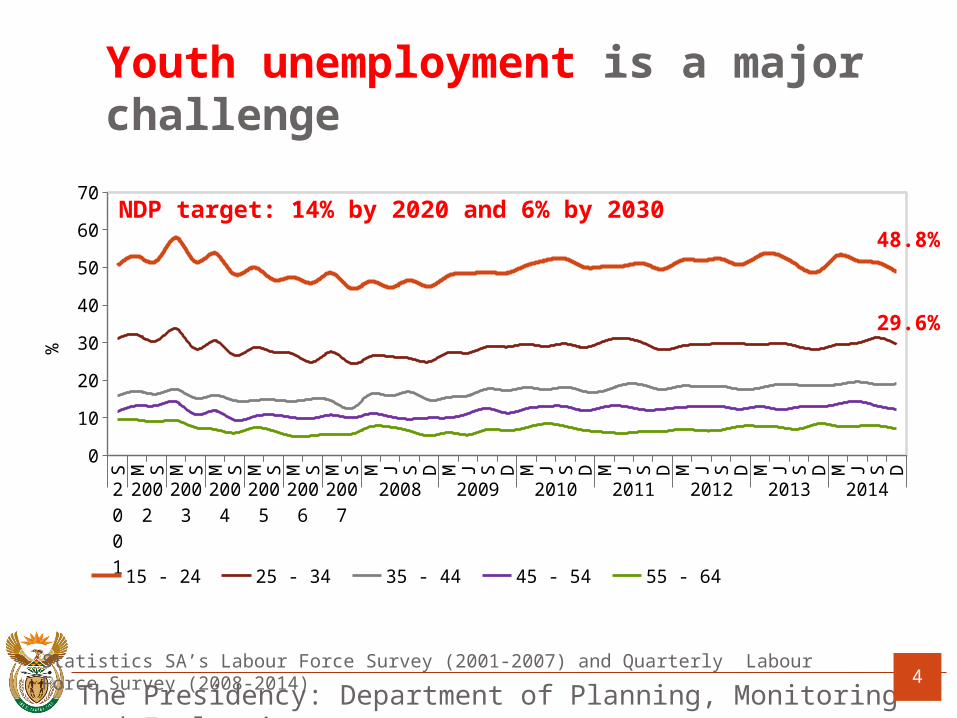
Youth unemployment is a major challenge
4
S M S M S M S M S M S M S M J S D M J S D M J S D M J S D M J S D M J S D M J S D
2001
2002 2003 2004 2005 2006 2007 2008 2009 2010 2011 2012 2013 2014
0
10
20
30
40
50
60
70
48.8%
29.6%
15 - 24 25 - 34 35 - 44 45 - 54 55 - 64
%
Statistics SA’s Labour Force Survey (2001-2007) and Quarterly Labour Force Survey (2008-2014)
NDP target: 14% by 2020 and 6% by 2030

5
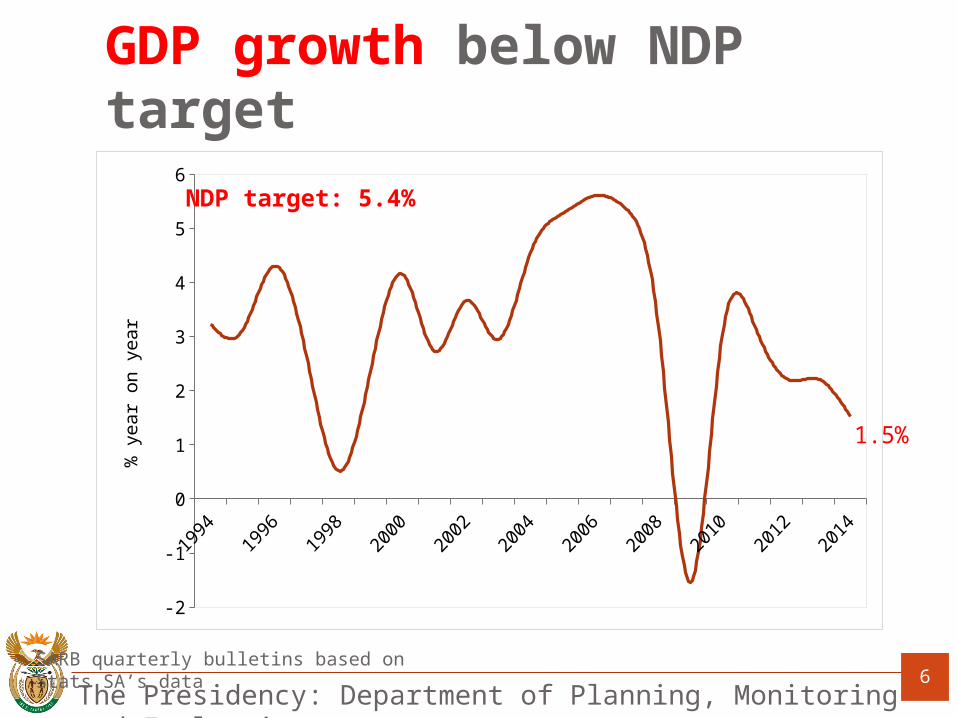
GDP growth below NDP target
SARB quarterly bulletins based on Stats SA’s data 6
-2
-1
0
1
2
3
4
5
6
1.5%% y
ear o
n ye
ar
NDP target: 5.4%
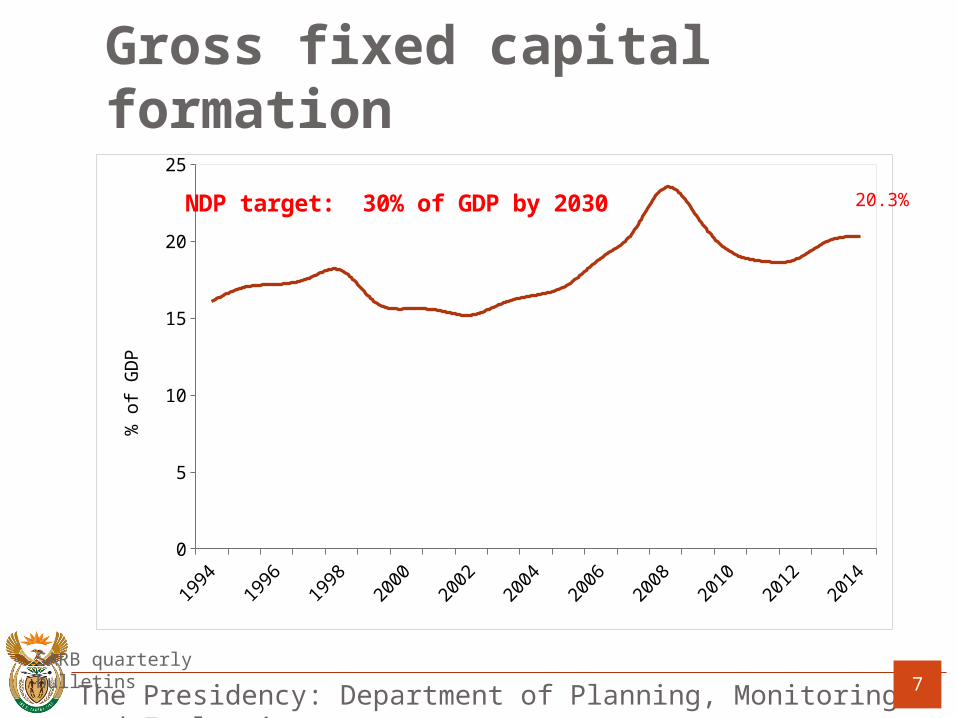
Gross fixed capital formation
SARB quarterly bulletins7
0
5
10
15
20
25
20.3%
% o
f GDP
NDP target: 30% of GDP by 2030

Participation in public employment programmes increased
EPWP total since 2004
CWP total since 2009
Department of Public Works 8
0
1,000,000
2,000,000
3,000,000
4,000,000
5,000,000
6,000,000
7,000,000
6 million
2009/10 2010/11 2011/12 2012/13 2013/140
20,000
40,000
60,000
80,000
100,000
120,000
140,000
160,000
180,000
200,000
177 thousand
NDP target: 2 million people per annum by 2030

Households accessing water, sanitation and electricity increased
9
2002 2005 2008 2011 20140
2
4
6
8
10
12
14
16
18
9
13
8.319918
13.403107
7
12
Milli
on h
ouse
hold
s
15.6 million households
11 million households
Stats SA’s General Household Survey 2002-2014
NDP target: Water – all people. 90% people access electricity through grid
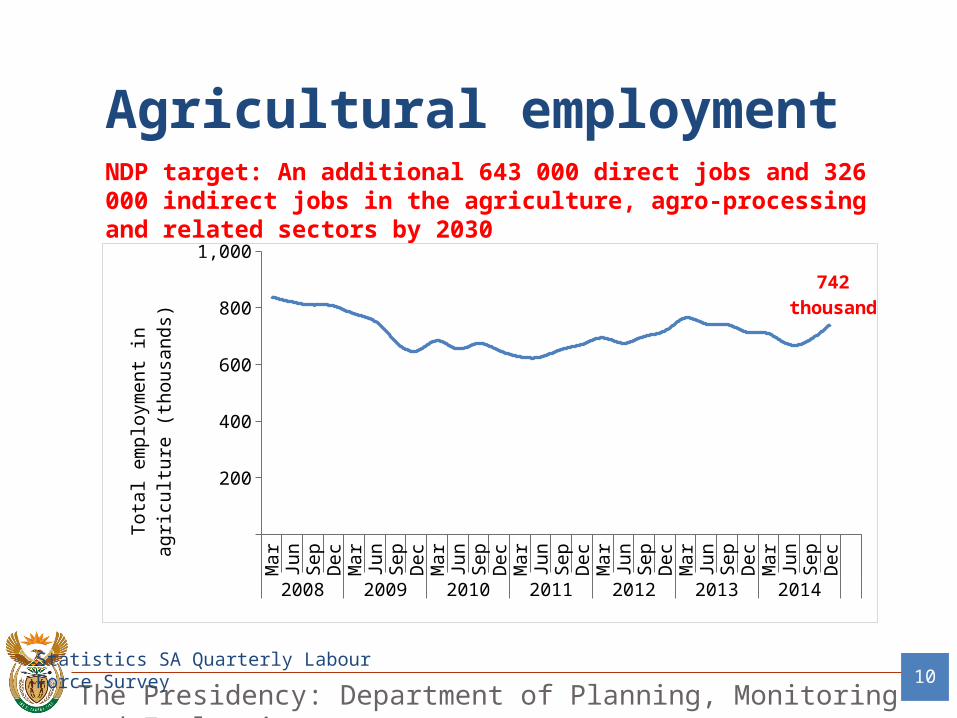
Agricultural employment
Statistics SA Quarterly Labour Force Survey 10
NDP target: An additional 643 000 direct jobs and 326 000 indirect jobs in the agriculture, agro-processing and related sectors by 2030
Mar
Jun
Sep
Dec
Mar
Jun
Sep
Dec
Mar
Jun
Sep
Dec
Mar
Jun
Sep
Dec
Mar
Jun
Sep
Dec
Mar
Jun
Sep
Dec
Mar
Jun
Sep
Dec
2008 2009 2010 2011 2012 2013 2014
200
400
600
800
1,000
742 thousand
Tota
l em
ploy
men
t in a
gricu
lture
(th
ousa
nds)

Expanded participation Early Childhood Development
Stats SA General Household Survey11
2002 2003 2004 2005 2006 2007 2008 2009 2010 2011 2012 2013 20140
10
20
30
40
50
60
70
80
90
100
0-4 year olds 5 year olds
%
5 yr olds: 87.2%
5 yr olds: 39.3%
NDP target: At least 2 years pre-school education for all
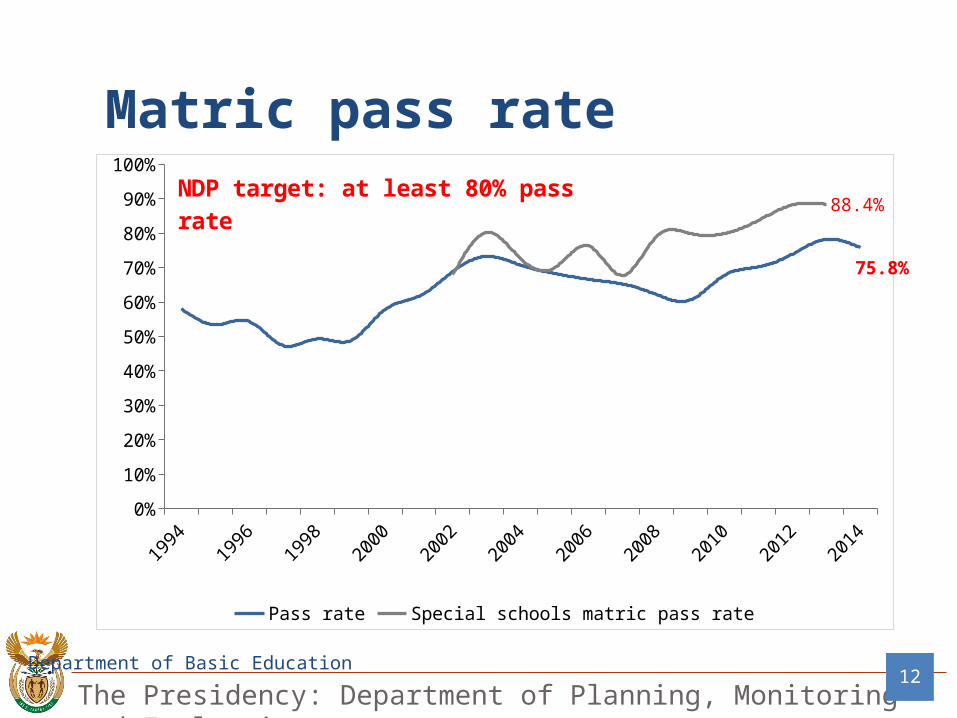
Matric pass rate
Department of Basic Education12
0%
10%
20%
30%
40%
50%
60%
70%
80%
90%
100%
75.8%
88.4%
Pass rate Special schools matric pass rate
NDP target: at least 80% pass rate
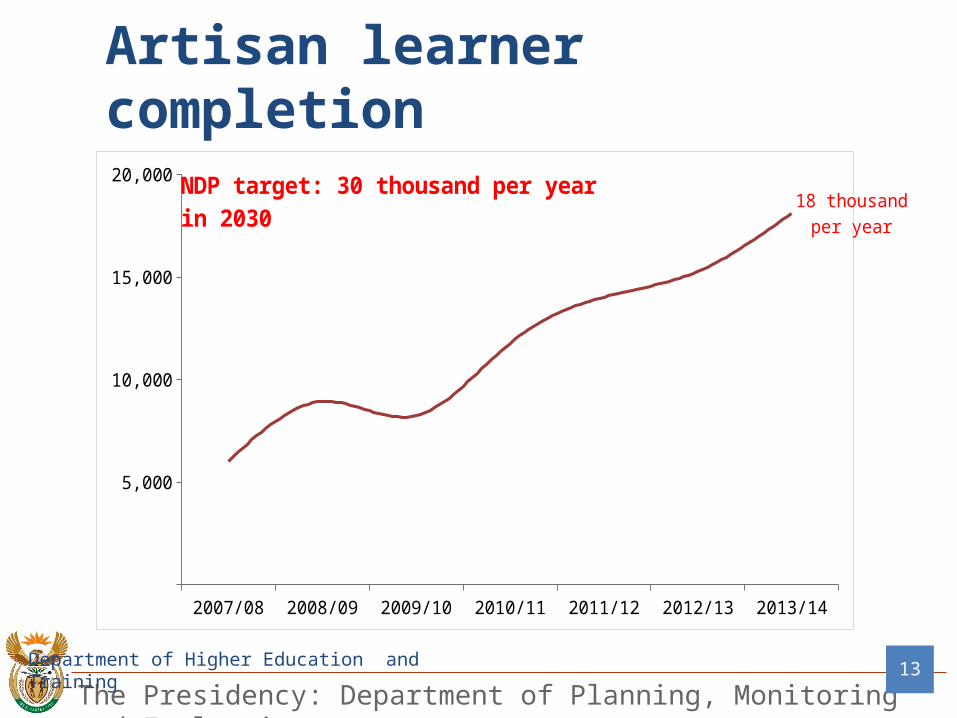
Artisan learner completion
Department of Higher Education and Training
13
2007/08 2008/09 2009/10 2010/11 2011/12 2012/13 2013/14
5,000
10,000
15,000
20,000
18 thousand per yearNDP target: 30 thousand per year in 2030

Too few learners pass Mathematics at Grade 12
Department of Basic Education14
2008 2009 2010 2011 2012 2013 2014
20 000
40 000
60 000
80 000
100 000
120 000
140 000
160 000
79 thousand
Mathematics passes Achieved at 40% and above
NDP target: 450 000 learners eligible for bachelors with maths and science

Decreasing share of GDP spent on Research & Development
HSRC, commissioned by Department of Science and Technology15
1991/92
1993/94
1997/98
2001/02
2003/04
2004/05
2005/06
2006/07
2007/08
2008/09
2009/10
2010/11
2011/12
10,000,000,000
20,000,000,000
30,000,000,000
0
0.2
0.4
0.6
0.8
1
1.2
0.76%
Gross Expenditure on R&D % of GDP
MTSF target: At least 1.5% of GDP by 2019
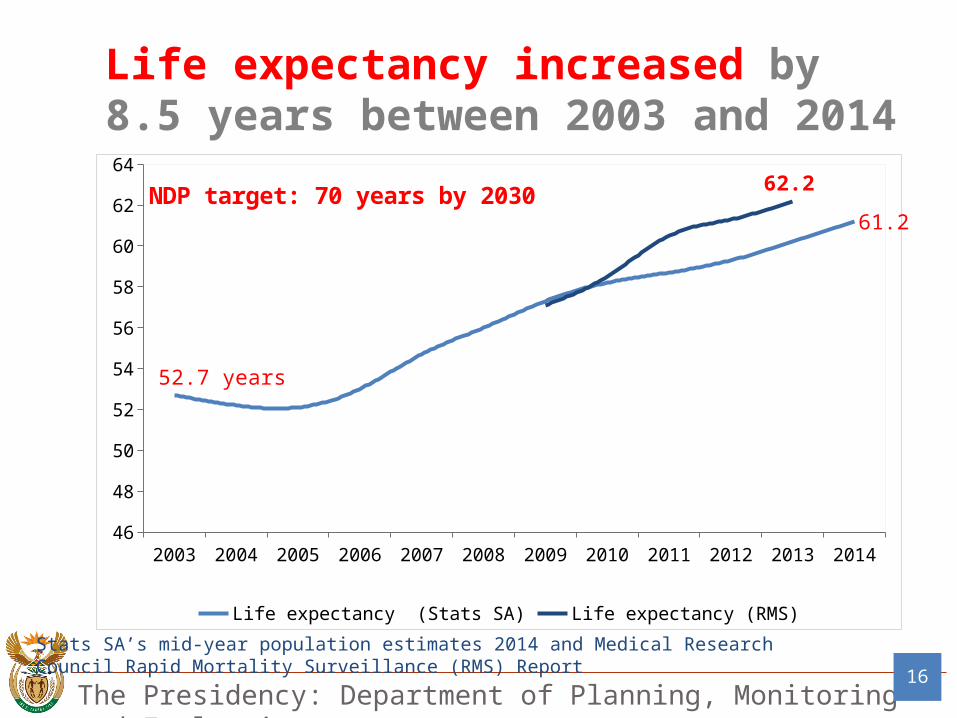
Life expectancy increased by 8.5 years between 2003 and 2014
Stats SA’s mid-year population estimates 2014 and Medical Research Council Rapid Mortality Surveillance (RMS) Report
16
2003 2004 2005 2006 2007 2008 2009 2010 2011 2012 2013 201446
48
50
52
54
56
58
60
62
64
52.7 years
61.2
62.2
Life expectancy (Stats SA) Life expectancy (RMS)
NDP target: 70 years by 2030

TB treatment success rate
Department of Health17
1994
1995
1996
1997
1998
1999
2000
2001
2002
2003
2004
2005
2006
2007
2008
2009
2010
2011
2012
2013
0
10
20
30
40
50
60
70
80
90
100
82%
77%
Successful treatment rate Cure rate
%
MTSF target: 85% treatment success rate of new clients by 2019

Child mortality declined significantly over the last decade
Stats SA’s Mid-year population estimates 2014MRC Rapid Mortality Surveillance (RMS) Reports 18
2002 2003 2004 2005 2006 2007 2008 2009 2010 2011 2012 2013 20140
10
20
30
40
50
60
70
80
90
Infant: 57.8
34.4
Under-5: 85.2 per 1 000 births
44.1
29
41
Infant mortality rate (Stats SA) Under-5 mortality (Stats SA)Infant mortality rate (RMS) Under-5 mortality (RMS)
Deat
hs p
er 1
000
live
birth
sNDP target: Reduce infant and child mortalityMDG target: 19 or less under-5’s per 1 000 in 2015

Maternal mortality declined, but is still high
Stats SA’s calculations based on civil registration and vital statistics system and MRC’s Rapid Mortality Surveillance Report 19
2002 2003 2004 2005 2006 2007 2008 2009 2010 20110
50
100
150
200
250
300
350
281 deaths per 100 000
197
Stats SA RMS
Mat
erna
l dea
ths
per 1
00 0
00 liv
e bi
rths
NDP target: Reduce maternal mortalityMDG target: 38 per 100 000 in 2015

Severe malnutrition under 5 years
Department of Health’s District Health Information System (DHIS)
20
2001 2002 2003 2004 2005 2006 2007 2008 2009 2010 2011 2012 2013 5 000
15 500
26 000
36 500
47 000
57 500
68 000
78 500
89 000
99 500
22 313
Num
ber
NDP target: Address hunger, malnutrition and micronutrient deficiencies that affect physical growth and cognitive development, especially among children
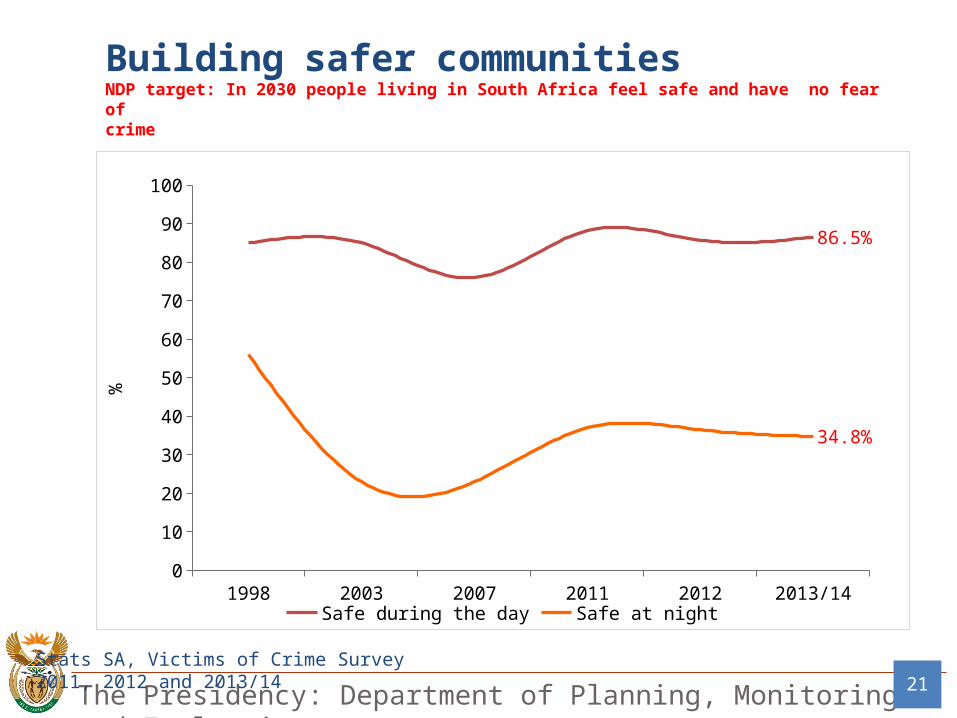
Stats SA, Victims of Crime Survey 2011, 2012 and 2013/14 21
1998 2003 2007 2011 2012 2013/140
10
20
30
40
50
60
70
80
90
100
86.5%
34.8%
Safe during the day Safe at night
%
Building safer communitiesNDP target: In 2030 people living in South Africa feel safe and have no fear of crime
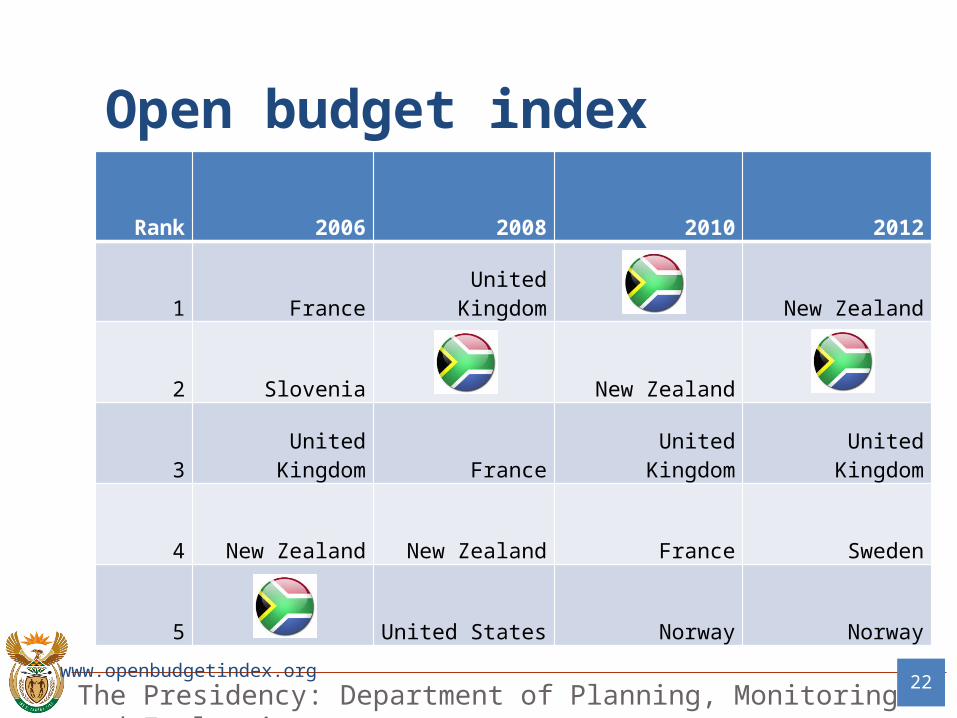
Open budget index
www.openbudgetindex.org22
Rank 2006 2008 2010 2012
1 France United Kingdom New Zealand
2 Slovenia New Zealand
3 United Kingdom France United Kingdom United Kingdom
4 New Zealand New Zealand France Sweden
5 United States Norway Norway

Perception of corruption remains high
Transparency International23
2000 2001 2002 2003 2004 2005 2006 2007 2008 2009 2010 2011 2012 2013 20140
10
20
30
40
50
60
70
80
90
100
50 5144
Scor
e (fr
om 0
- hi
gh c
orru
ptio
n to
100
- no
cor
rupt
ion)
NDP target: A corruption-free society, a high adherence to ethics throughout society and a government that is accountable to its people
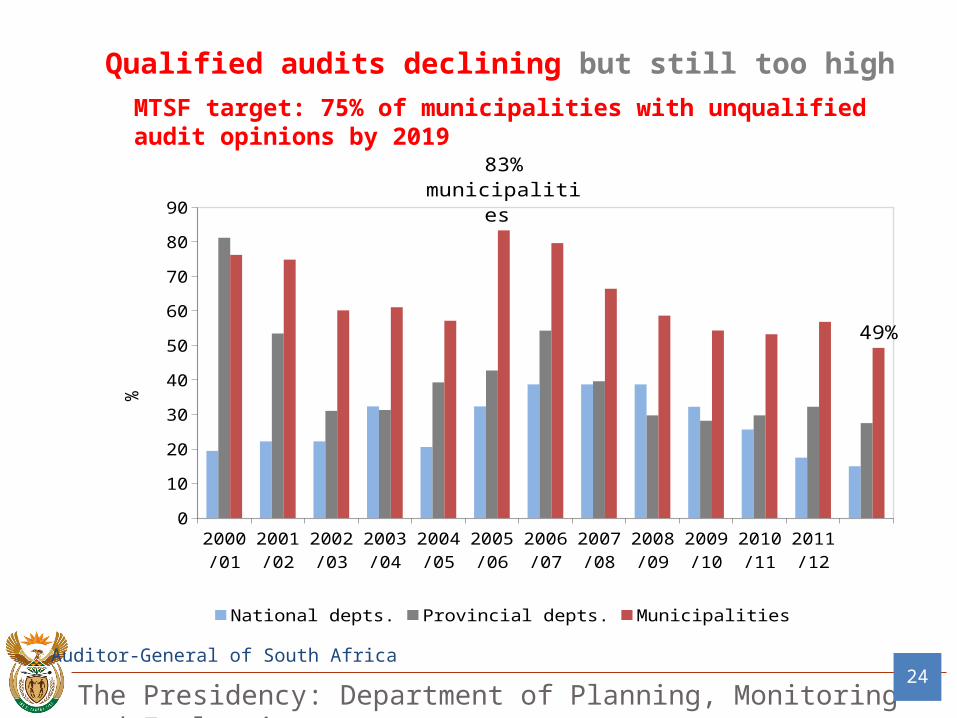
Qualified audits declining but still too high
Auditor-General of South Africa24
2000/01
2001/02
2002/03
2003/04
2004/05
2005/06
2006/07
2007/08
2008/09
2009/10
2010/11
2011/12
0
10
20
30
40
50
60
70
80
9083% municipalities
49%
National depts. Provincial depts. Municipalities
%MTSF target: 75% of municipalities with unqualified audit opinions by 2019

Revenue collection improved
South African Revenue Service
25
1996
/97
1997
/98
1998
/99
1999
/00
2000
/01
2001
/02
2002
/03
2003
/04
2004
/05
2005
/06
2006
/07
2007
/08
2008
/09
2009
/10
2010
/11
2011
/12
2012
/13
2013
/14
0
100
200
300
400
500
600
700
800
900
1 000
01 500 0003 000 0004 500 0006 000 0007 500 0009 000 00010 500 00012 000 00013 500 00015 000 00016 500 00018 000 00019 500 00021 000 000
3 million taxpayers
20 million
Personal Income Tax (PIT) Corporate Income Tax (CIT) Value Added Tax (VAT)Other tax types Income Tax register
R'bi
llion
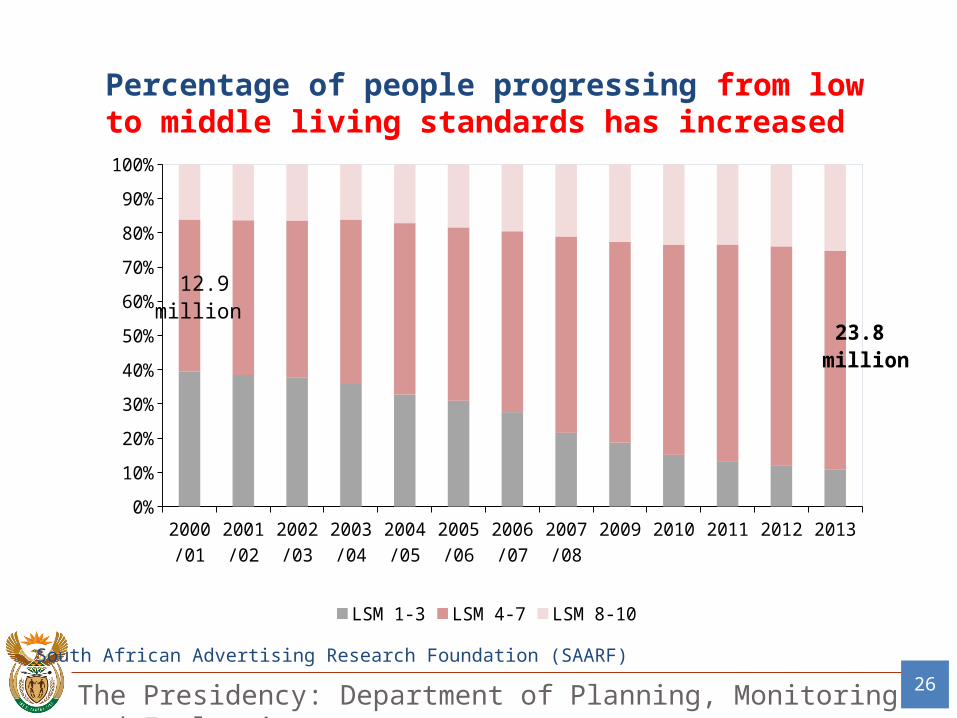
Percentage of people progressing from low to middle living standards has increased
South African Advertising Research Foundation (SAARF)
26
0%
10%
20%
30%
40%
50%
60%
70%
80%
90%
100%
12.9 million
23.8 million
LSM 1-3 LSM 4-7 LSM 8-10
27
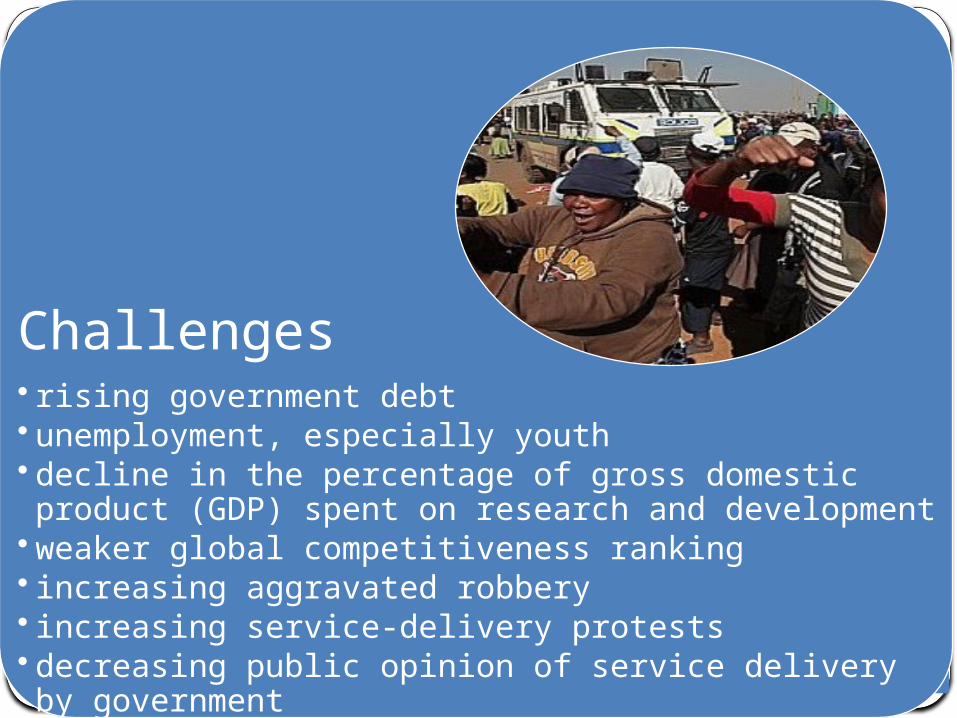
Challenges• rising government debt• unemployment, especially youth • decline in the percentage of gross domestic product (GDP) spent on research and development
• weaker global competitiveness ranking• increasing aggravated robbery• increasing service-delivery protests• decreasing public opinion of service delivery by government
28
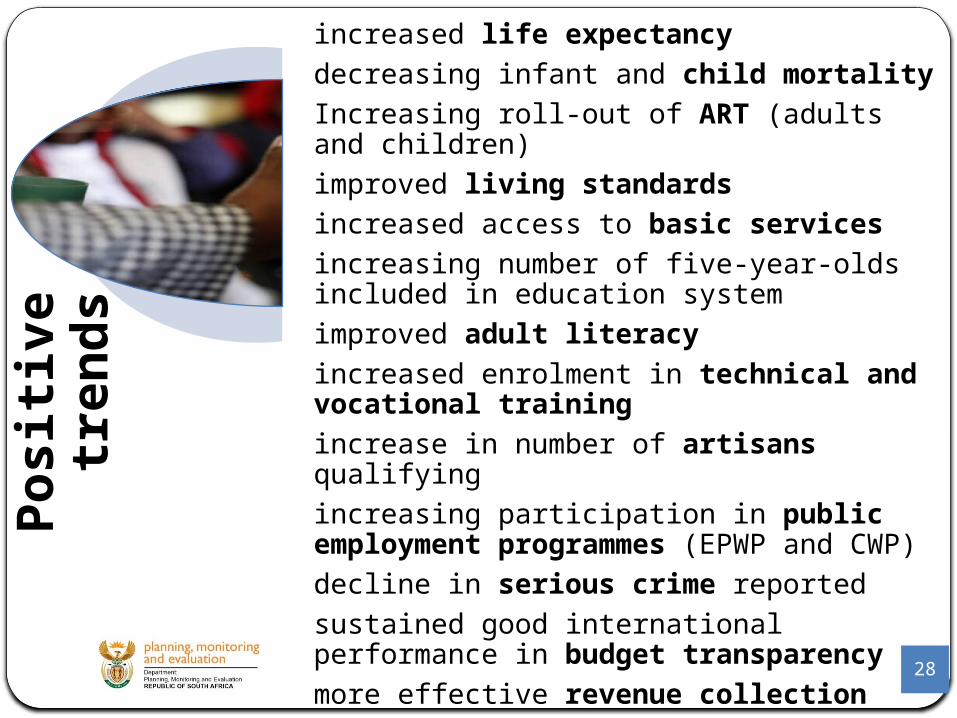
Posit
ive
tren
ds
increased life expectancy decreasing infant and child mortalityIncreasing roll-out of ART (adults and children) improved living standards increased access to basic servicesincreasing number of five-year-olds included in education system improved adult literacy increased enrolment in technical and vocational training increase in number of artisans qualifyingincreasing participation in public employment programmes (EPWP and CWP) decline in serious crime reported sustained good international performance in budget transparencymore effective revenue collection increasing tourism

29

Acknowledgement
30
31
Target Audience• Cabinet , Parliament and all Provincial Legislatures • Senior government officials • Embassies represented in South Africa & South African Embassies
abroad• South African delegations visiting other countries• University and community libraries• Think tanks and major non-governmental organisations • Research institutions• Media • International bodies like the World Bank, United Nations agencies