development of 3d cancer cell models for pre-clinical research · imortalizados, constituindo o...
TRANSCRIPT

Susana Caçador Veloso
Development of 3D cancer cell models
for pre-clinical research
- Evaluation of the tumour
microenvironment in 3D stirred-systems
2014


Development of 3D cancer cell models for pre-clinical research - Evaluation of
the tumour microenvironment in 3D stirred-systems
Copyright Susana Caçador Veloso, FFUC
A Faculdade de Farmácia e a Universidade de Coimbra têm o direito, perpétuo e sem
limites geográficos, de arquivar e publicar esta dissertação através de exemplares impressos
reproduzidos em papel ou de forma digital, ou por qualquer outro meio conhecido ou que
venha a ser inventado, e de a divulgar através de repositórios científicos e de admitir a sua
cópia e distribuição com objetivos educacionais ou de investigação, não comerciais, desde
que seja dado crédito ao autor e editor.
The Faculty of Pharmacy and the University of Coimbra are entitled, perpetual and
without geographical boundaries, to archive and publish this dissertation through copies
imprinted on paper or in digital form, or by any other known or to be invented medium, and
to disseminate through scientific repositories and admit the copy and distribution for
educational or research purposes, not commercial, as long as credit is given to the author
and publisher.

“É isso que nos faz viver. Não de insatisfação. Mas de busca por mais e mais. Pela
manutenção do sonho. Pelo não nos darmos por satisfeitos nem por acomodados.”
Carolina Tendon


VII
Preface
This work was performed in the Animal Cell Technology Unit of IBET and ITQB-
UNL, within the scope of the project “New models for preclinical evaluation of drug efficacy
in common solid tumours” - PREDECT (www.predect.eu), funded by Inovative Medicine
Initiative (http://www.imi.europa.eu/content/home ). The main aim of this project is to create
more appropriate in vitro platforms for target validation and drug discovery.
Part of the work herein described contributed for poster presentations in
international conferences:
(1) Santo VE, Estrada M, Veloso SC, Sousa MQF, van der Kuip H, Oren M, Boghaert
ER, Alves PM, Brito C “Novel robust 3D models of non-small-cell lung carcinoma for target
validation and tumor-stroma cross-talk elucidation through fully-controlled bioreactor
cultures”, 3D Cell Culture 2014 – Advanced Model Systems, Applications & Enabling
Technologies, Freiburg, Germany, to be held 25th-27th June 2014;
(2) Santo VE, Estrada M, Veloso SC, Sousa MQF, van der Kuip H, Oren M, Boghaert
ER, Alves PM, Brito C “Recapitulation of non-small-cell-lung carcinoma microenvironment in
perfusion bioreactor cultures: the impact of hypoxia on tumor-stroma crosstalk”, 23rd
Biennial Congress of the European Association for Cancer Research, Munich, Germany, to
be held 5th-8th July 2014.


IX
Acknowledgements
This master thesis was only possible due to the collaboration, contribution and
encouragement, directly or indirectly, from different persons, to whom I would like to
express a few words of gratitude and recognition.
To Prof. Dr. Paula Alves, for give me the opportunity to do my master thesis at
Animal Cell Technology Unit at IBET, ITQB-UNL, for the high-quality working conditions
offered and for being a strong example of leadership.
To Dr. Catarina Brito, it’s a privilege and a pleasure to work with her, for her
guidance, knowledge, support and patience to teach me. For being always available to
scientific discussions and for being an example in science. For being always there to motivate
me and give me precious advices that allowed me to growth as scientist and as a person.
To Dr. Vítor Espirito Santo, for accepting to be my co-supervisor. A deep thanks for
the confidence, support, scientific knowledge, wise comments, explanations, opinions and
suggestions throughout the all work.
To Prof. Dr. João Nuno Moreira, for accepting to be my internal supervisor.
To Dr. Margarida Serra, Dr. Marcos Sousa and Dr. Ana Teixeira for the scientific
advices and for always being available to help in anything.
To all the TCA colleagues for the good working environment and the help during this
year, specially to Catarina Pinto, Ana Paula Terrasso, Sofia Rebelo, Daniel Simão, Marta Silva,
Carina Silva and Rita Costa. Special and deep thanks to Marta Estrada for all the good
scientific explanations, for all the time and patience to teach me and willingness for help and
support in all moments.
To Carolina Pinto Ricardo, Nuno Espinha, Tiago Aguiar, , Anis Hamdi, Daniel Pais,
João Sá, Raquel Cunha and Lorena Ortiz for the friendship and advices during this year in
and outside the workplace.
À Liliana, ao Canel, ao Zé, à Vanessa e a toda a malta do HIIT. Sem vocês, este ano
não teria sido a mesma coisa.
A todos os amigos que fiz durante os meus anos académicos na Universidade de
Coimbra, por todos os bons momentos dentro e fora da instituição, especialmente ao
Rúben Oliveira, à Micky, ao Telmo, ao Crispim, ao Ricardo, à Daniela, à Paula, ao Paulo, ao
Caramelo, ao Tiago, ao Mário, à Tânia, ao Teixo, ao Sales, à Sara e ao Santos.
Aos amigos de longa data, dos quais nunca me esqueço. Obrigada pela amizade e
apoio.

X
Ao Rúben, por todo o apoio, carinho, incentivo, motivação, paciência e força que
sempre me deste. Obrigada por me fazeres sempre rir e por todos os momentos
partilhados. És um grande exemplo para mim.
À minha família, sem vocês nada disto teria sido possível. São para mim um exemplo
de coragem e perseverança. Obrigado por todo o amor e por todo o apoio e incentivo para
seguir em frente. Obrigado por estarem sempre presentes, em todos os momentos.

XI
Abstract
Lung cancer is the leading cause of cancer-related death worldwide. Non-small cell
lung cancer (NSCLC) is the most frequent type of lung cancer, constituting approximately
85% off all lung cancer cases. Despite intensive research for the development of anti-NSCLC
drugs, the majority fail in clinical trials. The reasons could be due to absence of therapeutic
action and/or due to side effects, which could not be predicted in vitro or in animal studies
because they lack the human physiological characteristics. Therefore, it is urgent to develop
strategies to eliminate ineffective and unsafe compounds with speed, reliability and respect
for animal welfare prior to clinical stages. Preclinical models that can better recapitulate
tumour microenvironment features, such as the presence of different cell types (tumour and
stromal cells) and extracellular matrix (ECM) components and their 3-dimensional (3D)
spatial cellular organization, including cell-cell and cell-ECM interactions, would in principle
predict clinical responses with higher accuracy. Tumour stroma is a supportive tissue around
the tumour, with fibroblasts being the major cell population. Tumour-stroma crosstalk
promotes changes in cancer cells and tumour microenvironment, enabling tumour
progression, invasion and metastasis. 3D human cellular models overcome limitations of
monolayer drug tests, such as the lack of cell-cell and cell-ECM interactions and 3D spatial
cellular organization, better resembling physiological complexity and drug response than 2-
dimensional (2D) culture. This allows a wide range of applications in pharmacological studies
and in tumour biology since tumour microenvironment can be recapitulated with co-cultures
of different type of cells and components, such as the stroma.
The aim of this work was to develop scalable and reproducible 3D NSCLC human
cellular models that could represent some of the above mentioned features. A 3D culture
strategy was followed based on stirred culture systems. In a first approach, aggregation of
NSCLC cell lines was implemented in spinner vessels. H460 and H1650 cell lines,
representing large cell and bronchioalveolar carcinoma, respectively, formed cellular
aggregates in suspension after 3 days of cell culture with high cell viability, cell proliferation
and metabolic activity. In a second approach, 3D cell culture in stirred culture systems was
combined with an alginate microencapsulation strategy for cell entrapment. H1650 cellular
aggregates were encapsulated with and without immortalized normal lung fibroblasts as
stromal component (mono and co-cultures, respectively). This strategy enabled to generate
homogeneous microcapsules containing tumour cellular aggregates surrounded by
fibroblasts, a configuration which resembles the in vivo situation. Moreover, this strategy

XII
enables collagen accumulation, characteristic of tumour microenvironment, such as ECM
proteins production. Microcapsule cultures were maintained in stirred culture systems for
15 days, with high cell viability within aggregates. Cell proliferation and metabolism was
similar in mono and co-cultures.
Therefore, a 3D human NSCLC cellular model was accomplished, suggesting that the
combination of 3D cell cultures, stirred culture systems and microencapsulation technique is
a promising tool for the generation of more reliable NSCLC models that better mimic the
tumour microenvironment and the possibility to study its influence in tumour progression.
Keywords: Non-small lung cancer, tumour microenvironment, stirred culture
systems, 3D cellular models, cellular aggregates, microencapsulation.

XIII
Resumo:
O cancro do pulmão é a maior causa de morte por cancro no mundo inteiro. O
cancro do pulmão de não-pequenas células (CPNPC) é o tipo de cancro do pulmão mais
frequente, constituindo aproximadamente 85% de todos os casos de carcinoma pulmonar.
Apesar da investigação intensa para desenvolver fármacos contra este tipo de cancro, a
maioria deles não ultrapassa a fase de ensaios clínicos. As razões podem ser devidas à
ausência de efeito terapêutico e/ou aos efeitos secundários, que não foram previstos em
estudos in vitro nem em estudos animais, uma vez que estes não possuem as características
fisiológicas do sistema humano. Deste modo, é urgente eliminar os compostos ineficazes e
não seguros com a maior brevidade e eficácia, reduzindo igualmente a experimentação
animal. Os modelos celulares humanos 3-dimensionais (3D) superam algumas das limitações
dos testes de fármacos em monocamada de células, tais como a ausência de interações
célula-célula e a organização celular espacial em 3D, o que melhor mimetiza a complexidade
e resposta fisiológica a fármacos, comparando com culturas celulares em 2-dimensões (2D).
Os modelos celulares em 3D têm uma vasta aplicação em estudos farmacológicos e na
biologia tumoral, uma vez que o microambiente tumoral pode ser mimetizado com co-
cultura de diferentes tipos celulares e componentes, como o estroma. O estroma tumoral é
um tecido de suporte que existe à volta do tumor, sendo os fibroblastos a maior população
celular. Interações tumor-estroma promovem alterações nas células cancerígenas e no
microambiente tumoral, permitindo a progressão, invasão e metástases tumorais.
O objetivo do trabalho foi desenvolver um modelo celular 3D humano de CPNPC
reprodutível e com aplicação em maior escala, com as características 3D descritas
anteriormente. Foi usada uma estratégia 3D de cultura celular, baseada em sistemas de
cultura agitados. Numa primeira abordagem, agregação de linhas celulares de CPCNP foi
implementada. As linhas celulares H460 e H1650, representando carcinomas de grandes
células e bronquioalveolar, respectivamente, formaram agregados em suspensão após 3 dias
de cultura celular com alta viabilidade e proliferação celular e actividade metabólica. Numa
segunda abordagem, cultura celular em 3D em sistemas de cultura agitados foi combinada
com uma estratégia de encapsulação em alginato, para confinar as células no mesmo espaço
físico. Agregados celulares de H1650 foram encapsulados sem e com fibroblastos do pulmão
imortalizados, constituindo o componente estromal (mono- e co-cultura, respectivamente).
Esta técnica possibilitou gerar cápsulas com agregados no seu interior e fibroblastos
individuais à volta desses agregados, o que se aproxima da situação in vivo. Microcápsulas
XIV
foram mantidas em sistemas de cultura agitados até 15 dias, com alta viabilidade celular nos
agregados. Proliferação e atividade metabólica foi semelhante em mono- e co-cultura. Esta
estratégia permite ainda acumulação de colagénio, característica do microambiente tumoral
devido à produção de proteínas da matrix extracelular,
Assim, foi possível obter um modelo celular 3D humano de CPNPC, o que sugere
que a combinação de cultura celular 3D, sistemas de cultura agitados e microencapsulação é
uma ferramenta promissora para alcançar modelos celulares mais eficazes que melhor
mimetizam o microambiente tumoral e a possibilidade de estudar a sua influência na
progressão do tumor.
Palavras-chave: Cancro do pulmão de não-pequenas células (CPNPC),
microambiente tumoral, sistema de cultura agitado, modelos celulares 3D, agregados
celulares, microencapsulação.

XV
Table of contents:
Contents
Index of Figures XVII
Index of Tables XIX
Abbreviations XX
1. Introduction 1
1.1. Lung cancer 3
1.1.1. Risk factors 4
1.1.2. Types of lung cancer 4
1.1.3. Lung cancer treatment 6
1.2. Epithelial to mesenchymal transition and metastasis 8
1.3. Tumour microenvironment 11
1.3.1. Stroma 12
1.4. Cancer cell metabolism 14
1.4.1. Tumour-stroma metabolic crosstalk 16
1.5. Need for new cell models for pre-clinical research 17
1.6. Cancer pre-clinical models 19
1.6.1. The drug discovery cascade 19
1.6.2. 2Dimensional versus 3Dimensional cell models 21
1.6.3. 3D static cell culture methods 23
1.6.4. 3D agitation-based cell culture methods 28
1.6.5. Mimicking the tumour microenvironment in vitro 35
1.7. Thesis aim 37
2. Materials and Methods 39
2.1. Cell lines and cell culture conditions 41
2.2. Generation of NSCLC aggregates and culture conditions 42
2.3. Development of a 3D NSCLC cellular model 43
2.3.1. Fibroblasts membrane staining protocol 43l
2.3.2. Encapsulation of NSCLC cellular aggregates 44
2.3.3. Mono- and co-culture of H1650 encapsulated aggregates 46
2.4. Analytical methods to evaluate cell culture 47
2.4.1. Determination of cell concentration, cell viability, cell death and
Apoptosis 47
2.4.2. Aggregate size determination 49
2.4.3. Metabolite analysis 49
2.4.4. Phenotypic characterization of the NSCLC cellular model 49
2.4.5. Quantification of newly synthesized ECM components 50
2.5. Statistical analysis 51

XVI
3. Results and discussion 53
3.1. Aggregation of NSCLC cell lines in stirred culture systems 55
3.2. Culture of encapsulated NSCLC aggregates in stirred culture systems 64
3.3. Metabolic characterization of encapsulated NSCLC aggregates in mono- and co-
culture 72
3.4. ECM deposition and phenotypic characterization mono- and co-cultures 76
4. Conclusion 87
5. Future Perspectives 91
6. References 95

XVII
Index of Figures:
Figure 1.1 – Respiratory system 3
Figure 1.2 – Scheme of the EGFR pathway 8
Figure 1.3 - Endothelial to mesenchymal transition and metastasis 9
Figure 1.4 – Shift between epithelial and mesenchymal morphology 10
Figure 1.5 - Tumour microenvironment 11
Figure 1.6 - Transition of a normal fibroblast to a cancer associated fibroblast (CAF) 13
Figure 1.7 - Action of activated fibroblast in the tumour microenvironment 14
Figure 1.8 – Cancer cell metabolism pathways 15
Figure 1.9 - Hallmarks of cancer 19
Figure 1.10 - Drug discovery cascade 20
Figure 1.11 - Morphological and functional cellular distribution in a tumour 22
Figure 1.12 - Forced-floating method 23
Figure 1.13 - Hanging drop method 24
Figure 1.14 - 3D cell culture method based on Matrigel 25
Figure 1.15 - Strategies to promote the release of multiple bioactive factors from a scaffold 26
Figure 1.16 - M/G residues that constitute the alginate 27
Figure 1.17 - Example of a non porous microcarrier 28
Figure 1.18 - Gyratory shaker for Erlenmeyer 29
Figure 1.19 - Agitation-based approaches for the production of aggregates 31
Figure 1.20 – A 4-fold DASbox® Mini Bioreactor System for cell culture 32
Figure 1.21 - Design of a 3D microfluidic device 33
Figure 1.22 - Concept of cell microencapsulation 36
Figure 1.23 – Aim of the thesis and strategies performed to accomplish the objectives 37
Figure 2.1 - Stirring profile for H460 and H1650 cellular aggregation s using spinner-flasks with straight paddle impeller (Corning® Life Sciences) 43
Figure 2.2 - Schematic illustration the cell encapsulation process with alginate 45
Figure 2.3 – Strategy performed to accomplish a 3D cellular model to evaluate the effect of tumour microenvironment on tumour progression 46
Figure 3.1 - Monitoring of aggregation of NSCLC cell lines in stirred culture systems 56
Figure 3.2 – Cell death expressed by the cumulative values of LDH released during aggregation of NSCLC cell lines in stirred culture systems. 57
Figure 3.3 - Aggregate size profile along aggregation of NSCLC cell lines in stirred suspension culture systems 58

XVIII
Figure 3.4 – Cell (a)) and aggregate (b)) concentration during aggregation of NSCLC cell lines in stirred culture systems. 59
Figure 3.5 – Concentration of glucose (a) and lactate (b) in the cell culture medium during aggregation of NSCLC cell lines in stirred culture systems 61
Figure 3.6 – Specific metabolic rates of glucose consumption (a) and lactate production (b) aggregation of NSCLC cell lines in stirred culture systems, from day 0 to day 1 and from day 1 to day 0 62
Figure 3.7 – Metabolic efficiency aggregation of NSCLC cell lines in stirred culture systems 63
Figure 3.8 - Monitoring of mono and co-cultures of H1650 aggregates encapsulated with NFs in stirred culture system. 66
Figure 3.9 – Cell death expressed by cumulative values of LDH released during mono and co-cultures of H1650 aggregates encapsulated with NFs in stirred culture system 67
Figure 3.10 – Evaluation of apoptotic activity during mono and co-cultures of H1650 aggregates encapsulated with NFs in stirred culture system at days 5 and 15 of culture by fluorescence microscopy 68
Figure 3.11 - Aggregate area profile of H1650 encapsulated aggregates in mono- and co-culture with NFs using a stirred suspension culture system 70
Figure 3.12 – Cell (a) and aggregate (b) number of H1650 encapsulated aggregates in mono and co-culture with NFs using a stirred suspension culture system 71
Figure 3.13 – Concentration of glucose (a) and lactate (b) in the cell culture medium of H1650 encapsulated aggregates in mono- and co-culture with NFs using a stirred suspension culture.Specific metabolic rates of H1650 aggregates in mono and co-culture with NFs using a stirred suspension culture system for glucose consumption (c) and lactate production (d) 73
Figure 3.14 – Yield of lactate/glucose of H1650 encapsulated aggregates in mono and co-culture with NFs in stirred culture systems 75
Figure 3.15 – Collagen concentration of H1650 encapsulated aggregates in mono- and co-culture with NFs in stirred culture system throughout time 76
Figure 3.16 - Immunocharacterization of H1650 encapsulated aggregates in mono- and co-cultures with NFs in stirred culture systems at day 15 of culture 77

XIX
Index of Tables
Table 1.I: Main types of lung cancer and their major characteristics 5
Table 1.2: Main differences between the epithelial and mesenchymal phenotypes 10
Table 1.3: Advantages and disadvantages of different 3D cell culture techniques 33
Table 2.1: Cell lines used to generate NSCLC cellular aggregates 41
Table 2.2: List of antibodies and respective dilutions used for immunofluorescence microscopy 50


XXI
Abbreviations
2D - Two dimensional
2HG - 2-hydroxyglutarate
3D - Three dimensional
ACL - ATP-citrate lyase
AJ- Adherens junctions
αKG – Alpha ketoglutarate
AKT – Protein kinase B
ALK - Anaplastic lymphoma kinase
Arg–Gly–Asp or RGD - amino acid sequence arginine–glycine–aspartic acid
ATP - Adenosine triphosphate
BaCl2 - Barium dichloride
BCL2 - B-cell lymphoma 2
CAF - Cancer-associated fibroblast
Cav-1- Caveolin-1
CHO – Chinese hamster ovary
CK18 – Cytokeratin 18
CO2 – Carbon dioxide
Col IV – Collagen IV
D – Desmosomes
DAPI - 4,6‐diamidino‐2‐phenylindole
DNA - Deoxyribonucleic acid
DPBS – Dulbecco’s phosphate buffered saline
dsDNA - Double-stranded nucleic acids
ECM – Extracellular matrix
EDA-fibronectin - Fibronectin containing the extra domain A
EDTA - Ethylenediaminetetraacetic acid
EGF- Endothelial growth factor
EGFR – Epidermal growth factor receptor
EMT – Epithelial to mesenchymal transition
ERBB2- v-erb-b2 avian erythroblastic leukemia viral oncogene homolog 2
F-2,6-bisP - Fructose 2,6-bisphosphate
FAS - Fatty acid synthase
FBS - Fetal bovine serum
FDA - Fluorescein diacetate
FGF2 - Fibroblast growth factor 2
FH - Fumarate hydratase
FSG - Fish skin gelatine
FSP1 - Fibroblast-specific protein 1
G – Gap junctions
G residue - α-(1-4)-linked L-guluronic acid
Glc – Glucose
GLDC - Glycine decarboxylase
GLUT1 - Glucose transporter 1
Grb-2 - Growth factor receptor-bound protein 2
HER- Human epidermal growth factor receptor
hESCs - Human embryonic stem cells
HGF - Hepatocyte growth factor
HGFR - Hepatocyte growth factor receptor
HIFα - Hypoxia-inducible factor, alpha subunit
HKII - Hexokinase 2
IARC - Agency for Research on Cancer
IDH1- Isocitrate dehydrogenase 1
IDH2 - Isocitrate dehydrogenase 2
IGF-1 - insulin-like growth factor 1
IGF-1R - insulin-like growth factor 1 (IGF-1) receptor
IgG – Immunoglobulin G
IL1- Interleukin1
kDa - Kilo Daltons
KRAS - Kirsten rat sarcoma viral oncogene homolog
Lac – Lactate
LDH - Lactate dehydrogenase

XXII
LDHA - Lactate dehydrogenase A
LDHcum – Lactate dehydrogenase cumulative
M - Molar
M residue - β-(1-4)-linked D-mannuronic acid
MAPK - Mitogen-activated protein kinase
MCL1 - Induced myeloid leukemia cell differentiation protein
MCP1 - Monocyte chemotactic protein 1
MCT4 - Monocarboxylate transporter-4
MET – Mesenchymal to epithelial transition
MET – Mesenchymal to epithelial transition
mL - Mililiter
mM – Milimolar
MMPs- Matrix metalloproteinases
mQ water – MiliQ water
MT – Astral microtubules
mTOR – Mechanistic or mammalian target of rapamycin (serine/threonine kinase)
MTs – Longitudinal microtubules
MUC4 – Mucin 4
MYC - V-myc avian myelocytomatosis viral oncogene homolog
NaCl – Sodium chloride
NADH - Dihydronicotinamide adenine dinucleotide
NASA - National Aeronautics and Space Administration
NFs – Normal fibroblasts
NSCLC – Non-small cell lung cancer
NT2 - NTera2/ cl. D1cell line
º C - Celsius degrees
P/S - Penicillin-streptomycin P53 – Tumour protein p53
pAKT – Phosphorilated protein kinase B
PBS - Phosphate-buffered saline
PSC – Pancreatic stem cells
PDGF - Platelet-derived growth factor
PFA -Paraformaldehyde
PFKFB3 - Phosphofructo-2-kinase/fructose-2,6-bisphosphatase 3
PGAM1 - Phosphoglycerate mutase I
PHGDH - Phosphoglycerate dehydrogenase
PI3K - Phosphatidylinositol-4,5-bisphosphate 3-kinase
PKM2 - Pyruvate kinase M2
poly-HEMA - Poly-2-hydroxyethylmethacrylate
PTEN- Phosphatase and tensin homolog, AKT - Protein Kinase B
qGlc – Specific glucose consumption rate
qLac – Specific lactate production rate
qMet – Specific metabolic rate
qRT-PCR - Quantitative real time polymerase chain reaction
RAF- Rapidly Accelerated Fibrosarcoma
RAS – Member of the small GTPase superfamily
RGD - Arginine–glycine–aspartic acid amino acid sequence
Rpm - Rotations per minute
RT - Room temperature
RTK - Receptor tyrosine kinase
SCLC – Small cell lung cancer
SD - Standard deviation
SDF1 - Stromal-cell-derived factor 1
SDH - Succinate dehydrogenase
SMA – Smooth-muscle actin
SOS - Son of Sevenless
STAT 3/5 - Signal transducer and activator of transcription
TCA cycle – Tricarboxylic acid cycle
TGF α- Tumour growth factor alpha

XXIII
TGF-β - Transforming growth factor-beta
THF – Tetrahydrofolate
TJ – Tight junctions
TKI - Tyrosine kinase inhibitors
TTBS - Tris-buffered saline with 0.1% (w/v) Tween 20
TX‐100 - Triton X‐100
Tyr-K - Tyrosine kinase
UP-MVG - Ultra Pure MVG alginate
VEGF - Vascular endothelial growth factor
w/ v - Weigh per volume
WB - Western blot
YLac/Glc - Yield actate/glucose
ZO-1 Zonnula occludens protein 1
αKG - α-ketoglutarate
μm - Micrometer
μM – Micromolar


Introduction


Introduction
3
1. I. Introduction
1.1. Lung cancer
Lungs are the organ responsible for bringing oxygen and releasing carbon dioxide
(CO2) to and from blood circulation in order to maintain the proper function of the cells. A
pair of lungs is located in the chest region on either side of the heart and ach lung is
composed of lobes. The left lung has two lobes and the right lung has three lobes (Warner,
2006). The bronchi are the two tubes that come from the trachea to the right and left lungs
(figure1.1). The bronchi split into bronchioles which, in turn, divide in tiny air sacs, called
alveoli.
Figure 1.1- Respiratory system. From: National Cancer Institute
(http://www.cancer.gov/cancertopics/types/lung).
Lung cancer is the leading cause of cancer-related mortality (Horn & Carbone, 2014;
Malvezzi, Bertuccio, Levi, La Vecchia, & Negri, 2013). European cancer mortality for lung
cancer in 2013 reported a continuing reduction in males, but a continuing increase in females
(Sculier, Meert, & Berghmans, 2014).In fact, mortality from lung cancer and breast cancers
are equivalent in females for the first time (Sculier et al., 2014). Despite progress, the overall
survival for lung cancer patients remains poor at 15%. This may be due to the fact that most
of the patients only have symptoms when the disease is already in an advanced stage (Mehta,

Introduction
4
Patel, & Sadikot, 2014). The main symptoms are coughing (including coughing blood), weight
loss, chest pain and breathing difficulties (Brenner et al., 2012). Therefore, it is extremely
important to improve better diagnosis and treatment techniques.
1.1.1. Risk factors
Cigarette consumption remains the leading risk factor for lung cancer development
and, therefore, smoking cessation is an important preventive strategy (Horn & Carbone,
2014; Miller, 2005). However, previous lung diseases such as emphysema, chronic bronchitis,
tuberculosis and pneumonia can influence lung cancer risk independently of tobacco use and
these diseases should be taken into consideration for assessing individual risk (Brenner et al.,
2012). In October 2013, the International Agency for Research on Cancer (IARC) classified
outdoor air pollution as carcinogenic to humans (Raaschou-Nielsen et al., 2013; Sculier et al.,
2014; W D Travis et al., 2011). Furthermore, lung cancer can also be hereditary (Mesquita et
al., 1997; Miller, 2005).
1.1.2. Types of lung cancer
There are two main types of lung cancer, non-small cell lung cancer (NSCLC) and
small cell lung cancer (SCLC), which arise from different epithelial cell types which
accumulate different genetic mutations (Herbst, Heymach, & Lippman, 2008; Sun et al.,
2012). For instance, NSCLC usually has mutation mainly in epidermal growth factor receptor
(EGFR) and Kirsten rat sarcoma viral oncogene homolog (KRAS) while SCLC commonly has
mutation in V-myc avian myelocytomatosis viral oncogene homolog (MYC), B-cell lymphoma
2 (BCL2) and tumour protein p53 (p53) (Herbst et al., 2008; Minna, 2012). All these genes
are either tumour suppressor genes, such as p53, or oncogenes, such as EGFR, KRAS, MYC
and BCL2 (Miller, 2005; Y. Zhong, Delgado, Gomez, Lee, & Perez-soler, 2001).
NSCLC is the most frequent type of lung cancer with almost 85% off all lung cancer
cases (Read, Page, Tierney, Piccirillo, & Govindan, 2004; X. Zhong & Rescorla, 2012).
Unfortunately, only 25% of all patients are diagnosed at an early stage (Hopper-Borge, 2014).
NSCLC include three major histologies: adenocarcinoma, large cell carcinoma and squamous
cell (epidermoid) carcinoma. Adenocarcinoma is the most common of these three. It starts
on peripheral lung tissue in opposition to large cell carcinoma and squamous cell carcinoma
that are more centrally located. In addition, adenocarcinoma develops from a particular type
of cell that produces mucin 4 (MUC4), which is a major constituent of mucus (Singh et al.,

Introduction
5
2006; Singh, Chaturvedi, & Batra, 2007). The second most common NSCLC is squamous cell
carcinoma, which appears in the large airways and it is characterized by flat cells. The large
cell carcinoma is characterized by large cells, presenting a higher volume of cytoplasm and
large nuclei and nucleoli (Popper, 2011).
SCLC corresponds to approximately 15% of all cases (Babakoohi, Fu, Yang, Linden, &
Dowlati, 2013; Rathi N. Pillai and Taofeek K. Owonikoko, 2014; Read et al., 2004). This
cancer type is characterized by cells that secrete neuroendocrines hormones , being more
prevalent in primary and secondary bronchi (Herbst et al., 2008; Rathi N. Pillai and Taofeek
K. Owonikoko, 2014).
SCLC has higher sensitivity to chemotherapy in a very early stage of disease comparing with
NSCLC in its. Despite this, patients usually suffer from the disease recurrence (Rathi N. Pillai
and Taofeek K. Owonikoko, 2014) since SCLC promotes metastasis in the beginning of the
disease (Babakoohi et al., 2013). Table I.1 summarizes the main types of lung cancer and its
pathologic features.
Table 1.I: Main types of lung cancer and their major characteristics
Lung
Cancer
Type
Lung
Cancer
Subtype
Main Characteristics
References
NS
CL
C
Adeno-
carcinoma
Location in the organ periphery;
Originated from small airway epithelial
and alveolar cells;
Most common type in patients who have
never smoked;
Ussually present EGFR mutations
(possible targeted therapy);
Tend to form glands and secrete mucins,
especially MUC4.
(Herbst et
al., 2008;
Llinares et
al., 2004;
Singh et al.,
2007)
Squamous
cell
Location in the organ centre and
periphery;
Strongly associated with cigarette
(Herbst et
al., 2008;

Introduction
6
1.1.3. Lung cancer treatment
Lung cancer treatment is based in four approaches: surgery, radiation therapy,
chemotherapy and targeted therapy. These strategies are described below and their use
depends on different factors, such as the type and stage of cancer as well the possible side
effects and the patient overall health (Coldren et al., 2006; Rowell & Williams, 2001; Sun et
al., 2012).
Surgery
Early-stage NSCLC is usually treated with a surgical resection (Myrdal, Gustafsson,
Lambe, Hörte, & Ståhle, 2001; Sculier et al., 2014). However, not every patient can handle
this procedure, because it is a very delicate surgery and there is a big risk of postoperative
complications. In patients with advanced stage and inoperable NSCLC other treatments,
such as the radiotherapy, chemotherapy and targeted therapy should be applied (Bradley et
al., 2004; Myrdal et al., 2001).
carcinoma smoking;
Arises from large airway epithelial cells;
Intrathoracic spread rather than distant
metastasis, therefore, best prognosis.
William D
Travis,
2011)
Large cell
carcinoma
Location in the organ periphery
Strongly associated with cigarette
smoking;
Grows and spreads quickly
(Popper,
2011; Sun et
al., 2012)
SC
LC
Small-cell
lung
carcinoma
Location in the centre;
Strongest smoking association;
Arises from pulmonary neuroendocrine
cells;
Rapid growth and early distant metastasis
(brain, liver, bone), leading to the disease
recurrence and worst prognosis;
Chemotherapy sensitivity only in early
stage
(Herbst et
al., 2008;
Sun et al.,
2012, Rathi
N. Pillai and
Taofeek K.
Owonikoko,
2014;)

Introduction
7
Radiotherapy and Chemotherapy
Radiotherapy involves the use of radiation, usually X-rays. There is a high rate of
treatment failure when using radiotherapy alone, being only efficient when the tumor is local
and small (less than 4 cm)(Bradley et al., 2004; Rowell & Williams, 2001; Timmerman et al.,
2006). Therefore, radiotherapy has a better result on the patient outcome when combined
with chemotherapy (Mehta et al., 2014; Sculier et al., 2014). If radiotherapy is applied in an
early stage of the disease it may aim to eliminate the cancer entirely. When applied in an
advanced stage, this treatment approach aims to decrease the size of the tumour and
control it for some time (Dosoretz et al., 1993; Gauden, Ramsay and Tripcony, 1995).
Doublet chemotherapy using platinum derivatives with another cytotoxic agent, such
as docetaxel is the standard first-line treatment for advanced NSCLC (Dearing, Sangal, &
Weiss, 2014; Sculier et al., 2014). It is usually combined with radiotherapy (Mehta et al.,
2014; Myrdal et al., 2001). However, many of the relapsing cancers gain chemotherapy
resistance, which contributes to the poor survival rate related to lung cancer. Even though
the cancer resistance mechanism has been extremely studied in vitro (Dearing et al., 2014;
Ma, 2012), the reasons for this process in vivo are not quite understood. Therefore, more
research must be done in this topic in order to improve chemotherapeutic methods already
used. Another disadvantage of the use of chemotherapy/radiotherapy is their side effects,
such as gastrointestinal distress, kidney and nerve damage and bone marrow suppression
(Mehta et al., 2014).
Targeted Therapy
Targeted therapy aims to use drugs or other substances to damage specifically the
malignant cells and not the normal cells (Ladanyi & Pao, 2008; Zhuang, Zhao, Zhao, Chang, &
Wang, 2014). There are different types of lung cancer which can be characterized by specific
molecular receptors or genes that are usually mutated in cancer cells, such as the EGFR and
anaplastic lymphoma kinase (ALK) (Ladanyi & Pao, 2008; Ma, 2012). Tyrosine kinase
inhibitors (TKI) are commonly used as a molecular targeted therapy included in the second
and third line of treatment regimen of NSCLC (Hopper-Borge, 2014; W D Travis et al.,
2011; Vasekar, Liu, Zheng, & Belani, 2014). Erlotinib and gefitinib are examples of TKI
already approved in Europe for the therapy of NSCLC (Ma, 2012; Zhuang et al., 2014). Their

Introduction
8
target is EGFR, which regulates cell proliferation, apoptosis, angiogenesis and tumour
invasion (figure 1.2). Crizotinib is another TKI approved in Europe that block the activity of
ALK, which play a role in cancer cell growth, metastasis and angiogenesis of 2 to 7% of
NSCLC (Ma, 2012; Shackelford, Vora, Mayhall, & Cotelingam, 2014). Other molecular
targets are being studied for the NSCLC treatment, such as human epidermal growth factor
receptor (HER) family of receptors, KRAS, Phosphatidylinositol-4,5-bisphosphate 3-kinase
(PI3K)/ protein kinase B (AKT)/ mammalian target of rapamycin (mTOR), PI3K/AKT/mTOR,
insulin-like growth factor 1 (IGF-1) receptor (IGF-1R) and hepatocyte growth factor
receptor (HGFR) (Zhuang et al., 2014). Consequently, it is important to perform a mutation
evaluation test in order to select the appropriate targeted therapy using the compound with
higher efficiency levels for that specific clinical setting.
Figure 1.2 - Scheme of the EGFR pathway. Erlotinib and gefitinib block the pathway at
kinase domain level (K). However, they are only effective if there is no other mutations downstream,
for instance at KRAS or BRAF level. Legend: EGF- Epidermal growth factor, EGFR- Epidermal
Growth Factor Receptor, TGF α- Tumour growth factor alpha, ERBB2- v-erb-b2 avian erythroblastic
leukemia viral oncogene homolog 2, PIK3- Phosphatidylinositol-4,5-bisphosphate 3-kinase, PTEN-
Phosphatase and tensin homolog, AKT - Protein Kinase B, mTOR- Mammalian target of rapamycin,
Grb-2 - Growth factor receptor-bound protein 2, STAT 3/5 - Signal transducer and activator of
transcription, SOS - Son of Sevenless is a set of genes encoding guanine nucleotide exchange factors,
RAS – member of the small GTPase superfamily , RAF- Rapidly Accelerated Fibrosarcoma, MAPK -
Mitogen-activated protein kinase. From (Ladanyi & Pao, 2008).
1.2. Epithelial to mesenchymal transition and metastasis
Although there has been progress in drug development and surgery in the last years,
treatment for lung cancer is not highly efficient due to metastasis and disease recurrence
(Xiao & He, 2010). These two events are related to cell modifications, including, function
gains and losses, such as the epithelial to mesenchymal transition (EMT). EMT, an
evolutionarily conserved process, is essential for the embryonic development and tumor
progression and it is enrolled in the metastasis, drug resistance and growth of many tumours
(Christiansen & Rajasekaran, 2006; J. M. Lee, Dedhar, Kalluri, & Thompson, 2006).

Introduction
9
A cascade of events involving several adhesion molecules is related with the metastic
process (Hanahan & Weinberg, 2011). Cells undergo a change in their phenotype, known as
EMT, which helps them to detach from the primary site and enter in the blood vessels
(figure 1.3). When in blood circulation, tumour cells can adhere to host cells or to other
tumour cells, which can possibly protect them from immune detection and the mechanical
force from blood flow (Xiao & He, 2010). This contributes to the progression of the tumour
and metastasis (Christiansen & Rajasekaran, 2006). In these two processes, the adhesive
characteristics are always changing, suggesting that they are dynamic mechanisms regarding
loss and gain of cell-cell adhesion.
Figure 1.3 – Epithelial to mesenchymal transition and metastasis. Cancer cells detach from
the primary tumour and the stroma, undergoing a phenotype modification. Then, these migrating and
invasive cells can invade the tissue around the primary tumour (a and b), enter the blood or
lymphatic circulation by penetrating the vessels (c), reach a distant organ or tissue, extravagate the
circulation (d) and might develop in a new microenvironment and generate a secondary tumour,
called metastasis (e), since they undergo a mesenchymal to epithelial transition, regaining some of the
cell adhesion features that they presented previously. Legend: EMT – Epithelial to mesenchymal
transition; MET – Mesenchymal to epithelial transition. From (Gout & Huot, 2008).
When cancer cells undergo EMT, they lose the epithelial phenotype, by losing
epithelial junction molecules such as E-cadherin or γ-catenin, while simultaneously expressing
mesenchymal markers such as fibronectin and vimentin (Z. Chen et al., 2012; Hopper-Borge,
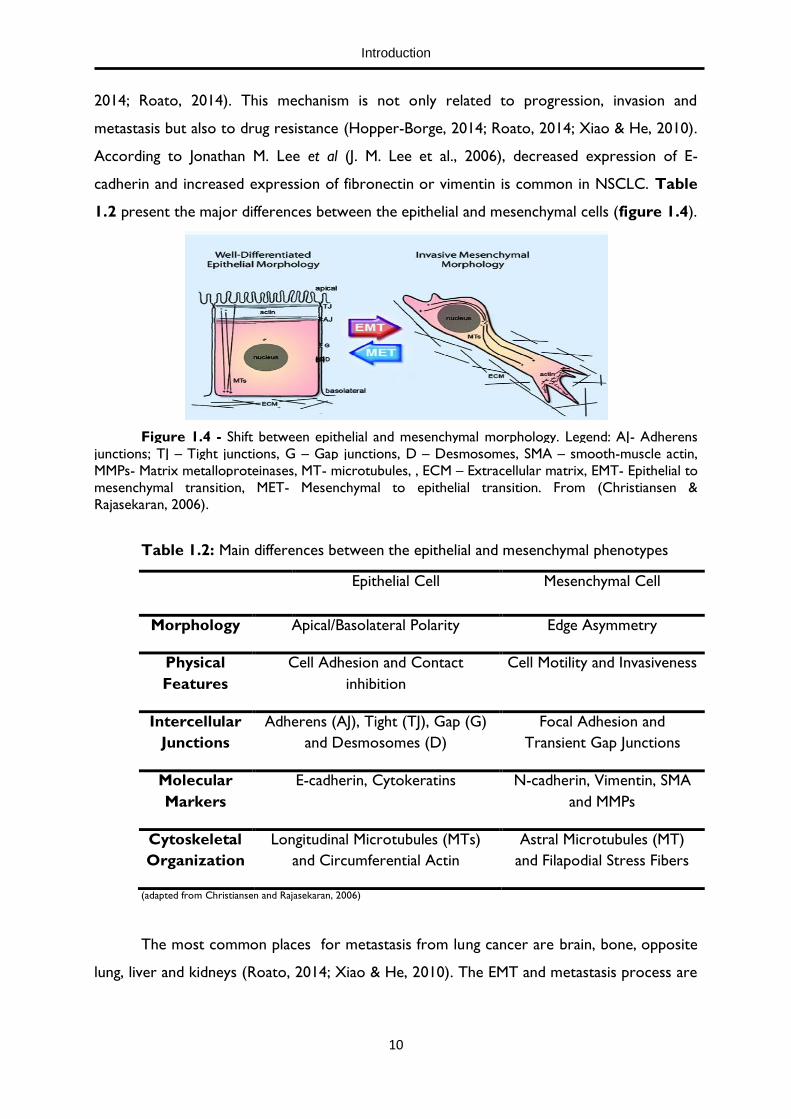
Introduction
10
2014; Roato, 2014). This mechanism is not only related to progression, invasion and
metastasis but also to drug resistance (Hopper-Borge, 2014; Roato, 2014; Xiao & He, 2010).
According to Jonathan M. Lee et al (J. M. Lee et al., 2006), decreased expression of E-
cadherin and increased expression of fibronectin or vimentin is common in NSCLC. Table
1.2 present the major differences between the epithelial and mesenchymal cells (figure 1.4).
Figure 1.4 - Shift between epithelial and mesenchymal morphology. Legend: AJ- Adherens
junctions; TJ – Tight junctions, G – Gap junctions, D – Desmosomes, SMA – smooth-muscle actin,
MMPs- Matrix metalloproteinases, MT- microtubules, , ECM – Extracellular matrix, EMT- Epithelial to
mesenchymal transition, MET- Mesenchymal to epithelial transition. From (Christiansen &
Rajasekaran, 2006).
Table 1.2: Main differences between the epithelial and mesenchymal phenotypes
Epithelial Cell Mesenchymal Cell
Morphology Apical/Basolateral Polarity Edge Asymmetry
Physical
Features
Cell Adhesion and Contact
inhibition
Cell Motility and Invasiveness
Intercellular
Junctions
Adherens (AJ), Tight (TJ), Gap (G)
and Desmosomes (D)
Focal Adhesion and
Transient Gap Junctions
Molecular
Markers
E-cadherin, Cytokeratins N-cadherin, Vimentin, SMA
and MMPs
Cytoskeletal
Organization
Longitudinal Microtubules (MTs)
and Circumferential Actin
Astral Microtubules (MT)
and Filapodial Stress Fibers
(adapted from Christiansen and Rajasekaran, 2006)
The most common places for metastasis from lung cancer are brain, bone, opposite
lung, liver and kidneys (Roato, 2014; Xiao & He, 2010). The EMT and metastasis process are

Introduction
11
caused by alterations not only in the cancer cells, but also in the cells surrounding the
tumour and in the tumour microenvironment (Fiaschi et al., 2012; Gout & Huot, 2008).
1.3. Tumour Microenvironment
Over the past decade, the reductionist view of a tumour as a group of homogeneous
cancer cells has been abandoned. Nowadays, a tumour is seen as a complex organ, including
a microenvironment composed by different types of cells and regions with different degrees
of vascularisation, inflammation, differentiation, proliferation and invasion (figure 1.5)
(Hanahan & Weinberg, 2011; Mueller & Fusenig, 2004). These cells change during tumour
progression, generating a sequence of tumour microenvironments that enables primary,
invasive, and then metastatic development. The neighbouring normal cells of the tumour also
likely affect the nature of the various neoplastic microenvironments (McMillin, Negri, &
Mitsiades, 2013). Cell function is influenced by multiple signals, including signals from other
cells and mechanical stimuli from extracellular matrix (ECM). In addition, the phenotype
modification and invasion of cancer cells are highly influenced by the surrounding
environment, because some characteristics such as the rigidity, porosity and structure may
probably establish concentration gradients of nutrients, growth factors, hormones and
oxygen levels to the cells according to the disease stage (Velasco, Tumarkin, & Kumacheva,
2012).
Figure 1.5 – Tumour microenvironment. Tumour heterogeneity arises from the existence
of different type of cells and components, including cancer cells, extracellular matrix, vascular
Introduction
12
endothelial, stromal and immune cells. These cells can have both pro- and anti-tumour effect and can
change their activity and localization within the tumour. From (Junttila & de Sauvage, 2013).
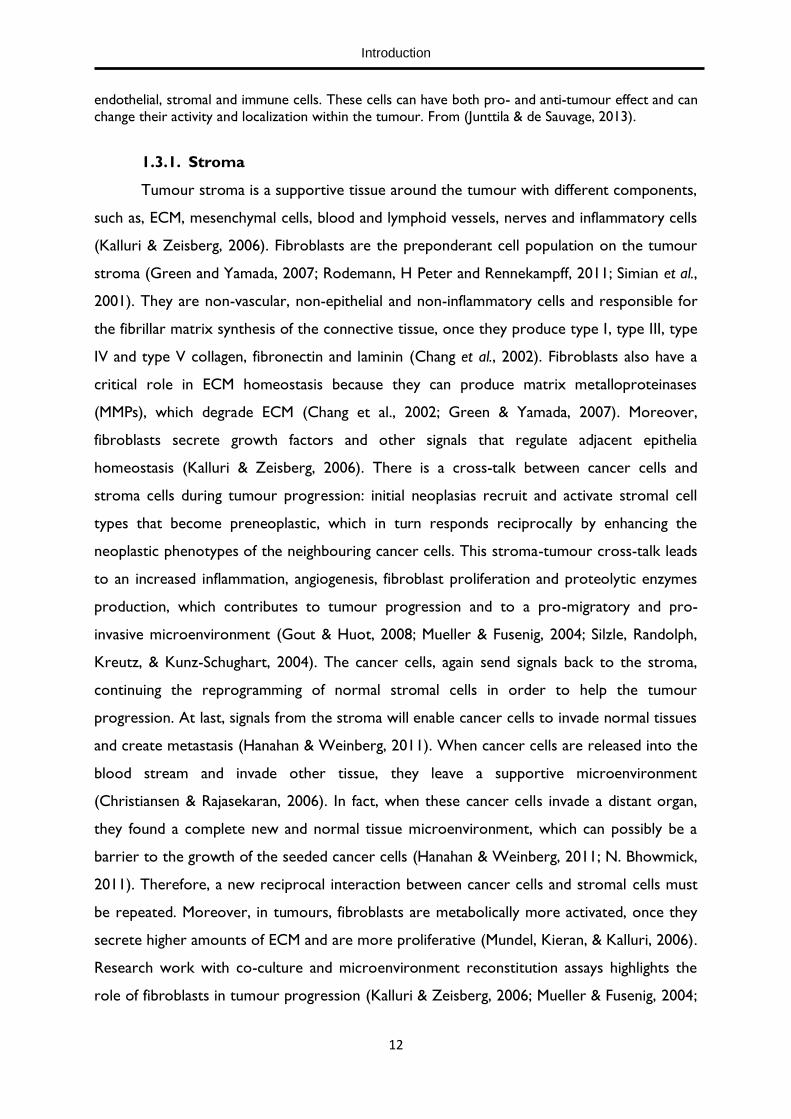
1.3.1. Stroma
Tumour stroma is a supportive tissue around the tumour with different components,
such as, ECM, mesenchymal cells, blood and lymphoid vessels, nerves and inflammatory cells
(Kalluri & Zeisberg, 2006). Fibroblasts are the preponderant cell population on the tumour
stroma (Green and Yamada, 2007; Rodemann, H Peter and Rennekampff, 2011; Simian et al.,
2001). They are non-vascular, non-epithelial and non-inflammatory cells and responsible for
the fibrillar matrix synthesis of the connective tissue, once they produce type I, type III, type
IV and type V collagen, fibronectin and laminin (Chang et al., 2002). Fibroblasts also have a
critical role in ECM homeostasis because they can produce matrix metalloproteinases
(MMPs), which degrade ECM (Chang et al., 2002; Green & Yamada, 2007). Moreover,
fibroblasts secrete growth factors and other signals that regulate adjacent epithelia
homeostasis (Kalluri & Zeisberg, 2006). There is a cross-talk between cancer cells and
stroma cells during tumour progression: initial neoplasias recruit and activate stromal cell
types that become preneoplastic, which in turn responds reciprocally by enhancing the
neoplastic phenotypes of the neighbouring cancer cells. This stroma-tumour cross-talk leads
to an increased inflammation, angiogenesis, fibroblast proliferation and proteolytic enzymes
production, which contributes to tumour progression and to a pro-migratory and pro-
invasive microenvironment (Gout & Huot, 2008; Mueller & Fusenig, 2004; Silzle, Randolph,
Kreutz, & Kunz-Schughart, 2004). The cancer cells, again send signals back to the stroma,
continuing the reprogramming of normal stromal cells in order to help the tumour
progression. At last, signals from the stroma will enable cancer cells to invade normal tissues
and create metastasis (Hanahan & Weinberg, 2011). When cancer cells are released into the
blood stream and invade other tissue, they leave a supportive microenvironment
(Christiansen & Rajasekaran, 2006). In fact, when these cancer cells invade a distant organ,
they found a complete new and normal tissue microenvironment, which can possibly be a
barrier to the growth of the seeded cancer cells (Hanahan & Weinberg, 2011; N. Bhowmick,
2011). Therefore, a new reciprocal interaction between cancer cells and stromal cells must
be repeated. Moreover, in tumours, fibroblasts are metabolically more activated, once they
secrete higher amounts of ECM and are more proliferative (Mundel, Kieran, & Kalluri, 2006).
Research work with co-culture and microenvironment reconstitution assays highlights the
role of fibroblasts in tumour progression (Kalluri & Zeisberg, 2006; Mueller & Fusenig, 2004;

Introduction
13
H Peter Rodemann & Rennekampff, 2011; Silzle et al., 2004). Moreover, activated fibroblasts
produce ECM rich in fibronectin and type I collagen, which contributes to tumour
angiogenesis (Chang et al., 2002). These activated fibroblasts existing in tumour stroma are
also known as cancer-associated fibroblasts (CAF). The signals and mechanisms of
transformation of a normal fibroblasts to a CAF are not completely understood (Fiaschi et
al., 2012; Kalluri & Zeisberg, 2006; Peng et al., 2013). It is known that cancer cells secrete
several molecules to the tumour stroma, such as transforming growth factor beta (TGF-β),
platelet-derived growth factor (PDGF) and fibroblast growth factor 2 (FGF2), which are
mediators of fibroblasts activation (figure 1.6).
Figure 1.6 – Transition of a normal fibroblast to a cancer associated fibroblast (CAF). a -
The fibrillar ECM is mostly constituted by type I collagen and fibronectin. There are interactions
between the fibroblasts and the microenvironment through α1ß1 integrin. Normal fibroblasts have a
fusiform appearance and an actin and vimentin filaments and they also express fibroblast-specific
protein 1 (FSP1). b- Activated fibroblasts are more proliferative and secrete more ECM proteins,
such as type I collagen, tenascin C and fibronectin containing the extra domain A (EDA-fibronectin).
They also express α-SMA. From (Kalluri & Zeisberg, 2006).
Fibroblasts interact with cancer, epithelial, endothelial, inflammatory cell and
perycites through the secretion of certain molecules (Mueller & Fusenig, 2004). This
contributes to the modification of the microenvironment and increases oncogenic signals,
which is likely to increase cancer progression (figure 1.7) (Kalluri & Zeisberg, 2006).

Introduction
14
Figure 1.7- Action of activated fibroblast in the tumour microenvironment. Legend:
Monocyte chemotactic protein 1 (MCP1); interleukin1(IL1); matrix metalloproteinases (MMPs);
vascular endothelial growth factor (VEGF); transforming growth factor-beta (TGF-β); hepatocyte
growth factor (HGF); stromal-cell-derived factor 1 (SDF1). From (Kalluri & Zeisberg, 2006).
In addition, CAFs mediate EMT of cancer cells, contributing to the progression of
cancer, because many of the exogenous signals for EMT are derived from CAFs, such as
MMPs, integrins and members of the TGF-β superfamily of proteins (Mueller & Fusenig,
2004; N. Bhowmick, 2011). TGF-β signalling is particularly striking for the analysis of cancer
progression as at early stages it possible acts as a tumour suppressor. However, during
advanced stages of cancer, TGF-β signalling promotes cancer progression and metastasis
(Mueller & Fusenig, 2004). This means that the anti-proliferative effect of TGF-β is gradually
lost while it facilitates EMT of cancer cells, along the progression of the disease (Siegel &
Massagué, 2003). Therefore, there are evidences that support the protective action of the
fibroblasts at an early stage of cancer progression. Moreover, fibroblasts produce immune-
modulatory cytokines, such as interferon-γ, interleukin-6 and tumour-necrosis factor-α,
which recruit cytotoxic T lymphocytes, natural killer cells and macrophages, that help to
fight tumour progression at the beginning, before the tumour-stroma crosstalk (Silzle et al.,
2004). Additionally, the tumour-stroma crosstalk includes mutual metabolic reprogramming,
responsible for the alterations on glucose uptake, for example. Therefore, it is extremely
important to understand the effect of stroma cells on tumour progression and cancer cells
metabolism.
1.4. Cancer cell metabolism
Glucose is one of the main nutrients to ensure cell viability, function and
proliferation, since it is a carbon and energy source. In a normal epithelial cell, glucose can
enter different metabolic pathways leading, for instance, to pyruvate production, CO2

Introduction
15
oxidation and aminoacids synthesis (Su et al., 2010). However energy metabolism alteration
is very characteristic of cancer cells (Daye & Wellen, 2012; Hanahan & Weinberg, 2011; Hsu
& Sabatini, 2008). This aspect was first reported by Otto Warburg (1926, 1956). It is one of
the main characteristics of cancer cells, known as Warburg effect (Hanahan & Weinberg,
2011). He noticed that tumour cells, unlike normal cells, reprogram their glucose
metabolism, even in presence of oxygen, using aerobic glycolysis with reduced mitochondrial
oxidative phosphorylation (Hsu & Sabatini, 2008; Otto Warburg, Franz Wind, 1926). The
reason is that increased glycolysis enables glycolytic intermediates to enter into various
biosynthetic pathways. This promotes the biosynthesis of macromolecules and organelles
essentials to support the large-scale biosynthetic pathways that are required for active cell
proliferation, as reviewed by Hsu (Hsu & Sabatini, 2008). Consequently, glucose is
metabolized via glycolysis and produces lactate by lactate dehydrogenase (figure 1.8).
Cancer cells are reported to be adapted to high levels of lactate (Kato et al., 2013; Pértega-
Gomes et al., 2014).
Figure 1.8 – Cancer cell metabolism pathways. Quiescent cells metabolize glucose,
glutamine and fatty acids for CO2 oxidation through tricarboxylic acid (TCA) cycle . NADH and
FADH2 are electrons carriers that will produce higher levels of energy through ATP synthesis in the
mitochondrial electron transport chain. This way, quiescent cells efficiently convert the nutrients into
energy to maintain cellular functions. On the other hand, rapidly proliferating cells need to generate
all the proteins, lipids and nucleic acids essential to cellular division. In consequence, cancer cells have
CO2

Introduction
16
a higher glucose and glutamine uptake, because they are the main nutrients to support cell growth.
Glutamine catabolism constantly provides nutrients into the TCA cycle. This is important to preserve
the TCA cycle function because there is a constant efflux of metabolites to support cell proliferation.
Legend: 2HG, 2-hydroxyglutarate; αKG, alpha-ketoglutarate; ACL, ATP-citrate lyase; ATP, adenosine
triphosphate; F-2,6-bisP, fructose 2,6-bisphosphate; FAS, fatty acid synthase; FH, fumarate hydratase;
*GLDC, glycine decarboxylase. Note that this reaction occurs in the mitochondrion; HIFα, hypoxia-
inducible factor, alpha subunit; HKII, hexokinase 2; IDH1, isocitrate dehydrogenase 1; IDH2,
isocitrate dehydrogenase 2; LDHA, lactate dehydrogenase A; mTOR, mechanistic target of
rapamycin; PFKFB3, phosphofructo-2-kinase/fructose-2,6-bisphosphatase3;PGAM1, phosphoglycerate
mutase 1; PHGDH, phosphoglycerate dehydrogenase; PI3K,phosphatidylinositol-4,5-bisphosphate 3-
kinase ; PKM2, pyruvate kinase M2; RTK, receptor tyrosine kinase; SDH, succinate dehydrogenase;
THF, tetrahydrofolate; Tyr-K, tyrosine kinase. Adapted from (Finley, Zhang, Ye, Ward, & Thompson,
2013)
Glutamine is the major nitrogen source of mammalian cells and an alternative energy
and carbon source to glucose (H. J. Cruz, Ferreira, Freitas, Moreira, & Carrondo, 1999;
Eagle, Washington, Cohen, & Levy, 1966). Therefore, glutamine is important for nitrogen
metabolism, enabling the aminoacids synthesis, and acting as substrate for the TCA cycle.
The cells uptake the glutamine and it is metabolized to glutamate in the cytoplasm through
glutaminase activity. Glutamate is then converted into alpha-ketoglutarate (αKG) by losing
the amino group, as NH4+, via deamination. The αKG is incorporated directly in the TCA
cycle (Newsholme et al., 2003). This leads to ammonium accumulation, which can be toxic
for cells and even inhibit their growth, due to intracellular pH decrease, inhibition of certain
enzymes in several metabolic pathways and to cellular ionic gradients alterations (H. Cruz,
Freitas, Alves, Moreira, & Carrondo, 2000; Schneider, Schütz, John, & Heinzle, 2010). There
are strategies to decrease the ammonium concentration in the cell culture medium such as
using dipeptides such as L-alanil-L-glutamine in the cell culture medium, that allow a slow
rate glutamine degradation and consequently a decrease in ammonium production (Christie
& Butler, 1994). Lactate is mainly produced from glucose metabolism, but can also be
produced in small amounts from glutamine through its conversion to glutamate which, in
turn, is incorporated in TCA cycle and is converted to malate that can ultimately be
metabolized to pyruvate. This one leads to lactate production though lactate dehydrogenase
A (LDHA) (Zielke, Sumbilla, Sevdalian, Hawkins, & Ozand, 1980).
1.4.1. Tumour-stroma metabolic crosstalk
The reciprocal metabolic interplay between stroma and cancer cells suggests that
CAFs also undergo Warburg effect and mitochondrial oxidative stress (Al, 2010; Fiaschi et
al., 2012). Fiaschi et al. observed that intercellular contact between cancer cells and stroma

Introduction
17
cells activated the stromal fibroblasts, which increased its glucose transporter 1 (GLUT1)
expression, lactate production and lactate extrusion by monocarboxylate transporter-4
(MCT4) overexpression (Fiaschi et al., 2012). On the other hand, cancer cells had a higher
lactate uptake to promote anabolic pathways and, consequently, cell growth. Hence, cancer
cells promoted Warburg metabolism to their transformed CAFs, exploiting their
byproducts, such as the lactate, in order to grow in a low glucose environment, using the
lactate for TCA cycle and protein synthesis. This mechanism is an example of alternative
strategies performed by plastic cancer cells, as these cells can either use Warburg
metabolism in high glucose environment, but shift to reverse Warburg metabolism upon
CAFs contact, if hypoxic/ischemic conditions lead to glucose starvation (Al, 2010; Pértega-
Gomes et al., 2014). Drugs targeting Warburg metabolism should take into consideration the
multiple adaptations exploited by cancer cells, due to crosstalk with its stroma.
Therefore, developing new therapeutic strategies focusing on stromal cells such as
CAFs seems to be an important step in cancer disease. The suitable therapeutic molecule
should eliminate the cancer promoting characteristics but retain the tumour suppressor
ones. One big advantage of targeting stroma is that these cells are not so genetically unstable
as cancer cells and, consequently, do not develop drug resistance so easily (Mueller &
Fusenig, 2004).
1.5. Need for new cellular models for pre-clinical research
The structure, development and functionality of a tumour is very complex because of
the variety of interactions between different cell types presented in the tumour and its
microenvironment (figure 1.5), including ECM, mesenchymal cells, blood and lymphoid
vessels, nerves and inflammatory cells (Mundel et al., 2006). As it was described before,
there are different treatment approaches for lung cancer. However, they only provide a
maximum of 5 year overall survival (Horn & Carbone, 2014; William D Travis, 2011).
Consequently, the need for alternative therapies for lung cancer is urgent, as well as a better
understand of the mechanisms underlying molecular pathways that can be potential
therapeutic targets, such as the ones presented in figure 1.9. For instance, the sustaining
proliferative signalling and the evasion to growth suppressor factors enable cancer cells to
growth faster (Bailón-Moscoso, Romero-Benavides, & Ostrosky-Wegman, 2014). The signals
behind these two mechanisms also influence cell survival and energy metabolism (Hanahan &
Weinberg, 2011). Cells develop resistance to cell death by the expression of anti-apoptotic

Introduction
18
proteins, such as the BCL2 protein family and undergo by an alteration in energy
metabolism, becoming more glycolytic (Hsu & Sabatini, 2008). This means that cancer cells
generate most of their ATP (adenosine triphosphate) via glycolysis, even under aerobic
conditions, consuming high amounts of glucose and producing much more lactate that non
transformed cells (Hsu & Sabatini, 2008; Otto Warburg, Franz Wind, 1926). This aspect is
known as the Warburg effect. Consequently, cancer cells need more nutrients to supply the
high amount of energy they need. Therefore, there are signals that stimulate the formation
of new vessels, such as the vascular endothelial growth factor (VEGF), which promotes
angiogenesis (Alevizakos, Kaltsas, & Syrigos, 2013; Bailón-Moscoso et al., 2014; Lammers &
Horn, 2013). EMT, another alteration in cancer cells mentioned above, regulates invasion
and metastasis (Christiansen & Rajasekaran, 2006; J. M. Lee et al., 2006; Xiao & He, 2010).
An additional factor that contributes for the tumour progression is its evasion to immune
destruction, in particular by T and B lymphocytes, macrophages, and natural killer cells
(Grosso & Jure-Kunkel, 2013; Hanahan & Weinberg, 2011). Genomic instability and genetic
alterations are an extremely important mechanisms underlying tumour progression (Choi et
al., 2010; Hanahan & Weinberg, 2011; W. Lee et al., 2010; Ma, 2012). Moreover, although
inflammation occurs by innate immune cells to fight infection and heal wounds, in the
microenvironment of a tumor and due to the tumor-stroma cross-talk, it has a tumour
supporting effect (Landskron, De la Fuente, Thuwajit, Thuwajit, & Hermoso, 2014). So, all
these mechanisms contribute for tumor progression and drug resistance, hence the need for
a better comprehension of all these interacting phenomena. Nevertheless, the finding of new
therapeutic targets and compounds implies their complete safety and nontoxicity for normal
cells. This leads to the urgency in developing new testing strategies to identify anti-cancer
agents faster, with more reliability and respect for animal welfare, in order to generate tests
with higher high-throughput that can provide a more efficient treatment with the minimal
side effects (Breslin & O’Driscoll, 2013). Therefore, it is extremely important to develop
experimental model systems to validate putative driver lesions and to gain insight into their
mechanisms of action.

Introduction
19
Figure 1.9 – Hallmarks of cancer. It is urgent to understand these mechanisms and to test
potential drugs in the proper cellular models before its use in clinical trials. Adapted from (Hanahan
& Weinberg, 2011).
1.6. Cancer preclinical models
1.6.1. The drug discovery cascade
There are several steps in order to successfully develop a new compound/drug. First,
a therapeutic target needs to be found and then lead compounds are designed, developed
and optimized for that specific target. After this, in vitro and in vivo tests are performed to
evaluate toxicity, pharmacokinetic, absorption, distribution, metabolism and excretion
properties. In vitro tests are performed using cell lines and in vivo tests using animal models,
which are fundamental to determine the safety and potential usefulness of the drug. Finally,
clinical trials are performed in humans to test the most effective compounds through various
stages until the drug is shown to be safe and proved to have a sufficient level of efficacy to be
commercialized (figure 1.10) (Breslin & O’Driscoll, 2013). Although a lot of compounds are
being study, only 10% of them pass throughout clinical development (Hait, 2010; Hughes,
Rees, Kalindjian, & Philpott, 2011).

Introduction
20
Figure 1.10 – Drug discovery cascade. Developing a new medicine takes an average of 10 to
15 years. Source: based on PhRMA profile Pharmaceutical Industry 2014.
Due to the fact that the development and evaluation of a new drug is very expensive
and takes several years to take place and that a lot of anti-cancer drugs fail in clinical trials
(the phase of drug development with higher costs), it is urgent to eliminate the ineffective
and unsafe compounds as early as possible (Hughes et al., 2011). The ideal would be to do
this before clinical trials, and, preferably, even before animal testing. These animal
experiments cannot be dismissed during the drug development process. However, the
results from the animal models should be carefully analysed in order to predict the
magnitude of drug response in humans because some adverse reactions in humans do not
happen during preclinical safety tests (Iwamoto, Distler, & Distler, 2011). This is due to the
morphological and functional differences between animals and humans, including differences
in protein expression, cell signalling pathways, responses to stimuli and affinity for ligands
(Benien & Swami, 2014). All these issues support the requirement for better human cell
model systems.
Consequently, it is crucial to improve in vitro cell models for drug testing in order to make a
better choice of the right candidate drug and, as a result, to spare the cost of the
development of drugs that will end to not have efficacy and safety (Breslin & O’Driscoll,
2013). Moreover, better in vitro cell models would also help to better understand the disease
and to predict the best diagnostic, prognostic and/or treatment for each case. All of these
evidence lead to the conclusion that is necessary to improve the cellular models used in
cancer research in order to include the tumour three-dimensional organization,

Introduction
21
heterogeneity and tumour-stroma crosstalk, resembling the heterogeneous expression of
certain genetic markers by the different type of cells. Animal models are the most similar
approaches to this theory, but there are some ethical and economical concerns related to
the extrapolation from the animal studies to the human beings (Lilienblum et al., 2008).
Monoculture cellular models, using only one type of cell, were extensively used. However, it
is already proved that the tumour associated stroma influences cancer progression.
Therefore, culturing cancer cells with other types of cells, such as fibroblasts, in co-culture
cellular models would better mimic the in vivo situation and allow a better understanding of
the tumour molecular mechanisms, (Amann et al., 2014; Breslin & O’Driscoll, 2013; Green &
Yamada, 2007; H P Rodemann & Bamberg, 1995).
1.6.2. 2-Dimensional versus 3-Dimensional cell models
The conventional method for cell culture is to grow cells in monolayer, which is
commonly used as system to analyze, for example, if a certain molecule is safe and effective
as a therapeutic drug. Nevertheless solid tumours do not grow in 2-dimensions (2D), but
instead in 3-dimensions (3D). ECM interactions are essential for cell differentiation,
proliferation and cell survival in vivo and are better recapitulated in 3D cultures rather than
in 2D monolayers. Furthermore, differences in cell morphology, polarity, receptor
expression, oncogene expression and overall cellular architecture were noticed between
cells grown as 2D monolayer and what is observed in vivo (Amann et al., 2014; Bechyne,
Szpak, Madeja, & Czyż, 2012; Carterson, Ho, Ott, Clarke, & Pierson, 2005; Yu Zhao et al.,
2014). Therefore, despite the easy manipulation, monitoring and characterization being
advantages of the 2D culture systems, they have serious limitations related to spatial
environment, structural architecture, comparability with in vivo systems and increased drug
sensitivity because cells have a higher surface area exposure (J. Bin Kim, 2005; Pampaloni,
Reynaud, & Stelzer, 2007). Consequently, 2D cellular models are not the most reliable
system to select a candidate target or compound in pre-clinical research since cells in 2D
structure lack many characteristics of an in vivo system.
Therefore, the need for cell models that mimic the environment within the target
tissue, in order to produce reliable biomedical relevant results, is pushing researchers to try
to develop alternative methods to 2D cell culture.
Multicellular tumour aggregates have been used as a 3D cancer cell model to
investigate some aspects of tumour biology since the 1940’s with the pioneer work of
Holtfreter (Beetschen, 2001; Holtfreter, 1944), in which the researchers developed

Introduction
22
aggregates of the three germ layers (mesoderm, endoderm and ectoderm) in order to study
the gastrulation movements in amphibian embryos. However, multicellular spheroids only
gained more attention after the research of Sutherland and co-workers (Sutherland,
McCredie, & Inch, 1971) in the 1970s, in which the researchers observed a high similarity
between aggregates of chinese hamster V79 lung cells and carcinoma from several patients.
The authors observed an outer zone of the aggregates with many dividing cells, an
intermediate area with less nutrients and oxygen that contained few dividing cells and an
inner mass of necrosis (figure 1.11). This zonal morphological and functional distribution is
also observed in a carcinoma (H. Chen et al., 2014; Hashimoto et al., 2012; Moreira, Alves,
Aunins, & Carrondo, 1995; Walenta et al., 2001). Therefore, aggregates started to be used
because they were a useful in vitro cell model to evaluate aspects of tumour biology, such as
the diffusion and effects of nutrients and oxygen on tumour growth.
Figure 1.11 - Morphological and functional cellular distribution in a tumour. The scheme
represents the usual structure of solid tumours representing the acidic front, the outer most
vascularised surface, the hypoxic region and the necrotic core. This distribution is related with
oxygen, nutrients and metabolites gradients within the solid tumour.
Adapted from http://www.bme.umich.edu/labs/centlab/research/overview.php.
So far, the best in vivo mimicking cell-based method is the 3D cell culture and it can
be seen as a useful “bridge” between monolayer cultures and animal models. The co-culture
of different types of cells using the 3D culture for the production of aggregates allows that
the organization of heterogeneous cell populations and their growth pattern resemble the
initial and avascular phase of solid tumours in vivo, not-yet-vascularized micrometastasis or
intercapillary tumor microsites (Kelm et al., 2003). Therefore, it is urgent to develop 3D cell
models and optimize the already existing methods.

Introduction
23
There are several methods to generate a 3D cell culture. Some of them are
described below.
1.6.3. 3D static cell culture methods
Forced-floating method
This method consists in avoiding cell attachment to the vessel surface, by chemical
modification with polymers such as 0.5% poly-2-hydroxyethylmethacrylate (poly-HEMA)
(Ivascu & Kubbies, 2006) or using 1.5% agarose (Friedrich, Seidel, Ebner, & Kunz-Schughart,
2009; Ivascu & Kubbies, 2006). This surface treatment prevents cells from attaching, thus
resulting in forced-floating cells and then cells are induced to aggregate through a
centrifugation step (figure 1.12). This method is advantageous because it is simple and
generally reproducible, since it is usually done in multi-well plates, which also allows the
seeding of the same number of cells into each well. In addition, the number of cells can easily
regulate the size of the spheroids. For instance, if more cells are seeded, larger spheroids
can be generated. Furthermore, forced-floating method using 96-well plates are very useful
for high-throughput drug testing, because the spheroids can be easily accessible and it is
possible to reproduce homogeneous spheroids in the 96-well plates. Nevertheless, there are
also some drawbacks related to this method, such as the time and work spent to do the
coating solutions and coating the plates before cell seeding and the difficulty to do the scale-
up. The alternative is to buy low attachment plates (precoated plates) commercially
accessible but this increases the cost of the method (Morizane, Doi, Kikuchi, Nishimura, &
Takahashi, 2011). Moreover, medium exchange without disturbing the aggregate is difficult.
Figure 1.12 – Forced-floating method. Adapted from (Breslin & O’Driscoll, 2013).
Hanging drop method
Hanging drop method allows the formation of aggregates by growing a small drop of
cellular suspension hanging on a glass cover slip that is inverted on a culture well (Amann et
al., 2014; Fennema, Rivron, Rouwkema, van Blitterswijk, & de Boer, 2013; Kelm, Timmins,

Introduction
24
Brown, Fussenegger, & Nielsen, 2003). The cell suspension become hanging drops and the
surface tension caused by the gravitic force makes them to be kept in place while the cells
accumulate at the bottom of the drop (Amann et al., 2014). They stay at the air-liquid
interface and can proliferate (figure 1.13). The size of spheroids can be regulated depending
on the cell density of the seeding suspension. This is one of the advantages of this technique
since it is possible to produce aggregates with well-controlled size in a fast and simple way.
Another advantage is that the plates do not need to be coated with substrates as required in
the technique described above (figure 1.11). However, the volume of the liquid drop is
limited and that turns out to be a drawback of this technique, as the surface tension does
not hold higher volumes. Another drawback is the difficulty in changing the cell culture
medium without perturbing the spheroid (Tung et al., 2011). In addition, this method is
labour intensive, not suitable for scale-up and high-throughput drug screening because it is
difficult to handle the established spheroids without damaging them (Benien & Swami, 2014).
Figure 1.13 – Hanging drop method. First, the cell suspension is dispensed with a pipette
and the surface with the cellular drop is inverted. The cellular suspension sticks to the hydrophilic
part, forming a hanging drop. Then, single cells start to aggregate and can eventually form a single
spheroid. Adapted from (Benien & Swami, 2014).
Matrices
Cell-cell and cell-ECM interactions are extremely important to generate a 3D
structure as they will determine cell polarization, function, differentiation and morphology
(Akhtar & Streuli, 2013; Casey et al., 2001; X. Zhong & Rescorla, 2012),. In consequence, the
use of matrices that can mimic the signals from neighbouring cells or from the basal
membrane is a good strategy to develop aggregates, because it would enable cells to
organize themselves as in an in vivo environment (Alcaraz, Nelson, & Bissell, 2004). In this
method, cells can be embedded and grown within the matrice or they can be cultured in top
of it (Sodunke et al., 2007) (figure 1.14). Several materials, such as collagen, alginate and
matrigel, have been used in 3D cell culture in order to mimic ECM characteristics, These
materials have the advantage to maintain the 3D structure and they have been used to study
intercellular interactions, cellular migration, invasion and tumour biology (J. Bin Kim, 2005).

Introduction
25
Figure 1.14 – 3D cell culture method based on Matrigel. Matrigel is one example of matrix,
in which is possible to generate 3D cell structures, such as the mammary acini. Cells can be seeded
within the gel or on its top. Aggregates can have different sizes due to different cell proliferation
rates. From Sodunke et al., 2007.
However, there are some drawbacks related to this method, because the ECM used is
usually of biological origin and, therefore, there are differences in its composition according
to the batch. In addition, some more complex ECM materials do not have a defined
composition. Another issue to be taking into account in large-scale production of 3D
spheroids is the cost of the matrix (Sodunke et al., 2007). Moreover, it is difficult to control
the size of the spheroids because cells are randomly seeded within or in the top of the gel
and may proliferate at different rates, producing aggregates with different sizes (figure
1.14). In consequence, cell culture may not be homogeneous for drug testing (Vinci et al.,
2012). Additionally, they cannot mimic the mass transport gradient that exists in the tumour
microenvironment (Benien & Swami, 2014)
Scaffolds
Several types of scaffolds are already used for 3D cell culture, such as gels (Justice,
Badr and Felder, 2009; Santo et al., 2009). Shape, cell adhesion sites and a good diffusion of
gases, nutrients and metabolites have to be considered when choosing the type of scaffold.
For instance, the choice to use the scaffold with a fiber-like shape is a convenient strategy to
enhance cell migration and matrix colonization, thus producing a more in vivo-like construct.
(Justice et al., 2009; Yu Zhao et al., 2014). Furthermore, some of these models can have
incorporated some signalling molecules, such as hormones or growth factors that contribute
for the proliferation and organization of the cells in that scaffold (figure 1.15). To better
mimic the in vivo microenvironment, sometimes a spatial and temporal coordination of
multiple factors is demanded (Santo, et al., 2009). Scaffolds can provide biomechanical and
biochemical support by presenting the appropriate mediators to the surrounding tissue.

Introduction
26
There are several strategies to control the spatial and temporal release of growth factors
from the scaffold (figure 1.15)
Figure 1.15 - Strategies to promote the release of multiple bioactive factors from a scaffold.
A) The signalling molecules are physically dispersed in the scaffold. And they are released in a fast and
uncontrolled way; B) Bioactive factors are released simultaneously; C) Bioactive factors are released
sequentially; D) Bioactive molecules have a spatiotemporal controlled release due to conjugation
with ligands or because they are covalently bound to the scaffold. E) Nanoparticles can be
incorporated inside microparticles within the scaffold promoting different release rates. F)
Development of gradients of bioactive factors. From (Santo, Mano and Reis, 2013).
Employing a scaffold material is one of the strategies to create a 3D tissue structure in
vitro because these scaffolds can provide a synthetic ECM with an appropriate template for
the acquisition of a three-dimensional cellular architecture and gives essential stimuli to cell
growth and tissue formation. Hydrogels, a type of highly hydrated polymer materials, such as
chitosan and alginate-based hydrogels, are being used as scaffolds materials due to its
biocompatibility, tissue-like properties, namely mechanical properties, nutrients and oxygen
diffusion, cell motility and aqueous environment, resembling the tissue environment (Drury
& Mooney, 2003; Glicklis, Shapiro, Agbaria, Merchuk, & Cohen, 2000; Yu Zhao et al., 2014).
Crosslink between polymer chains by various chemical bonds and physical interactions
determines the structural integrity of hydrogels. Moreover, cells cannot adhere immediately
to the hydrogels because they do not have receptors to hydrogel forming polymers. To
overcome this limitation of using hydrogels in cell culture, a peptide sequence capable of
binding to cellular receptors, such as the amino acid sequence arginine–glycine–aspartic acid
(Arg–Gly–Asp or RGD), can be covalently coupled to the polymer, (Drury & Mooney, 2003;
El-sherbiny & Yacoub, 2013). This sequence is derived from numerous ECM proteins
including fibronectin, laminin, vitronectin, and collagen (Drury & Mooney, 2003). Alginate is
an example of a polymer used to form hydrogels. It is a natural polysaccharide extracted
from the brown seaweed (Phaeophyceae) (Burey, Bhandari, Howes, & Gidley, 2008).
Alginate is a linear polymer composed of β-(1-4)-linked D-mannuronic acid (M) and α-(1-4)-
linked L-guluronic acid (G) residues (figure 1.16), which gels due to the coordination of

Introduction
27
divalent ions to the carboxylic acid groups of α - L -guluronic acid units (Velasco et al., 2012).
Varying the ratio of M/G monomers, modifies the crosslink density and, in consequence, the
mechanical characteristics and pore size of the gel (Drury & Mooney, 2003).
Figure 1.16 – M/G residues that constitute the alginate. From (Burey et al., 2008).
Alginate hydrogels are biodegradable, biosafe and high permeable to nutrients, which
makes them widely used in 3D cell culture (Glicklis et al., 2000; Hwang et al., 2009; Miranda,
2010; Serra et al., 2011). This hydrogel promotes the diffusion of oxygen, nutrients and drugs
to the living cells and allows the dissipation of the waste products from the cells (Tostões et
al., 2011). Another advantage is the control of the pore size in order to provide the desired
cell culture condition by controlling the M/G monomers ratio (Manuel & Gameiro, 2012;
Wang & Wang, 2014). Furthermore, hydrogels can absorb high amounts of water or
biological fluids due to its hydrophilic groups, swelling without dissolving. Hydrogels are soft
and rubbery when swollen, which resembles in some extent the living tissues, giving
favourable conditions for the proliferation of cells in vitro, maintaining its 3D structure (El-
sherbiny & Yacoub, 2013).
3D organ/tissue printing is a new strategy in tissue engineering. Usually, one or more
type of cells is mixed with the hydrogel and then this mixture is printed layer by layer in
order to embed the cells within the hydrogel at the moment of printing. This way, a 3D
scaffold with a defined shape and cellular morphology can be developed. In this technique,
hydrogel scaffolds are essential because they supply the embedded cells with a support
matrix and a highly hydrated microenvironment with controlled nutrient and oxygen
diffusion. Moreover, the hydrogel should also provide the correct biochemical and physical
signals, which are responsible for migration, proliferation and differentiation (Huh, Hamilton,
& Ingber, 2011; Yu Zhao et al., 2014).
Hydrogels can also be used as a base for cell-compatible microcarriers (figure 1.17),
which are spheres (generally with a diameter less than 500 µm2) that allow the culture of
cells on its outer surface (non porous microcarriers) or in both sides of its surface, inside

Introduction
28
and outside (porous microcarriers) (Benien & Swami, 2014; Schmidt, Rowley, & Kong, 2008;
Serra et al., 2011). Microcarriers allow the culture of large number of cells in small volumes
(Breslin & O’Driscoll, 2013; Serra et al., 2011). Collagen and laminin are used as
microcarrier coatings, enhancing the cell culture on its surface (J. Bin Kim, 2005). In this
case, cells grow as in 2D monolayer and physical forces from the environment and culture
conditions can damage the cells (Justice et al., 2009; Kehoe, Jing, Lock, Tzanakakis, & Ph,
2010). On the contrary, porous microcarriers that allow growing cells also on inside surface,
provide a protective environment from the shear forces. Another advantage of porous
microcarriers is that they have higher surface area to unit volume ratio than non porous
microcarriers. Moreover, microcarriers can be very advantages in specific cases: 1)to
increase the total available surface of the culture substrate; 2)to grow large number of
monolayers using a small container; 3) to co-culture different type of cells in close proximity;
4) to culture cells that do not aggregate spontaneously (Benien & Swami, 2014). Moreover,
microcarriers deposit very easily making cell sampling, cell harvesting and downstream
processing also very easy and simple. Nevertheless, microcarriers have some drawbacks
concerning the adhesion to each other and the costs associated with the materials (J. Bin
Kim, 2005; Serra, Brito, Correia, & Alves, 2012). Conventionally, microcarrier bead cultures
involve growth in stirred tank vessels (figure 1.19) to assist in mixing and provision of
nutrients.
Figure 1.17 – Example of a non-porous microcarrier. Cells attach and grow on the outer
surface. Adapted from (Pampaloni et al., 2007).
1.6.4. 3D agitation-based cell culture methods
Multicellular spheroids are the most common example of 3D cellular models and
they can be formed by stationary, such as the examples given in figures 1.11, 1.12, 1.13
and 1.14 or dynamic approaches (Kelm et al., 2003; Lin, Lin, & Chang, 2008). The main
requisite for cells to grow as 3D aggregates is that the adhesive forces between the cells are
higher than between the cells and the substrate where are cultured on (Mazzoleni, Lorenzo,
& Steimberg, 2009). However, the stationary systems may have some drawbacks related to
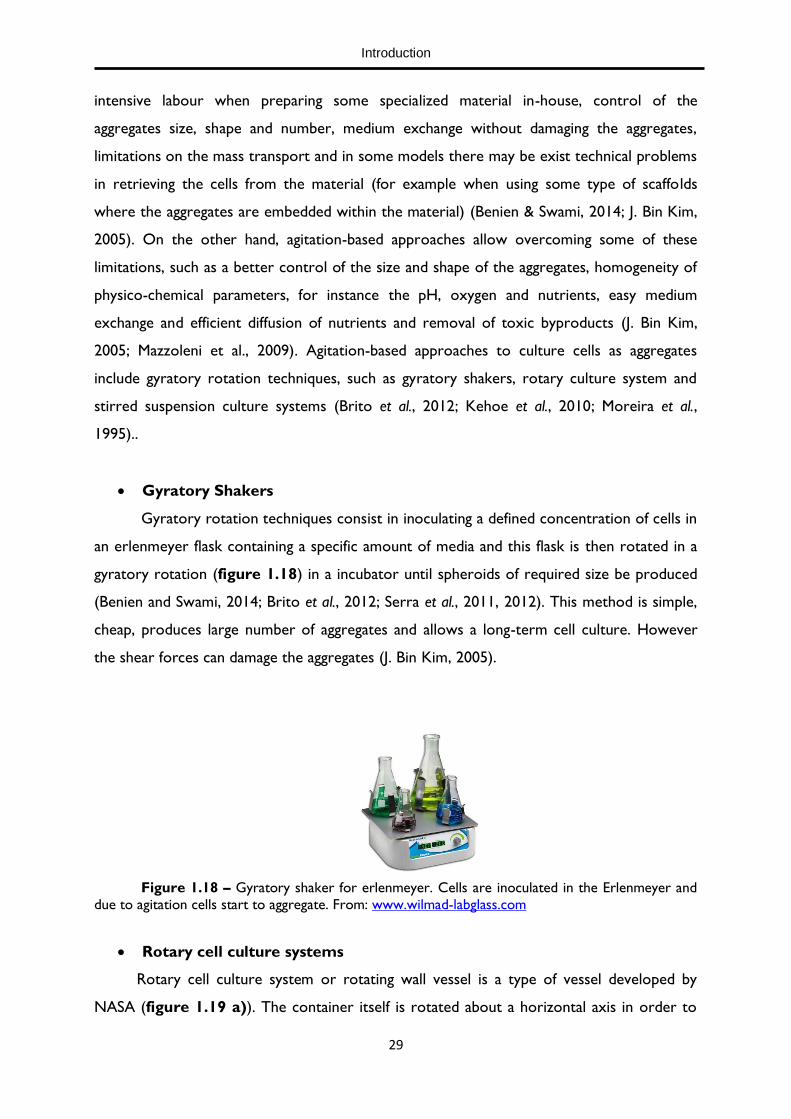
Introduction
29
intensive labour when preparing some specialized material in-house, control of the
aggregates size, shape and number, medium exchange without damaging the aggregates,
limitations on the mass transport and in some models there may be exist technical problems
in retrieving the cells from the material (for example when using some type of scaffolds
where the aggregates are embedded within the material) (Benien & Swami, 2014; J. Bin Kim,
2005). On the other hand, agitation-based approaches allow overcoming some of these
limitations, such as a better control of the size and shape of the aggregates, homogeneity of
physico-chemical parameters, for instance the pH, oxygen and nutrients, easy medium
exchange and efficient diffusion of nutrients and removal of toxic byproducts (J. Bin Kim,
2005; Mazzoleni et al., 2009). Agitation-based approaches to culture cells as aggregates
include gyratory rotation techniques, such as gyratory shakers, rotary culture system and
stirred suspension culture systems (Brito et al., 2012; Kehoe et al., 2010; Moreira et al.,
1995)..
Gyratory Shakers
Gyratory rotation techniques consist in inoculating a defined concentration of cells in
an erlenmeyer flask containing a specific amount of media and this flask is then rotated in a
gyratory rotation (figure 1.18) in a incubator until spheroids of required size be produced
(Benien and Swami, 2014; Brito et al., 2012; Serra et al., 2011, 2012). This method is simple,
cheap, produces large number of aggregates and allows a long-term cell culture. However
the shear forces can damage the aggregates (J. Bin Kim, 2005).
Figure 1.18 – Gyratory shaker for erlenmeyer. Cells are inoculated in the Erlenmeyer and
due to agitation cells start to aggregate. From: www.wilmad-labglass.com
Rotary cell culture systems
Rotary cell culture system or rotating wall vessel is a type of vessel developed by
NASA (figure 1.19 a)). The container itself is rotated about a horizontal axis in order to

Introduction
30
simulate microgravity and to expose cells to lower shear forces (Benien & Swami, 2014; Lin
et al., 2008). This technique maintains cell growth in suspension and continuous medium
perfusion and nutrient flow rate, assuring an efficient mass transport. Fluid turbulence and
shear forces are minimized by the vessel being completely filled with medium. Cells do not
attach to the walls and the speed of the rotation can be adjusted according to the type of
cell and along time: slower in the beginning, when there is single cell suspension, in order to
promote cell interactions and then, when cells start to adhere to each other and form larger
3D structures, the rotation needs to be higher, so that the heavier aggregates do not deposit
and can continue in suspension (Hwang et al., 2009; Kelm et al., 2003). Another advantage of
the rotating wall vessels is the production of long-term cultures, obtaining high yields of large
spheroids. This technique also enables co-culture multiple cell types to generate a complex
heterogeneous 3D in vitro structure and provides an efficient gas transfer through a semi-
permeable membrane (J. Bin Kim, 2005; Serra et al., 2012). However, the rotary cell culture
system is very expensive because specialized equipment is needed and has low scalability. In
addition, it is not possible to control the number of cells that constitute each aggregate. In
consequence, the suspension cell culture may have different size aggregates, which requires a
manual selection of similar size aggregates to do drug screening (Friedrich et al., 2009; Ivascu
& Kubbies, 2006), Another important limitation is the difficulty in sampling, which is only
performed at the end of cell culture (Serra et al., 2012).
Stirred-tank culture vessels
Stirred vessels are a cylindrical container with an impeller, which can be a paddle or a
rod, in order to stir the cell suspension. Stirred suspension culture systems, such as stirred
tank culture systems (figure 1.19 b)), prevent adherence of cells to the vessel allowing a
suspension cell culture (Breslin & O’Driscoll, 2013; J. Bin Kim, 2005). This is achieved with
constant agitation by the impeller and chemical coating of the vessel walls, for example with
dimethyldichlorosilane (Breslin & O’Driscoll, 2013). As in the rotary cell culture system, the
speed of agitation is adjusted during cell culture to optimize cell interactions and, in
consequence, cell aggregation (Alves, 1996). The speed is then increased to control
aggregates size and shape through the hydrodynamic forces and also to prevent the
deposition of the bigger and heavier aggregates (Kelm et al., 2003). This culture system have
several advantages, such as the production of large spheroids, long-term cultures because it
enables an easy medium exchange without damaging the aggregates, the possibility to scale-

Introduction
31
up, obtaining high yields of aggregates and easy sampling, allowing a continuous monitoring
and characterization of the culture throughout time (Moreira et al., 1995). In addition, the
stirring dynamic allows an efficient mass transport of nutrients and cell waste products to
and from the spheroids, respectively (J. Bin Kim, 2005). Despite all the advantages of the
stirred tank culture systems, they still present some disadvantages, since the shear force
from the paddle that create the agitation can damage physiologically the aggregates (Lin et al.,
2008; Serra et al., 2011). However, spinner-flasks are one of the most used 3D techniques
due to its simplicity, low cost and efficient production of aggregates (Benien & Swami, 2014;
Breslin & O’Driscoll, 2013; J. Bin Kim, 2005).
Figure 1.19 – Agitation-based approaches for the production of aggregates. a) Rotary wall
vessel; b) Spinner flask with paddle impeller. Adapted from (Benien & Swami, 2014)
Computer-controlled stirred tank bioreactors
Although spinners are widely used to culture cells in 3D, these systems are not fully
controlled. On the other hand, computer-controlled stirred tank bioreactors (figure 1.20)
allow an automated control of the environment, including on-line monitoring and control of
specific cell culture parameters, such as temperature, pH, dissolved oxygen and nutrients
(Martin, Wendt, & Heberer, 2004; Serra et al., 2012; Tostões et al., 2011). These variables
are essential to ensure high cell viability and proliferation, contributing to high yields and
long-term cultures. Additionally, this type of bioreactors have a simple design and are very
flexible since they can operate in different modes, such as batch, fed batch and continuous
perfusion. In the batch mode there are no medium exchanges until the end of the cell
culture In a fed batch reactor, fresh medium is continuous or periodically added to the cell
culture, without any medium removal. In continuous perfusion bioreactor, fresh medium is
continuously added and bioreactor medium is continuously removed, allowing an automatic
and regular replacement of cell culture medium (Martin et al., 2004); this enables a
continuously cell feeding and waste products removal (Tostões et al., 2011).
a) b)
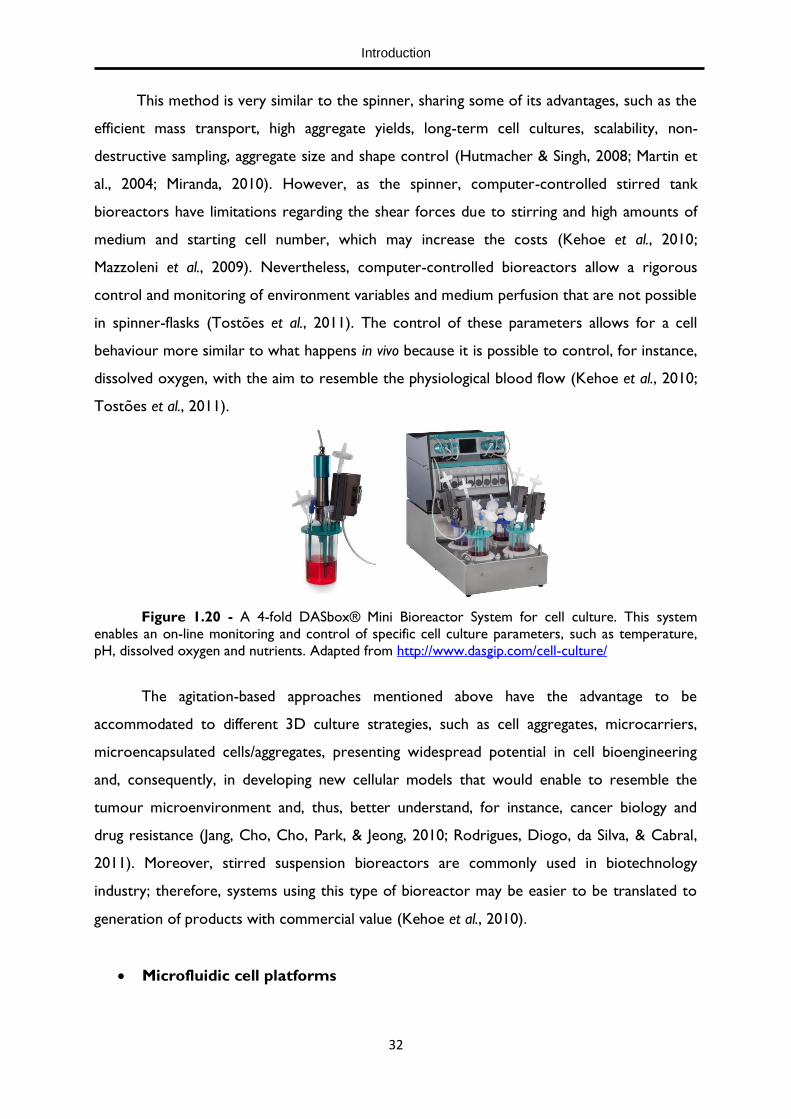
Introduction
32
This method is very similar to the spinner, sharing some of its advantages, such as the
efficient mass transport, high aggregate yields, long-term cell cultures, scalability, non-
destructive sampling, aggregate size and shape control (Hutmacher & Singh, 2008; Martin et
al., 2004; Miranda, 2010). However, as the spinner, computer-controlled stirred tank
bioreactors have limitations regarding the shear forces due to stirring and high amounts of
medium and starting cell number, which may increase the costs (Kehoe et al., 2010;
Mazzoleni et al., 2009). Nevertheless, computer-controlled bioreactors allow a rigorous
control and monitoring of environment variables and medium perfusion that are not possible
in spinner-flasks (Tostões et al., 2011). The control of these parameters allows for a cell
behaviour more similar to what happens in vivo because it is possible to control, for instance,
dissolved oxygen, with the aim to resemble the physiological blood flow (Kehoe et al., 2010;
Tostões et al., 2011).
Figure 1.20 - A 4-fold DASbox® Mini Bioreactor System for cell culture. This system
enables an on-line monitoring and control of specific cell culture parameters, such as temperature,
pH, dissolved oxygen and nutrients. Adapted from http://www.dasgip.com/cell-culture/
The agitation-based approaches mentioned above have the advantage to be
accommodated to different 3D culture strategies, such as cell aggregates, microcarriers,
microencapsulated cells/aggregates, presenting widespread potential in cell bioengineering
and, consequently, in developing new cellular models that would enable to resemble the
tumour microenvironment and, thus, better understand, for instance, cancer biology and
drug resistance (Jang, Cho, Cho, Park, & Jeong, 2010; Rodrigues, Diogo, da Silva, & Cabral,
2011). Moreover, stirred suspension bioreactors are commonly used in biotechnology
industry; therefore, systems using this type of bioreactor may be easier to be translated to
generation of products with commercial value (Kehoe et al., 2010).
Microfluidic cell platforms

Introduction
33
Microfluidic devices (figure 1.21), or micro-bioreactors, are efficient small-scale
systems that promote the formation of cellular aggregates and provide a precise control
over the cell microenvironment by adjusting specific parameters such as the perfusion rate
(Fennema et al., 2013). This process can be easily automated and have low volume drug
testing (Benien & Swami, 2014). Besides the long-term cell cultures, other advantages of
using microfluidic technology are the enhanced nutrient transport, the need for small
amount of reagents and cells (S.-Y. C. Chen, Hung, & Lee, 2011). However, there are some
limitations such as the low scalability, high shear stress due to the perfusion and continuous
removal of medium that contains factors secreted by cells that could influence cell culture
(Meyvantsson & Beebe, 2008).
Figure 1.21 - Design of a 3D microfluidic device. It has an open-top chamber and inlet and
outlet wells. There is continuous perfusion of medium from the flow inlet well, crossing the
microfluidic chamber and getting out from the outlet well. Gravity and surface tension forces are the
responsible for the perfusion, so this technique does not require any external pumps. This perfusion
allows the cell feeding and it is due to the gravity when there is a liquid height difference between the
inlet and outlet wells. The inlet well should have more liquid than the outlet well and the difference
regulates the perfusion rate. Cells are dispensed directly into the open access culture chamber.
Surface tension pressure prevents liquid from flowing out of the open chamber. Adapted from Breslin
and O’Driscoll, 2013; Chen, S.-Y. C. et al., 2011.
A summary of the advantages and disadvantages of the several 3D cell culture models
is presented in table I.3.
Table 1.3. Advantages and disadvantages of different 3D cell culture techniques
Advantages Disadvantages
Forced-floating method
-Simple
-Inexpensive
-High-throughput testing
-Spheroids easily accessible
-Material coating is relatively labour intensive
-Produces small amounts of spheroids
Hanging-drop method
-Homogenous spheroids
-No specialized equipment required
-Spheroids easily accessible
-Expensive when using specialised plates
-Labour intensive when preparing plates in-
house
-Small volumes difficult medium exchange

Introduction
34
without perturbing the cells
-Difficult long-term culture
-Low throughput
-Small number of aggregates
Matrices and scaffolds
-3D support that mimics in vivo
environment
-Can incorporate growth factors and other
cell signalling molecules
-Lack of materials approved for clinical
applications
-Difficulties in retrieving the cells in some
models
-Limit mass transport
-Biocompatibility and biodegradability issues
Rotary culture system
-Simple
-Low shear stress
-Efficient gas and nutrients transfer
-Supports 3D cell culture, such as cell
aggregates and cells immobilized on
scaffolds or microcarriers
-Produces large amounts of aggregates
-Long-term culture
-Culture several cell types
-Specialized equipment required
-Expensive
-Low scalability
-Sampling only at the end of cell culture, not
enabling monitoring throughout
Stirred tank systems
-Simple
-Allows large-scale production
-efficient mass transport
-Spheroids easily accessible
-can feed high-throughput screening
-
-Long-term culture
- -Accurate control of physico-chemical
parameters (when using computer
controlled bioreactors)
-Control of aggregates size and shape
-Easy sampling and monitoring and
characterization throughout time
-Possibility to work in perfusion
-Supports 3D cell culture, such as cell
aggregates and cells immobilized on
scaffolds or microcarriers
-Culture several cell types
-Shear stress can be harmful for more sensitive
cells
-Specialized equipment required (computer-
controlled bioreactors)
-Expensive (computer -controlled bioreactors)
-High amounts of reagents (ex: medium)
Microfluidic platforms
-High-throughput testing
-Allows optimization of culture conditions
-Accurate control of cell
microenvironment through the adjust of
the perfusion rate
-Efficient mass transport
-Allows miniaturization and the study of
cell-cell interactions or single cell analysis
-Expensive due to required specialized
equipment
-Requires low amounts of reagents
-Shear stress due to perfusion
-Low scalability
-Removal of important paracrine factors
secreted by cells due to perfusion

Introduction
35
1.6.5. Mimicking the microenvironment in vitro
Cell fate, proliferation and viability are highly dependent on signals that lie in the
extracellular environment, such as the ECM, soluble factors, cell–cell interactions, physical
forces and physicochemical factors (Alessandri et al., 2013; Palecek, 2011; Peng et al., 2013;
Santo, E. et al., 2013; Yamasaki et al., 1995). Natural ECM is composed by fibrous proteins,
for instance, fibronectin, collagen and laminin (Yu Zhao et al., 2014) and some matrices and
scaffolds, such as hydrogels, are widely used to mimic some ECM characteristics (Drury &
Mooney, 2003; El-sherbiny & Yacoub, 2013; Wang & Wang, 2014). Soluble factors can be
mimicked by medium composition allied with physiological concentration of certain
supplements and with the most suitable operation mode, such as fed-batch or perfusion
modes, which can be applied in stirred tank bioreactors. These culture operation modes
allow a better control of physicochemical factors concerning the nutrients, metabolites,
temperature, oxygen and pH and a continuous cell culture feeding and not complete removal
of factors secreted by the cells, which are essential for paracrine and endocrine cell-cell
interactions (Serra et al., 2012). These cell-cell interactions also depend on cellular
concentration, colony size, co-culture using several cell types and cellular spatial
organization. Spatial organization and 3D structure are very important to ensure a viable and
functional cellular model, which can be accomplished using a microencapsulation technique,
using, for instance, alginate (Alessandri et al., 2013; Serra et al., 2011). Cellular aggregates or
single cells are entrapped inside the alginate capsules that allow bidirectional diffusion of
nutrients, oxygen and waste products (figure 1.22). There are several advantages such as
cells being protected against the shear forces due to the dynamic agitation when cultured in
a stirred culture vessel (Serra et al., 2011; Velasco et al., 2012), which contributes to high cell
viability. Additionally, cellular aggregates in alginate capsules often have apicobasal
polarization (J. I. Partanen, Nieminen, & Klefstrom, 2009). This does not happen in a 2D
planar cell culture where the cells are in a flat monolayer. In addition, the encapsulation
method makes possible to change physical and chemically the hydrogel properties, by
changing the relative amounts of gel components, for example. These changes are important
to study the role the 3D microenvironment on cell fate and function and to enable an
efficient mass transport, promoting a long-term cell culture (Tostões et al., 2011; Velasco et
al., 2012; Wang & Wang, 2014). Moreover, cell microencapsulation using alginate has already
been reported in order to enhance viability and functionality in different type of cells,
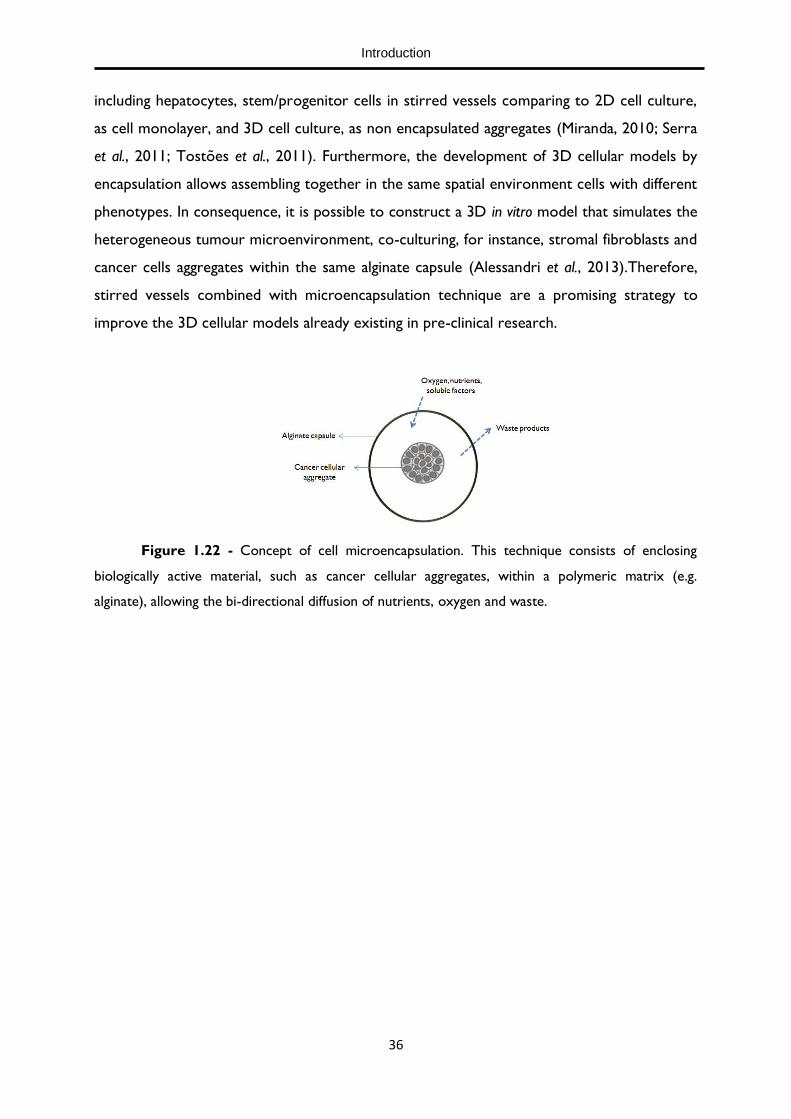
Introduction
36
including hepatocytes, stem/progenitor cells in stirred vessels comparing to 2D cell culture,
as cell monolayer, and 3D cell culture, as non encapsulated aggregates (Miranda, 2010; Serra
et al., 2011; Tostões et al., 2011). Furthermore, the development of 3D cellular models by
encapsulation allows assembling together in the same spatial environment cells with different
phenotypes. In consequence, it is possible to construct a 3D in vitro model that simulates the
heterogeneous tumour microenvironment, co-culturing, for instance, stromal fibroblasts and
cancer cells aggregates within the same alginate capsule (Alessandri et al., 2013).Therefore,
stirred vessels combined with microencapsulation technique are a promising strategy to
improve the 3D cellular models already existing in pre-clinical research.
Figure 1.22 - Concept of cell microencapsulation. This technique consists of enclosing
biologically active material, such as cancer cellular aggregates, within a polymeric matrix (e.g.
alginate), allowing the bi-directional diffusion of nutrients, oxygen and waste.

Introduction
37
1.7. Thesis aim
This thesis focused on the generation of a robust and scalable human cellular model
of NSCLC that could better mimic the in vivo tumour physiology and microenvironment,
with potential use for pre-clinical research and pharmacological applications. Therefore, a 3D
strategy was performed to resemble: 1) the three-dimensional cellular organization of a lung
tumour;2) the tumour cellular heterogeneity, especially the tumour and fibroblast
component; 3) ECM compartment.
The first aim of this thesis work was to establish a robust aggregation strategy for
generation of NSCLC cellular aggregates in order to mimic cell-cell interaction between
cancer cells within a tumour. To attain this, cancer cell lines representing 2 different
subtypes of NSCLC derived from metastatic sites of the tumour, namely H460 (large-cell
carcinoma) and H1650 (bronchioalveolar carcinoma) were cultured in stirred tank system.
The second objective was to develop a 3D NSCLC cell model that could better
mimic the tumour microenvironment, including the cell-ECM interactions and the tumour
cellular heterogeneity. The aggregation strategy in stirred suspension system developed in
aim 1 was combined with a microencapsulation technique using alginate. Therefore, H1650
cancer aggregates were encapsulated with and without normal lung fibroblasts and then
cultured in a stirred tank system.
All cell cultures were monitored throughout time, assessing cell viability,
proliferation, metabolism, phenotype and morphology (figure 1.23) in order to characterize
the developed 3D cell cultures.
Figure 1.23 – Aim of the thesis and strategies performed to accomplish the objectives.


Materials and Methods


Material and Methods
41
2. Materials and Methods
2.1. Cell lines and cell culture conditions
H460 and H1650 NSCLC cell lines were selected for the development of lung
cancer aggregates due to their different origin within the tumour and because they represent
the major NSCLC subtypes, adenocarcinoma and large-cell lung carcinoma (table 1.1). Both
cell lines come from a metastatic site with pleural effusion (table 2.1) (Gong et al., 2011).
Malignant pleural effusion occurs when a cancer leads to an atypical amount of fluid between
the thin layers of tissue (pleura) lining the outside of the lung and the wall of the chest cavity.
Lung cancer accounts for 50-65% of malignant pleural effusions and it is associated with a
poor outcome (Antony et al., 2001; Sugiura et al., 1997). H1650 cell line was further used to
study the cell-cell, cell-ECM and tumor-stroma interactions because it represents a subtype
of NSCLC, the bronchioalveolar carcinoma, which is characterized by unique pathologic,
radiographic and clinical features, such as bilateral lung involvement, non symptomatic
development and higher incidence in non smokers compared to other lung malignancies
(Shivanthan and Wijesiriwardena, 2011; Tan et al., 2003). Another important issue related to
this type of NSCLC is its increase in incidence, particularly in younger and nonsmoking
women (Furák et al., 2003; Hirsch et al., 2005). This cell line was also used due to its
metastatic potential (Gong et al., 2011).
The NSCLC cell lines H1650 and H460 were obtained from American Type Culture
Collection and the immortalized patient-derived normal fibroblast 14195 cell line (NFs
14195), derived by Heiko van der Kuip (RBMF, Stuttgart) within the scope of the PREDECT
project and immortalized by Moshe Oren (Weizmann Institute, Israel).
Table 2.1: Cell lines used to generate NSCLC cellular aggregates
Name
(Reference
ATCC)
Type Source
H1650
(CRL-5883)
Bronchioalveolar carcinoma Metastatic, pleural effusion

Material and Methods
42
H460
(HTB-177)
Large-cell carcinoma Metastatic, pleural effusion
Adapted from (Gong et al., 2011)
H460 cell line was cultured in RPMI medium 1640 (1x) + GlutaMAX™-I (from
Alfagene), supplemented with 10% (v/v) heat-inactivated fetal bovine serum (FBS), U.S. origin
from Gibco®, 1% (v/v) of penicillin and streptomycin (P/S, Invitrogen) and 1µg/mL of
puromycin (Invivogen). H1650 and NFs 14195 cell lines were cultured in RPMI medium 1640
(1x) + GlutaMAXTM -I (from Alfagene), supplemented with 10% (v/v) of heat-inactivated fetal
bovine serum (FBS), U.S. origin from Gibco® and 1% (v/v) of penicillin and streptomycin.
GlutaMAXTM-1 is a supplement already incorporated in the medium that contains a stabilized
form of glutamine, the dipeptide L-alanyl-L-glutamine, which prevents the rapid degradation
of glutamine and ammonia buildup in both adherent and suspension cultures (Christie &
Butler, 1994). All cell lines were incubated at 37ºC in humidified atmosphere of 5% CO2.
All cell lines were routinely cultured in adherent and static conditions until
establishment of the 3D culture. Cells were sub-cultured twice a week at 1.5x10⁴cell/cm2
(H1650 and H460 cell lines) and 1x10⁴cell/cm2 (NFs 14195 cell line) in standard tissue
culture flasks (150cm2 T-Flasks from BD Biosciences). For each sub-culture, cells were rinsed
with Dulbecco’s phosphate-buffered saline (DPBS), washed for 2 minutes with DPBS and
trypsinized using 0.05% trypsin- Ethylenediaminetetraacetic acid (EDTA; Invitrogen), for 2-4
minutes. Viable cells were counted using trypan blue exclusion test as described on section
2.4.1.
2.2. Generation of NSCLC aggregates and culture conditions
H1650 and H460 cells were dissociated from the 2D static cultures by trypsinization
using 0.05% trypsin-EDTA (Invitrogen) and inoculated as single cells at a density of 2x10⁵
cell/mL into silanized 125mL spinner-flasks, with straight blade paddle impeller (from
Corning® Life Sciences, figure 2.1). This type of impeller improves stirring and minimizes
shear stress derived from the hydrodynamic forces. To prevent cell attachment to the walls,
spinner flasks were pre-coated with 2-3 ml of dimethyldichlorosilane (Merck 8.03452,
Germany). The spinner flasks were placed on a magnetic stirrer. Inoculation was performed
in 75mL of the correspondent medium of each cell line. During aggregation phase, cells were
cultured in a batch operation mode, without medium exchange. Cultures were initiated with
a stirring rate of 40 rpm in order to promote cell interactions. After 4 hours of cell culture,

Material and Methods
43
50 mL of fresh corresponding medium were added to yield a final volume of 125 mL. For
each cell line, stirring rate was adjusted throughout time until 60 rpm, according to the cell-
cell aggregation profile (figure 2.1) to promote cell-cell adhesions and cell aggregation, to
prevent cellular clumps and control size and shape of aggregates. Cells were allowed to
aggregate and cell culture was maintained for 3 days and cell cultures were monitored every
day, analyzing cell viability, concentration, metabolic activity, aggregate size, concentration
and morphology during time.
Figure 2.1 - Stirring profile for H460 and H1650 cellular aggregation s using spinner-flasks
with straight paddle impeller (Corning® Life Sciences). Stirring rate was adjusted for each cell line to
promote cell aggregation, to prevent cellular clumps and to control size and shape of aggregates.
2.3. Development of a 3D NSCLC cellular model
2.3.1. Fibroblasts membrane staining protocol
Fibroblasts used in the co-cultures with H1650 aggregates were incubated with PKH
dye (PKH26 Red Fluorescent Cell Linker Kit, Sigma-Aldrich) for membrane labelling in order
to do an in vitro cell monitoring through fluorescence microscopy during co-culture. PKH26
is a fluorescent dye with long aliphatic tails that incorporates into lipid regions of the cell
membrane, labelling cells with a red colour for long periods of time and without affecting cell
viability. Briefly, cells were trypsinized and counted with the trypan blue exclusion method
(described in section 2.4.1). Cells were centrifuged at 300g for 5 minutes and then washed
with serum-free medium and centrifuged as before. The pellet of cells was carefully
resuspended in diluent provided by the kit. This cellular suspension was then incubated for 5
minutes with a 2x Dye Solution in diluent C, prepared immediately before use. After this, an
equal volume of serum was added to the cellular suspension in order to stop the reaction.
This cellular solution was diluted 1:2 in supplemented cell culture medium and centrifuged as
described previously. Cells were washed 3 times with phosphate-buffered saline (PBS) and

Material and Methods
44
then resuspended in supplemented cell culture medium before 3D culture with cancer
cellular aggregates.
2.3.2. Encapsulation of NSCLC cellular aggregates
Polymer - Alginate: Ultra Pure MVG alginate (UP-MVG NovaMatrix, Pronova
Biomedical, Oslo, Norway) was mixed with GRGDSP peptide-coupled MVG alginate
(NOVATACH, NovaMatrix) in a 1:4 proportion. The final alginate solution was prepared at
a concentration of 1.1% (w/v) in 0.9% (w/v) NaCl solution, which are formulations previously
optimized in the group (Rebelo et al., 2014; Serra et al., 2011; Tostões et al., 2011, 2012).
Microcapsules formation: H1650 cellular aggregates were encapsulated with 1.1 %
(w/v) of alginate prepared as described in the previous paragraph. Encapsulation was
performed in an electrostatically driven microencapsulation unit VarV1 (Nisco) using an
alginate-cell mixture prepared at a concentration of 6x10⁶ cell/mL of alginate for mono-
cultures and 12x106 cell/mL alginate for co-cultures. These encapsulation conditions yielded
microcapsules with a diameter of approximately 500 μm. The crosslinking reaction of the
microcapsules was done by precipitating the generated droplets directly from the nozzle into
a 20 mM BaCl2 solution, adjusted to 290-300 mOsm, using NaCl, buffered at pH 7.4 with 5
mM histidine (figure 2.2). Alginate microcapsules were washed three times with 0.9% (w/v)
NaCl solution and once with RPMI 1640 – GlutaMAXTM-1 medium before being transferred
to stirred culture systems.
Alginate microcapsules dissolution: Ba2+-UP MVG alginate was dissolved by incubating
the microcapsules with a chelating solution (50 mM EDTA in mQ water) for 5 minutes at
room temperature (RT) using vortex.

Material and Methods
45
Figure 2.2 - Schematic illustration the cell encapsulation process with alginate. Capsules are
formed when droplets of alginate-cells mixture contact with the BaCl2 solution, entrapping the cancer
aggregates inside with the single fibroblasts cells.

Material and Methods
46
2.3.3. Mono- and co-culture of H1650 encapsulated aggregates
H1650 cells were induced to form cell aggregates during 3 days prior encapsulation
by cultivating H1650 single cells in spinner flasks using the conditions previously described in
section 2.2 (figure 2.1). Encapsulation of H1650 aggregates was performed at day 3 of
aggregation phase, because H1650 aggregates were compact, dense and the shape was
spherical and well defined. Agitation of the impeller of the spinner vessel used in aggregation
phase was stopped to remove all the aggregates. Aggregates were filtered using a 70 µm
strainer in order to remove single cells and non-representative aggregates, such as diploid
and triploids. Aggregates were washed twice with PBS and centrifuged at 50 g for 3 minutes.
H1650 aggregates (mono-culture) and H1650 aggregates mixed together with human lung
NFs labelled with PKH26 14195 (co-culture) were embedded in the alginate polymeric
solution as previously described in section 2.3.2 (figure 2.2). The fibroblasts were maintained
in 2D cell culture until encapsulation process. Fibroblasts were mixed as single cells with
H1650 aggregates in a 1:1 ratio for the co-culture condition The initial cancer cell
concentration for encapsulation was 2x10⁵ cell/mL. The resulting capsules were transferred
to 125 mL spinner vessels (Corning® Life Sciences, figure 2.2) equipped with paddle
impellers and cultured in supplemented RPMI medium 1640 (1x) + GlutaMAXTM -I at 60 rpm
for additional 15 days. Culture medium was partially replaced at days 3, 5, 7, 10 and 12. This
was done by stopping agitation (to let the aggregates deposit), removing 50% of the medium
and feeding with 50% of fresh medium. Samples were collected from the spinner vessel at
several time points (including before and after changing the cell culture medium) at days 0, 1,
2, 3, 5, 7, 10, 12 and 15 in order to monitor the cultures in terms of cell viability, metabolic
activity, aggregate size, concentration and composition during time.
Figure 2.3 – Strategy performed to accomplish a 3D cellular model to evaluate the effect of
tumour microenvironment on tumour progression.

Material and Methods
47
2.4. Analytical methods to evaluate cell culture
2.4.1. Determination of cell concentration, cell viability, cell death and apoptosis
Trypan Blue exclusion method: During cell proliferation in adherent system and
before inoculating cells in stirred suspension culture systems, cell viability and concentration
was assessed using the trypan blue exclusion test. After trypsinization, cells were diluted in
0.1% (v/v) Trypan Blue dye (Gibco, Invitrogen Corporation, Paisley,27 UK) in PBS using a 1:5
dilution. Non-viable cells, whose membrane is damaged, are stained by trypan blue and
appear blue at the microscope whilst viable cells are not stained and appear white and bright.
Cell concentration was evaluated using a Fuchs-Rosental hemacytometer and a microscope
with phase contrast (DM IRB, Leica, Germany).
Crystal violet method: During cell culture in a stirred suspension culture system,
nuclei were counted in order to obtain total cell number in culture. Total number of cells
was counted using crystal violet method that stains nuclei in a deep purple color. Cells were
centrifuged at 300g, for 5 minutes and then lysed using lysis solution (1% Triton X-100 in 0.1
M citric acid), overnight at 37ºC. For encapsulated aggregates, alginate capsules were first
dissolved with a solution of 50 mM EDTA in mQ water. Then, samples were centrifuged at
50g (in order not to damage the aggregates) for 5 minutes and the pellet of cells was lysed.
In co-cultures of H1650 aggregates with immortalized NFs, cancer cells and fibroblasts were
separated before lysis. After centrifuging the co-culture samples at 50g, for 5 minutes, the
H1650 aggregates constituted the pellet as the fibroblasts remained in suspension in the
supernatant because they are organized in single cells or small aggregates. The supernatant
with fibroblasts is separated from the aggregates pellet and centrifuged at 300 g for
5minutes. H1650 aggregates and fibroblasts pellets were washed twice with PBS to remove
remaining dissolved alginate that could precipitate and interfere with cell counting. The
pellets were then lysed, overnight at 37ºC. At the moment of counting, nuclei were diluted
in 0.1% crystal violet in lysis solution. Nuclei density was assessed using a Fuchs-Rosental
hemacytometer and a microscope with phase contrast (DM IRB, Leica, Germany)
Cell membrane integrity assay: Aggregate viability was evaluated using the enzyme
substrate fluorescein diacetate (FDA; Sigma-Aldrich, Steinheim, Germany) 1:500 in PBS and
TO-PRO-3 iodide (Invitrogen) 1:500 in PBS dual staining. Aggregates were analyzed using a
fluorescence microscope (Leica DM6000). FDA is a non-fluorescent cell permeant ester that
stains viable cells, measuring enzymatic activity and cell membrane integrity at the same time.
Enzymatic activity is required to activate FDA fluorescence through FDA hydrolysis by

Material and Methods
48
intracellular esterases. Cell membrane integrity is necessary for retaining the fluorescein
inside the cell, slowing the loss of fluorescence. On the other hand, TO-PRO®-3 is a
carbocyanine monomer nucleic acid stain with far-red fluorescence. It indicates cell death
because it crosses damaged cellular membranes and stains the nuclear double-stranded
nucleic acids (dsDNA). Therefore, with FDA and TO-PRO-3 iodide dual staining, viable cells
present green fluorescence and non-viable present far-red fluorescence.
Lactate dehydrogenase (LDH) activity: Lactate dehydrogenase (LDH) activity from
the cell culture supernatant was determined as an indirect way to evaluate cell death. LDH is
an intracellular enzyme only present in the cell culture supernatant upon cellular membrane
damaged, which occurs during cell death. LDH (U/mL) activity from the culture supernatant
was determined as described before (Serra et al., 2011). Briefly, the rate of oxidation of
NADH to NAD+ coupled with the reduction of pyruvate to lactate was monitored at 340
nm and U represents the µmol of NADH consumed in reaction (1) per minute. However,
since the LDH is not a stable enzyme in the cell culture supernatant at 37ºC after 24 hours,
the cumulative value of LDH (LDHcum) was estimated for each timepoint and time interval,
respectively, using the following equation: LDHcum i+1 =LDHi+LDH i+1.
Piruvate + NADH + H+ LDH L-Lactate + NAD+ (equation 1)
Apoptotic activity: The assessment of cell apoptotic activity can provide important
complementary information about the 3D cell cultures. Apoptotic activity of encapsulated
H1650 aggregates and fibroblasts was performed with NucViewTM 488, caspase-3 substrate,
and MitoViewTM 633, far-red fluorescent mitochondrial dye. This assay is based on caspase-
3/7 activity and changes in the mitochondrial membrane potential using fluorescence
microscopy. Caspase-3 substrate, which is non-fluorescent and non DNA dye, penetrates on
cell membrane and it is cleaved by caspase-3/7 in cytoplasm, forming a high-affinity DNA dye.
This DNA probe migrates to cell nucleus originating bright green stain. Therefore,
NucViewTM 488 dye has a dual function of detecting intracellular caspase 3/7 and at the same
time stain cell nucleus. Consequently, apoptotic cells display a lower red fluorescence signal
and higher green fluorescence when compared with non-apoptotic cells. MitoViewTM 633
diffuses through cell membrane and accumulates in the mitochondria. This accumulation is
dependent on the mitochondria function, which is impaired during apoptosis (Gross,
Mcdonnell, & Korsmeyer, 1999; Joza et al., 2001; Merad-Boudia, Nicole, Santiard-Baron,
Saillé, & Ceballos-Picot, 1998). Therefore, apoptotic cells have lower MitoViewTM 633
staining compared with healthy cells. Encapsulated H1650 aggregates from mono and co-

Material and Methods
49
cultures were placed in a 24 well-plate and incubated for 2 hours in a humidified atmosphere
at 37ºC with 5% CO2 with a 1:500 dilution of each dye (NucViewTM 488 and MitoViewTM
633). Encapsulated aggregates were washed 3 times with DPBS and then resuspended in
500µL of DPBS before being observed in fluorescence microscope (Leica DM6000,
Germany).
2.4.2. Aggregate size determination
For aggregate size determination, aggregate suspensions were observed by phase
contrast microscopy and aggregate size measured using ImageJ software. The average area
was calculated by measuring the aggregate middle section area of a minimum of 100
aggregates. Aggregates with less than 20 μm diameter, generally duplets or triplets, were not
considered because they represent a small percentage of the total cell number in culture
(Serra et al., 2007).
2.4.3. Metabolite analysis
Glucose (Glc) and lactate (Lac) concentrations in the cell culture medium were
analyzed using an YSI 7100MBS (YSI Incorporated, USA). The specific metabolic rates (qMet.,
µmol/(million cell.day-1)) were calculated as described before (Serra et al., 2011) using the
equation: qMet. = ΔMet/ (ΔXv.Δt), where ΔMet (µmol) is the variation in metabolite
concentration during the time period Δt (day) and ΔXv (million cell) the average of total
number of cells during the same time period. Cellular metabolic efficiency was calculated as
the ratio between qLac/qGlc, representing the lactate/glucose yield (YLac/Glc).
2.4.4. . Phenotypic characterization of the NSCLC cellular model
Immunofluorescence microscopy: Alginate capsules were collected from the mono
and co-cultures in suspension culture and immediately fixed in 4% (w/v) paraformaldehyde
(PFA) and 4% (w/v) sucrose solution in DPBS during 30 minutes. Then, the capsules were
washed two times with DPBS and were dehydrated in DPBS solution with 30% of sucrose.
For the cryosectioning, encapsulated aggregates were frozen at -80 C in Tissue Teck
OCTtm (Sakura) and were sectioned in cryostat (Leica) in sections of 10 μm. Cryosections
were washed twice with DPBS followed by permeabilization with 0.1% Tx-100 solution in
DPBS for 10 minutes. After permeabilization, cryosections were washed 2 times with DPBS
and blocked with 0.2% of FSG in DPBS for 30 minutes. Primary antibody was diluted in 0.2%
FSG solution and incubated during 2 hours. After 2 washes with DPBS, cells were incubated

Material and Methods
50
for 1 hour with secondary antibody in 0.2% FSG solution. The list of primary antibodies is
presented in Table 2.2. Cryosections were finally washed twice with DPBS, mounted in
ProLong mounting medium contain DAPI (Invitrogen) and visualized using a fluoresce
microscope (Leica DM6000, Germany). Besides the antibodies, it was also used Alexa
Fluor® 488 Phalloidin (Invitrogen), which is a bicyclic peptide that binds F-actin with high
selectivity and presents green fluorescence because it is connected to Alexa Fluor® 488.
Table 2.2: List of antibodies and respective dilutions used for immunofluorescence
microscopy
Antibody Marker Supplier Dilution used
Anti-E-cadherin
Epithelial BD Biosciences 1:300
Anti-ZO1 Cell Polarity Invitrogen 1:100
Anti-CK18 -FITC
Epithelial
Santa Cruz
Biotechnology 1:100
Anti-vimentin
Mesenchymal Sigma 1:200
Anti-Phalloidin-
Alexa Fluor 488
Cytoskeleton
organization Invitrogen 1:100
Collagen IV
ECM Abcam 1:100
2.4.5. Quantification of newly synthesized ECM components
Collagen concentration retained inside alginate capsules from mono- and co-cultures
was assessed using SIRCOL Collagen colorimetric assay (Biocolor Ltd., U.K.). The Sircol
Assay is a dye-binding method that enables analysis of acid and pepsin-soluble collagens, from
type I to V. However, the dye reagent does not distinguish between collagen types, because
it binds to tri-peptide sequence [(gly-X-Y)n] (and many of these residues are converted post
translationally into hydroxyproline residues) which are found in all mammalian collagens
types. Briefly, cell culture samples were collected at days 5, 10 and 15 of mono- and co-
culture. Alginate capsules were dissolved as described before and aggregates and fibroblasts
were separated by centrifugation. Samples were kept at -80ºC until collagen quantification.

Material and Methods
51
Then, protein samples were transferred into low binding tubes and incubated overnight at
4ºC with 1mL of pepsin (freshly dissolved), 100µL of Acid Neutralising Reagent and 200µL of
cold Isolation and Concentration Reagent. Samples were then centrifuged at 12 000 rpm for
10minutes, supernatant was removed and 1mL of Sircol dye Reagent was added to each
pellet. Samples were gently shaked for 30 minutes and centrifuged as before. 250 µL of Alkali
Reagent was added to the samples, which were analyzed at 555nm. Collagen calibration
curve was performed by serial dilutions of the collagen standard solution provided by the kit
and further incubation with the alkali reagent.
2.5 Statistical analysis
The unpaired t-test was used for comparisons between two groups only. The one-
way ANOVA, followed by the Tukey’s pot-hoc, was used for comparisons between more
than two groups. p<0.05 was considered significant. Data are shown as mean ± standard
deviation of the means.


Results and Discussion


Results and Discussion
55
3. Results and discussion
3.1. Aggregation of NSCLC cell lines in stirred culture systems
The aim of the work was to generate NSCLC cellular models that could better mimic
the in vivo tumour microenvironment, recapitulating cell-cell and cell-ECM interactions
representative of cellular heterogeneity of tumours. In a first approach, the production of
cellular aggregates of the NSCLC cell lines H460 and H1650 was established in stirred
culture systems. The aggregation process followed for the generation of these aggregates
was based on the strategy proposed by Serra et al (2009), where human pluripotent
embryocarcinoma NTera2/cloneD1 (NT2) cells were cultured as 3D aggregates using stirred
culture systems.
H460 and H1650 NSCLC cell lines were inoculated as single cells in spinner-flasks
(figure 2.2) at a cell concentration of 0.2x10⁶ cell/mL (figure 3.1.I)) as described in
Materials and Methods, section 2.2 and the aggregation process followed for 3 days.
Aggregation was monitored by phase contrast microscopy throughout time (figure 3.1).
H460 and H1650 single cells started to attach to each other few hours after
inoculation (figure 3.1)). At day 1, both cell cultures presented aggregates in suspension,
with spherical shape in the case of H1650, whereas H460 still presented an irregular shape
by that time. At the third day of cell culture, both H460 and H1650 cultures presented
aggregates with a round, spherical and compact shape and very few single cells in suspension
(figure 3.1).
Fluorescein diacetate (FDA) and TOPRO iodide dual staining was used to evaluate
cell viability during culture time using fluorescence microscopy, with a protocol described in
the Materials and Methods, section 2.4.1. During the three days of aggregation, aggregates
were composed mainly by viable cells (green). A few non-viable cells were found (red),
corresponding to single cells that did not incorporate the aggregates (figure 3.1).

Results and Discussion
56
Figure 3.1 - Monitoring of aggregation of NSCLC cell lines in stirred culture systems.
Images obtained by phase contrast microscopy and by fluorescence microscopy. H460 and H1650
cell cultures were monitored throughout time: 0, 5, 24 and 72 hours. Viable cells were stained with
FDA (green) and non-viable cells were stained with TOPRO (red) as described in Materials and
Methods, Section 2.4.1. Scale bars represent 100µm. Data are from one representative experiment
of 4 (H460) and 5 (H1650) independent experiments.

Results and Discussion
57
Lactate Dehydrogenase (LDH) activity was also determined in order to evaluate cell
death during aggregation (see Materials and Methods, section 2.4.1). Cumulative values of
specific LDH release rates in the culture supernatant are shown in figure 3.2.
0 1 2 3
0.00
0.05
0.10
0.15
0.20
H460
H1650
*
***
Time (day)
LD
H c
um
(U/m
L)
Figure 3.2 – Cell death expressed by cumulative values of LDH released during aggregation
of NSCLC cell lines in stirred culture systems. Data are mean ± SD from 2 (H460) and 3 (H1650)
independent experiments. * P<0.01 and ***P<0.05 represent the significant differences between day
3 and day 0 of H460 LDH cumulative values by one-way ANOVA analysis with Tukey’s post multiple
comparison test.
Despite the progressive increase in cumulative LDH values for both cell lines, the
values of LDH in the culture supernatant were low. These results are in agreement with the
FDA/TOPRO assessment (figure 3.1), in which very few dead cells (in red) were detected.
Aggregate’s size increased for both cultures overtime (figure 3.1 and 3.3): H1650
and H460 aggregates displayed a statistically significant higher mean area at day 3 in
comparison with day 1 (p<0.001). Moreover, H1650 aggregates were significantly bigger than
H460 aggregates throughout time (figure 3.3) with average area of 7.36 ± 7.58 (x103 µm2)
and 3.94 ± 1.82 (x103 µm2), respectively, at day 3 of cell culture. In addition, size distribution
of H1650 aggregates was more heterogeneous than H460 cell line aggregates (figure 3.3)
throughout the whole aggregation period.
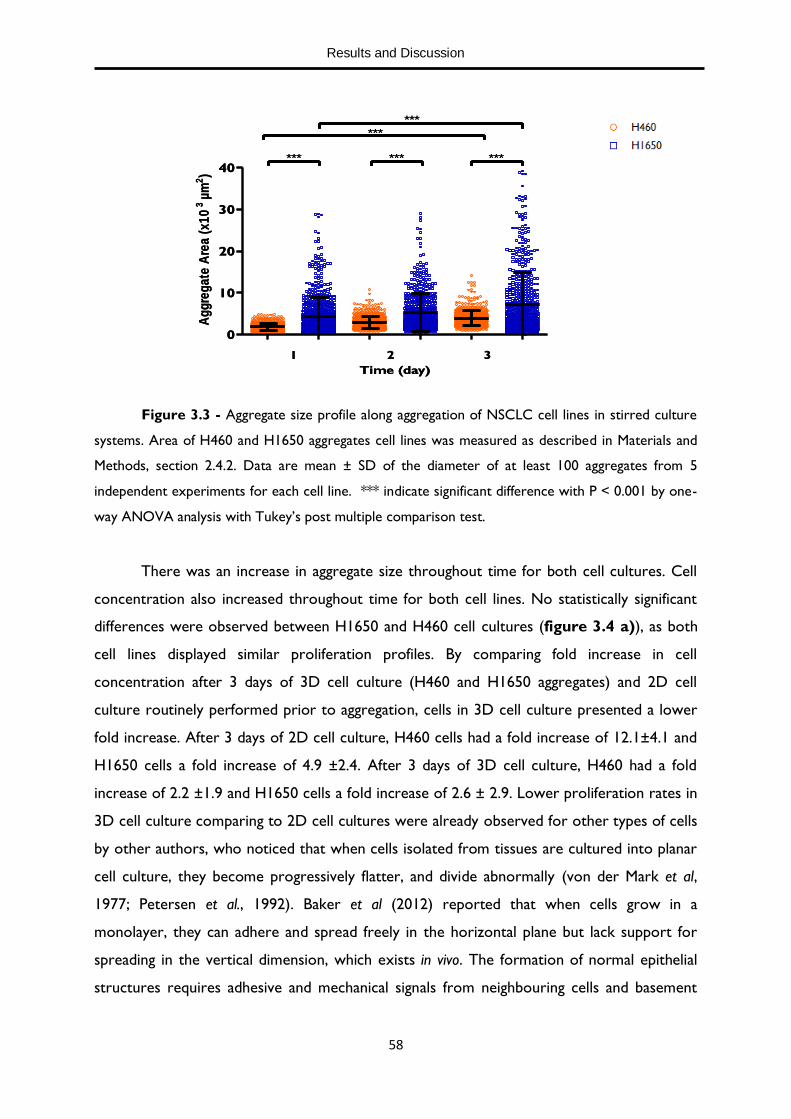
Results and Discussion
58
0
10
20
30
40
1 2 3
***
******
*** ***
Time (day)
Ag
gre
ga
te A
rea
(x
10
3µ
m2)
0
10
20
30
40
1 2 3
***
******
*** ***
Time (day)
Ag
gre
ga
te A
rea
(x
10
3µ
m2)
Figure 3.3 - Aggregate size profile along aggregation of NSCLC cell lines in stirred culture
systems. Area of H460 and H1650 aggregates cell lines was measured as described in Materials and
Methods, section 2.4.2. Data are mean ± SD of the diameter of at least 100 aggregates from 5
independent experiments for each cell line. *** indicate significant difference with P < 0.001 by one-
way ANOVA analysis with Tukey’s post multiple comparison test.
There was an increase in aggregate size throughout time for both cell cultures. Cell
concentration also increased throughout time for both cell lines. No statistically significant
differences were observed between H1650 and H460 cell cultures (figure 3.4 a)), as both
cell lines displayed similar proliferation profiles. By comparing fold increase in cell
concentration after 3 days of 3D cell culture (H460 and H1650 aggregates) and 2D cell
culture routinely performed prior to aggregation, cells in 3D cell culture presented a lower
fold increase. After 3 days of 2D cell culture, H460 cells had a fold increase of 12.1±4.1 and
H1650 cells a fold increase of 4.9 ±2.4. After 3 days of 3D cell culture, H460 had a fold
increase of 2.2 ±1.9 and H1650 cells a fold increase of 2.6 ± 2.9. Lower proliferation rates in
3D cell culture comparing to 2D cell cultures were already observed for other types of cells
by other authors, who noticed that when cells isolated from tissues are cultured into planar
cell culture, they become progressively flatter, and divide abnormally (von der Mark et al,
1977; Petersen et al., 1992). Baker et al (2012) reported that when cells grow in a
monolayer, they can adhere and spread freely in the horizontal plane but lack support for
spreading in the vertical dimension, which exists in vivo. The formation of normal epithelial
structures requires adhesive and mechanical signals from neighbouring cells and basement

Results and Discussion
59
membrane in order to control proliferation (Baker & Chen, 2012a). Thus, the dimension in
which cells are cultured is a crucial fate determinant and culturing cells in monolayer drives
abnormal cell function and proliferation, whereas 3D culture mimics a more physiological
state.
Figure 3.4 – Cell (a)) and aggregate (b)) concentration during aggregation of NSCLC
cell lines in stirred culture systems. Presented data displays mean ± SD from 3 (H460) and 2 (H1650)
independent experiments. ** P<0.01 and *P<0.05 represent the significant differences between day 3
and day 0 of H460 and H1650 cell concentration. Black asterisks (* P<0.05, ** P<0.01 and ***
P<0.001) represent significant differences between H460 and H1650 aggregate concentration in each
timepoint. Statistical analysis was done by one-way ANOVA analysis with Tukey’s post multiple
comparison test.
Oppositely to the cell concentration profiles, in which both cell lines presented
similar growth profiles, the analysis of aggregate concentration revealed a different trend
(figure 3.4 b)). The number of aggregates in culture formed by H460 cells grew
continuously during the three days of aggregation phase. On the other hand, the
concentration of H1650 aggregates in suspension decreased from day 1 onwards after an
initial significant increase at the first day of aggregation. The number of aggregates in
suspension was always statistically significantly different between H460 and H1650 cells
throughout the aggregation phase, with different levels of significance at each day of culture
as indicated with asterisks in figure 3.4 b).
In summary, H460 and H1650 cells formed homogeneous, spherical and compact
aggregates with high viability (figure 3.1) and cell death was not significant during
aggregation (figure 3.2). These results indicated that NSCLC aggregates were successfully
produced using stirred culture systems. Moreover, the aggregation strategy resulted in
suspension culture of H460 cells with high viability, that were not obtained by other authors
a) b)
0 1 2 3
0
500
1000
1500
2000H460
H1650
** ****
Time (day)
Ag
gre
gate
Co
nce
ntr
ati
on
(ag
g/m
L)
0 1 2 3
0.0
0.5
1.0
1.5
Time (day)
Ce
ll C
on
ce
ntr
ati
on
(x
10
6ce
ll/m
L)
** *

Results and Discussion
60
when culturing H460 in suspension, since they noticed a decrease in cell survival due to
anoikis (Chunhacha, Pongrakhananon, Rojanasakul, & Chanvorachote, 2012; Lloyd & Hardin,
2011; Pongrakhananon, Nimmannit, Luanpitpong, Rojanasakul, & Chanvorachote, 2010;
Rungtabnapa, Nimmannit, Halim, Rojanasakul, & Chanvorachote, 2011). Anoikis is a type of
cell death that occurs when cells do not have cell-cell or cell-ECM attachment (Paoli,
Giannoni, & Chiarugi, 2013; Wei, Yang, Zhang, & Yu, 2004). Anoikis constitutes an essential
defense mechanism that prevents detached cells to adhere to new matrices in the wrong
tissues and their abnormal growth in those sites, which can turn into a metastasis lesion (Y.-
N. Kim, Koo, Sung, Yun, & Kim, 2012; Sakuma et al., 2010; Wei, Yang, Zhang, & Yu, 2002). A
possible explanation for the successful formation of H460 aggregates in contrast with other
works is the fact that those previous studies were performed in static 3D culture conditions,
which provide significantly different culture conditions than the stirred tank system used in
this thesis work. In the present work, the use of stirred culture systems promoted cell-cell
interactions due to hydrodynamic forces (Moreira et al., 1995), may be responsible for the
absence of anoikis. Furthermore, stirred culture systems allow efficient mass transport, with
diffusion of oxygen, nutrients and pro-survival signals from one cell to another within the
aggregates.
The increase on H460 aggregate’s size and concentration, together with an increase
in cell concentration (figures 3.3 and 3.4 a)) suggested that the rise in H460 aggregate’s
size was mainly due to cell proliferation (figure 3.4 a)). On the contrary, the increase on
H1650 aggregate’s size (figure 3.3) and the decrease on H1650 aggregate´s concentration,
together with the increase in cell concentration suggested that H1650 aggregate’s size
increase was mainly due to aggregate fusion. This phenomenon contributed to the
production of larger aggregates than H460 aggregates (figure 3.3). These observations,
together with the fact that H460 had a non-spherical shape at day 1 and a smaller size than
H1650 aggregates throughout time whereas H1650 aggregates were already round and
bigger at day 1 (figure 3.1) might be related to a EMT in H460 cells. It is described in the
literature that these cells show low baseline expression of E-cadherin, an epithelial marker
essential in cell adhesion, and high expression of vimentin, a mesenchymal marker related
with higher motility and lower cell adhesion (Coldren et al., 2006; E. Y. Kim et al., 2014;
Matsubara et al., 2010; Pallier et al., 2012). In consequence, these properties of H460 cells
might explain a reduced adhesion to neighbouring tumour cells and a longer period
necessary to establish the formation of round and compact aggregates when in comparison

Results and Discussion
61
with H1650 cells. Moreover, this may be further related with large-cell carcinoma
pathological characteristic of fast spreading (Table 1.1) (Popper, 2011; Sun et al., 2012).
Glucose and lactate levels in the culture medium were monitored during aggregation,
in order to evaluate cell metabolism (Birsoy et al., 2014; H. Cruz et al., 2000; Zielke et al.,
1980).
0 1 2 3
0
5
10
15
Time (day)
Glu
co
se C
on
cen
trati
on
(mM
)
0 1 2 3
0
5
10
15H460
H1650
Time (day)L
acta
te C
on
cen
trati
on
(mM
)
Figure 3.5 – Concentration of glucose (a) and lactate (b) in the cell culture medium during
aggregation of NSCLC cell lines in stirred culture systems. Data are mean ± SD from 4 (H460 cell
line) and 5 (H1650 cell line) independent experiments.
For both H460 and H1650 cell cultures, there was a decrease in glucose and an
increase in lactate concentration in l culture medium along time, with no statistically
significant difference between the two cell lines (figure 3.5). These results indicated that
cells were metabolic active. Furthermore, the glucose concentration profile revealed that
there was no nutritional limitation regarding glucose supplementation since there was no
depletion of this specific metabolite (figure 3.5 a)). Moreover, the values of lactate
measured in the cell culture medium did not reach toxic values. Lactate levels superior to
20mM were shown to be toxic for culture of chinese hamster ovary (CHO) cells in vitro
(Castilho, Moraes, Augusto, & Butler, 2008). Nevertheless, cancer cells are reported to be
adapted to high acid lactic concentrations (Carmona-Fontaine et al., 2013; Goetze, Walenta,
Ksiazkiewicz, Kunz-Schughart, & Mueller-Klieser, 2011; Sukhatme & Chan, 2012).
The determination of glucose and lactate concentration in the cell culture medium
(figure 3.5 a) and b)) allowed to calculate the specific rates of glucose consumption (qGlc)
and lactate production (qLac), respectively (figure 3.6 a) and b)).
a) b)

Results and Discussion
62
0-1 2-30
5
10
15
**
Time (day)
qG
lc (
µm
ol/
mil
lio
n c
ell
day
-1)
0-1 2-30
5
10
15H460
H1650
**
**
Time (day)
qL
ac (
µm
ol/
mil
lio
n c
ell
day
-1)
Figure 3.6 – Specific metabolic rates of glucose consumption (a) and lactate production (b)
during aggregation of NSCLC cell lines in stirred culture systems, from day 0 to day 1 and from day 2
to day 3 of cell culture. Data are mean ± SD from 3 independent experiments (H460 and H1650
cells). Asterisks indicate significant difference (* P<0.05, ** P<0.01 and *** P<0.001) by one-way
ANOVA analysis with Tukey’s post multiple comparison test.
For both H460 and H1650 cell lines, there was a tendency towards a decrease in
qGlc (figure 3.6 a)) and in qLac (figure 3.6 b)) during aggregation. H1650 cells produced
higher levels of lactate than H460 cells from day 0 to day 1 of aggregation (figure 3.6 b))
without consuming statistically significant higher amounts of glucose than H460 cells on that
time period (figure 3.6 a)). This observation suggested that H1650 cells used glutamine
(presented in the cell culture medium due to GlutaMAXTM-1 (see Materials and Methods,
section 2.1)) as an alternative energy and carbon source to glucose during the first hours of
aggregation (Daye & Wellen, 2012). This could be seen as an adaptation response to a new
environment and culture condition from 2D to 3D. Cancer cells are known to consume
glutamine, besides glucose, in order to produce the necessary biomass (Daye & Wellen,
2012; Newsholme et al., 2003). Glutamine could have been uptaken by H1650 cells,
producing glutamate, which could then be further metabolized to α-ketoglutarate that would
enter in the TCA cycle (Maranga & Goochee, 2006). Ultimately, this sequence of events
would result in the production of pyruvate, which in turn, could be converted to lactate
(figure 1.8), increasing qLac by H1650 cells (figure 3.6 b)). However, further detailed
investigation need to be done to confirm this hypothesis, for instance, with metabolic flux
analysis (MFA) using 13C labeled glucose and glutamine (Metallo, Walther, & Stephanopoulos,
2009; Walther, Metallo, Zhang, & Stephanopoulos, 2012). Furthermore, the ration between
qGlc and qLac (YLac/Glc) allowed defining the glycolytic metabolic efficiency throughout time
(figure 3.7). . A highly efficient glucose metabolism, in which pyruvate produced in glycolysis
is being incorporated in the TCA cycle with consequent energy production and less lactate

Results and Discussion
63
production, leads to YLac/Glc lower than 2(Cruz et al., 1999, 2000; Maranga and Goochee,
2006).
0-1 2-30
2
4H460
H1650
Time (day)
YL
ac/G
lc
Figure 3.7 – Cellular Metabolic efficiency during aggregation of NSCLC cell lines in stirred
culture systems. Data are mean ± SD from 3 independent experiments (H460 and H1650 cells).
Statistical analysis by one-way ANOVA analysis with Tukey’s post multiple comparison test.
H460 and H1650 aggregates had a similar metabolic efficiency profile which remained
approximately constant during aggregation time, reaching values lower than 2 during the
time period assessed (figure 3.7). A slight decrease on the mean ratio was observed for
H460 cells between the first day of aggregation and the third day, however with no
statistically significance. These results suggested an efficient metabolic profile, in contrast
with Warburg effect commonly associated with cancer cells (Carmona-Fontaine et al., 2013;
Hsu & Sabatini, 2008). Comparing with 2D cell culture routinely performed prior
aggregation, H460 and H1650 3D cell culture had higher metabolic efficiency (YLac/Glc <2)
whereas Warburg effect was noticed in 2D cell culture (YLac/Glc= 2.03 ±0.146))). In
accordance, H460 and H1650 cells have been reported to have high rate of glycolysis and
reduced mitochondrial respiration, leading to the Warburg effect, when cultured in 2D
conditions (Amoêdo et al., 2011; Hao et al., 2010; Zhang, C. et al., 2011). The molecular
signals from cell-cell and cell-ECM interactions presented in vivo, involved in control of cell
proliferation (Ref das que tinhas atrás), may have led to lower proliferation rates in 3D cell
compared to monolayer cultures, and consequently an increase in YLac/Glc (Baker and Chen,
2012; von der Mark et al 1977; Petersen et al., 1992). The differences observed between 2D
and 3D H460 and H1650 metabolic efficiency for the first three days of culture might also be
related with a possible early adjustment period of the cells to the new culture conditions.
For a more powerful analysis, monitoring of glucose consumption and lactate production
rates must be followed for longer culture periods, as it will be discussed later in this thesis.

Results and Discussion
64
The adjustments on stirring parameters effectively controlled aggregate size and
shape, avoided aggregate clumping and allowed an efficient transport of nutrients and oxygen
to the aggregates since these were composed mainly by viable cells and there were no
necrotic centres, as assessed by FDA/TOPRO fluorescent viability assay (figure 3.1). The
different stirring profiles between cell lines (see Materials and Methods, section 2.5) may be
due to the differences in NSCLC subtype, since H1650 was derived from adenocarcinoma
and H460 from a large-cell carcinoma (Table 2.1). Large cell carcinoma is characterized by a
fast spreading and lower expression of cell-cell adhesion proteins, such as E-cadherin, ß-
catenin, integrins, zonula occludens 1 (ZO-1) (Popper, 2011; Sun et al., 2012; Coldren et al.,
2006; Kim, E. Y. et al., 2014; Matsubara et al., 2010; Pallier et al., 2012). These cell-cell
adhesions proteins are responsible for maintaining tight junctions, adherent junctions,
desmosomes, gap junctions, and other cell-cell interactions which help to form epithelial
tissue (Miyoshi & Takai, 2008; X. Zhong & Rescorla, 2012). These adhesion sites between
adjacent epithelial cells are essential for cell function and homeostasis of the epithelial tissue
(J. Partanen, 2012). However, molecular characterization with immunodetection and
Western blot (WB) analysis should be carried out to confirm the correlation of different
stirring profiles with different expression of cell-cell adhesion proteins, such as E-cadherin, ß-
catenin, integrins and ZO-1.
In conclusion, this agitation-based approach using spinner vessels is an efficient
strategy for the generation of 3D NSCLC cellular aggregates resembling the cell-cell
interactions and the 3D cellular organization. H460 and H1650 cellular aggregates were
successfully produced with round and compact shape, high cell viability and proliferation
ability, low levels of cell death and metabolic functionality. This stirring strategy is
reproducible, since it produced homogenous aggregates in several independent experiments.
On top of that, it is a highly robust system as due to its simplicity and efficiency, can be
adapted according to each cell line requirements. Moreover, this approach can provide a
significant input for the generation of knowledge on NSCLC cellular aggregates using stirred
culture systems as currently there is a lack of published data on this topic.
3.2. Culture of encapsulated NSCLC aggregates in stirred culture systems
Co-cultures of tumour cell aggregates together with immortalized, non-transformed
normal lung fibroblast (NFs) was the second step of the strategy to develop a 3D NSCLC
cellular model that could better mimic NSCLC microenvironment. The H1650 cell line was
Results and Discussion
65
selected. as the strategy implemented in the previous section was successful in the
establishment of reproducible spherical, compact and homogeneous H1650 cell aggregates.
Moreover, H1650 cells represents a subtype of NSCLC, the bronchioalveolar carcinoma,
with high levels of incidence (Shivanthan and Wijesiriwardena, 2011; Tan et al., 2003) with a
metastatic potential (Gong et al., 2011), thus being a feasible cell model to study the effect of
co-culture with fibroblasts on culture progression. Tumour microenvironment is composed
by a wide array of cell types, including fibroblasts, immune cells and vascular cells but this
thesis focused on the establishment of a cell model suitable for assessment of tumour-
fibroblast cross-talk.. An alginate microencapsulation strategy was pursued in order to
provide mechanical support and to confine the co-cultures within a restricted environment,
with the different cell types organized spatially in an “in vivo-like” configuration, in which
cancer aggregates and stromal cells could interact and proliferate. This spatial organization
resembled the cellular heterogeneity within a tumour tissue, mimicking the heterogeneous
distribution of cancer and stromal cells in the tumour.
H1650 cells were induced to form cellular aggregates prior encapsulation by culturing
H1650 single cells using the previously described conditions (see Materials and methods,
section 2.5). Encapsulation was performed at day 3 of H1650 aggregation, when H1650
aggregates already had a spherical and compact shape (figure 3.1 IV)). Mono- and co-
cultures of H1650 aggregates with NFs were performed in parallel as described in Materials
and Methods, section 2.5. H1650 aggregates encapsulated with and without single cells of
NFs were cultured in spinner flasks (figure 2.2), using the culture parameters described in
the previous section with a constant stirring speed of 60 rpm, up to 15 days. Alginate
capsules contained at least one H1650 aggregate in both mono-culture and co-culture
conditions (figure 3.8). In co-culture condition, NFs surrounded H1650 aggregates and they
were encapsulated in a H1650/NFs cell ratio of 1/1 (figure 3.8 b)).
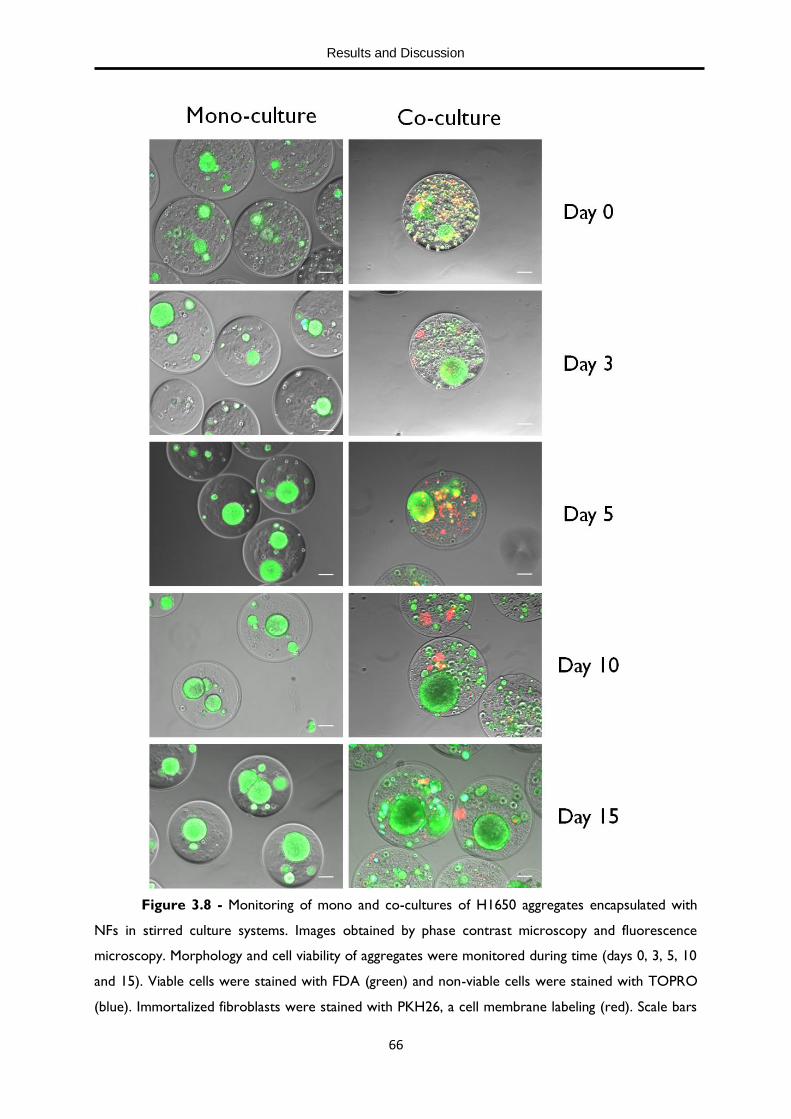
Results and Discussion
66
Figure 3.8 - Monitoring of mono and co-cultures of H1650 aggregates encapsulated with
NFs in stirred culture systems. Images obtained by phase contrast microscopy and fluorescence
microscopy. Morphology and cell viability of aggregates were monitored during time (days 0, 3, 5, 10
and 15). Viable cells were stained with FDA (green) and non-viable cells were stained with TOPRO
(blue). Immortalized fibroblasts were stained with PKH26, a cell membrane labeling (red). Scale bars

Results and Discussion
67
represent 100µm. Data are from one representative experiment of 2 independent experiments for
both conditions.
Both in mono- and co-cultures, aggregates were composed mainly by viable cells
(FDA, green), with just few non-viable cells (TOPRO, blue) detected (figure 3.8).
Moreover, no necrotic centres were observed in aggregates in both conditions (figure 3.8),
which suggested that the stirring conditions contributed for an efficient nutrient and oxygen
distribution within the vessel and that alginate capsules allowed an efficient mass transport,
enabling the diffusion of nutrients and oxygen to the centre of aggregates. In contrast, higher
levels of cell death were observed on the fibroblast component throughout time (figures
3.8). There was an increase in LDH cumulative values throughout time for both cultures,
which reflected an increase in cell death during cell culture (figure 3.9).
0 5 10 15
0.00
0.02
0.04
0.06
0.08
0.10H1650 Mono-Culture
H1650 Co-Culture
*****
**
**
*
**
Time (day)
LD
H c
um
(U
/mL
)
Figure 3.9 – Cell death expressed by cumulative values of LDH released during mono- and
co-cultures of H1650 aggregates encapsulated with NFs in stirred culture systems. Data are mean ±
SD from 2 independent experiments for each condition. * * P<0.01 and * P<0.05 represent significant
differences from day 3 to day 0. Black asterisks represent significant differences between mono- and
co-cultures. (* P<0.05, ** P<0.01 and *** P<0.001) by one-way ANOVA analysis with Tukey’s post
multiple comparison test.
NFs contributed to higher values of cumulative LDH in co-culture condition,
indicative of higher cell death (figure 3.8). The alginate capsules used in this work contained
RGD adhesion motifs to enhance fibroblast adhesion to the polymeric matrix and
consequently to promote their viability and the establishment of their typical morphology
(Horowitz et al., 2007). However the concentration of adhesions motifs might have been

Results and Discussion
68
insufficient in order to induce those effects to a full extent. Moreover, another possible
explanation can be attributed to the ratio of tumour cells/fibroblasts. An increase of
fibroblast concentration within the capsules might provide the required signalling cues
derived from cell-cell and cell-ECM interactions, assisting them on positive feedbacks loops
and promoting cell survival (Ref). One of advantages of model proposed in this work relies
on its versatility and the possible explanations for fibroblast cell death observed in figure
3.8 can be easily assessed on future experiments by adjusting specific parameters on the
experimental set-up, namely the GRGDSP peptide-coupled MVG alginate proportion relative
to UP-MVG alginate and NFs initial concentration.
Caspase-3 is an effector protease that can activate degradation enzymes, leading to
apoptosis and, in consequence, to cell death (Singhal, Vachani, & Antin-ozerkis, 2005).
Therefore, cell apoptosis was assessed by evaluation of caspase-3 activity, as described in
Materials and Methods, section 2.4.5, in mono- and co-culture at days 5 and 15 by
fluorescence microscopy (figure 3.10).
Figure 3.10 - Evaluation of apoptotic activity during mono- and co-cultures of H1650
aggregates encapsulated with NFs in stirred culture systems at days 5 and 15 of culture by
fluorescence microscopy. Detection of capase-3 activity (green) with NucViewTM 488, caspase-3
substrate, and mitochondrial activity (red) with MitoViewTM 633, far-red fluorescent mitochondrial
dye. Scale bars represent 100 µm. Data is from one representative experiment for both conditions.

Results and Discussion
69
Mitochondrial activity (in red) was detected in all aggregates (figure 3.10), indicating
cell viability. Although some apoptotic cells could be observed for mono- and co-cultures at
days 5 and 15, there were not an accumulation of apoptotic cells in specific regions of
aggregates, such as apoptotic centres. This suggested that this microencapsulation strategy
combined with this agitation-based approach allowed a good diffusion of nutrients and
oxygen to the whole aggregate, promoting high cell viability (figure 3.8) with no apoptotic
centres (figure 3.10) and, therefore, a long-term cell culture. Although there were some
cell death detected throughout time for both conditions (figures 3.8 and 3.9), this was not
due to apoptosis.
However, these results are just preliminary and additional research will be carried
out to further understand the cell death mechanisms by using, for example, spheroids
cryosections and immunofluorescence assays with apoptotic markers, such as M30 (caspase-
cleaved fragment of CK18), induced myeloid leukemia cell differentiation protein (MCL1),
BCL-2 and pro-apoptotic Bcl-2 family member protein BIM, in order to provide further
characterization.
The effect of co-culture on aggregate area was also analyzed. Despite oscillations in
aggregate’s area, especially in co-culture, there was not a significant tendency throughout
time (figure 3.11). H1650 aggregates were larger and had a more heterogeneous area’s
distribution in co-culture condition at days 5 and 10 (figure 3.11) than in mono-culture. At
day 5, aggregates in mono-culture had an average area of 5.1 ± 5 (x 103 µm2) and in co-
culture an average area of 11.5 ± 9.6 (x 103 µm2). At day 10, mono-culture aggregates
presented a mean area of 4.3 ± 5.9 (x 103 µm2) and co-culture aggregates an average area of
12.2 ± 14.1 (x 103 µm2). In future experiments, a higher number of aggregates must be
measured on further experiments in order to investigate if NFs have any clear effect on
aggregate’s area.

Results and Discussion
70
0
20
40
60
80
3 5 7 10 15
******
***
***
Time (day)
Ag
gre
gat
e A
rea
(x1
03µ
m2)
Figure 3.11 - Aggregate area profile of H1650 encapsulated aggregates in mono- and co-
culture with NFs using stirred suspension culture systems; data represents mean ± SD of the area of
at least 100 aggregates from 2 independent experiments for each condition. Area of aggregates was
measured as described in Materials and Methods, section 2.7. *** indicates significant difference
between mono- and co-culture at days 5 and 10 with P < 0.001 by one-way ANOVA analysis with
Tukey’s post multiple comparison test. *** indicates significant difference between day 3 and day 10
and between day 7 and day 10 for co-culture condition with P<0.001 by one-way ANOVA analysis
with Tukey’s post multiple comparison test.
Regarding cell concentration, there was an increase for mono- and co-cultures, which
presented similar growth profile (figure 3.12 a)). These results suggested that in the co-
culture conditions studied, fibroblasts did not affect the proliferation of cancer cells, which
maintained their replication ability until the end of the cultures. In order to confirm this
result, immunodetection, WB and RT-qPCR analysis of Ki67, a proliferation marker, should
be performed. To complement these results, cellular incorporation of 5-bromo-2’-
deoxyuridine (BrdU) or 5-ethynyl-2´-deoxyuridine (EdU), nucleoside analogues to thymidine
that are incorporated into DNA during active DNA synthesis and can be detected by flow
cytometry and/or immunodetection.

Results and Discussion
71
0 5 10 15
0.0
0.2
0.4
0.6
0.8
1.0H1650 Mono-culture
H1650 Co-Culture
Time (day)
Ce
ll C
on
ce
ntr
ati
on
(1
06ce
ll/m
L)
5 10 150.0
0.5
1.0
1.5H1650 Mono-culture
H1650 Co-culture
Time (day)
Ag
gre
gate
Co
nce
ntr
ati
on
Figure 3.12 – Cell (a) and aggregate (b) concentration of H1650 encapsulated aggregates in
mono- and co-culture with NFs using a stirred suspension culture system. Data are mean ± SD from
2 independent experiments for each condition. Asterisks represent significant differences between
mono- and co-cultures. (* P<0.05, ** P<0.01 and *** P<0.001) by one-way ANOVA analysis with
Tukey’s post multiple comparison test.
Regarding aggregate concentration, it remained constant throughout time for both
conditions, which suggest that there was no fusion of aggregates (figure 3.12 b)) and that
co-culture with NFs, in the conditions tested, did not induce any significant change on this
specific parameter of H1650 cells. Once again, future experiments should contemplate the
possibility of analyzing a higher number of aggregates, in order to confirm the presence or
absence of any specific trend on the effect of fibroblasts on H1650 aggregates, as well as
different approaches to improve fibroblast viability.
In summary, H1650 aggregates presented high viability and remained compact and
spherical during the whole culture time in mono- and co-culture conditions (figure 3.8).
Moreover, the size of generated aggregates was not sufficient to create oxygen and nutrients
limitations and, consequently, apoptotic centres inside the aggregates (figure 3.10). Colon
a)
b)

Results and Discussion
72
cancer aggregates previously generated in spinner vessels in our group presented clear
apoptotic cores which were related to their higher dimension and consequently to
limitations on the diffusion of nutrients and oxygen (Alexandra & Silva, 2013).
3.3. Metabolic characterization of encapsulated NSCLC aggregates in mono- and
co-culture
There was a decrease in glucose concentration and an increase in lactate
concentration on cell culture medium along culture time for both mono- and co-cultures
(figure 3.12), indicating that cells were metabolic active. The increase in glucose
concentration and the decrease in lactate concentration at days 3, 5, 7, 10 and 12
(highlighted by arrows) corresponded to 50% medium exchange in order to mimic the
metabolite supply and clearance obtained with blood circulation, responsible for supplying
glucose and oxygen to the cells and removing waste metabolites from the cells (see Materials
and Methods, section 2.3.3). Cells were not glucose deprived during the whole cell culture
time,. This enabled the maintenance of long-term cell cultures, with the high cell viability
(figure 3.8) and cell proliferation (figure 3.11 a)) until the last days of culture . At day 15,
lactate concentration reached 17.4 ± 0.23 mM (figure 3.12 b)), which were probably still
not toxic for H1650 cells. In fact, H1650 cells have been previously reported to be adapted
to high levels of lactate (Carmona-Fontaine et al., 2013; Y Zhao, Butler, & Tan, 2013). In
addition, lactate might be used as energy source by tumour cells. Pértega-Gomes et al (2014)
reported a higher membranous expression of the lactate transporter monocarboxylate
transporter I (MCT1), in cancer cells co-cultured with CAFs, suggesting transport of lactate
into tumour cells from the acidic extracellular environment, which could mean that lactate
might be used as a fuel by oxidative cancer cells (Pértega-Gomes et al., 2014). These results
also highlight the relevance of the metabolic interplay and crosstalk between tumour cells
and fibroblasts. In this thesis, a preliminary metabolic profiling was performed by tracking
glucose and lactate in the culture supernatants (figures 3.14 a and b, respectively) and
calculating glucose consumption (figure 3.14 c)) and lactate production (figure 3.14 d))
rates, both mono- and co-cultures of H1650 and H1650/NFs, respectively.
a) b)

Results and Discussion
73
0 5 10 15
0
5
10
15
** *****
***
Time (day)
Glu
co
se C
on
cen
trati
on
(m
M)
0 5 10 15
0
5
10
15
20H1650 Mono-Culture
H1650 Co-Culture
***
***
***
**
**
Time (day)
Lacta
te C
on
cen
trati
on
(m
M)
0-3 3-5 5-7 7-10 10-12 12-150
2
4
6
8
10
**
***
Time (day)
qG
lc (
µm
ol/
mil
lio
n c
ell
day
-1)
0-3 3-5 5-7 7-10 10-12 12-150
2
4
6
8
10H1650 Mono-Culture
H1650 Co-Culture
***
***
*
Time (day)
qL
ac (
µm
ol/
mil
lio
n c
ell
day
-1)
Figure 3.13 – Concentration of glucose (a) and lactate (b) in the cell culture medium of
H1650 encapsulated aggregates in mono- and co-culture with NFs using a stirred suspension culture
system. Arrows represent 50% of medium exchange. Specific metabolic rate of H1650 encapsulated
aggregates in mono- and co-culture with NFs using a stirred suspension culture system for glucose
consumption (c) and lactate production (d). Data represents mean ± SD from 2 independent
experiments for each condition. Asterisks indicate significant difference (* P<0.05, ** P<0.01 and ***
P<0.001) by one-way ANOVA analysis with Tukey’s post multiple comparison test.
c)
d)

Results and Discussion
74
Mono-cultures of H1650 cells presented lower glucose concentration and higher
lactate concentration on culture supernatant than co-cultures H1650 aggregates (figure
3.13 a) and b)) Nonetheless, specific consumption and production rates were not
significantly different between both cell cultures. It can be hypothesized that the observed
differences in metabolite concentration might be due to lactate consumption by cancer cells
associated with upregulation of MCT1 (Amoedo, Rodrigues, & Rumjanek, 2014; Pértega-
Gomes et al., 2014). However, this possibility still needs to be further addressed in future
studies, through a complete metabolic flux analysis with labeled metabolites,that would allow
distinguishing the contribution of each cell type and, for example, immunodetection and gen
e expression of MCT1 protein.
There was an overall decrease in qGlc and qLac for both mono- and co-culture
throughout time (figure 3.13 c) and d)). This could be indicative of a less proliferative
character of the cells, which might be achieving a plateau phase after the second week of
culture. Regarding lactate production (figure 3.13 b)), there were higher levels in mono-
culture on the first three days of cell culture, which can be related with lactate consumption
by cancer cells in presence of NFs as an alternative energy source to glucose (Al, 2010).
After these first days of culture, there were no statistically significant differences between
the mono- and co-cultures in lactate production rates. This result can be due to cell death
on fibroblasts component throughout time, which could decrease the possible effect of NFs
on the metabolic activity of cancer cells. However, the effect of NFs on glucose consumption
and lactate production has to be further investigated in order to understand if the NFs had
an additive or synergistic effect in qGlc and qLac when co-cultured with cancer-cells (due to
metabolic tumour-stroma crosstalk).

Results and Discussion
75
0-3 3-5 5-7 7-10 10-12 12-150.0
0.5
1.0
1.5
2.0
2.5H1650 Mono-Culture
H1650 Co-Culture
*
**
Time (day)
YL
ac/G
lc (
mo
l/m
ol)
Figure 3.14 – Yield of lactate/glucose of H1650 encapsulated aggregates in mono- and co-
culture with NFs in stirred culture systems. Data represents mean ± SD from 2 independent
experiments for each condition. Asterisks indicate significant difference (* P<0.05) by one-way
ANOVA analysis with Tukey’s post multiple comparison test.
The values of YLac/Glc varied between 1 and 2 in mono-cultures and 1 and 2.3 in co-
cultures (figure 3.14) throughout time. This suggested that there was a decrease in
metabolic efficiency during time, especially during the last days of cell culture (day 12-15)
(figure 3.14). In the beginning of cell culture YLac/Glc was inferior to 2, which indicated that
consumed glucose was entering the TCA cycle. However, H1650 cells in 2D are reported to
have high glycolytic metabolism and lower energy production via oxidative phosphorylation,
the Warburg effect (Amoedo et al., 2014; Amoêdo et al., 2011; Hao, Chang, Tsao, & Xu,
2010). However, in 3D cell culture, cells are reported to have lower cell metabolism due to
lower proliferation rates comparing to 2D cell culture (Amoêdo et al., 2011; Hao et al.,
2010).

Results and Discussion
76
3.4. ECM deposition and phenotypic characterization mono- and co-cultures
Fibroblasts are known to be essential for tumour environment structure and to
influence ECM composition in the tumour stroma with, for instance, an increase in collagen
production (Airola & Fusenig, 2001; Joyce & Pollard, 2009; H Peter Rodemann &
Rennekampff, 2011). This collagen production capacity is also reported in cancer cells
(Airola & Fusenig, 2001). Therefore, collagen that was entrapped by alginate capsules was
quantified in order to characterize the ECM component of the developed cell model (figure
3.15).
5 10 15
0
20
40
60
80Mono-culture
Co-culture
Time (day)
Co
llag
en
Co
nce
ntr
ati
on
(n
g/c
ap
sule
)
Figure 3.15 – Collagen concentration of H1650 encapsulated aggregates in mono- and
co-culture with NFs in stirred culture systems throughout time. Data represents mean ± SD from 1
experiment for each condition.
There was an increase in collagen concentration in both culture conditions
throughout time, with a tendency towards higher values in co-culture, especially at day 15,
which may indicate that fibroblasts promoted collagen deposition (figure 3.15). These
results suggested that the developed 3D cellular model successfully reproduced the collagen
accumulation characteristic of a reactive stroma (Airola & Fusenig, 2001). Cancer cells use
the collagen fibres produced by the fibroblasts, so they can migrate through the stroma and
reach the blood circulation, leading to metastasis (Joyce & Pollard, 2009). In addition, the
presence of lactate in the extracellular space upregulates type I collagen production (Goetze
et al., 2011), which can be related with collagen accumulation detected throughout time
(figure 3.15). Another important observation from collagen quantification is the increasing
protein detected even in mono-cultures, showing that H1650 present the ability to secrete
the ECM component when cultured in 3D conditions and encapsulated within a polymeric

Results and Discussion
77
matrix. Thus, the developed cellular model was able to recapitulate certain elements of
tumour microenvironment, namely regarding ECM components (Drury & Mooney, 2003;
Siegel & Massagué, 2003). Further experiments should be performed to evaluate the
influence of fibroblasts on collagen production, specifically through immunofluorescence
detection of collagen within the capsules.
The 3D NSCLC cell model generated in this thesis work was phenotypically
characterized at day 15 by immunofluorescence microscopy using markers are related to
hallmark features of cancer cells such as epithelial to mesenchymal transition and tumour
microenvironment (figure 1.9) (Hanahan & Weinberg, 2011). Molecular markers of
epithelial character (cytokeratin 18 – CK18), mesenchymal character (vimentin), polarity
(ZO-1 and F-actin) and ECM components (collagen IV) were used for characterization of the
H1650 aggregates throughout the culture period in both mono- and co-cultures .and results
are presented in figure 3.16..
Figure 3.16 - Immunocharacterization of H1650 encapsulated aggregates in mono- and
co-culture with NFs in stirred culture systems at day 15 of culture. Epithelial (CK 18, in red),
mesenchymal (vimentin, in red), polarity (ZO-1, in red), cytoskeletal organization (F-actin in green,
using the fluorescent molecular probe phalloidin) and ECM (Col IV, in red) markers were evaluated.
Nuclei were counterstained with DAPI (blue). Scale bars represent 100 µm. Data presented is from
one representative experiment for each condition.
At day 15, mono-cultures presented a clear epithelial phenotype with strong CK18
and apical ZO-1 immunolocalization, the later indicative of polarity (figure 3.16). However,
co-cultures presented a diffuse labeling and there was reduced detection of CK18, indicating
loss epithelial phenotype. Moreover, F-actin delineating cell junctions was less detected in
Mono-c
ulture
Co-c
ulture

Results and Discussion
78
H1650 aggregates cultured with fibroblasts (figure 3.16), suggesting the loss of epithelial cell
adhesion.
In addition, Col IV (in red) was faintly expressed centrally within the aggregates
(figure 3.16). These results were in accordance with quantification of collagen deposition
(figure 3.15), indicating higher accumulation of ECM components within the co-cultures,
which is essential to recapitulate the in vivo tumour microenvironment. Moreover, the
mesenchymal marker vimentin was faintly detected in co-culture aggregates in contrast with
mono-culture aggregates, which had no vimentin expression (figure 3.16).
Immunocharacterization of our cultures suggested that in co-culture of H1650
encapsulated aggregates with NFs, epithelial cancer cells initiate the loss of their epithelial
phenotype and polarity, towards acquisition of a mesenchymal phenotype. At day 15 of
culture, this process is still at an early stage and requires further validation at a longer
culture period. At this period, tumour cells presented a mixed epithelial/mesenchymal
phenotype. Thus, the presence of stromal cells might be promoting the EMT process.
Acquisition of EMT phenotype by H1650 cells is essential to promote invasion, metastasis
and drug resistance (Christiansen & Rajasekaran, 2006; J. M. Lee et al., 2006; Xiao & He,
2010).
Further molecular characterization, with other markers such as epithelial marker E-
cadherin, through immunohistochemistry, WB and gene expression by reverse transcription-
qPCR, should be performed to confirm the epithelial/mesenchymal phenotype observed in
figure 3.16. Furthermore, samples from earlier time points would help to understand the
evolution of epithelial/mesenchymal phenotype throughout time. In addition, longer culture
periods could be advantageous to observe the phenotypic shift in more detail.
The work presented in this thesis comprised the development of a novel 3D NSCLC
cellular model in which recapitulation of tumour microenvironment can be established. The
strategy herein presented was based on co-culture of 3D NSCLC aggregates with fibroblasts
within hydrogel capsules in stirred culture systems and represent a novelty in the field of in
vitro models for NSCLC drug discovery. The novelty in our strategy relied on the
combination of three key parameters that contributed for the establishment of a long-term
co-culture NSCLC model: 3D cultures, stirred culture systems and cell encapsulation.

Results and Discussion
79
Firstly, the formation of H1650 aggregates was successfully established and tumour
cells presented high levels of viability throughout the culture period (figure 3.1). Cell-cell
interactions in 3D aggregates contributed for these viability levels as monolayer cultures lack
some of these features to retain cell viability (Breslin & O’Driscoll, 2013; Justice et al., 2009;
Zhang et al., 2006). In 2D cell culture, cells spread horizontally and lack the vertical
dimension and the adhesive and mechanical signals from neighboring cells existing in vivo.
These characteristics are essential for cell fate determination (Baker & Chen, 2012b). Thus
3D cellular organization is similar to physiological conditions (Baker & Chen, 2012a; Benien
& Swami, 2014; Pampaloni et al., 2007) . Secondly, the hydrodynamic forces of stirred
culture systems promote good diffusion of oxygen and nutrients and removal of waste
metabolites, which enables high cell viability and long-term cell cultures. This culture system
allows simple manipulation without affecting cell culture. This way, the alterations on cell
culture characteristics, such as cell proliferation, viability and metabolism, are exclusively due
to alterations in culture variables and not due to operation of the culture system. Thirdly,
encapsulation strategy allowed obtaining capsules with adequate characteristics for aggregate
culture. Capsules had an adequate permeability, stability and elasticity to enable a bi-
directional diffusion of nutrients, oxygen, waste metabolites and soluble factors with possible
paracrine function as well the retention inside the capsule of other soluble factors with
autocrine action. Moreover, the capsule’s dimension with approximately 500 µm of diameter
and the spherical shape offer an optimal surface to volume ratio. This is appropriate to
ensure a good mass diffusion to the centre of the capsule and to to accommodate NSCLC
aggregates with similar size to the ones generated after 3 days of 3D NSCLC cell culture
(figure 3.3). ECM is an essential characteristic of in vivo tissue microenvironment. The
presence of ECM is indispensible for an adequate cell culture, since it gives the mechanical
and adhesive support needed for cell survival, proliferation, differentiation and function. The
use of ECM components in in vitro cell culture allows confining cells in the same spatial
environment, promoting cell-cell and cell-ECM interactions that cells need to grow and
organize in a tissue-like structure (Faucheux, Tzoneva, Nagel, & Groth, 2006; Sieh et al.,
2012). This spatial confinement can include different types of cells, enabling co-cultures and
the recreation of the microenvironment. This allows studying the cell-cell interactions, such
as tumour-stroma crosstalk. Different materials are currently used in cell culture, such as
collagen, matrigel, laminin and alginate (El-sherbiny & Yacoub, 2013; Glicklis et al., 2000;
Godugu et al., 2013; Xu, Farach-Carson, & Jia, 2014). The use of inert materials to mimic

Results and Discussion
80
ECM characteristics are advantageous to study the tumor microenvironment as it does not
influence the cellular factors secretion, while other ECM-mimicking materials, such as
matrigel, have biologic origin and a non-defined composition, which can guide morphological
changes and cellular organization (Ivascu & Kubbies, 2006; Sodunke et al., 2007). Alginate is
already used to create hydrogels for cell encapsulation (Lan & Starly, 2011; O. SMIDSROD,
1974; Rebelo et al., 2014; Wikström et al., 2008). Alginate is an inert material and,
consequently, do not interfere with factors secretion by cells (Lukashev & Werb, 1998). In
addition, the gelification of alginate capsules was performed using Ba2+, which was reported
to give better long-term mechanical stability than Ca2+ ions, since Ca2+ -alginate gels are more
sensitive to chelators, such as the lactate that is produced by cells (O. SMIDSROD, 1974).
Moreover, lung tumour cells secrete surfactants that could affect the stability of the calcium-
crosslinked hydrogels (Meyboom, 1997). Ba2+ did not present any toxicity to the cells as a
crosslinking agent (Wikström et al., 2008; Zimmermann et al., 2007). Another advantageous
of using alginate to encapsulate different cell types and create co-cultures is the possibility to
separate the different cellular components, which enables to distinguish cell parameters, such
as cell proliferation, viability, metabolism, molecular characterization, between the different
types of cell. Moreover, the choice of alginate as the polymeric component and Ba2+ as the
crosslinking agent to design the matrices proposed in this work was appropriate, since the
developed capsules demonstrated stability and permeability for a long-term culture period.
Additionally, the use of alginate enables to vary its components (such as polymer molecular
weight, strength, thickness, chemical structure) in order to change permeability, stiffness and
mechanical strength and, thus, resembling specific ECM characteristics. The combination of
3D NSCLC cellular co-culture with stirred culture systems and alginate microencapsulation
constitutes a novel strategy for the development of a robust and scalable 3D NSCLC cell
model appropriate for pre-clinical research. Encapsulation of H1650 cells, which were prior
aggregated, with NFs allowed to co-culture different types of cells in stirred culture systems.
This strategy resembled the tumour microenvironment, including cell-cell and cell-ECM
interactions and tumour-stroma crosstalk and it was not performed before by other
authors. Encapsulation of single cancer cells and fibroblasts resulted in hybrid aggregates
(Dolznig et al., 2011; Hsiao et al., 2009). In these studies, spheroids were formed by
encapsulation of single cell suspensions from two different cell types (e.g. cancer cells and
fibroblasts) and fibroblasts migrated to the core or stood dispersed in the spheroid, mixed
with cancer cells in a non-organized way (Lan & Starly, 2011). These results increase the

Results and Discussion
81
importance of the strategy of aggregating cancer cells prior to its alginate encapsulation with
NFs in stirred culture systems. Alginate microencapsulation successfully allowed co-culturing
fibroblasts with cancer aggregates within the capsule, which was not accomplished by other
authors when encapsulating single cell fibroblasts, since the authors noticed that cells formed
a clamp few hours after encapsulation in alginate and died (Shimi, Hopwood, Newman, &
Cuschieri, 1991; Zhang et al., 2006). Moreover, this cellular model is very versatile and can
be used to encapsulate other types of cells, including immortalized and primary cell lines and
different types of cellular aggregates (de Vos & Marchetti, 2002; Rebelo et al., 2014; Tostões
et al., 2011; Wikström et al., 2008). Consequently, the developed cellular model allow
mimicking the microenvironment of other solid tumours, for instance, breast and colon
cancer (already accomplish in the group, data not published) and other tissues, such as liver
and brain (Alessandri et al., 2013; Ivascu & Kubbies, 2007; Rebelo et al., 2014; Sodunke et al.,
2007; Tostões et al., 2011; Zhang et al., 2005). Moreover, the generation of H460 aggregates
had not been yet accomplished in suspension systems, increasing the novelty of aggregation
using stirred culture systems. Previous studies aiming the development of H460 aggregates
were done in static 3D cell culture and reported high cell death due to anoikis (Chunhacha
et al., 2012; Lloyd & Hardin, 2011; Pongrakhananon et al., 2010; Rungtabnapa et al., 2011). In
fact, the novelty of the developed 3D cellular model also relies in the fact that there is lack
of literature on encapsulated NSCLC aggregates cultured in stirred systems, since NSCLC
aggregates are usually generated in hanging drop or liquid overlay techniques (Amann et al.,
2014; Chanvorachote et al., 2009; Ghosh, Lian, Kron, & Palecek, 2012; Ivascu & Kubbies,
2006; Rungtabnapa et al., 2011; Wei et al., 2002) or even embedded or on top of scaffolds
(Choi et al., 2010; Godugu et al., 2013; Penzberg, 2005). These approaches do not include
the alginate encapsulation strategy herein described nor he efficient mass transfer caused by
stirring parameter of the cell culture system. Therefore, recapitulation of the tumour
microenvironment created within the alginate capsule when co-culturing H1650 aggregates
with NFs provides novelty and increased biological relevance to the cellular model herein
described. Manipulation overtime was simple and did not disturb the cell culture, which
constitutes another advantage of this 3D cellular model comparing, for instance, with
hanging-drop or forced floating techniques, in which aggregates are separated in different
wells or compartments (Amann et al., 2014; Kelm et al., 2003; Morizane et al., 2011; Tung et
al., 2011). In contrast, the combined strategy herein developed allows tracking the same
culture along time. Large numbers of homogeneous spheroids can be generated (figures 3.1
Results and Discussion
82
and 3.8) with the combined strategy developed in this work and it is suitable for drug
testing because it allows standardized, rapid, and large-scale production of 3D NSCLC
cellular models mimicking tumour microenvironment. It is also important to notice that the
high cell viability (figures 3.8 and 3.11) and low cell apoptosis (figure 3.17) throughout
the whole cell culture time demonstrated that this 3D cellular model is suitable for assessing
disease progression and to test pharmaceutical compounds in different stages of disease. The
strategy developed by combination of 3D cell culture, alginate microencapsulation and
stirred systems lead to long-term cell cultures with high cell viability and proliferation. Thus,
this cellular model would allow correlating the alterations of those parameters, cell
apoptosis and aggregate’s size with drug response, since modifications on those criterions
are not related to the strategy itself.
The dynamic strategy proposed using stirred culture systems for aggregation of
NSCLC cell lines resulted in application of a hydrodynamic force that promoted cell-cell
interactions, which prevented anoikis, and efficient mass transport. In consequence, these
culture conditions allowed diffusion of pro-survival signals from one cell to another and of
oxygen and nutrients, resulting in NSCLC aggregates with high viability in suspension.
Moreover, during the whole cell culture time, aggregates did not lose the compact and
spherical shape and did not clump (figures 3.1 and 3.8) comparing to non-encapsulated
aggregates in suspension cultures that formed large clumps with irregular shape (Serra et al.,
2011). These results showed that the stirring profiles efficiently controlled size and shape of
aggregates. Culturing H1650 encapsulated aggregates with NFs in stirred culture systems
also resulted in high cell viability and long-term cell culture, since there was high cell viability
(figure 3.8), low cell death (figure 3.9) and no apoptotic centres (figure 3.10),
demonstrating a good mass transport. The 3D cellular organization obtained with this novel
strategy allowed cell proliferation (figures 3.4 a) and 3.12 a)) and metabolism
characteristic of cancer cells, including the production of lactate (figures 3.5 b) and 3.6
b)). In the first days of 3D cell culture, cancer cells had higher metabolic efficiencies
comparing with 2D cell culture (figures 3.7 and 3.14), characterized by the Warburg effect
(Hsu & Sabatini, 2008; Otto Warburg, Franz Wind, 1926). The differences in initial days of
3D cell culture in cellular metabolic efficiency could be to and adaption phase from 2D to
3D culture conditions and to alginate encapsulation. However, the Warburg effect was
observed later on cell culture (from day 12 to day 15 in encapsulated H1650 with NFs in
stirred culture systems) (figure 3.14). These results indicated that the developed cellular

Results and Discussion
83
model did not affect the metabolism characteristic of cancer cells. Longer culture periods
would allow studying this phenomenon in greater detail. Moreover, as alginate allows
separating the different cellular components from the co-culture, MFA studies with labeled
glutamine and glucose could be performed to further analyze the metabolic pathways
evolved in tumour-stroma crosstalk. Moreover, this 3D NSCLC cellular model mimics some
of ECM characteristics. The use of an alginate hydrogel simulates the architecture, chemistry
and signaling of in vivo environment comparing with 2D cultures (Ghidoni et al., 2008).
Alginate capsules fulfilled the requisites of permeability, stability and elasticity, allowing bi-
directional diffusion of nutrients, oxygen and soluble factors, which supported an efficient
and long-term cell culture with high cell viability (figures 3.8 and 3.12 a)). Inert alginate
provides an aqueous mild and favorable environment for cell encapsulation; however, its
natural structure does not provide adhesion points to the encapsulated cells which can
result in a loss of cell viability along the culture period. The addition of RGD peptides
mimicked the adhesion points of ECM existing in vivo (Faucheux et al., 2006; Sieh et al., 2012).
The inclusion of these adhesion sequences on the matrix is particularly relevant for the
encapsulation of fibroblasts, known for their elongated shape and anchorage-dependent
character (Faucheux et al., 2006). The inert properties of alginate (O. SMIDSROD, 1974)
and collagen deposition throughout time (figure 3.15) allowed to notice accumulation of
newly-synthesized ECM components, in accordance with Col IV immunodetection at day 15
for H1650 encapsulated aggregates with NFs cultured in stirred culture systems (figure
3.16). Cells constantly remodel local ECM by degrading or synthesizing new ECM elements,
such as collagen (Even-Ram & Yamada, 2005). A reactive stroma is characterized by collagen
deposition (Airola & Fusenig, 2001). These collagen fibers promote tumour metastasis (Joyce
& Pollard, 2009). This suggested an important role of fibroblasts in remodeling ECM
composition, probably due to tumor-stroma crosstalk and the physiological relevance of this
3D cellular model to mimic the tumour microenvironment, including ECM and tumour-
stroma interactions. The reduced expression of CK18, the diffuse labeling of ZO-1, , and
faint detection F-actin and vimentin in H1650 encapsulated aggregates with NFs in stirred
culture systems after 15days of cell culture suggested partial loss of polarity and epithelial
phenotype and early steps on the acquisition of a mesenchymal phenotype (figure 3.17).
Thus, fibroblasts could have enhanced the EMT process of cancer cells, as a result of
tumour-stroma crosstalk along cell culture time. EMT has been related to higher motility,
invasiveness and TKI resistance by EGFR mutated cancer cells, such as H1650 cells, during

Results and Discussion
84
NSCLC cancer treatment (G. Chen, Kronenberger, Teugels, Umelo, & De Grève, 2012;
Choi et al., 2010; Ladanyi & Pao, 2008; Pallier et al., 2012). Therefore, this 3D NSCLC
cellular model has the advantage to allow the study of EMT evolution throughout time and
further application in drug screening.
Further studies are still required to conclude about the effect of H1650 encapsulated
aggregates co-cultured with NFs in cell behaviour. Higher RGD-couple alginate: alginate ratio
and higher NFs cellular concentration should be tested in order to evaluate the possible
causes of NFs cell death detected throughout culture (figures 3.8 and 3.9). In next
experiments, measurements of aggregate’s area should consider more than 100 aggregates in
order to see a tendency in aggregates size (figure 3.12). The evaluation of apoptotic activity
needs further fluorescence assays using cryosections or entire aggregates and antibodies
against apoptotic markers, such as M30, MCL1, BCL-2 and BIM. This would allow confirming
that cell apoptosis was not detected in specific regions within the aggregate (as apoptotic
centres) and that fibroblasts cell death was not due to apoptosis, since they presented
mitochondrial activity throughout cell culture (figure 3.10). Moreover, MFA studies with
labeled glucose and glutamine would enable to identify the metabolic pathways used
preferentially by each cell type. Thus, it would enable to take further conclusions about the
glycolytic metabolism characteristic of cancer cells, known as Warburg effect (Carmona-
Fontaine et al., 2013; Daye & Wellen, 2012) and metabolic tumour-stroma crosstalk. MCT1
expression analysis by WB and RT-qPCR in H1650 encapsulated aggregates with NFs
cultured in stirred systems and its immunodetection in cryosections or entire aggregates
through confocal microscopy would give further support to the MFA results about the
possible lactate consumption by cancer cells (Al, 2010; Fiaschi et al., 2012; Pértega-Gomes et
al., 2014). Longer culture periods would also be suitable to characterize metabolic
differences throughout time. The effect of NFs on H1650 encapsulated aggregates
epithelial/mesenchymal phenotype should be confirmed by additional assays with
immunodetection on cryosections or in entire aggregates in order to confirm a decrease in
detection of epithelial and polarity markers, such as CK 18, ZO-1 and F-actin and, in
contrast, an increase of detection of mesenchymal markers, such as vimentin, in H1650
aggregates. E-cadherin should also be assessed by immunofluorescence, since it is one of the
mainly proteins involved in cell-cell adhesions (Bhatt, Rizvi, Batta, Kataria, & Jamora, 2013;
Böhm, Totzeck, & Wieland, 1994). This would allow confirming that NFs contributed to a
loss in epithelial phenotype and gain of mesenchymal characteristics, accelerating the EMT

Results and Discussion
85
phenomenon. The molecular expression of these epithelial and mesenchymal markers by
WB and RT-qPCR would give further information about the effect of NFs in cancer cells
phenotype. In addition, analyzing these parameters in different time points of cell culture
would allow to take further conclusions about phenotypic alterations in H1650 encapsulated
aggregates with NFs during co-culture in stirred culture systems. Moreover, the effect of
NFs in remodeling the ECM by collagen accumulation needs further assays on collagen
quantification, as well as molecular characterization of different collagen types (including Col
IV). Furthermore, application of this 3D cellular strategy in computer-controlled bioreactors
would allow a more accurate control on cell culture variables, enabling studying the effect of
specific parameters, such as oxygen, pH, temperature, on cell culture readouts.


Conclusion


Conclusion
89
4. Conclusion
This thesis work successfully accomplished the aim that was proposed. Combination
of 3D cell culture, stirred culture systems and alginate encapsulation generated a robust and
scalable 3D NSCLC cellular model that recapitulated the tumour microenvironment with
potential use for pre-clinical research and pharmacological applications. Alginate
encapsulation of H1650 aggregates with NFs in stirred systems resembled the 3D spatial
organization characteristic of in vivo tumour tissues, including cell-ECM and tumour-stroma
interactions. The culture strategy herein described is a valuable tool to obtain highly
reproducible homogeneous long-term cell cultures, while enabling a non-destructive
sampling. This 3D cellular model can be used to culture other types of cells with cancer
aggregates in order to study the tumour heterogeneity and, in consequence, the influence of
different types of cells, such as endothelial and immune cells in cancer cell behaviour.
Additionally, this 3D cellular model can be applied in drug screening test in pharmacological
studies, with the possibility of high throughput with phenotypic characterization. The
pharmacological potential of this strategy would allow a better understanding of tumour
biology and decreasing the time and costs associated with drug discovery
In conclusion, 3D cell culture using alginate encapsulation combined with a stirred
system successfully generated for the first time a 3D NSCLC cellular model that
recapitulates the tumour microenvironment suitable for pre-clinical research.


Perspectives


Perspectives
93
5. Perspectives
Detection of caspase 3 activity, ECM, CAFs, epithelial, mesenchymal and apoptotic
markers, by qRT-PCR, Western blot and immunofluorescence microscopy, will be used to
evaluate the effect of tumour microenvironment in cancer cell behavior.
Metabolic flux analysis tools with labeled glucose and glutamine will be performed to
better characterize the cell metabolism and evaluate the tumour-stroma metabolic crosstalk.
Encapsulation of cancer aggregates with CAFs would allow assessing the effect of
reactive stroma comparing to normal stroma cells (NFs) on cancer cell characteristics.
The 3D cell culture strategy developed could be further improved by using
controlled stirred tank bioreactors. It is expected that by controlling parameters such as
mixing, pH, temperature, oxygen (for example, hypoxia versus normoxia) and nutrient
supply (perfusion mode), a better understand of the role of tumour microenvironment in
tumour progression will be obtained.
Test different pharmaceutical compounds, such as docetaxel, a microtubule-stabilizing
taxane used in the clinical treatment of different types of cancer, will enable to validate this
cellular model as a promising tool in pre-clinical research.


References


References
97
7. References
Airola, K., & Fusenig, N. E. (2001). Differential stromal regulation of MMP-1 expression in benign and malignant keratinocytes. The Journal of Investigative Dermatology, 116(1), 85–92. doi:10.1046/j.1523-1747.2001.00223.x
Akhtar, N., & Streuli, C. H. (2013). An integrin-ILK-microtubule network orients cell polarity and lumen formation in glandular epithelium. Nature Cell Biology, 15(1), 17–27. doi:10.1038/ncb2646
Al, M.-O. et. (2010). 2010_Oxidative stress in cancer associated fibroblasts_reverse Warburg effect.pdf.crdownload. Cell Cycle, 9(16), 3256–3276.
Alcaraz, J., Nelson, C. M., & Bissell, M. J. (2004). Biomechanical approaches for studying integration of tissue structure and function in mammary epithelia. Journal of Mammary Gland Biology and Neoplasia, 9(4), 361–74. doi:10.1007/s10911-004-1406-8
Alessandri, K., Sarangi, B. R., Gurchenkov, V. V., Sinha, B., Kießling, T. R., Fetler, L., … Nassoy, P. (2013). Cellular capsules as a tool for multicellular spheroid production and for investigating the mechanics of
tumor progression in vitro. Proceedings of the National Academy of Sciences of the United States of America, 110(37), 14843–8. doi:10.1073/pnas.1309482110
Alevizakos, M., Kaltsas, S., & Syrigos, K. N. (2013). The VEGF pathway in lung cancer. Cancer Chemotherapy and Pharmacology, 72(6), 1169–81. doi:10.1007/s00280-013-2298-3
Alexandra, I., & Silva, M. (2013). Evaluation of Chemotherapeutic Potential of Natural Extracts Using 3D Models of Colon Cancer.
Alves, P. (1996). Two-Dimensional Versus Three-Dimensional Culture Systems: Effects on Growth and Productivity of BHK Cells, 52, 429–432.
Amann, A., Zwierzina, M., Gamerith, G., Bitsche, M., Huber, J. M., Vogel, G. F., … Zwierzina, H. (2014). Development of an innovative 3D cell culture system to study tumour--stroma interactions in non-small cell lung cancer cells. PloS One, 9(3), e92511. doi:10.1371/journal.pone.0092511
Amoêdo, N. D., Rodrigues, M. F., Pezzuto, P., Galina, A., da Costa, R. M., de Almeida, F. C. L., … Rumjanek, F. D. (2011). Energy metabolism in H460 lung cancer cells: effects of histone deacetylase inhibitors. PloS
One, 6(7), e22264. doi:10.1371/journal.pone.0022264
Amoedo, N. D., Rodrigues, M. F., & Rumjanek, F. D. (2014). Mitochondria: are mitochondria accessory to
metastasis? The International Journal of Biochemistry & Cell Biology, 51, 53–7. doi:10.1016/j.biocel.2014.03.009
Antony, V. B., Loddenkemper, R., Astoul, P., Boutin, C., Goldstraw, P., Hott, J., … Sahn, S. a. (2001). Management of malignant pleural effusions. The European Respiratory Journal, 18(2), 402–19. Retrieved from http://www.ncbi.nlm.nih.gov/pubmed/11529302
Babakoohi, S., Fu, P., Yang, M., Linden, P. a, & Dowlati, A. (2013). Combined SCLC clinical and pathologic characteristics. Clinical Lung Cancer, 14(2), 113–9. doi:10.1016/j.cllc.2012.07.002
Bailón-Moscoso, N., Romero-Benavides, J. C., & Ostrosky-Wegman, P. (2014). Development of anticancer drugs based on the hallmarks of tumor cells. Tumour Biology : The Journal of the International Society for Oncodevelopmental Biology and Medicine, 35(5), 3981–95. doi:10.1007/s13277-014-1649-y
Baker, B. M., & Chen, C. S. (2012a). Deconstructing the third dimension: how 3D culture microenvironments alter cellular cues. Journal of Cell Science, 125(Pt 13), 3015–24. doi:10.1242/jcs.079509
Baker, B. M., & Chen, C. S. (2012b). Deconstructing the third dimension: how 3D culture microenvironments alter cellular cues. Journal of Cell Science, 125(Pt 13), 3015–24. doi:10.1242/jcs.079509

References
98
Bechyne, I., Szpak, K., Madeja, Z., & Czyż, J. (2012). Functional heterogeneity of non-small lung adenocarcinoma
cell sub-populations. Cell Biology International, 36(1), 99–103. doi:10.1042/CBI20110151
Beetschen, J. C. (2001). Amphibian gastrulation: history and evolution of a 125 year-old concept. The
International Journal of Developmental Biology, 45(7), 771–95. Retrieved from http://www.ncbi.nlm.nih.gov/pubmed/11732838
Benien, P., & Swami, A. (2014). 3D tumor models: history, advances and future perspectives. Future Oncology (London, England), 10(7), 1311–27. doi:10.2217/fon.13.274
Bhatt, T., Rizvi, A., Batta, S. P. R., Kataria, S., & Jamora, C. (2013). Signaling and mechanical roles of E-cadherin.
Cell Communication & Adhesion, 20(6), 189–99. doi:10.3109/15419061.2013.854778
Birsoy, K., Possemato, R., Lorbeer, F. K., Bayraktar, E. C., Thiru, P., Yucel, B., … Sabatini, D. M. (2014).
Metabolic determinants of cancer cell sensitivity to glucose limitation and biguanides. Nature, 508(7494), 108–12. doi:10.1038/nature13110
Böhm, M., Totzeck, B., & Wieland, I. (1994). Differences of E-cadherin expression levels and patterns in human lung cancer. Annals of Hematology, 68(2), 81–3. Retrieved from http://www.ncbi.nlm.nih.gov/pubmed/7511935
Bradley, J., Thorstad, W. L., Mutic, S., Miller, T. R., Dehdashti, F., Siegel, B. a, … Bertrand, R. J. (2004). Impact of FDG-PET on radiation therapy volume delineation in non-small-cell lung cancer. International Journal of
Radiation Oncology, Biology, Physics, 59(1), 78–86. doi:10.1016/j.ijrobp.2003.10.044
Brenner, D. R., Boffetta, P., Duell, E. J., Bickeböller, H., Rosenberger, A., McCormack, V., … Hung, R. J. (2012).
Previous lung diseases and lung cancer risk: a pooled analysis from the International Lung Cancer Consortium. American Journal of Epidemiology, 176(7), 573–85. doi:10.1093/aje/kws151
Breslin, S., & O’Driscoll, L. (2013). Three-dimensional cell culture: the missing link in drug discovery. Drug Discovery Today, 18(5-6), 240–9. doi:10.1016/j.drudis.2012.10.003
Brito, C., Simão, D., Costa, I., Malpique, R., Pereira, C. I., Fernandes, P., … Alves, P. M. (2012). 3D cultures of human neural progenitor cells: dopaminergic differentiation and genetic modification. Methods (San Diego, Calif.), 56(3), 452–60. doi:10.1016/j.ymeth.2012.03.005
Burey, P., Bhandari, B. R., Howes, T., & Gidley, M. J. (2008). Hydrocolloid gel particles: formation, characterization, and application. Critical Reviews in Food Science and Nutrition, 48(5), 361–77.
doi:10.1080/10408390701347801
Carmona-Fontaine, C., Bucci, V., Akkari, L., Deforet, M., Joyce, J. a, & Xavier, J. B. (2013). Emergence of spatial
structure in the tumor microenvironment due to the Warburg effect. Proceedings of the National Academy of Sciences of the United States of America, 110(48), 19402–7. doi:10.1073/pnas.1311939110
Carterson, A. J., Ho, K., Ott, C. M., Clarke, M. S., & Pierson, D. L. (2005). A549 Lung Epithelial Cells Grown as
Three-Dimensional Aggregates : Alternative Tissue Culture Model for Pseudomonas aeruginosa Pathogenesis, 73(2), 1129–1140. doi:10.1128/IAI.73.2.1129
Casey, R. C., Burleson, K. M., Skubitz, K. M., Pambuccian, S. E., Oegema, T. R., Ruff, L. E., & Skubitz, a P. (2001). Beta 1-integrins regulate the formation and adhesion of ovarian carcinoma multicellular spheroids. The American Journal of Pathology, 159(6), 2071–80. Retrieved from
http://www.pubmedcentral.nih.gov/articlerender.fcgi?artid=1850600&tool=pmcentrez&rendertype=abstract
Castilho, L., Moraes, A., Augusto, E., & Butler, M. (2008). Cell metabolism and its control in culture. In Animal Cell Technology: From Biopharmaceuticals to Gene Therapy (pp. 76–110). New York: Taylor & Francis Group. doi:doi:10.4324/9780203895160

References
99
Chang, H. Y., Chi, J.-T., Dudoit, S., Bondre, C., van de Rijn, M., Botstein, D., & Brown, P. O. (2002). Diversity,
topographic differentiation, and positional memory in human fibroblasts. Proceedings of the National Academy of Sciences of the United States of America, 99(20), 12877–82. doi:10.1073/pnas.162488599
Chanvorachote, P., Nimmannit, U., Lu, Y., Talbott, S., Jiang, B.-H., & Rojanasakul, Y. (2009). Nitric oxide regulates lung carcinoma cell anoikis through inhibition of ubiquitin-proteasomal degradation of caveolin-1. The Journal of Biological Chemistry, 284(41), 28476–84. doi:10.1074/jbc.M109.050864
Chen, G., Kronenberger, P., Teugels, E., Umelo, I. A., & De Grève, J. (2012). Targeting the epidermal growth factor receptor in non-small cell lung cancer cells: the effect of combining RNA interference with tyrosine kinase inhibitors or cetuximab. BMC Medicine, 10(1), 28. doi:10.1186/1741-7015-10-28
Chen, H., Shen, A., Zhang, Y., Chen, Y., Lin, J., Lin, W., … Peng, J. (2014). Pien Tze Huang inhibits hypoxia-induced epithelial-mesenchymal transition in human colon carcinoma cells through suppression of the
HIF-1 pathway. Experimental and Therapeutic Medicine, 7(5), 1237–1242. doi:10.3892/etm.2014.1549
Chen, S.-Y. C., Hung, P. J., & Lee, P. J. (2011). Microfluidic array for three-dimensional perfusion culture of
human mammary epithelial cells. Biomedical Microdevices, 13(4), 753–8. doi:10.1007/s10544-011-9545-3
Chen, Z., Zhang, D., Yue, F., Zheng, M., Kovacevic, Z., & Richardson, D. R. (2012). The iron chelators Dp44mT
and DFO inhibit TGF-β -induced epithelial-mesenchymal transition via up-regulation of N-Myc downstream-regulated gene 1 (NDRG1). The Journal of Biological Chemistry, 287(21), 17016–28. doi:10.1074/jbc.M112.350470
Choi, Y. J., Rho, J. K., Jeon, B., Choi, S. J., Park, S. C., Lee, S. S., … Lee, J. C. (2010). Combined inhibition of IGFR enhances the effects of gefitinib in H1650: a lung cancer cell line with EGFR mutation and primary
resistance to EGFR-TK inhibitors. Cancer Chemotherapy and Pharmacology, 66(2), 381–8. doi:10.1007/s00280-009-1174-7
Christiansen, J. J., & Rajasekaran, A. K. (2006). Reassessing epithelial to mesenchymal transition as a prerequisite for carcinoma invasion and metastasis. Cancer Research, 66(17), 8319–26. doi:10.1158/0008-5472.CAN-06-0410
Christie, a, & Butler, M. (1994). Glutamine-based dipeptides are utilized in mammalian cell culture by extracellular hydrolysis catalyzed by a specific peptidase. Journal of Biotechnology, 37(3), 277–90. Retrieved
from http://www.ncbi.nlm.nih.gov/pubmed/7765576
Chunhacha, P., Pongrakhananon, V., Rojanasakul, Y., & Chanvorachote, P. (2012). Caveolin-1 regulates Mcl-1
stability and anoikis in lung carcinoma cells. American Journal of Physiology. Cell Physiology, 302(9), C1284–92. doi:10.1152/ajpcell.00318.2011
Coldren, C. D., Helfrich, B. a, Witta, S. E., Sugita, M., Lapadat, R., Zeng, C., … Bunn, P. a. (2006). Baseline gene
expression predicts sensitivity to gefitinib in non-small cell lung cancer cell lines. Molecular Cancer Research : MCR, 4(8), 521–8. doi:10.1158/1541-7786.MCR-06-0095
Cruz, H., Freitas, C., Alves, P., Moreira, J., & Carrondo, M. (2000). Effects of ammonia and lactate on growth, metabolism, and productivity of BHK cells. Enzyme and Microbial Technology, 27(1-2), 43–52. Retrieved from http://www.ncbi.nlm.nih.gov/pubmed/10862901
Cruz, H. J., Ferreira, a S., Freitas, C. M., Moreira, J. L., & Carrondo, M. J. (1999). Metabolic responses to different glucose and glutamine levels in baby hamster kidney cell culture. Applied Microbiology and
Biotechnology, 51(5), 579–85. Retrieved from http://www.ncbi.nlm.nih.gov/pubmed/10390815
Daye, D., & Wellen, K. E. (2012). Metabolic reprogramming in cancer: unraveling the role of glutamine in
tumorigenesis. Seminars in Cell & Developmental Biology, 23(4), 362–9. doi:10.1016/j.semcdb.2012.02.002
De Vos, P., & Marchetti, P. (2002). Encapsulation of pancreatic islets for transplantation in diabetes: the
untouchable islets. Trends in Molecular Medicine, 8(8), 363–6. Retrieved from http://www.ncbi.nlm.nih.gov/pubmed/12127717

References
100
Dearing, K. R., Sangal, A., & Weiss, G. J. (2014). Maintaining clarity: Review of maintenance therapy in non-small
cell lung cancer. World Journal of Clinical Oncology, 5(2), 103–113. doi:10.5306/wjco.v5.i2.103
Dolznig, H., Walzl, A., Kramer, N., Rosner, M., Garin-Chesa, P., & Hengstschläger, M. (2011). Organotypic
spheroid cultures to study tumor–stroma interaction during cancer development. Drug Discovery Today: Disease Models, 8(2-3), 113–119. doi:10.1016/j.ddmod.2011.06.003
Drury, J. L., & Mooney, D. J. (2003). Hydrogels for tissue engineering: scaffold design variables and applications. Biomaterials, 24(24), 4337–4351. doi:10.1016/S0142-9612(03)00340-5
Eagle, H., Washington, C. L., Cohen, L., & Levy, M. (1966). SUBSTANCES OF LOW MOLECULAR
WEIGHT : The Population-dependent Requirement by Cultured Mammalian Cells for Metabolites Which They Can Synthesize : II . The Population-dependent Requirement by Cultured Cells for
Metabolites Which They Can Synthesize.
El-sherbiny, I. M., & Yacoub, M. H. (2013). Review article Hydrogel scaffolds for tissue engineering : Progress
and challenges.
Faucheux, N., Tzoneva, R., Nagel, M.-D., & Groth, T. (2006). The dependence of fibrillar adhesions in human fibroblasts on substratum chemistry. Biomaterials, 27(2), 234–45. doi:10.1016/j.biomaterials.2005.05.076
Fennema, E., Rivron, N., Rouwkema, J., van Blitterswijk, C., & de Boer, J. (2013). Spheroid culture as a tool for creating 3D complex tissues. Trends in Biotechnology, 31(2), 108–15. doi:10.1016/j.tibtech.2012.12.003
Fiaschi, T., Marini, A., Giannoni, E., Taddei, M. L., Gandellini, P., De Donatis, A., … Chiarugi, P. (2012). Reciprocal metabolic reprogramming through lactate shuttle coordinately influences tumor-stroma interplay. Cancer Research, 72(19), 5130–40. doi:10.1158/0008-5472.CAN-12-1949
Finley, L. W. S., Zhang, J., Ye, J., Ward, P. S., & Thompson, C. B. (2013). SnapShot: cancer metabolism pathways. Cell Metabolism, 17(3), 466–466.e2. doi:10.1016/j.cmet.2013.02.016
Friedrich, J., Seidel, C., Ebner, R., & Kunz-Schughart, L. a. (2009). Spheroid-based drug screen: considerations and practical approach. Nature Protocols, 4(3), 309–24. doi:10.1038/nprot.2008.226
Furák, J., Troján, I., Szoőke, T., Tiszlavicz, L., Morvay, Z., Eller, J., & Balogh, Á. (2003). Bronchioloalveolar lung
cancer: occurrence, surgical treatment and survival☆. European Journal of Cardio-Thoracic Surgery, 23(5), 818–823. doi:10.1016/S1010-7940(03)00084-8
Ghosh, G., Lian, X., Kron, S. J., & Palecek, S. P. (2012). Properties of resistant cells generated from lung cancer cell lines treated with EGFR inhibitors. BMC Cancer, 12(1), 95. doi:10.1186/1471-2407-12-95
Glicklis, R., Shapiro, L., Agbaria, R., Merchuk, J. C., & Cohen, S. (2000). Three-Dimensional Porous Alginate Scaffolds, (M).
Godugu, C., Patel, A. R., Desai, U., Andey, T., Sams, A., & Singh, M. (2013). AlgiMatrixTM based 3D cell culture system as an in-vitro tumor model for anticancer studies. PloS One, 8(1), e53708.
doi:10.1371/journal.pone.0053708
Goetze, K., Walenta, S., Ksiazkiewicz, M., Kunz-Schughart, L. a, & Mueller-Klieser, W. (2011). Lactate enhances
motility of tumor cells and inhibits monocyte migration and cytokine release. International Journal of Oncology, 39(2), 453–63. doi:10.3892/ijo.2011.1055
Gong, H. C., Wang, S., Mayer, G., Chen, G., Leesman, G., Singh, S., & Beer, D. G. (2011). Signatures of drug sensitivity in nonsmall cell lung cancer. International Journal of Proteomics, 2011, 215496. doi:10.1155/2011/215496

References
101
Gout, S., & Huot, J. (2008). Role of cancer microenvironment in metastasis: focus on colon cancer. Cancer
Microenvironment : Official Journal of the International Cancer Microenvironment Society, 1(1), 69–83. doi:10.1007/s12307-008-0007-2
Green, J. A., & Yamada, K. M. (2007). Three-dimensional microenvironments modulate fibroblast signaling responses. Advanced Drug Delivery Reviews, 59(13), 1293–8. doi:10.1016/j.addr.2007.08.005
Gross, A., Mcdonnell, J. M., & Korsmeyer, S. J. (1999). BCL-2 family members and the mitochondria in apoptosis BCL-2 family members and the mitochondria in apoptosis, 1899–1911.
Grosso, J. F., & Jure-Kunkel, M. N. (2013). CTLA-4 blockade in tumor models: an overview of preclinical and translational research. Cancer Immunity, 13(January), 5. Retrieved from http://www.pubmedcentral.nih.gov/articlerender.fcgi?artid=3559193&tool=pmcentrez&rendertype=abstra
ct
Hait, W. N. (2010). Anticancer drug development: the grand challenges. Nature Reviews. Drug Discovery, 9(4),
253–4. doi:10.1038/nrd3144
Hanahan, D., & Weinberg, R. a. (2011). Hallmarks of cancer: the next generation. Cell, 144(5), 646–74.
doi:10.1016/j.cell.2011.02.013
Hao, W., Chang, C.-P. B., Tsao, C.-C., & Xu, J. (2010). Oligomycin-induced bioenergetic adaptation in cancer
cells with heterogeneous bioenergetic organization. The Journal of Biological Chemistry, 285(17), 12647–54. doi:10.1074/jbc.M109.084194
Hashimoto, Y., Tazawa, H., Teraishi, F., Kojima, T., Watanabe, Y., Uno, F., … Fujiwara, T. (2012). The hTERT promoter enhances the antitumor activity of an oncolytic adenovirus under a hypoxic microenvironment. PloS One, 7(6), e39292. doi:10.1371/journal.pone.0039292
Herbst, R. S., Heymach, J. V, & Lippman, S. M. (2008). Lung cancer. The New England Journal of Medicine, 359(13), 1367–80. doi:10.1056/NEJMra0802714
Hirsch, F. R., Varella-Garcia, M., McCoy, J., West, H., Xavier, A. C., Gumerlock, P., … Gandara, D. R. (2005). Increased epidermal growth factor receptor gene copy number detected by fluorescence in situ
hybridization associates with increased sensitivity to gefitinib in patients with bronchioloalveolar carcinoma subtypes: a Southwest Oncology Group Study. Journal of Clinical Oncology : Official Journal of the
American Society of Clinical Oncology, 23(28), 6838–45. doi:10.1200/JCO.2005.01.2823
Holtfreter, J. (1944). A study of the mechanics of gastrulation. Part II J. Exp. Zool., 95, 171–212.
Hopper-Borge, W.-T. and. (2014). Drug Resistance Mechanisms in Non-Small Cell Lung Carcinoma. J Can Res Updates, 2(4), 265–282. doi:10.6000/1929-2279.2013.02.04.5.Drug
Horn, L., & Carbone, D. P. (2014). Reducing lung cancer mortality: 2014 update. Seminars in Oncology, 41(1), 3–4. doi:10.1053/j.seminoncol.2013.12.004
Horowitz, J. C., Rogers, D. S., Sharma, V., Vittal, R., White, E. S., Cui, Z., & Thannickal, V. J. (2007). Combinatorial activation of FAK and AKT by transforming growth factor-β1 confers an anoikis-resistant
phenotype to myofibroblasts. Cellular Signalling, 19(4), 761–71. doi:10.1016/j.cellsig.2006.10.001
Hsiao, A. Y., Torisawa, Y. suke, Tung, Y. C., Sud, S., Taichman, R. S., Pienta, K. J., & Takayama, S. (2009). Microfluidic system for formation of PC-3 prostate cancer co-culture spheroids. Biomaterials, 30, 3020–3027. doi:10.1016/j.biomaterials.2009.02.047
Hsu, P. P., & Sabatini, D. M. (2008). Cancer cell metabolism: Warburg and beyond. Cell, 134(5), 703–7. doi:10.1016/j.cell.2008.08.021

References
102
Hughes, J. P., Rees, S., Kalindjian, S. B., & Philpott, K. L. (2011). Principles of early drug discovery. British Journal
of Pharmacology, 162(6), 1239–49. doi:10.1111/j.1476-5381.2010.01127.x
Huh, D., Hamilton, G. a, & Ingber, D. E. (2011). From 3D cell culture to organs-on-chips. Trends in Cell Biology,
21(12), 745–54. doi:10.1016/j.tcb.2011.09.005
Hutmacher, D. W., & Singh, H. (2008). Computational fluid dynamics for improved bioreactor design and 3D
culture. Trends in Biotechnology, 26(4), 166–72. doi:10.1016/j.tibtech.2007.11.012
Hwang, Y.-S., Cho, J., Tay, F., Heng, J. Y. Y., Ho, R., Kazarian, S. G., … Mantalaris, A. (2009). The use of murine embryonic stem cells, alginate encapsulation, and rotary microgravity bioreactor in bone tissue
engineering. Biomaterials, 30(4), 499–507. doi:10.1016/j.biomaterials.2008.07.028
Ivascu, A., & Kubbies, M. (2006). Rapid generation of single-tumor spheroids for high-throughput cell function
and toxicity analysis. Journal of Biomolecular Screening, 11(8), 922–32. doi:10.1177/1087057106292763
Ivascu, A., & Kubbies, M. (2007). Diversity of cell-mediated adhesions in breast cancer spheroids. International
Journal of Oncology, 31(6), 1403–13. Retrieved from http://www.ncbi.nlm.nih.gov/pubmed/17982667
Iwamoto, N., Distler, J. H. W., & Distler, O. (2011). Tyrosine kinase inhibitors in the treatment of systemic
sclerosis: from animal models to clinical trials. Current Rheumatology Reports, 13(1), 21–7. doi:10.1007/s11926-010-0142-x
Jang, S., Cho, H.-H., Cho, Y.-B., Park, J.-S., & Jeong, H.-S. (2010). Functional neural differentiation of human adipose tissue-derived stem cells using bFGF and forskolin. BMC Cell Biology, 11, 25. doi:10.1186/1471-2121-11-25
Joyce, J. a, & Pollard, J. W. (2009). Microenvironmental regulation of metastasis. Nature Reviews. Cancer, 9(4), 239–52. doi:10.1038/nrc2618
Joza, N., Susin, S. a, Daugas, E., Stanford, W. L., Cho, S. K., Li, C. Y., … Penninger, J. M. (2001). Essential role of the mitochondrial apoptosis-inducing factor in programmed cell death. Nature, 410(6828), 549–54.
doi:10.1038/35069004
Junttila, M. R., & de Sauvage, F. J. (2013). Influence of tumour micro-environment heterogeneity on therapeutic
response. Nature, 501(7467), 346–54. doi:10.1038/nature12626
Justice, B. a, Badr, N. a, & Felder, R. a. (2009). 3D cell culture opens new dimensions in cell-based assays. Drug
Discovery Today, 14(1-2), 102–7. doi:10.1016/j.drudis.2008.11.006
Kalluri, R., & Zeisberg, M. (2006). Fibroblasts in cancer. Nature Reviews. Cancer, 6(5), 392–401.
doi:10.1038/nrc1877
Kato, Y., Ozawa, S., Miyamoto, C., Maehata, Y., Suzuki, A., Maeda, T., & Baba, Y. (2013). Acidic extracellular microenvironment and cancer. Cancer Cell International, 13(1), 89. doi:10.1186/1475-2867-13-89
Kehoe, D. E., Jing, D., Lock, L. T., Tzanakakis, E. S., & Ph, D. (2010). Scalable Stirred-Suspension Bioreactor Culture, 16(2).
Kelm, J. M., Timmins, N. E., Brown, C. J., Fussenegger, M., & Nielsen, L. K. (2003). Method for generation of homogeneous multicellular tumor spheroids applicable to a wide variety of cell types. Biotechnology and
Bioengineering, 83(2), 173–80. doi:10.1002/bit.10655
Kim, J. Bin. (2005). Three-dimensional tissue culture models in cancer biology. Seminars in Cancer Biology, 15(5),
365–77. doi:10.1016/j.semcancer.2005.05.002
Kim, E. Y., Kim, A., Kim, S. K., Kim, H. J., Chang, J., Ahn, C. M., & Chang, Y. S. (2014). Inhibition of mTORC1
induces loss of E-cadherin through AKT/GSK-3β signaling-mediated upregulation of E-cadherin repressor

References
103
complexes in non-small cell lung cancer cells. Respiratory Research, 15(1), 26. doi:10.1186/1465-9921-15-
26
Kim, Y.-N., Koo, K. H., Sung, J. Y., Yun, U.-J., & Kim, H. (2012). Anoikis resistance: an essential prerequisite for
tumor metastasis. International Journal of Cell Biology, 2012, 306879. doi:10.1155/2012/306879
Ladanyi, M., & Pao, W. (2008). Lung adenocarcinoma: guiding EGFR-targeted therapy and beyond. Modern
Pathology : An Official Journal of the United States and Canadian Academy of Pathology, Inc, 21 Suppl 2, S16–22. doi:10.1038/modpathol.3801018
Lammers, P. E., & Horn, L. (2013). Targeting angiogenesis in advanced non-small cell lung cancer. Journal of the National Comprehensive Cancer Network : JNCCN, 11(10), 1235–47. Retrieved from
http://www.ncbi.nlm.nih.gov/pubmed/24142825
Lan, S.-F., & Starly, B. (2011). Alginate based 3D hydrogels as an in vitro co-culture model platform for the toxicity screening of new chemical entities. Toxicology and Applied Pharmacology, 256(1), 62–72. doi:10.1016/j.taap.2011.07.013
Landskron, G., De la Fuente, M., Thuwajit, P., Thuwajit, C., & Hermoso, M. a. (2014). Chronic Inflammation and Cytokines in the Tumor Microenvironment. Journal of Immunology Research, 2014, 1–19. doi:10.1155/2014/149185
Lee, J. M., Dedhar, S., Kalluri, R., & Thompson, E. W. (2006). The epithelial-mesenchymal transition: new insights in signaling, development, and disease. The Journal of Cell Biology, 172(7), 973–81.
doi:10.1083/jcb.200601018
Lee, W., Jiang, Z., Liu, J., Haverty, P. M., Guan, Y., Stinson, J., … Zhang, Z. (2010). The mutation spectrum
revealed by paired genome sequences from a lung cancer patient. Nature, 465(7297), 473–7. doi:10.1038/nature09004
Lilienblum, W., Dekant, W., Foth, H., Gebel, T., Hengstler, J. G., Kahl, R., … Wollin, K.-M. (2008). Alternative methods to safety studies in experimental animals: role in the risk assessment of chemicals under the new European Chemicals Legislation (REACH). Archives of Toxicology, 82(4), 211–36. doi:10.1007/s00204-008-
0279-9
Lin, R.-Z., Lin, R.-Z., & Chang, H.-Y. (2008). Recent advances in three-dimensional multicellular spheroid
culture for biomedical research. Biotechnology Journal, 3(9-10), 1172–84. doi:10.1002/biot.200700228
Llinares, K., Escande, F., Aubert, S., Buisine, M.-P., de Bolos, C., Batra, S. K., … Copin, M.-C. (2004). Diagnostic
value of MUC4 immunostaining in distinguishing epithelial mesothelioma and lung adenocarcinoma. Modern Pathology : An Official Journal of the United States and Canadian Academy of Pathology, Inc, 17(2), 150–
7. doi:10.1038/modpathol.3800027
Lloyd, P. G., & Hardin, C. D. (2011). peroxide inhibits non-small cell lung cancer cell anoikis through the
inhibition of caveolin-1 degradation ”, 74078, 2010–2012. doi:10.1152/ajpcell.00483.2010.Caveolae
Lukashev, M. E., & Werb, Z. (1998). ECM signalling: orchestrating cell behaviour and misbehaviour. Trends in
Cell Biology, 8(11), 437–41. Retrieved from http://www.ncbi.nlm.nih.gov/pubmed/9854310
Ma, P. C. (2012). Personalized targeted therapy in advanced non-small cell lung cancer. Cleveland Clinic Journal of
Medicine, 79 Electro, eS56–60. doi:10.3949/ccjm.79.s2.12
Malvezzi, M., Bertuccio, P., Levi, F., La Vecchia, C., & Negri, E. (2013). European cancer mortality predictions for the year 2013. Annals of Oncology : Official Journal of the European Society for Medical Oncology / ESMO,
24(3), 792–800. doi:10.1093/annonc/mdt010
Manuel, R., & Gameiro, L. (2012). Rui Manuel Lucas Gameiro Domingues Process Engineering of Liver Cells for Drug Testing Applications Process Engineering of Liver Cells for Drug Testing Applications Copyright Rui Manuel Lucas Gameiro Domingues Tostões Faculdade de Ciências e Tecnologia – .

References
104
Maranga, L., & Goochee, C. F. (2006). Metabolism of PER . C6 TM Cells Cultivated Under Fed-Batch
Conditions at Low Glucose and Glutamine Levels. doi:10.1002/bit
Martin, I., Wendt, D., & Heberer, M. (2004). The role of bioreactors in tissue engineering. Trends in
Biotechnology, 22(2), 80–6. doi:10.1016/j.tibtech.2003.12.001
Matsubara, D., Ishikawa, S., Sachiko, O., Aburatani, H., Fukayama, M., & Niki, T. (2010). Co-activation of
epidermal growth factor receptor and c-MET defines a distinct subset of lung adenocarcinomas. The American Journal of Pathology, 177(5), 2191–204. doi:10.2353/ajpath.2010.100217
Mazzoleni, G., Lorenzo, D., & Steimberg, N. (2009). Modelling tissues in 3D: the next future of pharmaco-
toxicology and food research? Genes & Nutrition, 4(1), 13–22. doi:10.1007/s12263-008-0107-0
McMillin, D. W., Negri, J. M., & Mitsiades, C. S. (2013). The role of tumour-stromal interactions in modifying
drug response: challenges and opportunities. Nature Reviews. Drug Discovery, 12(3), 217–28. doi:10.1038/nrd3870
Mehta, H. J., Patel, V., & Sadikot, R. T. (2014). Curcumin and lung cancer-a review. Targeted Oncology. doi:10.1007/s11523-014-0321-1
Merad-Boudia, M., Nicole, A., Santiard-Baron, D., Saillé, C., & Ceballos-Picot, I. (1998). Mitochondrial Impairment as an Early Event in the Process of Apoptosis Induced by Glutathione Depletion in Neuronal Cells: Relevance to Parkinson’s Disease. Biochemical Pharmacology, 56(5), 645–655. doi:10.1016/S0006-
2952(97)00647-3
Mesquita, B. B. De, Chesson, A., Chytil, F., Grimble, R., Lotan, R., Norpoth, K., … Thurnham, D. (1997).
European Consensus Statement on Lung Cancer : Risk Factors and Prevention, 316–322.
Metallo, C. M., Walther, J. L., & Stephanopoulos, G. (2009). Evaluation of 13C isotopic tracers for metabolic flux analysis in mammalian cells. Journal of Biotechnology, 144(3), 167–74. doi:10.1016/j.jbiotec.2009.07.010
Meyboom, a. (1997). Reversible Calcium-dependent Interaction of Liposomes with Pulmonary Surfactant Protein A. ANALYSIS BY RESONANT MIRROR TECHNIQUE AND NEAR-INFRARED LIGHT SCATTERING. Journal of Biological Chemistry, 272(23), 14600–14605. doi:10.1074/jbc.272.23.14600
Meyvantsson, I., & Beebe, D. J. (2008). Cell culture models in microfluidic systems. Annual Review of Analytical Chemistry (Palo Alto, Calif.), 1, 423–49. doi:10.1146/annurev.anchem.1.031207.113042
Miller, Y. E. (2005). Pathogenesis of lung cancer: 100 year report. American Journal of Respiratory Cell and Molecular Biology, 33(3), 216–23. doi:10.1165/rcmb.2005-0158OE
Minna, J. E. L. and J. D. (2012). Molecular Biology of Lung Cancer : Clinical Implications. Clin Chest Med., 32(4),
703–740. doi:10.1016/j.ccm.2011.08.003.Molecular
Miranda, J. P. (2010). Extending Hepatocyte Functionality for Drug-Testing Applications Using High-Viscosity
Alginate – Encapsulated, 16(6). doi:10.1089/ten.tec.2009.0784
Miyoshi, J., & Takai, Y. (2008). Structural and functional associations of apical junctions with cytoskeleton.
Biochimica et Biophysica Acta, 1778(3), 670–91. doi:10.1016/j.bbamem.2007.12.014
Moreira, J. L., Alves, P. M., Aunins, J. G., & Carrondo, M. J. (1995). Hydrodynamic effects on BHK cells grown as suspended natural aggregates. Biotechnology and Bioengineering, 46(4), 351–60. doi:10.1002/bit.260460408
Morizane, A., Doi, D., Kikuchi, T., Nishimura, K., & Takahashi, J. (2011). Small-molecule inhibitors of bone morphogenic protein and activin/nodal signals promote highly efficient neural induction from human
pluripotent stem cells. Journal of Neuroscience Research, 89(2), 117–26. doi:10.1002/jnr.22547

References
105
Mueller, M. M., & Fusenig, N. E. (2004). Friends or foes - bipolar effects of the tumour stroma in cancer. Nature
Reviews. Cancer, 4(11), 839–49. doi:10.1038/nrc1477
Mundel, T. M., Kieran, M. W., & Kalluri, R. (2006). Identification of Fibroblast Heterogeneity in the Tumor
Microenvironment, (December), 1640–1646.
Myrdal, G., Gustafsson, G., Lambe, M., Hörte, L. G., & Ståhle, E. (2001). Outcome after lung cancer surgery.
Factors predicting early mortality and major morbidity. European Journal of Cardio-Thoracic Surgery : Official Journal of the European Association for Cardio-Thoracic Surgery, 20(4), 694–9. Retrieved from
http://www.ncbi.nlm.nih.gov/pubmed/11574210
N. Bhowmick, E. N. and H. M. (2011). Stromal fibroblasts in cancer initiation and progression, 432(7015), 332–337. doi:10.1038/nature03096.Stromal
Newsholme, P., Lima, M. M. R., Procopio, J., Pithon-Curi, T. C., Doi, S. Q., Bazotte, R. B., & Curi, R. (2003). Glutamine and glutamate as vital metabolites. Brazilian Journal of Medical and Biological Research = Revista
Brasileira de Pesquisas Médicas E Biológicas / Sociedade Brasileira de Biofísica ... [et Al.], 36(2), 153–63. Retrieved from http://www.ncbi.nlm.nih.gov/pubmed/12563517
O. SMIDSROD. (1974). Molecular Basis for some Physical Properties of Alginates in the Gel State. J Chem Soc Faraday Trans, 57, 263–274.
Otto Warburg, Franz Wind, E. N. (1926). THE METABOLISM OF TUMORS IN THE BODY. The Journal of General Physiology, 8(6), 519–530.
Pallier, K., Cessot, A., Côté, J.-F., Just, P.-A., Cazes, A., Fabre, E., … Blons, H. (2012). TWIST1 a new determinant of epithelial to mesenchymal transition in EGFR mutated lung adenocarcinoma. PloS One, 7(1), e29954. doi:10.1371/journal.pone.0029954
Pampaloni, F., Reynaud, E. G., & Stelzer, E. H. K. (2007). The third dimension bridges the gap between cell culture and live tissue. Nature Reviews. Molecular Cell Biology, 8(10), 839–45. doi:10.1038/nrm2236
Paoli, P., Giannoni, E., & Chiarugi, P. (2013). Anoikis molecular pathways and its role in cancer progression. Biochimica et Biophysica Acta, 1833(12), 3481–98. doi:10.1016/j.bbamcr.2013.06.026
Partanen, J. (2012). Epithelial Integrity as a Tumor Suppressor Mechanism – The Interplay Between Lkb1 and c‐Myc in Breast Cancer Development. University of Helsinki Finland.
Partanen, J. I., Nieminen, A. I., & Klefstrom, J. (2009). 3D view to tumor suppression: Lkb1, polarity and the arrest of oncogenic c-Myc. Cell Cycle Georgetown Tex, 8, 716–724. Retrieved from http://www.ncbi.nlm.nih.gov/pubmed/19221484
Peng, Q., Zhao, L., Hou, Y., Sun, Y., Wang, L., Luo, H., … Liu, M. (2013). Biological characteristics and genetic heterogeneity between carcinoma-associated fibroblasts and their paired normal fibroblasts in human
breast cancer. PloS One, 8(4), e60321. doi:10.1371/journal.pone.0060321
Penzberg, D.-. (2005). STUDIES OF FIBRONECTIN-CANCER CELLS INTERACTIONS UNDER STATIC AND
DYNAMIC CONDITIONS . DIFFERENT ADHESIVE BEHAVIOR OF HIGH METASTATIC AND LOW METASTATIC SUBCLONE OF NCI-H460 * Maneva-Radicheva L 1 ., Zlateva N ., 1 Kostadinova A . 1 , Dimoudis N . 2 , [ 1, 2005(MAY), 315–328.
Pértega-Gomes, N., Vizcaíno, J. R., Attig, J., Jurmeister, S., Lopes, C., & Baltazar, F. (2014). A lactate shuttle system between tumour and stromal cells is associated with poor prognosis in prostate cancer. BMC
Cancer, 14, 352. doi:10.1186/1471-2407-14-352
Petersen, O. W., Rønnov-Jessen, L., Howlett, a R., & Bissell, M. J. (1992). Interaction with basement membrane
serves to rapidly distinguish growth and differentiation pattern of normal and malignant human breast epithelial cells. Proceedings of the National Academy of Sciences of the United States of America, 89(19), 9064–

References
106
8. Retrieved from
http://www.pubmedcentral.nih.gov/articlerender.fcgi?artid=50065&tool=pmcentrez&rendertype=abstract
Pongrakhananon, V., Nimmannit, U., Luanpitpong, S., Rojanasakul, Y., & Chanvorachote, P. (2010). Curcumin
sensitizes non-small cell lung cancer cell anoikis through reactive oxygen species-mediated Bcl-2 downregulation. Apoptosis : An International Journal on Programmed Cell Death, 15(5), 574–85.
doi:10.1007/s10495-010-0461-4
Popper, H. H. (2011). Large cell carcinoma of the lung – a vanishing entity? Memo - Magazine of European
Medical Oncology, 4(1), 4–9. doi:10.1007/s12254-011-0245-8
Raaschou-Nielsen, O., Andersen, Z. J., Beelen, R., Samoli, E., Stafoggia, M., Weinmayr, G., … Hoek, G. (2013). Air pollution and lung cancer incidence in 17 European cohorts: prospective analyses from the European
Study of Cohorts for Air Pollution Effects (ESCAPE). The Lancet Oncology, 14(9), 813–22. doi:10.1016/S1470-2045(13)70279-1
Rathi N. Pillai and Taofeek K. Owonikoko. (2014). Small cell lung cancer: therapies and targets. Seminars in Oncology, 41(1), 133–42. doi:10.1053/j.seminoncol.2013.12.015
Read, W. L., Page, N. C., Tierney, R. M., Piccirillo, J. F., & Govindan, R. (2004). The epidemiology of bronchioloalveolar carcinoma over the past two decades: analysis of the SEER database. Lung Cancer (Amsterdam, Netherlands), 45(2), 137–42. doi:10.1016/j.lungcan.2004.01.019
Rebelo, S. P., Costa, R., Estrada, M., Shevchenko, V., Brito, C., & Alves, P. M. (2014). HepaRG microencapsulated spheroids in DMSO-free culture: novel culturing approaches for enhanced xenobiotic
and biosynthetic metabolism. Archives of Toxicology. doi:10.1007/s00204-014-1320-9
Roato, I. (2014). Bone metastases: When and how lung cancer interacts with bone. World Journal of Clinical
Oncology, 5(2), 149–155. doi:10.5306/wjco.v5.i2.149
Rodemann, H. P., & Bamberg, M. (1995). Cellular basis of radiation-induced fibrosis. Radiotherapy and Oncology : Journal of the European Society for Therapeutic Radiology and Oncology, 35(2), 83–90. Retrieved from http://www.ncbi.nlm.nih.gov/pubmed/7569029
Rodemann, H. P., & Rennekampff, H. (2011). Tumor-Associated Fibroblasts and their Matrix, 23–37. doi:10.1007/978-94-007-0659-0
Rodrigues, C. a. V., Diogo, M. M., da Silva, C. L., & Cabral, J. M. S. (2011). Design and operation of bioreactor systems for the expansion of pluripotent stem cell-derived neural stem cells. 1st Portuguese Biomedical
Engineering Meeting, 1–3. doi:10.1109/ENBENG.2011.6026041
Rowell, N. P., & Williams, C. J. (2001). Radical radiotherapy for stage I/II non-small cell lung cancer in patients
not sufficiently fit for or declining surgery (medically inoperable): a systematic review. Thorax, 56(8), 628–38. Retrieved from http://www.pubmedcentral.nih.gov/articlerender.fcgi?artid=1746110&tool=pmcentrez&rendertype=abstra
ct
Rungtabnapa, P., Nimmannit, U., Halim, H., Rojanasakul, Y., & Chanvorachote, P. (2011). Hydrogen peroxide inhibits non-small cell lung cancer cell anoikis through the inhibition of caveolin-1 degradation, 235–245.
doi:10.1152/ajpcell.00249.2010.
Sakuma, Y., Takeuchi, T., Nakamura, Y., Yoshihara, M., Matsukuma, S., Nakayama, H., … Miyagi, Y. (2010). Lung
adenocarcinoma cells floating in lymphatic vessels resist anoikis by expressing phosphorylated Src, (December 2009), 574–585. doi:10.1002/path
Santo, E., Mano, F., & Reis, R. L. (2013). Controlled Release Strategies for Bone , Cartilage , and Osteochondral Engineering — Part I : Recapitulation of Native Tissue Healing and Variables for the Design of Delivery
Systems, 00(00). doi:10.1089/ten.teb.2012.0138

References
107
Santo, V. E., Frias, A. M., Carida, M., Cancedda, R., Gomes, M. E., Mano, J. F., & Reis, R. L. (2009). Carrageenan-
based hydrogels for the controlled delivery of PDGF-BB in bone tissue engineering applications. Biomacromolecules, 10(6), 1392–401. doi:10.1021/bm8014973
Schmidt, J. J., Rowley, J., & Kong, H. J. (2008). Hydrogels used for cell-based drug delivery. Journal of Biomedical Materials Research. Part A, 87(4), 1113–22. doi:10.1002/jbm.a.32287
Schneider, K., Schütz, V., John, G. T., & Heinzle, E. (2010). Optical device for parallel online measurement of dissolved oxygen and pH in shake flask cultures. Bioprocess and Biosystems Engineering, 33(5), 541–7. doi:10.1007/s00449-009-0367-0
Sculier, J.-P., Meert, A.-P., & Berghmans, T. (2014). Updates in oncology. European Respiratory Review : An Official Journal of the European Respiratory Society, 23(131), 69–78. doi:10.1183/09059180.00009013
Serra, M., Brito, C., Correia, C., & Alves, P. M. (2012). Process engineering of human pluripotent stem cells for clinical application. Trends in Biotechnology, 30(6), 350–9. doi:10.1016/j.tibtech.2012.03.003
Serra, M., Brito, C., Leite, S. B., Gorjup, E., von Briesen, H., Carrondo, M. J. T., & Alves, P. M. (2009). Stirred bioreactors for the expansion of adult pancreatic stem cells. Annals of Anatomy = Anatomischer Anzeiger : Official Organ of the Anatomische Gesellschaft, 191(1), 104–15. doi:10.1016/j.aanat.2008.09.005
Serra, M., Correia, C., Malpique, R., Brito, C., Jensen, J., Bjorquist, P., … Alves, P. M. (2011). Microencapsulation technology: a powerful tool for integrating expansion and cryopreservation of human embryonic stem cells. PloS One, 6(8), e23212. doi:10.1371/journal.pone.0023212
Serra, M., Leite, S. B., Brito, C., Carrondo, M. J. T., & Alves, P. M. (2007). Novel Culture Strategy for Human Stem Cell Proliferation and Neuronal Differentiation, 3566(September), 3557–3566. doi:10.1002/jnr
Shackelford, R. E., Vora, M., Mayhall, K., & Cotelingam, J. (2014). ALK -rearrangements and testing methods in
non-small cell lung cancer : a review ABSTRACT :, 5(January).
Shimi, S. M., Hopwood, D., Newman, E. L., & Cuschieri, a. (1991). Microencapsulation of human cells: its effects
on growth of normal and tumour cells in vitro. British Journal of Cancer, 63(5), 675–80. Retrieved from http://www.pubmedcentral.nih.gov/articlerender.fcgi?artid=1972378&tool=pmcentrez&rendertype=abstract
Shivanthan, M. C., & Wijesiriwardena, B. (2011). Bronchoalveolar carcinoma on a background of chronic extrinsic allergic alveolitis in a spice miller – A case report. Respiratory Medicine CME, 4(3), 119–120.
doi:10.1016/j.rmedc.2011.01.004
Siegel, P. M., & Massagué, J. (2003). Cytostatic and apoptotic actions of TGF-beta in homeostasis and cancer.
Nature Reviews. Cancer, 3(11), 807–21. doi:10.1038/nrc1208
Sieh, S., Taubenberger, A. V, Rizzi, S. C., Sadowski, M., Lehman, M. L., Rockstroh, A., … Hutmacher, D. W.
(2012). Phenotypic characterization of prostate cancer LNCaP cells cultured within a bioengineered microenvironment. PloS One, 7(9), e40217. doi:10.1371/journal.pone.0040217
Silzle, T., Randolph, G. J., Kreutz, M., & Kunz-Schughart, L. a. (2004). The fibroblast: sentinel cell and local immune modulator in tumor tissue. International Journal of Cancer. Journal International Du Cancer, 108(2), 173–80. doi:10.1002/ijc.11542
Simian, M., Hirai, Y., Navre, M., Werb, Z., Lochter, a, & Bissell, M. J. (2001). The interplay of matrix metalloproteinases, morphogens and growth factors is necessary for branching of mammary epithelial cells. Development (Cambridge, England), 128(16), 3117–31. Retrieved from
http://www.pubmedcentral.nih.gov/articlerender.fcgi?artid=2785713&tool=pmcentrez&rendertype=abstract
Singh, A. P., Chaturvedi, P., & Batra, S. K. (2007). Emerging roles of MUC4 in cancer: a novel target for diagnosis and therapy. Cancer Research, 67(2), 433–6. doi:10.1158/0008-5472.CAN-06-3114

References
108
Singh, A. P., Chauhan, S. C., Bafna, S., Johansson, S. L., Smith, L. M., Moniaux, N., … Batra, S. K. (2006).
Aberrant expression of transmembrane mucins, MUC1 and MUC4, in human prostate carcinomas. The Prostate, 66(4), 421–9. doi:10.1002/pros.20372
Singhal, S., Vachani, A., & Antin-ozerkis, D. (2005). Prognostic Implications of Cell Cycle , Apoptosis , and Angiogenesis Biomarkers in Non − Small Cell Lung Cancer : A Review Biomarkers in Non ^ Small Cell
Lung Cancer : A Review, 3974–3986.
Sodunke, T. R., Turner, K. K., Caldwell, S. a, McBride, K. W., Reginato, M. J., & Noh, H. M. (2007). Micropatterns of Matrigel for three-dimensional epithelial cultures. Biomaterials, 28(27), 4006–16. doi:10.1016/j.biomaterials.2007.05.021
Su, M.-Y., Hsieh, S.-Y., Lee, Y.-R., Chang, M.-C., Yuan, T. T.-T., & Chang, J.-M. (2010). The relationship between energy status and AMP-activated protein kinase in human H460 lung cancer cells. Cell Biochemistry and Function, 28(7), 549–54. doi:10.1002/cbf.1685
Sugiura, S., Ando, Y., Minami, H., Ando, M., Sakai, S., & Shimokata, K. (1997). Prognostic value of pleural effusion in patients with non-small cell lung cancer. Clinical Cancer Research : An Official Journal of the
American Association for Cancer Research, 3(1), 47–50. Retrieved from http://www.ncbi.nlm.nih.gov/pubmed/9815536
Sukhatme, V. P., & Chan, B. (2012). Glycolytic cancer cells lacking 6-phosphogluconate dehydrogenase metabolize glucose to induce senescence. FEBS Letters, 586(16), 2389–95.
doi:10.1016/j.febslet.2012.05.052
Sun, J.-M., Ahn, M.-J., Ahn, J. S., Um, S.-W., Kim, H., Kim, H. K., … Park, K. (2012). Chemotherapy for
pulmonary large cell neuroendocrine carcinoma: similar to that for small cell lung cancer or non-small cell lung cancer? Lung Cancer (Amsterdam, Netherlands), 77(2), 365–70. doi:10.1016/j.lungcan.2012.04.009
Sutherland, R. M., McCredie, J. a, & Inch, W. R. (1971). Growth of multicell spheroids in tissue culture as a model of nodular carcinomas. Journal of the National Cancer Institute, 46(1), 113–20. Retrieved from http://www.ncbi.nlm.nih.gov/pubmed/5101993
Tan, M. A. L., Teichberg, S., Roberts, B., & Hajdu, S. I. (2003). Ultrastructural findings in metastatic bronchioloalveolar carcinoma. Annals of Clinical and Laboratory Science, 33(3), 289–94. Retrieved from
http://www.ncbi.nlm.nih.gov/pubmed/12956444
Timmerman, R., McGarry, R., Yiannoutsos, C., Papiez, L., Tudor, K., DeLuca, J., … Fletcher, J. (2006). Excessive
toxicity when treating central tumors in a phase II study of stereotactic body radiation therapy for medically inoperable early-stage lung cancer. Journal of Clinical Oncology : Official Journal of the American
Society of Clinical Oncology, 24(30), 4833–9. doi:10.1200/JCO.2006.07.5937
Tostões, R. M., Leite, S. B., Miranda, J. P., Sousa, M., Wang, D. I. C., Carrondo, M. J. T., & Alves, P. M. (2011).
Perfusion of 3D encapsulated hepatocytes--a synergistic effect enhancing long-term functionality in bioreactors. Biotechnology and Bioengineering, 108(1), 41–9. doi:10.1002/bit.22920
Tostões, R. M., Leite, S. B., Serra, M., Jensen, J., Björquist, P., Carrondo, M. J. T., … Alves, P. M. (2012). Human liver cell spheroids in extended perfusion bioreactor culture for repeated-dose drug testing. Hepatology (Baltimore, Md.), 55(4), 1227–36. doi:10.1002/hep.24760
Travis, W. D. (2011). Classification of lung cancer. Seminars in Roentgenology, 46(3), 178–86. doi:10.1053/j.ro.2011.02.003
Travis, W. D., Brambilla, E., Van Schil, P., Scagliotti, G. V, Huber, R. M., Sculier, J.-P., … Nicholson, a G. (2011). Paradigm shifts in lung cancer as defined in the new IASLC/ATS/ERS lung adenocarcinoma classification. The European Respiratory Journal, 38(2), 239–43. doi:10.1183/09031936.00026711
References
109
Tung, Y.-C., Hsiao, A. Y., Allen, S. G., Torisawa, Y., Ho, M., & Takayama, S. (2011). High-throughput 3D
spheroid culture and drug testing using a 384 hanging drop array. The Analyst, 136(3), 473–8. doi:10.1039/c0an00609b
Vasekar, M., Liu, X., Zheng, H., & Belani, C. P. (2014). Targeted immunotherapy for non-small cell lung cancer. World Journal of Clinical Oncology, 5(2), 39–47. doi:10.5306/wjco.v5.i2.39
Velasco, D., Tumarkin, E., & Kumacheva, E. (2012). Microfluidic encapsulation of cells in polymer microgels. Small (Weinheim an Der Bergstrasse, Germany), 8(11), 1633–42. doi:10.1002/smll.201102464
Vinci, M., Gowan, S., Boxall, F., Patterson, L., Zimmermann, M., Court, W., … Eccles, S. a. (2012). Advances in
establishment and analysis of three-dimensional tumor spheroid-based functional assays for target validation and drug evaluation. BMC Biology, 10(1), 29. doi:10.1186/1741-7007-10-29
Von der Mark, K., Gauss, V., von der Mark, H. and Mu¨ ller, P. (1977). Relationship between cell shape and type of collagen synthesised as chondrocytes lose their cartilage phenotype in culture. Nature, 267, 531–532.
Walenta, S., Snyder, S., Haroon, Z. a, Braun, R. D., Amin, K., Brizel, D., … Dewhirst, M. W. (2001). Tissue gradients of energy metabolites mirror oxygen tension gradients in a rat mammary carcinoma model. International Journal of Radiation Oncology, Biology, Physics, 51(3), 840–8. Retrieved from
http://www.ncbi.nlm.nih.gov/pubmed/11699496
Walther, J. L., Metallo, C. M., Zhang, J., & Stephanopoulos, G. (2012). Optimization of 13C isotopic tracers for
metabolic flux analysis in mammalian cells. Metabolic Engineering, 14(2), 162–71. doi:10.1016/j.ymben.2011.12.004
Wang, Y., & Wang, J. (2014). Mixed hydrogel bead-based tumor spheroid formation and anticancer drug testing. The Analyst, 139(10), 2449–58. doi:10.1039/c4an00015c
Warner, D. O. (2006). Review article: Age related alterations in respira- tory function - anesthetic considerations, 1244–1257.
Wei, L., Yang, Y., Zhang, X., & Yu, Q. (2002). Anchorage-independent phosphorylation of p130(Cas) protects lung adenocarcinoma cells from anoikis. Journal of Cellular Biochemistry, 87(4), 439–49. doi:10.1002/jcb.10322
Wei, L., Yang, Y., Zhang, X., & Yu, Q. (2004). Cleavage of p130Cas in anoikis. Journal of Cellular Biochemistry, 91(2), 325–35. doi:10.1002/jcb.10760
Wikström, J., Elomaa, M., Syväjärvi, H., Kuokkanen, J., Yliperttula, M., Honkakoski, P., & Urtti, A. (2008). Alginate-based microencapsulation of retinal pigment epithelial cell line for cell therapy. Biomaterials,
29(7), 869–76. doi:10.1016/j.biomaterials.2007.10.056
Xiao, D., & He, J. (2010). Epithelial mesenchymal transition and lung cancer. Journal of Thoracic Disease, 2(3), 154–9. doi:10.3978/j.issn.2072-1439.2010.02.03.7
Xu, X., Farach-Carson, M. C., & Jia, X. (2014). Three-dimensional in vitro tumor models for cancer research and drug evaluation. Biotechnology Advances, 1–13. doi:10.1016/j.biotechadv.2014.07.009
Zhang, X., Wang, W., Xie, Y., Zhang, Y., Wang, X., Guo, X., & Ma, X. (2006). Proliferation, viability, and metabolism of human tumor and normal cells cultured in microcapsule. Applied Biochemistry and
Biotechnology, 134(1), 61–76. Retrieved from http://www.ncbi.nlm.nih.gov/pubmed/16891667
Zhang, X., Wang, W., Yu, W., Xie, Y., Zhang, X., Zhang, Y., & Ma, X. (2005). Development of an in vitro
multicellular tumor spheroid model using microencapsulation and its application in anticancer drug screening and testing. Biotechnology Progress, 21(4), 1289–96. doi:10.1021/bp050003l
Zhao, Y., Butler, E. B., & Tan, M. (2013). Targeting cellular metabolism to improve cancer therapeutics. Cell Death & Disease, 4(3), e532. doi:10.1038/cddis.2013.60

References
110
Zhao, Y., Yao, R., Ouyang, L., Ding, H., Zhang, T., Zhang, K., … Sun, W. (2014). Three-dimensional printing of
Hela cells for cervical tumor model in vitro. Biofabrication, 6(3), 035001. doi:10.1088/1758-5082/6/3/035001
Zhong, X., & Rescorla, F. J. (2012). Cell surface adhesion molecules and adhesion-initiated signaling: understanding of anoikis resistance mechanisms and therapeutic opportunities. Cellular Signalling, 24(2), 393–401. doi:10.1016/j.cellsig.2011.10.005
Zhong, Y., Delgado, Y., Gomez, J., Lee, S. W., & Perez-soler, R. (2001). Loss of H-Cadherin Protein Expression in Human Non-Small Cell Lung Cancer Is Associated with Tumorigenicity Loss of H-Cadherin Protein Expression in Human Non-Small Cell Lung Cancer Is Associated with Tumorigenicity 1, 1683–1687.
Zhuang, H., Zhao, X., Zhao, L., Chang, J. Y., & Wang, P. (2014). Progress of clinical research on targeted therapy combined with thoracic radiotherapy for non-small-cell lung cancer. Drug Design, Development and
Therapy, 8, 667–675. doi:10.2147/DDDT.S61977
Zielke, H. R., Sumbilla, C. M., Sevdalian, D. A., Hawkins, R. L., & Ozand, P. T. (1980). Lactate: A major product
of glutamine metabolism by human diploid fibroblasts. Journal of Cellular Physiology, 104, 433–441. doi:10.1002/jcp.1041040316
Zimmermann, H., Wählisch, F., Baier, C., Westhoff, M., Reuss, R., Zimmermann, D., … Zimmermann, U. (2007). Physical and biological properties of barium cross-linked alginate membranes. Biomaterials, 28(7), 1327–45. doi:10.1016/j.biomaterials.2006.11.032