development of a bioinformatic approach to identify
TRANSCRIPT

DEVELOPMENT OF A BIOINFORMATIC APPROACH TO IDENTIFY CANDIDATE PATHOGENIC VARIANTS IN CANINE PHARMACOGENOMIC GENES
Master’s Thesis
Sruthi M Hundi
Faculty of Medicine and Life Sciences
University of Helsinki
February 2017

Acknowledgment This work was conducted at the Canine Genetics research group led by Professor Hannes T
Lohi, from the Department of Veterinary Science at the University of Helsinki. I would like to
thank Professor Hannes Lohi for giving me the opportunity to conduct the research at this lab
and his continuous supervision.
My sincere thanks to Marjo K Hytönen, as this study would have been more difficult if not
for her motivation and advice. I am thankful to Meharji Arumilli, for his valuable inputs on
NGS data analysis. I also extend my gratitude to all lab members of Hannes Lohi for a very
friendly work environment.
Finally I wish to thank my entire family, especially my parents Chandra Mouli and Usha
Mouli, and my husband Venkatram Yellapragada for being the key source of my strength.
Tampere, February 2017
Sruthi M Hundi

II
Table of Contents Acknowledgment IAbstract VI1. Introduction 12. LiteratureReview 4
DogasamodelforPharmacogenomics 52.1 RoleofNextGenerationSequencinginCaninePGxstudy 72.2
3. Aimsofthestudy 104. MaterialsandMethods 11
Human–CaninePharmacogeneticGenes 114.1 Canineorthologues 124.2 IdentifyingORFinCaninePGxGenes 134.3 WholeGenomeSequencing 144.4 FilteringPGxvariants 224.5 PathogenicityPrediction 224.6 Knownfunctionalinference 254.7
5. Results 26 IdentificationofCaninePGxgenes 265.1 PGxAnnotationTable 285.2 NGSDataAnalysis 295.3 VariantIdentification 315.4 VariantFiltering 325.5 Pathogenvariationprediction 345.6 KnownandUnknownMutations 395.7 DAVIDFunctionalEnrichmentanalysis 415.8
6. Discussion 437. Conclusionandfutureprospects 488. References 499. Appendix 49
FileFormats i9.1 KeyCommandsandArguments iii9.2 Tables v9.3
III
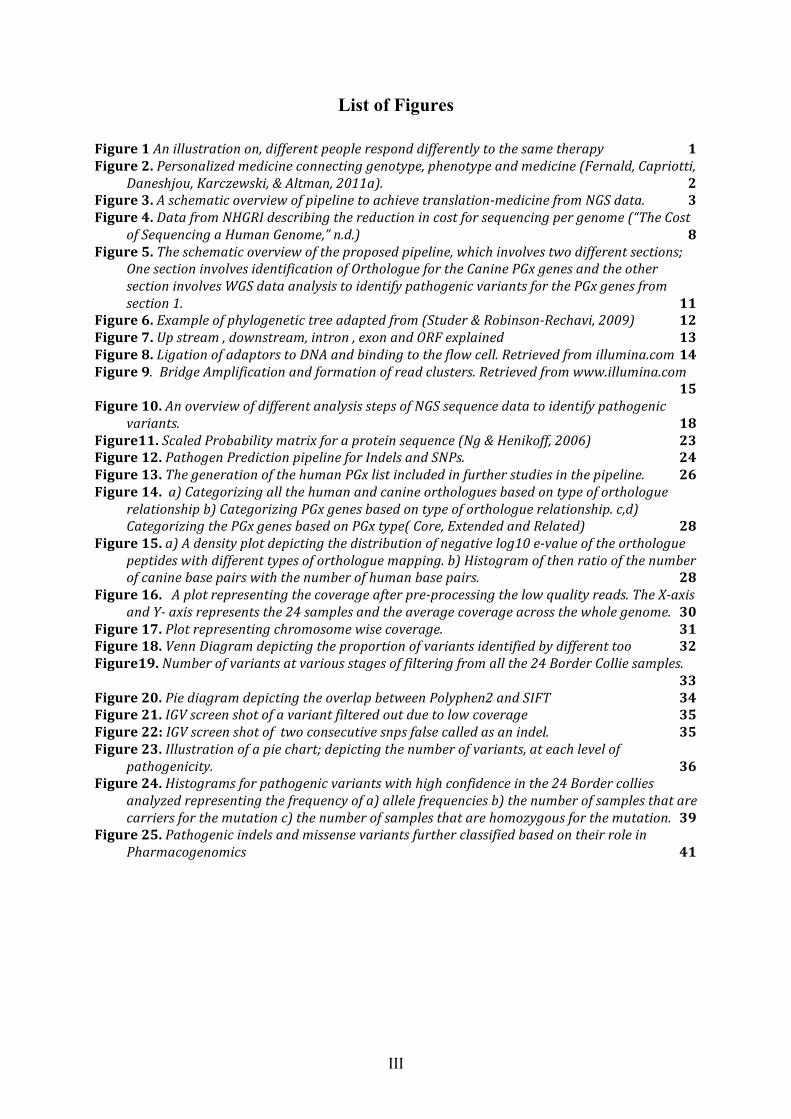
List of Figures Figure1Anillustrationon,differentpeopleresponddifferentlytothesametherapy 1Figure2.Personalizedmedicineconnectinggenotype,phenotypeandmedicine(Fernald,Capriotti,
Daneshjou,Karczewski,&Altman,2011a). 2Figure3.Aschematicoverviewofpipelinetoachievetranslation-medicinefromNGSdata. 3Figure4.DatafromNHGRIdescribingthereductionincostforsequencingpergenome(“TheCost
ofSequencingaHumanGenome,”n.d.) 8Figure5.Theschematicoverviewoftheproposedpipeline,whichinvolvestwodifferentsections;
OnesectioninvolvesidentificationofOrthologuefortheCaninePGxgenesandtheothersectioninvolvesWGSdataanalysistoidentifypathogenicvariantsforthePGxgenesfromsection1. 11
Figure6.Exampleofphylogenetictreeadaptedfrom(Studer&Robinson-Rechavi,2009) 12Figure7.Upstream,downstream,intron,exonandORFexplained 13Figure8.LigationofadaptorstoDNAandbindingtotheflowcell.Retrievedfromillumina.com14Figure9.BridgeAmplificationandformationofreadclusters.Retrievedfromwww.illumina.com
15Figure10.AnoverviewofdifferentanalysisstepsofNGSsequencedatatoidentifypathogenic
variants. 18Figure11.ScaledProbabilitymatrixforaproteinsequence(Ng&Henikoff,2006) 23Figure12.PathogenPredictionpipelineforIndelsandSNPs. 24Figure13.ThegenerationofthehumanPGxlistincludedinfurtherstudiesinthepipeline. 26Figure14.a)Categorizingallthehumanandcanineorthologuesbasedontypeoforthologue
relationshipb)CategorizingPGxgenesbasedontypeoforthologuerelationship.c,d)CategorizingthePGxgenesbasedonPGxtype(Core,ExtendedandRelated) 28
Figure15.a)Adensityplotdepictingthedistributionofnegativelog10e-valueoftheorthologuepeptideswithdifferenttypesoforthologuemapping.b)Histogramofthenratioofthenumberofcaninebasepairswiththenumberofhumanbasepairs. 28
Figure16.Aplotrepresentingthecoverageafterpre-processingthelowqualityreads.TheX-axisandY-axisrepresentsthe24samplesandtheaveragecoverageacrossthewholegenome. 30
Figure17.Plotrepresentingchromosomewisecoverage. 31Figure18.VennDiagramdepictingtheproportionofvariantsidentifiedbydifferenttoo 32Figure19.Numberofvariantsatvariousstagesoffilteringfromallthe24BorderColliesamples.
33Figure20.PiediagramdepictingtheoverlapbetweenPolyphen2andSIFT 34Figure21.IGVscreenshotofavariantfilteredoutduetolowcoverage 35Figure22:IGVscreenshotoftwoconsecutivesnpsfalsecalledasanindel. 35Figure23.Illustrationofapiechart;depictingthenumberofvariants,ateachlevelof
pathogenicity. 36Figure24.Histogramsforpathogenicvariantswithhighconfidenceinthe24Bordercollies
analyzedrepresentingthefrequencyofa)allelefrequenciesb)thenumberofsamplesthatarecarriersforthemutationc)thenumberofsamplesthatarehomozygousforthemutation. 39
Figure25.PathogenicindelsandmissensevariantsfurtherclassifiedbasedontheirroleinPharmacogenomics 41

IV
List of Tables
Table1.HistoryofDNASequencingAdaptedfrom(Messing&Llaca,1998) 7Table2.Generelationshipingenefromdifferentspecies 12Table3.Contingencytableforthefischerexacttest. 28Table4.AnexampleofPGxannotationtable 29Table5.Statisticsofreadsbeforealignment 30Table6.Statisticsofreadsalignedtoreference 30Table7.Statisticsaftermarkingtheduplicatedreads 31Table8.Statisticsafterre-calibration 31Table9.StatisticsofSNPsidentified. 32Table10.StatisticsofIndelsidentifiedbyGATKandSamtools. 32Table11.LengthofCaninePGxgenesandORFs.LengthinBasePairs 33Table12.VariantsidentifiedbyPolyphen2 34Table13.VariantsidentifiedbySIFT. 34Table14.1:ThefinallistofmissensepathogenicvariantswithhighconfidenceandtheirPGx
information. 37Table14.2:ThefinallistofStopgain/splicesitepathogenicvariantswithhighconfidenceand
theirPGxinformation. 37Table14.3:Thefinallistofframe-shiftpathogenicvariantswithhighconfidenceandtheirPGx
information. 38Table15.Theenrichedpathwayormechanismsrelatedtothepathogenicvariantsofhigh
confidenceandthegenesinvolvedinrespectivepathwaysormechanismsinpharmacogenetics. 41

V
List of Abbreviations ABC ATP Binding Cassette ADME Absorption Distribution Metabolism Excretion BAM Binary Alignment Map BWT Burrows Wheelers Transform
CPIC Clinical Pharmacogenetics Implementation Consortium
CYP Cytochrome P-450 IGV Integrative Genome Viewer
ITPC International Tamoxifen Pharmacogenomics Consortium
IWPC International Wafarin Pharmacogenomics Consortium MDR Multi Drug Resistance MSA Multiple Sequence Alignment MUSCLE Multiple Sequence Alignment by Log Expectation NGS Next Generation Sequencing OMIA Online Mendelian Inheritance in Animals OMIM Online Mendelian Inheritance in Man PGx Pharmacogenomic PharmGKB The Pharmacogenomic Knowledge Base SLC Solute Like Carrier VCF Variant Call Format WES Whole Exome Sequencing WGS Whole Genome Sequencing

VI
Master’s Thesis Place: Faculty of Medicine and Faculty Sciences, University of Tampere Author: Sruthi M Hundi Title: Development of a Bioinformatics Approach to Identify Candidate Pathogenic Variants in Canine Pharmacogenomic Genes Pages: 55 Supervisor: Professor Hannes T Lohi, Department of veterinary medicine, University of Helsinki. Reviewers: Professor Matti Nykter, Faculty of Medicine and Life sciences, University of Tampere. Professor Hannes T Lohi, Department of veterinary medicine, University of Helsinki. Date: 22nd February 2017
Abstract Genetic variations in pharmacogenomic genes result in diverse response of individuals to different drugs. Understanding the functional implications of these variations has gathered a significant research interest over the past decades providing a prime example for personalized medicine. Personalized medicine is a rapidly evolving field of pharmacogenetics that involves individual design of drug composition and dosage based on the genetic profile. The annotation of the genomes of domestic animals such as dog followed by an increasing amount of available whole genome sequencing data opens new opportunities for pharmacogenomics (PGx) in animal models. Despite some highlighted examples of canine PGx, e.g. MDR1 susceptibility, canine PGx is still poorly characterized. The major aim of this thesis was to utilize the growing number of WGS (Whole Genome Sequence) data for PGx profiling by developing a bioinformatic analysis pipeline that can identify potential candidate pathogenic variants. Canine orthologs for 540 Human PGx genes were retrieved resulting in 495 canine PGx genes. Ensembl’s phylogenetic trees were used to identify the orthologs. The pipeline analysis was piloted in 24 dogs in Border collie. A pipeline was developed to analyze the WGS of these dogs and to identify the pathogenic variants. The analysis altogether revealed 2964 variants in the coding regions of these 495 Canine pharmacogenomic genes. Out of these, 56 variants (1.8%) were predicted to be pathogenic and could be prioritized for further validation to determine their prevalence and functional significance. A pharmacogenomic annotation of these genes was also established, using available human data as a reference model. This annotation categorizes them based on their ortholog relationship, role in drug processing and importance in pharmacogenomics.

1
1. Introduction It has been known for centuries that not everybody reacts to a medicine in a uniform fashion.
In the 1500s, Philippus Paracelsus said ‘Medicine is not merely a science but is an art’. Sir
William Osler stated in 1892 that ‘If it were not for the great variability among individuals,
medicine might as well be a science and not an art’. Several genes, generalized as
pharmacogenes are involved in the life cycle of a drug in a body. Pharmacogenomics
(hereafter referred as PGx in the document) is the study of how genomic variation in these
genes influences the pattern a drug is processed in a body. These pharmacogenes play an
important role in processing of the drug that includes Absorption, Distribution, Metabolism
and Excretion (ADME) (Johnson, 2003). Genetic variability has a significant influence on
how a drug mechanism works in a body and mutations in these genes can thus be a major
causative factor for distinctive response to a drug (Shin, Kayser, & Langaee, 2009) as shown
in Figure 1. For example, a mutation in a drug receptor-encoding gene could result in an
altered protein, affecting the process of absorption of the drug and eventually the effect of the
drug.
Figure 1 An illustration on, different people respond differently to the same therapy
However, a mutation in the pharmacogenes can be pathogenic only when administered with
drugs, although the individual may not display any disease specific phenotype in absence of
the drug. The ability to tailor the prescription, so that there is an increase in the probability of
beneficial outcomes and a decrease in the probability of negative effects, has led to increasing

2
interest towards ‘personalized medicine’ (Chan & Ginsburg, 2011). This field also focuses on
preventive and prediction medicine, at a reduced cost, rather than responsive medicine.
PGx intends to customize the medical treatment as per their individual genome and uses
bioinformatics approach to study their genomic profile. The basic idea of personalized
medicine revolves around, the concept of, connecting information from traditional medicine
with personal genomics. While traditional medicine defines the relationship between
phenotype (pathogenic state) and the medical treatment, personal genomics provides
information on phenotype and genotype correlation. As can be seen in Figure 2,
pharmacogenomics connects genotype information from personal genomics, medicinal
information from translation medicine and draws a meaningful relationship between them.
Figure 2. Personalized medicine connecting genotype, phenotype and medicine (Fernald, Capriotti, Daneshjou, Karczewski, & Altman, 2011a).
Bioinformatics plays an essential role in various stages in the process of making personalized
medicine a reality (Rodriguez-Antona, 2015). The exponential increase in the use of
sequencing technologies and reduction in its cost has enabled the use of next generation
sequencing (NGS) in many genetic studies. As a result there is an increased availability of
personal genomic data. A bioinformatic approach to resourcefully use the available NGS data,
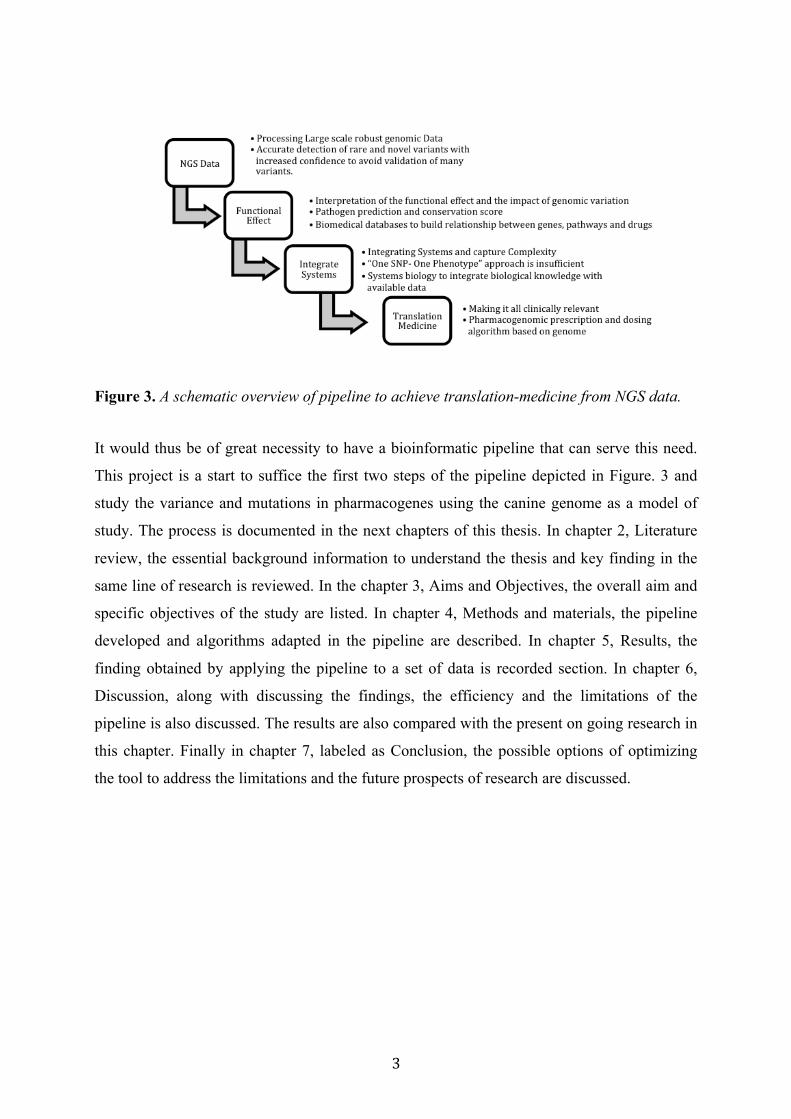
to yield clinically relevant information is a multistep process as shown below in Figure. 3
(Fernald, Capriotti, Daneshjou, Karczewski, & Altman, 2011b).
3
Figure 3. A schematic overview of pipeline to achieve translation-medicine from NGS data.
It would thus be of great necessity to have a bioinformatic pipeline that can serve this need.
This project is a start to suffice the first two steps of the pipeline depicted in Figure. 3 and
study the variance and mutations in pharmacogenes using the canine genome as a model of
study. The process is documented in the next chapters of this thesis. In chapter 2, Literature
review, the essential background information to understand the thesis and key finding in the
same line of research is reviewed. In the chapter 3, Aims and Objectives, the overall aim and
specific objectives of the study are listed. In chapter 4, Methods and materials, the pipeline
developed and algorithms adapted in the pipeline are described. In chapter 5, Results, the
finding obtained by applying the pipeline to a set of data is recorded section. In chapter 6,
Discussion, along with discussing the findings, the efficiency and the limitations of the
pipeline is also discussed. The results are also compared with the present on going research in
this chapter. Finally in chapter 7, labeled as Conclusion, the possible options of optimizing
the tool to address the limitations and the future prospects of research are discussed.

4
2. Literature Review A drug that is administered needs to be absorbed at proper levels, distributed to targeted
tissues, metabolized and then excreted from the body, as is the process of ADME. A mutation
in a gene that encodes the drug processing protein can interfere the process of drug
metabolism or sometimes may also cause toxic effects. Information on such mutations is the
key to identify or design biomarkers that can qualitatively and quantitatively predict the drug
response (Frank & Hargreaves, 2003). There are several PGx databases that have been
striving to identify, store and deliver such important information of the pharmacogenomic
genes, their variation and relationships such as gene-drug, gene-pathway etc. Some of the
very well known databases are PharmGKB (Thorn, Klein, & Altman, 2005, 2010) and
pharmaADME (http://www.pharmaadme.org).
PharmGKB is a pharmacogenomic database that started as an effort to store post-genomic
data in 2000 (Thorn et al., 2010). With the advent of new technologies, the flow of data has
exploded, and since then, PharmGKB refocused to employ knowledge and capture complex
relationship between genes, drugs, pathways and variations. All the gathered information is
organized, stored and labeled based on different criteria such as pharmacokinetics,
pharmacodynamics, cellular component, molecular function, clinical significance
(disease/phenotype), importance in drug processing and availability of genotype data. The
data can be accessed with respect to these labels or the gene. About 400 pharmacogenes have
been listed as a part of various collaborative projects such as Clinical Pharmacogenetics
Implementation Consortium (CPIC) (Relling, 2015), International Tamoxifen
Pharmacogenomics Consortium (ITPC) and International Warfarin Pharmacogenomics
Consortium (IWPC) (International Warfarin Pharmacogenetics Consortium et al., 2009).
Several well-known examples include Cytochrome P450 (CYP) drug-metabolizing family
genes in the liver, as well as genes in the ATP-binding Cassette (ABC) transporters and
Solute Carrier (SLC) transporter families.
PharmaADME is another well-known pharmacogenomic consortium that makes effort to
develop standardized evidence based drug metabolizing genetic biomarkers. The biomarkers
are used in the process of drug development to predict genetic and pharmacokinetic (the rate
at which the drug is processed) variability in an individual body. PharmaADME has
categorized genes as core, extended and related genes based on its importance and relatedness

5
with drug processing. There are also databases specific to some very important PGx genes
and alleles such as CYP-allele database (S. C. Sim & Ingelman-Sundberg, 2013), NAT-allele
database (E. Sim, Fakis, Laurieri, & Boukouvala, 2012) and TP search database (Ozawa et al.,
2004). Combining the information from these databases with genomics would leadoff
genotype to phenotype research in contrast to the traditional phenotype to genotype mode of
approach. This mode of research was tried out successfully to predict drug sensitivity
phenotypes by using genotype information of CYP2D6 from CPIC (Gaedigk, Sangkuhl,
Whirl-Carrillo, Klein, & Leeder, 2016).
Most of these databases are aimed at pharmacogenomics of human genome. However, the
availability of genome assembly and advances in sequence data annotations for domestic
animals is making it possible to make significant finding in veterinary pharmacogenomics.
Court et al suggest that using the advancing bioinformatic technologies and comparative
genomics, it is also possible to relate knowledge from the above databases to contribute to
comparative medicine (Mosher & Court, 2010).
Dog as a model for Pharmacogenomics 2.1
A dog (Canis lupus familiaris) characterizes as an interesting model for both genetic and
pharmacogenetic study. The whole genome of human and dog are about 95 percent similar.
Most of the genes in humans have an orthologous or a predicted gene in the dog. Both human
and dog follow a similar disease inheritance pattern and the mutated gene for a disease is
often the same. Several findings in dogs have helped to identify genetic conditions in humans
such as in cancer (Ranieri et al., 2013) and neurological disease (Seppälä et al., 2011). The
genetic distance in different breeds of dogs is much higher (3-4 x) than the genetic diversity
in different human populations. Breed-specific mutations in PGx genes are very important as
these mutations could have toxic effects against the administered drugs (Fleischer, Sharkey,
Mealey, Ostrander, & Martinez, 2008). Along with genomic features, environmental factors
also play a huge role in personalized medicine (Ginsburg & Willard, 2009). Dogs share the
same environment with humans and hence are exposed to very similar environmental factors.
Thus, dogs can be considered as an important model for pharmacogenetic study.

6
Although the pharmacogenomics research in dogs is still not as advanced, as in human, it is
one of the most well studied animals with clinically relevant pharmacogenetic discoveries.
Many variants that could be pharmacogenomic related and pathogenic have been identified
(Katrina L Mealey, 2006). The key transporter and metabolizer genes well studied in canine
include, the ABC transporter and CYP family genes. Some of the prominent discoveries in
canine PGx include the MDR1 (Multi Drug Resistance) delta mutation(Katrina L Mealey,
2013), Cytochrome P-450 variants (Court, 2013) and the TPMT variation (Salavaggione &
Kidd, 2002).
The P-glycoprotein (P-gp) produced by the MDR1 gene is a key transporter protein (Zhou,
Gottesman, & Pastan, 1999). The well-known four base pair deletion in MDR1 shifts the ORF
leading to generation of premature stop codon (K L Mealey, Bentjen, Gay, & Cantor, 2001).
This produces a malformed or mutated P-gp protein that is about 10% in length of the normal
P-gp protein. The affected dogs are said to exhibit the "multidrug sensitivity" phenotype.
These dogs exhibit high difference in distribution and excretion of the drug when compared to
the normal ones. Studies have shown that the normal dogs could show neurotoxicity at high
doses (>2 mg/kg), while heterozygous and homozygous mutants showed neurotoxicity at
lower doses, approximating at 300 micro g/kg dose and 129 micro g/kg respectively (K L
Mealey et al., 2001). In another study a Collie with hetero MDR1 mutation affected with
lymphoma when treated with doxorubicin, a P-gp substrate, exhibited gastro intestinal
toxicity. It was inferred in this study that improper excretion of the drug could have been the
causative factor of the toxicity (K. L. Mealey et al., 2008)
CYP is an essential drug metabolizing and excreting gene. The CYP genes CYPB11 is said to
be highly variable among different dog breeds (Court, 2013). However, the clinical impact of
this is not yet known. There are also other possible pathogenic variants identified in dogs but
with unknown clinical significance such as CYP2C41 gene deletion and amino acid variants
in CYP2D15, CYP2E1 and CYP3A12. A genetic variation in the CYP2D15 gene, which
processes the drug Celecoxib, includes deletion of an exon 3. This deletion leads to
unidentified metabolism of Celecoxib. The other noted polymorphism in this family is the
CYP1A2 premature stop polymorphism. The premature stop codon causes loss of enzyme
activity of the gene. In the study by Court et. al, the affected dogs seemed to contain high
level of the respective substrate drug, when compared to the normal dogs, depicting low or no
enzyme activity of the impaired gene (Court, 2013).
7
TPMT is a Phase II metabolizing enzyme that has a pharmacogenomic-identified variant. This
variant, causes decreased enzymatic activity of its substrate azathioprine leading to high
susceptibility to azathioprine-induced suppression of bone marrow (Haller et al., 2012).
Role of Next Generation Sequencing in Canine PGx study 2.2 To make reliable PGx predictions based on individual genomes and gathered genetic
evidence, the first essential requirement as depicted in Figure 2, is to accumulate genomic
data. DNA sequencing is the process of resolving the DNA sequence from a sample. The
history of DNA sequencing hails back to 1965 when Holley sequenced yeast tRNA. Sanger
sequencing was a major breakthrough for DNA sequencing as it laid foundations to the
process of First Generation Sequencing or Automated Sanger sequencing. Ever since many
improvements have been made at a faster pace in the process of sequencing leading to the
advent of NGS methods.
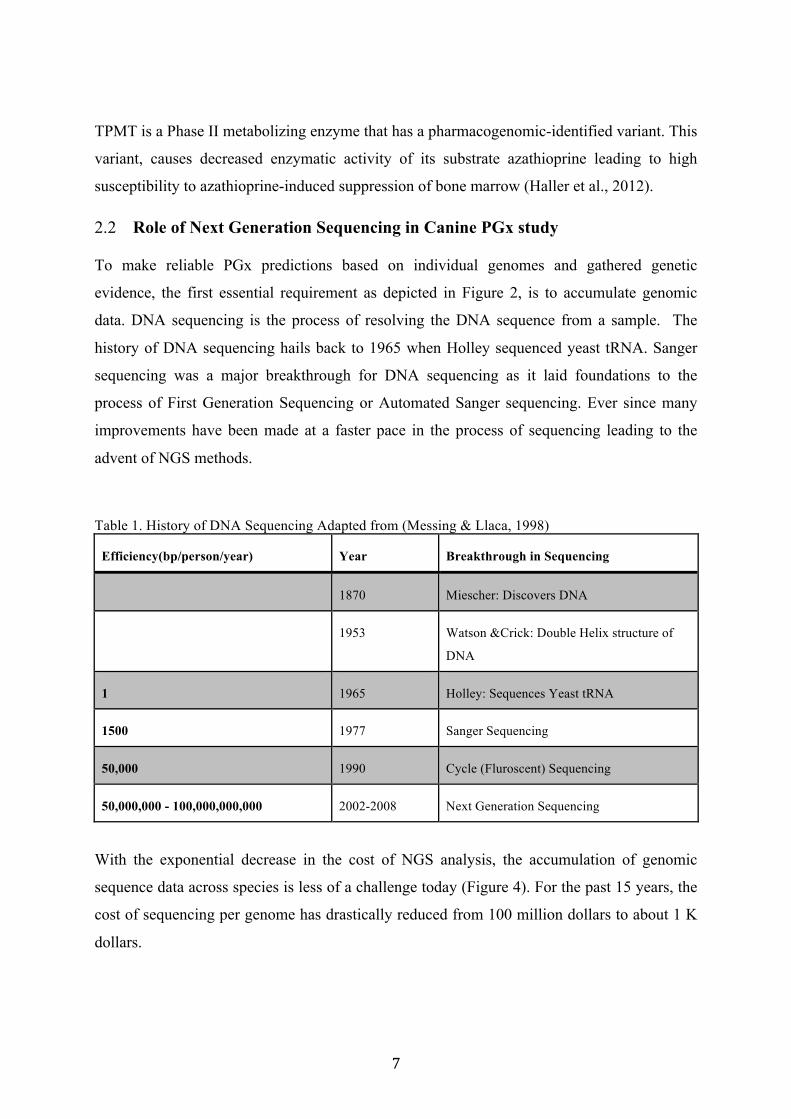
Table 1. History of DNA Sequencing Adapted from (Messing & Llaca, 1998)
Efficiency(bp/person/year) Year Breakthrough in Sequencing
1870 Miescher: Discovers DNA
1953 Watson &Crick: Double Helix structure of
DNA
1 1965 Holley: Sequences Yeast tRNA
1500 1977 Sanger Sequencing
50,000 1990 Cycle (Fluroscent) Sequencing
50,000,000 - 100,000,000,000 2002-2008 Next Generation Sequencing
With the exponential decrease in the cost of NGS analysis, the accumulation of genomic
sequence data across species is less of a challenge today (Figure 4). For the past 15 years, the
cost of sequencing per genome has drastically reduced from 100 million dollars to about 1 K
dollars.

8
Figure 4. Data from NHGRI describing the reduction in cost for sequencing per genome (“The Cost of Sequencing a Human Genome,” n.d.)
The first Whole Genome Sequence (WGS) was accomplished in the year 1995 by
Fleischmann et.al, when they published the complete sequence of Heamophilus influenza- a
common bacteria present in the respiratory tract of humans. The application of WGS saw a
rapid rise in the early 2000s when human and mouse and many other mammals were
sequenced (Waterston et al., 2002).
The first version whole Canine genome was sequenced in Standard Poodle in 2003, and was
followed by a higher quality sequence in Boxer in 2005. This was referred as the first canine
genome assembly, CanFam1.0. The assembly was updated to CanFam2 in 2005 (Lindblad-
Toh et al., 2005). The latest updated version of canine assembly is CanFam3.1 that was
published in 2012. Besides WGS, methods such as whole exome sequencing (WES) and
targeted resequencing that includes sequencing of only the exome of a genome and a specific
region of genome, respectively, are also widely used in dogs nowadays (Ahonen et al 2013) .
Once the genome is sequenced either through WGS, WES or targeted resequencing, the
produced data can be used to perform downstream NGS data analysis. However, there are
many challenges that need to be overcome to obtain reliable and reproducible data (Shendure
& Ji, 2008). Improper quality of the NGS data is a significant challenge that needs to be
addressed. Many issues such as poor quality of the sequencing technique leading to increased
error in base pair calling, low coverage and low quality reads are a few to mention (Yu &
Sun, 2013). After sequencing data quality control, the identification of novel variants should
be a performed with increased confidence, to avoid false positives and detect the variants,

9
which are otherwise falsely tagged as negatives(Nielsen, Paul, Albrechtsen, & Song, 2011).
For this use of dbSNP and in-house variants are essential.
The WGS data of a sample includes 3-4 millions variants. However, not all of these variants
are pathogenic. Particular bioinformatic and functional approaches are required to predict and
confirm the pathogenicity of the variants. Most of the pathogenic genomic variants alter the
amino acid sequence and subsequent protein structure affecting its proper function. A study
suggests that protein molecules are quite robust and tolerate small changes in the amino acid
sequence (M Pajunen et al.). However, if an amino acid or multiple amino-acid changes
happen to alter a property of the protein such as structure (Feyfant E et.al) of protein or
catalytic activity of protein (Yusuke Takahashi et.al), then it could be pathogenic. Certain
mutations could happen to change the function of a protein (M Oren et al), i.e. if a protein has
a ligand binding capacity, loss of function would lead to improper binding to ligand, while
gain of binding would lead to unnecessary binding to ligand. Hence, understanding the
impact of the mutation on the protein structure and function is essential to be able to evaluate
the pathogenicity of the mutation. For the prediction of the possible impact of the mutation,
evolutionary analysis is an approach, based on the assumption that a change in a conserved
position does not allow alterations without a compromise on function. However, the
bioinformatic methods can only do the predictions and the true pathophysiology of the
mutation has to be confirmed experimentally (Fernald et al., 2011b) .

10
3. Aims of the study Our hypothesis is that extensive genomic variation exist in canine PGx genes at individual
and breed level and that the most likely pathogenic variants lie within the conserved
functional regions of the open reading frames (ORFs) altering the protein structure and
functions. To test this hypothesis in a pilot study cohort of 24 Border Collies, we included the
following specific aims:
• Retrieve a list of known human PGx genes and their annotations such as
pharmacogenomic functions and processed drugs utilizing available public databases
such as PharmgKb and PharmaADME.
• Identify canine PGx orthologs.
• Build a bioinformatic pipeline to analyze the WGS data of 24 Border Collies to
identify genomic variants and their predicted implications in canine PGx genes.
• Analyze the frequency and significance of the variants in the breed.
11
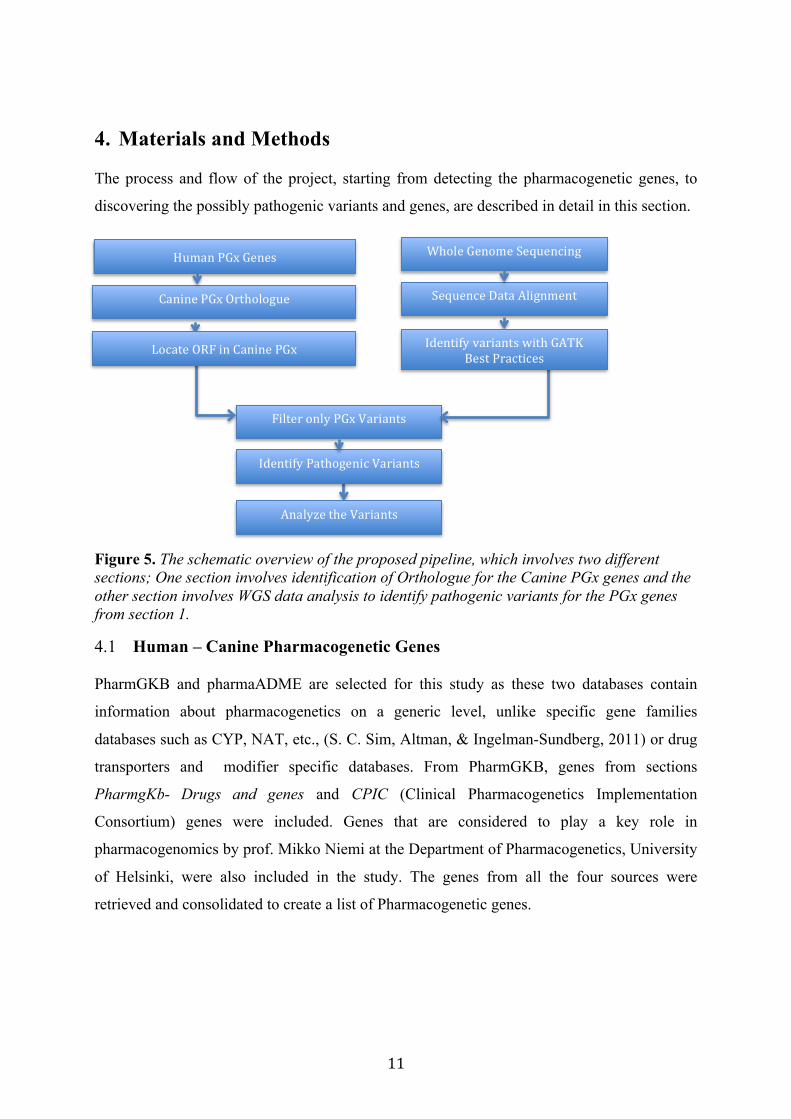
4. Materials and Methods The process and flow of the project, starting from detecting the pharmacogenetic genes, to
discovering the possibly pathogenic variants and genes, are described in detail in this section.
Figure 5. The schematic overview of the proposed pipeline, which involves two different sections; One section involves identification of Orthologue for the Canine PGx genes and the other section involves WGS data analysis to identify pathogenic variants for the PGx genes from section 1.
Human – Canine Pharmacogenetic Genes 4.1 PharmGKB and pharmaADME are selected for this study as these two databases contain
information about pharmacogenetics on a generic level, unlike specific gene families
databases such as CYP, NAT, etc., (S. C. Sim, Altman, & Ingelman-Sundberg, 2011) or drug
transporters and modifier specific databases. From PharmGKB, genes from sections
PharmgKb- Drugs and genes and CPIC (Clinical Pharmacogenetics Implementation
Consortium) genes were included. Genes that are considered to play a key role in
pharmacogenomics by prof. Mikko Niemi at the Department of Pharmacogenetics, University
of Helsinki, were also included in the study. The genes from all the four sources were
retrieved and consolidated to create a list of Pharmacogenetic genes.
HumanPGxGenes WholeGenomeSequencing
CaninePGxOrthologue
SequenceDataAlignment
FilteronlyPGxVariants
IdentifyPathogenicVariants
AnalyzetheVariants
LocateORFinCaninePGx IdentifyvariantswithGATKBestPractices

12
Canine orthologues 4.2 The canine orthologues were retrieved using Ensembl Compara gene trees (Vilella et al.,
2009). Ensembl Compara is a computation pipeline that was built to produce phylogenetic
trees for many genomes, especially the vertebrates, evolved during the process of evolution.
The general idea of evolution is that all forms of life shares a common ancestor and this
primary theory is defined as ‘descent with modification’. Sweeping changes in the genome
has led to the process of speciation throughout evolution. Even after speciation, many genes
or proteins sharing the same functionality remain highly similar. A phylogenic tree is more
like a graph of the evolutionary journey of a gene from root to different species (Doolittle,
1999). Species that are genetically close lie close to each other or belong to the same cluster
in a phylogenetic tree. To perform comparative analysis on an interested gene, the first
essential step is not only to identify the homologous gene, but also to identify the type of the
relationship of the gene between the species, i.e. whether it is in an ortholog or a paralog.
This information is readily available from a phylogenetic tree or a gene tree.
Figure 6. Example of phylogenetic tree adapted from (Studer & Robinson-Rechavi, 2009)
The Ensembl Compara gene trees were created using a series of computational steps that
starts with protein sequences of all species and ends with creation of gene tress. The protein
sequences were obtained, from all the species involved in the study, by retrieving the longest
translation available in the Ensembl database. The protein sequence from each species was
analyzed with pBLAST against protein sequences of all other species protein databases.
Based on the BLAST Score Ratios (BSR) (Ratio of blast score between two species), proteins
of different species were connected to form a graph. From the graph the clusters were
Table 2. Gene relationship in gene from different species
Gene Pair Relation-
Ship
Type
A All others Orthologue
One-to-
many
α Bα and Cα Orthologue
One-to-One
β Bβ, Cβ1 and
Cβ2 Orthologue
One-to-
many
Β Cβ1 and Cβ2 Paralogue Within-
species

13
identified using linkage cluster methods. All the proteins in a single cluster belonged to a
single gene family. The protein sequences of all these were performed Multiple Sequence
Alignment (MSA) using MUSCLE. The protein sequence obtained from MSA was back
translated to DNA sequence, and was given as an input to the program, TreeBeST, that
generated the required phylogenetic tree.
Ensembl Perl API consists of four connected databases known as Core, Compara, Variation
and Regulation. Each database uses different classes known as adaptors to retrieve the
required information. The homology adaptor from Compara was used to retrieve the ortholog
information between human and dog. Along with the orthologue gene, information such as
eValue and dn/ds ratio was also retrieved.
Identifying ORF in Canine PGx Genes 4.3 For the canine orthologs retrieved from Ensembl Compara, the genomic co-ordinates for only
the protein coding regions needed to be obtained. As per the central dogma of molecular
biology, the DNA is transcribed into mRNA (Introns + Exons + UTR), mRNA in-turn into
mature mRNA (Exons +UTR) after the splicing event. Maximum portion of the mature
mRNA is comprised of the coding sequences that are translated to proteins. This region of
mRNA that is translated to protein comprises the open reading frame (ORF, Figure 7).
Figure 7. Up stream , downstream, intron , exon and ORF explained
By using the information of ortholog gene retrieved (from the homology adaptor), gene
specific information was retrieved using the gene adaptor from the Ensembl core database.
The information included details of the gene such as genomic location, co-ordinates of exons
and coding regions within the gene. Using this information a bed file was created with only
the open reading frames (of the longest transcript) of each ortholog genes.
14
Whole Genome Sequencing 4.4 DNA samples were collected from twenty-four Border Collies. DNA was isolated from the
EDTA-blood using semi-automated Chemagen robot and purified. DNA prepared and
sequenced using Illumina HiSeq2500 methodology as described by Hytönen et al 2016,
PlosGenet.
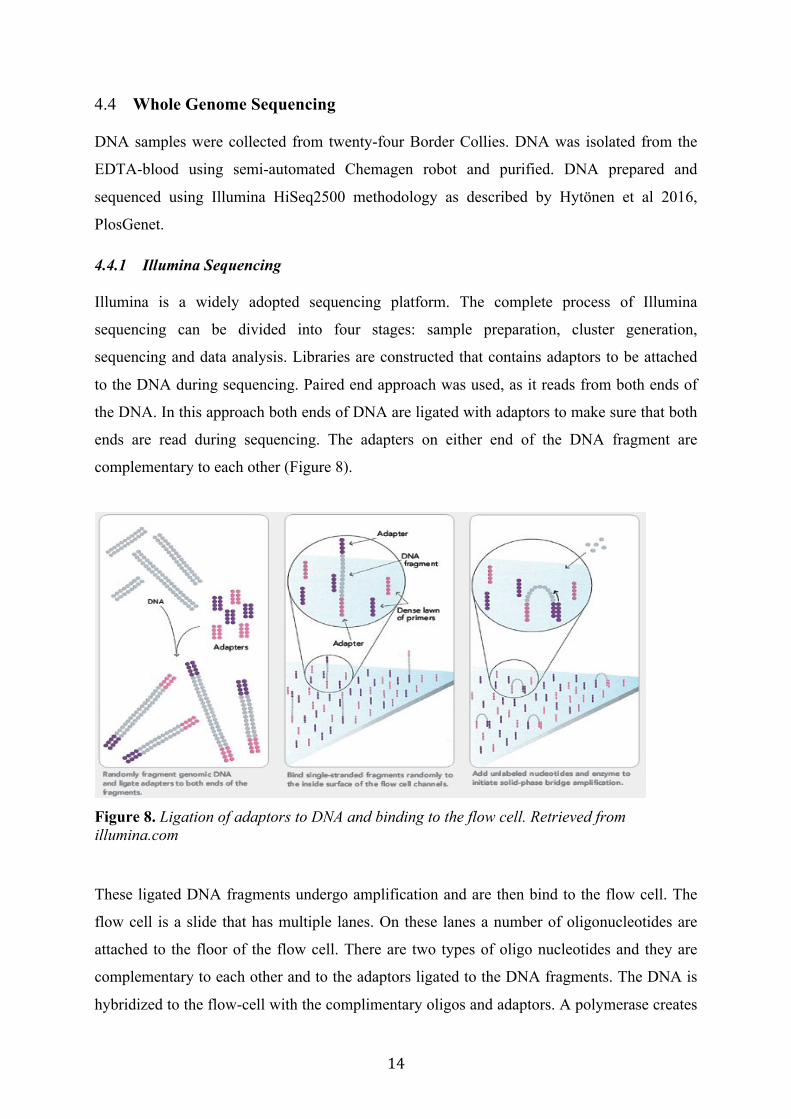
4.4.1 Illumina Sequencing Illumina is a widely adopted sequencing platform. The complete process of Illumina
sequencing can be divided into four stages: sample preparation, cluster generation,
sequencing and data analysis. Libraries are constructed that contains adaptors to be attached
to the DNA during sequencing. Paired end approach was used, as it reads from both ends of
the DNA. In this approach both ends of DNA are ligated with adaptors to make sure that both
ends are read during sequencing. The adapters on either end of the DNA fragment are
complementary to each other (Figure 8).
Figure 8. Ligation of adaptors to DNA and binding to the flow cell. Retrieved from illumina.com
These ligated DNA fragments undergo amplification and are then bind to the flow cell. The
flow cell is a slide that has multiple lanes. On these lanes a number of oligonucleotides are
attached to the floor of the flow cell. There are two types of oligo nucleotides and they are
complementary to each other and to the adaptors ligated to the DNA fragments. The DNA is
hybridized to the flow-cell with the complimentary oligos and adaptors. A polymerase creates

15
a complementary strand to the hybridized DNA creating a double stranded DNA. From this
double stranded DNA, the original strand is detached by washing it away. The free end of the
newly created complementary strand also binds to the flow cell by hybridizing with the other
oligonucleotides. These DNA fragments now attached on both sides to the flow through the
ligands undergo bridge amplification as shown in figures 8 and 9, leading to amplification of
both the forward and reverse strand of the DNA fragment.
Figure 9. Bridge Amplification and formation of read clusters. Retrieved from www.illumina.com
The same process is followed through out all the lanes of the flow cell forming clusters of
DNA fragments. Next the reverse strand is washed away and further amplification is blocked.
The ligand present at the free end of the DNA fragment contains region that is complimentary
to a sequences primer. Thus a sequencing primer is hybridized to the ligand that starts
producing the read. Fluorescent nucleotides are attached to the DNA fragment producing a
read. With each addition a light specific to that nucleotide is emitted from the flow cell
cluster, depicting the nucleotide in the read. The number of time the light is emitted at a
cluster depicts the length of the read. The intensity of the color emitted depicts the quality of
the base call. This read depicting the read one is washed away. The DNA is bridged and a
complementary sequence is produced washing away the first fragment. The sequencing
process is again repeated, now in the opposite direction producing the read two. These reads
are recorded on files known as fastq/fasta.
16
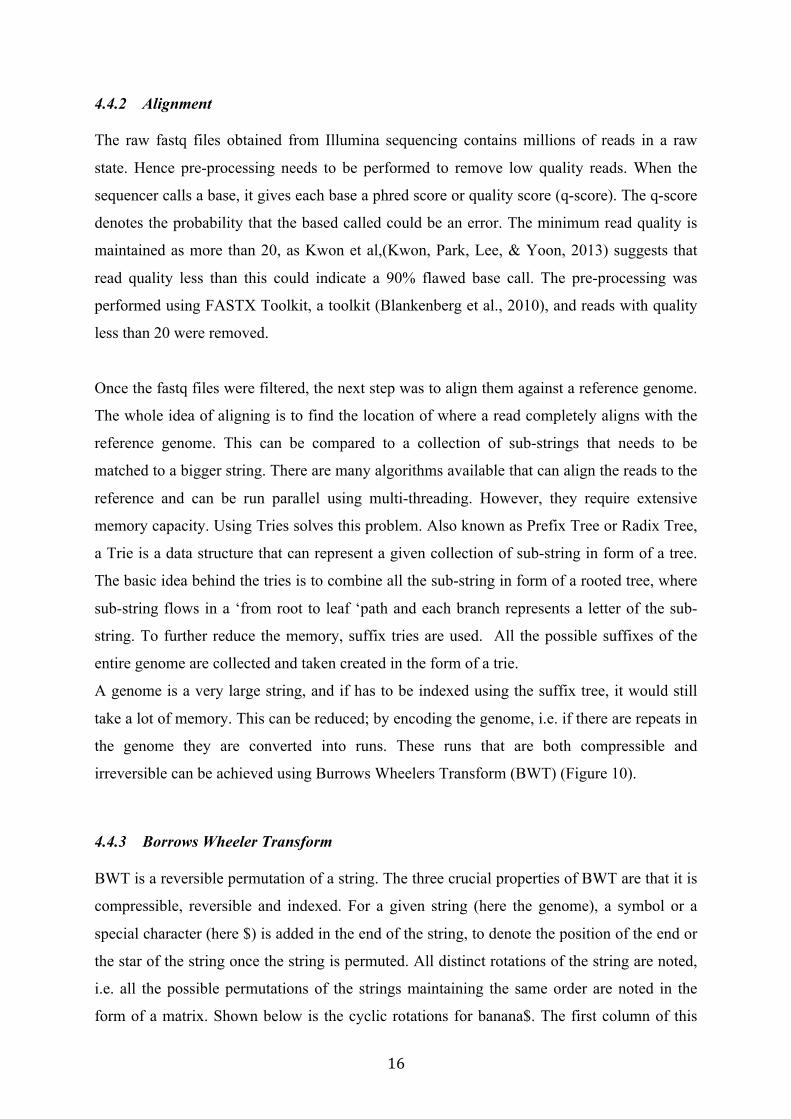
4.4.2 Alignment The raw fastq files obtained from Illumina sequencing contains millions of reads in a raw
state. Hence pre-processing needs to be performed to remove low quality reads. When the
sequencer calls a base, it gives each base a phred score or quality score (q-score). The q-score
denotes the probability that the based called could be an error. The minimum read quality is
maintained as more than 20, as Kwon et al,(Kwon, Park, Lee, & Yoon, 2013) suggests that
read quality less than this could indicate a 90% flawed base call. The pre-processing was
performed using FASTX Toolkit, a toolkit (Blankenberg et al., 2010), and reads with quality
less than 20 were removed.
Once the fastq files were filtered, the next step was to align them against a reference genome.
The whole idea of aligning is to find the location of where a read completely aligns with the
reference genome. This can be compared to a collection of sub-strings that needs to be
matched to a bigger string. There are many algorithms available that can align the reads to the
reference and can be run parallel using multi-threading. However, they require extensive
memory capacity. Using Tries solves this problem. Also known as Prefix Tree or Radix Tree,
a Trie is a data structure that can represent a given collection of sub-string in form of a tree.
The basic idea behind the tries is to combine all the sub-string in form of a rooted tree, where
sub-string flows in a ‘from root to leaf ‘path and each branch represents a letter of the sub-
string. To further reduce the memory, suffix tries are used. All the possible suffixes of the
entire genome are collected and taken created in the form of a trie.
A genome is a very large string, and if has to be indexed using the suffix tree, it would still
take a lot of memory. This can be reduced; by encoding the genome, i.e. if there are repeats in
the genome they are converted into runs. These runs that are both compressible and
irreversible can be achieved using Burrows Wheelers Transform (BWT) (Figure 10).
4.4.3 Borrows Wheeler Transform BWT is a reversible permutation of a string. The three crucial properties of BWT are that it is
compressible, reversible and indexed. For a given string (here the genome), a symbol or a
special character (here $) is added in the end of the string, to denote the position of the end or
the star of the string once the string is permuted. All distinct rotations of the string are noted,
i.e. all the possible permutations of the strings maintaining the same order are noted in the
form of a matrix. Shown below is the cyclic rotations for banana$. The first column of this

17
matrix is sorted lexicographically and the resulting matrix is known as Burrows Wheeler
matrix. From this matrix the string from the last column is known as Burrows Wheeler
Transform.
BANANA$ B1A1N1A2N2A1$1
BANANA$ $BANANA A $ $1BANANA1
ANANA$B A$BANAN N A A1$BANAN1
NANA$BA ANA$BAN N A A2NA$BAN2
ANA$BAN Sorted ANANA$B B Sorted A A3NANA$B1
NA$BANA BANANA$ $ B B1ANANA$1
A$BANAN NA$BANA A N N1A$BANA2
$BANANA NANA$BA A N N2ANA$BA3 BWT Matrix BWT Last Column First column First Last Property
From the last column the first column can be retrieved by lexographically sorting it. Then, the
first and last columns when combined to form a two-dimensional matrix are known as 2mers.
These 2mers when sorted can be used to re-construct (decompress) the whole original string
in an order. The process of decompression is more efficient by a property of BWT, which is
the ‘First-Last Property’. From a Burrows Wheelers Matrix, for a particular symbol or
character, its nth occurrence in the last column and nth occurrence in the first column,
correspond to the same position in the original string. The statement can be re-arranged as, if
a character ‘a’ has many repeats in a string, then the same character ‘a’ at a position ‘x’ in the
string, has kth occurrence in both the first and second columns. For example, taking A1, A2
and A3 for instance. A1 in the last column and A1 in the first column belong to the same
position in BANANA, that BA1NANA. Similarly, A2 and A3 in the first column and last
column belong to positions BANA2NA and BANANA3 respectively.
4.4.4 BWT Pattern Matching Using the BWT and suffix array, the alignment of the read (sub-string) to the genome (string)
can be performed efficiently with less memory. The genome is compressed to BWT.
Combining this information with the first-last property, pattern matching can be achieved
very efficiently. The tool Burrows Wheeler Aligner (BWA) that uses BWT, was used to
perform the alignment of the filtered reads. The reads were aligned against canine reference
assembly CanFam3.1. The output of the alignment in saved in a binary format in files known
as Binary Alignment Map (BAM).

18
Pre-processing
Readalignment
Recalibration
VariantCalling
Annotation
RemoveLowquality,UnmappedandduplicateReads
CalculateCoverageAlignwithReference
IndelRe-alignment
IdentifyReadGroup
ReadGroupCo-variation BSQR
Identifyvariants Determinegenotypes
Removelowcoveragevariants
Predicttypeofmutation
Annotatewithvariantid
To identify the variations in the PGx genes from the bam files, the reads have to be processed
using various tools, including BWA, Samtools, GATK, Picard, VCF-Tools and SnpEff.
Figure 10. An overview of different analysis steps of NGS sequence data to identify pathogenic variants.
4.4.5 Pre-processing the aligned reads Even after aligning the reads, a couple of pre-processing steps are needed. A Read produced
by sequencer contains information of the location of the read in the first line and the
nucleotide sequence in the next consecutive lines. Not every read produced by the sequencer
needs to be mapped. Many reads could be left un-mapped due to various reasons such as poor
quality or incompleteness of the reference genome or due to unknown genome contamination
(Gouin et al., 2014). However, these reads can still map to the reference and might be a
source of confusion or false discovery. Hence, these unmapped reads are removed before
further analysis. In the process of sequencing, the DNA is amplified to make available enough
samples for the sequencer to read the nucleotide sequence. This step results in duplicated
reads. These reads are undesirable as they might impede the actual statistical proof of
genotyping a variant such as allele frequency (Tin, Rheindt, Cros, & Mikheyev, 2014). In
cases where many reads are duplicated with similar co-ordinates, the read that has better
quality is retained and the others are removed. The unmapped reads were removed using
Samtools (H. Li, 2011; H. Li et al., 2009). After some research it was analyzed that marking

19
the duplicates was better than removing them (Ebbert et al., 2016). Picard
(http://broadinstitute.github.io/picard/) was used to mark the duplicate reads. We utilized here
a PCR-free protocol for the WGS of 24 Border Collies to lower the number of ‘PCR
contaminants’ in the data analysis and to improve the sequencing coverage elsewhere in the
genome.
4.4.6 Calculate Coverage Once the unwanted reads are removed, the remaining mapped reads are calculated for
coverage. In theory, coverage can be mentioned as the number of times a nucleotide n a read
is sequenced. The higher the coverage better is the quality of the sequencing and in an
obvious manner higher is the cost. Though the overall or average coverage is given with a
value, e.g. ~35x, it is possible that there are reads more than 90x and some even less than 10x.
When coverage of some portion of genome is low, this can affect the reliability of the variant
calling. For instance, if there are only total of 4 reads for a locus and 2 reads among them
were called wrong due to some sequencing error, then this leads to call of a false variant.
Thus, it is always a good practice to calculate the coverage (Sims, Sudbery, Ilott, Heger, &
Ponting, 2014). The overall and genomic region specific coverage is calculated using
qualimap (Garc??a-Alcalde et al., 2012).
4.4.7 Indel Re-alignment The insertions or deletions in a read sequence can be confusing for the aligning algorithm to
align with the reference. The Indels could be easily misinterpreted as multiple SNPs and can
also disturb the recalibration process. Local re-alignment around target intervals is quite
essential to avoid false discovery of SNP. Local re-alignment looks for problem causing
regions, where there could be a possible indel. Multiple consecutive SNPs in a read are one
such possible locus. In such locus, the reads are re-aligned by finding the possible alternate
consensus sequences. The consensus sequence is scored, by summing up the mismatch scores.
The alternate consensus sequence with the best score is selected rather than the original
alignment. The indel realignment is performed using ‘IndelRealigner’ option from GATK
(DePristo et al., 2011).
4.4.8 Re-calibration Each single base has a phred score that depicts the quality of base in a read. However, the
score of a single base is not sufficient to determine the quality of the read. Reads that are run

20
together in a batch in a sequencing machine belong to a read group. Each read contains a read
group id, depicts the read group it belongs to in the sequencing machine run. Though the
phred scores can depict the error probability of a single base call, it is not appropriate measure
to identify insertions or deletions. For this covariates are calculated between the phred score
of the base in a read, the position of the base in the read, the previous nucleotide and it’s
phred score and the machine cycle the base is produced. The recalibration of a base is done in
two steps. The first step includes, creation of recalibration table and using this data the bam is
re-calibrated in the second step. The re-calibration table contains the details of the number of
bases in a read group and the frequency of mismatched bases, as per dbSNP. Once the
recalibration table is created, the quality scores of the reads in the old bam file are re-
calculated and written to a new re-calibrated bam file. These new phred scores are essential to
identify indels (DePristo et al., 2011). Using dbSNP data from DoGSD as a reference dbSNP,
recalibration was performed using ‘BaseRecalibrator’ option from GATK (Bai et al., 2015).
4.4.9 Variant Identification From the bam file, once the reads are aligned with the reference and re-calibrated, the single
nucleotide bases that differ from the reference are identified as SNPs (Nielsen et al., 2011).
The nucleotide from the aligned reads at each genomic position is first genotyped and variants
are identified based on the genotype information. The base call intensities from the
sequencing are noted in terms of per base quality score based on noise from image analysis.
This values is converted to phred score by the below formula
Qphred = -10log10 (error) (Qphred = 20 => 1% error )
Formula.1. Calculation of phred score
As this cannot be trusted completely, recalibration was performed using GATK using the
empirical phred scores that was calculated as the difference between the mismatches between
the base call and the reference genome and the mismatches implied by the raw quality score.
This empirical phred score is added to the raw quality score to obtain the recalibrated quality
scores. These base calls and the recalibrated quality scores are used to determine the genotype
and eventually the variant. In the classic method of genotyping, the number of alleles at a site
is counted and would be determined heterozygous if the non-reference allele is between 20-
21
80%; else it is determined as homozygous depending on weather the allele is reference or
non-reference. However, this could work as described only if the coverage is about 20x and
this method also does not provide the probability of certainty of the genotype called. Hence
the best available option for genotype calling is probabilistic models. The genotype calling
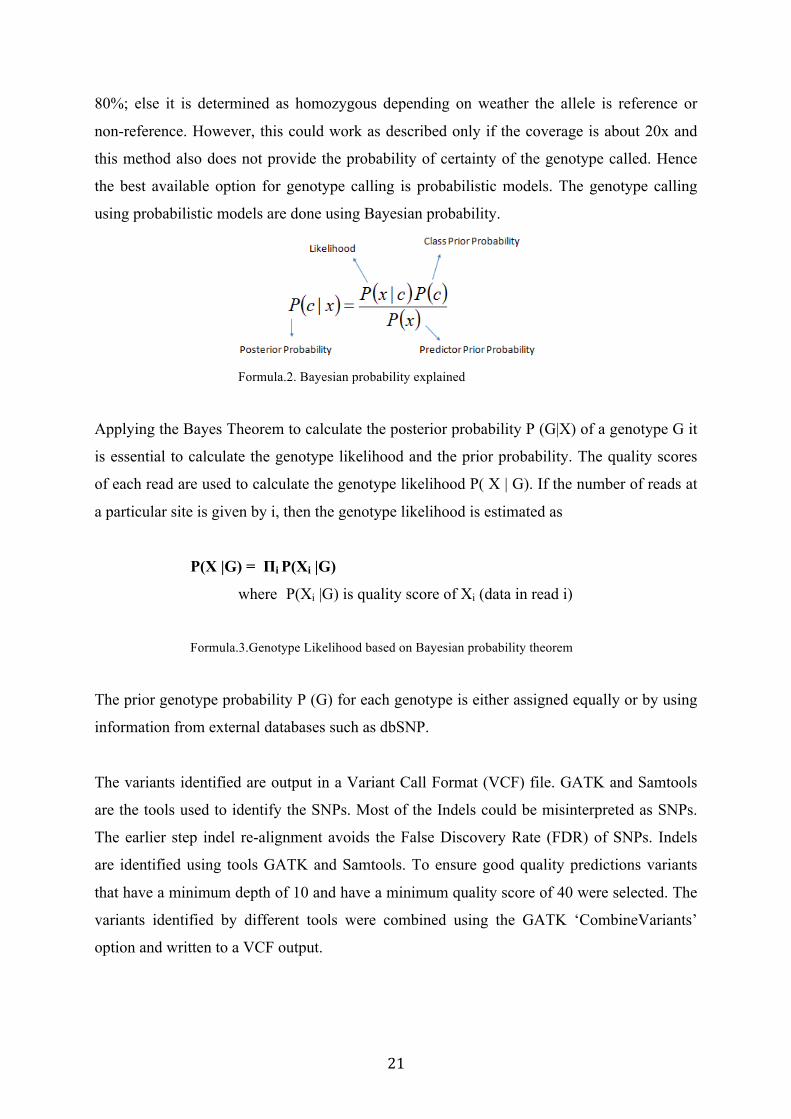
using probabilistic models are done using Bayesian probability.
Formula.2. Bayesian probability explained
Applying the Bayes Theorem to calculate the posterior probability P (G|X) of a genotype G it
is essential to calculate the genotype likelihood and the prior probability. The quality scores
of each read are used to calculate the genotype likelihood P( X | G). If the number of reads at
a particular site is given by i, then the genotype likelihood is estimated as
P(X |G) = Πi P(Xi |G)
where P(Xi |G) is quality score of Xi (data in read i)
Formula.3.Genotype Likelihood based on Bayesian probability theorem
The prior genotype probability P (G) for each genotype is either assigned equally or by using
information from external databases such as dbSNP.
The variants identified are output in a Variant Call Format (VCF) file. GATK and Samtools
are the tools used to identify the SNPs. Most of the Indels could be misinterpreted as SNPs.
The earlier step indel re-alignment avoids the False Discovery Rate (FDR) of SNPs. Indels
are identified using tools GATK and Samtools. To ensure good quality predictions variants
that have a minimum depth of 10 and have a minimum quality score of 40 were selected. The
variants identified by different tools were combined using the GATK ‘CombineVariants’
option and written to a VCF output.
22
Variant databases have a broad set of SNPs, where each variant is tagged with a variant
identifier. The GATK variant annotator, marks these ids to the variants in the filtered vcf file,
i.e. if a variant present in the filtered VCF file has an id tagged to it in the database, then the
annotator, tags the id to the variant. These ids were added to the Id Field in the VCF File.
Filtering PGx variants 4.5 At this stage, the two parallel segments of the pipeline were completed: (1) create bed files
with ORF genomic positions of the PGx genes; (2) identify variants from the samples under
study. The next step was to combine the outputs of the two segments and filter the variants
based on the ORF genomic positions of PGx genes. Thus, a two-step filtering was performed.
One, only variants related to PGx genes were retained and two, only variants that belonged to
the ORFs were selected. Also variants from psuedogenes were filtered out. The remaining
variants from all the samples under study were combined into a single file using GATK tool.
Pathogenicity Prediction 4.6 Proteins that have the same function in different species (orthologues) have evolutionarily
conserved sequence structure especially in the functional domains. In such conserved
positions, when the existing amino acid is changed by another amino acid with different
properties, the change is potentially deleterious.
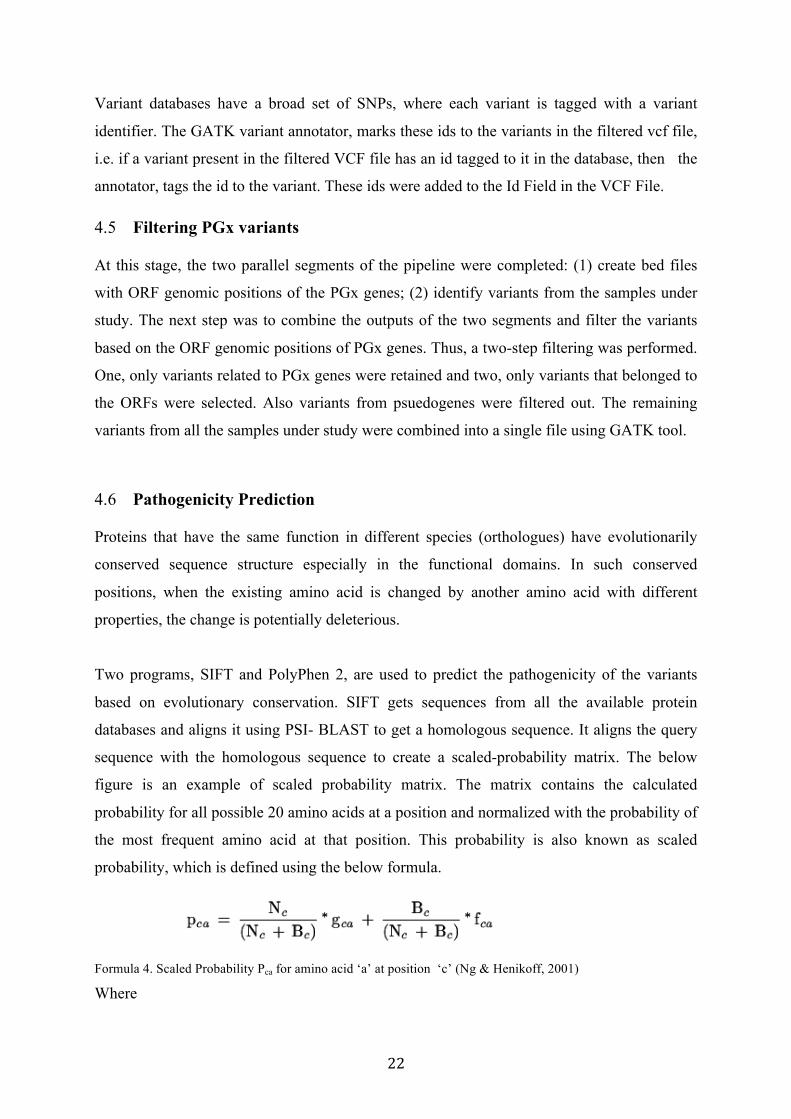
Two programs, SIFT and PolyPhen 2, are used to predict the pathogenicity of the variants
based on evolutionary conservation. SIFT gets sequences from all the available protein
databases and aligns it using PSI- BLAST to get a homologous sequence. It aligns the query
sequence with the homologous sequence to create a scaled-probability matrix. The below
figure is an example of scaled probability matrix. The matrix contains the calculated
probability for all possible 20 amino acids at a position and normalized with the probability of
the most frequent amino acid at that position. This probability is also known as scaled
probability, which is defined using the below formula.
Formula 4. Scaled Probability Pca for amino acid ‘a’ at position ‘c’ (Ng & Henikoff, 2001)
Where

23
Nc = Number of amino acids in the sequence
Bc = Number of pseudo counts exp (Σa(ra*gca))
ra =rank of the amino acid a in the BLOSUM matrix
gca= sequence weighed frequency that amino acid a appears at c (for normalizing)
fca = Pseudo count function added to Nc
A substitution is considered deleterious if its score is below a threshold (here < 0.05) (Ng &
Henikoff, 2006).
Figure11. Scaled Probability matrix for a protein sequence (Ng & Henikoff, 2006)
Polyphen 2, aligns the proteins from closely related species using MSA. From the MSA,
Position Specific Independent Counts score is calculated (PSIC Score), which represents the
logarithmic ratio of likelihood of a particular amino acid occurring at a particular position to
the likelihood of occurring at any other position (background frequency). These scores are
accumulated to form the profile matrix for a protein sequence. For a mutation, the difference
in the PSIC score of the reference and the mutant is calculated as ΔPSIC. Very high ΔPSIC
value indicates a possibility of pathogenic mutation(Adzhubei, Jordan, & Sunyaev, 2013).
Polyphen2 also uses a structure-based prediction along with the sequence-based features to
predict the pathogenicity. It gathers structure related protein information from databases like
Dictionary of Secondary Structure in Proteins (DSSP), Protein Data Bank (PBD) and also
calculates this information based on some protein structure parameters (such as
hydrophobicity, electrostatic interactions etc.). It maps the amino acid change to the structure
information available to decide if the amino acid is pathogenic(Adzhubei et al., 2013).
24
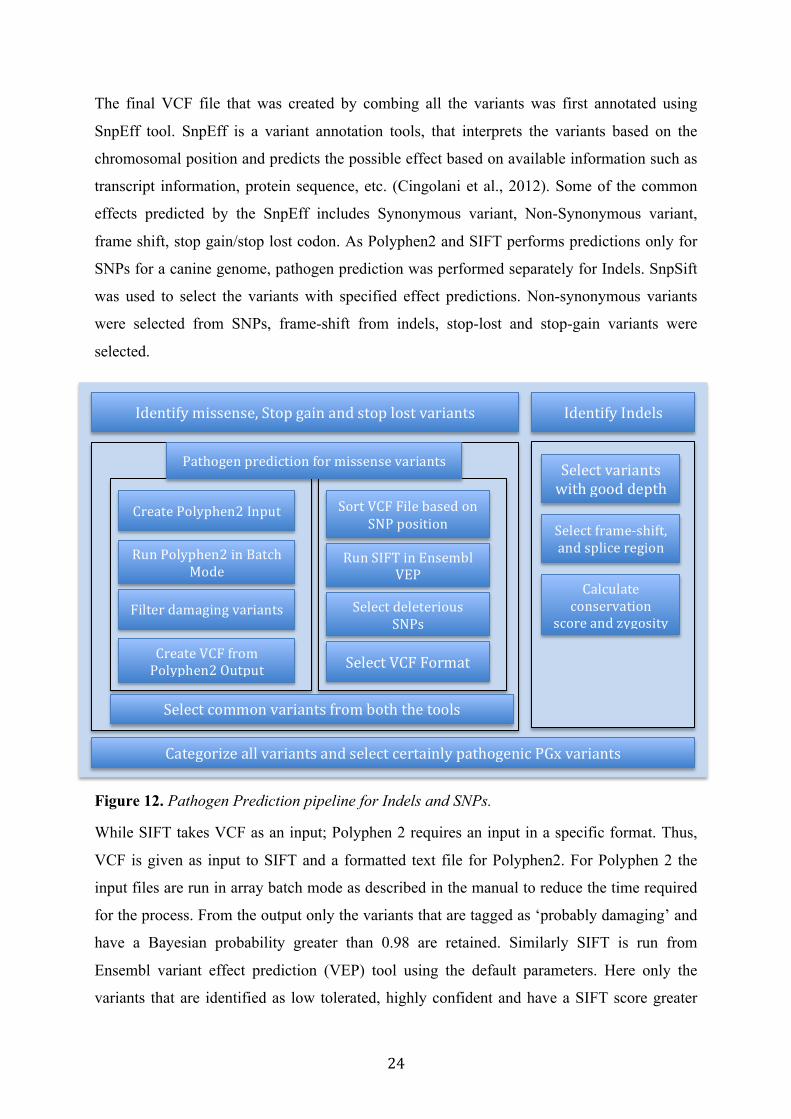
The final VCF file that was created by combing all the variants was first annotated using
SnpEff tool. SnpEff is a variant annotation tools, that interprets the variants based on the
chromosomal position and predicts the possible effect based on available information such as
transcript information, protein sequence, etc. (Cingolani et al., 2012). Some of the common
effects predicted by the SnpEff includes Synonymous variant, Non-Synonymous variant,
frame shift, stop gain/stop lost codon. As Polyphen2 and SIFT performs predictions only for
SNPs for a canine genome, pathogen prediction was performed separately for Indels. SnpSift
was used to select the variants with specified effect predictions. Non-synonymous variants
were selected from SNPs, frame-shift from indels, stop-lost and stop-gain variants were
selected.
Figure 12. Pathogen Prediction pipeline for Indels and SNPs.
While SIFT takes VCF as an input; Polyphen 2 requires an input in a specific format. Thus,
VCF is given as input to SIFT and a formatted text file for Polyphen2. For Polyphen 2 the
input files are run in array batch mode as described in the manual to reduce the time required
for the process. From the output only the variants that are tagged as ‘probably damaging’ and
have a Bayesian probability greater than 0.98 are retained. Similarly SIFT is run from
Ensembl variant effect prediction (VEP) tool using the default parameters. Here only the
variants that are identified as low tolerated, highly confident and have a SIFT score greater
Identifymissense,Stopgainandstoplostvariants IdentifyIndels
PredictPathogenicity
Polyphen2 SIFT
Selectcommonvariantsfromboththetools
FilterIndels
CategorizeallvariantsandselectcertainlypathogenicPGxvariants
CreatePolyphen2Input
RunPolyphen2inBatchMode
Filterdamagingvariants
CreateVCFfromPolyphen2Output
SortVCFFilebasedonSNPposition
RunSIFTinEnsemblVEP
SelectdeleteriousSNPs
SelectVCFFormat
Selectvariantswithgooddepth
Selectframe-shift,andspliceregion
Calculateconservation
scoreandzygosity
Pathogenpredictionformissensevariants

25
than 0.9 are included. The filtered variants from SIFT and Polyohen2 are further filtered to
retain only the SNPs predicted pathogenic by both the tools.
Unlike for the SNPs there are rather few tools to predict the effect of Indels for Canine
genome. Hence they need to be confirmed using genome viewer tools such as IGV. As it is
difficult to view so many Indels, a two-step filtering is used. From these indels only frame-
shift and splice region variants are selected, as these are the most probable indels that can be
deleterious. Next, only the variants with a depth greater than 20 are kept. Another interesting
feature to be observed here is breed specific variants. Variants in a homozygous state in all
the samples could either be variants specific to Border collie or Boxer (the reference genome
breed) and hence are removed. The remaining set of mutations is mostly true and deleterious,
however they are confirmed using IGV.
The missense variants identified as pathogenic by both SIFT and Polyphen2, the stop
mutations and the frame-shifts selected from the above processes are combined to get the final
list of interesting variants, among the 24 samples included in this study. To increase the
pathogenicity confidence of the indels the allele frequency and zygosity of the variant are
calculated using genotype frequency. Based on the information calculated, the variants are
categorized into pathogenic with high confidence, likely pathogenic and unlikely pathogenic.
Known functional inference 4.7 There are many clinical or disease or drug-related databases that provide implication of many
known mutations. The only online database for Canine is Online Mendelian Inheritance for
Animals (OMIA). However, there are many clinical or disease related database for human
such as CliniVar, Online Mendelian Inheritance for Man (OMIM), PharmGKB. To be able to
use the information from human databases, the genomic co-ordinates of certainly pathogenic
variants are converted to its orthologuous base in human genome using liftOver. LiftOver is
an online tool developed by the University of California, Santa Cruz (UCSC) genome
browser, and it provides amino acid in the human reference orthologous to the one at the
canine reference. The genomic positions are converted from CanFam3 to hg38.
To understand the biological characteristic of the certainly pathogenic variants, functional
analysis is performed using DAVID online tool.

26
5. Results
Identification of Canine PGx genes 5.1 To generate the list of Canine PGx genes, we first developed a list of known human PGx
genes from various sources, including PharmGKB, PharmaADME databases and the gene list
(382 genes) from prof. Mikko Niemi at the Department of clinical pharmacology. The list of
genes includes 47 genes from PharmGKB VIP gene set and 200 and 110 genes from
PharmGKB CPIC and drug related genes set, respectively. From the PharmaADME database,
31 Core genes, 267 extended and 74 related PGx genes were selected. The total set included
540 genes and they were divided into three categories: core genes, extended genes and related
genes (Figure 13). The core genes consisted of the genes that belonged to VIP gene set from
PharmGKB and core gene set from pharmaADME. The extended gene set consisted of genes
with known drug information (genes that belonged to drug related gene set) from PharmGKB
and the genes that belonged to extended gene set from pharmaADME. The related genes were
the genes that belonged to the related category (target/receptor genes) from pharmaADME
and other genes that do not belong to any other categories.
Figure 13. The generation of the human PGx list included in further studies in the pipeline.
Canine orthologues were identified using the Ensembl Compara API tool. We retrieved 495
orthologous canine genes for 492 human genes. Among the 495 orthologues, 60 were likely
pseudo-genes genes. Pseudo-genes are said to be the genes, that are evolutionarily related to
functional protein coding genes, but are suspected to have lost the protein coding
functionality due to various possible mutations such as a frame-shift or stop mutation. Even
though these 60 genes are pseudo-genes, recent studies using high-throughput technologies

27
have suggested that pseudo-genes could possess gene-expression regulatory functions (W. Li,
Yang, & Wang, 2013). There are also studies that suggest pseudo-genes have important
associations with pharmacogenomic genes and also act as therapeutic targets in some
cases(Roberts & Morris, 2013)(Cordero & Ashley, 2012).
Most of the orthologue pairs are mapped one to one, i.e one human gene to one canine gene.
For example, human ABCB1 and TPMT have MDR1 and TPMT as canine orthologues (only
one orthologue each). However, there were few orthologue pairs on an one-to-may-many
basis. For example, the canine CYP2A13 gene mapped to three human genes CYP2A13,
CYP2A7, and CYP2A6. The likely reason for this is that the three human genes are paralogs
to each other with high sequence similarity. However, the most likely orthologue pair can be
checked from the e-value (appendix Table 1) (Figure 15). Including both on-to-one and one-
to-many orthologue pairs, a total number of 532 human-canine orthologue pairs were
observed (with 492 human and 495 canine genes, Figure 14).
59%
8%
5%
28%
HumanCanineAllOrthologues
69%13%
8%10%
HumanCaninePGxOrthologues
Onetoone
OnetoMany
ManytoMany
OnetoNone
54 17
206
44
191
19
050100150200250300350400450500
KnownGene PsuedoGene
CaninePGxcategorized
Core Extended Related
43
186 180
1637
2312
277
0
50
100
150
200
Core Extended Related
PGxTypesOrthologueRelationship
OnetoOne OnetoMany
ManytoMany

28
Figure 14. a) Categorizing all the human and canine orthologues based on type of orthologue relationship b) Categorizing PGx genes based on type of orthologue relationship. c,d) Categorizing the PGx genes based on PGx type( Core, Extended and Related)
Chi squared test with Yates correction was performed to check how enriched the canine PGx
list was with genes that have a one to one orthologue relationship with human genes.
Table 3. Contingency table for the fischer exact test. The pValue from the fischer.test was about 0.001
Other Relationship One to one
Other Genes 11021 15398
PGX Genes 180 409 To understand the protein sequence similarities between the orthologues, eValues from pBlast
were obtained for two orthologue peptides from Ensembl compara API. When an eValue is
very small (negative exponentials) it is close to zero. For the convenience of understanding,
such values are converted to the minimum evaluable scientific number, which is ‘2.225074e-
308’. Also the number of base pairs in open reading frame of the orthologues was retrieved.
Figure 15. a) A density plot depicting the distribution of negative log10 e-value of the orthologue peptides with different types of orthologue mapping. b) Histogram of then ratio of the number of canine base pairs with the number of human base pairs.
PGx Annotation Table 5.2 A category annotation table was created using the information from PharmgKB and
PharmADME databases. The table contains information for each PGx gene in human; it’s
canine orthologue, the type of mapping (one2one, one2many and many2many), the gene type
(core, extended or related) and it’s pharmacogenomic role (enzyme, transporter, receptor,
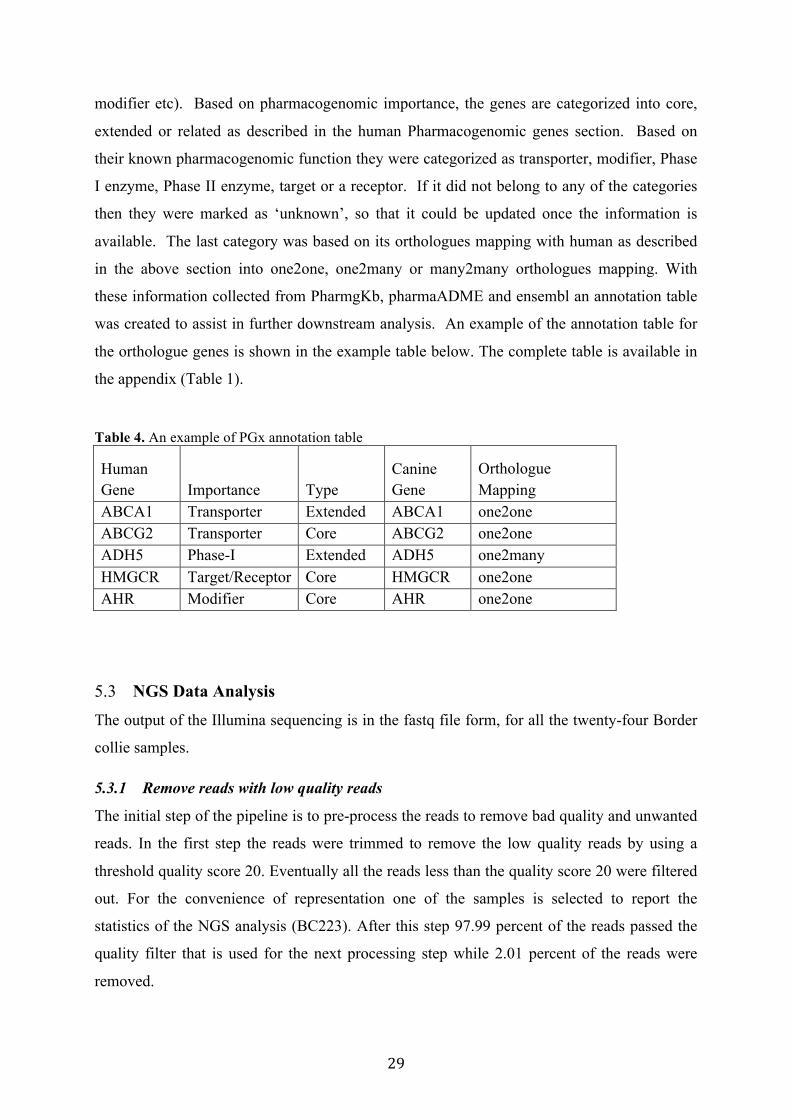
29
modifier etc). Based on pharmacogenomic importance, the genes are categorized into core,
extended or related as described in the human Pharmacogenomic genes section. Based on
their known pharmacogenomic function they were categorized as transporter, modifier, Phase
I enzyme, Phase II enzyme, target or a receptor. If it did not belong to any of the categories
then they were marked as ‘unknown’, so that it could be updated once the information is
available. The last category was based on its orthologues mapping with human as described
in the above section into one2one, one2many or many2many orthologues mapping. With
these information collected from PharmgKb, pharmaADME and ensembl an annotation table
was created to assist in further downstream analysis. An example of the annotation table for
the orthologue genes is shown in the example table below. The complete table is available in
the appendix (Table 1).
Table 4. An example of PGx annotation table
Human Gene Importance Type
Canine Gene
Orthologue Mapping
ABCA1 Transporter Extended ABCA1 one2one ABCG2 Transporter Core ABCG2 one2one ADH5 Phase-I Extended ADH5 one2many HMGCR Target/Receptor Core HMGCR one2one AHR Modifier Core AHR one2one
NGS Data Analysis 5.3
The output of the Illumina sequencing is in the fastq file form, for all the twenty-four Border
collie samples.
5.3.1 Remove reads with low quality reads
The initial step of the pipeline is to pre-process the reads to remove bad quality and unwanted
reads. In the first step the reads were trimmed to remove the low quality reads by using a
threshold quality score 20. Eventually all the reads less than the quality score 20 were filtered
out. For the convenience of representation one of the samples is selected to report the
statistics of the NGS analysis (BC223). After this step 97.99 percent of the reads passed the
quality filter that is used for the next processing step while 2.01 percent of the reads were
removed.

30
5.3.2 Align with reference and coverage
The fastq files from the above step were aligned with the reference genome CanFam3.1. The
coverage of all the samples was calculated (Figure 16).
Figure 16. A plot representing the coverage after pre-processing the low quality reads. The X-axis and Y- axis represents the 24 samples and the average coverage across the whole genome.
After the alignment the reads that were left unmapped were removed. 0.6 % of the reads was
found to left be unmapped and were removed. From this output of this file duplicate reads
(formed due to PCR amplification) were removed. About 3.39 percent of the reads were
removed in this step. The output bam after this was a successfully pre-processed file. The pre-
processed bam file was re-calibrated using dbSNP data from DoGSG as a reference. The
statistics of all these steps are presented in the tables below (Tables 4-7)
Table 5. Statistics of reads before alignment Raw fastq
Files % of Total Reads
Filtered Fastq file
% of reads passed
% of Reads removed
Read 1 658,200,600 51.25 643,444,600 97.76 2.24 Read 2 626,093,375 48.75 615,667,265 98.22 1.78 Total Reads
1,284,294,105 100 1,259,111,865 97.99 2.01
Table 6. Statistics of reads aligned to reference Initial Reads Mapped Reads UnMapped Reads % Mapped Reads % Unmapped Reads
1,259,111,865 1,250,549,904 8,561,961 99.324 0.676
0
10
20
30
40
50
60
BC272
BC273
BC1021
BC1026
BC1028
BC1029
BC203
BC222
BC223
BC377
BC387
BC388
BC399
BC556
BC569
BC576
BC577
BC578
BC674
BC824
BC877
BC907
BC922
BC925
Averagecoverageofallthe24samples

31
Table 7. Statistics after marking the duplicated reads Before Marking Duplicates
After marking Reads Marked Reads % Marked Reads
1,250,549,904 1,209,546,285 410,003,619 3.39
Table 8. Statistics after re-calibration Total number of reads
Reads from 1st in pair (Number and %)
Reads from second in pair (Number and %)
1,209,546,285 606,635,506 50.15 602,910,779 49.85 The chromosome wise coverage was calculated after re-calibration for a better insight into the
coverage details.
Figure 17. Plot representing chromosome wise coverage.
Variant Identification 5.4
The final recalibrated bam contains 94.17 % of reads compared to the raw reads after the pre-
processing and recalibration steps. These reads were used to call the variants that include
SNPs, Indels and some structural variants.
With the default set parameters GATK identified 4771681 SNPS and 1391674 Indels while
Samtools identified 4595077 SNPS and 189339 Indels. The variants were combined based on
the chromosome position and the nucleotide change in the variation using the GATK combine
variants option. Both the tools identified 96.09 % of SNPs. GATK and Samtools individually
identified 2.23 % and 1.68% of the SNPs. Similarly, out of the 1581013 total potential indels
identified, 550812 indels that contribute to 65.16% from the combined lists were the ones
0
10
20
30
40
50
60
70
80
chr1
chr3
chr5
chr7
chr9
chr11
chr13
chr15
chr17
chr19
chr21
chr23
chr25
chr27
chr29
chr31
chr33
chr35
chr37
chrX
ChromosomewisecoverageofRecalibratedBAM
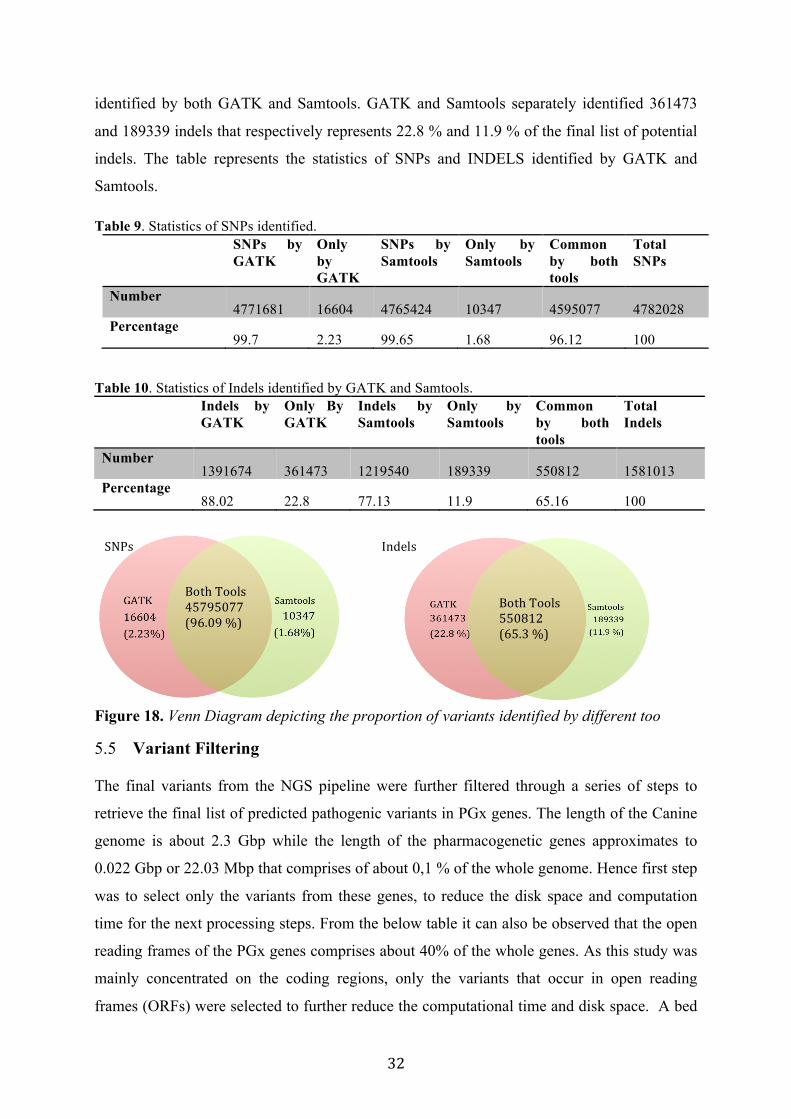
32
identified by both GATK and Samtools. GATK and Samtools separately identified 361473
and 189339 indels that respectively represents 22.8 % and 11.9 % of the final list of potential
indels. The table represents the statistics of SNPs and INDELS identified by GATK and
Samtools.
Table 9. Statistics of SNPs identified. SNPs by
GATK Only by GATK
SNPs by Samtools
Only by Samtools
Common by both tools
Total SNPs
Number 4771681 16604 4765424 10347 4595077 4782028
Percentage 99.7 2.23 99.65 1.68 96.12 100
Table 10. Statistics of Indels identified by GATK and Samtools. Indels by
GATK Only By GATK
Indels by Samtools
Only by Samtools
Common by both tools
Total Indels
Number 1391674 361473 1219540 189339 550812 1581013
Percentage 88.02 22.8 77.13 11.9 65.16 100
Figure 18. Venn Diagram depicting the proportion of variants identified by different too
Variant Filtering 5.5 The final variants from the NGS pipeline were further filtered through a series of steps to
retrieve the final list of predicted pathogenic variants in PGx genes. The length of the Canine
genome is about 2.3 Gbp while the length of the pharmacogenetic genes approximates to
0.022 Gbp or 22.03 Mbp that comprises of about 0,1 % of the whole genome. Hence first step
was to select only the variants from these genes, to reduce the disk space and computation
time for the next processing steps. From the below table it can also be observed that the open
reading frames of the PGx genes comprises about 40% of the whole genes. As this study was
mainly concentrated on the coding regions, only the variants that occur in open reading
frames (ORFs) were selected to further reduce the computational time and disk space. A bed
BothTools45795077(96.09%)
BothTools550812(65.3%)
SNPs Indels
33
file was created using Bedtools with information of genomic regions of just the ORF of PGx
genes. This bed file was used to filter the variants. The final output of this step is also a VCF
file.
Table11. Length of Canine PGx genes and ORFs. Length in Base Pairs Whole Canine Genome Pharmacogenomic (PGx) Genes PGx Genes ORF 2,392,715,236
22,031,443 922,260
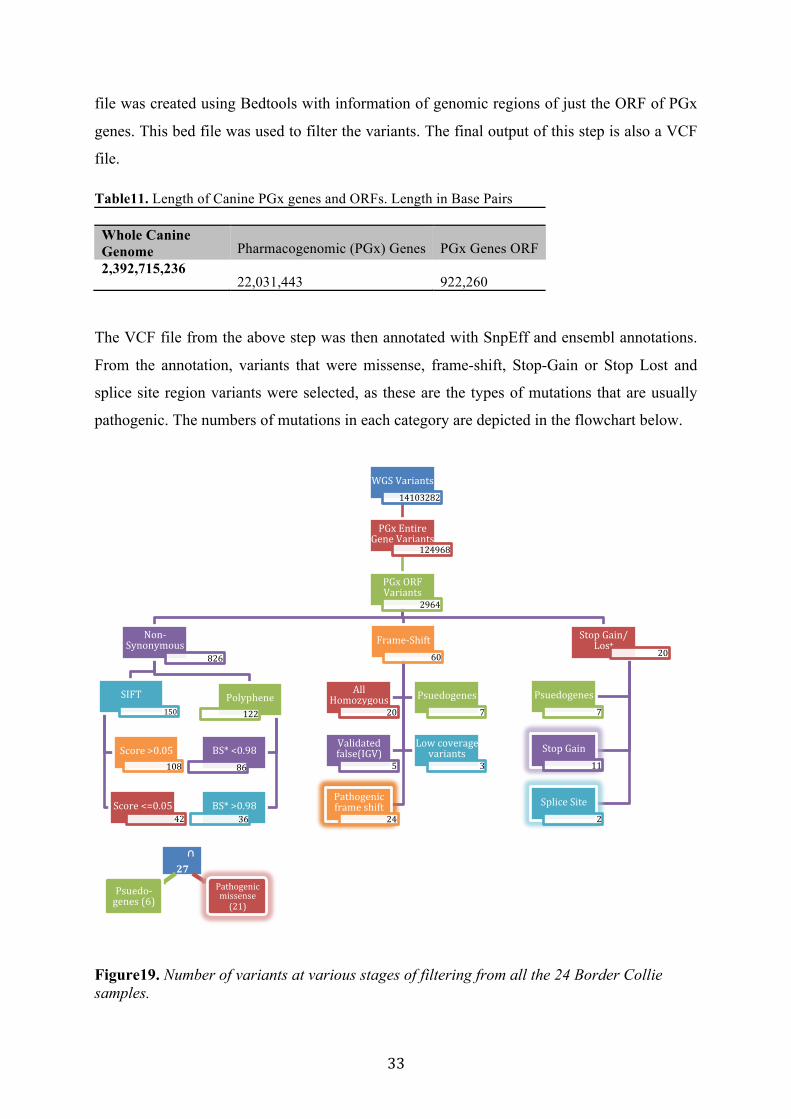
The VCF file from the above step was then annotated with SnpEff and ensembl annotations.
From the annotation, variants that were missense, frame-shift, Stop-Gain or Stop Lost and
splice site region variants were selected, as these are the types of mutations that are usually
pathogenic. The numbers of mutations in each category are depicted in the flowchart below.
Figure19. Number of variants at various stages of filtering from all the 24 Border Collie samples.
WGSVariants14103282
PGxEntireGeneVariants
124968
PGxORFVariants
2964
Non-Synonymous
826
SIFT150
Score>0.05108
Score<=0.0542
Polyphene122
BS*<0.9886
BS*>0.9836
Frame-Shift60
AllHomozygous
20
Psuedogenes7
Validatedfalse(IGV)
5
Lowcoveragevariants
3
Pathogenicframeshift
24
StopGain/Lost
20
Psuedogenes7
StopGain11
SpliceSite2
∩27
Pathogenicmissense(21)
Psuedo-genes(6)

34
Pathogen variation prediction 5.6 The Missense variants were further processed to find or predict the possibly pathogenic
mutations. Polyphen2 classifies the predictions into benign, possibly damaging and probably
damaging. The variants that were predicted probably damaging with a Bayesian probability
greater than 0.95 are selected, as they are the one with high confidence. SIFT, identifies the
pathogenic variants or deleterious variants and gives a confidence score. The variants that
were deleterious with high confidence were selected. As Polyphen predicts based on sequence
alignments and SIFT based on conservation score, selecting only the variants that are
predicted pathogenic by both the programs, further increases the confidence of the prediction.
Among the 826 variants from 24 samples, 42 variants from Polyphen2 and and 36 variants
form SIFT were selected based on their respective selecting criteria as mentioned above.
Table 12. Variants identified by Polyphen 2 Predicted as benign
Predicted as damaging
Predicted as damaging with Bayesian score > 0.95 (selected)
Predicted damaging based on alignment
Predicted damaging based on structure
704 122 42 40 2
Table13.Variants identified by SIFT. Predicted benign Predicted deleterious Deleterious with high confidence
676 150 42
Figure 20. Pie diagram depicting the overlap between Polyphen2 and SIFT
The indels, that included frame shift, stop gain / stop lost and splice site mutations were
further analyzed in IGV. Variants that were false positive and had very low coverage were
removed. An example of low coverage is depicted in figure 21 at
‘chr7:79047553:GCCCC>GCCC’, the coverage is very less and hence the genotype cannot be
reliable.
159
27
OnlySIFT
OnlyPolyphen2
BothSIFTandPolyphen2

35
Figure 21. IGV screen shot of a variant filtered out due to low coverage
One of the indels identified at chromosome position ‘ is a false positive as depicted in figure
22. It can be seen that the indel is actually two snps at adjacent positions and is falsely called
as an indel. From the frame-shift variants 2 and 3 variants were removed due to low coverage
and false positives respectively.
Figure 22: IGV screen shot of two consecutive snps false called as an indel.

36
A simple algorithm was written to calculate the number of homozygous and heterozygous
mutation at each site and the allele frequency based on the genotype frequency. In the final
step, 20 variants were removed, as they were present in all the samples in a homozygous state
implying that they could be specific to Border collie or the Boxer (reference genome). All the
remaining variants were then categorized into three classes such as pathogenic variants with
high confidence, likely pathogenic and unlikely pathogenic. Highly confident pathogenic
variants included the frame-shift and stop-gain indels after the filtering and the missense
variants identified by both SIFT and Polyphen 2. The highlighted boxes in figure 19 represent
the set of highly confident pathogenic variants. Likely pathogenic variants include breed
specific variants, variants with low coverage and pathogenic missense variants identified by
either SIFT or polyphen2. The variants that did not come under any of this category belonged
to unlikely pathogenic variants.
Figure 23. Illustration of a pie chart; depicting the number of variants, at each level of pathogenicity.
A total of 68 variants were classified as certainly pathogenic variants out of which 9 belonged
to core genes and 59 belonged to either extended or related genes. Among the rest of the
variants 251 variants belonged to the likely pathogenic category while 657 variants were
categorized as unlikely pathogenic variants. The complete list of pathogenic variants with
high confidence from this study is listed here below (Table 14).
69%
25%
5%
1%HighconfidencePathogenicity
Unlikely
Likely
Extended/Related
Core

37
Table 14.1: The final list of missense pathogenic variants with high confidence and their PGx information.
Gene CHR POS REF ALT PGx Imp Function AA Change 0/1 1/1 ABCB4 chr14 13543365 C T Extended Transporter p.R1191G 4 0 ABCC10 chr12 11915224 T G Extended Transporter p.A1120S 9 2 ABCC11 chr2 66872504 G A Extended Transporter p.N1099S 3 0 ABCC8 chr21 39963480 C T Extended Transporter p.S1485G 5 4 ACAA2 chr7 79043218 A C Related Unknown p.S189Y 1 0 CRAT chr9 54576878 A G Reltated Unknown p.E388K 1 0 CYP2J2 chr5 49978117 A G Core Phase-I p.A407T 2 0 DHRSX chrX 1190103 T C Extended Phase-I p.A161T 8 3 DLA-DQA chr12 2225877 A G Related Unknown p.V221M 9 0 DLA-DQA chr12 2225964 T C Related Unknown p.L250F 4 18 EPHX1 chr7 38980909 T C Extended Phase-I p.R71H 7 0 FMO3 chr7 27725328 A G Extended Phase-I p.P358S 1 0 FMO6P chr7 27686759 T C Extended Phase-I p.G442R 3 2 MDR1 chr14 13710943 G T Core Transporter p.Q197H 4 0 PML chr30 37265646 T C Related Unknown p.R457W 3 0 RPS6KB1 chr9 34424229 T C Related Unknown p.P448S 5 1 SLC22A1 chr1 49277508 A G Core Transporter p.G218D 11 4 SLC22A1 chr1 49279319 A G Core Transporter p.G308E 5 0 SLC22A10 chr18 53608679 G T Extended Transporter p.S189R 7 3 SLC22A12 chr18 52549442 A G Extended Transporter p.L72F 9 0
Table 14.2: The final list of Stop gain /splice site pathogenic variants with high confidence and their PGx information.
Gene CHR POS REF ALT PGx Imp Function AA Change 0/1 1/1 ALDH3B1 chr18 49807490 G A Extended Phase-I R198* 3 0 ALDH3B1 chr18 49807373 C A Extended Phase-I E237* 2 1 ALDH3B1 chr18 49807860 A T,C Extended Phase-I C74* 3 17 ALDH3B1 chr18 49807979 G A Extended Phase-I Q35* 3 19 AOH2 chr37 9870736 C T Extended Phase-I R518* 2 0 CYP1A2 chr30 37821686 C T Core Phase-I R373* 7 0 CYP3A26 chr6 9797643 C A Extended Phase-I E122* 3 0 DLA-DRB1 chr12 2157139 G C Related Unknown Y119* 1 0 DLA-DRB1 chr12 2157346 G T,C Related Unknown Y50* 9 2 SAA1 chr21 40704199 G T Related Unknown G93* 1 0 SAA1 chr21 40684958 G T Related Unknown G109* 1 0 SLC22A18 chr18 46885448 GG GGGTG Extended Transporter . 0 1 SLC22A18 chr18 46885444 GGG GGGGGG Extended Transporter . 7 14

38
Table 14.3: The final list of frame-shift pathogenic variants with high confidence and their PGx information.
Gene CHR POS REF ALT PGx Imp Function 0/1 1/1
ABCA1 chr11 60809270 TGA T Extended Transporter 1 0
ADH4 chr32 21295994 GTTTTTT GTTTTT Extended Phase-I 3 0
ALDH3B1 chr18 49807377 CTG C Extended Phase-I 1 1
ALDH3B1 chr18 49807371 CT C Extended Phase-I 0 1
ARVCF chr26 29530257 TGGGGGG GGGGTGGGGAGGGGGG
Related Target/Receptor 0 1
CAR chr38 21255656 GGTACGT GGT Extended Modifier 6 1
CEBPB chr24 36633990 CCCCCGGCGGGCCCCGGC
CCCCCGGC Related Unknown 1 0
CYP1A2 chr30 37820110 CAA CA Core Phase-I 3 0
CYP1A2 chr30 37824002 CCCCCATCTAT
CCCCCATCTATCCCCATCTAT
Core Phase-I 4 0
CYP2S1 chr1 112747078 G GGC Extended Phase-I 1 0
CYP4A39 chr15 13668765 TCCC TCC Extended Unknown 7 1
DLA-DQA chr12 2224871 CTGT CT Related Unknown 4 0 DLA-DRB1 chr12 2157296 A AT Related Unknown 3 0
DLA-DRB1 chr12 2157345 GGT GCCACG
T,G Related Unknown 2 1
DLA-DRB1 chr12 2157297 A AG Related Unknown 1 0
FLT4 chr11 1171662 GT G Related Unknown 0 1
FLT4 chr11 1171641 GGGGCGGGCGGG
GGGGCGGG Related Unknown 1 0
METAP1 chr32 21208568 CTTTT CTT Extended Phase-I 12 1
NFKB1 chr32 23948573 TTGTTCTGTT TTGTT Related Unknown 1 0
PML chr30 37215571 C CA Related Unknown 7 1
SLC22A10 chr18 53608677 GCT GT Extended Transporter 8 3
SOD1 chr31 26539786 CTATAT CTAT - Modifier 9 0
TNFRSF8 chr2 84202155 GCAC GCACAC Related Unknown 1 0
UGT2B31 chr13 58949074 C CA Extended Phase-II 2 0

39
The allele frequencies of these pathogenic variants in the 24 samples studied was calculated
as per Hardy Weinberg Equilibrium. The plot in figure 22, depicts the distribution of the
mutations and their zygosity. The detailed information is available in table 15.
Figure 24. Histograms for pathogenic variants with high confidence in the 24 Border collies analyzed representing the frequency of a) allele frequencies b) the number of samples that are carriers for the mutation c) the number of samples that are homozygous for the mutation.
Known and Unknown Mutations 5.7The pathogenic variants with high confidence were accessed across known clinical databases
to verify if any of these were clinically relevant. The only online gene-variant database for
dogs is Online Mendelian Inheritance for Animals (OMIA). To be able to use the information
from human databases, the genomic co-ordinates of certainly pathogenic variants were
converted to its orthologous base in human genome using liftOver. Based on the orthologous
genomic positions of the canine variants, the human databases CliniVar, OMIM and
PharmGKB were accessed for comparison (Figure 23). We found several examples of known
pathogenic change in the dog genes when compared to human PGx gene variants. In this

40
process a few interesting phenotypes reported in and around the same region were identified.
These studies were related to Cytochrome P-450 and the ABC transporters families.
CYP1A2, a member of the Cytochrome P 450 enzymes family is a PGx Core gene and a
Phase-I metabolizing enzyme. The mutation identified as a part of this study, c.1117C>T, has
an entry in OMIA and has been has identified to cause a truncated protein, when in a
homozygous state, resulting in phenotypes of poor or extensive metabolizers in beagle dogs.
In the current study , this mutation is not homozygous, but 7 out of 24 dogs pose to be carriers
for this mutation (Mise, Hashizume, Matsumoto, Terauchi, & Fujii, 2004). Given the
importance of CYP1A2 in the pharmacogenomics, this gene should be screened in additional
Border Collies and other breeds to understand prevalence and to develop strategies to avoid
adverse drug responses in future. CYP2J2 is another PGx Core, Phase –I enzyme, that has a
mutation p.A407T in 2 Border Collies in heterozygous state. In humans a mutation p.N404T
in the same gene has been identified to show significantly reduced metabolism of both
arachidonic acid and linoleic acid in their homozygous state(King et al., 2002). It would be
interesting to screen through other canine WGS data avialble for this mutation and check for
possible phenotype and penetrance.
Among ABC transporters, three genes ABCA1, ABCB1 (MDR1) ,ABCC8 and ABCA1 had
some interesting phenotypes in human. A missense mutation p.Q197H in MDR1 was
identified in this study. In humans, a missense mutation p.G191R in the same protein domain
has been identified and demonstrated to be resistant to many drugs in a set of leukemia
patients, causing an efflux on the drug transport (Yang, Wu, Bui, & Ho, 2008). Therefore, it is
possible that Q197H has clinical implications and should be further studied. MDR1(Multi
Drug Resistant) is a highly sensitive gene towards many drugs both in human and canine. The
well- known MDR1-delta(Δ) mutation, a four base pair deletion, in canine was not observed
in this set of Border collies and has been found rare also in other studies (Katrina L Mealey,
2013). There was also another predicted pathogenic missense mutation p.S1485G in ABCC8
that requires further attention. The ABCC8 is a member of the ATP Binding Cassette,
transporter family. There is a reported mutation in humans in the same protein nucleotide
binding domain 2 (p.R1486K) that is a potential pathogenic mutation in case of patients with
hyperinsulinemic hypoglycemia (HHG), a glucose metabolism disorder (Ohkubo et al.,
2005). Another mutation R1420C, in the same nucleotide binding domain has been identified
to be the cause the same disorder in infants (Tanizawa et al., 2000). Also it was observed

41
from mutdb that any mutation in this domain is highly pathogenic and is related to HHG. In a
similar manner the frame shift mutation in ABCA1 (PGx extended and transporter) at p.I570
occurs in a protein domain that is highly sensitive to high density lipo-protein deficiency
(HDLD) in humans. Mutations at this protein domain halt the release of lipids and cholesterol
from cells causing hindrance to the production of HDL leading to HDLD.
Figure 25. Pathogenic indels and missense variants further classified based on their role in Pharmacogenomics
DAVID Functional Enrichment analysis 5.8 To understand the biological significance behind the variants, functional annotation was
performed for these genes using DAVID. The functional annotation was carried out for the
pathogenic variants of high confidence to look for enriched pathways or protein domains. The
enriched terms with a Benjamini Hochberg (BJ) adjusted pValue threshold less than 0.01
were selected. The details of the enriched pathways and protein domains are listed below in
Table 15.
Table 15. The enriched pathway or mechanisms related to the pathogenic variants of high confidence and the genes involved in respective pathways or mechanisms in pharmacogenetics.
Category Enriched Terms
Genes Involved pValue Adjusted (BJ) pValue
KEGG_PATHWAY ABC transporters ABCA1,ABCB4,ABCC10,ABCC11,ABCC8 1.4E-5 1.3E-3
KEGG_PATHWAY
Metabolism of xenobiotics by cytochrome P450 UGT2B31,ADH4,CYP1A2,CYP2S1,EPHX1 2.5E-5 1.2E-3
0246810121416
ModifierTransporterPhaseI/II
0% 50% 100%
HumanOrthologaaposition
CanineCertainlyPathogenic
Novel dbSNP OMIA clinivar/PharmgKB

42
KEGG_PATHWAY
Drug metabolism - cytochrome P450 UGT2B31,ADH4,CYP1A2,FMO3 5.7E-4 1.9E-2
KEGG_PATHWAY
Retinol metabolism carcinogenesis UGT2B31,ADH4,CYP1A2,CYP2S1 6.5E-4 1.6E-2

43
6. Discussion Although the pharmacogenomic study in humans is quite well annotated and being carried out
at increasing pace, it is still in an early developmental stage in dogs. This project aimed to
build a bioinformatic pipeline for NGS data to identify and classify genetic variation in canine
PGx genes in 24 Border Collies. The orthologues of the ~500 known human PGx genes were
identified and screened for variations in the ORFs. Thousands of variants were identified and
bioinformatic predictions indicate that about 1.3% of these could be harmful with expected
phenotypes at least in the homozygous dogs. These likely pathogenic variants should be
prioritized for experimental functional and clinical validation and for better estimation of the
prevalence in the larger study cohorts within the Border collie and other breeds.
This pilot study establishes not only a useful bioinformatic tool and infrastructure for future
studies but also reveals novel insights into the extent of the likely pathogenic PGx gene
variation in dogs with implication to veterinary medicine. NGS data is rapidly accumulating
in dogs and the approach developed here should greatly facilitate the identification of
candidate variants for subsequent genetic, functional and clinical validations. The pipeline
has been carefully designed by analyzing the results at the end of each phase that includes,
ortholog identification, dna sequencing, variant identification and pathogen prediction, to
ensure precise identification of the desired variants.
Many tools such as eggnog, UCSC Lift over, ensembl, and orthoMCL were reviewed to
identify the canine orthologues. However, according to a few studies, the ensembl compara
api has been evaluated to give best results for vertebrates when compared with other tools
(Altenhoff & Dessimoz, 2009). Although the pseudo-genes identified by the compara API
were not used in the further analysis in this study, they are saved in the in-house database for
possible analyses. Using the ensembl api, 72% of the 27000 human genes have orthologues in
canine genome. The percentage of genes with no orthologues can be related to the excess
predicted genes and their paralog genes in human possibly due to spurious gene prediction
(Lindblad-Toh et al., 2005). Contradictory to this, the human PGx list used in this project has
about 90 % of orthologues in canine. This can be correlated with the study of parallel
evolution between human and dogs (Wang et al., 2013), which states that most of the
positively selected genes between human and canine belong to metabolism and digestion.

44
The pValue from the Chi-square test (0.001) provides additional support to this statement.
From the eValues retrieved for the orthologue peptides, the highest value is ‘9e-21’ (for
CEBPD -an enhancer binding protein), which could still be considered a good eValue. About
75.02 % of the PGx orthologues have an eValue rounded to zero, as can be seen in Figure 15,
suggesting that this percent of genes almost have no chance of the alignment occurring just by
chance. Also from the histogram in Figure 15, depicting the ratio of base pairs in canine and
human orthologue genes, it can be inferred that most of the orthologues have almost same
length of open reading frame. The eValue and the gene length ratio provide additional
confidence to use these human PGx genes as a reference to study canine pharmacogenomics.
It is also interesting to note that genes with one to one orthologue relationship do not have any
psuedogenes. The characterization of psuedogenes is very important, as it is evident from
UGT1A1, a transferase enzyme producing gene, which is also a core PGx gene (Barbarino,
Haidar, Klein, & Altman, n.d.). The human UGT1A1 has only a pseudogene as a canine
orthologue, but the study by Troberg et al., provides details into the UGTs of canine and its
pharmacogenomic relevance. (Troberg et al., 2014). More such studies are essential to
understand the functionalities of the missing orthologues or psuedogenes. There has also been
growing evidence that pseudogenes could be therapeutic targets. This information could be
used to study how the small RNAs produced by pseudogene transcripts are involved with the
regulation of gene expression of their genes (Roberts & Morris, 2013).
The high quality WGS data utilized here was generated by Illumina HiSeq2500 protocols.
The steps followed in the sequencing pipeline are with reference to the GATK Best practices
pipeline, which best suits to Illumina data. A good 99.3 percent of the reads were mapped
after removing the low quality reads, representing a good sequencing library (Illumina Hi
Seq) and alignment (BWA – MEM) combination. Although the percentage of unmapped
reads is small (only 0.6%), and should not affect the storage of further performance much,
they are still removed as well as the 3.39% of duplicate reads to avoid spurious variant calls.
Samtools and GATK were utilized to identify variants in the WGS data. Although both tools
are quite efficient in identifying variants, the combination of the tools helped to identify an
additional 4% of the variants . Use of the combination of the tools has previously proven
beneficial especially with the canine genome (Ahonen, Arumilli, & Lohi, 2013). We observed
an overlap of 96% for SNPs but only 65% for indels between the tools. The haplotype caller
is used to identify the variants with GATK and re-aligning the indels included in the pipeline
ensures the confidence of the accuracy of the indels identified. Although the overall results

45
give an idea that the performance of GATK and Samtools is similar, the 4% difference in the
SNPs can be related to the difference in the Bayesian genotyping method. Also the error
modeling during GATK likelihood calculation, could cause the difference in the genotype
calling from Samtools, especially when the depth is more than hundred folds. The
‘genotypeMerge’ option has been used to take care of the variants with genotype differences
between samtools and GATK, by prioritizing the GATK genotypes. This suggests that use of
combination of tools or algorithms is always a better choice to increase the accuracy and rate
of novel variants identified. The same procedure could also be used with exome sequencing
samples, as this project only intends to look at the open reading frames of the genes. The NGS
pipeline used has been developed in such a way that, the variant files are made available in a
standard VCF 4.0 format, so that they could be used for any other research project if required.
Filtering the variants based on the open reading frame positions was the initial step to use
VCFs from the whole genome samples. This step significantly reduced the storage space as
the interested regions (ORFs of the PGx genes), comprised only about 0.1% of the whole
genome variant file. This change would be quite radical even for an exome variant file, as the
PGx ORFs contribute to only about 1% of the whole canine exome region. This decreases the
computational space and time required for further processing.
SnpEff has been a very useful tool to predict the effect of the variants on the coding
sequences. Based on the type of variation, an impact factor is assigned to it. The impact factor
has been quite useful to further filter the variants. Other than missense SNPs, that are
classified to have moderate impact by SnpEff, high impact variations were selected to proceed
further. Among the high impact variations there were only frame-shift, stop gain or stop lost
mutations. As the project looks at only the open reading frames, it is possible than only these
types of variations occurred. Also information such as name of the gene, change in the amino
acid sequence due to the variation, exon number, name of the transcript, etc., were also
annotated using SnpEff. To be able to differentiate between novel and known variations, the
variants were annotated with variants from canine dbSNP. In this whole process Ensembl
database was used, as the same is being followed throughout, from identifying the
orthologues to predicting the pathogenic variants.
As not all missense variants are pathogenic, they were run using two separate pathogenic
tools, Polyphen2 and SIFT. Although the total number of variants predicted deleterious with a

46
good confidence were quite close, 200 by Polyphen2 and 230 by SIFT, the number of variants
identified commonly by both the tools is only 27, which is only about 7% to 8% of the
individual pathogenic sets. The reason for this is that, both the tools classify them into
different categories of pathogenicity. Polyphen2 classifies them into possibly damaging,
probably damaging and neutral with a Bayesian score. SIFT classifies into predicted
deleterious, tolerated and neutral with different confidence type, high confidence and low
confidence. As only a strict selection criterion was used, the missense variations that were
predicted as absolutely deleterious were selected. This selection criterion suits the PGx study
as mentioned in bioinformatics approach to achieve translation medicine from NGS data
(Figure 3 in the Introduction section). There are also other studies that support the approach
of using a combination of multiple pathogen prediction tools to ensure the confidence of
pathogenicity(Grimm et al., 2015)(Hicks, Wheeler, Plon, & Kimmel, 2011). Although there is
a debate on reliability on pathogen prediction tools, due to possibility of missing true
positives, it is still an efficient method to prioritize the variants for functional validation.
The key challenge in the whole process was validation of the indels using IGV, as the task
demanded more manual work. The accurate detection of indels is still a challenge due to
reasons such as low coverage and presence of repeated sequences. The study by Yue Jiang et
al suggests that the indels reported by different studies on a same population are highly
inconsistent(Jiang, Turinsky, & Brudno, 2015). Such studies also support the necessity of
more accurate indel detection tool and high throughput data with better quality. The other
interesting set of variants was the presence of homozygous variants in all the samples. These
variants could be either specific to the reference genome Boxer or the Border Collies.
Analyzing the same variants in exomes or whole genomes of other breeds could give a better
insight. However as this scenario has appeared only in indels (frame shift) it would be
appropriate to re-call the indels using different parameters before drawing conclusions. These
facts suggest that there is still a lot of scope for better indel calling algorithms.
The certainly pathogenic variants contribute to about 6% of variant set studied for
pathogenicity. Figure 23 (in the Results section) clearly depicts the portion of likely, unlikely
and pathogenic with high confidence variants. While the small portion of final variants
depicts the confidence in the pathogenic variants, the 25% of likely pathogenic variants (low-
confidence) is the result of difference in pathogen prediction algorithms. This also depicts the
47
need for a universal prediction algorithm that can detect pathogenic variants with more
accuracy.
Recent studies have suggested that many genetic variants that are pathogenic are common in
asymptomatic individuals (Cassa, Tong, & Jordan, 2013). The study of functional variants in
human PGx genes by Nelson R.et al, depicts that there is an abundance in the number of
deleterious rare variants that have a functional impact on drug metabolism. This pattern of
distribution highlights the necessity to analyze the allele frequency of PGx mutations in a
population (Nelson et al., 2012). In most of the cases the adverse reaction to drugs is caused
by homozygous mutations. In addition to being carriers, heterozygous mutations can
sometimes cause adverse reaction with reduced intensity. For example in the analysis of
human CYP genes van der weide et al, categorized the mutations into poor, intermediate and
extensive metabolizers based on the genotype of the mutations (van der Weide & Hinrichs,
2006). Hence understanding of the distribution of allele frequencies and zygosity is quite
essential. From the figure 22.a, it can be seen that in the Border collie population studied a
huge proportion of the pathogenic variants are rare and specific to samples. It can also be
inferred from the figure 22.b,c that the proportion of the heterozygote mutations are more
when compared to homozygous mutations. The outlier in the histogram represent variants
from DLA-DQA1 and DLA-DRB1 which is are highly polymorphic genes (Kennedy et al.,
2000). From the David functional enrichment analysis, it can be seen that the enriched
pathways are transporters and metabolism related. Previous interest has also targeted
transporters (Katrina L Mealey, 2013) and metabolizing enzymes (Court, 2013). As the
canine genome has possibilities for new assembly and annotation in future, updating the
annotation table and re-running that last step of the table is sufficient to keep the analyzed and
new data updated. Also the different phases of the pipeline are independent of the other and
hence can be upgraded or optimized easily whenever there is possibility.
48
7. Conclusion and future prospects The increase in the need to understand personalized medicine, due to ineffective or toxic
responses of a group of individuals to certain drugs, has led to tremendous increase in the
study of pharmacogenomics in the past four to five years. This project aimed at
accomplishing the first two stages of the ‘bioinformatics approach to achieve personalized
medicine’ that are, processing of large-scale genomic data and functional interpretation of the
effect and impact of the genomic variation. Identification of the pathogenic variants can be
further validated and analyzed for possibility of being a potential biomarker. The output could
be further integrated with other biological data, such as proteomic and metabolomics data,
using systems biology approaches to achieve translational or personalized medicine.
This study had practical and scientific implications. We established a powerful bioinformatic
infrastructure that allows systematic study of NGS data for PGx variation in future. A precise
set of PGx genes was gathered and respective canine orthologs were identified. After detailed
analysis, the canine PGx set was included in the analysis. The PGx gene set was also
annotated with labels, based on the gene’s role and importance in drug processing. A standard
pipeline was established using the state of the art techniques to perform the NGS analysis.
The pipeline was designed in such a way, that it could process, either WGS or WES data.
The final output of the data included a set of pathogenic variants that were predicted to have
pharmacogenomic implications in the population studied. The framework also produced a
report on the frequency, pathway analysis and allele zygosity of the pathogenic variants. The
pipeline is designed in an object or module oriented design. As a result, each module is
independent of each other and any future changes for optimization would be easy and would
not affect the other modules.
This mode of analysis could be highly useful to study the clinical impact, since we already
discovered several putative functional variants, in the small pilot of 24 samples. Ongoing
analyses in about 500 samples, following a genotype to phenotype pattern of research, should
reveal many new candidate variants, especially in the core PGx genes. It would also establish
a large study of functional and clinical pharmacogenomics in dogs, contributing to
translational and personalized medicine.

49
8. References Adzhubei, I., Jordan, D. M., & Sunyaev, S. R. (2013). Predicting functional effect of human missense mutations using PolyPhen-2. Current Protocols in Human Genetics. doi:10.1002/0471142905.hg0720s76
Ahonen, S. J., Arumilli, M., & Lohi, H. (2013). A CNGB1 Frameshift Mutation in Papillon and Phalène Dogs with Progressive Retinal Atrophy. PLoS ONE, 8. doi:10.1371/journal.pone.0072122
Altenhoff, A. M., & Dessimoz, C. (2009). Phylogenetic and functional assessment of orthologs inference projects and methods. PLoS Computational Biology, 5. doi:10.1371/journal.pcbi.1000262
Bai, B., Zhao, W. M., Tang, B. X., Wang, Y. Q., Wang, L., Zhang, Z., … Zhang, Y. P. (2015). DoGSD: The dog and Wolf genome SNP database. Nucleic Acids Research, 43, D777–D783. doi:10.1093/nar/gku1174
Barbarino, J. M., Haidar, C. E., Klein, T. E., & Altman, R. B. (n.d.). PharmGKB summary: very important pharmacogene information for UGT1A1. doi:10.1097/FPC.0000000000000024
Blankenberg, D., Gordon, A., Von Kuster, G., Coraor, N., Taylor, J., Nekrutenko, A., & Team, G. (2010). Manipulation of FASTQ data with galaxy. Bioinformatics, 26, 1783–1785. doi:10.1093/bioinformatics/btq281
Cassa, C. A., Tong, M. Y., & Jordan, D. M. (2013). Large numbers of genetic variants considered to be pathogenic are common in asymptomatic individuals. Human Mutation, 34, 1216–1220. doi:10.1002/humu.22375
Chan, I. S., & Ginsburg, G. S. (2011). Personalized medicine: progress and promise. Annu Rev Genomics Hum Genet, 12, 217–44. doi:10.1146/annurev-genom-082410-101446
Cingolani, P., Platts, A., Wang, L. L., Coon, M., Nguyen, T., Wang, L., … Ruden, D. M. (2012). A program for annotating and predicting the effects of single nucleotide polymorphisms, SnpEff: SNPs in the genome of Drosophila melanogaster strain w 1118; iso-2; iso-3. Fly, 6, 80–92. doi:10.4161/fly.19695
Cordero, P., & Ashley, E. a. (2012). Whole-genome sequencing in personalized therapeutics. Clinical Pharmacology and Therapeutics, 91, 1001–9. doi:10.1038/clpt.2012.51
Court, M. H. (2013). Canine Cytochrome P-450 Pharmacogenetics. Veterinary Clinics of North America - Small Animal Practice. doi:10.1016/j.cvsm.2013.05.001
DePristo, M. A., Banks, E., Poplin, R., Garimella, K. V, Maguire, J. R., Hartl, C., … Daly, M. J. (2011). A framework for variation discovery and genotyping using next-generation DNA sequencing data. Nature Genetics, 43, 491–8. doi:10.1038/ng.806
Doolittle, W. F. (1999). Phylogenetic classification and the universal tree. Science (New York, N.Y.), 284, 2124–2129. doi:10.1126/science.284.5423.2124

50
Ebbert, M. T. W., Wadsworth, M. E., Staley, L. A., Hoyt, K. L., Pickett, B., Miller, J., … Shyr, Y. (2016). Evaluating the necessity of PCR duplicate removal from next-generation sequencing data and a comparison of approaches. BMC Bioinformatics, 17, 239. doi:10.1186/s12859-016-1097-3
Fernald, G. H., Capriotti, E., Daneshjou, R., Karczewski, K. J., & Altman, R. B. (2011a). Bioinformatics challenges for personalized medicine. Bioinformatics. doi:10.1093/bioinformatics/btr295
Fernald, G. H., Capriotti, E., Daneshjou, R., Karczewski, K. J., & Altman, R. B. (2011b). Bioinformatics challenges for personalized medicine. Bioinformatics, 27, 1741–1748. doi:10.1093/bioinformatics/btr295
Fleischer, S., Sharkey, M., Mealey, K., Ostrander, E. A., & Martinez, M. (2008). Pharmacogenetic and metabolic differences between dog breeds: Their impact on canine medicine and the use of the dog as a preclinical animal model. AAPS Journal, 10, 110–119. doi:10.1208/s12248-008-9011-1
Frank, R., & Hargreaves, R. (2003). Clinical biomarkers in drug discovery and development. Nature Reviews. Drug Discovery, 2, 566–80. doi:10.1038/nrd1130
Gaedigk, A., Sangkuhl, K., Whirl-Carrillo, M., Klein, T., & Leeder, J. S. (2016). Prediction of CYP2D6 phenotype from genotype across world populations. Genetics in Medicine : Official Journal of the American College of Medical Genetics. doi:10.1038/gim.2016.80
Garc??a-Alcalde, F., Okonechnikov, K., Carbonell, J., Cruz, L. M., G??tz, S., Tarazona, S., … Conesa, A. (2012). Qualimap: Evaluating next-generation sequencing alignment data. Bioinformatics, 28, 2678–2679. doi:10.1093/bioinformatics/bts503
Ginsburg, G. S., & Willard, H. F. (2009). Genomic and personalized medicine: foundations and applications. Translational Research. doi:10.1016/j.trsl.2009.09.005
Gouin, a., Legeai, F., Nouhaud, P., Whibley, a., Simon, J.-C., & Lemaitre, C. (2014). Whole-genome re-sequencing of non-model organisms: lessons from unmapped reads. Heredity, 114, 494–501. doi:10.1038/hdy.2014.85
Grimm, D. G., Azencott, C.-A., Aicheler, F., Gieraths, U., MacArthur, D. G., Samocha, K. E., … Borgwardt, K. M. (2015). The evaluation of tools used to predict the impact of missense variants is hindered by two types of circularity. Human Mutation, 36(5), 513–23. doi:10.1002/humu.22768
Haller, S., Schuler, F., Lazic, S. E., Bachir-Cherif, D., Krämer, S. D., Parrott, N. J., … Belli, S. (2012). Expression Profiles of Metabolic Enzymes and Drug Transporters in the Liver and along the Intestine of Beagle Dogs. Drug Metabolism and Disposition, 40, 1603–1611. doi:10.1124/dmd.112.045443
Hicks, S., Wheeler, D. A., Plon, S. E., & Kimmel, M. (2011). Prediction of missense mutation functionality depends on both the algorithm and sequence alignment employed. Human Mutation, 32, 661–668. doi:10.1002/humu.21490

51
International Warfarin Pharmacogenetics Consortium, Klein, T. E., Altman, R. B., Eriksson, N., Gage, B. F., Kimmel, S. E., … Johnson, J. A. (2009). Estimation of the warfarin dose with clinical and pharmacogenetic data. The New England Journal of Medicine, 360, 753–64. doi:10.1056/NEJMoa0809329
Jiang, Y., Turinsky, A. L., & Brudno, M. (2015). The missing indels: An estimate of indel variation in a human genome and analysis of factors that impede detection. Nucleic Acids Research, 43, 7217–7228. doi:10.1093/nar/gkv677
Johnson, J. A. (2003). Pharmacogenetics: Potential for individualized drug therapy through genetics. Trends in Genetics. doi:10.1016/j.tig.2003.09.008
Kennedy, L. J., Altet, L., Angles, J. M., Barnes, A., Carter, S. D., Francino, O., … Wagner, J. L. (2000). Nomenclature for factors of the Dog Major Histocompatibility System (DLA), 1998: First report of the ISAG DLA Nomenclature Committee. Animal Genetics, 31, 52–61. doi:10.1046/j.1365-2052.2000.00492.x
King, L. M., Ma, J., Srettabunjong, S., Graves, J., Bradbury, J. A., Li, L., … Zeldin, D. C. (2002). Cloning of CYP2J2 gene and identification of functional polymorphisms. Molecular Pharmacology, 61, 840–52. Retrieved from http://www.ncbi.nlm.nih.gov/pubmed/11901223
Kwon, S., Park, S., Lee, B., & Yoon, S. (2013). In-depth analysis of interrelation between quality scores and real errors in Illumina reads. In Proceedings of the Annual International Conference of the IEEE Engineering in Medicine and Biology Society, EMBS (pp. 635–638). doi:10.1109/EMBC.2013.6609580
Li, H. (2011). A statistical framework for SNP calling, mutation discovery, association mapping and population genetical parameter estimation from sequencing data. Bioinformatics, 27, 2987–2993. doi:10.1093/bioinformatics/btr509
Li, H., Handsaker, B., Wysoker, A., Fennell, T., Ruan, J., Homer, N., … Durbin, R. (2009). The Sequence Alignment/Map format and SAMtools. Bioinformatics, 25, 2078–2079. doi:10.1093/bioinformatics/btp352
Li, W., Yang, W., & Wang, X.-J. (2013). Pseudogenes: Pseudo or Real Functional Elements? Journal of Genetics and Genomics, 40, 171–177. doi:10.1016/j.jgg.2013.03.003
Lindblad-Toh, K., Wade, C. M., Mikkelsen, T. S., Karlsson, E. K., Jaffe, D. B., Kamal, M., … Lander, E. S. (2005). Genome sequence, comparative analysis and haplotype structure of the domestic dog. Nature, 438, 803–819. doi:10.1038/nature04338
Mealey, K. L. (2006). Pharmacogenetics. The Veterinary Clinics of North America. Small Animal Practice, 36, 961–73, v. doi:10.1016/j.cvsm.2006.05.006
Mealey, K. L. (2013). Adverse drug reactions in veterinary patients associated with drug transporters. The Veterinary Clinics of North America. Small Animal Practice, 43, 1067–78. doi:10.1016/j.cvsm.2013.04.004

52
Mealey, K. L., Bentjen, S. a, Gay, J. M., & Cantor, G. H. (2001). Ivermectin sensitivity in collies is associated with a deletion mutation of the mdr1 gene. Pharmacogenetics, 11, 727–733. doi:10.1097/00008571-200111000-00012
Mealey, K. L., Fidel, J., Gay, J. M., Impellizeri, J. A., Clifford, C. A., & Bergman, P. J. (2008). ABCB1-1?? polymorphism can predict hematologic toxicity in dogs treated with vincristine. Journal of Veterinary Internal Medicine, 22, 996–1000. doi:10.1111/j.1939-1676.2008.0122.x
Messing, J., & Llaca, V. (1998). Importance of anchor genomes for any plant genome project. Proceedings of the National Academy of Sciences of the United States of America, 95, 2017–2020. doi:10.1073/pnas.95.5.2017
Mise, M., Hashizume, T., Matsumoto, S., Terauchi, Y., & Fujii, T. (2004). Identification of non-functional allelic variant of CYP1A2 in dogs. Pharmacogenetics, 14, 769–773. doi:10.1097/00008571-200411000-00008
Mosher, C. M., & Court, M. H. (2010). Comparative and veterinary pharmacogenomics. Handbook of Experimental Pharmacology, 199, 49–77. doi:10.1007/978-3-642-10324-7
Nelson, M. R., Wegmann, D., Ehm, M. G., Kessner, D., St. Jean, P., Verzilli, C., … Mooser, V. (2012). An Abundance of Rare Functional Variants in 202 Drug Target Genes Sequenced in 14,002 People. Science, 337, 100–104. doi:10.1126/science.1217876
Ng, P. C., & Henikoff, S. (2001). Predicting deleterious amino acid substitutions. Genome Research, 11, 863–874. doi:10.1101/gr.176601
Ng, P. C., & Henikoff, S. (2006). Predicting the effects of amino acid substitutions on protein function. Annual Review of Genomics and Human Genetics, 7, 61–80. doi:10.1146/annurev.genom.7.080505.115630
Nielsen, R., Paul, J. S., Albrechtsen, A., & Song, Y. S. (2011). Genotype and SNP calling from next-generation sequencing data. Nature Reviews. Genetics, 12, 443–451. doi:10.1038/nrg2986
Ohkubo, K., Nagashima, M., Naito, Y., Taguchi, T., Suita, S., Okamoto, N., … Ono, J. (2005). Genotypes of the pancreatic beta-cell K-ATP channel and clinical phenotypes of Japanese patients with persistent hyperinsulinaemic hypoglycaemia of infancy. Clinical Endocrinology, 62, 458–65. doi:10.1111/j.1365-2265.2005.02242.x
Ozawa, N., Shimizu, T., Morita, R., Yokono, Y., Ochiai, T., Munesada, K., … Sugiyama, Y. (2004). Transporter database, TP-search: A web-accessible comprehensive database for research in pharmacokinetics of drugs. Pharmaceutical Research. doi:10.1023/B:PHAM.0000048207.11160.d0
Ranieri, G., Gadaleta, C. D., Patruno, R., Zizzo, N., Daidone, M. G., Hansson, M. G., … Ribatti, D. (2013). A model of study for human cancer: Spontaneous occurring tumors in dogs. Biological features and translation for new anticancer therapies. Critical Reviews in Oncology/Hematology. doi:10.1016/j.critrevonc.2013.03.005

53
Relling, M. (2015). Clinical implementation of pharmacogenetics: CPIC guidelines. Clinical Chemistry and Laboratory Medicine, 53, S75. Retrieved from http://ovidsp.ovid.com/ovidweb.cgi?T=JS&PAGE=reference&D=emed13&NEWS=N&AN=71910363
Roberts, T. C., & Morris, K. V. (2013). Not so pseudo anymore: pseudogenes as therapeutic targets. Pharmacogenomics, 14, 2023–34. doi:10.2217/pgs.13.172
Rodriguez-Antona, C. (2015). The role of pharmacogenetics and pharmacogenomics in 21st-century medicine: state of the art and new challenges discussed in the VII Conference of the Spanish. Drug Metabolism and Personalized Therapy, 15–16. doi:10.1515/dmpt-2015-0033
Salavaggione, O., & Kidd, L. (2002). Canine red blood cell thiopurine S-methyltransferase: companion animal pharmacogenetics. Pharmacogenetics, 12, 713–724. doi:10.1124/jpet.103.059055.provide
Seppälä, E. H., Jokinen, T. S., Fukata, M., Fukata, Y., Webster, M. T., Karlsson, E. K., … Lohi, H. (2011). Lgi2 truncation causes a remitting focal epilepsy in dogs. PLoS Genetics, 7. doi:10.1371/journal.pgen.1002194
Shendure, J., & Ji, H. (2008). Next-generation DNA sequencing. Nat Biotechnol, 26, 1135–1145. doi:10.1038/nbt1486
Shin, J., Kayser, S. R., & Langaee, T. Y. (2009). Pharmacogenetics: From discovery to patient care. American Journal of Health-System Pharmacy. doi:10.2146/ajhp080170
Sim, E., Fakis, G., Laurieri, N., & Boukouvala, S. (2012). Arylamine N-acetyltransferases--from drug metabolism and pharmacogenetics to identification of novel targets for pharmacological intervention. Adv Pharmacol, 63, 169–205. doi:10.1016/B978-0-12-398339-8.00005-7
Sim, S. C., Altman, R. B., & Ingelman-Sundberg, M. (2011). Databases in the area of pharmacogenetics. Human Mutation. doi:10.1002/humu.21454
Sim, S. C., & Ingelman-Sundberg, M. (2013). Update on allele nomenclature for human cytochromes P450 and the Human Cytochrome P450 Allele (CYP-allele) Nomenclature Database. Methods in Molecular Biology (Clifton, N.J.), 987, 251–259. doi:10.1007/978-1-62703-321-3_21
Sims, D., Sudbery, I., Ilott, N. E., Heger, A., & Ponting, C. P. (2014). Sequencing depth and coverage: key considerations in genomic analyses. Nature Reviews Genetics, 15, 121–32. doi:10.1038/nrg3642
Studer, R. A., & Robinson-Rechavi, M. (2009). How confident can we be that orthologs are similar, but paralogs differ? Trends in Genetics, 25, 210–216. doi:10.1016/j.tig.2009.03.004
Tanizawa, Y., Matsuda, K., Matsuo, M., Ohta, Y., Ochi, N., Adachi, M., … Oka, Y. (2000). Genetic analysis of Japanese patients with persistent hyperinsulinemic hypoglycemia of

54
infancy: Nucleotide-binding fold-2 mutation impairs cooperative binding of adenine nucleotides to sulfonylurea receptor 1. Diabetes, 49, 114–120.
The Cost of Sequencing a Human Genome. (n.d.). Retrieved from https://www.genome.gov/27565109/the-cost-of-sequencing-a-human-genome/
Thorn, C. F., Klein, T. E., & Altman, R. B. (2005). PharmGKB: the pharmacogenetics and pharmacogenomics knowledge base. In Methods in molecular biology (Vol. 311, pp. 179–191). doi:10.1038/sj.tpj.6500230
Thorn, C. F., Klein, T. E., & Altman, R. B. (2010). Pharmacogenomics and bioinformatics: PharmGKB. Pharmacogenomics, 11, 501–505. doi:10.2217/pgs.10.15
Tin, M. M. Y., Rheindt, F. E., Cros, E., & Mikheyev, A. S. (2014). Degenerate adaptor sequences for detecting PCR duplicates in reduced representation sequencing data improve genotype calling accuracy. Molecular Ecology Resources, 15, 329–36. doi:10.1111/1755-0998.12314
Troberg, J., Jarvinen, E., Muniz, M., Sneitz, N., Mosorin, J., Hagstrom, M., & Finel, M. (2014). The Dog UGT Enzymes of Subfamily 1a; Cloning, Expression and Activity. Drug Metabolism and Disposition: The Biological Fate of Chemicals, dmd.114.059303–. doi:10.1124/dmd.114.059303
Van der Weide, J., & Hinrichs, J. W. J. (2006). The influence of cytochrome P450 pharmacogenetics on disposition of common antidepressant and antipsychotic medications. The Clinical Biochemist. Reviews / Australian Association of Clinical Biochemists, 27, 17–25. Retrieved from http://www.ncbi.nlm.nih.gov/pubmed/16886044\nhttp://www.pubmedcentral.nih.gov/articlerender.fcgi?artid=PMC1390790
Vilella, A. J., Severin, J., Ureta-Vidal, A., Heng, L., Durbin, R., & Birney, E. (2009). EnsemblCompara GeneTrees: Complete, duplication-aware phylogenetic trees in vertebrates. Genome Research, 19, 327–335. doi:10.1101/gr.073585.107
Wang, G. D., Zhai, W., Yang, H. C., Fan, R. X., Cao, X., Zhong, L., … Zhang, Y. P. (2013). The genomics of selection in dogs and the parallel evolution between dogs and humans. Nat Commun, 4, 1860. doi:10.1038/ncomms2814
Waterston, R. H., Lindblad-Toh, K., Birney, E., Rogers, J., Abril, J. F., Agarwal, P., … Lander, E. S. (2002). Initial sequencing and comparative analysis of the mouse genome. Nature, 420, 520–562. doi:10.1038/nature01262\rnature01262 [pii]
Yang, Z., Wu, D., Bui, T., & Ho, R. J. Y. (2008). A novel human multidrug resistance gene MDR1 variant G571A (G191R) modulates cancer drug resistance and efflux transport. The Journal of Pharmacology and Experimental Therapeutics, 327, 474–481. doi:jpet.108.138313 [pii]\r10.1124/jpet.108.138313
Yu, X., & Sun, S. (2013). Comparing a few SNP calling algorithms using low-coverage sequencing data. BMC Bioinformatics, 14, 274. doi:10.1186/1471-2105-14-274

55
Zhou, Y., Gottesman, M., & Pastan, I. (1999). Studies of human MDR1-MDR2 chimeras demonstrate the functional exchangeability of a major transmembrane segment of the multidrug transporter and phosphatidylcholine flippase. Molecular and Cellular Biology, 19, 1450–1459. Retrieved from /Users/Maria/Dropbox/Posgrado/pappers/Library/pdf0/2765.pdf

i
9. Appendix File Formats 9.1
9.1.1 Fastq The Fastq Files contain two types of lines. One has the read identifier that starts with the
symbol ‘>’ and the next succeeding line is the nucleotide (or amino acid if it is a protein fasta
file) sequence of the particular read (or transcript for protein fasta). Once the sequence is
completed the next line again starts with the identifier of the next sequence and it goes on so.
As mentioned the sequence identifier starts ‘>’ and is immediately followed by the name or id
of the sequence. The id or name could be a combination of information. In the example
below, it can be seen that the identifier starts with ‘>’ and is followed by gene name, ensembl
gene id, transcript id and protein name separated by ‘:’. The second line depicts the
nucleotide sequence.
>ACBA1:ENSCAFG00000002727:ENSCAFT00000004346:ABCA1 TTAATGACCAGCCACGGCGGCCGCCTCCACGGGCCCCCGAGCCACACGCACGGTGCTGGCGCCGCCCGCTGAGCCGACATGGCCTCCTGGCCTCAGCTGCGCCTGCTGCTGTGGAAGAACCTCACCTTCAGAAGAAGGCAGACCTGTCAGCTGTTGCTGGAAGTGGCCTGGCCTCTGTTTATCTTCCTGATCCTGATCTCCGTGCGGCTGAGCTACCCGCCCTATGAGCAACATGAGTGCCACTTTCCAAACAAAGCCATGCCCTCTGCAGGAACGCTTCCTTGGATTCAGGGGATTATCTGTAATGCCAATAACCCCTGCTTCCGCTATCCGACTCCTGGTGAGGCCCCTGGGGTGGTTGGAAACTTTAACAAATCCATTGTGTCTCGCCTGTTCTCAGATGCTCAGCGGCTCCTTTTA
9.1.2 BAM Binary Alignment Map or BAM file is a binary form of sequence alignment data. HISEQ:16:D24BTACXX:6:2301:1341:71647 163 chr1 112734887 60 101M = 112735185 399 TCAGTCAGTGGAGCGTGCACTCTTGATCTCGGGGTGGGGTGGGGGTGTTTGAGTTTGAGCCCCACGTTGGGTGGAAAGAGGACTTAGAAACAAAAGCTTAA =>:>===>=>===<4;<;<;<<<<<<<<<<4;;;/9;<<.69;;;6799<;::9:<=:<:;<<<<5:==<<:9;;<<;2:;<;=???>??>>??>==>==? MC:Z:101M BD:Z:EEHHKKJJIGIGDIEGFGHDGDDDFGFFDDCDBBEEGBBEEGBBBEEEE?FGCHF@GHDIFDDGEFGFGHCFFHGF@EDDGHHIFEIEGBHHJCCIMHEDE MD:Z:101 BI:Z:FFHHHGHHGEGGEGEFEEHDGDECEGFEEDCEDDEEGDDEEGDDDEEFEAEGEFEBFHFHGEEHEGGFFHEFFHHGBFGGHIFIEGIHIDHJKFFJMIDFF NM:i:0 MQ:i:60 AS:i:101 XS:i:0 RG:Z:BC223-5B5E6E0A
9.1.3 VCF Variant Call Format (VCF) is a tab-separated file that has details of the NGS variants. The
VCF file was initially created by the 1000 genomes. It starts with a meta-information line,
header and then followed by data. The meta-information lines starts with ‘##’ and each line
contains details of the file such as format or information of the header, such as, Chromosome
(CHROM), position (POS), Reference (REF), etc. The fields of the VCF files are mentioned
here below

ii
CHROM Chromosome Number
POS Position of the variant
ID Variant ID eg/- BICF2S2345117
REF The reference nucleotide at the given chromosome position
ALT The alternate nucleotide/variant in the sample at the same position
QUAL Quality of the read at the chromosomal position
FILTER Denotes if the position has passed all the filters
INFO Denotes other information such as Allele frequency, allele count, depth, sample genotype etc. Also the annotation is included in this column.
9.1.4 Bed File A bed file is a tab-delimited file with information about a genomic region. There are three
mandatory regions in a bed file, chromosome name, region start and region end. There are
nine other optional fields such as name, strand etc., and providing information about the
genomic region in the mandatory field. The below is an example of a basic bed file used in
this project.
>CYP1A2.bed chr30 37819355 37820173 chr30 37820699 37820819 chr30 37821253 37821342 chr30 37821600 37821723 chr30 37822620 37822706 chr30 37823781 37824078
9.1.5 Polyphen 2 Input The input is a tab-delimited text with protein name, position of the alteration, reference and
alternate amino acids. The alternate amino acid is the substitution for the reference amino acid
due to the variation. The protein identifier can be protein name, Uniprot or ensembl or Ref
Seq name. In this case the ensembl protein identifier is retrieved from translation
adaptor(ensembl perl api) using transcript id, which in turn can be obtained from vcf file
using the SnpSift ‘extractFields’ utility in SnpEff tool.
Protein Identifier Position in Sequence
Amino Acids Ref Amino Acids Alt
ENSCAFP00000001840 22 R P
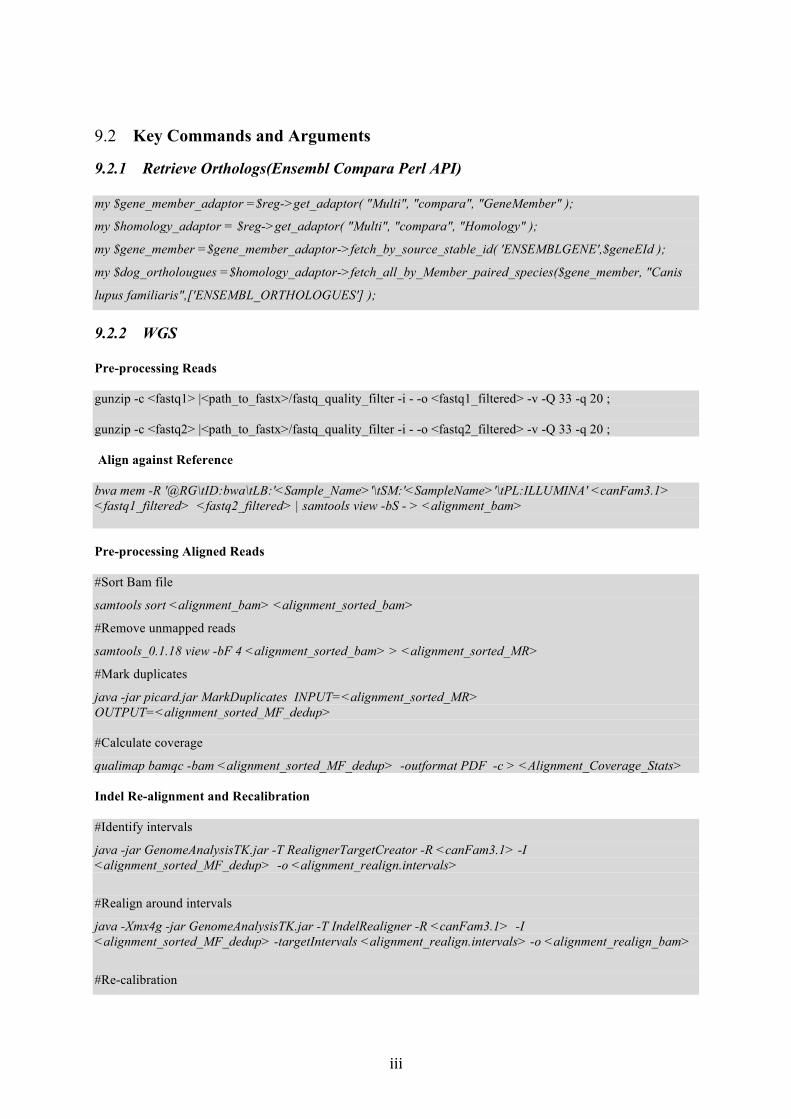
iii
Key Commands and Arguments 9.2
9.2.1 Retrieve Orthologs(Ensembl Compara Perl API) my $gene_member_adaptor =$reg->get_adaptor( "Multi", "compara", "GeneMember" );
my $homology_adaptor = $reg->get_adaptor( "Multi", "compara", "Homology" );
my $gene_member =$gene_member_adaptor->fetch_by_source_stable_id( 'ENSEMBLGENE',$geneEId );
my $dog_ortholougues =$homology_adaptor->fetch_all_by_Member_paired_species($gene_member, "Canis
lupus familiaris",['ENSEMBL_ORTHOLOGUES'] );
9.2.2 WGS Pre-processing Reads gunzip -c <fastq1> |<path_to_fastx>/fastq_quality_filter -i - -o <fastq1_filtered> -v -Q 33 -q 20 ; gunzip -c <fastq2> |<path_to_fastx>/fastq_quality_filter -i - -o <fastq2_filtered> -v -Q 33 -q 20 ; Align against Reference bwa mem -R '@RG\tID:bwa\tLB:'<Sample_Name>'\tSM:'<SampleName>'\tPL:ILLUMINA' <canFam3.1> <fastq1_filtered> <fastq2_filtered> | samtools view -bS - > <alignment_bam> Pre-processing Aligned Reads #Sort Bam file
samtools sort <alignment_bam> <alignment_sorted_bam>
#Remove unmapped reads
samtools_0.1.18 view -bF 4 <alignment_sorted_bam> > <alignment_sorted_MR>
#Mark duplicates
java -jar picard.jar MarkDuplicates INPUT=<alignment_sorted_MR> OUTPUT=<alignment_sorted_MF_dedup> #Calculate coverage
qualimap bamqc -bam <alignment_sorted_MF_dedup> -outformat PDF -c > <Alignment_Coverage_Stats> Indel Re-alignment and Recalibration #Identify intervals
java -jar GenomeAnalysisTK.jar -T RealignerTargetCreator -R <canFam3.1> -I <alignment_sorted_MF_dedup> -o <alignment_realign.intervals>
#Realign around intervals
java -Xmx4g -jar GenomeAnalysisTK.jar -T IndelRealigner -R <canFam3.1> -I <alignment_sorted_MF_dedup> -targetIntervals <alignment_realign.intervals> -o <alignment_realign_bam>
#Re-calibration

iv
java -Xmx4g -jar GenomeAnalysisTK.jar -T BaseRecalibrator -R <canFam3.1> -knownSites <dogGSD.vcf> -I <alignment_realign_bam> -o <alignment_realign_recal> java -Xmx4g -jarGenomeAnalysisTK.jar -T PrintReads -R <canFam3.1> -I <alignment_realign_bam> -BQSR <alignment_realign_recal> -o <alignment_recalibrated.bam> Identify Variants with GATK #GATK variants identification
java -jar GenomeAnalysisTK.jar -R <canFam3.1> -T HaplotypeCaller -I <alignment_recalibrated.bam> -stand_emit_conf 10 -stand_call_conf 30 --genotyping_mode DISCOVERY -o <GATK.vcf> #Filter with depth and remove others
java -jar GenomeAnalysisTK.jar -R <canFam3.1> -T VariantFiltration --variant <GatkSNP_raw.vcf> --filterExpression 'QD < 2.0' --filterName QD --filterExpression 'MQ < 40.0' --filterName MQ --filterExpression 'DP < 10' --filterName DP -o <Gatk_filt.vcf> java -jar GenomeAnalysisTK.jar -R <canFam3.1> -T SelectVariants --variant - --excludeFiltered -o <Gatkfilt_Sel.vcf> Identify Variants with Samtools samtools_0.1.18 mpileup -ABugf <canFam3.1> -d 1000000 <alignment_recalibrated.bam> | bcftools view -vcg - | bcfTools/vcfutils.pl varFilter -D 1000000 > <Sam.vcf>
##Filter SNPS
bcftools/vcfutils.pl varFilter -Q 40 -d 10 <Sam.vcf> | awk '$6>=40' > <Sam_filt.vcf>
Combine both GATK and Samtools java -jar GenomeAnalysisTK.jar -T CombineVariants -R <canFam3.1> --variant:Gatk <Gatkfilt_Sel.vcf> --variant:Sam <Sam_filt.vcf> -genotypeMergeOptions PRIORITIZE -priority Gatk,Sam --filteredrecordsmergetype KEEP_UNCONDITIONAL -o <Snp_Indel_Filt.vcf> Annotate with SnpEff java -Xmx4G -jar snpEff.jar eff -c snpEff.config -v CanFam3Broad <Snp_Indel_Filt.vcf> > $<Snp_Indel_Filt_snpEff.vcf>
9.2.3 Pathogen Prediction Filter PGx variants and select Mis-sense, Frame-shift, Stop-gain/lost, Splice region java -Xmx2g -jar <GenomeAnalysisTK.jar> -R <canFam3.1> -T SelectVariants <Snp_Indel_Filt_snpEff.vcf> --variant -o <Snp_Indel_Filt_snpEff_PGx.vcf> -L PGx_ORF_Genes.bed cat <Snp_Indel_Filt_snpEff_PGx.vcf> | snpEff/scripts/vcfEffOnePerLine.pl |java -jar <SnpSift.jar> filter "( EFF[*].EFFECT = 'frameshift_variant' )" - > <PGx_ORF_FS.vcf>
cat <Snp_Indel_Filt_snpEff_PGx.vcf> | snpEff/scripts/vcfEffOnePerLine.pl |java -jar <SnpSift.jar> filter "( EFF[*].EFFECT != 'frameshift_variant') & (EFF[*].IMPACT = 'HIGH')" - > <PGx_ORF_HIGH.vcf>
cat <Snp_Indel_Filt_snpEff_PGx.vcf> |snpEff/scripts/vcfEffOnePerLine.pl |java -jar <SnpSift.jar> filter "( EFF[*].EFFECT ='missense_variant')" - > <PGx_ORF_NS.vcf>

v
Tables 9.3 Table 1. The PGx annotation table for all Canine human orthologues
Human Gene Importance Type Canine Gene Mapping
ABCA1 Transporter Extended ABCA1 One2one
ABCA4 Transporter Extended ABCA4 One2one
ABCB1 Transporter Core MDR1 One2one
ABCB11 Transporter Extended ABCB11 One2one
ABCB4 Transporter Extended ABCB4 One2one
ABCB5 Transporter Extended ABCB5 One2one
ABCB6 Transporter Extended ABCB6 One2one
ABCB7 Transporter Extended ABCB7 One2one
ABCB8 Transporter Extended ABCB8 One2one
ABCC1 Transporter Extended MRP1 One2one
ABCC10 Transporter Extended ABCC10 One2one
ABCC11 Transporter Extended ABCC11 One2one
ABCC12 Transporter Extended ABCC12 One2one
ABCC2 Transporter Core MRP2 One2one
ABCC3 Transporter Extended ABCC3 One2one
ABCC4 Transporter Extended ABCC4 One2one
ABCC5 Transporter Extended ABCC5 One2one
ABCC6 Transporter Extended ABCC6 One2one
ABCC8 Transporter Extended ABCC8 One2one
ABCC9 Transporter Extended ABCC9 One2one
ABCD1 Unknown Related ABCD1 One2one
ABCG1 Transporter Extended ABCG1 One2one
ABCG2 Transporter Core ABCG2 One2one
ABL1 Unknown Reltated ABL1 One2one
ACAA1 Unknown Reltated ACAA1 One2one
ACAA2 Unknown Reltated ACAA2 One2one
ACAD10 Unknown Reltated ACAD10 One2one
ACAD11 Unknown Reltated ACAD11 One2one
ACAD8 Unknown Reltated ACAD8 One2one
ACAD9 Unknown Reltated ACAD9 One2one
ACADL Unknown Reltated ACADL One2one

vi
ACADM Unknown Reltated ACADM One2one
ACADS Unknown Reltated ACADS One2one
ACADSB Unknown Reltated ACADSB One2one
ACADVL Unknown Reltated ACADVL One2one
ACAT1 Unknown Reltated ACAT1 One2one
ACAT2 Unknown Reltated ACAT2 One2one
ACE Unknown Core ENSCAFG00000012998 One2many
ACOT8 Unknown Reltated ACOT8 One2one
ACOX1 Unknown Reltated ACOX1 One2one
ACOX2 Unknown Reltated ACOX2 One2one
ACOX3 Unknown Reltated ACOX3 One2one
ADD1 Unknown Reltated ADD1 One2one
ADH1A Phase-I Core ENSCAFG00000010410 One2many
ADH1B Phase-I Core ENSCAFG00000010410 One2many
ADH1C Phase-I Core ENSCAFG00000010410 One2many
ADH4 Phase-I Extended ADH4 One2one
ADH5 Phase-I Extended ADH5 One2many
ADH5 Phase-I Extended ENSCAFG00000009465 One2many
ADH5 Phase-I Extended ENSCAFG00000013007 One2many
ADH6 Phase-I Extended ADH6 One2one
ADH7 Phase-I Extended ENSCAFG00000029473 Many2many
ADHFE1 Phase-I Extended ADHFE1 One2one
ADORA2A Unknown Reltated ADORA2A One2one
ADRB1 Unknown Core ADRB1 One2one
ADRB2 Unknown Core ADRB2 One2one
AHR Modifier Core AHR One2one
AKAP9 Target/Receptor Related AKAP9 One2one
AKR1A1 Unknown Reltated AKR1A1 One2one
AKR1B1 Unknown Reltated AKR1B1 One2many
AKR1B1 Unknown Reltated ENSCAFG00000003343 One2many
AKR1C3 Unknown Reltated AKR1C3 One2many
AKR1D1 Unknown Reltated ENSCAFG00000028750 One2many
AKR1D1 Unknown Reltated ENSCAFG00000029647 One2many
AKR1D1 Unknown Reltated ENSCAFG00000032319 One2many
AKR1E2 Unknown Reltated AKR1E2 One2one

vii
AKR7L Unknown Reltated AKR7L One2one
AKT1 Unknown Reltated AKT1 One2one
ALB Target/Receptor Related ALB One2one
ALDH1A1 Phase-I Core ALDH1A1 One2one
ALDH1A2 Phase-I Extended ALDH1A2 One2one
ALDH1A3 Phase-I Extended ALDH1A3 One2one
ALDH1B1 Phase-I Extended ALDH1B1 One2one
ALDH2 Phase-I Extended ENSCAFG00000008683 Many2many
ALDH2 Phase-I Extended ENSCAFG00000019771 Many2many
ALDH3A1 Phase-I Extended ALDH3A1 One2one
ALDH3A2 Phase-I Extended ALDH3A2 One2one
ALDH3B1 Phase-I Extended ALDH3B1 One2one
ALDH3B2 Phase-I Extended ALDH3B2 One2one
ALDH4A1 Phase-I Extended TAS1R2 One2one
ALDH5A1 Phase-I Extended ALDH5A1 One2one
ALDH6A1 Phase-I Extended ALDH6A1 One2one
ALDH7A1 Phase-I Extended ALDH7A1 One2one
ALDH8A1 Phase-I Extended ALDH8A1 One2one
ALDH9A1 Phase-I Extended ALDH9A1 One2one
ALK Unknown Reltated ALK One2one
ALOX5 Unknown Core ALOX5 One2one
AMACR Unknown Reltated AMACR One2one
ANKK1 Unknown Reltated ANKK1 One2one
AOX1 Phase-I Extended AOH2 One2many
AOX1 Phase-I Extended ENSCAFG00000030427 One2many
APOA2 Target/Receptor Related APOA2 One2one
APOE Unknown Reltated APOE One2one
ARG1 Unknown Reltated ARG1 One2one
ARNT Modifier Extended ARNT One2one
ARSA Modifier Extended ARSA One2one
ARVCF Target/Receptor Related ARVCF One2one
ASL Unknown Reltated ENSCAFG00000010332 One2many
ASNA1 Target/Receptor Related ENSCAFG00000002783 One2many
ASNA1 Target/Receptor Related ENSCAFG00000017208 One2many
ASS1 Unknown Reltated ASS1 One2one

viii
ATIC Unknown Reltated ATIC One2one
ATP7A Modifier Extended ATP7A One2one
ATP7B Modifier Extended ATP7B One2one
AhRR Unknown Reltated AHRR One2one
BCR Unknown Reltated BCR One2one
BDH2 Target/Receptor Related BDH2 One2one
BLVRB Unknown Reltated BLVRB One2one
BRAF Unknown Reltated BRAF One2one
BRCA1 Unknown Core BRCA1 One2one
C11orf65 Unknown Reltated C11orf65 One2one
CALU Unknown Reltated CALU One2one
CAT Modifier Extended CAT One2many
CAT Modifier Extended ENSCAFG00000002508 One2many
CBR1 Phase-I Extended ENSCAFG00000014444 One2many
CBR1 Phase-I Extended ENSCAFG00000023660 One2many
CBR1 Phase-I Extended ENSCAFG00000031486 One2many
CBR3 Phase-I Extended CBR3 One2one
CCR5 Unknown Reltated CCR5 One2one
CDA Modifier Extended CDA One2one
CEBPA Unknown Reltated CEBPA One2one
CEBPB Unknown Reltated CEBPB One2one
CES1 Phase-I Extended CESDD1 One2one
CES2 Phase-I Extended CES2 One2one
CFTR Modifier Core CFTR One2one
CHRNA2 Target/Receptor Related CHRNA2 One2one
CHST1 Phase-II Extended CHST1 One2one
CHST10 Phase-II Extended CHST10 One2one
CHST11 Phase-II Extended CHST11 One2one
CHST12 Phase-II Extended CHST12 One2one
CHST2 Phase-II Extended CHST2 One2one
CHST3 Phase-II Extended CHST3 One2one
CHST4 Phase-II Extended CHST4 One2one
CHST5 Phase-II Extended ENSCAFG00000020075 One2many
CHST6 Phase-II Extended ENSCAFG00000020075 One2many
CHST7 Phase-II Extended CHST7 One2one

ix
CHST8 Phase-II Extended CHST8 One2one
CHST9 Phase-II Extended CHST9 One2one
COL18A1 Target/Receptor Related COL18A1 One2one
COL22A1 Unknown Reltated COL22A1 One2one
COMT Target/Receptor Core COMT One2one
COQ2 Unknown Reltated COQ2 One2one
CPS1 Unknown Reltated CPS1 One2one
CRAT Unknown Reltated CRAT One2one
CRHR1 Unknown Reltated CRHR1 One2one
CRHR2 Unknown Reltated CRHR2 One2one
CROT Target/Receptor Related CROT One2one
CRP Unknown Reltated CRP One2one
CRYZ Target/Receptor Related CRYZ One2many
CRYZ Target/Receptor Related ENSCAFG00000002181 One2many
CTSK Target/Receptor Related CTSK One2one
CYB5R1 Unknown Reltated CYB5R1 One2one
CYB5R2 Unknown Reltated CYB5R2 One2one
CYB5R3 Phase-I Extended CYB5R3 One2one
CYB5R4 Unknown Reltated CYB5R4 One2one
CYP11A1 Phase-I Extended CYP11A1 One2one
CYP11B1 Phase-I Extended ENSCAFG00000001285 One2many
CYP11B2 Phase-I Extended ENSCAFG00000001285 One2many
CYP17A1 Phase-I Extended CYP17A1 One2one
CYP19A1 Phase-I Extended CYP19A1 One2one
CYP1A1 Phase-I Core CYP1A1 One2one
CYP1A2 Phase-I Core CYP1A2 One2one
CYP1B1 Phase-I Extended CYP1B1 One2one
CYP20A1 Phase-I Extended CYP20A1 One2one
CYP21A2 Phase-I Extended CYP21 One2one
CYP24A1 Phase-I Extended CYP24A1 One2one
CYP26A1 Phase-I Extended CYP26C1 One2one
CYP27A1 Phase-I Extended CYP27A1 One2one
CYP27B1 Phase-I Extended CYP27B1 One2one
CYP2A13 Phase-I Extended CYP2A13 Many2many
CYP2A6 Phase-I Core CYP2A13 Many2many

x
CYP2A7 Phase-I Extended CYP2A13 Many2many
CYP2B6 Phase-I Core CYP2B6 One2one
CYP2C18 Phase-I Extended ENSCAFG00000013311 Many2many
CYP2C8 Phase-I Core CYP2C21 One2many
CYP2E1 Phase-I Core CYP2E1 One2one
CYP2F1 Phase-I Extended CYP2F1 One2one
CYP2J2 Phase-I Core CYP2J2 One2one
CYP2R1 Phase-I Extended CYP2R1 One2one
CYP2S1 Phase-I Extended CYP2S1 One2one
CYP2W1 Unknown Reltated CYP2W1 One2one
CYP39A1 Phase-I Extended CYP39A1 One2one
CYP3A4 Phase-I Core CYP3A12 Many2many
CYP3A4 Phase-I Core CYP3A26 Many2many
CYP3A4 Phase-I Core ENSCAFG00000014939 Many2many
CYP3A4 Phase-I Core ENSCAFG00000014990 Many2many
CYP3A43 Phase-I Extended CYP3A12 Many2many
CYP3A43 Phase-I Extended CYP3A26 Many2many
CYP3A43 Phase-I Extended ENSCAFG00000014939 Many2many
CYP3A43 Phase-I Extended ENSCAFG00000014990 Many2many
CYP3A5 Phase-I Core CYP3A12 Many2many
CYP3A5 Phase-I Core CYP3A26 Many2many
CYP3A5 Phase-I Core ENSCAFG00000014939 Many2many
CYP3A5 Phase-I Core ENSCAFG00000014990 Many2many
CYP3A7 Phase-I Extended CYP3A12 Many2many
CYP3A7 Phase-I Extended CYP3A26 Many2many
CYP3A7 Phase-I Extended ENSCAFG00000014939 Many2many
CYP3A7 Phase-I Extended ENSCAFG00000014990 Many2many
CYP46A1 Phase-I Extended CYP46A1 One2one
CYP4A11 Phase-I Extended CYP4A37 Many2many
CYP4A11 Phase-I Extended CYP4A38 Many2many
CYP4A11 Phase-I Extended CYP4A39 Many2many
CYP4A11 Phase-I Extended ENSCAFG00000023399 Many2many
CYP4A22 Unknown Reltated CYP4A37 Many2many
CYP4A22 Unknown Reltated CYP4A38 Many2many
CYP4A22 Unknown Reltated CYP4A39 Many2many

xi
CYP4A22 Unknown Reltated ENSCAFG00000023399 Many2many
CYP4B1 Phase-I Extended CYP4B1 One2one
CYP4F12 Phase-I Extended ENSCAFG00000015931 One2many
CYP4F3 Phase-I Extended CYP4F3 One2one
CYP51A1 Phase-I Extended CYP51A1 One2one
CYP7A1 Phase-I Extended CYP7A1 One2one
CYP7B1 Phase-I Extended CYP7B1 One2one
CYP8B1 Phase-I Extended CYP8B1 One2one
DDO Phase-I Extended DDO One2one
DECR1 Unknown Reltated DECR1 One2one
DHRS1 Phase-I Extended DHRS1 One2one
DHRS13 Phase-I Extended ENSCAFG00000008572 Many2many
DHRS2 Phase-I Extended DHRS2 One2one
DHRS3 Phase-I Extended DHRS3 One2one
DHRS4 Phase-I Extended DHRS4 One2many
DHRS4L2 Phase-I Extended DHRS4 One2many
DHRS7 Phase-I Extended DHRS7 One2one
DHRS7B Phase-I Extended DHRS7B One2one
DHRS7C Phase-I Extended DHRS7C One2one
DHRS9 Phase-I Extended DHRS9 One2one
DHRSX Phase-I Extended DHRSX One2one
DNTTIP2 Target/Receptor Related DNTTIP2 One2one
DPEP1 Phase-I Extended DPEP1 One2one
DPYD Phase-I Core DPYD One2one
DRD2 Unknown Core DRD2 One2one
EAF2 Target/Receptor Related EAF2 One2one
ECH1 Unknown Reltated ECH1 One2one
ECHS1 Unknown Reltated ECHS1 One2one
ECI1 Unknown Reltated ECI1 One2one
ECI2 Unknown Reltated ECI2 One2one
EGF Unknown Reltated EGF One2one
EGFR Unknown Core EGFR One2one
EHHADH Unknown Reltated EHHADH One2one
EPHX1 Phase-I Extended EPHX1 One2one
EPHX2 Phase-I Extended EPHX2 One2one

xii
ERBB2 Unknown Reltated ERBB2 One2one
ERCC1 Unknown Reltated ERCC1 One2one
ESR1 Unknown Reltated ESR1 One2one
ESR2 Unknown Reltated ESR2 One2one
EXOC6 Target/Receptor Related EXOC6 One2one
F2 Unknown Reltated F2 One2one
F5 Unknown Core F5 One2one
FCER1G Target/Receptor Related FCER1G One2one
FCGR3A Unknown Reltated ENSCAFG00000013015 One2many
FDPS Unknown Reltated FDPS One2one
FGFR1 Unknown Reltated FGFR1 One2one
FGFR3 Unknown Reltated FGFR3 One2one
FIP1L1 Unknown Reltated FIP1L1 One2one
FKBP1A Unknown Reltated ENSCAFG00000006795 One2many
FLOT1 Unknown Reltated FLOT1 One2one
FLT1 Unknown Reltated FLT1 One2one
FLT4 Unknown Reltated FLT4 One2one
FMO1 Phase-I Extended FMO1 One2one
FMO2 Phase-I Extended FMO2 One2one
FMO3 Phase-I Extended FMO3 One2one
FMO4 Phase-I Extended FMO4 One2one
FMO5 Phase-I Extended FMO5 One2one
FMO6P Phase-I Extended FMO6P One2one
FOXA3 Unknown Reltated FOXA3 One2one
G6PD Target/Receptor Core G6PD One2one
GBA Unknown Reltated GBA One2one
GCDH Unknown Reltated GCDH One2one
GCLC Target/Receptor Related GCLC One2one
GCLM Target/Receptor Related GCLM One2one
GGCX Unknown Reltated GGCX One2one
GNB3 Unknown Reltated GNB3 One2one
GPLD1 Target/Receptor Related GPLD1 One2one
GPX1 Phase-I Extended GPX1 One2one
GPX2 Phase-I Extended GPX2 One2one
GPX3 Phase-I Extended GPX3 One2one

xiii
GPX5 Phase-I Extended GPX5 One2one
GPX6 Phase-I Extended GPX6 One2one
GPX7 Phase-I Extended GPX7 One2one
GRIK4 Unknown Reltated GRIK4 One2one
GSR Phase-I Extended GSR One2one
GSS Phase-I Extended GSS One2one
GSTA1 Phase-II Extended ENSCAFG00000002230 One2many
GSTA2 Phase-II Extended ENSCAFG00000024271 Many2many
GSTA3 Phase-II Extended ENSCAFG00000031682 Many2many
GSTA4 Phase-II Extended ENSCAFG00000009164 One2many
GSTA4 Phase-II Extended GSTA4 One2many
GSTA5 Phase-II Extended ENSCAFG00000002230 One2many
GSTCD Phase-II Extended GSTCD One2one
GSTK1 Phase-II Extended ENSCAFG00000004632 One2many
GSTK1 Phase-II Extended ENSCAFG00000023764 One2many
GSTK1 Phase-II Extended ENSCAFG00000029004 One2many
GSTM1 Phase-II Core ENSCAFG00000019812 One2many
GSTM2 Phase-II Extended ENSCAFG00000019812 One2many
GSTM3 Phase-II Extended GSTM3 One2one
GSTM4 Phase-II Extended ENSCAFG00000019812 One2many
GSTM5 Phase-II Extended ENSCAFG00000019812 One2many
GSTO1 Phase-II Extended GSTO1 One2one
GSTO2 Phase-II Extended GSTO2 One2one
GSTP1 Phase-II Core ENSCAFG00000010648 One2many
GSTP1 Phase-II Core ENSCAFG00000011452 One2many
GSTP1 Phase-II Core ENSCAFG00000019307 One2many
GSTP1 Phase-II Core ENSCAFG00000025332 One2many
GSTP1 Phase-II Core ENSCAFG00000032752 One2many
GSTP1 Phase-II Core GSTP1 One2many
GSTT1 Phase-II Core GSTT1 One2one
GSTT2 Phase-II Extended ENSCAFG00000014043 One2many
GSTZ1 Phase-II Extended GSTZ1 One2one
HADH Unknown Reltated HADH One2one
HADHA Unknown Reltated HADHA One2one
HADHB Unknown Reltated ENSCAFG00000004314 One2many

xiv
HADHB Unknown Reltated ENSCAFG00000029395 One2many
HAGH Phase-I Extended HAGH One2one
HIF1A Unknown Reltated HIF1A One2one
HLA-DOB Target/Receptor Related DLA-DOB One2one
HLA-DQA1 Unknown Reltated DLA-DQA One2many
HLA-DRB1 Unknown Reltated DLA-DRB1 One2many
HMGCR Target/Receptor Core HMGCR One2one
HNF1A Unknown Reltated HNF1 One2one
HNF4A Modifier Extended HNF4A One2one
HNMT Phase-II Extended HNMT One2one
HPRT1 Unknown Reltated HPRT One2one
HSD11B1 Phase-I Extended HSD11B1 One2one
HSD17B10 Unknown Reltated HSD17B10 One2one
HSD17B14 Phase-I Extended HSD17B14 One2one
HSD17B4 Unknown Reltated HSD17B4 One2one
HTR1A Unknown Reltated HTR1A One2one
HTR2C Unknown Reltated HTR2C One2one
IAPP Modifier Extended IAPP One2one
IFNL3 Unknown Reltated ENSCAFG00000005588 One2many
IGF2R Target/Receptor Related CI-MPR/IGF2R One2one
IL1B Unknown Reltated IL1B One2one
IL1RN Unknown Reltated IL1RN One2one
IL2RA Unknown Reltated IL2RA One2one
IL6 Unknown Reltated IL6 One2one
IL6R Unknown Reltated IL6R One2one
IL6ST Unknown Reltated IL6ST One2one
INMT Unknown Reltated ENSCAFG00000013528 Many2many
INTS12 Target/Receptor Related INTS12 One2one
ITK Unknown Reltated ITK One2one
ITPA Unknown Reltated ITPA One2one
KCNH2 Unknown Core KCNH2 One2one
KCNJ11 Modifier Core KCNJ11 One2one
KDR Unknown Reltated KDR One2one
KIT Unknown Reltated KIT One2one
KRAS Unknown Reltated K-RAS One2one
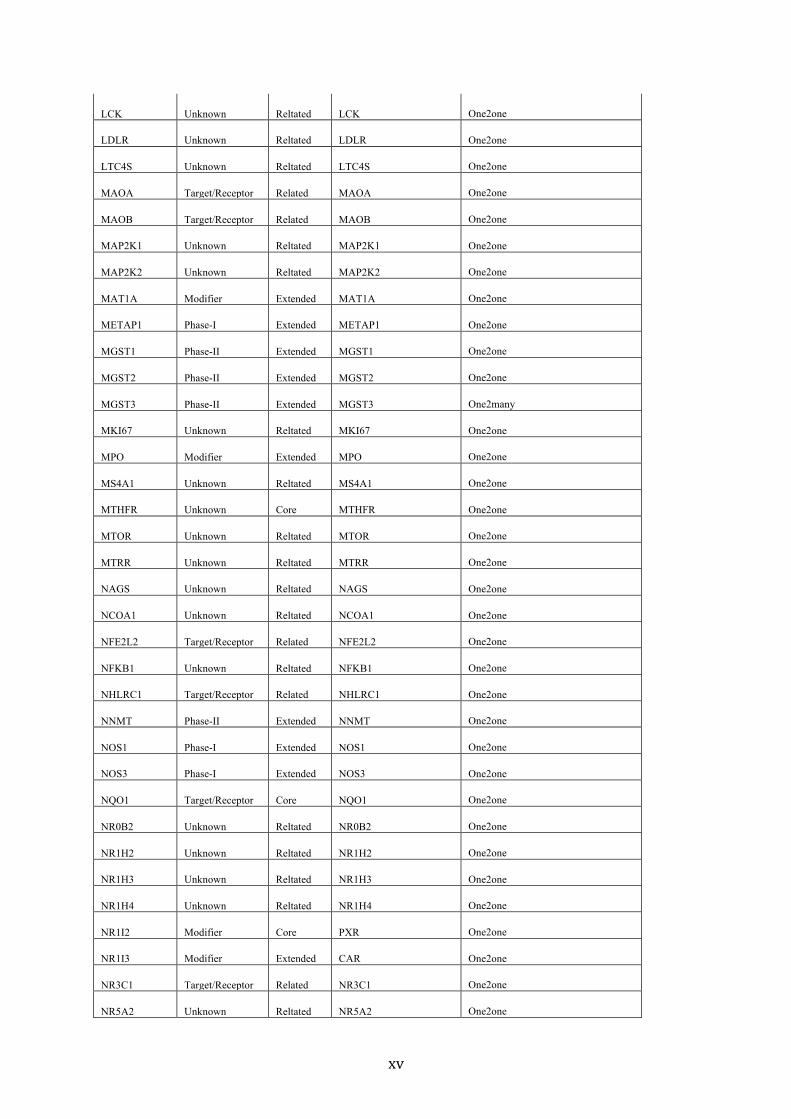
xv
LCK Unknown Reltated LCK One2one
LDLR Unknown Reltated LDLR One2one
LTC4S Unknown Reltated LTC4S One2one
MAOA Target/Receptor Related MAOA One2one
MAOB Target/Receptor Related MAOB One2one
MAP2K1 Unknown Reltated MAP2K1 One2one
MAP2K2 Unknown Reltated MAP2K2 One2one
MAT1A Modifier Extended MAT1A One2one
METAP1 Phase-I Extended METAP1 One2one
MGST1 Phase-II Extended MGST1 One2one
MGST2 Phase-II Extended MGST2 One2one
MGST3 Phase-II Extended MGST3 One2many
MKI67 Unknown Reltated MKI67 One2one
MPO Modifier Extended MPO One2one
MS4A1 Unknown Reltated MS4A1 One2one
MTHFR Unknown Core MTHFR One2one
MTOR Unknown Reltated MTOR One2one
MTRR Unknown Reltated MTRR One2one
NAGS Unknown Reltated NAGS One2one
NCOA1 Unknown Reltated NCOA1 One2one
NFE2L2 Target/Receptor Related NFE2L2 One2one
NFKB1 Unknown Reltated NFKB1 One2one
NHLRC1 Target/Receptor Related NHLRC1 One2one
NNMT Phase-II Extended NNMT One2one
NOS1 Phase-I Extended NOS1 One2one
NOS3 Phase-I Extended NOS3 One2one
NQO1 Target/Receptor Core NQO1 One2one
NR0B2 Unknown Reltated NR0B2 One2one
NR1H2 Unknown Reltated NR1H2 One2one
NR1H3 Unknown Reltated NR1H3 One2one
NR1H4 Unknown Reltated NR1H4 One2one
NR1I2 Modifier Core PXR One2one
NR1I3 Modifier Extended CAR One2one
NR3C1 Target/Receptor Related NR3C1 One2one
NR5A2 Unknown Reltated NR5A2 One2one

xvi
ORM1 Target/Receptor Related ENSCAFG00000003331 One2many
ORM2 Target/Receptor Related ENSCAFG00000003331 One2many
OTC Unknown Reltated OTC One2one
P2RY1 Unknown Core P2RY1 One2one
P2RY12 Unknown Core P2RY12 One2one
PDE3A Phase-I Extended PDE3A One2one
PDE3B Phase-I Extended PDE3B One2one
PDGFRA Unknown Reltated PDGFRA One2one
PDGFRB Unknown Reltated PDGFRB One2one
PGR Unknown Reltated PGR One2one
PIK3CA Unknown Reltated PIK3CA One2one
PKD2 Target/Receptor Related PKD2 One2one
PLG Target/Receptor Related PLG One2one
PML Unknown Reltated PML One2one
PNMT Phase-II Extended PNMT One2one
POLG Unknown Reltated POLG One2one
PON1 Phase-I Extended PON1 One2one
PON2 Phase-I Extended PON2 One2one
PON3 Phase-I Extended PON3 One2one
POR Modifier Extended OR One2one
PPARA Modifier Extended PPARA One2one
PPARD Modifier Extended PPARD One2one
PPARG Modifier Extended PPARG One2one
PPP1R9A Target/Receptor Related PPP1R9A One2one
PRKAB2 Target/Receptor Related PRKAB2 One2one
PSMB8 Target/Receptor Related PSMB8 One2one
PTGIS Target/Receptor Core PTGIS One2one
PTGS2 Unknown Core COX-2 One2one
RALBP1 Target/Receptor Related RALBP1 One2one
RARA Unknown Reltated RARA One2one
RHD Unknown Reltated RH30 One2many
RPS6KB1 Unknown Reltated RPS6KB1 One2one
RXRA Modifier Extended RXRALPHA One2one
RYR1 Unknown Core RYR1 One2one
SAA1 Unknown Reltated SAA1 Many2many

xvii
SCN1A Unknown Reltated SCN1A One2one
SCN5A Unknown Core SCN5A One2one
SCP2 Unknown Reltated SCP2 One2one
SERPINA7 Modifier Extended TBG One2one
SERPINC1 Unknown Reltated SERPINC1 One2one
SGOL2 Target/Receptor Related SGOL2 One2one
SHBG Target/Receptor Related SHBG One2one
SLC10A1 Transporter Extended SLC10A1 One2one
SLC10A2 Transporter Extended SLC10A2 One2one
SLC13A1 Transporter Extended SLC13A1 One2one
SLC13A2 Transporter Extended SLC13A2 One2one
SLC13A3 Transporter Extended SLC13A3 One2one
SLC15A1 Transporter Extended SLC15A1 One2one
SLC15A2 Transporter Core SLC15A2 One2one
SLC16A1 Transporter Extended MCT1 One2one
SLC19A1 Transporter Core SLC19A1 One2one
SLC22A1 Transporter Core SLC22A1 One2one
SLC22A10 Transporter Extended SLC22A10 One2one
SLC22A11 Transporter Extended SLC22A11 One2one
SLC22A12 Transporter Extended SLC22A12 One2one
SLC22A13 Transporter Extended SLC22A13 One2one
SLC22A14 Transporter Extended SLC22A14 One2one
SLC22A15 Transporter Extended SLC22A15 One2one
SLC22A16 Transporter Extended SLC22A16 One2one
SLC22A17 Transporter Extended SLC22A17 One2one
SLC22A18 Transporter Extended SLC22A18 One2one
SLC22A2 Transporter Core SLC22A2 One2one
SLC22A3 Transporter Extended SLC22A3 One2one
SLC22A4 Transporter Extended SLC22A4 One2one
SLC22A5 Transporter Extended SLC22A5 One2one
SLC22A6 Transporter Core SLC22A6 One2one
SLC22A7 Transporter Extended SLC22A7 One2one
SLC22A8 Transporter Extended SLC22A8 One2one
SLC22A9 Transporter Extended ENSCAFG00000015226 One2many
SLC27A1 Transporter Extended SLC27A1 One2one

xviii
SLC28A1 Transporter Extended SLC28A1 One2one
SLC29A2 Transporter Extended SLC29A2 One2one
SLC2A4 Transporter Extended SLC2A4 One2one
SLC2A5 Transporter Extended SLC2A5 One2one
SLC47A1 Unknown Reltated SLC47A1 One2one
SLC47A2 Unknown Reltated SLC47A2 One2one
SLC5A6 Transporter Extended SLC5A6 One2one
SLC6A6 Transporter Extended SLC6A6 One2one
SLC7A5 Transporter Extended SLC7A5 One2one
SLC7A7 Transporter Extended SLC7A7 One2one
SLC7A8 Transporter Extended SLC7A8 One2one
SLCO1A2 Transporter Extended OATPA One2one
SLCO1B1 Transporter Core OATPC One2many
SLCO1B3 Transporter Core OATPC One2many
SLCO1B7 Unknown Reltated OATPC One2many
SLCO1C1 Transporter Extended SLCO1C1 One2one
SLCO2A1 Transporter Extended SLCO2A1 One2one
SLCO2B1 Transporter Extended SLCO2B1 One2one
SLCO3A1 Transporter Extended SLCO3A1 One2one
SLCO4A1 Transporter Extended SLCO4A1 One2one
SLCO4C1 Transporter Extended SLCO4C1 One2one
SLCO5A1 Transporter Extended SLCO5A1 One2one
SLCO6A1 Transporter Extended SLCO6A1 One2one
SOD1 Modifier Extended SOD1 One2one
SOD2 Modifier Extended SOD2 One2one
SOD3 Modifier Extended SOD3 One2one
SPG7 Target/Receptor Related SPG7 One2one
STK19 Target/Receptor Related STK19 One2one
SULF1 Phase-I Extended SULF1 One2one
SULT1A1 Phase-II Core SULT1A1 One2many
SULT1A2 Phase-II Extended SULT1A1 One2many
SULT1A3 Phase-II Extended SULT1A1 One2many
SULT1B1 Phase-II Extended SULT1B1 One2one
SULT1C2 Phase-II Extended SULT1C2 One2one
SULT1E1 Phase-II Extended SULT1E1 One2one

xix
SULT2A1 Phase-II Extended ENSCAFG00000000894 Many2many
SULT2B1 Phase-II Extended SULT2B1 One2one
SULT4A1 Phase-II Extended SULT4A1 One2one
TAP1 Transporter Extended TAP1 One2one
TAP2 Transporter Extended TAP2 One2many
TBXAS1 Target/Receptor Related TBXAS1 One2one
TMEM43 Unknown Reltated TMEM43 One2one
TMEM63A Target/Receptor Related TMEM63A One2one
TNFRSF8 Unknown Reltated TNFRSF8 One2one
TNFSF13B Unknown Reltated TNFSF13B One2one
TNIP1 Target/Receptor Related TNIP1 One2one
TOMM40L Target/Receptor Related TOMM40L One2one
TP53 Unknown Reltated P53 One2one
TPMT Phase-II Core TPMT One2one
TSC1 Unknown Reltated TSC1 One2one
TSC2 Unknown Reltated TSC2 One2one
TSPO Target/Receptor Related TSPO One2one
TTBK1 Target/Receptor Related TTBK1 One2one
TTR Target/Receptor Related TTR One2one
TYMS Target/Receptor Core TS One2one
UGT1A10 Phase-II Extended ENSCAFG00000031066 One2many
UGT1A4 Phase-II Extended ENSCAFG00000024836 Many2many
UGT1A6 Phase-II Extended UGT1A6 One2one
UGT1A7 Phase-II Extended ENSCAFG00000031066 One2many
UGT1A9 Phase-II Extended ENSCAFG00000031066 One2many
UGT2A1 Phase-II Extended ENSCAFG00000002857 One2many
UGT2B10 Phase-II Extended ENSCAFG00000031254 Many2many
UGT2B11 Phase-II Extended ENSCAFG00000030088 Many2many
UGT2B15 Phase-II Core ENSCAFG00000028888 Many2many
UGT2B17 Phase-II Core ENSCAFG00000029376 Many2many
UGT2B28 Phase-II Extended UGT2B31 Many2many
UGT2B4 Phase-II Extended ENSCAFG00000030088 Many2many
UGT2B7 Phase-II Core ENSCAFG00000030088 Many2many
UGT8 Phase-II Extended UGT8 One2one
UMPS Unknown Reltated UMPS One2one
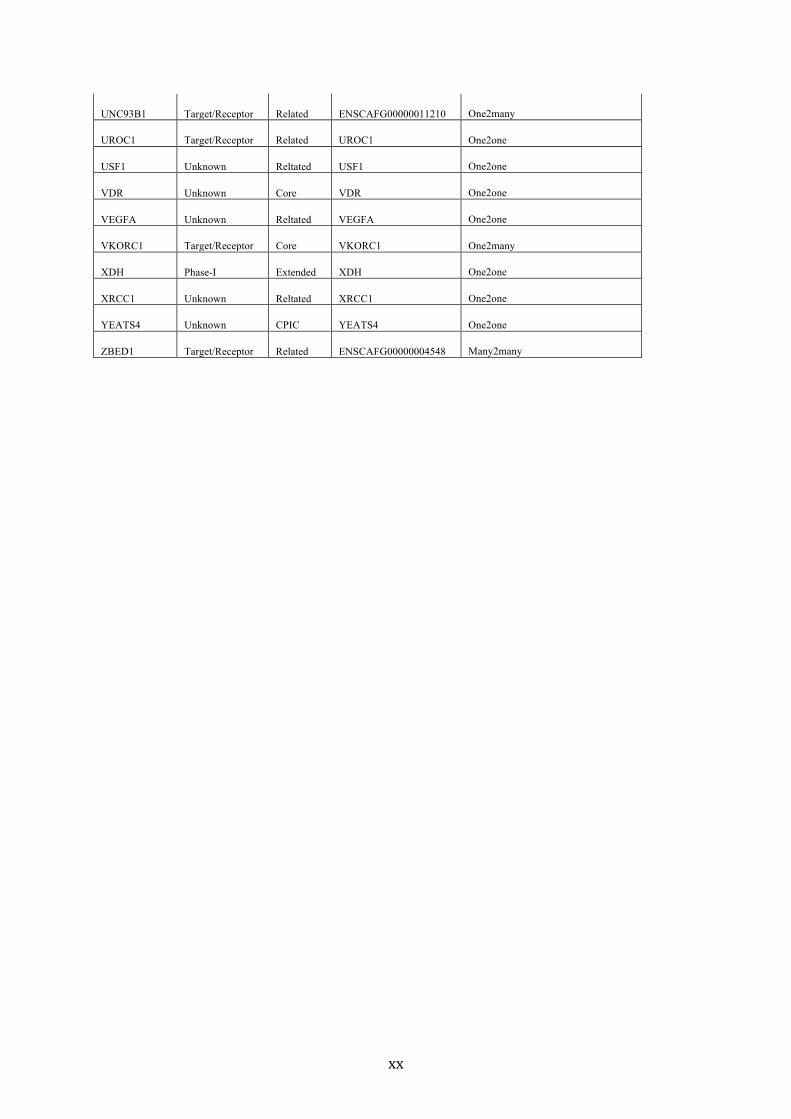
xx
UNC93B1 Target/Receptor Related ENSCAFG00000011210 One2many
UROC1 Target/Receptor Related UROC1 One2one
USF1 Unknown Reltated USF1 One2one
VDR Unknown Core VDR One2one
VEGFA Unknown Reltated VEGFA One2one
VKORC1 Target/Receptor Core VKORC1 One2many
XDH Phase-I Extended XDH One2one
XRCC1 Unknown Reltated XRCC1 One2one
YEATS4 Unknown CPIC YEATS4 One2one
ZBED1 Target/Receptor Related ENSCAFG00000004548 Many2many