development of a high strength laminate repair system
TRANSCRIPT

University of North DakotaUND Scholarly Commons
Theses and Dissertations Theses, Dissertations, and Senior Projects
January 2012
Development Of A High Strength Laminate RepairSystemAndrew Garrett Onken
Follow this and additional works at: https://commons.und.edu/theses
This Thesis is brought to you for free and open access by the Theses, Dissertations, and Senior Projects at UND Scholarly Commons. It has beenaccepted for inclusion in Theses and Dissertations by an authorized administrator of UND Scholarly Commons. For more information, please [email protected].
Recommended CitationOnken, Andrew Garrett, "Development Of A High Strength Laminate Repair System" (2012). Theses and Dissertations. 1310.https://commons.und.edu/theses/1310

DEVELOPMENT OF A HIGH STRENGTH LAMINATE REPAIR SYSTEM
by
Andrew Garrett Onken
Bachelor of Science in Chemical Engineering
University of Minnesota Duluth, 2009
A Thesis
Submitted to the Graduate Faculty
of the
University of North Dakota
in partial fulfillment of the requirements
for the degree of
Master of Science
Grand Forks, North Dakota
August
2012

ii
Copyright 2012 Andrew Garrett Onken


iv
Title Development of a High Strength Laminate Repair System
Department Chemical Engineering
Degree Master of Science
In presenting this thesis in partial fulfillment of the requirements for a graduate degree
from the University of North Dakota, I agree that the library of this University shall make
it freely available for inspection. I further agree that permission for extensive copying for
scholarly purposes may be granted by the professor who supervised my thesis work or, in
his/her absence, by the Chairperson or the department of the dean of the Graduate School.
It is understood that any copying or publication or other use of this thesis or part thereof
for financial gain shall not be allowed without my written permission. It is also
understood that due recognition shall be given to me and the University of North Dakota
in any scholarly use which may be made of any material in my thesis.
Andrew Onken
July 26, 2012

v
TABLE OF CONTENTS
LIST OF FIGURES .......................................................................................................... vii
LIST OF TABLES ............................................................................................................. ix
ACKNOWLEDGEMENTS ................................................................................................ x
ABSTRACT ....................................................................................................................... xi
CHAPTER
I. INTRODUCTION ..................................................................................................... 1
II. BACKGROUND ...................................................................................................... 5
Resins .......................................................................................................... 8
Reinforcements ......................................................................................... 13
Repair Methods ......................................................................................... 16
Analytical Techniques .............................................................................. 18
Mechanics ................................................................................................. 20
Surface Treatment ..................................................................................... 21
III. EXPERIMENTAL METHODS ............................................................................ 26
Chemical Methods .................................................................................... 28
DSC Measurements .................................................................................. 28
Rheology ................................................................................................... 29
Mechanical Methods ................................................................................. 30
Sample Preparation ................................................................................... 33

vi
IV. RESULTS AND DISCUSSION............................................................................ 35
Chemical Results ...................................................................................... 35
Mechanical Results ................................................................................... 41
V. INITIATOR STUDY .............................................................................................. 44
Repair Initiator Study ................................................................................ 47
Repair Initiator Results ............................................................................. 49
Blade Initiator Study ................................................................................. 51
Blade Initiator Study Results .................................................................... 52
Blade Initiator Study Conclusions ............................................................ 57
VI. CONCLUSIONS AND RECOMENDATIONS ................................................. 58
APPENDIX B: RHEOLOGY DATA ............................................................................... 79
APPENDIX C: BLADE INITIATOR VISCOSITY PROFILES ..................................... 94
REFERENCES ................................................................................................................. 99

vii
LIST OF FIGURES
Figure ............................................................................................................................. Page
1. Monomeric components of an unsaturated polyester resin: a) propylene glycol
(PG), b) maleic anhydride (MA), c) phthalic anhydride (PA), and d) styrene. [7] . 9
2. Generic chemical structure of the alkyd backbone of an orthophthalic unsaturated
polyester resin. [7] ................................................................................................. 9
3. Reaction mechanism for an unsaturated polyester resin cure. [8] ....................... 10
4. Reaction scheme for vinyl ester production [9] .................................................... 12
5. Energy flow through resin with core shell rubber additive................................... 13
6. Energy flow through resin without core shell rubber additive ............................. 13
7. Examples of various fiber orientations [10].......................................................... 15
8. Composite Patch Repair [11] ................................................................................ 17
9. Composite Step Repair [11] .................................................................................. 17
10. Composite Scarf Repair [11] ................................................................................ 17
11. Example of Storage and Loss Modulus for a thermoset plastic............................ 19
12. Isocyante monomer used in polyurethanes ........................................................... 23
13. DCB Specimen for mechanical testing ................................................................. 31
14. Tension fatigue testing specimen .......................................................................... 32
15. Representative Isothermal DSC Scan ................................................................... 37
16. Representative Post Isothermal Dynamic DSC Scan............................................ 38
17. Representative Rheology Data for repair resin ..................................................... 40

viii
18. Fatigue Results for Top 3 Repair Resin Candidates ............................................. 43
19. Dimer and Monomer forms of Methyl Ethyl Ketone Peroxide (MEKP) initiator 45
20. Cumyl Hydroperoxide Initiator............................................................................. 45
21. HDP-75 gel time vs. w/w% initiator ..................................................................... 54
22. MCP-75 gel time vs. w/w% initiator .................................................................... 55
23. MCP-21 gel time vs. w/w% initiator .................................................................... 55
24. Norox 757 gel time vs. w/w% initiator ................................................................. 56
25. Pulcat gel time vs. w/w% initiator ........................................................................ 56

ix
LIST OF TABLES
Table Page
1. Advantages and disadvantages of reinforcing fibers [4]...................................... 14
2. Advantages and Disadvantages of repair methods [11] ........................................ 16
3. Resin Coding for each supplier ............................................................................. 27
4. Fiber Stack layup used for mechanical DCB specimens ...................................... 31
5. Fiber Stack layup for tension fatigue testing ........................................................ 32
6. Resin and Initiator combinations and levels tested ............................................... 33
7. DSC Data for the baseline resin and each resin candidate .................................... 37
8. Gel Time Data for baseline and new repair resin candidates ................................ 39
9. Interlaminar Fracture Toughness, GIc, for each resin tested ................................. 42
10. Initiators used for resin testing .............................................................................. 47
11. Initiator study DSC results with HB ..................................................................... 50
12. Initiator study Rheology results with HB ............................................................. 50
13. Blade Initiator Data ............................................................................................... 52

x
ACKNOWLEDGEMENTS
I would like to thank all the people who helped me to complete the work needed
for this thesis. Special thanks to LM Wind Power for funding the project. Without them
I would not have been able to do the research and experience working on a global
research team. Without the help of all the suppliers, who so willingly supplied resins and
initiators free of charge, I would not have had access to the materials required to
complete the project. I would especially like to thank Dr. Brian Tande, my faculty
advisor who helped guide me to the completion of this project. I would also like to thank
Tanveer Chawla and Lee Haag from the Mechanical and Chemical Engineering
Departments at the University of North Dakota. They were a vital part of the research
team and without them much of the work may not have been completed.

xi
ABSTRACT
Composite manufacturing often requires repairs at some point during the life of
the part. Working with LM Wind Power, the Chemical and Mechanical Engineering
Departments at the University of North Dakota worked to develop a new laminate repair
system to be used in composite repairs. Both chemical and mechanical test methods were
explored to analyze various resins in an attempt to increase the interface toughness
between the parent laminate and repair laminate. A total of six resins from four suppliers
were tested. Differential scanning calorimetry and dynamic mechanical rheological
testing were performed to analyze the curing kinetics of each resin tested. Static double
cantilever beam and tension-tension fatigue tests were performed to measure the
mechanical performance of each resin. All specimens were prepared to mimic that of a
large-scale wind turbine blade. Each resin tested was compared to the current repair resin
system to determine which choice was best to meet the requirements set for by LM Wind
Power for repair laminate improvement. The results indicated that toughened resin
performance is superior to that of the current resin system.
Along with the analysis of new repair resins, an initiator study was performed.
The initiator study was done on the blade resin used for vacuum assisted resin transfer
molding (VARTM). Four initiators were tested and compared to the current initiator.
Methods included differential scanning calorimetry and rheology. The goal with testing
these initiators was to see if changing the initiator would increase the working time while

xii
decreasing the overall curing time. To achieve this, the initial viscosity of the resin
needed to remain low to ensure a full wet out of the part and once wet out was complete a
sharp increase in viscosity would indicate a fast cure. Of the initiators tested, Pulcat from
Syrgis Performance Initiators performed better than the others. However, without testing
it in production, it is unclear whether or not it is superior to the current initiator MCP-75.

1
CHAPTER I
INTRODUCTION
The work performed for this thesis was the result of a new relationship between
the University of North Dakota and LM Wind Power. In an effort to bring academic
excellence and industrial practicality together, UND and LM Wind Power joined efforts
to improve repair methods for composite wind turbine blades. Specifically, LM wanted to
research and implement methods to reduce the cost of performing repairs while
maintaining the integrity of their blades. Cost reduction can be achieved by reducing the
labor involved to make a repair to a blade. In other words, reducing the amount of time it
takes for a repair to be applied and cured reduces costs. Other ways to reduce costs are
material selection and reduction of material usage. Choosing materials that perform
better than others may mean that less material is needed to meet the same design
specifications. Note that choosing a better material may cost more for the material per
unit, but may also be more economical than using more of a cheaper material. Together,
LM Wind Power and the University of North Dakota researched materials that could be
suitable to improve repair methods on composite wind turbine blades.
LM Wind Power is the leading supplier of blades for wind turbines. The only
supplier that operates on a global basis, LM has produced over 140,000 blades since
1978. LM not only does research with universities, but also internally and with their
material suppliers. A collaborative research effort with these groups has allowed LM to

2
gain extensive knowledge about composites and turbine blade manufacturing resulting in
technologies that build more efficient and longer lasting wind turbines [1]. To improve
their knowledge base and remain one of the leading manufacturers of wind turbine
blades, LM decided to work with the University of North Dakota on a research project to
develop and implement a new repair resin for use in blade production.
LM Wind Power needs to make repairs to their blades for a variety of reasons.
Some of these reasons include design flaws that create weak spots in blades that require
repairs before shipment of the blades. Other reasons repairs are needed can be due to
environmental impurities during manufacturing. For example, if particles such as dust or
debris contaminate the blade prior to infusion, resin may not bond well or flow evenly,
creating areas of the composite that are referred to as either fiber-rich or resin-rich areas.
During composites manufacturing, it is desirable to achieve a fiber-to-resin ratio called
the fiber weight fraction that is set by the mechanics and design of composites. These
fiber-rich areas are often referred to as dry glass. During the infusion process, the resin
flow across glass reinforcement is called wetting. Thus the term dry glass comes from
the glass fiber-rich regions not getting wetted out to the desired ratio. LM has explained
that they have issues during infusion and they will get areas of dry glass that require
repairs. LM uses nondestructive thermal imaging to detect areas requiring repairs.
Per LM’s requirements, both the Chemical Engineering and Mechanical
Engineering Departments at the University of North Dakota were charged with the task
of developing a resin system for laminate repairs in order to complete three tasks: 1)
improve the interface toughness between fully cured repair laminates and blade
laminates; 2) decrease the curing time of repair laminates; and 3) reduce the scarf ratio

3
required for laminate repair. The projected outcomes included reduced cost of poor
quality as defined by LM Wind Power by 25%, reduced scarf ratio resulting in reduced
labor, and overall increased integrity of each blade. This means that wind turbine blades
produced by LM Wind Power will require fewer in field repairs and any costs associated
with other repairs will require less time and money. In order to reach the goals as defined
by LM Wind Power, it was required that baseline testing of the current repair resin be
conducted and followed by a study to determine a system that would increase the
interface toughness, or the amount of energy required to crack the bond between the
repair laminate and main blade, by three times.
Although the current method works for LM, in attempt to reduce costs and
improve quality, two hypotheses were developed to reach the goals defined by LM. The
first was the use of high styrene resin would soften the cured blade laminate during
repairs and result in increased interface toughness between the blade and repair
laminates. The theory with this hypothesis was that a higher concentration of solvent
used for the polymer would increase absorption of the repair resin into the parent
laminate. This hypothesis was chosen because styrene is the solvent used that keeps the
polyester or vinyl ester resin in solution until the polymerization reaction is initiated. The
second method was the use of toughened resins for repair methods will increase the
interface toughness between the laminates. Using said hypotheses, various resins were
explored and tested for the discovery of a new repair resin system for LM Wind Power.
After a brief overview of the background of composites, geared towards fiber reinforced
plastics, the methods used for characterizing and analyzing materials for improving repair
laminate technology are discussed. These methods include differential scanning

4
calorimetry, rheology, and mechanical testing. As the reader continues, data and analysis
are presented for various resins tested for the LM Wind Power repair resin project. Using
these methods, resins were either accepted or rejected for the hypotheses and use by LM
for a new repair system.
Along with the exploration of repair systems, a side project was performed
exploring the effects of different initiators on the blade resin. This project was a spin-off
of the repair resin project. The hypothesis was that choosing a better initiator for the
blade resin will improve the infusion process of blade production and reduce the amount
of repairs required during manufacturing. This study used the same techniques as the
repair resin project other than mechanical testing. Using differential scanning
calorimetry and rheology, various initiators including methyl ethyl ketone peroxide,
cumyl hydroperoxide, acetyl acetone peroxide, and blends of these were explored to help
improve blade infusion. The end goal of exploring both the new repair resins and
initiators for blades was to improve LM’s repair methods and increase cost savings.

5
CHAPTER II
BACKGROUND
Composites are two or more materials that together provide superior properties
for desired applications. Composites have been used dating back to biblical times in
ancient Egypt where straw reinforced clay bricks were used [2]. During this early stage
in history these composites were primitive compared to the technology used presently.
As technology progressed through history, fiberglass composites and steel reinforced
structure became more and more common. During the 19th
century masons used iron
rods as reinforcements which lead to steel reinforced concrete commonly used in road
construction. In 1935 Owens Corning invented fiber reinforced plastics using glass fibers
and polymer matrix commonly referred as fiberglass [3]. The use of this technology lead
to the applications of composites to industries including marine, aerospace, automotive,
sporting goods, biomedical and many other applications.
Common composites include concrete and fiber reinforced plastics (FRP). FRPs
have a wide variety of uses, and have been used for products such as window frames,
boats, snowboards, and airplanes. Composites have even been used in the sporting goods
industry. For example, most hockey sticks used are either one piece graphite composite
sticks or a two part graphite composite shaft and blade. The aerospace industry has been
able to utilize composite materials for the manufacturing of airplanes. Cirrus Design

6
based out of Duluth, Minnesota manufactures complete airplanes using carbon fiber and
glass fiber reinforced polymer matrix composites. These are some of the most advanced
personal aircraft built today. Other uses have included government aircraft including the
B-2 Stealth Bomber [4] and automotive uses. Generally composites have been used and
can be used for just about anything the mind desires. The wind industry has been able to
utilize the benefits of composites for the manufacturing of blades with the large benefit
coming from the strength to weight ratio that can be achieved using composite materials.
Due to the properties of composites, they can be built to sustain forces equal to a part
made out of metal, but have far less mass. This superior property comes from
reinforcement, and matrix material selection.
Often times composites manufacturers are looking for the best materials to give
the highest strengths with the lowest weights. This is especially true in the aerospace
industry for the manufacturing of airplanes and airplane parts. To obtain this high
strength to weight ratio, the aerospace industry typically uses carbon reinforcement fibers
with an epoxy matrix in what is called a prepreg. A prepreg is a composite material that
is pre-impregnated with semi-cured epoxy resin. Prepregs are great for producing very
consistent parts but require a heating cycle at elevated temperatures to fully cure the part.
These materials and methods would be considered the top end of composites
manufacturing. Other common reinforcement materials include glass fibers and aramid
fibers while matrix materials include epoxies, vinyl esters, acrylics, and unsaturated
polyesters. The matrix material is the glue that holds the composite together. Beginning
in a liquid form and then going to solid form, the matrix binds the reinforcement together
and maintains the shape of the composite part. The cheapest of these materials are glass

7
fiber reinforcements and unsaturated polyester resins. Occasionally a metal matrix
composite may be used but this is uncommon and not applicable to the wind industry.
Metal matrix composites are usually seen in industrial electrical transmission and use
aluminum as the matrix material.
LM Wind Power uses composites technology to manufacture wind turbine blades.
Like all composites manufacturers, LM uses this technology to achieve high strength to
weight ratios. Since wind turbine blades are exposed to the elements, these blades need
to withstand average wind speeds of about 10 miles per hour over a 20 year period [5].
At these continuously high wind speeds, tremendous amounts of force are applied to the
blades. Thus, LM requires high strength but wishes for low weight since each blade is
suspended approximately 300 feet up. Another reason low weight is desirable is that any
friction created during the rotation of the turbine is generally lost energy in the form of
heat. Lower blade weight results in lower amounts of energy lost due to friction and thus
create a more efficient wind turbine.
Like most materials, composites break or degrade and require repairs eventually.
Fiber reinforced plastic composites are built using a polymer matrix. Because wind
turbine blades are exposed to the elements continuously, degradation to polymer
composites usually is from exposure to sunlight and/or moisture. To prevent degradation,
wind turbine blades are manufactured with a gel coat, or a protective layer, encasing the
main structure of the composite. The purpose of this gel coat is to protect the composite
from elements that cause degradation. The gel coat is another polymer made of acrylic.
It will usually contain polymer additives such as TiO2 to prevent ultraviolet penetration to
the main composite blade. The gel coat is also non-porous for reduction of the diffusion

8
of nature’s elements that can potentially cause damage to the main composite blade.
Composite wind turbine blades also degrade over time due to prolonged fatigue stresses.
The wind applies force to each turbine blade which creates spinning motion of the
turbine. This applied force is semi-continuous and thus blades experience fatigue stresses
that, with time, reduce the strength of a turbine blade. Since wind turbine blades are
exposed to various methods of degradation, they often times require repairs to reinforce
the strength of the each blade. Because these repairs are performed in the field, it was
essential to explore thixotropic resin systems, resins that have high viscosities that reduce
flow unless a shear stress is applied, thus allowing for vertical application of repairs.
Other reasons blades may need repairs can include other exposure to the elements. For
example they may have hail damage or wind damage that resulted from a severe storm.
They may also need repairs before departure from manufacturing. These repairs result
from human error, design flaws, and environmental contaminates during production.
Resins
Thermoset resins are plastics that once cured cannot be melted and/or recycled.
For the case of composite wind turbine blades, crosslinked thermosetting resins are used
in the manufacturing of fiber reinforced plastic composites. Orthophthalic unsaturated
polyester resins are commonly used during blade production. Composite repairs are
necessary for various reasons. Some of these reasons include inherent flaws from blade
design, stress concentrations, ply delamination, and other flaws.
Currently, LM Wind Power uses an orthophthalic unsaturated polyester resin,
similar to that of their blade resin, for repair methods. This resin (GT80) is described by
the supplier as being designed for hand layup applications with improved toughness

9
relative to that of other general purpose polyester resins [6]. In general, orthophthalic
UPE resins are formed through the condensation reaction of maleic anhydride (MA),
phthalic anhydride (PA), and propylene glycol (PG). These monomers begin in solution
using styrene monomer as the solvent. Once initiated using organic peroxide, usually
MEKP, the styrene monomer becomes the crosslinking agent resulting in a three
dimensional crosslinked polymer network. Figure 1 shows the chemical structure of each
of these monomers. The product of this condensation reaction is an unsaturated polyester
alkyd, a generic chemical structure of which is shown in Figure 2
Figure 1: Monomeric components of an unsaturated polyester resin: a) propylene
glycol (PG), b) maleic anhydride (MA), c) phthalic anhydride (PA), and d) styrene.
[7]
Figure 2: Generic chemical structure of the alkyd backbone of an orthophthalic
unsaturated polyester resin. [7]
n

10
Typically, a large fraction of the MA isomerizes during the polymerization to
form a fumerate unit, which has a “trans” configuration. This is normally advantageous,
as the fumerate unit is much more reactive than the maleate, or “cis”, isomer. The
unsaturated polyester alkyd is then diluted with styrene and other additives (promoters,
thixotropic agents, tougheners, etc.) to produce the final resin. Curing of the resin takes
place through the reaction of the unsaturated double bonds of the MA units and styrene.
During this reaction, the addition of MEKP and cobalt ions along with styrene monomer
produces a styrene radical. The styrene radical then attacks the carbon – carbon double
bonds present in the unsaturated polyester alkyd. As diffusion of radicals progress, a
crosslinked polyester network is formed resulting in a cured thermoset plastic. Figure 3
shows the mechanism during the cure of unsaturated polyester resin.
Figure 3: Reaction mechanism for an unsaturated polyester resin cure. [8]

11
Per LM’s requirement, resin selection was done assuming that each resin was
available globally and meets the health, environmental, and safety regulations for which
LM manufactures blades. The new resins tested were selected based on this requirement
and included low styrene vinyl esters, high styrene vinyl ester, and three rubber modified
toughened vinyl esters. In general, vinyl ester and toughened resins display superior
properties relative to unsaturated polyester resins. This is due to the epoxy backbone that
makes up the vinyl ester structure. Vinyl esters are commonly produced by esterifying a
diepoxide with methacrylic acid forming an unsaturated terminal bond. The presence of
the unsaturated bond allows vinyl ester resins to be highly reactive and allows for a
crosslinked polymer network. Fewer ester linkages mean that vinyl esters are less
susceptible to degradation. The double bond of an ester linkage is less stable than single
bonds and therefore is more likely to react undesirably or degrade [7]. Figure 7 shows a
general reaction mechanism for producing vinyl ester resin. Similar to Figure 6, the
carbon-carbon double bonds are attacked by styrene radicals creating a crosslinked
polymer network.
12
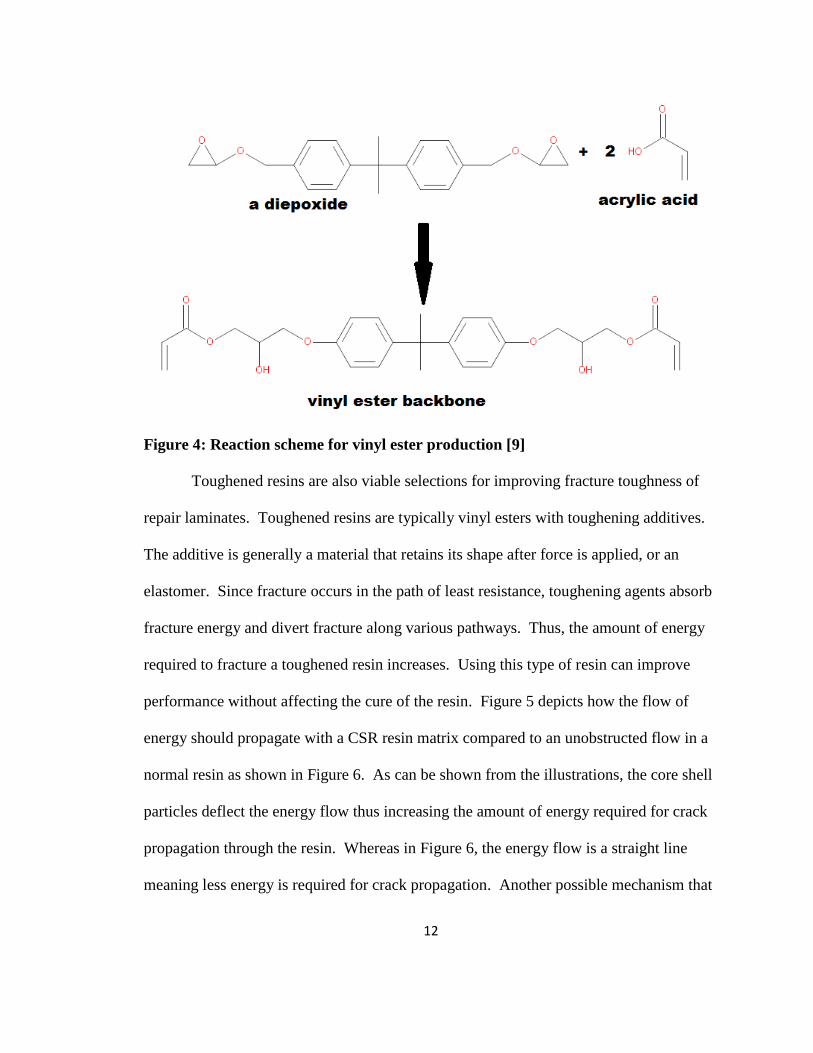
Figure 4: Reaction scheme for vinyl ester production [9]
Toughened resins are also viable selections for improving fracture toughness of
repair laminates. Toughened resins are typically vinyl esters with toughening additives.
The additive is generally a material that retains its shape after force is applied, or an
elastomer. Since fracture occurs in the path of least resistance, toughening agents absorb
fracture energy and divert fracture along various pathways. Thus, the amount of energy
required to fracture a toughened resin increases. Using this type of resin can improve
performance without affecting the cure of the resin. Figure 5 depicts how the flow of
energy should propagate with a CSR resin matrix compared to an unobstructed flow in a
normal resin as shown in Figure 6. As can be shown from the illustrations, the core shell
particles deflect the energy flow thus increasing the amount of energy required for crack
propagation through the resin. Whereas in Figure 6, the energy flow is a straight line
meaning less energy is required for crack propagation. Another possible mechanism that

13
CSR particles could use to increase fracture energy could be energy conversion from
potential to thermal energy, where the CSR particles absorb any crack energy rather than
deflecting it.
Figure 5: Energy flow through resin with core shell rubber additive
Figure 6: Energy flow through resin without core shell rubber additive
Understanding of the chemical characteristics of each resin type allow for better
decision making when choosing resins for testing. Knowing that vinyl esters are
inherently tougher than polyester suggests that vinyl ester alone will meet the
requirements set for improvements on repair laminates. However, for this study both
vinyl ester and toughened vinyl esters were tested to broaden the spectrum of results.
Reinforcements
There are several commonly used reinforcements used in composite materials.
Concrete, for example, is inherently a composite. The reinforcement is present in the
form of pebbles and stones dispersed throughout the mixture before it hardens. Once

14
concrete hardens, the pebbles and stones are distributed throughout the matrix as
reinforcement. It is also common for concrete roadways to use steel rods as
reinforcement. These rods, called rebar, are positioned through the concrete matrix to
help carry the load of traffic. Thus reinforcement adds strength and increases the lifetime
of the road while decreasing the amount of cracks and potholes that occur. In the case of
fiber reinforced polymer composites, a variety of materials, and their orientation can be
used to design the composite part. Depending on the use of the part, including the cost,
the reinforcements can be more or less ridged Table 1 lists some of these materials and
their advantages and disadvantages.
Table 1: Advantages and disadvantages of reinforcing fibers [4]
Fiber Advantages Disadvantages
E-glass, S-glass High Strength
Low cost
Low Stiffness
Short fatigue life
High temperature sensitivity
Aramid High tensile strength
Low density
Low compressive strength
High moisture absorption
Boron High stiffness
High compressive strength
High cost
Carbon High strength
High stiffness
Moderately high cost
Graphite Very high stiffness Low strength
High cost
Ceramic High stiffness
High use temperature
Low strength
High cost
Along with the various types of materials available, fibers may be arranged in
different orientations. These orientations include chopped fibers, chopped strand mats,
woven fibers, continuous fibers, semi-continuous fibers, and many other orientations.
For the purposes of manufacturing wind turbine blades, a combination of continuous

15
unidirectional fibers, chopped strand mats, and biaxial mats are used. For the case of
LM, the continuous fibers are backed with chopped strands and are called “combi.”
Continuous unidirectional fibers run the length of the part without any breaks and all the
fibers are oriented in the same direction. Chopped strand mats are shorter fibers that are
dispersed evenly in random directions through the part. Biaxial mats have fibers that are
woven and oriented perpendicular to each other. LM uses this combination of glass
fibers because through the design of their blades, these fiber orientations and materials
meet the needs of the design and are cost effective. Each orientation is used to give the
manufactured blade the required strength in both the latitudinal and longitudinal
directions. Figure 7 below shows some of the various fiber orientations used in
composites manufacturing.
Figure 7: Examples of various fiber orientations [10]

16
Repair Methods
There are various types of repair methods commonly used in industry and include
patch, scarf, and step repairs. Each of these methods has advantages and disadvantages.
Table 1 describes the common methods and their advantages and disadvantages.
Table 2: Advantages and Disadvantages of repair methods [11]
Repair Method Advantages Disadvantages
Patch -Quick and simple
-Requires minimum preparation
-Adds thickness and weight
-Especially good surface
treatment required
Scarf -Marginally thickness added
-Each repair ply overlaps the ply
that it is repairing giving
straighter, stronger load paths
-Goods bonds achieved from
freshly exposed surfaces
-Time consuming
-High skill needed
Step -Same as scarf -Extremely and most difficult to
perform
Patch repairs are easy to do, but add mass to the part when repaired. Step repairs are
often challenging because it takes a highly skilled individual to prepare the main laminate
for repair application [11]. Scarf repairs are beneficial because they don’t add much
weight, each ply overlaps the ply it is repairing giving straighter, stronger load paths, and
freshly exposed material allows for greater adhesion between the repair and main
laminates. Like the step repair, scarf repairs are difficult and require high levels of skill,
but not to the extremes as in a step repair. Figures 8, 9, and 10 show these methods
respectively [11].

17
Figure 8: Composite Patch Repair [11]
Figure 9: Composite Step Repair [11]
Figure 10: Composite Scarf Repair [11]
LM Wind Power uses the scarf method for structural repairs on wind turbine
blades. Because the step repair is extremely difficult to perform, the scarf repair is often
the choice of composite manufacturers. Using the scarf method exposes fresh material
for boding between the main laminate and the repair laminate. Since the quality of the
repair is directly related to how well bonded it is to the parent laminate, resin selection
can be an important factor when performing repairs. The type of resin used can help to
increase the bond strength of a repair. Increasing the bond strength between the repair
and the parent laminate allows for steeper scarf ratios, or the degree of taper, to be used.
Reducing the scarf ratio greatly reduces the amount of labor required for repairs and
18
results in cost savings. It was hypothesized that using the method of grinding that
exposed fibers would increase the interface toughness between the parent laminate and
the repair laminate. Because of this both methods were tested using the resin only bond
as a baseline test to compare the half ground method to.
Analytical Techniques
The methods used for analyzing new repair resins utilized two primary polymer
science analytical tools; differential scanning calorimetry and rheology. Differential
scanning calorimetry (DSC) is a thermal analysis tool that measures the heat flow of a
sample compared to a control sample. When using thermoset resins, the polymerization
undergoes an exothermic reaction releasing heat energy. DSC measures the amount of
heat that is given off during this reaction over a given time period during an isothermal
DSC scan. Similarly, DSC machines can add known amounts of heat to measure any
heat flow from chemical reactions during dynamic DSC scans. Using isothermal scans
along with dynamic scans allows for measuring the degree of cure of a thermoset resin.
Rheology is another tool for measuring the properties of thermoset resins. For the
case of thermoset resins, dynamic oscillatory time sweep tests measure the viscoelastic
behavior of the polymer as it cures. All polymers experience both visco, meaning fluid
like, and elastic, meaning solid like behavior. Viscoelastic behavior of polymers can be
broken into two sections, the storage modulus, and loss modulus. The storage modulus,
G′, is the measurement of how well the sample stores heat energy and in phase response.
This parameter indicates how solid like a polymer is. The loss modulus, G″, is the
measurement of how well the sample dissipates heat energy and out of phase response, or

19
how liquid like the polymer is. Figure 11 depicts the behavior of an arbitrary thermoset
during a rheological test.
Figure 11: Example of Storage and Loss Modulus for a thermoset plastic
During the cure of a thermoset resin, these two parameters can be measured to
approximate a gel time. During the initial stages of curing, resins display liquid like
properties and G″ is a dominating parameter. Over time the resin becomes highly
crosslinked from styrene radicals reacting with unsaturated carbon-carbon double bonds
and growth of polymer chains. Thus, the storage modulus (G′) increases and eventually
crosses the loss modulus (G″) indicating that the polymer has become more solid like.
The crossover point of G′ and G″ indicate an approximate gel point of the resin [12].
0.1
1
10
100
0.01
0.1
1
10
100
0 50 100 150 200
Co
mp
lex
Vis
cosi
ty η
* (P
a s)
Mo
du
li G
ʹ, G
″ (P
a)
Time (min)
G' Pa
G'' Pa
η* (Pa*s)

20
Once a resin has reached its gel point, the polymer has reached essentially infinite
molecular weight and no longer flows with fluidity.
Resins can be characterized by coupling the data from both DSC and rheology.
During composite manufacturing the working time, or the amount of time needed to
complete the part layup, is an essential parameter needed to optimize the time need to
manufacture a part. Large composites manufacturers such as LM Wind Power want to
minimize the time it takes to make a part. Understanding of the rheology of the resin
during the cure allows them better judgment of the cost of manufacturing. Without the
DSC data however, only the working time can be evaluated. In other words, the amount
of time a manufacturer has for production is related to the rheological behavior of the
resin system. In order to maximize production, a blade mold needs to be infused with
resin quickly without reaching the gel point of the resin prior to wet-out. Using rheology,
a viscosity profile can be generated to define the resins working time. Using information
from DSC with rheology allows for an even more detailed picture of cost of
manufacturing. Knowing how long it takes for a resin to reach a certain degree of cure
means the composites manufacturer knows how long they need before they can ship the
part. In general, using a resin that meets the required properties with rheology doesn’t
mean it is a good resin choice if DSC shows that this particular resin will not reach a 95%
degree of cure within a day’s time.
Mechanics
Not only are the chemical characteristics important, but ultimately the mechanical
properties of cured laminates dominate resin selection. Mechanical properties, in both
static and fatigue modes, when coupled with the chemical characteristics of the resin

21
selection, provide valuable information. All this information together gives a clear
picture of what can be expected when a transition is made from one repair resin system to
another repair resin system. Various ASTM standards were examined prior to testing to
find the most applicable test methods available. Since the interface toughness between
the parent laminate and the repair laminate is the data required, a double cantilever beam
test was performed following ASTM D 5528. This standard tests Mode I interlaminar
fracture toughness of unidirectional fiber reinforced plastics. Since blades are mainly
unidirectional fiber orientation, this test was fitting for the analysis. Using this test, the
ultimate strength of the composite repair for each resin was determined. Although this is
important information, wind turbines experience prolonged amounts of stress from wind
gusts. Most wind turbine blades are designed to last 20 years or more. Therefore, the
fatigue strength is also very important. The fatigue testing was performed by LM Wind
Power. Although fatigue testing followed a tension-tension fatigue method, the actual
test is specialized for LM and thus is proprietary information.
Surface Treatment
The most important part of a repair laminate is the bond strength at the interface
between the repair and the main laminate. There are three main theories that describe
how adhesion between a parent laminate and a repair laminate occur. These three
theories are the adsorption theory, diffusion theory, and the chemical reaction theory.
Adsorption theory states that intimate contact between the parent laminate and the repair
laminate will result in a permanent bond with secondary molecular forces, or Van der
Waals forces. Diffusion theory states that at the molecular level, molecules from both the
parent and repair laminates will diffuse together to form a bond. The third theory,

22
chemical reaction theory, is the result of primary chemical bonds such as covalent bonds
forming between the parent and repair laminates to create a permanent bond interface.
[13]. Primary chemical bonding between the repair laminate and parent laminate would
result in the strongest repair laminate. However since composite wind turbine blades are
manufactured with thermoset resins, it is extremely difficult to break the existing bonds
of the cured parent laminate to bond with the repair laminate. Because chemical bonding
is nearly impossible between cured laminates, adsorption theory is accepted as the
dominating form of bonding between laminates. This means that for a repair to bond
adequately with the parent laminate, there needs to be enough space between the polymer
molecules for the repair resin to form contact resulting in a strong bond. Because
thermoset resins are essentially infinite in molecular weight, it is difficult for new resins
to bond well solely on adsorption theory. However, when applying a repair laminate,
surface treatment aids in the adsorption of new repair resin into the main laminate that is
already cured.
Surface treatment can be crucial for improving this bond. Due to the nature of
scarf repairs the surface of the laminate is prepared by grinding. This exposes fresh
material for bonding as well as roughens up the surface to create bonding sites. These
bonding sites are exposed microscopic area of the laminate that comes in contact with
fresh resin during a repair. The more area available the better the bond should be.
Various methods were discussed with LM Wind Power on how to prepare the
surface for repairs. One mentioned was to use excimer lasers. Using lasers would act the
same as grinding but result in larger surface area for bonding sites. Another suggestion

23
was to look at silane primers. However, in the past LM tried using polyurethane primers.
Polyurethane primers use diisocyanate as a primary monomer with toluene solvent.
Figure 12: Isocyante monomer used in polyurethanes
Toluene diisocyanate has been deemed a poisonous chemical by the Environmental
Protection Agency [14] and thus LM ceased use of polyurethane primers. Because of the
issues that arose from LM Wind Power’s previous usage of primers, the use of primers
for improvements on repair resin methods was declared out of the scope of the project.
Because primers were out of scope, only discussions of them were brought to the table
and no primers or other surface treatment options were experimented with during the
development of the new repair resin system. For the purposes of this thesis, grinding of
the parent laminate was the only form of surface treatment prior to the application of the
new repair resin system.
Although the only surface treatment used prior to repairs was grinding there are
various ways to enhance bonding between the repair laminate and the main laminate
based on the grinding method. LM Wind Power has used a grinding method that
removes enough material to leave one complete ply intact for bonding. This method of
grinding reveals no glass reinforcements of the composite allowing for a resin to resin
bond. Another approach is to grind the main laminate so that there is half of a ply
exposed. The half ground method exposes both glass reinforcement and polymer for

24
bonding. It was later decided by LM Wind Power to include the half grind and full grind
of the parent laminates for testing.

26
CHAPTER III
EXPERIMENTAL METHODS
A total of six resins were tested and compared to the current repair resin both
mechanically and chemically. Baseline testing was performed on the current repair resin
prior to testing the new repair resin candidates. All six resins were tested using
AkzoNobel Cadox M-50A MEKP initiator except for resins HA and HB. HA was
initiated with Norox 925H from Syrgis Performance Initiators. HB was also tested with
Norox 925H as well as Norox HDP-75, both from Syrgis. HB and HA were tested with
different initiators based on recommendations from the resin supplier. Each resin tested
is listed below in Table 3, where GT125 is the parent laminate resin simulating a wind
turbine blade, and GT80 is the current baseline repair resin.

27
Table 3: Resin Coding for each supplier
Resin Supplier Description
GT125 Reichhold Parent Adherend VARTM Resin
GT80 Reichhold Unsaturated Polyester (Current System)
RH Reichhold High Styrene Vinyl Ester
RL Reichhold Low Styrene Vinyl Ester
IP Interplastic Standard Vinyl Ester
AD Ashland Performance Materials Toughened Vinyl Ester
HA Hexion Toughened Vinyl Ester
HB Hexion Toughened Vinyl Ester
Resins RH and RL from Reichhold are both 100% vinyl ester resins. According
to the supplier both these resins are pre-promoted thixotropic resins. It is especially
important to use thixotropic resins for field repairs. Thixotropic means that the resin will
not flow easily unless shear force is applied over time such as mixing. This allows for
vertical repairs to be made without the repair laminate slipping off the main laminate due
to gravity. These resins are manufactured to have high strength and toughness.
Generally RH and RL are similar types of resins, except RH is a high styrene resin (about
42%) whereas RL is a low styrene resin (about 35%) [15,16]. Similar to RH and RL, IP
is a 100% vinyl ester resin from Interplastic Corporation. This resin would fall into the
low styrene category because, like RL, it has a maximum of 35% styrene. Again, it was
formulated for hand layup and spray up applications typically geared towards the marine

28
industry [17]. All three of these resins were tested by UND to confirm or deny the first
hypothesis that high styrene vinyl ester resins would improve bond strength.
The next three resins (AD, HA, and HB) are all toughened vinyl esters. AD is a
resin from Ashland Performance Materials. This is a new experimental vinyl ester resin
that is toughened with polybutadiene copolymer [18]. While maintaining the superior
properties of vinyl esters over unsaturated polyesters, toughened resins include
elastomeric copolymer for increase fracture toughness. HA and HB are both toughened
resins from Momentive Performance Materials, formerly Hexion Specialty Chemicals
[19,20]. Both these resins are toughened using core shell rubber technology, the
difference between the two being that HA and HB use 100 nm core shell particles and
200 nm core shell particles, respectively, as toughening agents.
Chemical Methods
The chemical portion test methods included differential scanning calorimetry and
dynamic rheological testing. Together these methods were utilized to screen viable repair
resin candidates. Each repair resin candidate was analyzed using DSC and rheology. For
both baseline testing and new resins, isothermal DSC scans were run followed by a
dynamic heat ramping DSC scan. Likewise, each resin, including the baseline, was
tested using rheology.
DSC Measurements
A Perkin Elmer Jade DSC was used to perform the thermal analysis of the resins.
Each sample was tested using hermetically sealed aluminum sample pans. Sample sizes
for the DSC ranged from 12 to 20 mg. Each run consisted of an isothermal step holding at
25 oC for 300 minutes followed by a dynamic heat ramp from 25 to 250
oC at 10
oC/min

29
[21]. The isothermal step measures the amount of energy given off during the
exothermic reaction during the cure cycle. The dynamic heat ramp allows for calculation
of any residual heat from any unreacted carbon-carbon double bonds. The residual heat
is indicated by any heat flow present during the dynamic temperature scan. The heat
generated during the isothermal scan (ΔHiso) and the dynamic scan (ΔHres) sum to the
total amount of heat generated from curing. Using this data, the degree of cure can be
calculated at any specified time using the following equation:
Eq 1
where ΔHt is the heat generated in time t, ΔHiso is the heat generated during isothermal
scanning, and ΔHres is the residual heat from unreacted C=C. Each heat of reaction is
obtained by taking the integral of the heat flow over time. We can then calculate the
degree of cure for each resin at a given time [22].
Rheology
All rheological measurements were taken using an AR2000 controlled stress
rheometer, manufactured by TA Instruments. Dynamic time sweep tests were performed
at ambient conditions using 40 mm parallel plate geometry, an oscillating stress of 1.000
Pa, and a frequency of 1.000Hz. These conditions were chosen from running a
preliminary experiment to establish that at this stress and frequency, the polymer
remained in the linear regime. Oscillating frequency was chosen to prevent the polymer
chains from aligning during the cure. This method better fits real production conditions
used by LM. Each resin experienced the oscillatory shear stress until the storage
modulus and elastic modulus crossed, indicating the approximate gel point of the resin.

30
The resulting data were then used to determine the approximate gel time, indicated by a
large and rapid increase in the complex viscosity:
√
Eq. 2
where
η* = Complex Viscosity (Pa s)
G’ = Storage Modulus (Pa)
G” = Loss Modulus (Pa)
ω = Angular frequency (rad/s)
Mechanical Methods
Mechanical test methods included Mode I fracture toughness using double
cantilever beam (DCB) testing and tensile fatigue. DCB mechanical testing was
performed following ASTM Standard D 5528. This tests Mode I interlaminar fracture
toughness of unidirectional fiber reinforced polymer matrix composites. Testing was
done on a Shimadzu AG-IS Universal Testing Machine under displacement control at a
crosshead rate of 0.1mm/min. Using a Retiga 1300 camera, crack propagation was
monitored and recorded. Loads were applied stepwise for every 15mm of crack growth.
This was done to prevent false loads to be recorded as the crack propagated. With the
help of the Mechanical Engineering Department, the data was analyzed to obtain GIc, the
mode I interlaminar fracture toughness. Figure 13 and Table 4, below, show the
specimen and layup used for DCB testing.
31
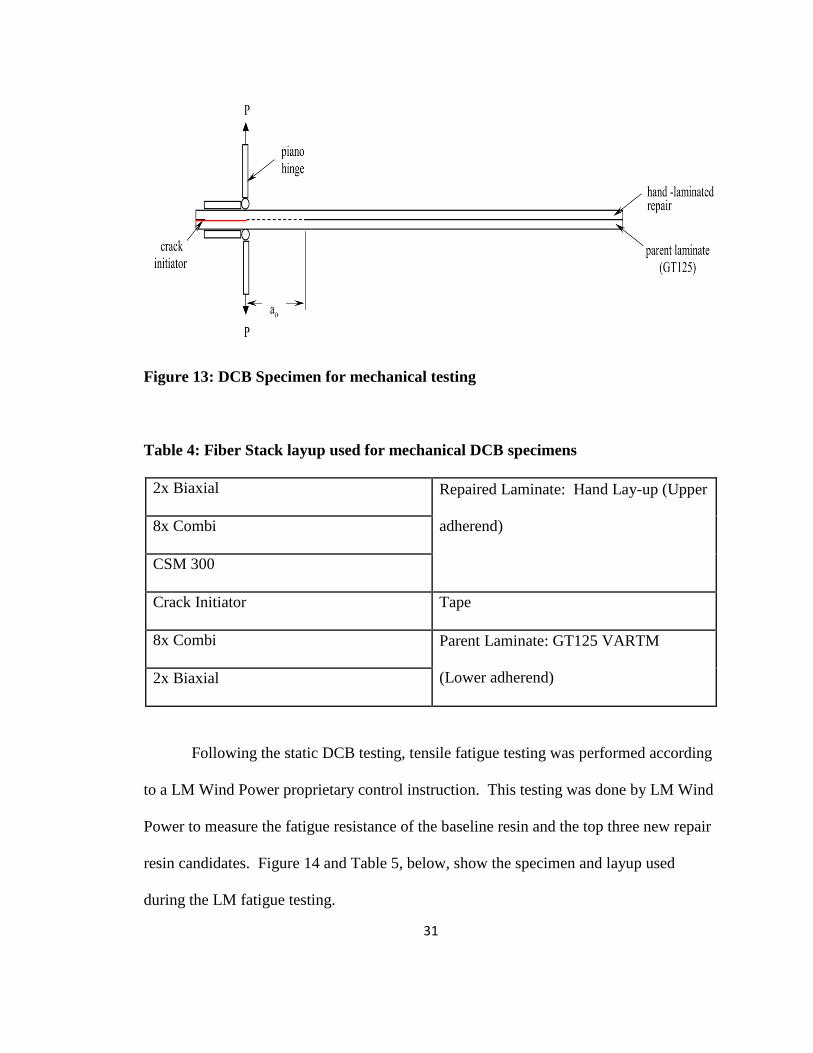
Figure 13: DCB Specimen for mechanical testing
Table 4: Fiber Stack layup used for mechanical DCB specimens
2x Biaxial Repaired Laminate: Hand Lay-up (Upper
adherend)
8x Combi
CSM 300
Crack Initiator Tape
8x Combi Parent Laminate: GT125 VARTM
(Lower adherend) 2x Biaxial
Following the static DCB testing, tensile fatigue testing was performed according
to a LM Wind Power proprietary control instruction. This testing was done by LM Wind
Power to measure the fatigue resistance of the baseline resin and the top three new repair
resin candidates. Figure 14 and Table 5, below, show the specimen and layup used
during the LM fatigue testing.

32
Figure 14: Tension fatigue testing specimen
Table 5: Fiber Stack layup for tension fatigue testing
1X Combi
Repair Laminate: Hand Layup
1X CSM
4X Combi
Parent Laminate: VARTM GT125
4X Combi
1X CSM
Repair Laminate: Hand Layup
1X Combi

33
Sample Preparation
For the chemical testing, samples of neat resin were prepared in small glass vials.
A known amount of resin was added to each vial and then the relative amount of initiator
was added based on weight percent. The weight percent and type of initiator added for
each resin tested is shown below in Table 6.
Table 6: Resin and Initiator combinations and levels tested
Resin Initiator Type % Initiator
GT80 Cadox M-50A 1.2
RH
Cadox M-50A 1.5
RL
Cadox M-50A 1.5
IP
Cadox M-50A 1.5
AD
Cadox M-50A 1.5
HA Cadox M-50A 1.5
HB Norox 925H 1.2
HB Norox 925H 1.5
HB Norox 925H 1.7
HB Norox 925H 2.0
HB Norox HDP-75 1.5
HB Norox HDP-75 1.7
HB Norox HDP-75 2.0
After initiation, the resin was mixed for at least one minute using a Maxi Mix II
vortex mixer. Samples were then taken from the glass vial for DSC and rheology testing.
DSC samples were crimped in hermetically sealed sample pans with weights ranging

34
from about 10 to 20 mg. Rheology samples were placed between the 40mm parallel plate
geometry with a gap of about 2500 microns.
Mechanical test specimens were prepared jointly with LM Wind Power engineers
and the UND Mechanical Engineering Department. The DCB specimens were composed
of a parent laminate and a repair laminate. The parent laminate used GT125 unsaturated
polyester resin in a vacuum assisted resin transfer molding process (VARTM). To avoid
any unaccounted factors, each parent laminate underwent a post curing cycle at elevated
temperatures of 60 oC for 24 hours followed by 3 hours at 95
oC. Once the parent
laminate was post-cured, it was ground and prepped for the application of the repair
laminate. One complete ply of the parent laminate was ground off in preparation for the
application of the repair laminate. Repair laminates of the baseline resin and new resin
candidates were applied using the hand layup method. To maintain a high degree of cure
for the repair laminates, the final composite was again post-cured at 40 oC for 16 hours
prior to testing. Specimens measuring 35 cm long and 3 cm wide were cut from the
prepared composite with a diamond band saw for DCB testing. Piano hinges were
adhered to the composite using Araldite 2021 MMA adhesive.
Fatigue test specimens were prepared similar to the DCB specimens. The parent
plate was prepared using the same method as the DCB samples; however the repair
laminate was applied slightly different. Rather than apply repair laminate to only one
side of the parent laminate, the repair laminate was applied to both sides of the parent
plate.

35
CHAPTER IV
RESULTS AND DISCUSSION
Both the chemical data and mechanical data describe how each resin candidate
behaves. The chemical data indicates how off the shelf resins behaved during the cure
cycle. Each test resulted in the degree of cure and gel point for each resin. Both these
parameters are important for a few reasons. It is desirable to reach a high degree of cure
quickly for efficient output of completed parts. The gel point is even more important
because it lets you know how much working time is available for the hand layup of a
repair laminate. By utilizing the information from the data, a more desirable resin can be
chosen to better meet the needs for repair laminates.
Coupling the chemical data with the mechanical data gives an overall picture of
how a repair laminate will behave. Ultimately, the mechanical properties are the most
important characteristics of the resin candidates. If a chosen resin candidate does not
meet the mechanical requirements, it will automatically be excluded from possible
solutions. Mechanical characteristics in both static and fatigue modes are essential to
choosing a new viable repair resin.
Chemical Results
The DSC data shows that each resin candidate tested reached a degree of cure in
ranging from about 45% to 70%. Since the current repair resin GT80 had a degree of

36
cure of 70.8% after five hours, it was desirable to have the new resin candidate reach near
70% or higher degree of cure after five hours. Table 7 below shows the degree of cure
for each resin candidate. This was calculated using Eq. 1. As mentioned in Chapter 3,
the area under the curve for the heat flow during isothermal DSC scans results in ΔHiso.
Likewise, ΔHres is the area under the curve for the heat flow during the post isothermal
dynamic DSC scans. Figures 15 and 16 show representative heat flow curves for the
isothermal and dynamic DSC scans respectively. The resins that were chosen for this
study were off the shelf from each resin supplier. Variance from resin to resin is likely
due to the fact that Cadox M-50A is an initiator that was developed primarily for
unsaturated polyester resins. Other than GT80, all the resins tested were vinyl ester
resins. Although this information was known, to remove variables, Cadox M-50A was
used to maintain consistency during testing. Because the testing done was preliminary
and a screening design, the resins tested were not formulated by each supplier to meet our
exact needs. The “off the shelf” resins were tested to make sure the research was on the
right path towards choosing a new resin. Thus, each resin was tested and compared to
GT80 with the intention of tweaking the resin formulation to better meet curing needs
after selection. It should also be noted that HB, a toughened resin used Norox 925H as
an initiator based on information from the resin supplier.

37
Table 7: DSC Data for the baseline resin and each resin candidate
Resin Initiator
Type
%
Initiator ΔHiso (J/g) ΔHres (J/g)
Degree of
Cure (%)
GT80 Cadox M-50A 1.2 270.4 111.5 70.8
RH
Cadox M-50A 1.5 155.4 130.2 54.4
RL
Cadox M-50A 1.5 237.2 126.5 65.2
IP
Cadox M-50A 1.5 305.4 128.3 70.4
AD
Cadox M-50A 1.5 200.8 93.7 68.2
HA Cadox M-50A 1.5 171.7 136.3 55.7
HB Norox 925H 1.5 120.4 142.9 45.7
Figure 15: Representative Isothermal DSC Scan
0
0.2
0.4
0.6
0.8
1
1.2
1.4
1.6
1.8
2
0 50 100 150 200 250 300
He
at F
low
En
do
Do
wn
(m
W)
Time (min)
Peak Exotherm
Onset of Gelation
ΔHiso

38
Figure 16: Representative Post Isothermal Dynamic DSC Scan
Coupling the DSC data with rheology data helps to give a clearer picture of the
curing kinetics of each resin. Since the gel point of each resin is important for the
working time needed to make repairs, it is imperative that this information be known.
Table 8 shows the gel time data for the baseline resin and the new repair resin candidates.
Figure 17 shows the resulting storage and loss modulus, G’ and G”, along with the
complex viscosity calculated from Eq. 2 for a representative repair resin sample.
The rheology data shows that all resins tested except AD, had gel times similar to
GT80. This is good as it allows enough time for the proper layup of hand laminate
repairs. AD was sent as an unpromoted resin. Promoting the resin based on supplier gel
-3
-2
-1
0
1
2
3
4
5
6
300 305 310 315 320 325
He
at F
low
En
do
Do
wn
(m
W)
Time (min)
ΔHres

39
time data, 0.2 phr of a 6% cobalt napthenate solution was used to promote the resin.
Clearly, this gave a gel time of about 18 minutes. This quick of a gel time would be
unacceptable for repair methods. To account for this, various promoter packages can be
tested to allow adequate working time for repairs. In general, this applies to all resin
candidates. However, the other candidates were pre-promoted per LM Wind Power’s
request.
Table 8: Gel Time Data for baseline and new repair resin candidates
Resin Initiator Type w/w % Initiator Gel Time (min)
GT80 Cadox M-50A 1.2 68
RH Cadox M-50A 1.5 60
RL Cadox M-50A 1.5 65
IP Cadox M-50A 1.5 80
AD Cadox M-50A 1.5 18
HA Cadox M-50A 1.5 67
HB Norox 925H 1.5 87

40
Figure 17: Representative Rheology Data for repair resin
The chemical data resulted in generally expected information. Using a five hour
isothermal DSC scan, the achievement of about 60% degree of cure makes sense based
on data from the baseline testing of the current repair resin that is well known by LM. As
the polymerization progresses, it becomes more difficult for individual polymer chains to
diffuse through the bulk, resulting in higher degree of cure. Although with thermoset
resins the polymerization never ceases, the majority of the reaction occurs within a short
period of time. Since LM lets repairs sit for at least 24 hours prior to shipment, achieving
the degree of cure observed indicates that each resin candidate will cure in an acceptable
timeframe suitable to LM Wind Power. This was proven after LM selected the resin they
0
20
40
60
80
100
120
140
160
180
1
10
100
1000
10000
0 20 40 60 80 100
Co
mp
lex
Vis
osi
ty (
Pa
S)
Log
Mo
du
lus
(Pa)
Time (min)
G' Pa G'' Pa η* Pa S
Approximate Gel Point

41
desired. Residual enthalpies showed that for thin and thick laminates using the new
repair resin achieved 98% and 92% degrees of cure, respectively.
Since the resins tested were requested to come from the supplier as a pre-
promoted resin with a gel time around 40 minutes the rheology data initially is puzzling.
During the rheology testing small masses were used. It is widely accepted that large
mass laminates experience higher peak exotherm temperatures and generate more heat
than thin laminates. Since the rheology testing essentially simulated a thin laminate, the
heat generated was easily dissipated to the surroundings. Because of the heat dissipation,
the reaction progresses at a slower rate compared to a thick laminate which means that
slower gel times will be observed. However, compared to the baseline resin, the gel
times still met acceptable ranges required for the application of a hand laminated repair as
required by LM Wind Power.
Mechanical Results
Following ASTM D 5528, static DCB testing resulted in average interlaminar
fracture toughness for each resin as shown in Table 9. It is shown that all resin
candidates tested performed better than GT80 in the static tests. However, DCB testing
was designed to screen the top three resin choices. RH was the best performing resin at
just over twice as tough as GT80. Following RH, were HB and AD at about 1.5 times
tougher than GT80.

42
Table 9: Interlaminar Fracture Toughness, GIc, for each resin tested
Resin Averaged GIc’ at
ao ~ 100 mm
GT80 165 J/m2
IP 225 J/m2
AD 250 J/m2
RL 230 J/m2
RH 340 J/m2
HA 175 J/m2
HB 260 J/m2
Using the top three new repair resin candidates, RH, HB, and AD, fatigue testing
was performed by LM Wind Power. Figure 18 shows that RH, HB, and AD all are much
better than GT80 in fatigue strength. The data shows larger strain for the resin candidates
which means that they can support higher fatigue loads. This is based off of Equation 3
where:
[
] [
] [
] Eq. 3
With uniform stiffness, a, higher strain, ε, means larger loads, N [4].

43
Figure 18: Fatigue Results for Top 3 Repair Resin Candidates

44
CHAPTER V
INITIATOR STUDY
Along with the repair resin testing, an initiator study was performed. It was
hypothesized that without making changes to the resin formulation, choosing the optimal
initiator type could improve the curing properties. Thermoset resins require the addition
of free radical initiators in order to polymerize into a three dimensional crosslinked
polymer network. When using unsaturated polyester and vinyl ester resins as a matrix,
initiator types are almost always organic peroxides. Studies done by Norac Inc. have
been done showing that variations in initiator do indeed affect the cure cycle of resins.
Ingredients of initiators that may affect resin cure include the active oxygen content,
which is related to the amount of hydrogen peroxide present, the initiator type, including
methyl ethyl ketone peroxide (MEKP), cumyl hydroperoxide (CHP), acetyl acetone
peroxide (AAP), and various blends of these initiators. It is important to know that
hydrogen peroxide alone will kick off the curing reaction but it will not progress beyond
the gel point. Because of this it is imperative that the main organic peroxide is present,
either as a monomer, dimer, or trimer. Studies done at Norac Inc. have also shown that
the amount of monomer, dimer, and trimer of the peroxide also can affect the cure.
Norac Inc. has shown that with high dimer initiators, the gel time lengthens compared to
the monomeric initiator.

45
During the development of the new repair resin system, three organic peroxides
were studied. There were two MEKP initiators and one MEKP-CHP blended initiator.
Figures 19 and 20 show generic structures of MEKP and CHP initiators. Figure 19
shows the monomer and dimer forms of MEKP.
Figure 19: Dimer and Monomer forms of Methyl Ethyl Ketone Peroxide (MEKP)
initiator
Figure 20: Cumyl Hydroperoxide Initiator.
Various initiators were tested with the new repair resin candidates including
Cadox M-50A, Norox 925H, and Norox HDP-75. Both Cadox M-50A and Norox 925H
are methyl ethyl ketone peroxide (MEKP). Cadox M-50A is a multipurpose MEKP
initiator from AkzoNobel that has been used for room temperature curing of unsaturated
polyesters. Cadox M-50A is considered a high hydrogen peroxide, high monomer
initiator. Similarly, Norox 925H is an MEKP initiator used for the room temperature
cure of unsaturated polyester and vinyl ester reins. Unlike Cadox M-50A, 925H is

46
considered a low hydrogen peroxide, medium monomer MEKP initiator. It has been
specifically formulated by Syrgis Performance Initiators to reduce gas generation in
applications using vinyl ester resins [23].
Unlike Cadox M-50A and Norox 925H, Norox HDP-75 is a blended initiator.
HDP-75 is a three to one blend of MEKP and CHP, or cumyl hydroperoxide. It has been
formulated by Syrgis Performance Initiators as a high dimer, low hydrogen peroxide
initiator for use in room temperature cures of unsaturated polyester and vinyl ester resins.
HDP-75 is designed mainly for vacuum infusion of resin, but because it is a MEKP-CHP
blend, it was thought to provide a quality cure that could be used with the hand laminate
repair system [24,25].

47
Repair Initiator Study
An initiator study was performed on the top resin choices to help find an optimal
initiator package for improvements on the curing kinetics of the resin candidate chosen,
shown in Table 10.
Table 10: Initiators used for resin testing
Initiator Supplier Description
Cadox M-50A AkzoNobel MEKP
Norox 925H Syrgis Performance
Initiators
MEKP
Norox HDP-75 Syrgis Performance
Initiators
High Dimer MEKP-CHP Blend
Norox MCP75 Syrgis Performance
Initiators
Parent Adherend Initiator
Following the same procedures as the DSC and rheology testing, two initiators were
tested with the HB toughened vinyl ester resin. Syrgis Performance Initiators supplied
Norox 925H and Norox HDP-75 as initiators to test with the new repair resin. These
initiators were chosen for testing based on discussions between UND, LM Wind Power,
and Syrgis Performance Initiators. As discussed earlier, the rationale for using 925H was
that it is has a lower concentration of hydrogen peroxide and would result in reduced gas
formation during the cure. Likewise, HDP-75 was studied to determine if the MEKP-
CHP blend would ultimately achieve a more desirable cure.

48
Each initiator was tested at various weight percent in both DSC and Rheology.
Typically, resin suppliers have completed quality assurance testing before they ship
resins to a customer and have determined a range of acceptable initiator concentrations to
use during the curing process. Generally resin suppliers recommend using between 1.0%
and 2.5% initiator for the curing of their resin. Based on these recommendations, Norox
925H was tested at 1.2, 1.5, 1.7, and 2.0%, while HDP-75 was tested at 1.2, 1.5, and
2.0%. With both initiators at each of the levels listed, HB toughened vinyl ester resin
underwent isothermal DSC scans at 25 oC for five hours followed by a dynamic heat
ramp from 25 to 250 oC. Similarly, HB underwent rheological testing at each level with
both 925H and HDP-75 initiators at ambient conditions. Both initiators were tested at
these levels to determine the optimum concentration that would give the best cure,
appropriate gel time, and low peak exotherm required by LM Wind Power. The analysis
of the resulting data was then done following the same methods described previously in
the DSC Measurements and Rheology sections discussed in Chapter III.
49
Repair Initiator Results
Working with the supplier, HB was formulated with a promoter package to work
well with Norox 925H at 1.5% w/w. Both 925H and HDP-75 showed good degree of
cure with HB at the 1.5% w/w. Norox 925H, however, was closer to the desired gel point
at 1.5% w/w. This is most likely due to the efforts the supplier put forth to provide a
resin meeting the requirements of the new repair resin. At higher initiator concentrations,
both 925H and HDP-75 showed low degree of cure and longer gel points. This is most
likely due to radical terminations. Radical terminations occur when free radicals collide
with other free radicals that cause the two radicals to kill each other off, leaving behind
nonreactive polymer chains. This generally occurs between growing polymer chains.
This sometimes occurs when too much initiator is added. Tables 11 and 12 show the
results of DSC and Rheology testing using the two initiators. It is clear from the DSC
data that at higher levels of initiator HB did not cure well with Norox 925H. Similarly,
with HDP-75 as the initiator, as concentration was increased the degree of cure went
down. This could be from radical terminations. However, the drastic differences
between 1.7%, 2.0% 925H doesn’t make sense compared to all the other levels tested
with both 925H and HDP-75. Perhaps the resin is reacting differently with these
concentrations of initiators because of the presence of the CSR particles.
The rheology data shows that the gel point for each initiator was rather long
except for 1.5% 925H. Like earlier stated, this could be from low mass simulating thin
laminates. However, the data continues to indicate that the use of 1.5% 925H initiator is
the best level and type of initiator to use with HB. Again this is because Hexion worked
hard in the formulation of their resin to meet the needs of LM Wind Power.

50
Table 11: Initiator study DSC results with HB
Resin Initiator
Type
%
Initiator ΔHiso (J/g) ΔHres (J/g)
Degree of
Cure (%)
HB Norox 925H 1.2 92.6 102.9 47.3
HB Norox 925H 1.5 120.4 142.9 45.7
HB Norox 925H 1.7 5.51 257.9 2.1
HB Norox 925H 2.0 18.4 244.9 7.0
HB Norox HDP-75 1.5 158.1 170.2 48.2
HB Norox HDP-75 1.7 103.7 224.5 31.6
HB Norox HDP-75 2.0 71.3 256.9 21.7
Table 12: Initiator study Rheology results with HB
Resin Initiator Type % Initiator Gel Time (min)
HB Norox 925H 1.2 150
HB Norox 925H 1.5 87
HB Norox 925H 1.7 173
HB Norox 925H 2.0 140
HB Norox HDP-75 1.5 116
HB Norox HDP-75 1.7 108
HB Norox HDP-75 2.0 103

51
Blade Initiator Study
Like the repair resin initiator study, an initiator study was performed on the blade
resin. This study was a spin-off of the repair resin project. Like the repair resin initiator
study, it was hypothesized that choosing the right initiator would improve blade infusion
and cure cycle resulting in a more uniform cure during blade production, thus reducing
the number of repairs need during manufacturing.
Similar to the repair resin project, the blade initiator study used DSC and
Rheology to collect data for the analysis of each initiator. LM Wind Power’s blade resin,
an orthophthalic unsaturated polyester was used for this study and five initiators were
tested from Syrgis Performance Initiators including HDP-75, MCP-21, MCP-75, Norox
757, and Pulcat. MCP-75 is the current blade initiator and is a monomeric MEKP. HDP-
75 was chosen because it is a high dimer MEKP initiator. Again, Norac Inc. has shown
that high dimer initiators help to drive the reaction. MCP-21 is similar to MCP-75 where
as both are MEKP-CHP blends, but MCP-21 is a two-to-one ratio of MEKP to CHP and
MCP-75 is a three-to-one ratio of MEKP to CHP. Norox 757 and Pulcat were chosen to
incorporate other initiators other than MEKP and CHP. Norox 757 is an acetyl acetone
peroxide with a high active oxygen content used for room temperature curing during
resin transfer molding of unsaturated polyester resins. Pulcat is a proprietary initiator
from Syrgis Performance Initiators typically used in pultrusion. It was chosen purely
from an academic approach to see what happens when used with unsaturated polyester
resins. Using the same procedures from the repair resin study, the following data was
collected using the five initiators with the blade resin.

52
Table 13: Blade Initiator Data
Blade Initiator Study Results
One of the main goals for this project was to decrease the overall cure time while
increasing the working time. The initiators with the greatest degree of cure were
PULCAT and Norox 757. By comparing the degree of cure of PULCAT with that of
MCP-75, PULCAT displays approximately a 12% increase in the degree of cure over that
of MCP-75 at 1.5% weight percent. This should effectively reduce the overall cure time
for a blade. How much this will lower the overall cure time is yet to be determined and
more research would be needed to quantify this time savings.
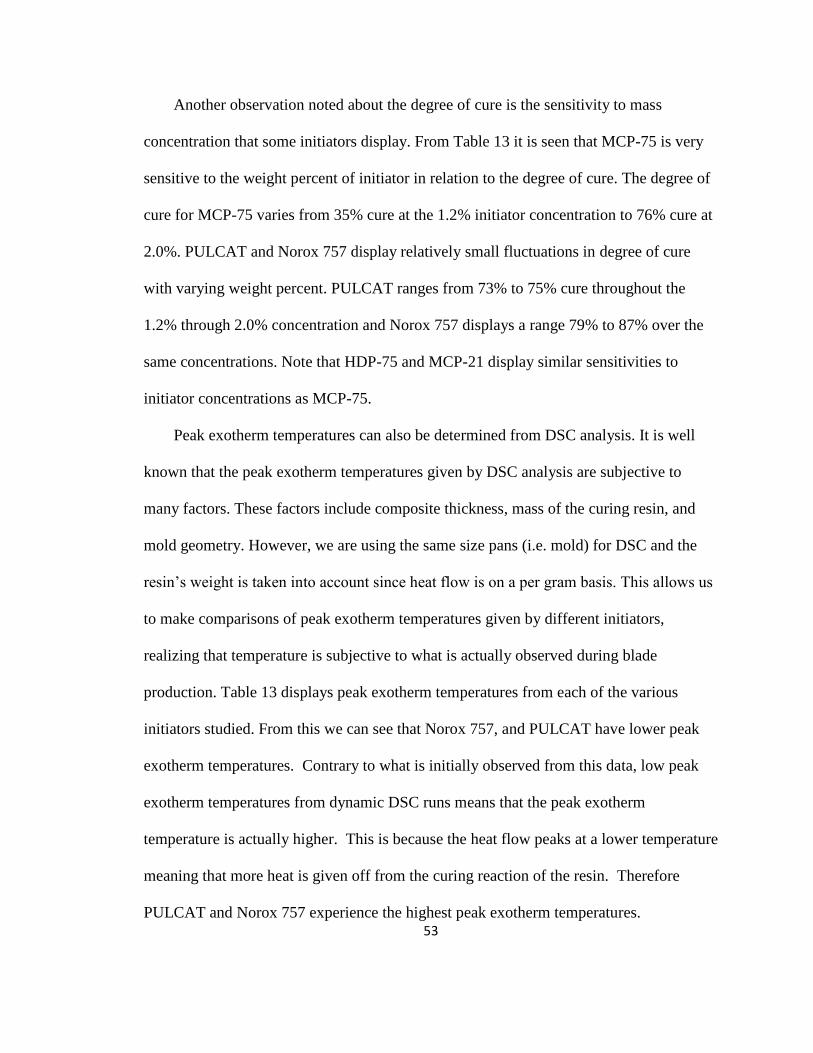
53
Another observation noted about the degree of cure is the sensitivity to mass
concentration that some initiators display. From Table 13 it is seen that MCP-75 is very
sensitive to the weight percent of initiator in relation to the degree of cure. The degree of
cure for MCP-75 varies from 35% cure at the 1.2% initiator concentration to 76% cure at
2.0%. PULCAT and Norox 757 display relatively small fluctuations in degree of cure
with varying weight percent. PULCAT ranges from 73% to 75% cure throughout the
1.2% through 2.0% concentration and Norox 757 displays a range 79% to 87% over the
same concentrations. Note that HDP-75 and MCP-21 display similar sensitivities to
initiator concentrations as MCP-75.
Peak exotherm temperatures can also be determined from DSC analysis. It is well
known that the peak exotherm temperatures given by DSC analysis are subjective to
many factors. These factors include composite thickness, mass of the curing resin, and
mold geometry. However, we are using the same size pans (i.e. mold) for DSC and the
resin’s weight is taken into account since heat flow is on a per gram basis. This allows us
to make comparisons of peak exotherm temperatures given by different initiators,
realizing that temperature is subjective to what is actually observed during blade
production. Table 13 displays peak exotherm temperatures from each of the various
initiators studied. From this we can see that Norox 757, and PULCAT have lower peak
exotherm temperatures. Contrary to what is initially observed from this data, low peak
exotherm temperatures from dynamic DSC runs means that the peak exotherm
temperature is actually higher. This is because the heat flow peaks at a lower temperature
meaning that more heat is given off from the curing reaction of the resin. Therefore
PULCAT and Norox 757 experience the highest peak exotherm temperatures.
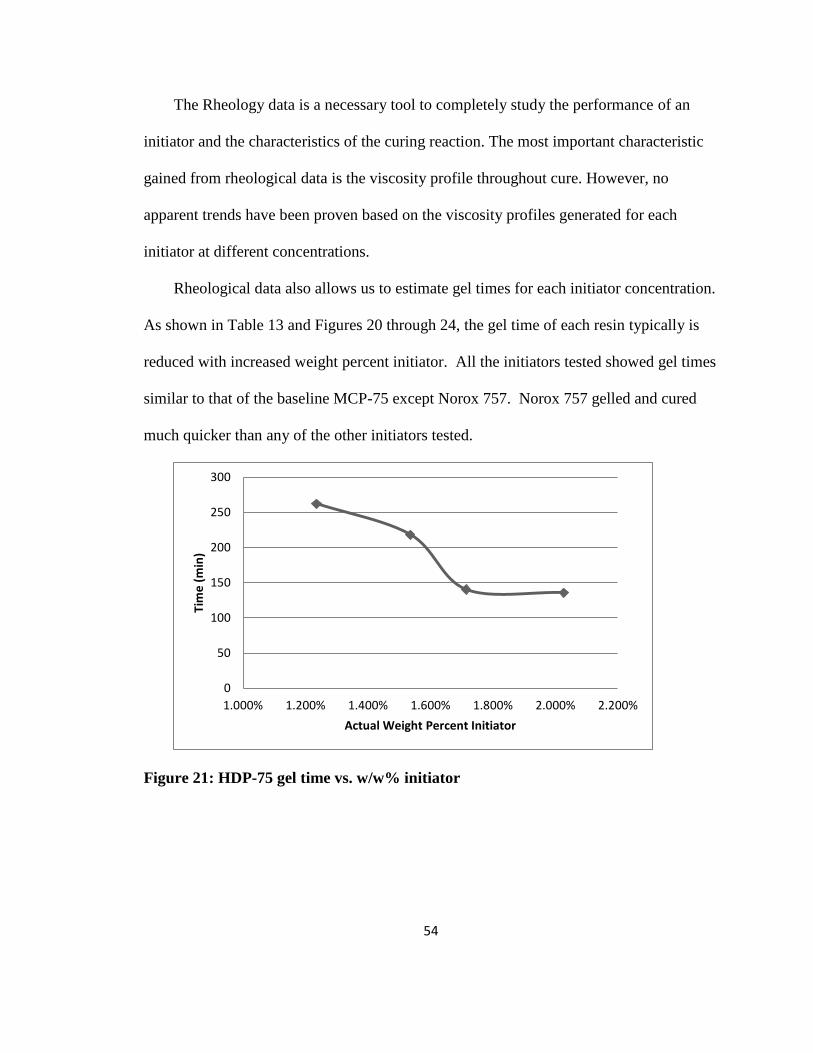
54
The Rheology data is a necessary tool to completely study the performance of an
initiator and the characteristics of the curing reaction. The most important characteristic
gained from rheological data is the viscosity profile throughout cure. However, no
apparent trends have been proven based on the viscosity profiles generated for each
initiator at different concentrations.
Rheological data also allows us to estimate gel times for each initiator concentration.
As shown in Table 13 and Figures 20 through 24, the gel time of each resin typically is
reduced with increased weight percent initiator. All the initiators tested showed gel times
similar to that of the baseline MCP-75 except Norox 757. Norox 757 gelled and cured
much quicker than any of the other initiators tested.
Figure 21: HDP-75 gel time vs. w/w% initiator
0
50
100
150
200
250
300
1.000% 1.200% 1.400% 1.600% 1.800% 2.000% 2.200%
Tim
e (
min
)
Actual Weight Percent Initiator

55
Figure 22: MCP-75 gel time vs. w/w% initiator
Figure 23: MCP-21 gel time vs. w/w% initiator
0
50
100
150
200
250
300
1.000% 1.200% 1.400% 1.600% 1.800% 2.000% 2.200%
Tim
e (
min
)
Actual Weight Percent Initiator
0
50
100
150
200
250
300
1.000% 1.200% 1.400% 1.600% 1.800% 2.000% 2.200%
Tim
e (
min
)
Actual Weight Percent Initiator

56
Figure 24: Norox 757 gel time vs. w/w% initiator
Figure 25: Pulcat gel time vs. w/w% initiator
0
50
100
150
200
250
300
1.00% 1.20% 1.40% 1.60% 1.80% 2.00% 2.20%
Tim
e (
min
)
Actual Weight Percent Initiator
0
50
100
150
200
250
300
1.00% 1.20% 1.40% 1.60% 1.80% 2.00%
Tim
e (
min
)
Actual Weight Percent Initiator

57
Blade Initiator Study Conclusions
Based on the data acquired, there is not an initiator that necessarily stands out as
performing better than MCP-75. It is still unclear as to what viscosity is acceptable for
good wetting during infusion and should be determined in the future. Compared to
MCP-75 all the initiators tested fell within a similar range of viscosities, but no viscosity
profile trends were able to be observed.
Coupling the DSC data and the Rheology data, PULCAT did indicate improvements.
It has been shown that the gel times using PULCAT are similar to the current initiator
system, but the degree of cure is higher. This leads to the belief that blades can be wetted
out with the longer gel times, yet overall cure time is reduced. An ideal initiator would
allow the blade to be fully wetted in say 45 minutes, gel in 60 minutes, and be 95% cured
within a few hours. By using PULCAT as an initiator we may be able to reduce the
overall cure time but it is far from an ideal case.
The data collected thus far does not allow for recommendations at this point on using
an “improved” initiator versus the current MCP-75 package. More research needs to be
conducted to define viscosities that are acceptable for good fiber wetting, as well as the
minimum required working time. Both these factors are related to each other. For
example, if a lower viscosity resin is available and can maintain said low viscosity after
initiation, the wetting time can be reduced. Studies analyzing the flow of resin and
wetting properties need to be performed to help determine this information.

58
CHAPTER VI
CONCLUSIONS AND RECOMENDATIONS
Coupling the chemical testing with the mechanical testing, all resins candidates
performed better than GT80. The top three candidates, RH, HB, and AD underwent
fatigue testing to determine which resin was superior. Although all three of the top resins
performed well in fatigue, HB was superior.
Since HB performed the best, an initiator study was done to determine which
initiator and what weight percent works best for the requirements of LM Wind Power.
Testing was initially done using the current initiator Cadox M-50A. Visual results using
this initiator showed a high level of porosity in the composite laminate. Discussions
between LM Wind Power, UND, and Syrgis led to the choice of testing both Norox 925H
and Norox HDP-75 as initiators with HB. Both of these initiators have relatively low
concentrations of hydrogen peroxide compared to standard MEKPs. Studies done by
Syrgis have shown that high hydrogen peroxide concentrations in initiators result in
excess gas generation and porosity during curing. The supplier also worked to formulate
the promoter package of HB to work well with Norox 925H. Due to these discussions,
both initiators were tested, and it can be concluded that using 1.5% w/w 925H initiator
works best with HB. This was confirmed when laminates were prepared and visually
inspected showing a lower amount of porosity compared to Cadox M-50A.

59
Based on the superior performance mechanically of HB, it has been recommended
to replace the current repair resin with HB. The chemical testing also confirms that HB is
within the curing requirements, and allows enough working time for efficient throughput.
Although HB was the top choice, it was decided to ultimately go with RH. This resin
was chosen over HB because unlike HB, RH is not a new experimental resin that is just
coming into the market. RH is readily available globally and fits the needs of LM Wind
Power. By switching to this resin choice, LM Wind Power should be able to reduce the
scarf ratio of repairs and increase the integrity of their blades.
An initiator study was also performed as a spin off project of the repair resin
project. The initiator study tested LM Wind Power’s blade resin with four different
initiators from Syrgis Performance Initiators. Each initiator type was chosen just to see
what would happen with the blade resin. Using DSC and rheology, the four initiators
were compared to the current initiator MCP-75. The data suggested that with each
initiator tested, an initial spike in viscosity will occur. This is an undesirable trait
because higher viscosity of the resin package results in a longer to for wet-out of the part.
However, unlike MCP-75, HDP-75, and MCP-21, Pulcat did not show a gradual increase
throughout the curing cycle at low weight percent initiator (1.2%). It did, however, gel in
about half the time expected from the resin formulation. This leads us to believe that if
Pulcat was used over MCP-75, that good wet-out may be achieved even with a shorter gel
time. To prove that this is true, Pulcat would need to be tested in a VARTM system on
top of the DSC and rheology testing and then compared to MCP-75. Due to financial and
time constraints these tests were not performed. It is recommended that if LM Wind
Power choses to further pursue this hypothesis, that infusion testing be performed with

60
Pulcat. However, at this time, there is no recommendation to change the initiator type
based on the DSC and rheology data.
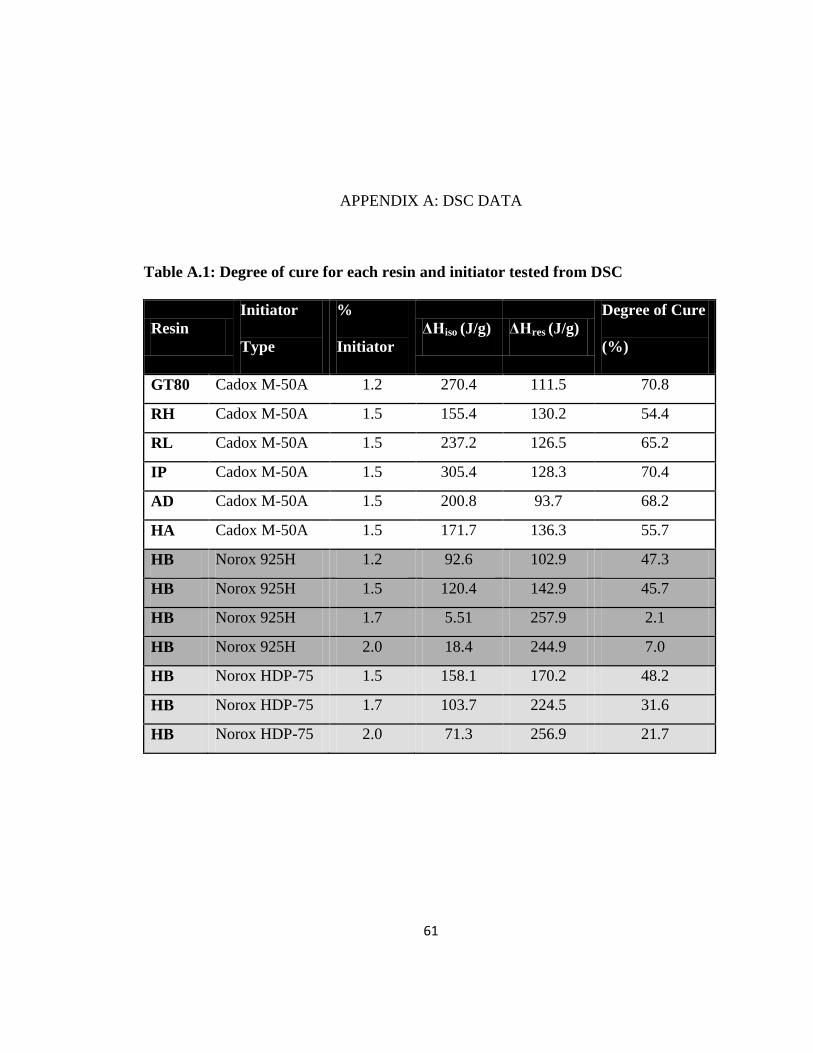
61
APPENDIX A: DSC DATA
Table A.1: Degree of cure for each resin and initiator tested from DSC
Resin
Initiator
Type
%
Initiator
ΔHiso (J/g) ΔHres (J/g)
Degree of Cure
(%)
GT80 Cadox M-50A 1.2 270.4 111.5 70.8
RH
Cadox M-50A 1.5 155.4 130.2 54.4
RL
Cadox M-50A 1.5 237.2 126.5 65.2
IP
Cadox M-50A 1.5 305.4 128.3 70.4
AD
Cadox M-50A 1.5 200.8 93.7 68.2
HA Cadox M-50A 1.5 171.7 136.3 55.7
HB Norox 925H 1.2 92.6 102.9 47.3
HB Norox 925H 1.5 120.4 142.9 45.7
HB Norox 925H 1.7 5.51 257.9 2.1
HB Norox 925H 2.0 18.4 244.9 7.0
HB Norox HDP-75 1.5 158.1 170.2 48.2
HB Norox HDP-75 1.7 103.7 224.5 31.6
HB Norox HDP-75 2.0 71.3 256.9 21.7

63
Figure A. 1: GT80 25 oC isothermal DSC scan
0
0.2
0.4
0.6
0.8
1
1.2
1.4
1.6
1.8
2
0 50 100 150 200 250 300
He
at F
low
En
do
Dw
on
(m
W)
Time (min)

64
Figure A. 2: GT80 post isothermal dynamic DSC scan
-3
-2
-1
0
1
2
3
4
5
6
300 305 310 315 320 325
He
at F
low
En
do
Do
wn
(m
W)
Time (min)

65
Figure A. 3: AD 25 oC isothermal DSC scan
12.8
13
13.2
13.4
13.6
13.8
14
0 50 100 150 200 250 300
He
at F
low
En
do
Do
wn
(m
W)
Time (min)
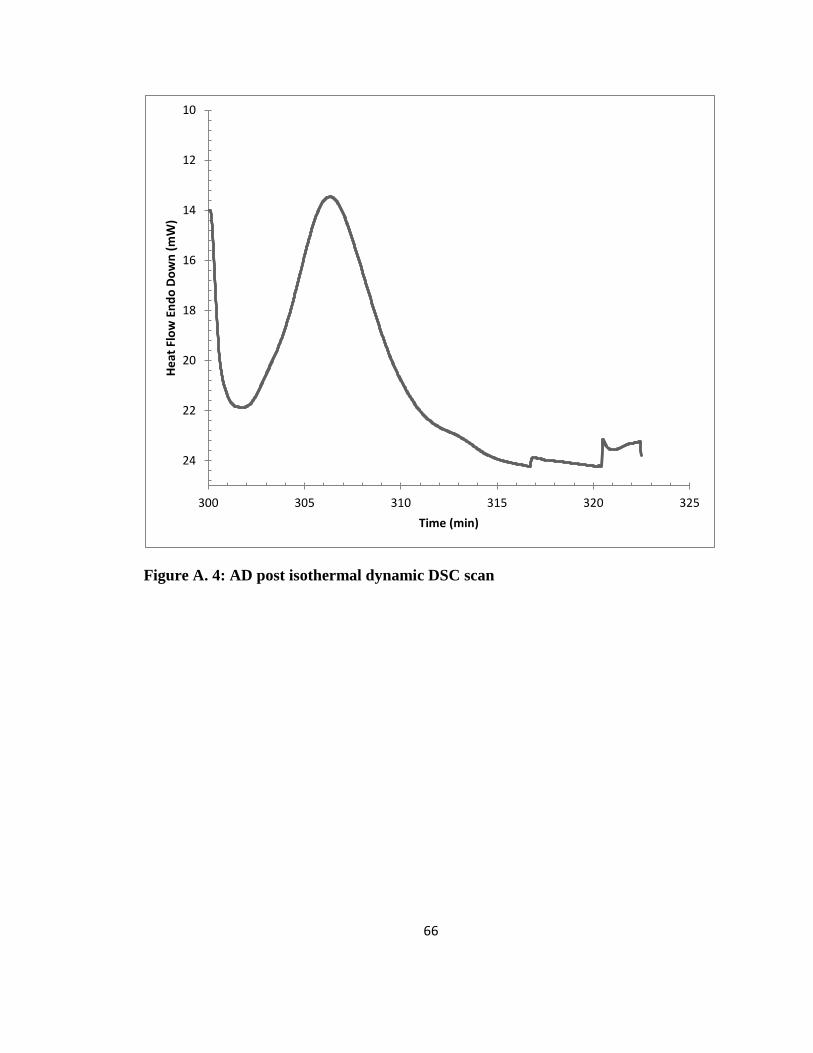
66
Figure A. 4: AD post isothermal dynamic DSC scan
10
12
14
16
18
20
22
24
300 305 310 315 320 325
He
at F
low
En
do
Do
wn
(m
W)
Time (min)

67
Figure A. 5: IP 25 oC isothermal DSC scan
-0.5
-0.4
-0.3
-0.2
-0.1
0
0.1
0.2
0.3
0.4
0 50 100 150 200 250 300
He
at F
low
En
do
Do
wn
(m
W)
Time (min)

68
Figure A. 6: IP post isothermal dynamic DSC scan
-1
0
1
2
3
4
5
6
7
8
9
300 305 310 315 320 325 330
He
at F
low
En
do
Do
wn
(m
W)
Time (min)

69
Figure A. 7: RH 25 oC isothermal DSC scan
-0.9
-0.85
-0.8
-0.75
-0.7
-0.65
-0.6
0 50 100 150 200 250 300
He
at F
low
En
do
Do
wn
(m
W)
Time (min)

70
Figure A. 8: RH post isothermal dynamic DSC scan
-8
-6
-4
-2
0
2
4
300 305 310 315 320 325
He
at F
low
En
do
Do
wn
(m
W)
Time (min)

71
Figure A. 9: RL 25 oC isothermal DSC scan
-2
-1.9
-1.8
-1.7
-1.6
-1.5
-1.4
0 50 100 150 200 250 300
He
at F
low
En
do
Do
wn
(m
W)
Time (min)

72
Figure A. 10: RL post isothermal dynamic DSC scan
-6
-4
-2
0
2
4
6
300 305 310 315 320 325
He
at F
low
En
do
Do
wn
(m
W)
Time (min)

73
Figure A. 11: HA 25 oC isothermal DSC scan
19.45
19.5
19.55
19.6
19.65
19.7
19.75
19.8
19.85
19.9
0 50 100 150 200 250 300
He
at F
low
En
do
Do
wn
(m
W)
Time (min)
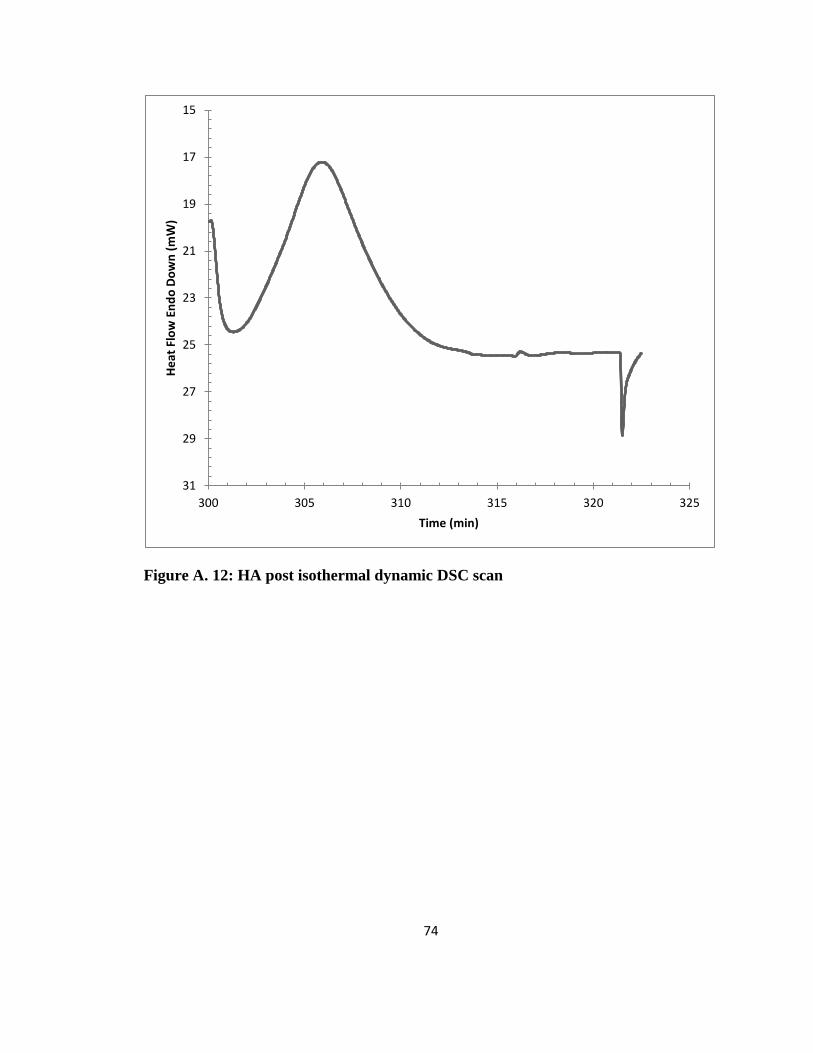
74
Figure A. 12: HA post isothermal dynamic DSC scan
15
17
19
21
23
25
27
29
31
300 305 310 315 320 325
He
at F
low
En
do
Do
wn
(m
W)
Time (min)

75
Figure A. 13: HB 25 oC isothermal DSC scan with varying MEKP-925H initiator
16
16.5
17
17.5
18
18.5
19
0 50 100 150 200 250 300
He
at F
low
En
do
Do
wn
(m
W)
Time (min)
1.2% 925H
1.5% 925H
1.7% 925H
2.0% 925H

76
Figure A. 14: HB post isothermal dynamic DSC scan with varying MEKP-925H
initiator
0
5
10
15
20
25
30
35
40
300 310 320 330 340 350
He
at F
low
En
do
Do
wn
(m
W)
Time (min)
1.2% 925H
1.5% 925H
1.7% 925H
2.0% 925H
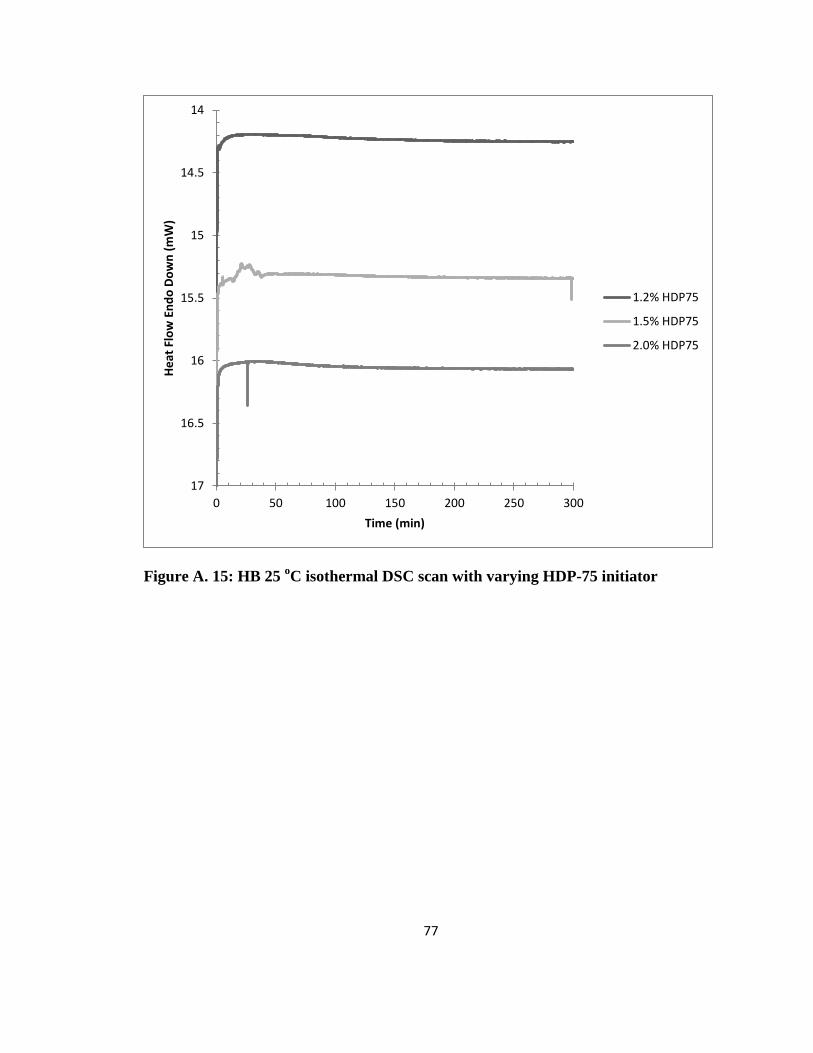
77
Figure A. 15: HB 25 oC isothermal DSC scan with varying HDP-75 initiator
14
14.5
15
15.5
16
16.5
17
0 50 100 150 200 250 300
He
at F
low
En
do
Do
wn
(m
W)
Time (min)
1.2% HDP75
1.5% HDP75
2.0% HDP75

78
Figure A. 16: HB post isothermal dynamic DSC scan with varying HDP-75 initiator
0
5
10
15
20
25
30
35
40
290 300 310 320 330 340 350
He
at F
low
En
do
Do
wn
(m
W)
Time (min)
1.2% HDP75
1.5% HDP75
2.0% HDP75

79
APPENDIX B: RHEOLOGY DATA
Figure B. 1: Rheological Testing of GT80 at Ambient Conditions
0
500
1000
1500
2000
2500
3000
3500
1
10
100
1000
10000
100000
0 5 10 15 20 25 30 35 40 45 50 55 60 65 70 75 80 85 90
Co
mp
lex
Vis
cosi
ty (
Pa
S)
Log
Mo
du
lus
(Pa)
Time (min)
G' G" Complex Viscosity

80
Figure B. 2: Rheological Testing of AD at Ambient Conditions
0
10
20
30
40
50
60
70
80
0.01
0.1
1
10
100
1000
0 5 10 15 20 25
Co
mp
lex
Vis
cosi
ty (
Pa
s)
Log
Mo
du
lus
(Pa)
Time (min)
G' Pa G'' Pa
η* Pa s

81
Figure B. 3: Rheological Testing of IP at Ambient Conditions
0
20
40
60
80
100
120
140
160
180
1
10
100
1000
10000
0 20 40 60 80 100
Co
mp
lex
Vis
osi
ty (
Pa
S)
Log
Mo
du
lus
(Pa)
Time (min)
G' Pa G'' Pa η* Pa S

82
Figure B. 4: Rheological Testing of RH at Ambient Conditions
0
50
100
150
200
250
1
10
100
1000
10000
0 20 40 60 80 100 120
Co
mp
lex
Vis
ocs
ity
(Pa
S)
Log
Mo
du
lus
(Pa)
Time (min)
G' Pa G'' Pa
η* Pa S

83
Figure B. 5: Rheological Testing of RL at Ambient Conditions
0
100
200
300
400
500
600
0.1
1
10
100
1000
10000
0 10 20 30 40 50 60 70 80 90
Co
mp
lex
visc
osi
ty (
Pa
S)
Log
Mo
du
lus
(Pa)
Time (min)
G' Pa
G'' Pa
η* Pa S

84
Figure B. 6: Rheological Testing of HA at Ambient Conditions
0
5
10
15
20
25
1
10
100
1000
0 10 20 30 40 50 60 70 80 90
Co
mp
lex
Vis
cosi
ty
Log
Mo
du
lus
(Pa)
Time (min)
G' Pa G'' Pa
η* Pa S

85
Figure B. 7: Rheological Testing of HB with 1.2% 925H at Ambient Conditions
0
10
20
30
40
50
60
70
80
90
0.1
1
10
100
1000
0 50 100 150 200
Co
mp
lex
Vis
cosi
ty (
Pa
s)
Log
Mo
du
lus
(Pa)
Time (min)
G' G'' η*

86
Figure B. 8: Rheological Testing of HB with 1.5% 925H at Ambient Conditions
0
20
40
60
80
100
120
140
0.1
1
10
100
1000
0 20 40 60 80 100 120
Co
mp
lex
Vis
cosi
ty (
Pa
s)
Log
Mo
du
lus
(Pa)
Time (min)
G' G''
η*

87
Figure B. 9: Rheological Testing of HB with 1.7% 925H at Ambient Conditions
0
20
40
60
80
100
120
140
0.1
1
10
100
1000
0 50 100 150 200
Co
mp
lex
Vis
cosi
ty (
Pa
s)
Log
Mo
du
lus
(Pa)
Time (min)
G' PaG'' Paη* Pa s

88
Figure B. 10: Rheological Testing of HB with 2.0% 925H at Ambient Conditions
0
10
20
30
40
50
60
0.1
1
10
100
1000
0 20 40 60 80 100 120 140 160
Co
mp
lex
Vis
cosi
ty (
Pa
s)
Log
Mo
du
lus
(Pa)
Time (min)
G' G'' η*

89
Figure B. 11: Complex Viscosity of HA with Varying 925H Concentration
0
20
40
60
80
100
120
140
0 50 100 150 200
Co
mp
lex
Vis
cosi
ty (
Pa
S)
Time (min)
1.20%
1.50%
1.70%
2.00%

90
Figure B. 12: Rheological Testing of HB with 1.5% HDP-75 at Ambient Conditions
0
10
20
30
40
50
60
70
0.1
1
10
100
1000
0 20 40 60 80 100 120 140
Co
mp
lex
Vis
cosi
ty (
Pa
S)
Log
Mo
du
lus
(Pa)
Time (min)
G' G'' η* Pa S

91
Figure B. 13: Rheological Testing of HB with 1.7% HDP-75 at Ambient Conditions
0
10
20
30
40
50
60
0.1
1
10
100
1000
0 20 40 60 80 100 120
Co
mp
lex
Vis
cosi
ty (
Pa
S)
Log
Mo
du
lus
(Pa)
Time (min)
G' G'' η* Pa S
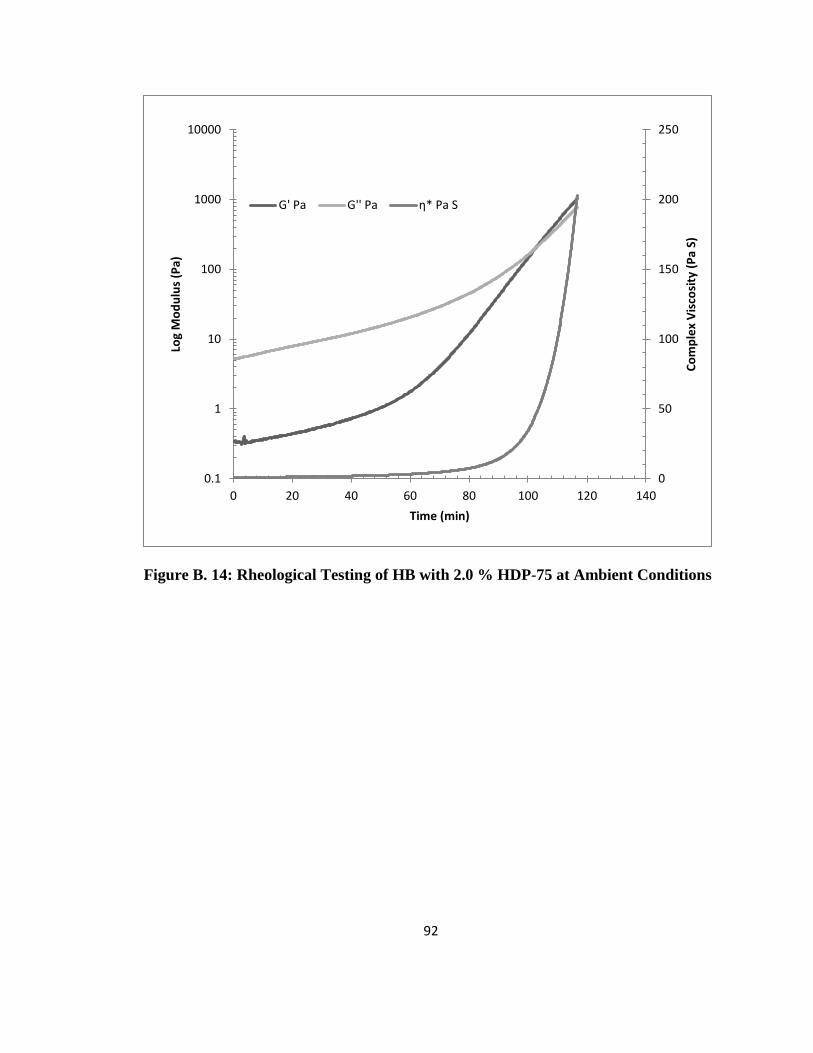
92
Figure B. 14: Rheological Testing of HB with 2.0 % HDP-75 at Ambient Conditions
0
50
100
150
200
250
0.1
1
10
100
1000
10000
0 20 40 60 80 100 120 140
Co
mp
lex
Vis
cosi
ty (
Pa
S)
Log
Mo
du
lus
(Pa)
Time (min)
G' Pa G'' Pa η* Pa S

93
Figure B. 15: Complex Viscosity of HB with Varying HDP-75
0
50
100
150
200
250
0 20 40 60 80 100 120 140
Co
mp
lex
Vis
cosi
ty (
Pa
S)
Time (min)
1.50%
1.70%
2.00%

94
APPENDIX C: BLADE INITIATOR VISCOSITY PROFILES
Figure C.1: This figure displays the complex viscosity profile of HDP-75 at various
mass concentrations
0.1
1
0 50 100 150 200 250 300
Co
mp
lex
Vis
cosi
ty (
Pa
S)
Time (min)
1.20%
1.50%
1.70%
2.00%

95
Figure C.2: This figure displays the complex viscosity profile of MCP-21 at various
mass concentrations
0.1
1
0 50 100 150 200 250
Co
mp
lex
Vis
cosi
ty (
Pa
S)
Time (min)
1.20%
1.50%
1.70%
2.00%
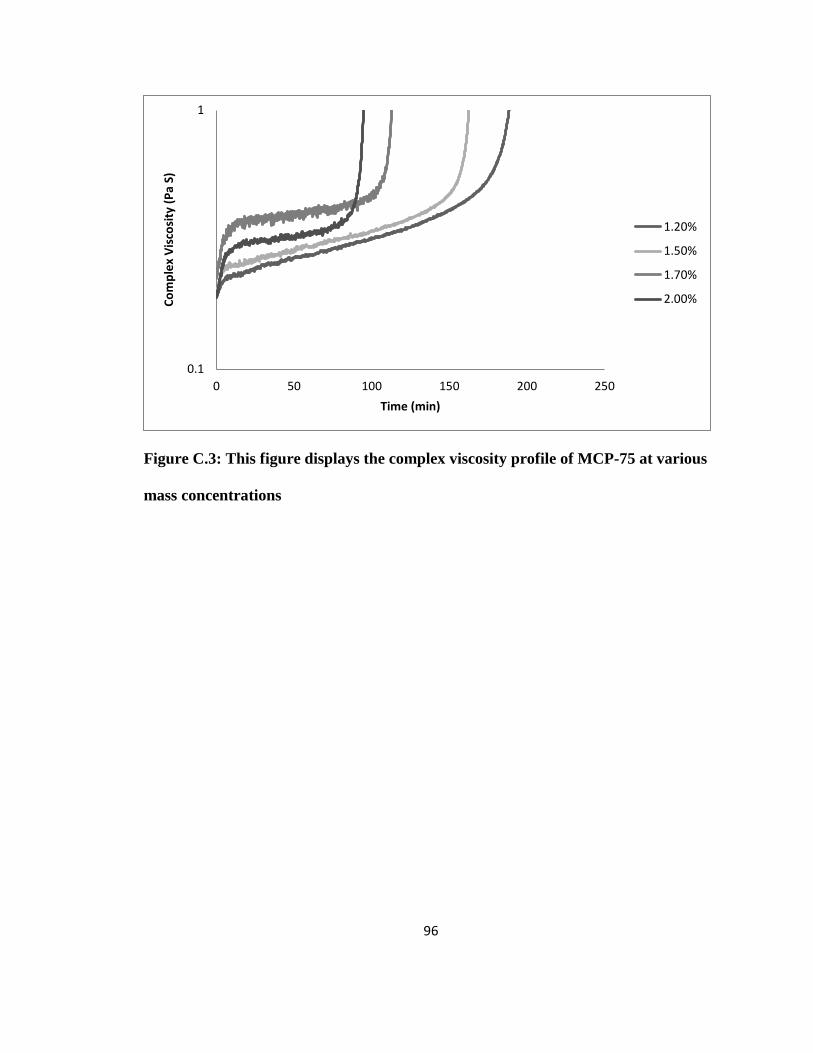
96
Figure C.3: This figure displays the complex viscosity profile of MCP-75 at various
mass concentrations
0.1
1
0 50 100 150 200 250
Co
mp
lex
Vis
cosi
ty (
Pa
S)
Time (min)
1.20%
1.50%
1.70%
2.00%

97
Figure C.4: This figure displays the complex viscosity profile of Norox 757 at
various mass concentrations
0.1
1
0 10 20 30 40 50 60 70 80
Co
mp
lex
Vis
cosi
ty (
Pa
S)
Time (min)
1.20%
1.50%
1.70%
2.00%

98
Figure C.5: This figure displays the complex viscosity profile of PULCAT at various
mass concentrations
0.1
1
0 50 100 150 200
Co
mp
lex
Vis
cosi
ty (
Pa
S)
Time (min)
1.20%
1.50%
1.70%
2.00%

99
REFERENCES
[1] LM Wind Power - Together We Capture the Wind to Power a Cleaner World -
LM Wind Power. Web. 10 July 2011. <http://lmwindpower.com>.
[2] "King James Bible Online." KING JAMES BIBLE ONLINE. N.p., n.d. Web. 22
June 2012. <http://www.kingjamesbibleonline.org/>. Exodus 5:7
[3] Johnson, Todd. "History Of Composites." About.com Composites / Plastics. N.p.,
n.d. Web. 22 June 2012.
<http://composite.about.com/od/aboutcompositesplastics/a/HistoryofComposites.
htm>.
[4] Daniel, Isaac M., and Ori Ishai. Engineering Mechanics of Composite Materials.
2nd ed. New York: Oxford UP, 2006. Print.
[5] "Utility Scale Land Based 80-Meter Wind Maps." Wind Powering America:. N.p.,
16 May 2012. Web. 14 June 2012.
<http://www.windpoweringamerica.gov/wind_maps.asp>.
[6] Reichhold Inc. Polylite 413-M912 TDS. Reichhold 2005. Print.
[7] Goodman, Sidney H. "4 Unsaturated Polyester and Vinyl Ester Resins."
Handbook of Thermoset Plastics. 2nd ed. Park Ridge, N.J., U.S.A.: Noyes
Publications, 1998. Print.
[8] Lambrych, Kevin. "Resin Chemistry of the Non-Chemist." Proc. of Composites
2010, Mandalay Bay, Las Vegas. Print.

100
[9] "Polymer Composites." Polymer Science Learning Center. Web. 10 July 2011.
<http://www.pslc.ws/macrog/composit.htm>.
[10] Elgun, Serdar Z. "Composites." Composites. N.p., 19 Nov. 1999. Web. 09 July
2012. <http://info.lu.farmingdale.edu/depts/met/met205/composites.html>.
[11] "Composite Repair." Hexcel Composites. Hexcel Composites, Duxford, Apr.
1999. Web. 10 July 2011.
[12] Franck, A. J., ed. Understanding Rheology of Thermosets. Comp. TA Instruments.
Article.
[13] Gutowski, Timothy George Peter. Advanced Composites Manufacturing. New
York: Wiley, 1997. Print.
[14] "2,4-Toluene Diisocyanate." EPA. Environmental Protection Agency, 6 Nov.
2007. Web. 14 June 2012. <http://www.epa.gov/ttn/atw/hlthef/toluene2.html>.
[15] Reichhold Inc. Hydrex 33260-25 TDS. Reichhold, 2009. Print.
[16] Reichhold Inc. Hydrex 33350-99 TDS. Reichhold, 2009. Print.
[17] Interplastic Corp. CoREZYN CORVE8121LH-30 TDS. Interplastic, 2009. Print.
[18] Ashland Performance Materials. MSDS Derekane 603-200. Ashland Performance
Materials, 2010. Print.
[19] Hexion Specialty Chemicals. MSDS 155-0351. Hexion Specialty Chemicals,
2010. Print.
[20] Hexion Specialty Chemicals. MSDS 785-7066. Hexion Specialty Chemicals,
2010. Print.
[21] LM Wind Power. LM CI-00096/A1. DSC Control Instruction.

101
[22] De La Caba, Koro, Pedro Guerrero, Iñaki Mondragon, and José M. Kenny.
"Comparative Study by DSC and FTIR Techniques of an Unsaturated Polyester
Resin Cured at Different Temperatures." Polymer International 45.4 (1998): 333-
38. Print.
[23] Syrgis Performance Initiators. Standard MEKP Products. Syrgis Performance
Initiators. Print.
[24] Syrgis Performance Initiators. Norox 925H PDS. Syrgis Performance Initiators.
Print.
[25] Syrgis Performance Initiators. Norox HDP-75 PDS. Syrgis Performance
Initiators, 2007. Print.
[26] ASTM D 5528 Mode I Interlaminar Fracture Toughness of Unidirectional Fiber
Reinforced Plastics. ASTM Standard.
[27] Bohme, Gerhard, Robert Nali, Andrew G. Onken, Brian M. Tande, Balaji
Jagimoggala, and Ramachandran Mahadevan. Hexion Conference Call.
Conference Call.
[28] Delacaba, K., P. Guerrero, A. Eceiza, and I. Mondragon. "Kinetic and
Rheological Studies of an Unsaturated Polyester Cured with Different Catalyst
Amounts." Polymer 37.2 (1996): 275-80. Print.
[29] Fink, Denny, and Andrew G. Onken. Syrgis Conference Call. Conference Call.
June 24th
, 2010.
[30] Formulas Shear Strain-Controlled Instruments.

102
[31] Franck, A. J., and W. Kunze. "Synergy of the Combined Application of Thermal
Analysis and Rheology in Monitoring and Characterizing Changing Processes in
Materials." Comp. TA Instruments. Web.
[32] Goodman, Sidney H. "4 Unsaturated Polyester and Vinyl Ester Resins."
Handbook of Thermoset Plastics. 2nd ed. Westwood, NJ: Noyes Publications,
1998. Print.
[33] Goodman, Sidney H. "7 Thermoset Polyurethanes." Handbook of Thermoset
Plastics. 2nd ed. Westwood, NJ: Noyes Publications, 1998. Print.
[34] Kirschling, Chris, and Andrew G. Onken. Reichhold Conference Call. Conference
Call.
[35] Nali, Robert. 785-7066 RT Gel Time Data. Raw data.
[36] Syrgis Performance Initiators. Product Cross Reference List. Syrgis Performance
Initiators. Print.
[37] Fink, Dennis. Optimizing Peroxide Performance for Vacuum Infusion.
Composites 2006 Conventions and Trade Show. October 18-20, 2006.
[38] Lambrych, Kevin, Brian M. Tande, Andrew G. Onken, and Eric Powell. Ashland
Conference Call. 21 June 2010. Conference Call.