development of a strain gage signal analysis technique …
TRANSCRIPT

DEVELOPMENT OF A STRAIN GAGE SIGNAL ANALYSIS TECHNIQUE TO
DETERMINE TIME OF RIB FRACTURE IN THORACIC IMPACTS
Undergraduate Honors Thesis
Presented in Partial Fulfillment of the Requirements for
Graduation with Distinction
at The Ohio State University
By
Anthony Vergis
The Ohio State University
2011
Defense Committee:
Professor John Bolte, Adviser
Instructor Amanda Agnew
Dr. Richard Hughes

ii
ABSTRACT
In 2010, 32,788 fatalities occurred due to automobile accidents, with a large portion of
fatalities resulting from thoracic injuries. Data gathered from research on post mortem human
surrogates (PMHS) can be used to improve the biofidelity of crash test dummies, a tool used to
increase the safety of today’s automobiles. The Injury Biomechanics Research Laboratory
(IBRL) at The Ohio State University has conducted 13 PMHS tests to determine the response of
the body to thoracic impacts. Strain gauges were attached to ribs to measure strain and predict
the time of fracture of the ribs during the impact. However, upon initial inspection, the strain
signals were not a reliable predictor of time of fracture. The purpose of this study was to analyze
the strain gauge signals from previous tests to determine a quantitative measure that would signal
if a fracture occurred or not. In this study, signals were compared to autopsy reports, which
revealed the locations of actual fractures on the ribs. Single rib fracture studies were also
completed, where ribs with strain gauges were broken ex vivo under the view of a high speed
camera. From these tests, the strain gauge signal can be directly compared to the time of fracture,
because the initiation of the fractures is evident on the video. Results from these tests and
analysis of prior data show that there is correlation between the slope and strain drop-off in the
signals and the time of rib fracture in the PMHS. The resulting quantitative analysis of the strain
signals can be used to predict time of failure of ribs in past and future tests so proper injury
predicting criteria of the thorax can be determined and used to improve the biofidelity of crash
test dummies.

iii
Dedicated to my mother for continually supporting me through my college education and
giving me the occasional wakeup call so I never missed an exam

iv
Acknowledgements:
I would first like to thank my advisor, Dr. John H. Bolte IV for his continued help with
supporting my research, and helping me with all my questions throughout the years. I would also
like to support Amanda Agnew and Yun-Seok Kang for providing me direction and helping to
mentor me through the research process. I would also like to thank Dr. Hughes for reviewing my
thesis and helping me complete this research in physics with an engineering laboratory. I would
next like to thank Rod Herriott, Kevin Moorhouse, Heather Rhule, and all other employees at
NHTSA VRTC and TRC who have helped to support the project that I have been completing.
Finally, I would like to thank Julie Bing, Hannah Gustafson, Kyle Icke, Matt Kremer, Matt
Long, Austin Meek, Brian Suntay, and all other people involved with the Injury Biomechanics
Research Lab at The Ohio State University for helping to complete tests and answering questions
for me along the way.

v
Table of Contents
Chapter 1: Introduction 1
Chapter 2: Background 4
o 2.1 Thorax Anatomy 4
o 2.2 Clinical Significance 8
o 2.3 Strain 8
o 2.4 The Strain Gage 10
Chapter 3: Literature Review 11
Chapter 4: Methods 14
o 4.1 Original Thoracic Impact Summary 14
o 4.2 Human Rib Strain Gage Procedures 18
o 4.3 Ex vivo Tests 22
o 4.4 Data Analysis 24
Chapter 5: Results 26
o 5.1 13 Thoracic Test Results 26
o 5.2 Quantitative Analysis of Thorax Data 34
o 5.3 Ex vivo Testing 37
o 5.4 Recent Thorax Test 42
o 5.5 Binary Logistic Regression 44
Chapter 6: Discussion 46

vi
o 6.1 Discussion 46
o 6.2 Improvements 49
o 6.3 Future Work 49
Chapter 7: Conclusions 51
References 52
Appendix A: Autopsy Report 54
Appendix B: Rib Data Sheet 58

vii
List of Tables
Table 4.1 19
o Strain Gage Application Matrix
Table 5.1 32
o Time of Fracture Estimates
Table 5.2 35
o Correctly Predicted Fractures
Table 5.3 35
o Correctly Predicted Non-Fractures
Table 5.4 37
o Incorrectly Predicted Signals
Table 5.5 40
o Ex vivo Testing Data
Table 5.6 41
o Gage to Fracture Distance Data
Table 5.7 44
o 1101 Test Strain Gage Data
Table 6.1 48
o Binary Logistic Regression Statistics

viii
List of Figures
Figure 2.1 5
o Thoracic Cavity [7]
Figure 2.2 6
o Bony Thorax [7]
Figure 2.3 7
o Human Rib [6]
Figure 2.4 10
o Coil Patterns on Strain Gage [10]
Figure 3.1 12
o Duma et al. Strain Gage Placement [4]
Figure 4.1 16
o 3aω block
Figure 4.2 17
o Pre-Test Setup for 1001LTH45L01
Figure 4.3 18
o Autopsy of Rib Cage after Test 1001LTH45L01. There were no fractures
Figure 4.4 20
o Prepared Strain Gage for test 1001LTH45L01
Figure 4.5 21

ix
Gages Being Applied to Ribs
Figure 4.6 23
o Pendulum Test Setup
Figure 4.7 23
o Rib After Testing
Figure 4.8 25
o Example Signal
Figure 5.1 27
o 0802LTH45L01 Rib Strain Data
Figure 5.2 28
o 0803OTH45L01 Rib Strain Data
Figure 5.3 28
o 0804OTH45L01 Rib Strain Data
Figure 5.4 29
o 0902LTH45L01 Rib Strain Data
Figure 5.5 29
o 0903LTH45L01 Rib Strain Data
Figure 5.6 30
o 0905LTH55L01 Rib Strain Data
Figure 5.7 30
o 1001LTH45L01 Rib Strain Data

x
Figure 5.8 31
o 1002LTH45L01 Rib Strain Data
Figure 5.9 31
o 1003LTH45L01 Rib Strain Data
Figure 5.10 33
o Unpredictable Data
Figure 5.11 38
o HRB01 Data
Figure 5.12 38
o HRB02 Data
Figure 5.13 39
o HRB03 Data
Figure 5.14 39
o HRB04 Data
Figure 5.15 41
o Distance from Gage to Fx. Vs. Strain Rate
Figure 5.16 42
o 1101OTH25L01 Strain Gage Data
Figure 5.17 42
o 1101LTH25R02 Strain gage Data
Figure 5.18 43

xi
o 1101OTH45R03 Strain Gage Data
Figure 5.19 43
o 1101LTH45L04 Strain Gage Data
Figure 5.20 45
o Binary Logistic Regression

1
Chapter 1: Introduction
In 2010, 32,788 fatalities occurred due to automobile accidents, with a large portion of
fatalities resulting from thoracic [9]. Two factors that contribute to thoracic injury fatalities are
pneumothorax and flail chest [2]. Both of these can be caused by damage to the bony rib cage.
Flail chest especially is caused by multiple fractures in ribs. Due to this knowledge, it is
becoming increasingly more important to study the dynamics of the thorax in a collision situation
so that restraints can be developed that will prevent these life threatening thoracic injuries. Much
of the testing is performed on Anthropomorphic Test Devices (ATDs).
Anthropomorphic Test Devices, which are commonly referred to as “Crash Dummies,”
are used in automotive safety research to predict responses of the human body during automobile
collisions. These ATDs contain sensors that can measure forces, compressions, and angular
rotations at multiple points throughout the ATD. However, it is not possible to know what the
injury thresholds are for humans solely based on those data. Therefore post mortem human
surrogate (PMHS) testing is performed to gain the response of the human body to different
injurious impact events. These PMHS are obtained through willed body and body donor
programs at various universities and hospitals. After being tested to make sure that a PMHS is
safe and is representative of the population, it can be used in testing to determine the injury
thresholds and dynamic response of the body to an impact. Long et al at The Ohio State
University Injury Biomechanics Research Lab (IBRL) have been comparing the response of a
PMHS between lateral and oblique impacts with a pneumatic ram [8].

2
A secondary study of the test is to determine the time of rib fracture during the impact.
This is important because it can reveal the force and compression of the chest at the time that the
rib failed so that the best predictors of injury during an impact can be developed. In order to
determine the time of rib fractures, Vishay strain gages were applied to the ribs, and the strain
was measured throughout various thoracic impacts. However, throughout these tests, it was not
always easy to predict the time of fracture from the signal. Having the autopsy report helped to
determine the presence of a fracture, but the signals were difficult to use qualitatively.
Because it is difficult to obtain a PMHS, The Ohio State Injury Biomechanics Research Lab has
started testing multiple times on a subject. However, multiple impacts cannot be completed if a
rib has fractured. In the scenario of multiple tests, an autopsy cannot be performed in between
the two tests, because it will damage the PMHS. Therefore, reliable strain gage signals are
needed to determine whether or not a fracture occurred so testing can either continue or cease.
The goal of this study is to develop a quantitative method to predict the likelihood of a rib
fracture based on the strain gage signal and to compare results with results from ex vivo human
rib testing to strengthen the conclusions about rib fractures in thoracic impact tests. This will be
performed by completing the following objectives. The objectives of this study are as follows:
Analyze strain gage data from the first 13 thoracic tests to determine a quantitative
method to predict whether or not a rib fractured during the thoracic impact test before
conducting an autopsy
Analyze results from 4 ex vivo rib fracture pendulum tests to compare the signals from
the thoracic data to signals where the fracture is visible and unobstructed
Compare a recent thoracic test which used the new Vishay Strain Gages without exposed
leads

3
Use data from all tests to support the quantitative method developed for the thoracic data

4
Chapter 2: Background
This chapter will discuss the gross anatomy and related clinical knowledge about the
thorax and ribs. It will also discuss strain and the strain gage.
2.1 Thorax Anatomy
The human thorax is the region of the human body most notable for containing the heart
and lungs. It is bordered laterally on both the right and left side by the upper limbs. It is bordered
superiorly by the neck and inferiorly by the diaphragm, which is a muscle separating the thorax
from the abdomen. Figure 2.1 depicts the thorax deep to the thoracic wall. The thorax contains
some of the most vital organs in the human body. The lungs are located laterally in Figure 2.1,
and they are responsible for the exchange of oxygen and carbon dioxide in the blood stream as a
person breathes. The heart is located in the pericardial cavity. It is responsible for transporting
blood throughout the body. The arteries associated with the heart transport oxygenated blood
throughout the body, and the veins transport deoxygenated blood back to the heart, with the
exception of the pulmonary artery and vein. The pulmonary artery transports deoxygenated
blood from the heart to the lungs, and the pulmonary veins transport oxygenated blood from the
lungs to the heart. Also found deep to the thoracic wall are the esophagus and trachea. The
trachea is anterior to the esophagus and transports air to and from the lungs, and the esophagus
transports food to the stomach in the abdominal cavity as part of the digestive system.

5
The thoracic wall is depicted in Figure 2.2 and consists of the bony thorax. The bony
thorax consists of 12 thoracic vertebrae as the posterior portion of the thoracic wall. Articulating
with the vertebrae are 12 ribs, which form the oblique portion of the thoracic wall. Ribs 1-7,
which are the 7 most superior ribs, are true ribs, ribs 8-10 are false ribs, and ribs 11 and 12 are
floating ribs. The coastal cartilage, a type of hyaline cartilage articulates ribs 1-10 with the
sternum in the anterior portion of the thorax. True ribs have costal cartilage that directly
articulates with the sternum. False ribs have coastal cartilage that articulates with the coastal
Figure 2.1: Thoracic Cavity [7]

6
cartilage of rib 7 to connect to the sternum. The floating ribs do not have coastal cartilage
attached to them. The sternum consists of the manubrium superiorly, the sternal body medially,
and the xiphoid process inferiorly. In the intercostal spaces, the spaces between the ribs lay
muscles, arteries, veins, and nerves. The muscles that are involved in exhalation, the depression
of the rib cage, are the internal intercostal muscles, the transverse thoracis muscles, and the
serratus posterior inferior muscle. The muscles that are involved in inhalation, the elevation of
the rib cage are the scalene muscles, external intercostal muscles and the serratus posterior
superior muscle.
As seen in Figure 2.3, each rib contains multiple distinctions. The head of the rib is the
portion of the rib closest to the vertebrae. The neck is the flattened portion adjacent and lateral to
Figure 2.2: Bony Thorax [7]

7
the head. The eminence lateral to the neck is the tubercle of the rib. The tubercle of the rib
articulates with the vertebra through ligaments. Lateral and anterior to the tubercle is the costal
angle, where the greatest curvature of the rib occurs. The body makes up the rest of the rib. Also
included in the external structure of the rib is the costal groove, which is an elevated, flattened
portion of the rib that runs along the inferior border of the rib. The superficial surface of the rib
can also be called the cutaneous surface, and the deep surface can be called the pleural surface,
since this portion rests against the lungs. Like all bones, the external surface, the cortical bone, is
much harder and more solid than the inner bone. This trabecular bone is a meshwork material of
bony matter and is less dense than cortical bone.
Figure 2.3: Inferior View: Human Rib [6]

8
2.2 Clinical Significance
Fractured ribs can be a problem for numerous reasons in trauma situations. One of the
most prevalent problems caused by fractured ribs is flail chest, defined by multiple fractures in
the rib cage, Flail chest is a condition where a person cannot breathe as easily as normal. One
reason for this is because the thoracic wall does not contract and relax properly while breathing.
However, it is not this breathing deficiency that generally causes fatalities in people who suffer
flail chest. It is usually the pulmonary contusion that occurs along with the flail chest that causes
enough structural damage to the lungs to increase the risk of fatal injuries. Autopsy confirmation
of deaths occurring directly because of flail chest is usually difficult because a thoracic injury
that fractures ribs is usually accompanied by other severe injuries. Borman et al showed that
there is an increased mortality rate when flail chest accompanies other extrathoracic injuries.
When a thoracic trauma fatality is related to complications resulting from flail chest, the death
usually happens within 24 hours. Fatalities involving flail chest are also more likely to occur in
elderly people. With current medical procedures, flail chest can be treated if it can be addressed
before death [2].
2.3 Strain and the Strain Gauge:

9
Strain can be defined as a measurement of deformation of a material. At a rest, there is
zero strain on an object. However, when a force is applied to an object and deformation occurs,
strain builds up in the object. Stress is the specific acting power that causes strain. Stress is
measured as a force applied over a given area and has the same units as pressure (N/m2). A stress
on an object causes a strain in the object, which is the resulting deformation. The strain can be
measured as the change in length divided by the original length of the material. This makes the
strain a unitless measure. A derived unit, strain, can be referred to as a strain of 1. However,
most measurements of strain are taken in micro-strain, because deformations are usually much
smaller. A micro strain is the strain multiplied by 106. Stress and strain can be related by
Young’s modulus, which is seen in equation 1 below.
1. E = stress/strain (2.1)
2. F =(E A0 ΔL)/L0 (2.2)
where F is the force applied, E is Young’s modulus, A0 is the original cross sectional
area, ΔL is the change in length and L0 is the original length
In a material, strain continues to build until the material fails. In this case, the strain
decreases. If the force stops being applied, it will return to its normal zero value. The strain
decreased because of either a break of a structural change in the material. In human ribs, the rib
will fracture when enough strain is placed on it.

10
2.4 The Strain Gage
In general, a strain gage is a sensor that can determine the strain placed on an object that
it is in direct contact with. On the face of the gage that is attached to the rib, there is a coil of a
conductor. As electrical current flows through the conductor, the resistance can be measured.
When strain occurs, the face of the strain gage changes shape, and a reduction or increase in the
resistance of the coiled conductor ensues. Tension placed on the gage increases the resistance,
and compression on the gage reduces the resistance. Figure 2.4 demonstrates the coils in the
gage. As the current flows through the wire, the changes in resistance can be indirectly
measured, and after a conversion factor is applied, the strain can be determined from this change
in resistance [10].
Figure 2.4: Coil Patterns on Strain Gages [10].

11
Chapter 3: Literature Review
There have been multiple studies analyzing rib fracture testing in impact studies. These
tests have used multiple different application methods, gained multiple results, and have used
different instruments to determine fracture timing. This study has been done in conjunction with
results that were gained during a study completed by Matt Long at The Ohio State University
Injury Biomechanics Lab. Concurrently a study was conducted at the Virginia Tech-Wake Forest
Center for Injury Biomechanics that also used strain gages in a thoracic study to determine time
of fracture. Another study has conducted rib fracture time analysis with piezoelectric transducers
(PZTs). Research has also been done on single rib tests, showing properties of the human ribs
and fracture patterns.
Much of this study has been done in parallel with the thoracic testing that was performed
by Long et al. Long et al performed 9 PMHS tests of the thorax, all of which were included in
the results of this study. In this study, the method for determining the time of fracture was to use
the autopsy to determine how many fractures occurred at each rib. The next step was to
qualitatively look at the strain gage signal to determine a sudden value change in the data. No
comparison was made between regression slopes or maximum strain values and fracture, but
fracture time estimates could still be determined because it was already known whether or not a
fracture event was present in the signal because of autopsy reports. The point of fracture was
defined as the point before a large drop-off in strain [8].

12
Duma et al also tested for rib fracture times with strain gages in thoracic impacts. In
2003, Duma et al performed a dynamic belt loading on the thorax of two PMHS. 47 strain gages
were used on each subject’s ribs. In this testing the skin was removed from the thorax and the
strain gages were applied to each rib after this was completed. Gages were adhered along the
axis of the rib and were relieved of tension in the wiring through wire ties around the rib as seen
in Figure 3.1 [3,4].
This figure shows the placement of the gages on the ribs, which was possible because the
skin and subcutaneous tissue was removed from the thorax in one cut. The other major difference
between the application of strain gages between the testing of Long et al and of Duma et al was
Figure 3.1: Duma et al Strain Gage Placement [4]

13
that Duma et al used an acidic solution to etch into the rib after clearing the surface and then
neutralizing it with a basic solution. After obtaining results, multiple measurements were
recorded. Maximum strain, time of maximum strain, and the strain rate were all recorded. The
definition of the strain rate in this testing was determined by using the portion of the strain graph
during loading that fit a linear regression best. This analysis showed a wide range of values
between both the maximum strain and the strain rate. The signals after the peak were left out in
case the strain gage broke or was detached from the rib after the rib fracture. The final
determination of fracture was still found qualitatively as a “sudden drop in strain” signal [3,4].
Trosseille et al also looked at the strain and strain rate in tests where strain gages were
applied to ribs during thoracic impacts. Maximum absolute strain and maximum absolute strain
rate were compared to one another. In this study, it was determined that the fractured ribs had
generally larger maximum absolute strains and maximum absolute strain rates than the non-
fractured ribs. This test used filtered results, which allowed the maximum absolute strain rate to
be studied. This study used up to 98 strain gages on each of 8 PMHS. A set strain rate for
fracture prediction was not defined [11].
Because of time, cost, and sensitivity concerns with strain gages, Gabrielli et al set out to
create a new method to determine rib fracture times that did not have the same problems the
strain gage technology has. This study set out to use a different instrument for rib fracture time
determination, piezoelectric transducers (PZTs). PZTs are instruments that convert deformations
into a measurable change in voltage by detecting mechanical vibrations. Gabrielli et al were able
to determine a range of frequency signals for the mechanical vibrations that correlated to
fractures on both the instrumented rib and an adjacent rib. This study still has many limitations
though. The signals cannot tell which adjacent rib the fracture is located on, so PZTs would have

14
to be used on most or all ribs still to determine a fracture times with confidence. While this new
instrumentation has promise for the future to alleviate difficulty understanding strain gage data,
this new technique still has limitations which must be minimized [5].

15
Chapter 4: Methods
This chapter contains four sections. The first section is a brief overview of the overall
thoracic tests in which the strain gages were used. The second section contains a more in depth
look at the application of strain gages throughout testing. The third section details the ex vivo rib
tests. Finally, the fourth section details data analysis.
4.1 Original Thoracic Impact Summary
Fourteen thoracic impact trials were conducted in which strain gages were used to
determine the time of rib fracture. For each of the tests, after a subject was received, the subject
was first anzlyzed to make sure it was a usable subject, because every PMHS had to be
representative of the human population. Blood tests or medical histories were analyzed to ensure
the safety of lab personnel. A Body Mass Index (BMI) test was completed by utilizing the
weight and height of the PMHS. Subjects were only accepted if they fell within the normal or
overweight range in the BMI logarithm. After this was performed, a bone mineral density
(BMD) scan was performed on each PMHS. This test was performed to ensure that subjects were
not osteoporotic, because osteoporotic bones are much weaker than healthy bones and would not
be representative of the population. Other abnormalities in the subjects were also recorded so
that if any abnormal results occurred because of them, they would be noted as a potential reason.
After the subject was cleaned and prepared, it was instrumented. Angular Rate Sensors
and Accelerometers were attached to subjects. They were placed on 3aω blocks (Figure 4.1).

16
Each of these blocks contained three accelerometers and three angular rate sensors. They were
placed on the sternum and the T4 vertebra to measure the accelerations and angular motions of
the subject during the impact.
After the subject was instrumented, it underwent a CT scan to determine any pre-impact
injuries and to use as an injury comparison to a post-test CT scan. After this, the subject was
placed on a table in a seated position. The subject was positioned into the proper position, and
then coordinates of the subject were measured with a FARO device. High Speed Cameras were
setup before the test to capture the impact. After all was set up, the PMHS was impacted either
laterally or obliquely in the thoracic region. A SIPU device was placed next to the PMHS to
prevent it from falling onto the ground and producing further injury. The impact was performed
by a pneumatic ram. On the ram was a load cell that could measure the force of the ram on the
body throughout the duration of the impact. Throughout the setup before the test, and after the
Figure 4.1: 3aω block

17
test, camera still photographs were taken, and during the test, a handheld camera also recorded
the impact. Figure 5.3 shows the test setup.
Figure 4.2: Pre-Test Setup for 1001LTH45L01

18
After impact, an autopsy was performed, paying attention to rib fractures, the ligementum
arteriosum, the heart, blood vessels, the lungs, the thoracic vertebrae, and the thoracic muscles.
Figure 4.3 shows the thoracic cage during the autopsy. Appendix A has a sample autopsy report
[8].
4.2 Human Rib Strain Gage Procedures:
For each of the 14 thoracic impact tests, different amount of strain gages were applied to
different ribs. The strain gage matrix below demonstrates what type of strain gage preparation,
strain gage, and which ribs were used in each test.
Figure 4.3: Autopsy of Rib Cage after Test 1001LTH45L01. There were no fractures.

19
Table 4.1: Strain Gage Application Matrix
Test Number Model Gage Taping Silicone Incision Ribs with Gages
801 N/A N/A N/A N/A N/A
802 Gen Purpose none none 1 long L5-L10; R5-R10
803 Gen Purpose none none 1 long L5-L10; R5-R10
804 Gen Purpose none none 1 long L5-L10; R5-R10
901 Gen Purpose taped none 1 per rib L3-L10; R3-R10
902 Gen Purpose taped none 1 per rib L3-L10; R3-R10
903 Gen Purpose taped none 1 per rib L3-L10; R3-R10
904 Gen Purpose taped none 1 per rib L3-L10; R3-R10
905 Gen Purpose taped none 1 per rib L3-L10; R3-R10
906 Gen Purpose taped none 1 per rib L3-L10; R3-R10
1001 Gen Purpose taped yes 1 per rib L3-L10; R3-R10
1002 Gen Purpose taped yes 1 per rib L3-L10 ant and post
1003 Gen Purpose taped yes 1 per rib L3-L10 ant and post
1101
Gen Purpose without exposed wire none none 1 per rib L3-L10 lat and obl; R3-R10 lat and obl
In general every strain gage was placed on ribs the same way. First, the strain gage had to
be tested and prepared. Vishay General Purpose Strain Gages Item Code 3037385 were used for
every test, and a strengthened model of the same item was used during the last test. First, silicon
was placed on the back of the strain gage, where the leads attached, to ensure the leads would
stay connected to the gage. Next, a piece of labeling tape was placed about 6 inches from the end
of the wire that was used for connection to the data acquisition system. After this was completed,
the wires were separated towards that same end so they could be more easily plugged into the
data acquisition system. Next, the exposed leads of the gage were secured with electrical tape so
that the exposed wire would not fail. This involved placing a strip of tape on each side of the
gage extending from the head of the strain gage, along the leads and to the wiring. This tape was
then cut down in width. After this, another piece of tape was wrapped around the point of
connection between the leads and the wiring. Next the resistance was tested throughout the

20
separate wires to make sure that there was not a short between any electrical connections. After
this was done, a catalyst was applied to the surface of the strain gage that would be attached to
the rib. Figure 4.4 demonstrates a prepared strain gage.
Next the strain gages were attached to the ribs. Slits were cut to expose ribs 3-10.
Whether or not both sides were used is found in the Table 5.1. Data on how many strain gages
were placed on each rib can also be found in this matrix. Slits of approximately 20 cm in length
were cut. Special precaution was made not to cut through intercostal muscles so that the internal
anatomy of the thoracic cage was not compromised. After incisions were made to expose a
lateral or oblique portion of the rib, each exposed rib was cleaned and scraped where the strain
gage would be placed. Some steps above were omitted in some tests. Refer to Table 5.1 to
determine if steps were omitted in any given test. Gages were placed either lateral or oblique
because impacts were made on the lateral or oblique side of the thorax, and the strain gages were
placed where the impact would not happen so that the impacting face would not damage the
strain gage. Once each rib was exposed, a finger of a latex glove was placed over the normal
personal protective gloves on a member of the lab’s finger. The rib was then rubbed with
Figure 4.4: Prepared Strain Gage for test 1001LTH45L01

21
anhydrous diethyl ether to ensure a dry surface was present for the rib. The person next placed
glue on the strain gage and on the finger and glued the gage to the rib. Pressure was applied to
the gage for three minutes. All gages were placed on in the same direction, so the wiring would
all extend from the subject in the same direction. After all gages were placed on the ribs, the
incisions were sutured closed. Figure 4.5 shows gages being placed onto the ribs. The gages were
again tested for resistance in case any gages had failed while placing them on the ribs. The wires
from the gages were bundled with one another and were sutured to the subject so that the gages
would not easily be pulled off the ribs. After the subject was positioned, the wires from the gages
were connected to the data acquisition system.
Figure 4.5: Gages Being Applied to Ribs

22
4.3 Ex vivo Tests
Four human ribs were tested ex vivo in a pendulum fracture test with a custom pendulum
fixture. First, the human ribs were removed from a PMHS and were cleaned off completely so
that there was no flesh left on the bones. Throughout the entire process, the ribs were kept moist
with a saline solution so that they would not dry out and lose their material properties. The ribs
were potted so that they could be secured in the rib fixture. After the ribs were cleaned and
potted, the strain gages were prepared and cleaned. The strain gages were prepared in the same
way that they were prepared for the thoracic impact tests. They were then glued onto the rib.
Four gages were placed on each rib. Two were placed on the cutaneous surface at 30% and 70%
of the rib, and two were placed on the plural surface, also at 30% and 70% of the length of the
rib. All wires were placed in the same direction. The gloves covering the strain gages were
trimmed so that the gages could be seen. After the gages were placed on the ribs, the rib was
placed into the fixture and was impacted. The pendulum acted to compress the rib until it
fractured. High speed cameras were set up to record the fracture event. The test setup can be seen
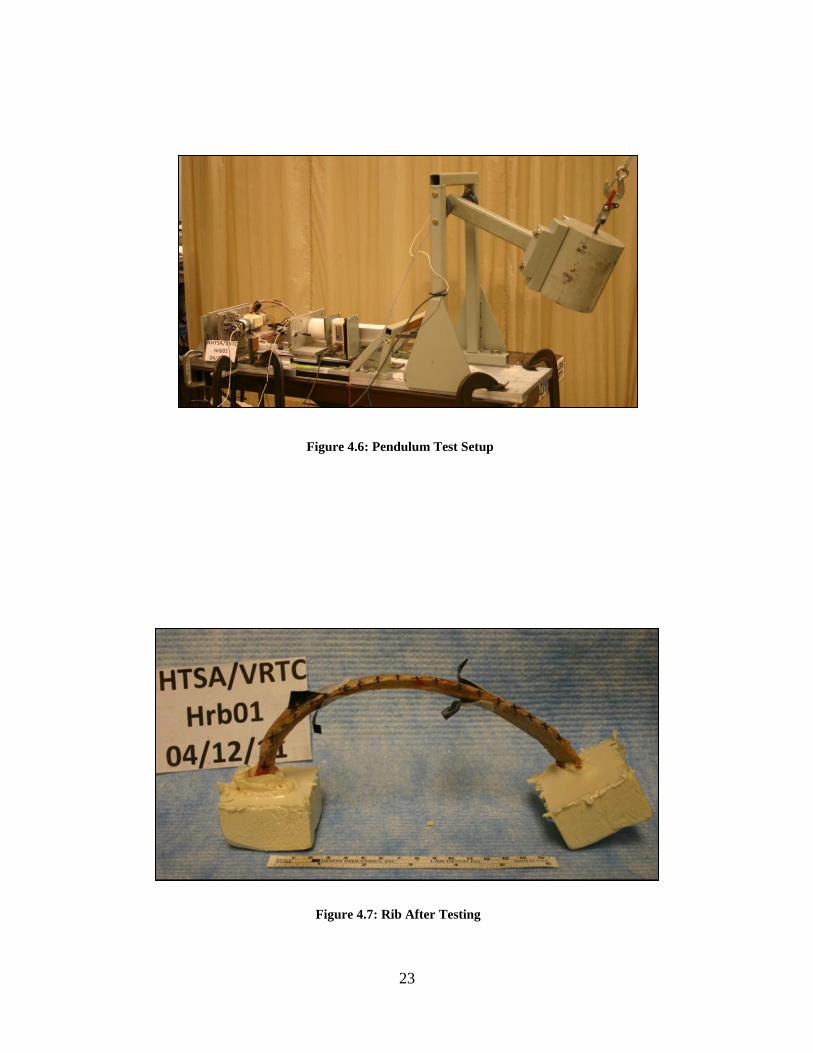
in Figure 4.6. After the rib was impacted, measurements and observations from the rib fracture
were recorded. This process was repeated with all four ribs. The rib after fracture can be seen in
Figure 4.7. Appendix B has a sample data sheet from the ex vivo testing.
23
Figure 4.6: Pendulum Test Setup
Figure 4.7: Rib After Testing

24
4.4 Data Analysis
First a subjective blind study was conducted in order to become more familiar with the
strain gage signals. Without knowing the results of the autopsy, all signals were viewed. First,
failed signals had to be picked out because they did not give reliable data. Failed signals showed
no strain throughout the trial, did not return to a magnitude of strain near 0 after the impact, or
strain results that showed no set pattern of strain. After this was performed, all signals that did
not appear to have failed were analyzed. All signals from the test were analyzed together,
because without scaling the signals together, relative magnitudes of strain could not be noted.
The first thirteen thoracic impact tests were part of the blind study. Predicted time of fracture,
which is defined as the time that correlates to the maximum strain in the subject, was recorded.
Every signal that was analyzed was measured for several characteristics. The decline in
strain after the maximum was looked as a sign of fracture instead of the buildup of strain because
the definition of a fracture is the release of strain. Strain could either be placed on the rib
relatively slowly or quickly, but the rib could still fracture. The definition of the decline in strain
after the maximum is the section of the strain gage chart from maximum to the first local
minimum. The first measurement that was taken from all tests was the maximum strain. Other
measurements that were taken include the maximum magnitude of strain rate after the fracture,
the regression slope of the strain rate after the fracture, the time range of the decline in strain
after the fracture, and the strain range between the maximum and the first local minimum after
the maximum strain. Absolute values were taken for all values because the sign of the strain
depended on whether the surface was being extended or compressed, and for the ex vivo tests, the

25
different surfaces of the bone had different signs. All signals were processed using Microsoft
Office Excel 2010. Figure 4.8 shows an example plot.
0
500
1000
1500
2000
2500
3000
3500
4000
0.00 0.02 0.04 0.06 0.08 0.10
Stra
in (μ
S)
Time (s)
Figure 4.8: Example Plot
Maximum Strain
Strain Rate (Slope)
Local Minimum Strain

26
Chapter 5: Results
This section discusses the various data that were analyzed throughout this study. The
analysis includes the 13 original thoracic impact tests, the four ex vivo trials, and the most recent
thoracic impact test with different strain gages.
5.1: 13 Thorax Tests Strain Gage Results
Strain signals were observed for all tests. Four of the 13 tests were excluded from this
study. Test 0801 was excluded from the study because no strain data was recorded. Test 0901
was excluded because the signals were clipped before reaching maximum strain. Tests 0905 and
0906 were excluded due to signal noise that made it difficult to determine a peak strain. This
study only used non-censored strain results so that results could be applied to future tests before
censoring out noise in the data.
Figures 5.1-5.9 show the strain signals from all gages that did not fail. Failed strain
gages were removed, and they were determined by signals that did not change in magnitude
throughout the test, had major fluctuations throughout the impact, or did not return to zero after
the impact. Tests 1002 and 1003 had two strain gages applied to each rib, one was on the
anterior side of the thorax and the other was on the posterior side of the thorax. Also, the first rib
fracture fail time estimate for each rib that fractured and had a functioning strain gage is listed in
Table 6.1. The fracture time estimate is the first maximum point before a major drop off in strain.

27
Only the time for the first failure is given because the gage could have been detached from the
section of the rib that had the second fracture. For 1003, the times of the fractures are taken from
the anterior gages only, because they had the larger, better defined signals. Table 5.1 lists the
predicted times of fractures for the fractured ribs with good data traces.
-2000
-1000
0
1000
2000
3000
4000
5000
6000
0.00 0.02 0.04 0.06 0.08 0.10
Stra
in (μ
S)
Time (s)
Figure 5.1: 0802LTH45L01 Rib Strain
StrainL6
StrainL7
StrainL9
StrainL10

28
-1500
-1000
-500
0
500
1000
1500
2000
0.00 0.02 0.04 0.06 0.08 0.10
Stra
in (μ
S)
Time (s)
Figure 5.2: 0803OTH45L01 Rib Strain
StrainL6
StrainL7
StrainL8
StrainL9
StrainL10
-1500
-1000
-500
0
500
1000
0.00 0.02 0.04 0.06 0.08 0.10
Stra
in (μ
S)
Time (s)
Figure 5.3: 0804OTH45L01
StrainL9
StrainL10

29
-2000
0
2000
4000
6000
8000
10000
12000
0.00 0.02 0.04 0.06 0.08 0.10
Stra
in (μ
S)
Time (s)
Figure 5.4: 0902LTH45L01 Rib Strain
StrainL3
StrainL5
StrainL7
StrainL8
StrainL10
-6000
-4000
-2000
0
2000
4000
6000
8000
10000
12000
14000
0.00 0.02 0.04 0.06 0.08 0.10
Stra
in (μ
S)
Time (s)
Figure 5.5: 0903LTH45L01 Rib Strain
StrainL3
StrainL4
StrainL5
StrainL6
StrainL7
StrainL8
StrainL9
StrainL10

30
-4000
-2000
0
2000
4000
6000
8000
10000
12000
14000
0.00 0.02 0.04 0.06 0.08 0.10
Stra
in (μ
S)
Time (s)
Figure 5.6: 0904LTH55L01 Rib Strain
StrainL4
StrainL5
StrainL6
StrainL7
StrainL8
StrainL9
-10000
-5000
0
5000
10000
15000
20000
0.00 0.02 0.04 0.06 0.08 0.10
Stra
in (μ
S)
Time (s)
Figure 5.7: 1001LTH45L01 Rib Strain
StrainL3
StrainL4
StrainL6
StrainL7
StrainL9
StrainL10

31
-4000
-2000
0
2000
4000
6000
8000
10000
12000
0.00 0.02 0.04 0.06 0.08 0.10
Stra
in (μ
S)
Time (s)
Figure 5.8: 1002LTH45L01 Rib Strain
StrainL3Ant
StrainL3Pos
StrainL5Ant
StrainL5Pos
StrainL6Ant
StrainL6Pos
StrainL7Ant
StrainL7Pos
StrainL8Ant
StrainL8Pos
StrainL10Ant
-6000
-4000
-2000
0
2000
4000
6000
8000
10000
12000
14000
0.00 0.02 0.04 0.06 0.08 0.10
Stra
in (μ
S)
Time (s)
Figure 5.9: 1003OTH45L01 Rib Strain StrainL3Ant
StrainL3Pos
StrainL4Ant
StrainL4Pos
StrainL5Ant
StrainL5Pos
StrainL6Ant
StrainL6Pos
StrainL7Ant
StrainL7Pos
StrainL8Ant
StrainL8Pos
StrainL9Ant
StrainL10Ant
StrainRL10Pos

32
Table 5.1: Time of Fracture Estimates
Rib Time (s)
0803L6 0.0107
0902L5 0.019
0902L7 0.01875
0902L8 0.00875
0902L10 0.0105
0903L4 0.0249
0903L5 0.01715
0903L6 0.0121
0903L7 0.01035
0903L8 0.0096
0903L9 0.00845
0903L10 0.0081
0904L4 0.016
0904L5 0.0139
0904L6 0.01435
0904L7 0.01625
0904L9 0.016
1003L3 0.02425
1003L4 0.021
1003L5 0.0241
1003L6 0.0329
1003L7 0.0268
Without the autopsy report, it was difficult to determine the signals that showed a fracture
and the signals that did not show a fracture. For example, when looking at individual signals, the
trend in the strain appeared to have the characteristics of a signal that denoted a fracture, but
when the signal was compared to other signals, it no longer did, because of difference in
magnitude of strain. Figure 5.10 below demonstrates this issue.

33
0
1000
2000
3000
4000
0 0.02 0.04 0.06 0.08 0.1
Strain L3
-2000
-1000
0
1000
2000
0 0.02 0.04 0.06 0.08 0.1
Strain L5
-5000
0
5000
10000
15000
0 0.02 0.04 0.06 0.08 0.1
Strain L8
-5000
0
5000
10000
15000
0 0.05 0.1
Stra
in (
μS)
Time (s)
Figure 5.10: Unpredictable Data

34
Three of the individual signals in Figure 5.10 were taken from the same test. This
demonstrates the difficulty of qualitatively predicting fractures. Rib L3 was correctly predicted
to have no fracture. Rib L5 was incorrectly predicted to have fractured. Rib 8 was correctly
predicted to have fractured. The graph at the bottom shows all three signals, all from the same
test, on the same scale. The shapes of the curves look different on different time scales, making it
difficult to make a good prediction qualitatively.
5.2 Quantitative Analysis of Thorax Data
First, eight random strain gage signals that were selected correctly were isolated. Several
statistics were recorded from the signals. Maximum Strain, Strain Range, the maximum
magnitude of slope between any two data points, and a 20% to 80% regression curve were
recorded. The 20% to 80% regression curve is a linear regression plot of the data 20% of the
range from the maximum to local minimum from both the maximum and minimum. Any points
that fell within the 20% to 80% of the strain range were included in this regression plot. These 8
gages were selected to be representative of the greater population of correctly guessed fractured
ribs. Table 652 below shows the data. All time measurements are in seconds. All strain
measurements are in microstrain, and all slope measurements are in microstrain/second.

35
Table 5.2: Correctly Predicted Fractures
test rib time max max strain time min min strain strain range min slope Regression R Squared
902 L8 8.75E-03 1.02E+04 1.20E-02 1.94E+03 8.23E+03 -1.89E+07 -4.23E+06 0.9205
902 L10 1.00E-02 6.15E+03 1.59E-02 -7.74E+02 6.92E+03 -9.52E+06 -9.75E+05 0.9774
904 L4 1.60E-02 1.15E+04 1.97E-02 1.45E+03 1.00E+04 -4.64E+07 -4.64E+07 1.0000
904 L5 1.39E-02 6.25E+03 1.46E-02 -7.25E+02 6.97E+03 -3.49E+07 -3.34E+07 0.9994
904 L6 1.44E-02 5.28E+03 1.55E-02 -3.10E+02 5.59E+03 -2.32E+07 -1.87E+07 0.9734
1003 L4ant 2.10E-02 1.21E+04 2.31E-02 1.54E+03 1.06E+04 -3.50E+07 -2.77E+07 0.9833
1003 L5ant 2.41E-02 8.30E+03 2.80E-02 2.25E+03 6.05E+03 -1.72E+07 -1.62E+07 0.9988
1003 L6ant 3.29E-02 1.16E+04 3.61E-02 8.22E+01 1.15E+04 -4.76E+07 -3.40E+07 0.9681
average 1.76E-02 8.91E+03 2.06E-02 6.82E+02 8.23E+03 -2.91E+07 -2.27E+07 0.9776
minimum 8.75E-03 5.28E+03 1.20E-02 -7.74E+02 5.59E+03 -4.76E+07 -4.64E+07 0.9205
maximum 3.29E-02 1.21E+04 3.61E-02 2.25E+03 1.15E+04 -9.52E+06 -9.75E+05 1.0000
The same was done for signals that were correctly predicted as non-fractured rib signals.
Table 5.3 demonstrates this.
Table 5.3: Correctly Predicted Non-Fractures
test rib time max max strain time min min strain strain range min slope Regression R Squared
902 L3 3.13E-02 3.33E+03 9.46E-02 8.27E+02 2.51E+03 -4.06E+05 -4.59E+04 0.9952
1001 L6 1.63E-02 1.44E+04 9.81E-02 3.58E+03 1.08E+04 -1.80E+06 -2.31E+05 0.9305
1001 L7 1.61E-02 8.25E+03 7.68E-02 -1.22E+03 9.47E+03 -3.14E+05 -2.45E+05 0.9935
1001 L9 8.15E-03 4.20E+03 9.95E-02 -1.01E+03 5.21E+03 -2.57E+06 -1.09E+05 0.9918
1002 L5ant 2.37E-02 2.30E+03 6.90E-02 -4.02E+02 2.70E+03 -1.80E+05 -1.20E+05 0.9958
1002 L6ant 2.23E-02 6.34E+03 7.12E-02 -4.95E+02 6.84E+03 -3.74E+05 -2.72E+05 0.9866
1002 L7ant 2.01E-02 9.43E+03 7.24E-02 -8.83E+02 1.03E+04 -5.82E+05 -3.42E+05 0.9944
1002 L8ant 1.84E-02 6.20E+03 7.14E-02 -1.03E+03 7.23E+03 -3.44E+05 -2.64E+05 0.9960
average 1.95E-02 6.80E+03 8.16E-02 -8.02E+01 6.88E+03 -8.22E+05 -2.04E+05 0.9855
min value 8.15E-03 2.30E+03 6.90E-02 -1.22E+03 2.51E+03 -2.57E+06 -3.42E+05 0.9305
max value 3.13E-02 1.44E+04 9.95E-02 3.58E+03 1.08E+04 -1.80E+05 -4.59E+04 0.9960

36
The data for both the fractured ribs and non-fractured ribs both have a large range in most
of the categories compared. It was determined that any possible criteria to use should not overlap
between the fractured and non-fractured signals. Because of this, the maximum strain was first
eliminated as a choice for determining whether or not a fracture occurred since the maximum
value of 14400 microstrain for the non-fractured ribs was greater than 5280 microstrain for the
minimum of the fractured signals. After this, strain range was also eliminated because again, the
maximum value of 10800 microstrain for the non-fractured ribs was larger than the minimum
value of 5590 microstrain for the fractured ribs. Next, the maximum magnitude of slope between
any two points in the data was looked at. This produced a separated range, but some of the data
had noise in it. Because of this noise, the data would need to be censored to use this maximum
magnitude of slope between any two points. This is because a signal with noise might have
slopes between two points that are not representative of the greater trend. That left the regression
slope to be utilized. Separation exists between the correctly predicted fracture and correctly
predicted non-fracture range.
This data was next applied to incorrectly predicted strain signals to determine whether or
not the quantitative analysis could do what the qualitative analysis could not do. The cutoff used
to determine the range for the regression slope was a magnitude of 659,000 microstrain per
second, which is the average of the maximum magnitude for the non-fractures and the minimum
magnitude for the fractured signal regression plots. This was compared to the incorrectly
fractured signals. The autopsies revealed that 0902L5, 0903L4, and 1003L3Ant all had fractured,
and 0802L6 and 0904L8 had not fractured.

37
This cutoff correctly predicts 1003L3Ant and incorrectly predicts the other signals.
Because of this, it was determined that a strict cutoff point could not be used to determine
whether or not a rib fractured. The data from this test, along with data from the ex vivo tests and
most recent thorax test were combined to create a logistic binary regression plot in Figure 5.20
that could give a prediction of whether or not a rib fractured based on the strain rate after the
peak.
5.3: Ex vivo Testing
For the four ribs tested ex vivo, results are graphed below in Figures 5.11-5.14. In test
HRB02, gage PSG1 failed. In test HRB03, gage PSG2 failed, and in test HRB04, gage CSG1
failed. The vibration in the strain gage signals were caused by the vibrations of the table in the
pendulum test. The gages labeled CSG1 and CSG2 are on the cutaneous side of the rib, and the
gages labeled PSG1 and PSG2 are on the pleural side of the rib.
Table 5.4: Incorrectly Predicted Signals
test rib time max max strain time min min strain strain range min slope Regression R Squared
902 L5 1.93E-02 1.14E+03 3.54E-02 -4.89E+02 1.63E+03 -6.39E+05 -1.45E+05 0.9531
1003 L3Ant 2.43E-02 2.11E+03 2.72E-02 -8.97E+02 3.01E+03 -3.28E+06 -1.94E+06 0.9470
802 L6 1.82E-02 4.58E+03 2.64E-02 7.07E+02 3.88E+03 -9.49E+06 -6.42E+06 0.9565
903 L4 2.89E-02 7.99E+03 7.78E-02 1.75E+03 6.24E+03 -1.02E+07 -1.58E+05 0.9722
904 L8 2.15E-02 7.50E+03 2.25E-02 3.94E+03 3.56E+03 -1.02E+07 -8.28E+06 0.9845

38
-15000
-10000
-5000
0
5000
10000
15000
0 0.01 0.02 0.03
Stra
in (μ
S)
Time (s)
Figure 5.11: HRB01 Strain Gage Data
PSG1
PSG2
CSG1
CSG2
-8000
-6000
-4000
-2000
0
2000
4000
6000
0 0.01 0.02 0.03
Stra
in (μ
S)
Time (s)
Figure 5.12: HRB02 Strain Gage Data
PSG2
CSG1
CSG2

39
In this testing, the pleural side of the rib underwent tension, which is noted by the
positive strain values, while the cutaneous gages underwent compression. This is opposite the
human thorax testing, where the only gages placed on were cutaneous. In the thorax testing, all
the strain was positive. This demonstrates that the mechanism of fracture was different for the ex
vivo tests and the thoracic impacts.
-10000
-8000
-6000
-4000
-2000
0
2000
4000
6000
8000
0 0.01 0.02 0.03
Stra
in (μ
S)
Time (s)
Figure 5.13: HRB03 Strain Gage Data
PSG1
CSG1
CSG2
-10000
-8000
-6000
-4000
-2000
0
2000
4000
6000
8000
0 0.01 0.02 0.03
Stra
in (μ
S)
Time (s)
Figure 5.14: HRB04 Strain Gage Data
PSG1
PSG2
CSG2

40
The statistical analysis was repeated for the human rib ex vivo testing. It can be seen
below in Table 5.5.
Table 5.5: Ex Vivo Testing Data
Test gage
time max strain
max strain
time min strain min strain
strain range Min Slope Regression
R Squared
HRB01 PSG1 2.04E-02 1.28E+04 2.11E-02 5.11E+03 1.79E+04 6.11E+07 2.65E+07 0.9547
HRB01 PSG2 2.03E-02 7.65E+03 2.09E-02 1.56E+03 9.21E+03 5.07E+07 1.55E+07 0.8333
HRB01 CSG1 2.03E-02 8.21E+03 2.11E-02 2.79E+03 1.10E+04 3.63E+07 1.56E+07 0.9675
HRB01 CSG2 2.02E-02 9.85E+03 2.09E-02 1.20E+03 1.11E+04 5.55E+07 1.82E+07 0.8732
HRB02 PSG2 1.85E-02 5.27E+03 1.89E-02 2.32E+02 5.51E+03 3.53E+07 1.70E+07 0.9096
HRB02 CSG1 1.86E-02 4.82E+03 1.90E-02 4.84E+02 4.34E+03 2.52E+07 1.16E+07 0.8896
HRB02 CSG2 1.86E-02 6.92E+03 1.89E-02 1.72E+02 6.75E+03 4.10E+07 2.60E+07 0.9608
HRB03 PSG1 1.91E-02 5.38E+03 2.01E-02 1.47E+03 6.85E+03 2.22E+07 7.07E+06 0.9245
HRB03 CSG1 1.90E-02 8.93E+03 2.01E-02 8.12E+02 9.74E+03 2.56E+07 1.04E+07 0.9450
HRB03 CSG2 1.90E-02 4.90E+03 2.02E-02 2.44E+03 7.34E+03 1.59E+07 6.57E+06 0.9738
HRB04 PSG1 2.51E-02 4.84E+03 2.63E-02 1.78E+03 6.61E+03 2.21E+07 4.93E+06 0.9098
HRB04 PSG2 2.44E-02 6.75E+03 2.62E-02 1.77E+03 8.52E+03 2.68E+07 5.62E+06 0.8921
HRB04 CSG2 2.44E-02 8.21E+03 2.54E-02 3.43E+02 7.87E+03 3.66E+07 1.01E+07 0.8450
average 2.06E-02 7.27E+03 2.14E-02 1.55E+03 8.67E+03 3.49E+07 1.35E+07 0.9138
maximum 2.51E-02 1.28E+04 2.63E-02 5.11E+03 1.79E+04 6.11E+07 2.65E+07 0.9738
minimum 1.85E-02 4.82E+03 1.89E-02 1.72E+02 4.34E+03 1.59E+07 4.93E+06 0.8333
Every rib fractured in the ex vivo tests, and the gages all show the 20% to 80% regression
slope to be well above the cutoff from the thorax testing. Absolute values were taken of all
values so averages, minimum, and maximums could be calculated. Also, the distance from the
gage to the fracture could be accurately measured during this testing in Table 5.6. Figure 5.15
below demonstrates whether or not there is correlation between regression slope and distance
from fracture to gage. This figure shows that there is no measurable correlation between distance
and strain rate.

41
Table 5.6: Gage to Fracture Distance Data
test gage distance from fx (mm) Regression
HRB01 PSG1 45 26455788
HRB01 PSG2 40 15546689
HRB01 CSG1 60 15646661
HRB01 CSG2 35 18160830
HRB02 PSG2 25 17017667
HRB02 CSG1 65 11618271
HRB02 CSG2 25 25985980
HRB03 PSG1 50 7067702
HRB03 CSG1 50 10403236
HRB03 CSG2 45 6565224
HRB04 PSG1 60 4928817
HRB04 PSG2 25 5618427
HRB04 CSG2 25 10087426
0
20
40
60
80
100
0 1 2 3 4 5
Stra
in R
ate
(μ
S/se
c.)
distance from gage to fx (mm)
Figure 6.15: Distance from Gage to Fx. vs Strain Rate

42
5.4 Recent Thorax Test
The recent thoracic impact was different from earlier tests, because it contained four
impacts on the same subject. Four impacts were performed because the strain gages showed no
sign of fracture at all. Figures 5.17-5.20 show the strain data from these tests.
-4000
-2000
0
2000
4000
6000
8000
10000
12000
0.00 0.02 0.04 0.06 0.08 0.10
Stra
in (μ
S)
Time (s)
Figure 5.16: 1101OTH25L01 Strain Gage Data
-1000
0
1000
2000
3000
4000
5000
0.00 0.02 0.04 0.06 0.08 0.10
Stra
in (μ
S)
Time (s)
Figure 5.17: 1101LTH25R02 Strain Gage Data

43
From each of the four tests, the two gages that showed the maximum strain were taken
and used for the binary logistic regression plot along with the original thoracic tests and the ex
vivo testing.
-6000
-4000
-2000
0
2000
4000
6000
8000
10000
0.00 0.02 0.04 0.06 0.08 0.10
Stra
in (μ
S)
Time (s)
Figure 5.18: 1101OTH45R03 Strain Gage Data
-2.00E+03
0.00E+00
2.00E+03
4.00E+03
6.00E+03
8.00E+03
1.00E+04
1.20E+04
1.40E+04
1.60E+04
0.00 0.02 0.04 0.06 0.08 0.10
Stra
in (μ
S)
Time (s)
Figure 5.19: 1101LTH45L04 Strain Gage Data
StrainL3LatStrainL3OblStrainL4LatStrainL4OblStrainL5LatStrainL5OblStrainL6LatStrainL6OblStrainL7LatStrainL7OblStrainL8LatStrainL8OblStrainL9LatStrainL9OblStrainL10LatStrainL10Obl

44
Table 6.7: 1101 Test Strain Gage Data
Test gage time max max strain time min min strain strain range min slope Regression R Squared
1101OTH25L01 L4Obl 3.26E-02 6.56E+03 9.31E-02 1.46E+00 6.56E+03 -1.65E+06 -1.93E+05 0.9949
1101OTH25L01 L5Obl 2.86E-02 9.46E+03 9.92E-02 1.84E+02 -9.27E+03 -3.50E+05 -2.22E+05 0.9891
1101LTH25R02 L5Lat 3.36E-03 2.18E+03 8.06E-02 -4.84E+01 2.23E+03 -1.48E+05 -8.62E+04 0.9950
1101LTH25R02 R6Lat 3.03E-02 4.43E+03 8.55E-02 -4.60E+02 4.89E+03 -2.64E+05 -1.62E+05 0.9965
1101LTH45R03 R4Obl 1.82E-02 7.97E+03 7.66E-02 6.22E+01 7.90E+03 -4.26E+05 -2.24E+05 0.9930
1101LTH45R03 R5Obl 1.64E-02 6.79E+03 7.97E-02 1.71E+02 6.62E+03 -4.08E+05 -1.45E+05 0.9391
1101OTH45L04 L4Obl 3.10E-02 1.34E+04 8.08E-02 6.07E+01 1.33E+04 -1.08E+06 -3.00E+05 0.9655
1101OTH45L04 L6Lat 2.05E-02 8.46E+03 7.09E-02 -9.05E+02 9.36E+03 -3.96E+05 -2.80E+05 0.9891
average 2.26E-02 7.40E+03 8.33E-02 -1.17E+02 5.20E+03 -5.91E+05 -2.02E+05 0.982775
maximum 3.26E-02 1.34E+04 9.92E-02 1.84E+02 1.33E+04 -1.48E+05 -8.62E+04 0.9965
minimum 3.36E-03 2.18E+03 7.09E-02 -9.05E+02 -9.27E+03 -1.65E+06 -3.00E+05 0.9391
This graphical data demonstrates that the regression slopes fall into the range of the non-
fractured rib data from the original thorax testing.
5.5 Binary Logistic Regression
After collecting all 42 data points, a binary logistic regression plot was created as a
predictor for when a rib fractured or not based on the slope of the strain gage signal after the
maximum point. The p-value for this test is 0.000 and the Goodman-Kruskel Gamma value is
0.82. A p-value of 0 is representative of a good fit. A gamma value closer to 1 shows perfect

45
predictive ability of the regression chart to predict future results[1].
The results of the binary logistic regression plot show that there is a 50% chance of the
rib fracturing if the natural log of the slope of the microstrain vs. time graph is 13.9. This
correlates to a strain rate of 1,060,000 microstrain per second.
0
0.1
0.2
0.3
0.4
0.5
0.6
0.7
0.8
0.9
1
5 7 9 11 13 15 17 19
Pro
bab
ility
of
Frac
ture
Natural Log of Microstrain/Second
Figure 6.20: Binary Logistic Regression

46
Chapter 6: Discussion, Improvements, and Future Work
6.1 Discussion
The original thirteen thoracic tests demonstrated many things about understanding how to
predict whether or not a rib fractured in a thoracic impact. First, it is worth noting what the strain
gage testing revealed about the limitations of strain gages in impact testing. It appears that the
reason strain gages failed was because of failure of the leads or connection between the leads,
wiring, and gage surface. It does not appear that the gages failed because of actual damage to the
gage face. If this were the case, it would be noted that gage failures would be consistent
throughout all tests even after the wiring and leads were supported. For the first three tests 61%
of gages showed accurate signals. For the last three tests, 78% of gages showed accurate signals.
Throughout the testing, ribs were strengthened with more and more techniques including taping
the leads and placing silicone to adhere the leads to the gage better.
For the signal statistics, the strain rate after the maximum point was used for multiple
reasons. The first reason is that the definition of a fracture is the breaking of a bone after a force
was applied to it. The strain rate leading to the maximum point showed the force being applied to
the bone. No matter how quickly or slowly the force was applied, at a certain point, the rib
would fracture due to the increased strain on the bone. The shapes of strain before the maximum
for the fractured ribs varied greatly. The slope of the strain graph after the maximum was used
because the fracture event releases the strain in the bone causing the rapid decrease of strain.

47
Duma et al did not use the strain rate after the fracture because of the possibility of it failing at
the maximum. Multiple autopsy reports from that study showed the fracture occurring at the
gage, which could contribute to the reasoning behind that theory [3,4]. However, there is no
reason to justify that the gage would fail after the maximum otherwise unless the impact
damages the gage. Maximum strain and strain range were not used as measureable results,
because there was less correlation between them and the fracture outcome.
The ex vivo testing revealed multiple things about the test setup. First, the direction of the
strain was worth noting. During the ex vivo testing, the cutaneous side of the rib was in
compression, while the pleural side of the gage was in tension. This is the opposite of the human
thorax testing, but it is because of different mechanisms of fracture. There tended to be a general
trend that strain rate was lower the farther away the gage was from the fracture, but there was not
enough solid evidence to accurately determine if that is correct or not. The change in strain rate
was only significant if one gage was more than 1 cm closer to the fracture than the other. There
was also no significance in
Limited insight was given by the 1101 thorax test. Figures 5.17-5.20 show the strain gage
signals, but without any fractures to compare the signals to, it is difficult to know how close the
ribs came to fracture or how much strain they could handle. Graphically, it does appear that there
is a correlation between impact speed and maximum strain on the ribs. The last two tests
involved ribs being impacted at higher speeds. However the thorax was impacted in different
locations for the various speeds. The tests labeled OTH were obliquely impacted, and the tests
labeled LTH were laterally impacted. It is also worth noting that in the lateral impacts, all gages
underwent tensile strain only, but during the oblique impacts, some gages underwent
compression strain also.

48
Finally, after all the data was collected and measured, the binary logistic regression plot
was created. It can be seen in Figure 5.21 that the regression plot shows that there is a 50%
chance of a rib fracture if the strain rate after the maximum is above 1,060,000 microstrain per
second, which correlates with a natural log on the graph of 13.9. There is a 10% chance of a rib
fracture if the natural log of the strain rate is 11.8, which is a strain rate of 13,600 microstrain per
second. This data can be used for future trials, because a program can be created to take the
signal and analyze for this piece of data. After a test, the strain rates could be determined, and if
they are above a certain level, testing could stop or a CT scan could be performed to determine if
a fracture actually occurred before more testing occurred. This will have the limitation of only
being able to determine the presence or absence of fractures and not how many fractures
occurred, but that can be analyzed during an autopsy after the test.
Strain rate was chosen as a better fit for the binary logistic regression than maximum
strain or stain range. Maximum strain rate was an effective measure. It was even more effective
than the regression strain rate, but because it excludes any signals with noise, it was not used.
Table 6.1 shows all of the p values for the test that all slopes are zero, gamma values, and chi
square values for the four measurements tested for the binary logistic regression. Of the five
incorrectly predicted signals, the binary logistic regression predicted one of them correctly.
Table 6.1: Binary Logistic Regression Statistics
Tests that all slopes are zero P-value
Hosmer-Lemeshow Chi-Square P-value
Goodman-Kruskal Gamma value
absolute value of regression 0 0.42 0.83
natural log of absolute value of regression 0 0.24 0.82
absolute value of minimum slope 0 0.93 0.96
maximum strain 0.68 0.25 0.11
strain range 0.28 0.74 0.19

49
6.2 Improvements
Several improvements could be made to this study. Most of the improvements involve
using the new, more robust strain gages. With the older signals, even taped, several gages failed,
leaving bad signals. There is always the fear that other signals failed in less noticeable ways, and
these failed signals could have been used in the data. In order to get a truly representative binary
logistic regression, all data must be accurate to the strain on the rib. Because the only way to
know if a gage failed is to visually examine the signal, it is possible that a failed gage could have
appeared to have not failed. Throughout all testing, more effort must be made into recording the
distance along the rib from every gage to every fracture, the condition the gage is in during the
autopsy report, taking more photographs during autopsy to determine whether the gage was
along the correct axis or if there was an offset. Thoracic testing impact speed and conditions
were not looked into in this thesis, but they could be correlated with fractures so that they could
be utilized to help predict presence of fracture. During the ex vivo tests, the table must be secured
better to the ground so that vibrations do not interrupt the strain gage signal noticeably. This
could affect the regression slope of each signal.
6.3 Future Work
Future work for quantitatively studying strain gage signals to determine whether or not a
fracture has occurred will involve completing more strain gage tests with the new strain gage
models to determine the difference it makes and if the new strain gages have the same limitations

50
in predicting fractures, because no rib with the robust strain gage has fractured at The Ohio State
University. The only test they were involved in had no fractures through four impacts. After this
is completed, the data points taken from the gages should be compared to the binary logistic
regression to determine whether or not they fit with the regression. If they do not, a new binary
logistic regression should be created with multiple points from the new testing. More ex vivo
tests should be completed with the robust strain gages so that the results can be compared to the
results from the ex vivo tests with the strain gages with exposed wires to determine if the
sensitivity differences make a significant difference in the results.

51
Chapter 7: Conclusions
The most effective quantitative measure for predicting whether or not a fracture
occurred without observing autopsy is the magnitude of the strain rate after the
fracture event.
There is a 10% chance of a fracture if the magnitude of the strain rate is 13,600
microstrain per second after the maximum strain magnitude.
There is a 50% chance of fracture if the magnitude of the strain rate is 1,060,000
microstrain per second.
New, robust strain gages do not fail nearly as often as the older model that was used
in the earlier 13 thoracic tests.
These robust strain gages need more testing to determine if they agree with the binary
logistic regression of this study and to determine if they have any problems in testing
where fractures occurred.
The ex vivo tests and the thoracic impact tests have different mechanisms of fracture
because the cutaneous surfaces of the ribs during the thoracic impact tests undergo
tension while the cutaneous surfaces of the ribs during the ex vivo tests undergo
compression.

52
References
1. Bolte, J. H., et al. (2004). “Injury and Impact Response of the Shoulder Due to Lateral
and Oblique Loading.” Dissertation, The Ohio State University, Columbus 393 p.
2. Borman, J. B., et al. (2006). “Unilateral flail chest is seldom a lethal injury.” Emergency
Medicine Journal 23: 903-905
3. Duma, S., J. Stitzel, et al. (2005). “Non-censored rib fracture data from dynamic belt
loading tests on the human cadaver thorax.” International Technical Conference on the
Enhanced Safety of Vehicles (ESV).
4. Duma, S., et al. (2011). “Rib Fracture Timing in Dynamic Belt Tests With Human
Cadavers.” Clinical Anatomy 24: 327-338
5. Gabrielli, F., D. Subit, et al. (2009). "Time-frequency analysis to detect bone fracture in
impact biomechanics. Application to the thorax." Medical Engineering & Physics 31:
952-958.
6. Gray, H. (1918). “Anatomy of the Human Body." Bartleby. Web. 23 May 2011.
<http://www.bartleby.com/107/>.
7. Human Body. Encyclopædia Britannica Online. Web. 23 May. 2011.
<http://www.britannica.com/EBchecked/media/121130/The-human-heart-in-situ>.
8. Long, et al. (2009). “Biomechanical Response of the PMHS Thorax to High Speed
Lateral and Oblique Impacts.” Masters Thesis, The Ohio State University, Columbus.
144 p.
9. National Highway Traffic and Safety Administration. (2011). “Early Estimate of Motor
Vehicle Fatalities in 2010.” U.S. Department of Transportation, Washington, D.C.

53
10. Omega Engineering, Inc. (1998). “The Strain Gage.” Transactions: Force-Related
Measurements 3: 15-25.
11. Trosseille, X., P. Baudrit, et al. (2008). "Rib cage strain pattern as a function of chest
loading configuration." Stapp Car Crash Journal 52: 205-231.

54
Appendix A: Sample Autopsy Report:
Autopsy Date: 10/28/2010
Autopsy Report
1003OTH45L01
Diaphragm:
o No Injury
Heart & Aortic Arch:
o No Injury
Kidney:
o No Injury
Liver:
o No Injury
Lung:
o No Injury
Pancreas:
o No Injury
Pericardium:
o No Injury
Pleura:
o No Injury
Pulmonary Artery:
o No Injury
Rib Cage:
o Fractures (measurements recorded in cm taken from the middle of the sternum
and inferior to the sternal notch):
1. L3 ant: Non-displaced fracture
Location at costochondral joint
8 cm inferior & 6.5 cm lateral to the sternum
Fracture was located 2 cm lateral to the anterior strain gage
2. L4 ant: Non-displaced fracture
11 cm inferior & 13 cm lateral to the sternum
Fracture was located 2 cm lateral to the anterior strain gage
3. L4 post: Non-displaced fracture
5 cm inferior & 19.5 cm lateral to the sternum
Fracture was located 6 cm posterior to the posterior strain gage
4. L5 ant: Non-displaced fracture
Location at costochondral joint

55
14.5 cm inferior & 14 cm lateral to the sternum
Fracture was located 2 cm lateral to the anterior strain gage
5. L6 ant: Non-displaced fracture
Location at costochondral joint
18.5 cm inferior & 14 cm lateral to the sternum
Fracture was located ½ cm medial to the anterior strain gage
6. L7 ant: Non-displaced fracture
Location at costochondral joint
22.5 cm inferior & 15 cm lateral to the sternum
Fracture was located 2 cm medial to the anterior strain gage
o Antemortem Fractures
1. R10
2. R11
Spleen:
o No Injury
Other Notes:
Tissue thickness at impact site:
o Upper ram edge: 3.6 cm
o Middle of ram: 3.0 cm
o Lower ram edge: 2.0 cm
Strain Gage Notes
Unless noted, all strain gages were found strongly attached to proper rib
o Anterior Left Side
L10 – Placed partially on musculature and subcutaneous tissue; was still
loosely attached to the 10th
rib
o Posterior Left Side
L3 – Partially loose upon dissection
o Right Side
No strain gages were placed on the right side of the subject
Ligamentum Arteriosum:
o Ligamentum arteriosum was intact at autopsy
Catheter Location:
o During autopsy the foley catheters were dissected out to note their location:
Left Common Carotid Artery – This foley was in proper position with its
balloon approximately 2 cm superior to the arch of the aorta, placing the
sensors in the arch.

56
Descending Aorta – This foley was in proper position with its balloon at
the level of the diaphragm and sensors just inferior to the heart
Inferior Vena Cava - This foley was located inferiorly at the level of the
diaphragm. Unfortunately, the balloon popped, thus we tied off both
femoral veins in hope of closing off the inferior venous system of the
subject.
Superior Vena Cava – This foley was in proper position with its balloon
superior to the right atrium of the heart.
Figure 1: Ribcage of impact (left) side.
Superior Inferior
3 5 6 7
4
8 9 10

57
Figure 2: Intact Ligamentum Arteriosum
AIS Code Summary –
450230.3 -
o 6 rib fractures on the left, impact, side of the thorax
o all fractures were non-displaced, with only one rib (4th
) fractured in multiple
places
o stable chest, no pneumothorax
John H. Bolte IV, PhD
Associate Professor, Division of Anatomy
Director – Injury Biomechanics Research Laboratory
The Ohio State University

58
Appendix B: Sample Data Form from ex vivo test
Potted Rib Measurement Data Sheet
Test/Rib ID: __Hrb01 (5985-R4)_____________ Date: ____4/12/11_______
Pre-impact ID Measurement
(mm) Description
Straight Length 1 (SL1): 170 SL1= Linear length from point ‘a’ to ‘b’ on pleural surface
Straight Length 2 (SL2): 190 SL2= Linear length from point ‘c’ to ‘d’ on cutaneous surface
Curve Length 1 (CL1): 215 CL1= Curve length from point ‘a’ to ‘b’ on pleural surface
Curve Length 2 (CL2): 23.5 CL2= Curve length from point ‘c’ to ‘d’ on cutaneous surface
Pleural Strain Gage 1 (PSG1):
65 PSG1= Curve length on pleural surface to 30% of CL1 from point ‘a’
Pleural Strain Gage 2 (PSG2):
150 PSG2= Curve length on pleural surface to 70% of CL1 from point ‘a’
Cutaneous Strain Gage 1 (CSG1):
75 CSG1=Curve length on cutaneous surface to gage from point ‘c’ (placed by matching to PSG1)
Cutaneous Strain Gage 2 (CSG2):
165 CSG2=Curve length on cutaneous surface to gage from point ‘c’ (placed by matching to PSG2)
Post-impact
ID Measurement (mm)
PSG1 45
PSG2 40
CSG1 60
CSG2 35
*All measurements are from tip of strain gage to end of fracture surface on respective surface. Strain gage tips are all pointed towards the sternal rib end.

59
Notes: Transverse fx