development of an advanced flameless combustion heat ... · combustion heat source utilizing heavy...
TRANSCRIPT

UNCLASSIFIED
TECHNICAL REPORT AD ________________
NATICK/TR-10/018
DEVELOPMENT OF AN ADVANCED FLAMELESS
COMBUSTION HEAT SOURCE UTILIZING HEAVY
FUELS
by
Clifford G. Welles
Catalytic Devices International, LLC
Pleasanton, CA 94588
July 2010
Final Report February 2006 – June 2008
Approved for public release; distribution is unlimited.
Prepared for
U.S. Army Natick Soldier Research, Development and Engineering Center
Natick, Massachusetts 01760-5018

UNCLASSIFIED

REPORT DOCUMENTATION PAGE Form Approved
OMB No. 0704-0188 Public reporting burden for this collection of information is estimated to average 1 hour per response, including the time for reviewing instructions, searching existing data sources, gathering and maintaining the data needed, and completing and reviewing this collection of information. Send comments regarding this burden estimate or any other aspect of this collection of information, including suggestions for reducing this burden to Department of Defense, Washington Headquarters Services, Directorate for Information Operations and Reports (0704-0188), 1215 Jefferson Davis Highway, Suite 1204, Arlington, VA 22202-4302. Respondents should be aware that notwithstanding any other provision of law, no person shall be subject to any penalty for failing to comply with a collection of information if it does not display a currently valid OMB control number.
PLEASE DO NOT RETURN YOUR FORM TO THE ABOVE ADDRESS.
1. REPORT DATE (DD-MM-YYYY)
07-07-2010 2. REPORT TYPE
Final
3. DATES COVERED (From - To)
February 2006 - June 2008 4. TITLE AND SUBTITLE
DEVELOPMENT OF AN ADVANCED FLAMELESS
COMBUSTION HEAT SOURCE UTILIZING HEAVY FUELS
5a. CONTRACT NUMBER
W911QY-05-C-0064 5b. GRANT NUMBER
5c. PROGRAM ELEMENT NUMBER
622786 6. AUTHOR(S)
Clifford G. Welles
5d. PROJECT NUMBER
5e. TASK NUMBER
5f. WORK UNIT NUMBER
7. PERFORMING ORGANIZATION NAME(S) AND ADDRESS(ES)
8. PERFORMING ORGANIZATION REPORT NUMBER
9. SPONSORING / MONITORING AGENCY NAME(S) AND ADDRESS(ES) 10. SPONSOR/MONITOR’S ACRONYM(S)
U.S. Army Natick Soldier Research, Development and Engineering Center
ATTN: RDNS-CFE (A. Schmidt)
Kansas Street, Natick, MA 01760-5018 11. SPONSOR/MONITOR’S REPORT NUMBER(S)
NATICK/TR-10/018
12. DISTRIBUTION / AVAILABILITY STATEMENT
Approved for public release; distribution is unlimited.
13. SUPPLEMENTARY NOTES
14. ABSTRACT
Report developed under Broad Agency Announcement contract. Advance Flameless Catalytic Combustion Technology
(AFCT) is a collection of innovative, proprietary techniques and processes that have demonstrated effectiveness in
overcoming problems associated with stabilizing captive flameless heat generation. CDI’s unique success in achieving
stabilization in captive combustion for light fuels such as methanol, ethanol and butane was extended to include heavy
fuels such as JP-8 and diesel and also to increase the thermal power output to include near kilowatt levels. A complete
re-design of the critical subsystem components was required. The results were then utilized to construct a catalytic Flow-
Through Water Heater demonstration prototype unit, intended as a portable accessory for the soldier personal hydration
pack.
15. SUBJECT TERMS
16. SECURITY CLASSIFICATION OF:
17. LIMITATION OF ABSTRACT
SAR
18. NUMBER OF PAGES
80
19a. NAME OF RESPONSIBLE PERSON
Alex Schmidt a. REPORT
U
b. ABSTRACT
U
c. THIS PAGE
U 19b. TELEPHONE NUMBER (include area code)
(508) 233-6042
Standard Form 298 (Rev. 8-98) Prescribed by ANSI Std. Z39.18
FUELS CATALYSIS FLAMELESS WATER HEATER
WATER JET-A FUEL PROTOTYPES SYSTEM DESIGN
HEATING PORTABLE COMBUSTION FUEL CONSUMPTION
JP-8 FUELS OXIDATION HEAVY FUELS TRANSPORT PROPERTIES
KEROSENE HYDRATION VAPORIZATION BAA(BROAD AGENCY ANNOUNCEMENT)
Catalytic Devices International, LLC
7063-E Commerce Circle
Pleasanton, CA 94588
UNCLASSIFIED

This page intentionally left blank
UNCLASSIFIED

iii
UNCLASSIFIED
Table of Contents
List of Figures ............................................................................................................................... iv
List of Tables ................................................................................................................................. v
Preface ........................................................................................................................................... vi
1. Summary .................................................................................................................................... 1
2. Introduction ............................................................................................................................... 2
3. Milestones and Timeline ........................................................................................................... 4 3.1 Overview of Significant Project Milestones ......................................................................... 4 3.2 Principal Technical Challenges ............................................................................................ 4
4. Development Activities ............................................................................................................. 6 4.1 Evaluation of Target Application Concepts .......................................................................... 6 4.2 Design Selection Process ...................................................................................................... 6
4.3 Determining Heavy-Fuel Flameless Combustion Fundamentals ......................................... 7 4.3.1 Validating Quantitative Properties of Catalytic Combustion ........................................ 7 4.3.2 Light Fuel Testing/Calibration (Methanol and Ethanol).............................................. 10 4.3.3 Heavy Fuel Testing/Calibration (Jet-A) ....................................................................... 11 4.3.4 Heavy Fuel Reforming ................................................................................................. 13 4.3.5 Dynamic Azeotrope Evaporator .................................................................................. 16 4.3.6 Effects of Fuel Aging ................................................................................................... 22 4.3.7 Vibrating Shutter Nebulizer ......................................................................................... 26
5. Prototype Design and Construction ...................................................................................... 29 5.1 Preliminary System Design for the Flow-Through Water Heater ...................................... 29 5.2 Subsystem Modeling, Design & Testing ............................................................................ 31
5.2.1 Catalytic Combustor & Heat Exchanger Subsystem ................................................... 32
5.2.2 Catalytic Combustion Chamber ................................................................................... 37 5.2.3 Gas Flow and Heat Transfer Calculations ................................................................... 42 5.2.4 Flashback Analysis ...................................................................................................... 44 5.2.5 Temperature Profile Inside Ceramic Combustor Plate ................................................ 45 5.2.6 Catalytic Combustion Plate Surface Temperature ....................................................... 47 5.2.7 Catalytic Combustion Plate Physical Properties .......................................................... 47 5.2.8 Catalyst Deposition Profiles ........................................................................................ 49 5.2.9 Improved Catalytic Combustion Plate Properties ........................................................ 51 5.2.10 Catalytic Starter ......................................................................................................... 55
6. Conclusions/Recommendations ............................................................................................. 71

iv
UNCLASSIFIED
List of Figures
Figure 1. Schematic of Experimental Set-Up ................................................................................8 Figure 2. Catalytic Combustion Test Bed (left) & Evaporation Chamber (right) .........................9 Figure 3. Catalytic Combustion Data for Methanol & Ethanol ...................................................11 Figure 4. Catalytic Combustion Data for Jet-A Fuel ...................................................................12 Figure 5. Schematic Showing Method to Reform Heavy Fuels into Simple Fuels .....................14 Figure 6. Catalytic Combustion Data for Jet-A Fuel ...................................................................15 Figure 7. Schematic of Apparatus for Measuring Azeotrope Dynamics .....................................18 Figure 8. Data Validating Dynamic Azeotrope Concept .............................................................19 Figure 9. Design Geometry Incorporating Dynamic Azeotrope Principle ..................................20 Figure 10. Table-Top Dynamic Azeotrope & Catalytic Combustion Test Bed ............................21 Figure 11. Evaporative Body Showing Before & After Extended Use .........................................21 Figure 12. Close-up of Test Surface After Running Contaminated Jet-A .....................................24 Figure 13. Effect on Azeotrope from Aged & Contaminated Fuel ...............................................25
Figure 14. Effect on Azeotrope from Water Contaminated Fuel ..................................................25 Figure 15. Nebulizer Principle of Operation .................................................................................26 Figure 16. Nebulizer Output Stream with Methanol or Jet-A .......................................................27 Figure 17. View of Nebulizer Head Assembled ............................................................................28 Figure 18. System Design Concepts ..............................................................................................30 Figure 19. Placement of TEG in Heat Flow Path ..........................................................................32 Figure 20. Inside Views of High Performance Heat Transfer Unit ...............................................33 Figure 21. Top and Bottom Views of Heat Transfer Unit .............................................................33 Figure 22. Example of Poor Heat Transfer Design .......................................................................34 Figure 23. Significantly Improved Heat Transfer ..........................................................................35 Figure 24. Advanced Heat Transfer Prototype Performance .........................................................36 Figure 25. Pressure Drop versus Flow Rate ..................................................................................37
Figure 26. Combustor Temperature vs. Equivalence Ratio ..........................................................38 Figure 27. Visualization of Fuel Droplet Size vs. Transport Effectiveness .................................39 Figure 28. Test Bed for Nebulizer-Based Catalytic Combustion ..................................................40 Figure 29. Alternative Air Moving Mechanisms Evaluated ..........................................................41 Figure 30. Model Geometry for Gas & Heat Flow Estimates .......................................................42 Figure 31. Flow Tube Thermal Profile ..........................................................................................44 Figure 32. Porous Ceramic Catalytic Combustion Plate Substrate ...............................................47 Figure 33. Diagram of Combustion Plate Experimental Apparatus ..............................................48 Figure 34. Pressure Drop versus Plate Parameters ........................................................................49 Figure 35. Catalyst Gradient Strategies for Ceramic Substrate .....................................................50
Figure 36. View of Flow Uniformity Test Cell .............................................................................51 Figure 37. Relationship Between Thermal & Electrical Conductivity ..........................................52 Figure 38. Metal Foam Combustor Plate Physical Structure.........................................................53
Figure 39. Thermal Conductivity vs. Primary Porosity of Combustor Plate .................................54 Figure 40. Thermal Conductivity vs. Temperature of Combustor Plate ......................................55 Figure 41. Top View of Assembled Catalytic Starter Device .......................................................58 Figure 42. Close-up View of Ceramic Coated Filament w/Catalyst Applied ...............................58
Figure 43. Catalytic Starter Cage Close-up ...................................................................................59 Figure 44. Microscopic View of Catalytic Starter “Light-Off” Promoter .....................................60 Figure 45. Transient Temperature Calculations for 5 Volts ..........................................................61
Figure 46. Transient Temperature Calculations for 10 Volts ........................................................61

v
UNCLASSIFIED
Figure 47. Flow Chart Showing Areas of Potential Heat Transfer Improvements ........................63 Figure 48. Illustration of CAD Model Used in CFD Study ...........................................................64
Figure 49. Reverberatory Screen Effect on Radiative Heat Transfer ............................................65 Figure 50. Recuperative Heat Design Change ...............................................................................67 Figure 51. Illustrated Effect of Internal Convective Cell Formation on Fuel Delivery .................68 Figure 52. Convective Cell Formation with Fully Developed Air Swirl Input .............................69
List of Tables
Table 1. Primary Milestones .........................................................................................................4
Table 2. Heat Exchanger (HX) Test Results ..............................................................................35 Table 3. Fuel/Air Uniformity Experimental Results ..................................................................51 Table 4. Fuel Temperature vs Fractional Boiling .......................................................................57 Table 5. CFD Recommended Design Changes and Conclusions ...............................................71

vi
UNCLASSIFIED
Preface
Advanced Flameless Combustion Technology (AFCT) was originally conceived to address
several consumer market segments in the outdoor industry. AFCT differs most notably from the
earlier forms of catalytic combustion primarily by the “captive” (i.e., enclosed within an
envelope) nature of the heat generating reaction. By enclosing the catalytic flameless reaction,
Catalytic Devices International (CDI) has been able to demonstrate that substantial benefits can
be accrued.
This report documents work performed for the AFCT Heavy Fuels Project by CDI during the
period February 2006 to June 2008 under contract W911QY-05C-0064, awarded by the U.S.
Army Natick Soldier Research, Development and Engineering Center (NSRDEC) under project
element 622786. The project was directed toward the development of heavy fuels capability as a
fundamentally new type of catalytic heat source based on the application of unique catalytic
reaction and control principles established and patented by CDI.
These major competitive advantages are what distinguish AFCT and provide for new
applications not previously possible with earlier catalytic combustion heat sources:
System Weight
Energy density
Power Density
Cost (both per unit and per watt-hour)
Portability
Packability
Power Control
By exploiting the significant potential performance advantages in the categories above, it is felt
that both civilian and military application of AFCT will benefit. Military application of AFCT
are a logical extension of this technology, but they also challenge CDI to arrive at the optimum
mix of features, performance and cost to satisfy the stringent demands of military application.
The specific tasks of this project, reported upon in the following pages, was to (a) advance the
utility of AFCT such that it can operate from heavy fuels, such as JP-8, each adapted to the
specific task required; and (b) increase the power output of AFCT to allow more types of
physical and functional forms.
1
UNCLASSIFIED
DEVELOPMENT OF AN ADVANCED, FLAMELESS-COMBUSTION
HEAT SOURCE FOR USE WITH HEAVY FUELS
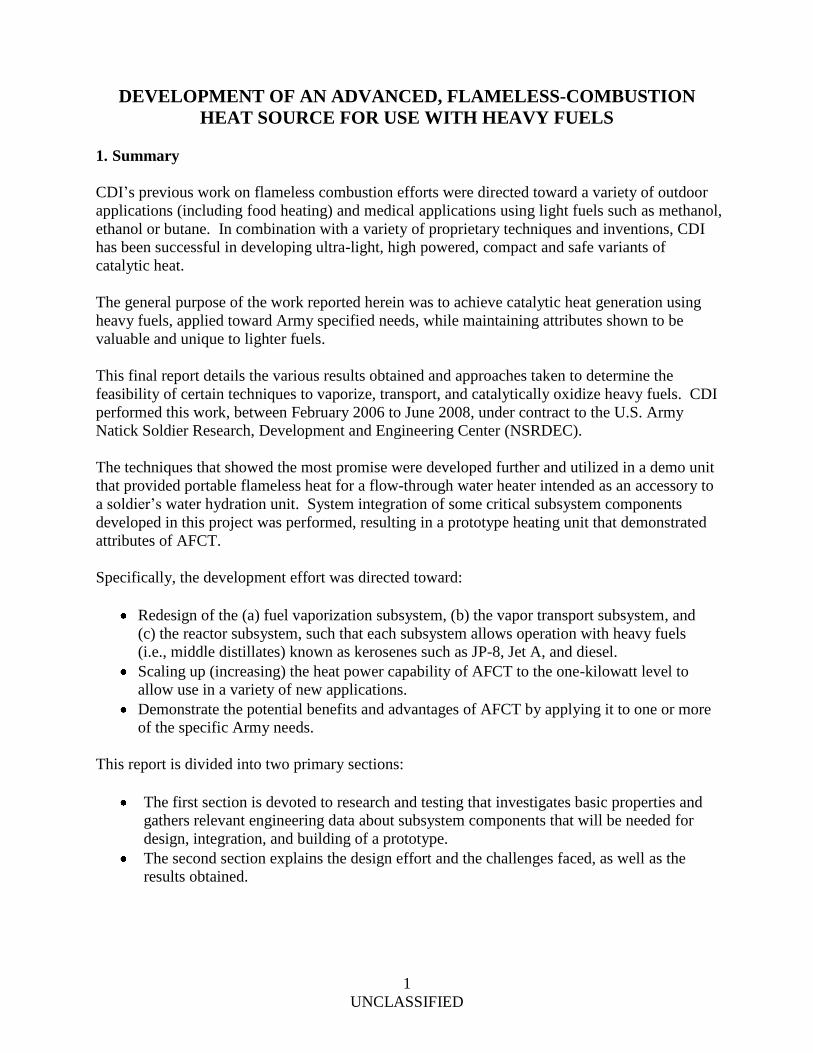
1. Summary
CDI’s previous work on flameless combustion efforts were directed toward a variety of outdoor
applications (including food heating) and medical applications using light fuels such as methanol,
ethanol or butane. In combination with a variety of proprietary techniques and inventions, CDI
has been successful in developing ultra-light, high powered, compact and safe variants of
catalytic heat.
The general purpose of the work reported herein was to achieve catalytic heat generation using
heavy fuels, applied toward Army specified needs, while maintaining attributes shown to be
valuable and unique to lighter fuels.
This final report details the various results obtained and approaches taken to determine the
feasibility of certain techniques to vaporize, transport, and catalytically oxidize heavy fuels. CDI
performed this work, between February 2006 to June 2008, under contract to the U.S. Army
Natick Soldier Research, Development and Engineering Center (NSRDEC).
The techniques that showed the most promise were developed further and utilized in a demo unit
that provided portable flameless heat for a flow-through water heater intended as an accessory to
a soldier’s water hydration unit. System integration of some critical subsystem components
developed in this project was performed, resulting in a prototype heating unit that demonstrated
attributes of AFCT.
Specifically, the development effort was directed toward:
Redesign of the (a) fuel vaporization subsystem, (b) the vapor transport subsystem, and
(c) the reactor subsystem, such that each subsystem allows operation with heavy fuels
(i.e., middle distillates) known as kerosenes such as JP-8, Jet A, and diesel.
Scaling up (increasing) the heat power capability of AFCT to the one-kilowatt level to
allow use in a variety of new applications.
Demonstrate the potential benefits and advantages of AFCT by applying it to one or more
of the specific Army needs.
This report is divided into two primary sections:
The first section is devoted to research and testing that investigates basic properties and
gathers relevant engineering data about subsystem components that will be needed for
design, integration, and building of a prototype.
The second section explains the design effort and the challenges faced, as well as the
results obtained.

2
UNCLASSIFIED
2. Introduction
While the catalytic combustion of kerosene fuels is known in the literature, the low temperature
(e.g., 200 °C to 300 °C) catalytic combustion characteristic of AFCT, when applied to heavy
fuels, is not and presents special challenges.
The effort was directed toward enhancement of CDI’s current advanced flameless combustion
technology so as to expand capabilities in two main technical areas:
Fuel vaporization, vapor transport and catalytic flameless combustion of heavy fuels
(i.e., middle distillates) known as the kerosene, such as, JP-8, Jet A and diesel
Scaling up (increasing the heat power output to the 1-kW or 2-kW level to allow for a
wider range of applications.
To reduce technical risk, CDI took more than one approach to the problem of vaporizing,
transporting and catalytically oxidizing the fuel/air mixture. Heavy fuels require special
consideration in each of these stages.
Approach #1: The vaporization process with heavy fuels can result in the build-up of residues or
tar-like substances. Part of the project was devoted to extending the development of a
fundamentally new class of vaporizers -- invented at CDI -- and referred to in this paper as
Vapor Extraction Membrane (VEM) technique. The VEM technique in conjunction with other
AFCT methods is uniquely qualified, for fundamental reasons, to tackle the difficult issues
relating to residue build-up and vapor condensation with heavy fuels.
To achieve this, the development was aimed at: (a) designing a non-boiling evaporator with
non-selective evaporation characteristics, (b) enhancing current VEM technology, and
(c) empirical validation of non-selective evaporation.
Approach #2: The transport problem relates to the fact that heavy fuels have a much higher
average boiling point than the normal fuels (alcohols and light fuels) used with CDI’s current
design. Several approaches to remedy this problem are available and have been investigated on a
theoretical level at CDI. These include either individually or in combination the following
techniques: counter flow heat transfer conduits, catalytically heated conduits, super-hydrophobic
conduit walls. For practical reasons, and to mitigate schedule risk, a simple combination of heat
conduit and short path transport was utilized for this project.
The ultimate purpose of vaporization and transport is to induce a catalytically supported fuel/air
oxidation reaction (i.e., generate heat). CDI’s current design needed modification to allow for
the differences between the catalytic combustion properties of alcohols currently used and the
heavy fuels, which contain unsaturated aliphatics, as well as saturated and unsaturated
cyclic/multi-cyclic hydrocarbons.
Approach #3: The power-scaling task was accomplished by incorporating advances in low
pressure high flow (LPHF) fan technology with a radical re-design of the reactor
(i.e., catalytically coated combustion plate structure) to allow ultra-low back pressure and
redistribution of the heat energy in conjunction with solutions to vapor transport of saturated
fuel/air mixtures as presented below.

3
UNCLASSIFIED
In the later part of the project, CDI teamed up with the Creare Inc. in an effort that centered
around combining Creare’s fuel nebulizer system with CDI’s catalytic combustion sub-systems.
To achieve a smooth alignment of the two technologies, CDI undertook the task of providing
detailed mathematical modeling of the prototype. This allowed for rapid adjustments to the
prototype when performance issues arose. Ultimately, it also provided a future direction for an
eventual re-design of the prototype for possible market entry.

4
UNCLASSIFIED
3. Milestones and Timeline
3.1 Overview of Significant Project Milestones
Table 1 provides an overview of the project.
3.2 Principal Technical Challenges
There were two primary areas of technical challenge that upon reflection can be determined to be
the driving elements for project resources. They are:
maximizing the cross-over of established technical solutions from the proven CDI light
fuels technology towards the catalytic combustion of heavy fuels, and
adapting the heavy fuels solution to a specific Army field application.
While the catalytic combustion of kerosene fuels is known in the literature, the low temperature
catalytic combustion (e.g., 200 °C to 300 °C) characteristic of AFCT is not and presents special
challenges.
Table 1. Primary Milestones
2006 2007 2008
Heavy Fuels Catalyst Testing Facility Completed
Analysis of Target Applications Completed
Flow-Through Water Heater Application
Design Concept Completed
Catalytic Reforming Alternative Approach
Dynamic Azeotrope Alternative Approach
Effects of Fuel Aging on Catalytic
Performance Analyzed
Ultrasonic Nebulizer Approach Established
as Primary Technique for Project
All Subsytems Modeled and Designed
Subsystems Fabricated and Tested
Subsystem Integration Completed
System Performance Modeled and Improvements
Made
Project Milestones

5
UNCLASSIFIED
Part of the development effort reported herein was directed toward a significant enhancement of
the current advanced flameless combustion technology at CDI. The effort was directed toward
enhancement of capabilities in two main technical areas:
fuel vaporization, vapor transport and catalytic flameless combustion of heavy fuels
(i.e., middle distillates) known as the kerosene, such as, JP-8, Jet A, and diesel; and
scaling up (increasing) the heat power to the kilowatt level with a wider range of
applications.
To reduce the technical risk, CDI took several different approaches to the problem of vaporizing,
transporting and catalytically oxidizing the fuel/air mixture.
The extension of the “Vapor Extraction Membrane” (VEM) to operate with JP-8 was a primary
effort in the early part of the project. VEM is unique to CDI and was originally developed for
outdoor products to allow relatively high chemical power levels in a very compact unit.
A JP-8 version of VEM was shown to be viable through the use of table-top “proof of principle”
experiments. However, it was not brought close enough to a product level in time for
implementation in a field version during the project.
Instead, for the purposes of reducing schedule risk, a method known as vibrating-mesh nebulizer
was adapted since it was already in a relatively advanced state at the time. However, the
nebulizer introduced a host of new challenges having to do with completing the vaporization,
mixing of fuel with air and metering the fuel in a reliable fashion. It also required that a new
type of catalytic combustor plate be developed, with thermal and catalytic properties that are
amenable to the nebulizer characteristics.
Finally, a more complete understanding of the complex behavior underlying the demo unit was
needed because of several unexpected outcomes during testing of the demo unit. The
subsystems that make up the demo unit were analyzed both in singular form and as an assembly
in a completed system. The results provided corrective actions that were applied to the final unit.

6
UNCLASSIFIED
4. Development Activities
Sections 4.1 though 4.3.7 represent the gathering of fundamental engineering data and research
that was used in section 5 for the building of the demonstration unit sub-systems.
4.1 Evaluation of Target Application Concepts
Early in the project an attempt was made to establish a realistic goal for directing the research.
This was done by calculating high level engineering and physics parameters associated with each
particular goal.
A number of potential applications were evaluated to determine the best one for showcasing the
technical results of the project. Detailed calculations were performed and design criteria
established regarding performance for the following potential catalytic applications:
Snow melter to melt 1.5 kg of snow, and heat it to 70 °C
Immersion water heater to heat 500 gm of water to 70 °C
"Instant" (flow-through) water heater to heat water to 70 °C
Hotplate to heat 500 gm of water to 70 °C
Ultimately, the Instant Water Heater (IWH) was chosen as being best suited for demonstration in
the time and budget allotted.
4.2 Design Selection Process
An analysis of total energy, power required for reasonable heating times, amount of fuel and air
(and their flow rates) required for each application, along with the amount, rate, and
composition, and physical characteristics of exhaust products, all lead to a recommendation for a
particular target application.
Vapor pressure calculations and the results of experiments were used to determine the thermal
requirements of the evaporator and catalytic reactor components. These results were then be
used to examine materials compatibility issues.
During the consideration of the various target applications, the analysis was incorporated using
the following criteria:
The heated components within the evaporator and combustor will be fabricated from
materials capable of operating at temperatures in excess of 400 °C.
The area of all heated components will be minimized to minimize startup heat
requirements.
The thickness of all heated components will be minimized to minimize startup heat
requirements.
The specific heat capacity of all components will be minimized to minimize startup heat
requirements.

7
UNCLASSIFIED
The heat transfer path between the catalyst and the heated surface must consist of an
insulating material in order to maintain the catalyst at high temperature.
A heat recuperator should be employed to heat the incoming air and cool the exhaust,
thereby maximizing efficiency.
The external surface area of the device will be minimized in order to minimize heat loss.
Per-use fueling should be considered due to the very low volume of fuel required for each
use.
Utilization of a collapsible air bladder should be considered due to the relatively low
volume of air required for each use.
The above results were then used to perform a preliminary design analysis for the devices listed,
and to make recommendations for the direction of development efforts.
The conclusion was that the best target application to showcase the research results would be a
catalytic flow-through water heater.
4.3 Determining Heavy-Fuel Flameless Combustion Fundamentals
The catalytic oxidation of the simple fuels like methanol and other aliphatic hydrocarbons are
relatively well characterized in the literature. JP-8, which contain a wide range of hydrocarbon
species are not readily predictable from first principles over the wide range of temperatures
desired, and thus needed to be examined to obtain a good working knowledge of the process.
This basic data would later allow us to design the elements that go into a JP-8 catalytic reactor.
4.3.1 Validating Quantitative Properties of Catalytic Combustion
The combustion of heavy fuels in AFCT devices poses additional challenges to the AFCT
technology. Such fuels are both chemically complex, being composed of complex molecules,
and chemically heterogeneous, comprising a mixture of hundreds of different complex molecular
species. These complexities will result in the production of a tremendous diversity of
intermediate compounds as well as the possibility of side (non-oxidative) reactions. In addition,
significantly higher catalyst temperatures are likely to be required for complete oxidation.
The oxidation reaction between fuel and oxygen requires that the molecules have a minimum
kinetic energy in order to approach closely enough to react and then break the existing bonds
between the atoms so that new bonds can be formed. This energy is called the "activation
energy." The kinetic energy of the molecules can only be increased by increasing the
temperature of the fuel-air mixture. This is why a spark is needed to light a flame.
The advantage of a catalyst is that the molecules stick to the surface of the catalyst particles and
the attractive forces between the atoms of the catalyst and the atoms in a fuel molecule cause the
bonds to stretch so that less energy is required to break the bonds -- i.e., the temperature of the
fuel-air mixture (and the catalyst) required for combustion to occur can be much less than the
temperature of a flame.
It is still true, however, that a higher temperature will result in a higher reaction rate -- the
catalyst simply lowers the temperature at which the reaction begins. In addition, a molecule like
8
UNCLASSIFIED
methanol must undergo multiple reactions in order for complete oxidation to occur -- the reaction
is not just one step as might be assumed from the appearance of the overall reaction formula:
For simple fuel molecules, such as methanol, a relatively low temperature can produce complete
oxidation since the bonds in a methanol molecule are stretched very effectively by the platinum
catalyst and also because each methanol molecule must participate in only a few reactions to
become completely oxidized. With more complex molecules, such dodecane (C12H26 -- a
component of jet-fuel) many more reactions must occur, and some of those reactions also have
higher activation energies. So we expect that higher temperatures will be required to combust
heavy fuels as compared to methanol.
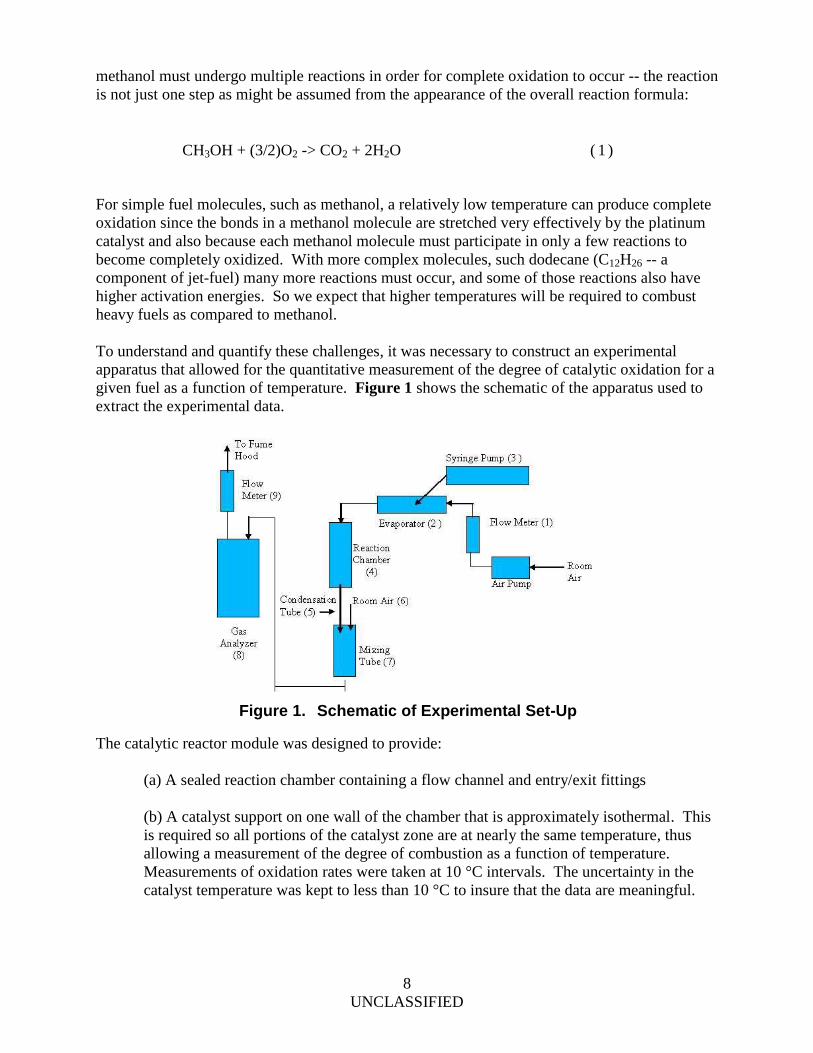
To understand and quantify these challenges, it was necessary to construct an experimental
apparatus that allowed for the quantitative measurement of the degree of catalytic oxidation for a
given fuel as a function of temperature. Figure 1 shows the schematic of the apparatus used to
extract the experimental data.
The catalytic reactor module was designed to provide:
(a) A sealed reaction chamber containing a flow channel and entry/exit fittings
(b) A catalyst support on one wall of the chamber that is approximately isothermal. This
is required so all portions of the catalyst zone are at nearly the same temperature, thus
allowing a measurement of the degree of combustion as a function of temperature.
Measurements of oxidation rates were taken at 10 °C intervals. The uncertainty in the
catalyst temperature was kept to less than 10 °C to insure that the data are meaningful.
CH3OH + (3/2)O2 -> CO2 + 2H2O ( 1 )
Figure 1. Schematic of Experimental Set-Up
9
UNCLASSIFIED
(c) A catalyst support that is of sufficient size so as not to be diffusion-limited. That is,
substantially all fuel molecules must be able to move by diffusion across the channel to
the catalyst surface before exiting the chamber.
Diffusion limits are important because the fuel-air mixture enters one end of the chamber, flows
through the chamber, and exits the far end. Only molecules that actually strike the inner wall of
the chamber coated with catalyst can be oxidized. Since the bulk flow is parallel to the wall, by
itself, it cannot cause molecules to strike the catalyst. That job is done by diffusion, the random
motion of individual molecules.
The average distance a molecule diffuses during a given time interval can be calculated. It is
called the diffusion length. If the diffusion length is large compared to the largest distance that a
molecule needs to travel in order to strike the catalyst-coated wall, then diffusion will not be a
limiting factor. In that case, temperature will be the only determinant of the amount of the fuel
that is combusted as the mixture flows through the chamber.
Requirement (b) above dictates that a high thermally conductive material be used for the
chamber and that the cross-sectional area of the chamber be sufficient so that, taking into account
the heat power generated by combustion and also the length of the flow channel, the temperature
difference between the ends of the channel is less than the desired temperature uncertainty.
Requirement (c) dictates that the height of the channel be small enough that -- taking into
account the gas flow velocity, the chamber length, and molecular diffusion coefficient -- the
resulting (lateral) molecular diffusion length will be much larger than the channel height.
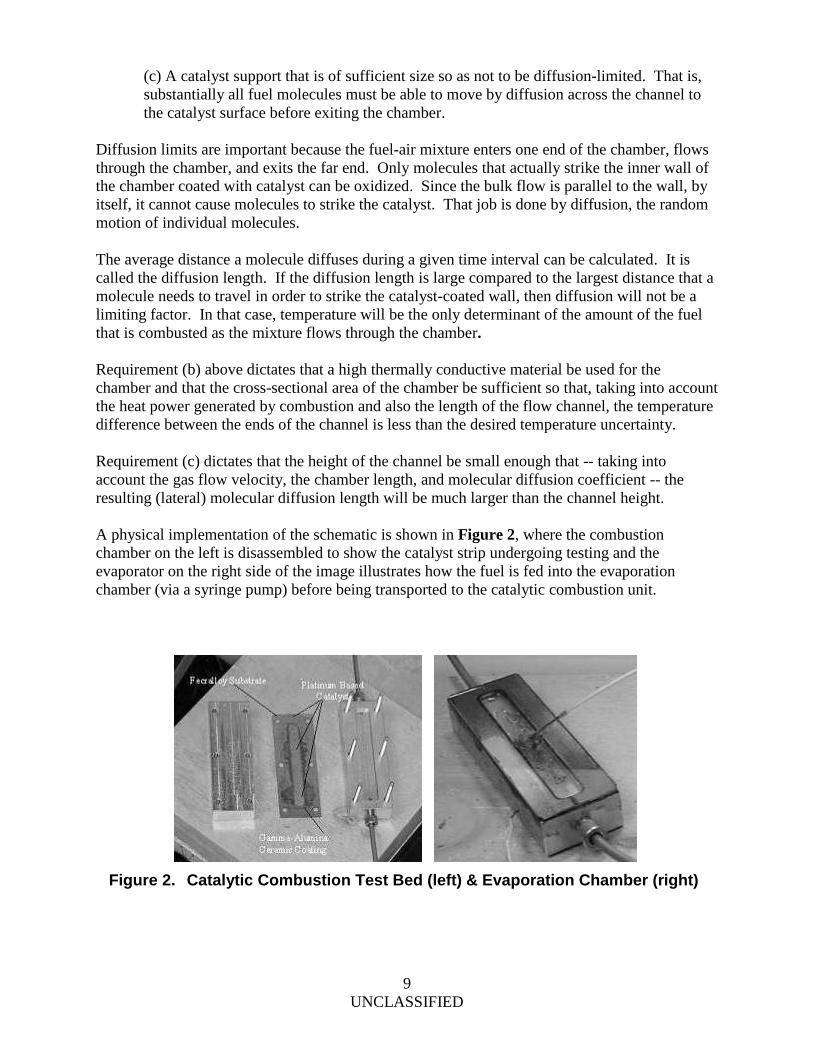
A physical implementation of the schematic is shown in Figure 2, where the combustion
chamber on the left is disassembled to show the catalyst strip undergoing testing and the
evaporator on the right side of the image illustrates how the fuel is fed into the evaporation
chamber (via a syringe pump) before being transported to the catalytic combustion unit.
Figure 2. Catalytic Combustion Test Bed (left) & Evaporation Chamber (right)

10
UNCLASSIFIED
The rate of feed of the syringe pump is controlled by a computer program to allow a precise
control and measurement of the fuel/air mixture entering the flameless combustion unit. Both
the evaporation unit and combustion unit are maintained in an isothermal condition by way of
thermostatically controlled heat sinks.
In preparation for testing of the target fuel, JP-8, simple aliphatic alkane molecules
(i.e., methanol & ethanol) were first used to calibrate and test the concept and apparatus to
determine the degree of combustion as a function of temperature.
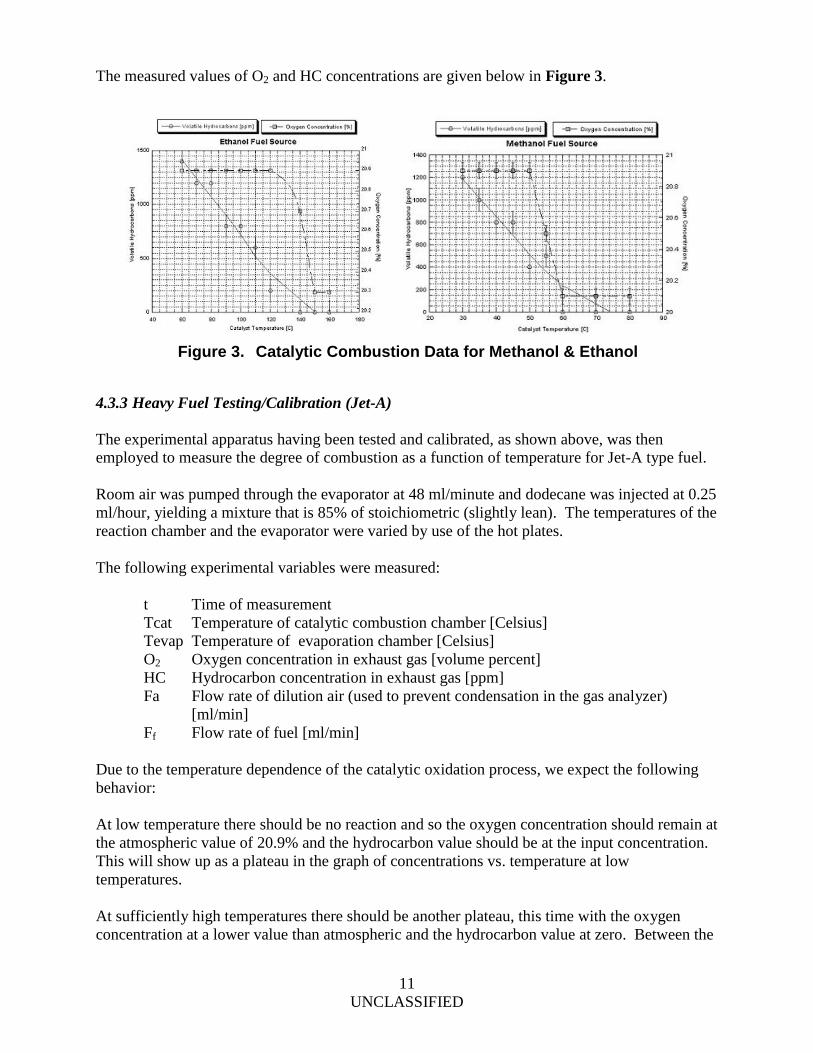
4.3.2 Light Fuel Testing/Calibration (Methanol and Ethanol)
Because methanol and ethanol are volatile at room temperature, a bubbler was temporarily
substituted for the fuel vaporizer unit shown in Figure 2. Room air was bubbled through the
liquid alcohol fuel maintained at an approximately constant temperature, thereby producing a
known fuel/air mixture. The temperature of the reaction chamber was varied by use of the
thermostatically controlled heat sink (hot plate). During some data runs, the chamber was placed
on a block of thermal insulator material, allowing the temperature to vary slowly (about 2 °C per
minute) downward by ambient air cooling.
The following experimental variables were measured:
t Time of measurement
Tcat Temperature of catalytic combination chamber [Celsius]
Tbub Temperature of liquid in bubbler [Celsius]
O2 Oxygen concentration in exhaust gas [volume percent]
HC Hydrocarbon concentration in exhaust gas [ppm]
Fa Flow rate of dilution air (used to prevent condensation in the gas analyzer)
[ml/min]
Ff Flow rate of air into bubbler containing methanol or ethanol [ml/min]
Due to the temperature dependence of the catalytic oxidation process, we expect the following
behavior:
At low temperature there should be no reaction; therefore, the oxygen concentration should
remain at the atmospheric value of 20.9% and the hydrocarbon value should be at the input
concentration (i.e., the plateau in the graph of concentrations vs. temperature at low
temperatures). At sufficiently high temperatures there should be another plateau, this time with
the oxygen concentration at a lower value than atmospheric and the hydrocarbon value at zero.
Between the low and high temperature plateaus we should see a transition in which partial
oxidation occurs (along with possible side reactions). If no high-temperature plateau occurs then
the oxidation is not complete.
During the run, the bubbler temperature varied between 24.9 and 25.1 °C. The bubbler input air
flow was constant at 31 ml/min and the dilution air flow was constant at 800 ml/min. The
measurements were commenced at Tcat of 80 °C and terminated at 30 °C.
11
UNCLASSIFIED
The measured values of O2 and HC concentrations are given below in Figure 3.
4.3.3 Heavy Fuel Testing/Calibration (Jet-A)
The experimental apparatus having been tested and calibrated, as shown above, was then
employed to measure the degree of combustion as a function of temperature for Jet-A type fuel.
Room air was pumped through the evaporator at 48 ml/minute and dodecane was injected at 0.25
ml/hour, yielding a mixture that is 85% of stoichiometric (slightly lean). The temperatures of the
reaction chamber and the evaporator were varied by use of the hot plates.
The following experimental variables were measured:
t Time of measurement
Tcat Temperature of catalytic combustion chamber [Celsius]
Tevap Temperature of evaporation chamber [Celsius]
O2 Oxygen concentration in exhaust gas [volume percent]
HC Hydrocarbon concentration in exhaust gas [ppm]
Fa Flow rate of dilution air (used to prevent condensation in the gas analyzer)
[ml/min]
Ff Flow rate of fuel [ml/min]
Due to the temperature dependence of the catalytic oxidation process, we expect the following
behavior:
At low temperature there should be no reaction and so the oxygen concentration should remain at
the atmospheric value of 20.9% and the hydrocarbon value should be at the input concentration.
This will show up as a plateau in the graph of concentrations vs. temperature at low
temperatures.
At sufficiently high temperatures there should be another plateau, this time with the oxygen
concentration at a lower value than atmospheric and the hydrocarbon value at zero. Between the
Figure 3. Catalytic Combustion Data for Methanol & Ethanol
12
UNCLASSIFIED
low and high temperature plateaus we should see a transition in which partial oxidation, along
with possible side reactions, occurs. If no high-temperature plateau occurs then the oxidation is
not complete.
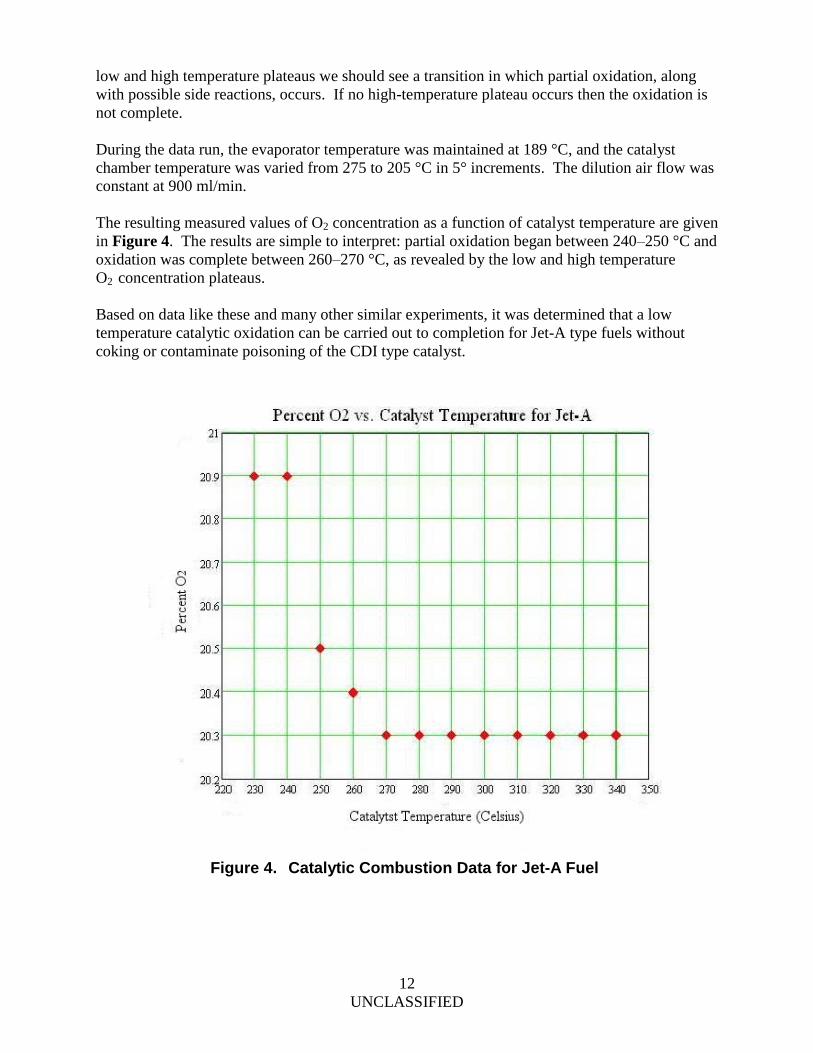
During the data run, the evaporator temperature was maintained at 189 °C, and the catalyst
chamber temperature was varied from 275 to 205 °C in 5° increments. The dilution air flow was
constant at 900 ml/min.
The resulting measured values of O2 concentration as a function of catalyst temperature are given
in Figure 4. The results are simple to interpret: partial oxidation began between 240–250 °C and
oxidation was complete between 260–270 °C, as revealed by the low and high temperature
O2 concentration plateaus.
Based on data like these and many other similar experiments, it was determined that a low
temperature catalytic oxidation can be carried out to completion for Jet-A type fuels without
coking or contaminate poisoning of the CDI type catalyst.
Figure 4. Catalytic Combustion Data for Jet-A Fuel

13
UNCLASSIFIED
4.3.4 Heavy Fuel Reforming
A significant challenge for heavy-fuel AFCT devices is the requirement that the entire catalytic
combustor be preheated to a temperature of over 300 °C prior to the initiation of fuel and air
flow.
Another difficulty with the evaporation and combustion of Jet-fuel is that the evaporation must
be accomplished in close proximity to the combustion, because the fuel-air mixture from the
evaporator will have a high dew point of about 200 °C. Transport of the fuel-air mixture
between a separate evaporator and combustor would require that the transport path be maintained
at a high temperature, which would, in turn, require bulky (and inflexible) thermal insulation as
well as a method of raising and maintaining the high temperature.
It is possible to maintain the heat along the pathway by performing partial oxidation reactions
throughout the conduit. At this stage of development, in order to maintain schedule it was
decided this approach could be revisited at a later time -- after first designing and testing the
basic system.
The above limitations make the evaporation and catalytic combustion of jet-fuel significantly
more difficult than, for example, methanol. A technical approach that may circumvent these
limitations would be to include a device that could convert the jet-fuel into a different liquid fuel
having a much lower boiling point. This would eliminate the problem of condensation and
which would catalytically oxidize at a relatively low temperature.
In conforming with the methodology outlined at the beginning of the report, multiple approaches
to solving a problem would be explored when feasible.
One such alternate approach is a fuel processing technique known as "fuel reforming." There
exists a considerable technological data base that would allow the development of reformers
using jet-fuel. The reformer would output a product known as "synthesis gas" or "syngas," -- an
equimolar mixture of hydrogen and carbon monoxide.
This type of fuel processor is also known as a partial oxidation reformer. The integration of such
a reformer with the evaporator would result in a fuel that would remain a gas down to about -
200 °C, thereby enabling easy transport over an arbitrary distance to the combustor.
The question of the temperature required to allow complete catalytic combustion of the syngas
was explored. To answer this question, we conducted experiments using proprietary CDI
catalyst technology.
To determine the temperature required to completely combust syngas, it is necessary to construct
an apparatus that will allow for a quantitative measurement of the extent of catalytic oxidation
for a given fuel as a function of temperature.
14
UNCLASSIFIED
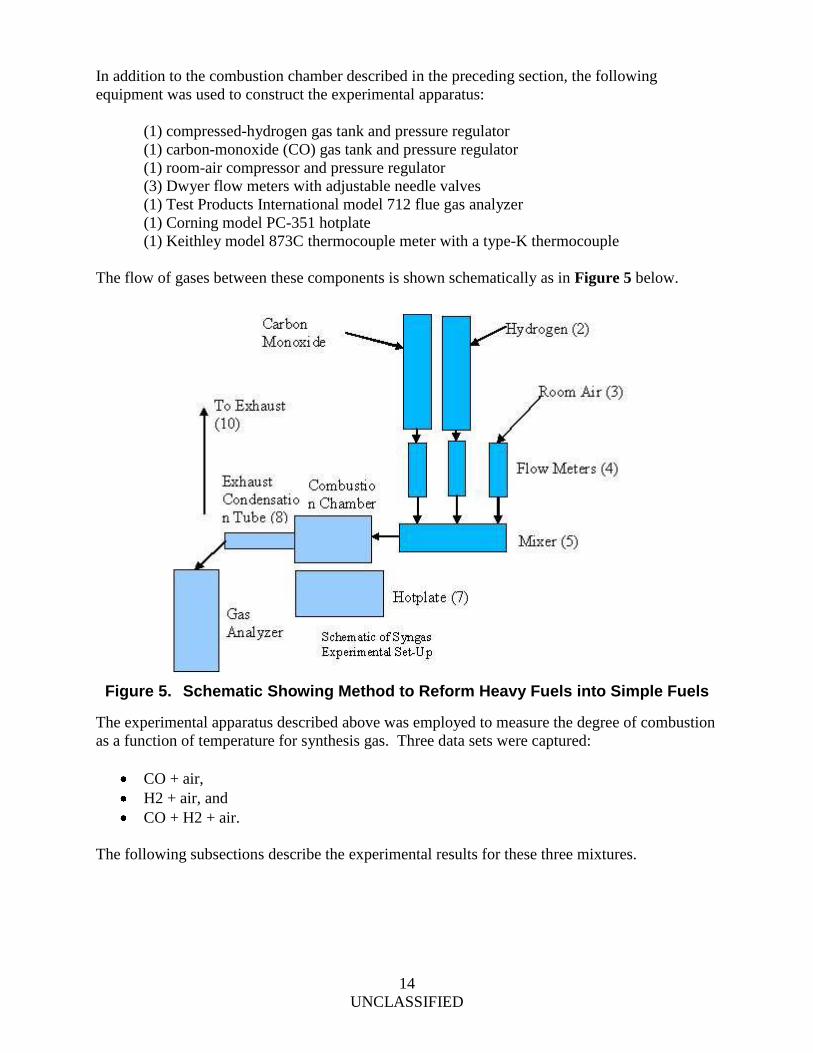
In addition to the combustion chamber described in the preceding section, the following
equipment was used to construct the experimental apparatus:
(1) compressed-hydrogen gas tank and pressure regulator
(1) carbon-monoxide (CO) gas tank and pressure regulator
(1) room-air compressor and pressure regulator
(3) Dwyer flow meters with adjustable needle valves
(1) Test Products International model 712 flue gas analyzer
(1) Corning model PC-351 hotplate
(1) Keithley model 873C thermocouple meter with a type-K thermocouple
The flow of gases between these components is shown schematically as in Figure 5 below.
The experimental apparatus described above was employed to measure the degree of combustion
as a function of temperature for synthesis gas. Three data sets were captured:
CO + air,
H2 + air, and
CO + H2 + air.
The following subsections describe the experimental results for these three mixtures.
Figure 5. Schematic Showing Method to Reform Heavy Fuels into Simple Fuels

15
UNCLASSIFIED
Carbon-Monoxide + Air:
The first experiment used a lean (80 ml/min air and 10 ml/min CO -- equivalence ratio = 0.3)
mixture of air and CO. It is well known that CO has a high affinity for platinum and so we
expect that this mixture will require a high temperature to begin combustion.
We concluded that the CO/air mixture requires temperatures in the range of 300 °C for
substantially complete combustion.
H2 + Air
The second data set was acquired using an approximately stoichiometric mixture of air and
hydrogen (100 ml/min air and 40 ml/min hydrogen -- equivalence ratio = 0.96).
A small platinum catalyst sensor was inserted into the end of the exhaust condensation tube to
serve as a rough combustible gas sensor. The hotplate was turned on and set to a ramp rate of
about 3 °C per minute. The sensor indicated the presence of H2 exhaust until a temperature of
75 °C was reached.
CO + H2 + Air (Syngas)
For the combustion of synthesis gas we would expect that the temperature required for
substantially complete combustion would be between the (high) temperature found for CO + air
and the (low) temperature found for H2 + air. To determine this temperature, we used a slightly
lean mixture (250 ml/min air, 42 ml/min CO, and 42 ml/min H2 -- equivalence ratio = 0.8).
The experiment was begun at 140 °C with the hotplate set to a ramp rate of about 3 °C/min. The
probe of the gas analyzer was inserted at 160 °C and left in place. The CO sensor reading was
not used due to the high (off-scale) concentration of CO. The O2 sensor readings as a function of
temperature are depicted in the graph shown in Figure 6.
Figure 6. Catalytic Combustion Data for Jet-A Fuel

16
UNCLASSIFIED
This demonstrated that syngas created from jet-fuel by means of a partial oxidation reformer
would eliminate condensation in transfer lines between the evaporator/reformer and catalytic
reactor.
However, the catalyst temperatures required to combust syngas are in the same range as for
catalytic combustion of jet-fuel vapor using the current catalyst. Therefore, the use of flexible
materials -- typically requiring temperatures less than 200 °C -- which are desirable for
implementing AFCT, are problematic when using syngas.
CDI is working on new designs for extending AFCT to these higher temperatures while retaining
all of the flexibility, lightweight and surface-conforming features.
Because of progress in these two areas, the advantage of nearly unlimited transport of the
gaseous fuel/air mixture, without condensation issues, may be significant enough to warrant a
revisit of the reforming approach in the future.
4.3.5 Dynamic Azeotrope Evaporator
The methodology explored next is directed toward extending the currently successful method
utilized at CDI with simple fuels, to be applicable to heavy fuels.
Evaporation of jet-fuel is considerably more difficult than evaporation of a pure liquid, such as
methanol, due to several factors:
● Jet-fuel is a complex mixture of literally hundreds of chemical compounds with different
boiling points, resulting in a boiling temperature range instead of a sharp boiling point.
● Evaporation of such a mixture generally results in a change in composition of the fuel
and vapor over time (distillation), since the low-boiling components tend to evaporate
early in the process.
● Jet-fuel contains chemical species, such as olefins, that are reactive and can cause
degradation of the fuel, especially when the fuel is in contact with air, heat, and/or light.
The degradation consists of the production of new fuel components that have very low
volatility or may be non-volatile.
● Jet-fuel can contain particulate matter.
● The composition can vary from batch to batch, since the feedstock from which it is
produced is of natural origin.
The problem posed by distillation is that the temperature and composition of both the liquid and
vapor will generally change over time. This makes the constant power output operation of the
combined evaporation/combustion system difficult or impossible. For example, if air is bubbled
through a heated volume of jet-fuel, the resulting fuel-air mixture will contain an excess of the
low-boiling fuel components. As these light components are distilled off, the temperature of the
liquid must be increased in order to maintain the air-fuel mixture (known as the equivalence
ratio) within the design range of the combustor.
This problem does not exist for a special type of mixture known as an azeotrope. An azeotropic
mixture has the property that the composition of the liquid and the vapor remain constant during
evaporation. The most well-known of these mixtures is the combination of 95% ethanol and

17
UNCLASSIFIED
5% water. Unfortunately, jet-fuel is not an azeotropic mixture and actually has a relatively wide
boiling range, beginning at 180 °C and ending at 260 °C.
It is possible to design an evaporator that produces a dynamic azeotrope, resulting in a system in
which the composition of the vapor is identical to that of the fuel. This would then assure a
constant evaporation temperature and vapor composition.
A dynamic azeotrope will occur in an evaporation system that possesses the following attributes:
● Evaporation takes place at a stable liquid-vapor boundary.
● The flow of liquid fuel from the fuel reservoir to the boundary is laminar (i.e., no
turbulence or other mixing effects occur) and entirely directed toward the boundary.
In such a system, when evaporation begins the composition of the liquid at the liquid-vapor
boundary will change as low-boiling components evaporate, leaving higher-boiling components
in the liquid. The requirement of laminar flow toward the boundary prevents the higher-boiling
components from being carried back to the supply, except by the process of molecular diffusion.
The balance of liquid flow toward the boundary and diffusion of heavy fuel components away
from the boundary will result in a stable concentration gradient that can be confined to a region
near the liquid-vapor boundary. A stable composition at the boundary, in turn, results in a vapor
composition which is identical to the composition of the fuel in the reservoir.
In other words, the liquid at the boundary becomes enriched in heavy fuel components and
increases in temperature until the heavy components reach a particular composition and
temperature, causing an evaporation rate balancing the rate that heavy components are delivered
by the liquid to the boundary. When such a stable composition and temperature steady state is
achieved, a dynamic azeotrope has been created.
The dynamic azeotrope is achieved by the balance of liquid flow toward the liquid-vapor
boundary and the diffusion of high-boiling components away from the boundary (i.e., toward the
fuel reservoir). If the heat required to evaporate the liquid is applied only at the liquid-vapor
boundary, another balance will automatically be achieved: a balance between heat conducted
through the liquid from the boundary toward the reservoir and the cold liquid flowing toward the
boundary. This will produce a temperature gradient such that the heat producing the evaporation
will not propagate to the fuel reservoir.
In addition to the two design requirements identified above, it is also necessary that the system
reach a dynamic azeotrope steady state in a short time relative to the operation time of the
evaporator. This is important, because during this start-up interval the temperature and
composition of the fuel will be varying. This can be achieved by requiring that the fuel volume
contained in the evaporator porous media be a small fraction of the total fuel volume in the
reservoir.
18
UNCLASSIFIED
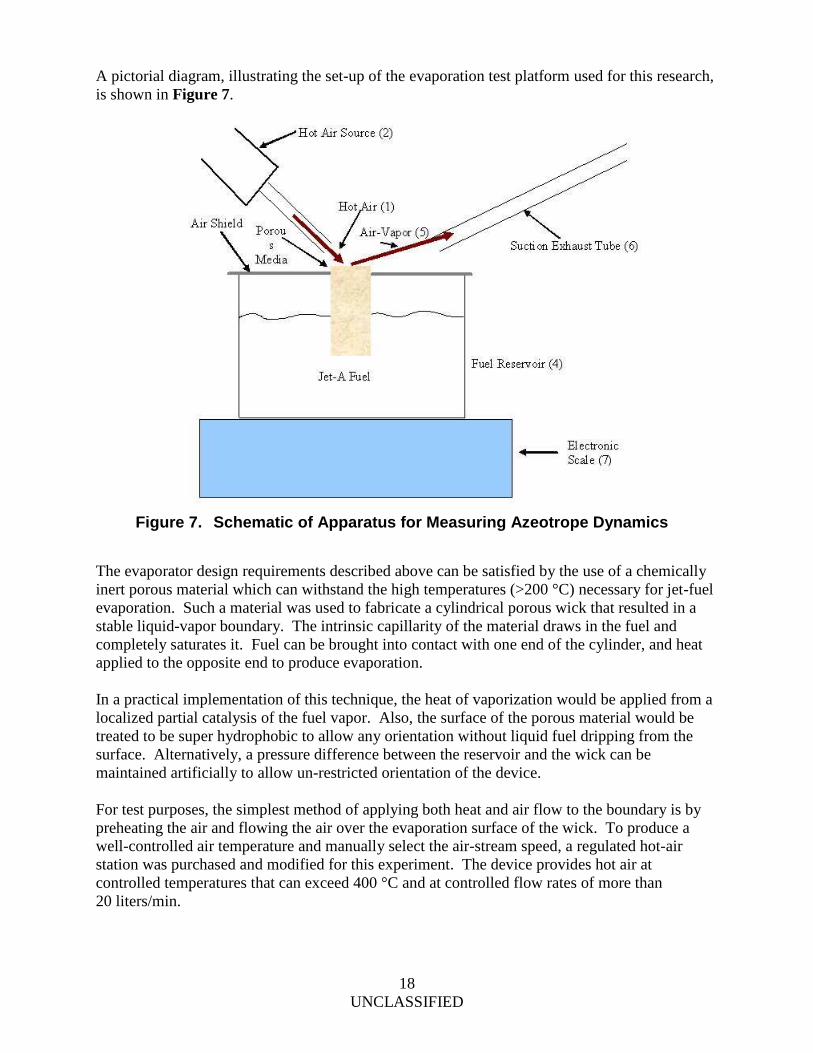
A pictorial diagram, illustrating the set-up of the evaporation test platform used for this research,
is shown in Figure 7.
The evaporator design requirements described above can be satisfied by the use of a chemically
inert porous material which can withstand the high temperatures (>200 °C) necessary for jet-fuel
evaporation. Such a material was used to fabricate a cylindrical porous wick that resulted in a
stable liquid-vapor boundary. The intrinsic capillarity of the material draws in the fuel and
completely saturates it. Fuel can be brought into contact with one end of the cylinder, and heat
applied to the opposite end to produce evaporation.
In a practical implementation of this technique, the heat of vaporization would be applied from a
localized partial catalysis of the fuel vapor. Also, the surface of the porous material would be
treated to be super hydrophobic to allow any orientation without liquid fuel dripping from the
surface. Alternatively, a pressure difference between the reservoir and the wick can be
maintained artificially to allow un-restricted orientation of the device.
For test purposes, the simplest method of applying both heat and air flow to the boundary is by
preheating the air and flowing the air over the evaporation surface of the wick. To produce a
well-controlled air temperature and manually select the air-stream speed, a regulated hot-air
station was purchased and modified for this experiment. The device provides hot air at
controlled temperatures that can exceed 400 °C and at controlled flow rates of more than
20 liters/min.
Figure 7. Schematic of Apparatus for Measuring Azeotrope Dynamics

19
UNCLASSIFIED
The evaporator wick is fabricated from Zircar ZAL-45AA, a porous alumina, which is usually
used for high-temperature furnace insulation. The cylindrical wick was sealed to prevent
evaporation from the sides by the application of a layer of a thin layer of glass glazing. The
glazing has a coefficient of thermal expansion that is matched to the porous material. The top
and bottom surfaces of the wick were left unsealed. This wick design can withstand
temperatures of over 700 °C if necessary.
The amount of heat delivered to the boundary is determined by the velocity and temperature of
the hot air, which is held constant during the experiment. The development of a dynamic
azeotrope will be signaled by the following process characteristics:
● A transient period in which the temperature of the boundary increases as the high-boiling
fuel components become concentrated at the boundary.
● A steady state in which the temperature of the boundary is constant.
If the fuel is degraded by non-volatile components, then the steady state will be replaced by a
pseudo-steady state in which the liquid-vapor boundary temperature increases at a particular rate.
This slow temperature increase is caused by the gradual accumulation of an assortment of fuel
components (i.e., different molecular weights) at the boundary. If these components have
moderately low-volatility, then the boundary temperature will eventually level off to a new
equilibrium. If the accumulation consists largely of non-volatiles (e.g., sludge), a continuous
temperature increase will result.
The resulting temperature of the hot air stream (top trace) and the evaporation boundary (bottom
trace) are recorded in Figure 8. This data validates the concept.
Figure 8. Data Validating Dynamic Azeotrope Concept

20
UNCLASSIFIED
The top portion of the graph in Figure 8 showed that thermal energy was being delivered at a
steady rate. Any variation in this rate would be expected to show up as a variation in the bottom
portion of the graph. Subtracting the difference between the two data sets and differentiating
provides a measure of azeotrope drift rates. The resulting drift rate, within experimental error,
was found to be zero.
These results indicate that a dynamic azeotrope is successfully achieved, and that no significant
increase occurred in the azeotrope equilibrium temperature after the first hours of evaporation.
Consequently, it appears that this evaporation methodology can be employed to provide effective
jet-fuel evaporation for periods exceeding of tens of hours.
To determine if a stable dynamic azeotrope can be established in a practical and efficient
evaporator design, it was desirable to design an evaporator for which the evaporation rate is
approximately constant over the evaporating surface.
For a practical evaporator, it is important that the air-fuel flow be enclosed in a channel instead
of using the unbounded approach taken in the design of the experimental evaporation apparatus.
Since the evaporation rate is a function of temperature, as well as fuel-vapor concentration and
boundary-layer thickness, such a design will require a flow channel whose thickness decreases so
as to increase the air-fuel velocity along the flow direction.
A basic conceptual cylindrical design incorporating these features is illustrated in Figure 9:
Figure 9. Design Geometry Incorporating Dynamic Azeotrope Principle

21
UNCLASSIFIED
Several evaporative bodies of the half-ellipsoid shape shown in Figure 9 were fabricated using a
variety of porous aluminas from Zircar. One with a diameter of 17 mm and length of 22 mm was
bonded to a Pyrex tube to provide a connection to the fuel reservoir, installed in the apparatus
shown in Figure 10, and run for 10 to 20 hours.
The fuel reservoir was placed on a sensitive scale to monitor the evaporation rate. The
evaporative body was enclosed by a Pyrex tube with an inner diameter of 23 mm. The tube was
press-fit onto the hot-air source by the use of Teflon tape as a gasket. A cylindrical piece of
reticulated aluminum open-cell foam was inserted into the Pyrex tube above the hot-air source to
serve as a flow-straightener, since the output of the hot-air source was found to be highly non-
uniform.
Figure 11 shows the evaporative body before and after the 20 hours of operation, and illustrates
the discoloration that results when either accelerated aged fuel or purposely contaminated fuel is
used. The cross-sectional view on the right shows an axially symmetric discoloration. It is
Figure 10. Table-Top Dynamic Azeotrope & Catalytic Combustion Test Bed
Figure 11. Evaporative Body Showing Before & After Extended Use

22
UNCLASSIFIED
believed that this occurs as a result of a very mild catalytic reaction between the alumina wick
material and the fuel. Some of the fuel's molecular components are believed to have been slowly
converted to higher molecular weight compounds that are non-volatile and become attached to
the alumina fibers. The lighter areas of the wick are marked by a subtle small-scale pattern that
we theorized may be due to phase separation and/or the Marangoni Effect. The large-scale
pattern may be due to the highly non-uniform hot-air velocity and temperature distribution over
the wick surface, which would cause its own Marangoni flow (surface tension decreases with
increasing temperature). It is likely the non-uniform hot-air flow is responsible for at least a
portion of the deposition.
To test this hypothesis, a similar evaporative body was constructed using Ferro 3249 silica
powder, formed and sintered into a suitable shape
The silica evaporative body was then run through the same fuel evaporative testing as the
alumina body. The results showed no detectable discoloration of the evaporative body, lending
support to the hypothesis that surface chemistry in the alumina was altering the fuel composition.
The silica has other properties that reduce the possibility of chemical interaction. In particular it
has a much lower thermal conductivity -- this lowers the temperature experienced by the fuel
during transport to the evaporating surface -- and it has a microstructure absent the filaments or
whiskers found in alumina. The absence of filaments is important, because filament structures
provide a higher surface area for reactions to occur upon.
4.3.6 Effects of Fuel Aging
We now describe the results of the effects of fuel contamination and degradation and test the
mitigation of such effects, most critically a reduction in the evaporation rate.
Fuel degradation can occur at any point in the supply chain between the refinery and the
introduction of the fuel into the device. The degradation can be caused by several factors:
● Chemical reactions between fuel components
● Chemical reactions between fuel components and air
● Chemical reactions enhanced by the surface chemistry of containers or tubing materials
● Chemical reactions between fuel components and container or tubing materials
● Container or tubing material components being dissolved into the fuel liquid
In addition, the fuel can be further degraded within the device unless the device is specifically
designed to minimize degradation.
Fuel degradation is detrimental to an evaporator due to the potential for inclusion of low-
volatility or non-volatile chemical species at the liquid-vapor boundary. An admixture of low-
volatility or non-volatile components in the fuel liquid can result in the deposition of such
components at the liquid-vapor boundary. Such deposits can result in inhibition of liquid flow
that will degrade the operation of the evaporator, possibility to the point of failure.

23
UNCLASSIFIED
The proper design of the evaporator must prevent such degradation from resulting within the
useful lifetime of the device. Conversely, if such degradation is unavoidable, designing easy
maintenance options, such as replaceable evaporator surfaces, can be done if necessary.
To minimize fuel degradation within the device, the temperature of the fuel liquid should be kept
as low as possible to decrease the reaction rate for chemical reactions that can degrade the fuel.
This turns out to be readily accomplished and a natural consequence of the stable temperature
gradient that becomes established as the dynamic azeotrope takes effect.
The requirement of a stable liquid-vapor boundary with heat applied only to the boundary,
however, yields advantages such as:
producing a minimum possible increase in the temperature of the liquid,
relative orientation insensitivity, and
a suitable surface for integration of sensors, mitigation devices, catalysts, etc. This then
allows for implementation of practical, commercially viable designs.
Since catalytic combustion requires a fuel vapor-air mixture, rather than pure fuel vapor, there is
an additional means of reducing the fuel liquid temperature. Designing the evaporator so that air
flows over the fuel-vapor boundary will cause the liquid temperature at the boundary to be less
than the temperature that would be required if pure vapor were to be produced, because the
presence of the air decreases the partial pressure of the vapor below atmospheric temperature.
The selection of all materials that come into contact with the fuel, such as the reservoir and
interconnect tubing, must take into account the degradation processes listed above. In particular,
both practical experience as well as literature searches confirm that various metals and polymers
are known to cause fuel degradation or contamination and need to be avoided.
If these components have moderately low-volatility, then the boundary temperature will
eventually level off to a new equilibrium. If the accumulation consists largely of non-volatiles
(e.g., sludge), a continuous temperature increase will result.
The following protocol was used to produce Jet-A degraded by the combination of exposure to
air and elevated temperature.
The fuel samples are designated as :
Fresh: Jet-A Stored for 10 months in polyethylene without exposure to air, light, or
elevated temperatures
Lightly Aged: Jet-A aged in the lab by refluxing for 18 hours at 100 °C and aerated at the
concurrently.
Contaminated: Jet-A purposely contaminated separately with PVC tubing palsticizer and
then in another batch with water only.
The plasticizer generally employed in PVC tubing is DEHP (di-2-ethyl hexyl phthalate), which
has a boiling point of 385 °C, but which undergoes thermal decomposition in the 180 °C range.
DEHP is also highly soluble in hydrocarbon liquids. Since PVC tubing is in widespread use, we
examined DEHP contamination. Phthalate plasticizers have been used by some manufacturers in

24
UNCLASSIFIED
making so called fuel-tolerant plastic tubing; therefore, it is assumed that this particular
plasticizer is representative of the many other phthalate type plasticizers found in a wide variety
of plastics and might be encountered in the field.
The second contaminate used was water. In the examples shown below, the water contamination
level was set at ~3% by volume. The water was made to be semi-miscible by drop-wise addition
over an hour's time at elevated temperatures and with constant stirring. This is a rather high
level, and it is felt it would seldom be encountered in practice, but represents an upper bound to
fuel that is sitting around in partially filled tanks for long periods where condensation could be
present.
During tests with fresh Jet-A and lightly-aged Jet-A, the evaporating surface of the wick was not
significantly discolored. Only a slightly yellow stain was noted and appeared have only a small
effect on the evaporation rate or dynamic azeotrope.
In contrast to this result, tests run using the extract obtained from exposing PVC tubing to Jet-A
shows a wick that rapidly darkened. It eventually turned completely black after only a single
test. This can be seen in Figure 12.
Figure 12. Close-up of Test Surface After Running Contaminated Jet-A

25
UNCLASSIFIED
Further testing was done using various combinations of aged and contaminated fuel. The results
are recorded in Figure 13 and Figure 14. The left side of Figure 13 shows the plasticzer
causing an increase in the boundary temperature of the evaporator surface. This is interpreted to
mean that the azeotrope is breaking down and the fuel/air composition is therefore not stable
(i.e., constant in composition over time). The right side of Figure 13 shows a constant
temperature over time and illustrates how a near perfect dynamic azeotrope should appear.
Figure 14 shows a similar but less pronounced effect of an unstable azeotrope which results
from water contaminated fuel. Note that in comparison to the plasticizer contaminate the water
contamination is a much smaller temperature change over a much longer period.
It was determined that only the plasticizer (phthalates) contamination mechanism appeared to
result in significant deviations from stable evaporation.
These results are interpreted to mean that the dynamic azeotrope technique will work well with
any "normal," reasonable quality, jet-fuel.
Plasticizer-Contaminated Jet-A Fresh Jet-A
Figure 13. Effect on Azeotrope from Aged & Contaminated Fuel
Figure 14. Effect on Azeotrope from Water Contaminated Fuel

26
UNCLASSIFIED
4.3.7 Vibrating Shutter Nebulizer
The vibrating mesh approach is an alternative approach to providing a metered flow of micro-
atomized fuel to a catalytically active surface or reactor. In this method, droplets of fuel are
formed by rapid motion of an actuator that creates transient pressure pulses on the liquid surface
of the fuel. The surface of the liquid is in contact with a thin sheet of metal that has a multitude
of microscopic holes. If the pressure transient is of sufficient magnitude, the liquid is forced
through the holes and forms a free droplet traveling away from the surface. A series of droplets
are driven out of the microscopic holes during each pressure pulse. Between pulses, the actuator,
located below the metal screen, retracts and pulls in fluid from an adjacent reservoir.
Figure 15 illustrates the principle components of such a mechanism and shows the free droplets
exiting the metal screen.
The typical orifice size for the metal screen is on the order of 5 microns in diameter separated by
a distance of about 100 microns. The resulting spray of droplets is somewhat analogous to the
inkjet devices, although, unlike the ink jet, the droplets cannot be made to selectively exit from
any particular orifice.
Figure 15. Nebulizer Principle of Operation

27
UNCLASSIFIED
A example showing the use of a vibrating mesh nebulizer with both methanol and Jet-A is shown
in Figure 16. It can be seen on the left that the methanol droplets vaporized quickly after being
ejected from the nebulizer mesh plate. This is because of the high volatility property of
methanol. The picture on the right shows the vapor trail for Jet-A. The trail is more distinct than
the methanol, because Jet-A is much less volatile than methanol; the drops therefore travel
relatively long distances in the air before being dispersed by air currents. The Jet-A droplets
never actually vaporized at room temperature, but merely drift away from each other until they
are no longer visible.
For the nebulizer to be a useful fuel metering device for catalytic oxidation reactions, it was
necessary to complete the vaporization process. This can be done by including one of several
techniques.
One method is to preheat the Jet-A. An alternative approach is to allow the droplets to impact a
pre-heated catalytic surface (e.g., electrical pulse), releasing chemical energy, and forcing the
catalytic surface to eventually reach a temperature sufficient to complete vaporization of the rest
of the droplet stream.
In the latter stage of this project, in concert with the Army technical point of contact, it was
determined that a low-risk fuel metering approach should be the focus. This would allow the
project to move more rapidly toward a specific application that could be deployed in the
remaining contract time period.
To complete the application deployment within the time constraints, the nebulizer became the
preferred vaporizer method. Although the dynamic azeotrope technique described earlier has
many advantages over the nebulizer, it was not yet in a state of development that would allow for
drawing up prototype fabrication designs and thereby provide a lower risk implementation.
Methanol Jet-A
Figure 16. Nebulizer Output Stream with Methanol or Jet-A

28
UNCLASSIFIED
Figure 17 illustrates the relative size and form of a typical nebulizer head using the vibrating
mesh approach.
section break (even)
Figure 17. View of Nebulizer Head Assembled

29
UNCLASSIFIED
5. Prototype Design and Construction
In the last quarter of the development effort, the focus was toward a demonstration unit that
would allow the in-field soldier to connect his personal hydration water supply unit to an
accessory device that would "instantly" produce an output stream of hot water. The hot water
could then be utilized for a variety of beverage or dehydrated foods.
A re-alignment of project goals was achieved through the joint partnering of CDI and Creare.
Both the technique for generating heat and the end application were modified to reduce technical
risk and improve delivery schedules.
The primary fuel metering component selected was the Creare vibrating mesh nebulizer in
conjunction with an electronically-controlled fuel pump. It was decided Creare’s experience in
constructing and working with this novel fuel metering and atomizing technique (i.e., ultrasonic
nebulization) made it a reasonable choice for maintain the development schedule. In addition
they provided sub-system integration services.
CDI provided the basic system architecture, heat transfer studies and optimization designs, as
well as catalytic combustor plates, electrically-activated catalytic reaction promoter (i.e., the
starter), air pump design and construction, water cooled heat exchanger, and selection of the
electrically-activated fluid (water) control valve.
Additional aspects of the process, such as conversion of the fuel droplets to a useful heat output
(e.g., droplet transport uniformity, vaporization, starting mechanism, etc.), overall architecture
required to maintain proper energy balance, and thermo-electrics configuration, were largely
driven by CDI’s design team. So the project schedule could be met, it was decided toward the
end of the project to not integrate the thermo-electrics module into the system.
Most of what was learned in the earlier part of the project was adapted for this stage of the effort,
but several new technical challenges arose and required a rapid development of new designs.
The highlights of this design and construction process are presented in the following section.
5.1 Preliminary System Design for the Flow-Through Water Heater
Figure 18 shows the basic system architecture and form and fit design for the flow through
catalytic water heater, aka Instant Water Heater. The several views shown in the figure illustrate
some of the design constraints examined.
For example, the choice of location of the fuel was carefully considered as it would effect how
much the fuel mixture would pre-heat before the nebulizer received the fuel. The selection of
where to place the electronics was important, not just from a heat and space perspective, but also
driven by the desire to limit the distance to the nebulizer to avoid having the high voltage cable
(several hundred volts) cross through or around the fuel source.
The diameter and thickness of the catalytic combustor plate were studied because they effect the
pressure drop that the air pump must overcome. Mathematical calculation and experimental
efforts were employed to arrive at the best solution.

30
UNCLASSIFIED
If the combustor plate is too large, the pressure drop will be low, but then the surface
temperature is reduced -- and thus the radiant energy transfer rate to the heat exchanger. It also
causes issues with uniformity of combustion and difficulty with electronic light-off. On the
other hand, if the plate is too small, it will overheat the catalyst, causing sintering of the platinum
particles and a consequential reduction in power output. These issues were resolved as described
in the following sections.
Other trade-off studies were directed toward whether the air pump and battery should be internal
or external, optimum distance from the combustor plate and heat exchanger, degree of heat
recuperation from the exhaust, size of the fuel tank, method of controlling water flow through the
exchanger to avoid vapor-lock (i.e., steam bubbles preventing flow) and proper shut down in
case of non-standard conditions (e.g., sudden loss of water supply).
The performance requirement for the IWH is to heat two cups (473 ml) of water from 40 °F to
200 °F, in 10 minutes, under conditions of continuous hot water flow exiting the system.
Figure 18. System Design Concepts
Catalytic
Combustor Plate
Electric
Motor
Fuel
Reservoir
External
Configuration

31
UNCLASSIFIED
Using the specific heat-capacity of water (4.184 joules/gram-K), the mass of water (473 grams)
and the desired temperature increase (160 °F = 89 °C), the required amount of heat energy is
176 kilojoules. If uniformly applied over 10 minutes, this amounts to a power level of 293 watts
at 100% efficiency.
If a conservative estimate of 60% efficiency is selected, this results in a power level of 488 watts
and a total heat energy of 293 kilojoules. Using the lower heating value of Jet-A of
43 kilojoules/gram and the fuel density of 0.81 grams/ml, the mass of fuel required will be
6.8 grams and the volume will be 8.4 ml.
The heater will employ flows of water, air, and fuel. The flow rates for the above quantities over
10 minutes time will be 0.79 ml/sec (47 ml/min) for water and 0.014 ml/sec (0.84 ml/min) for
fuel.
For a stoichiometric air/fuel mixture, the required air flow rate will be 148 ml/sec
(8.9 liters/min). To provide for complete combustion, we will employ a slightly lean mixture
with an equivalence ratio of 0.9, resulting in a required air flow rate of 9.9 liters/min.
Improvements in efficiency will result in a lower fuel requirement as well as a lower air flow
rate. 100% efficiency would result in a fuel consumption of 5.0 ml and a required air flow rate
of 5.9 liters/min.
5.2 Subsystem Modeling, Design & Testing
The control electronics package was provided by Creare. The original concept arrived at by CDI
proposed the following functionality:
Microcontroller for flow control, startup, and shutdown sequencing
Temperature sensor inputs
Liquid sensor inputs (for detection of priming and liquid depletion)
Pump control voltage outputs
TEG input (i.e., Thermo-Electric Generator -- later deleted from the deliverable)
Battery pack and charging circuit
To produce electrical power, a TEG was studied. The TEG could be bonded to the heat-
absorbing face of the water heat exchanger in the center of the spiral (described later). This
would provide for the lowest possible cold-face temperature for the TEG.

32
UNCLASSIFIED
The cold water enters in the center of the heat exchanger (HX) so as to ensure the hot face will
not exceed operational limits. TEG's from Hi-Z are designed to operate with a thermal power
flux of 10 watts/cm2, and this matches well with the calculated radiative power flux from the
catalytic combustor plate. The TEG could be sandwiched between a pair of aluminum plates to
act as heat spreaders and mounting interfaces, as shown in Figure 19.
In the course of the design effort, it was determined the TEG subsystem would add an additional
two months to the project and was deleted as a near term goal in order to maintain schedule.
The air pump design was decided to be a radial-vane pump engineered and produced by CDI.
The water metering device was self-priming and consisted of a solenoid activated valve. The
valve was placed up-stream of the water cooled heat exchanger. The siphon effect enabled the
use of only one valve placed at the inlet to the heat exchanger.
The siphon effect prevented water from flowing through the heat exchanger during the "off"
condition. To regulate water temperature, the valve was conceived with an idea that it could be
turned on and off in a manner such that the duty cycle could be actively altered by the electronics
and the average net flow-rate controlled as desired.
5.2.1 Catalytic Combustor & Heat Exchanger Subsystem
A computational study of the heat transfer mechanism was performed to provide a determination
of relative efficiency and the basic physical properties of the unit. The goal was to find a design
that allowed a rugged, compact, lightweight, readily manufacturable topology while allowing the
water to reach appropriate exit temperatures at specified flow rates.
The task was divided into four milestones:
(a) Advanced computational fluid dynamics (CFD) modeling experiments were
performed to assess basic theoretical feasibility of the design.
(b) Preliminary conceptual design for an integrated assembly containing (1) the
radiant/hot gas absorber surface, (2) heat diffuser plate, and (3) fluid conduit layer water
loop
(c) Assembly of a proof-of-concept heat transfer package
(d) A water flow rate controller and test set-up
Figure 19. Placement of TEG in Heat Flow Path

33
UNCLASSIFIED
Figure 20 and Figure 21 illustrate a result of milestone (a). They show the outcome of asking a
hypothetical question and answering it through CosmosFlowWorks, a CFD software program.
The hypothetical question was: What fluid path length would be required for the water to arrive
at a temperature equal to the average receptor plate temperature before exiting? Implicit to this
question are parameters such as flow rate, flow channel material properties, flow channel
dimensions and patterns.
To maintain a low weight and to provide for a simple and cheap manufacturing approach, it was
decided to use as much low-density polymer material in the construction as feasible. In practice,
making the whole serpentine path out of aluminum is possible, but not practical, because of
expense and weight, and also because the thermal mass of the whole heat transfer unit becomes
problematic. For instance, if the fluid is suddenly stopped, a large excess of thermal energy will
drain into the stationary water and could raise its temperature above boiling. To make the unit
safe using a solid metal mass might require special design and extra unit cost.
Figure 20. Inside Views of High Performance Heat Transfer Unit
Figure 21. Top and Bottom Views of Heat Transfer Unit
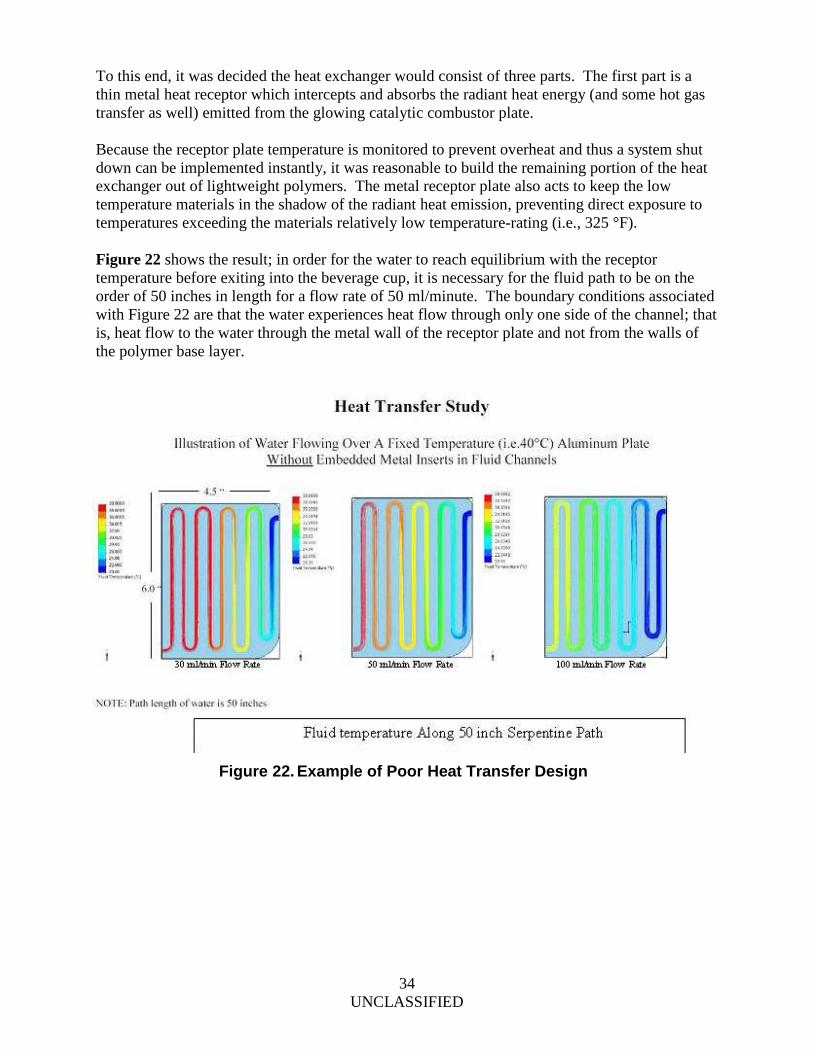
34
UNCLASSIFIED
To this end, it was decided the heat exchanger would consist of three parts. The first part is a
thin metal heat receptor which intercepts and absorbs the radiant heat energy (and some hot gas
transfer as well) emitted from the glowing catalytic combustor plate.
Because the receptor plate temperature is monitored to prevent overheat and thus a system shut
down can be implemented instantly, it was reasonable to build the remaining portion of the heat
exchanger out of lightweight polymers. The metal receptor plate also acts to keep the low
temperature materials in the shadow of the radiant heat emission, preventing direct exposure to
temperatures exceeding the materials relatively low temperature-rating (i.e., 325 °F).
Figure 22 shows the result; in order for the water to reach equilibrium with the receptor
temperature before exiting into the beverage cup, it is necessary for the fluid path to be on the
order of 50 inches in length for a flow rate of 50 ml/minute. The boundary conditions associated
with Figure 22 are that the water experiences heat flow through only one side of the channel; that
is, heat flow to the water through the metal wall of the receptor plate and not from the walls of
the polymer base layer.
Figure 22. Example of Poor Heat Transfer Design

35
UNCLASSIFIED
Figure 23 shows that the fluid path length, required to reach equilibrium with the receptor plate
temperature, can be easily dropped to half the former path length (i.e., 25 inches) if a metal insert
is included within the channel structure. As was seen in Figure 20, the insert chosen was
custom-made in the form of a rectangular stainless-steel spring.
Performance data for the completed unit, as illustrated in these figures was gathered using an
electrically regulated film heater bonded to the receptor plate. The results from this testing are
displayed in Table 2.
Four separate test criteria were run to establish a range of performance. Each test consisted of
fixing the receptor plate temperature and then flowing the water through at a constant rate of
50 ml/minute. The resulting water temperature at the exit was recorded. In this case, the fluid
path was by necessity less than the ideal length of 25 inches -- it was in fact set to 12 inches.
Figure 23. Significantly Improved Heat Transfer
Table 2. Heat Exchanger (HX) Test Results Test #1 Test #2 Test #3 Test #4
Inlet
Temperature20°C 20°C 20°C 20°C
Outlet
Temperature38°C 61°C 78°C 96°C
Water Flow
Rate50ml/minute 50ml/minute 50ml/minute 50ml/minute
Plate
Temperature50°C 75°C 100°C 120°C

36
UNCLASSIFIED
However, it can be seen from the result that the degree of over-temperature required of the
receptor plate to force the exit temperature of the water to near boiling is relatively minor. The
primary reason for the shorter than ideal path length was simply that the metal insert was
designed before the ideal path length was confirmed through modeling; therefore, the channel
widths were fixed to match the insert width. In the future, reducing the channel width and metal
insert width by half will result in a full 25 inches within the same device size, improving heat
transfer efficiency.
Figure 24 shows the same heat exchanger data. It is indicating that the water temperature
reaches roughly 80% of the receptor plate temperature before exiting.
The intent of the design was to allow for a low enough pressure drop across the HX unit so that
even very low pressure heads, such as encountered in gravity fed system like a personal
hydration unit, will give at least 50 ml/minute of flow rate.
Figure 25 illustrates that the water pressure drop occurring in the heat exchanger is sufficiently
small to allow gravitationally motivated head pressure of the hydration unit to drive the system at
50 ml/minute or greater.
The performance will allow for a range of flows from 0–100 ml/minute. This allows the water
flow-rate parameter to be used as the controlling variable for water exit-temperature. By
electronically adjusting the average flow rate, water temperature is then easily regulated even
though the heat combustion power is fixed at a constant value.
Figure 24. Advanced Heat Transfer Prototype Performance

37
UNCLASSIFIED
The results shown in Figure 25 are a trade-off between pressure drop and heat transfer
effectiveness (not efficiency). This is because the CFD models demonstrate that the fluid comes
to equilibrium with the receptor plate temperature only if the path length is maintained above a
certain critical value. However, a longer path length increases pressure drop and requires a
greater pressure head to achieve the same flow rate.
5.2.2 Catalytic Combustion Chamber
One of the primary challenges in catalytic combustion is to provide adequate heat transfer from
the combustor plate to the water HX receptor plate, in such a way that the following
requirements are met:
(a) The combustor temperature is kept high enough to perform fuel droplet vaporization
without leaving deleterious deposits.
(b) The combustor temperature is kept high enough to perform complete catalytic
combustion of the fuel.
(c) The combustor temperature is not so high that it degrades the catalyst.
(d) The temperature range conforms with items (a) through (c) throughout power
variations required during startup, operation, and shutdown.
(e) The effective thermal mass of the combustor, and all materials with which it is in
thermal contact, remains low enough that only a reasonable amount of energy is required
to heat it to ignition temperature.
It can be shown that an adiabatic catalytic combustor running at a very lean equivalence ratio of
0.4 and using a conventional heat exchanger to transfer heat from the catalyst exhaust gas to the
water could achieve the above goals.
Figure 25. Pressure Drop versus Flow Rate

38
UNCLASSIFIED
For an adiabatic design, the catalyst temperature would be equal to the adiabatic flame
temperature associated with a particular equivalence ratio. It would also be independent of
power output level over (in principle) an arbitrarily large power range.
In addition, since the heat would be carried from the combustor to the water heat exchanger via
the flow of the hot gases, the catalyst would not need to be in conductive contact with any other
part of the system, save for the requirements of mounting.
The adiabatic reactor design, unfortunately, does not provide for the possibility of the small form
factor desired for the IWH application; however, it is possible to modify the design in a manner
that will allow for a small planar form factor.
This can be done by using thermal radiation, in addition to convection, in order to transfer heat
from the combustor to the water heat exchanger. Since the catalytic combustor can operate at
temperatures of many hundreds of degrees Celsius, the radiant heat generated by a reasonable
surface area (a 3" disc) would fulfill the design goals of the IWH. This was explored in detail
using a CFD model discussed in section 5.2.3.
To be specific, for a temperature of 900 °C the heat radiated per unit area is 487 watts. Due to
the very steep dependence of radiant heat flux on temperature (T4), a relatively large change in
the power generated by the combustor would result in a small temperature change. For example,
doubling the power output would increase the (Kelvin) temperature by a factor of the fourth root
of two -- a 19% increase.
We see from Figure 26 that the adiabatic combustor exhaust temperature for a stoichiometric
mixture ( =1) is about 2100 °C -- much too high for any catalyst or support. However, a
mixture with twice the air required for a stoichiometric mixture ( =0.5) produces a combustor
exhaust temperature of 1100 °C, and ten times stoichiometric air yields only 250 °C -- the latter
being within the range of some flexible polymeric materials, although this would require a much
higher-volume air pump. More practically, an equivalence ratio of 0.3 produces a temperature of
Figure 26. Combustor Temperature vs. Equivalence Ratio

39
UNCLASSIFIED
700 °C, which is low enough so as to not degrade the catalyst, but high enough to oxidize any
deposits of carbonaceous material in the catalytic combustor (as may occur if a fuel nebulizer is
used).
To achieve the above design goals each subsystem must be examined in terms of their interaction
with other parts of the whole system and not just as individual components. These subsystem
components are given a preliminary assessment below.
For the combustion to be uniform within the catalytic reactor, which is required so as to ensure
uniformity of the combustor temperature, the aerosol and air flows must be uniformly mixed.
And to minimize the volume of the mixer, the design envisions a cylindrical swirl-mixer with a
diameter of 1" and a length of 1".
The aerosol will be injected along the axis of the cylinder and the air will be injected along the
wall of the cylindrical chamber, perpendicular to the axis and tangential to the wall, as can be
seen in Figure 27.
The rotating flow pattern of the air will subject the fuel droplets to a large centrifugal force and
distribute them outward toward the cylinder wall. The diameter of the air injection port was
adjusted in order to achieve adequate uniformity of mixing without causing impingement of the
droplets on the cylinder wall.
Figure 27. Visualization of Fuel Droplet Size vs. Transport Effectiveness

40
UNCLASSIFIED
CDI has run several Computational Fluid Dynamics (CFD) models. They are shown
sequentially in terms of droplet size along the top of Figure 27. The model suggests that the
droplet size emitted from the Creare nebulizer has a critical effect on the mixing process, as
would be expected from first principals.
More specifically, the model shows that when the nebulizer injects droplet diameters above
10 micron in size, it can be expected that a portion of the aerosol will make contact with the
walls of the mixing vessel.
The top row of images in Figure 27 show the result of droplet size increasing from left to right,
spanning a range from 10–40 microns.
The CFD model was programmed to terminate the flow-stream paths at the point where the
droplet touches a wall. Thus, in going from 10 micron to 40 micron drop size, the result is that
the number of paths making the complete journey through the mixer without impacting a surface
are seen to drop off significantly.
The importance of the increasing impingement is that condensation of the fuel is likely to result
in the mixing area; consequently, reduction of the system power output and a pooling of
condensed fuel over time may result. The 10-micron drop-size recorded by Creare for their
nebulizer is the peak value expected. Since the droplet size distribution is not a mono-chromatic
distribution, droplets of greater diameter are expected.
The problem will have varying significance depending on the design. If the wall of the chamber
is coated black, the absorbed radiant heat from the glowing combustor plate may be able to
partially ameliorate the problem. This would favor a set-up where the nebulizer fuel injection
rate and air-flow rate are constant. In this way the inner wall of the chamber can then be tuned to
receive the optimum amount of feedback radiant energy. Figure 28 shows the actual interior of
the combustion chamber and the catalytic combustion plate during a JP-8 fuel test operation.
Figure 28. Test Bed for Nebulizer-Based Catalytic Combustion

41
UNCLASSIFIED
Alternatively, since the combustion plate, after reaching equilibrium temperature, will be of a
temperature to instantly vaporize any fuel condensate, then the inner wall of the chamber could
be redesigned mechanically so the condensate does not escape out the edge of the plate. This
would require machining a special interior lip near the exit of the chamber to redirect any
condensate toward the center of the combustion plate.
Figure 29 illustrates two possible sources of air for the system. The photo on the right shows a
high efficiency, high flow, rotary vane air pump designed and constructed at CDI. While it is
able to easily handle the pressure drops likely to be encountered in forcing air through the
catalytic combustor plate, it is nevertheless bulkier, heavier and more power consumptive than
would be desired in an actual product. Calculations have shown that the utilization of low back-
pressure metal foam combustor plates (instead of porous ceramic) along with some re-design of
the input ports of the mixing chamber could in theory allow the use of micro-blower assemblies.
The micro-blower generally has a comparatively high flow-rate with respect to the same sized
rotary vane pump but "pays" for this improved flow rate by limiting the pressure drop capacity to
under 1" of water.
The two left photographs in Figure 29 show an example of one possible micro-blower to be
considered in future work. It is a brushless-motor driven device with integral pole switching and
sensing circuitry built into the blower body. Because it is brushless, the lifetime is expected to
be in the many thousands of hours.
In addition, this particular blower model claims to have a maximum pressure drop capability of
0.36 inches of water pressure. If this is true, it may be possible to obtain the required 6 liters per
minute flow rate (and above) with minimal battery power (e.g., less than 0.125 watt) with very
low weight and noise.
The blower does not come with a shroud or ducting, and this will need to be specially designed
and coupled to the mixing chamber. Also, the input port to the mixing chamber will need to be
modified to accept this device so as not to place any addition pressure drop in the path of the
blower.
Figure 29. Alternative Air Moving Mechanisms Evaluated

42
UNCLASSIFIED
5.2.3 Gas Flow and Heat Transfer Calculations
An important concern in the design of this application has to do with keeping operational
parameters within certain bounds to avoid adverse effects. Some possible adverse effects include
sintering of the catalyst, flashback of the fuel-air stream, insufficient radiative energy,
insufficient vaporization of droplets at the combustor plate, and excessive pressure drop across
the combustor plate. Initially, a series of first order manual calculations were performed to help
direct the design effort.
To simplify the analysis, a geometry was used that is disposed to both experimental investigation
and theoretical analysis. The model geometry comprises a 1"-diameter porous disc affixed to the
end of a 1"-diameter Pyrex tube. The geometry is shown diagrammatically in Figure 30.
To estimate certain critical parameters of operation, a thermal profile calculation was performed
of the flow as it (a) travels through the flow tube to the porous ceramic disc, then (b) through the
disc (profile view). From the latter we can then calculate the pressure profile, which will be vital
in determining the selection of porous material and the performance needed from the air pump.
The following calculations were performed with a porous alumina material in mind to be used as
the combustion plate structure. Later, an alternative material, made from a stainless-steel metal
foam would ultimately be found to be a better choice. Nevertheless, the process presented here
for assessing performance is the same.
A few simplifying assumptions were made in order to carry out the calculation analytically:
● We will ignore the fuel aerosol component of the flow. This component occupies a total
volume more than three orders of magnitude smaller than the air volume, this
simplification will not noticeably affect the result.
● We will assume that the flow is laminar. The Reynolds number for the air flow in the
tube is about 30, small enough for the flow to be laminar if no vorticity is intentionally
introduced. In the actual device being designed there is considerable vorticity introduced
by the swirl mixer, so the extension of results in this calculation to the actual device was
carefully considered.
● Air entering the porous disc immediately takes on the temperature of the back surface of
the disc by assuming that the thermal entry length is zero. The actual thermal entry
length is small compared to the other dimensions of the geometry. In particular, the flow
Figure 30. Model Geometry for Gas & Heat Flow Estimates

43
UNCLASSIFIED
velocity into the disc is very small (about 2 cm/sec) and the pore size of the ceramic disc
is also very small (about 20 μm).
● We ignore the effects of buoyancy on the heated air. This allows for a further assumption
that the air flow is entirely one-dimensional, accurate to the extent that the zone of heated
air near the back surface of the disc is very thin -- which the calculation will reveal.
The temperature of the air as a function of distance from the back surface of the porous disc was
calculated based on the assumption that the flow is entirely one-dimensional and the air is at the
same temperature as the back surface of the disc at the point at which it enters the disc.
This is a problem in combined conduction and convection, with heat being conducted by the air
away from the surface upstream and heat being carried by the flow towards the surface
downstream. Therefore, the time-dependent heat diffusion equation was used. For the one-
dimensional case, it is as follows:
where T is the temperature, x is the distance from the back face of the disc, and α is the thermal
diffusivity of air. Since we are looking for a steady-state solution, the time derivative vanishes
and the equation becomes an ordinary second order linear differential equation:
Where V = flow velocity, the solution to which is:
where the Ci are constants of integration, and x = α/V
When the boundary condition for x is set to infinity, T equals the input air temperature, which
tells us that C2 = T i (the initial air temperature). Given that the temperature at x=0 is equal to the
(as yet unknown) temperature of the back face of the porous disc TB, we see that C1 = T B - T i, so
the solution is:
2
2
x
T
t
TV
t
T ( 2 )
0)(2
2
dx
dTV
dx
Td ( 3 )
210
/)( C
xxeCxT ( 4 )
( 5 )

44
UNCLASSIFIED
The exponential factor x0 is, therefore, the distance from the back surface of the porous disk at
which the incoming air is heated to 1/e of the temperature of that surface or, equivalently, the
heat diffusion length.
The relevant values of T i, T B , and x0 are: 20 °C, 500 °C (a desirable value), and 3.9 mm. The
thermal profile in the flow tube is shown in the graph in Figure 31, with the distance x in mm.
Most interesting is the 1/e thickness (the heat diffusion length) of the heated layer adjacent to the
back face of the porous disc, i.e., near x=0. Flashback may occur if the thickness of the heated
layer exceeds the laminar flame thickness, which is in the range of several millimeters. Since x0
is about 4 mm, there may indeed be a flashback problem, at least absent any of the mitigating
factors identified below in the section on flashback. However, operation of the prototype so far,
have shown that with this approximate model geometry combined with use of the Creare
nebulizer and air flow rates (discussed later), that flash back is not observed.
5.2.4 Flashback Analysis
The design of the system requires that the fuel-air mixture not ignite into a flame, but instead
oxidize catalytically. The auto-ignition temperature of mixtures of Jet-A vapor and air is 260 °C
and the laminar flame velocity is in the range of 30–40 cm/sec. Since the flow velocity of the
fuel-air mixture will be only a few cm/sec and the auto-ignition temperature is low relative to the
temperature desired for the back surface of the porous disc, flashback must be considered a real
possibility.
There are, however, reasons to expect that flashback will not occur in this design:
● The fuel is in the form of an aerosol, not vapor, and it may be that either flame velocity or
auto-ignition is inhibited in this case. A literature search has given conflicting
information.
Figure 31. Flow Tube Thermal Profile
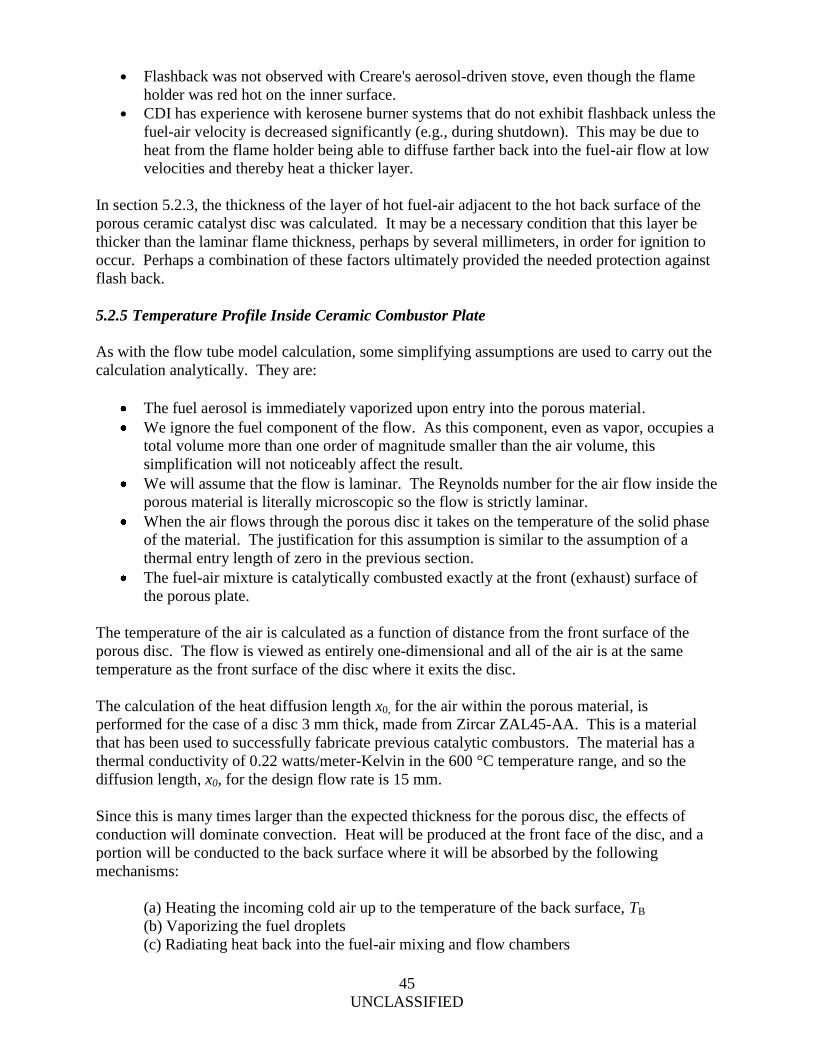
45
UNCLASSIFIED
● Flashback was not observed with Creare's aerosol-driven stove, even though the flame
holder was red hot on the inner surface.
● CDI has experience with kerosene burner systems that do not exhibit flashback unless the
fuel-air velocity is decreased significantly (e.g., during shutdown). This may be due to
heat from the flame holder being able to diffuse farther back into the fuel-air flow at low
velocities and thereby heat a thicker layer.
In section 5.2.3, the thickness of the layer of hot fuel-air adjacent to the hot back surface of the
porous ceramic catalyst disc was calculated. It may be a necessary condition that this layer be
thicker than the laminar flame thickness, perhaps by several millimeters, in order for ignition to
occur. Perhaps a combination of these factors ultimately provided the needed protection against
flash back.
5.2.5 Temperature Profile Inside Ceramic Combustor Plate
As with the flow tube model calculation, some simplifying assumptions are used to carry out the
calculation analytically. They are:
The fuel aerosol is immediately vaporized upon entry into the porous material.
We ignore the fuel component of the flow. As this component, even as vapor, occupies a
total volume more than one order of magnitude smaller than the air volume, this
simplification will not noticeably affect the result.
We will assume that the flow is laminar. The Reynolds number for the air flow inside the
porous material is literally microscopic so the flow is strictly laminar.
When the air flows through the porous disc it takes on the temperature of the solid phase
of the material. The justification for this assumption is similar to the assumption of a
thermal entry length of zero in the previous section.
The fuel-air mixture is catalytically combusted exactly at the front (exhaust) surface of
the porous plate.
The temperature of the air is calculated as a function of distance from the front surface of the
porous disc. The flow is viewed as entirely one-dimensional and all of the air is at the same
temperature as the front surface of the disc where it exits the disc.
The calculation of the heat diffusion length x0, for the air within the porous material, is
performed for the case of a disc 3 mm thick, made from Zircar ZAL45-AA. This is a material
that has been used to successfully fabricate previous catalytic combustors. The material has a
thermal conductivity of 0.22 watts/meter-Kelvin in the 600 °C temperature range, and so the
diffusion length, x0, for the design flow rate is 15 mm.
Since this is many times larger than the expected thickness for the porous disc, the effects of
conduction will dominate convection. Heat will be produced at the front face of the disc, and a
portion will be conducted to the back surface where it will be absorbed by the following
mechanisms:
(a) Heating the incoming cold air up to the temperature of the back surface, TB
(b) Vaporizing the fuel droplets
(c) Radiating heat back into the fuel-air mixing and flow chambers

46
UNCLASSIFIED
Mechanisms (a) and (b) are vital to the proper function of the heater. Mechanism (c) may be
useful to heat the walls of the chamber so that fuel will not condense there, but should be low
enough so that the fuel nebulizer is not heated significantly. Radiation can be minimized by
ensuring that the emissivity of the back surface of the porous plate is low.
The following calculations help to determine the amount of hear power lost to air heating and
fuel vaporization, and will also calculate the amount of radiant heat expected from the back
surface.
We will assume that the back surface is at 500 °C, which is a temperature that should ensure that
the surface remains free of fuel residue. The heat power required to increase the temperature of
the 6 liter/minute flow (i.e., value selected to produce 340 watts of combustion power) is
therefore:
Where cp is the specific heat of air at constant pressure and dM/dt is the mass flow rate of air per
unit area.
The heat power required to vaporize the fuel flowing at a rate of 0.6 ml/minute is:
This value is so low that it will be disregarded in subsequent calculations.
The heat power radiated from the back surface at 500 °C, assuming an emissivity of ε = 0.15 for
the alumina fiber material, is:
The total heat power that must be conducted to the back surface of the porous disc is, therefore,
approximately 100 watts, the majority of which will flow back into the disc as heated air.
The Fourier heat conduction formula was used to calculate the thickness of the candidate
material, Zircar ZAL45-AA, necessary to provide the conduction of 77 watts from the front to
the back surface of the porous disc. This assumes that the temperatures of the front and back are
700ºC and 500ºC, respectively:
wattsdt
dMCP
airairpair 62)( ( 6 )
wattsdt
dMCP
airJPpvapor 3.2)(8 ( 7 )
wattsATPbackradiate
154 ( 8 )
mmP
TAt
totaldisc
0.3 ( 9 )

47
UNCLASSIFIED
This is a value that is in the lower range of thicknesses that will provide sufficient strength but
should be acceptable.
5.2.6 Catalytic Combustion Plate Surface Temperature
Heat exits the front face of the porous ceramic disc via two mechanisms, radiation and the heat
contained in the hot exhaust gases. In this section we will calculate the amount of heat
transferred by these two mechanisms, and thereby calculate the temperature of the front face.
The total radiant heat emitted from the front surface is:
Since we want to maximize the amount of radiant heat emitted we will set ε = 1 in the following.
The total heat carried from the front surface by the exhaust gases is:
Tref is the reference temperature that is used to define the enthalpy of combustion (lower heating
value) of JP-8, and equals 150 °C. These two powers should add up to the total power. The
solution to this quartic equation is solved numerically by setting the total power to 340 watts for
this example. The result is that Tfront is 709 °C.
This turns out to be an acceptable value in that the catalyst will not be caused to deteriorate due
to sintering, nor will the alumina be caused to change phase.
5.2.7 Catalytic Combustion Plate Physical Properties
Figure 32 shows a 4mm thick porous alumina (Zircar ZAL-45) disc 2.5 inches in diameter.
ATPfrontradiate
4 (
1
0 )
dt
dMTTCP exhaust
referenceexhaustexhaustpexhaust
)( ( 1
1 )
Figure 32. Porous Ceramic Catalytic Combustion Plate Substrate

48
UNCLASSIFIED
A wide variety of porous ceramic material exist to choose from, so a number of materials were
tested for critical properties to determine if they are suitable for inclusion into the design. Both
strength, machinability (or formability), thermal conductivity and porosity were evaluated.
Zal-45 was found to be sufficiently strong to stand up to handling required for prototype
assembly. It also had good machinability and thermal conductivity, and was stable at
temperatures expected to be reached during processing and operation.
Another key property is that the porosity should be sufficient to minimize pressure drop of the air
stream. This is critical, because the air pump was chosen to be of a miniature radial vane type
running from battery power and has very limited over-pressure capability.
The air pump chosen for the water heater project can produce the required flow rate if the
pressure drop is less than 5" of water (about 0.2 psi). The permeability of the porous material
must therefore be high enough to ensure that the back-pressure is at or under this value.
Experiments were carried out on three materials from Zircar: ZAL15-AA, AL30-AA, and
ZAL45-AA to determine the pressure drop properties of each. For each material, a thin disc was
cemented into one end of a Pyrex tube, and compressed air at a known flow rate was pumped
into the open end. The experimental apparatus is shown diagrammatically in Figure 33.
Figure 33. Diagram of Combustion Plate Experimental Apparatus

49
UNCLASSIFIED
The results of the testing are displayed in Figure 34. The data show that the ZAL-45 is the best
candidate when evaluated for this criteria.
All three samples provided back-pressures that were less than 1" of water, with sample
thicknesses that are about twice the envisioned thickness. However the back-pressure will be
considerably higher when the discs are at 600 °C. The correction factor is equal to the ratio of
the kinematic viscosity for air at 600 °C to that of air at room temperature:
It was calculated that a 3-mm thick disc of ZAL45-AA at 600 °C would produce a back-pressure
of 3" of water, which is comfortably less than the air pump capability.
5.2.8 Catalyst Deposition Profiles
Considerable effort was expended to explore fabrication techniques to establish a 3-dimensional,
well defined catalytic coating profile throughout the body of the combustion plate.
It is considered desirable, that the exit side of the plate should have a catalytic coating but the
entrance side would be either completely uncoated or perhaps provided with a minimal and
spatially uniform coating. A possible advantage for coating the entrance side is to allow for an
easier start-up process.
Figure 34. Pressure Drop versus Plate Parameters

50
UNCLASSIFIED
Figure 35 shows a cross-section micro-graph of the front side (exit) of the combustion plate.
Various gradient profiles were generated and tested throughout the project to see if a particular
advantage might be gained.
Varieties of methods for controlling the profile were explored. One particular approach had the
property of being easy to control and reasonable in terms of labor.
The method chosen is based on a concept borrowed from the IC (integrated circuit)
manufacturing industry where a diffusion blocking barrier is deposited in various places on the
silicon wafer to mask off regions of silicon for doping with selected impurities.
For the porous alumina combustion plate, the issue is more 3-dimensional than normally
encountered in IC manufacture where iso-planer structures are the norm.
The masking material selected for fabrication was based on a low melting, water-soluble wax
that was infused into the bulk of the material at a well controlled rate (i.e., by capillary action).
By stopping the capillary action at a predefined time, the depth of penetration of the wax is
determined. The wax also needed to have the property that it would sublimate at temperatures
below its combustion point to avoid depositing carbon residue during the barrier removal stage.
After the wax solidified in spatially well defined bulk regions of the disk, the disk is then infused
with the catalyst pre-curser solution and allow to dry. It is then placed in an inert atmosphere
and heated slowly to 600 °C. During this time, the wax turns into a gas and leaves the porous
disk with any residue, after which the disk is allowed to be exposed to the ambient atmosphere to
complete the reduction of the catalyst solution. The porous disk is then ready for final
dimensioning (i.e., thickness, diameter, etc.) and coupling with the electric starting assembly.
Figure 35. Catalyst Gradient Strategies for Ceramic Substrate

51
UNCLASSIFIED
Testing of the both the resultant catalyst combustion behavior and the flow uniformity (or non-
uniformity) of the fuel/air stream in the porous disc was performed in an apparatus shown in
Figure 36. A pattern of catalytically active regions are deposited across the exit face of the plate
and the resulting combustion temperature was measured at each zone.
The fuel/air flow rate was set to 1.5 liters per minute and the total chemical power in the fuel/air
stream was set to 100 watts. The flameless combustion temperatures measured at the test zones
were purposely kept low so as not to allow the substantially higher viscosity of 600 °C air from
altering the flow stream between the test zones.
Table 3 shows that the fuel-air was essentially distributed evenly over the surface. This can be
attributed in part to the high degree of material uniformity (i.e., density and pore size) throughout
the ZAL45-AA. It also shows that the fabrication process does not leave behind residue that
may affect the flow stream adversely.
5.2.9 Improved Catalytic Combustion Plate Properties
The combustor plate designs from earlier in the project consisted of either a porous ceramic
material (e.g., ZAL-45A) or a refractory felt material, each coated with ample amounts of
activated platinum.
The porous ceramic plate had issues with a relatively slow light-off, whereby the central region
was started first and the reaction spread slowly out toward the periphery of the disc. This could
take several minutes to achieve equilibrium condition.
It was speculated that the relatively large thermal mass of the ceramic extended the time to
thermal equilibrium.
Figure 36. View of Flow Uniformity Test Cell
Table 3. Fuel/Air Uniformity Experimental Results Center Top Left Top Right Bottom Left Bottom Right
Temperature 500°F 490°F 510°F 505°F 495°F
Flow Rate 1.5 l/min 1.5 l/min 1.5 l/min 1.5 l/min 1.5l/min
Total Fuel-Air
Energy100 watts 100 watts 100 watts 100 watts 100 watts

52
UNCLASSIFIED
To address this issue, the porous ceramic was replaced with a simple refractory felt (silica-
alumina) material. This reduced the thermal mass and allowed for a quicker light off and
thermal equilibrium; however, a condition of fuel condensate dripping from the sides of the
combustor plate was experienced after a period of unit operation. That is, it appeared that a
portion of the fuel droplet stream from the nebulizer was precipitating out as a liquid and passing
through the combustor plate in an un-reacted condition.
To solve these two issues and additionally improve robustness of the catalytic plate, a study was
undertaken to review possible alternative materials. The material would need to have a very low
density, withstand refractory type temperatures, have good thermal properties, be easy to
fabricate and have the ability to tolerate mechanical abuse without being seriously damaged.
One such candidate, a low density refractory metal foam, appeared to meet these requirements.
To appreciate why the thermal characteristics of metal foam improve combustor plate
performance, it is necessary to examine both the macro and micro properties of the foam metal.
Figure 37 summarizes some important equations that influence both transient and steady state
thermal behavior. Equation 1 describes the relationship between thermal diffusivity and the
intrinsic properties of any material. Equation 2 describes the Wiedemann-Franz law.
P. Grootenhuis, et al reported on the relationship between thermal and electrical properties of
porous metals (i.e., metal foam) in 1952 Proc. Phys. Soc. B 65 502-511. It was determined that
to a first order approximation, electrical conductivity was independent of particle size but
correlated well with density and, in addition, were in a linear relationship with density. Using
the Wiedemann-Franz law to connect the thermal conductivity, we see that thermal conductivity
is also linear with density.
Figure 37. Relationship Between Thermal & Electrical Conductivity
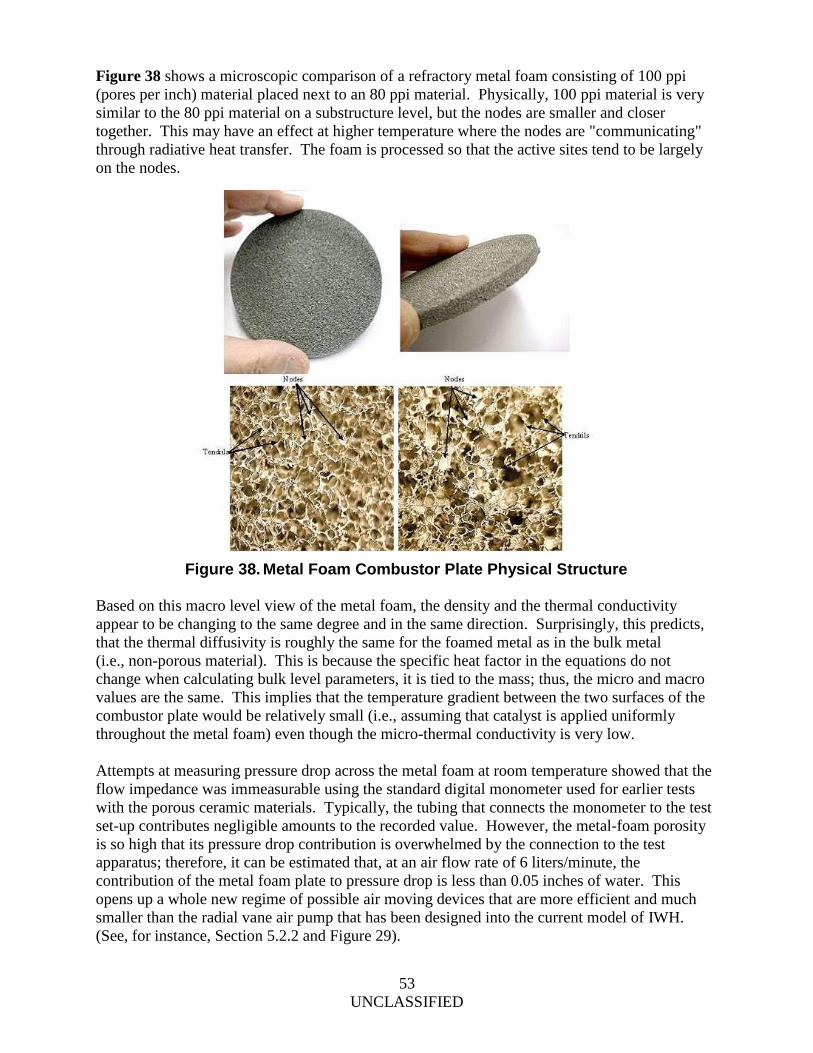
53
UNCLASSIFIED
Figure 38 shows a microscopic comparison of a refractory metal foam consisting of 100 ppi
(pores per inch) material placed next to an 80 ppi material. Physically, 100 ppi material is very
similar to the 80 ppi material on a substructure level, but the nodes are smaller and closer
together. This may have an effect at higher temperature where the nodes are "communicating"
through radiative heat transfer. The foam is processed so that the active sites tend to be largely
on the nodes.
Based on this macro level view of the metal foam, the density and the thermal conductivity
appear to be changing to the same degree and in the same direction. Surprisingly, this predicts,
that the thermal diffusivity is roughly the same for the foamed metal as in the bulk metal
(i.e., non-porous material). This is because the specific heat factor in the equations do not
change when calculating bulk level parameters, it is tied to the mass; thus, the micro and macro
values are the same. This implies that the temperature gradient between the two surfaces of the
combustor plate would be relatively small (i.e., assuming that catalyst is applied uniformly
throughout the metal foam) even though the micro-thermal conductivity is very low.
Attempts at measuring pressure drop across the metal foam at room temperature showed that the
flow impedance was immeasurable using the standard digital monometer used for earlier tests
with the porous ceramic materials. Typically, the tubing that connects the monometer to the test
set-up contributes negligible amounts to the recorded value. However, the metal-foam porosity
is so high that its pressure drop contribution is overwhelmed by the connection to the test
apparatus; therefore, it can be estimated that, at an air flow rate of 6 liters/minute, the
contribution of the metal foam plate to pressure drop is less than 0.05 inches of water. This
opens up a whole new regime of possible air moving devices that are more efficient and much
smaller than the radial vane air pump that has been designed into the current model of IWH.
(See, for instance, Section 5.2.2 and Figure 29).
Figure 38. Metal Foam Combustor Plate Physical Structure

54
UNCLASSIFIED
On a micro level, the thermal conductivity, as viewed from the many thousands of metal nodes
(again referring to Figure 38) is much less than bulk metal properties, because the heat must flow
through slender tendrils in order to reach the next node. Thus, the thermal diffusivity at this
level of dimension appears very low (i.e., node-to-node transmission). In the case of the metal
foam used in this project, the densities are about 2% or 3% of the bulk stainless steel metal, so
the thermal diffusivity may be presumed to be about 40 times less than the bulk metal.
Since diffusivity governs the rate at which heat energy flows away from the source of heat
(i.e., catalytic reaction site attached to node), each node can be expected to be much higher in
temperature than the average bulk temperature. This explains why the light-off was found to be
significantly quicker. Temperature uniformity is better and droplets of fuel are impeded from
getting through the matrix because they eventually impact the extremely hot (>900 °C) nodes
along the way, causing instantaneous evaporation.
Figure 39 and Figure 40 show data reported by Jörg Sauerhering of the Institute of Technical
Thermodynamics, in Cologne Germany. These data shed more light on the behavior of porous
metal materials. In his measurements, he defines a primary porosity as the complement of the
ratio between the overall foam density and the density of the microscopic tendrils (i.e., matrix).
This particular approach to defining porosity is used because in some types of metal foams,
depending on the fabrication method, the density of the tendrils may be less than the pure metal.
For the foams used in this report, the tendril density should be about the same as the pure metal.
This data confirms the general contention that metal foam thermal conductivity is proportional to
the bulk density of the foam and roughly with a slope of minus 1. It is interesting to note that
this relationship is does not appear to be generally applicable to non-metals (based on some
preliminary literature research). In non-metal foams (e.g., alumina) the change in density of the
body has a markedly less effect on thermal conductivity. Thus, the use of ceramic foams is not
expected to have the same benefits called out in this report for the metal foam.
Figure 39. Thermal Conductivity vs. Primary Porosity of Combustor Plate (note that Primary Porosity is unitless)

55
UNCLASSIFIED
An interesting effect from radiative heat loss occurs when the temperatures reach much higher
levels as would be found during actual operation (i.e., catalytic combustion). Figure 40 shows
how radiative transfer between the nodes can increase the effective thermal conductivity by a
factor of 2 or 3.
This effect results in a certain degree of self regulation of the metal node temperatures, and thus
increases the range of power densities that the foam can take before the metal succumbs to over
temperature effects.
Although the thermal properties of the metal foam appear beneficial, the question still remained
as to whether it had the necessary mechanical properties. The answer was found to be that it was
far superior to previous materials in terms of mechanical properties. For instance, in actual
operation the combustor plate had to be sized precisely and fit into a predetermined orifice
opening in the mixer chamber. This means that the ability to make minute adjustments to the fit
is beneficial. Metal foam appears to be easily adjusted without a general release of detritus, or
unraveling of the fabric (i.e., as may occur in felts) or a chipping of edges as in porous ceramics.
Also, when fitting the foam to final position within the mixing chamber, a seal/gasket like
component is generally pressed over its periphery to finalize the fit and keep it in position. The
foam resiliency (i.e., compressibility) allows the seal to be tightened without fear of fracturing
the material and allows rapid expansion during heat-up without failure of the sealing surface. In
addition, the metal foams can withstand very large thermal and mechanical shocks, which occur
in the normal operation of the system, without degrading performance.
5.2.10 Catalytic Starter
In this section calculation results and empirical physical designs for an electro-catalytic starter
(ECS) are explored.
Figure 40. Thermal Conductivity vs. Temperature of Combustor Plate

56
UNCLASSIFIED
A critical system element in the successful operation of the catalytic IWH is the mechanism for
starting the catalytic reaction. While it is common in some types of catalytic combustors to
provide an open flame, this was not considered an option for the design parameters of the current
application.
Electrical energy, controlled by an embedded intelligence, is the preferred approach since it is
safer and allows automatic starting. However, because electrical energy for portable application
depends on batteries, optimization of the starting mechanism, to reduce energy requirements is
necessary to keep batteries small and light weight and to increase the number of starts between
battery changes.
In the future, the use of TEG devices may be used to charge the battery during use to eliminate
changing the battery during the useful lifetime of the IWH unit.
The physical principles underlying the ECS are joule heating and catalytic light-off.
Conceptually, the scheme is to first provide ohmic heating to a region located in the path of the
fuel/air stream, just above the main catalytic plate combustor, and then allow the generated heat
to raise the temperature of a small mass of catalytically active material, causing a catalytic
light-off of the fuel/air mixture and a consequent propagation of the catalytic reaction front
throughout the combustion plate.
Use was made of the CFD modeling package known as Cosmos FlowWorks. This CFD package
is a moderately sophisticated tool for simulating real world fluid mechanical and heat transfer
problems. Empirical data was also obtained and used to confirm the model results.
The first step in the process was to reduce the model to the most basic physical representation of
the real device and examine the details of the ignition process. The fuel/air stream is assumed to
be directed normal to the catalytic combustion plate and have sufficient air present to complete
combustion if it were to start. It is not economically feasible to provide a starting condition over
the whole combustion plate surface, so it becomes important to direct the effort toward
optimizing a design that allows localized starting to propagate across the combustion plate
surface.
When the droplets arrive at the plates inner surface, they immediately begin to be absorbed by
the porous structure and if not quickly reacted, could lead to a "wet-out" condition where the
plate is over-saturated with unburned fuel, thus preventing catalytic action from beginning. The
starter, therefore, must be very quick in its light-off process to prevent this condition. This leads
to the conclusion that the transient as well as the steady state (i.e., equilibrium temperature)
starter temperatures are import criteria.
Both of these values are calculated for a range of starting powers. For this study, the starting
parameters were between 5.55–10 watts. This range of power was chosen for practical reasons
having to do with portability of the end application and the need for readily available battery
chemistries. Thus, the energy requirement to achieve starting temperatures needs to be
minimized in order to allow small and lightweight batteries. This in turn points to the need for
the starter to have low thermal mass.

57
UNCLASSIFIED
In summary, the following system requirements were used to guide the design approach:
The need for a rapid climb to light-off temperature
Minimize the light-off temperature
Assure that droplet coalescence is minimized
The third condition directs the design effort to pay special attention to the surface temperatures
to which the droplets come in contact. To assure that the droplets do not merge into a larger
mass at the surface of the starter, and to prevent the accumulation of residue on the starter
materials, the starter should quickly reach a temperature above the boiling point of the majority
of the hydrocarbon components contained within the fuel.
This condition can be met by assuring that the average temperature of all contacted surfaces
reach 500 °C or more in a time period shorter than the agglomeration rate of fuel droplets. As
we see from Table 4, at the 500 °C temperature greater than 95% of the components of most
kerosenes will vaporize. If this happens rapidly enough, it will prevent build up of fuel droplets
into a single larger mass.
The first condition drives the design toward the use of low thermal mass for the starter
components and the proper degree of thermal isolation from the combustor plate.
The second condition drives the design toward having two types of catalytically active structures
within a single igniter assembly. The first catalytic structure is realized by combining the joule
heating function of the filament with a catalytically active ceramic coating. The filament is
coated with a high surface area (i.e., micro level) ceramic alumina, which is then infused with a
platinum catalyst solution. Since the catalytically active ceramic coating is in direct contact with
the filament, it reaches the filament temperature almost simultaneously.
Figure 41 shows an actual assembled and working igniter device. Its overall dimensions are
0.800 inch wide by 1.157 inch long for an overall projected area of about 0.9256 square inches.
Table 4. Fuel Temperature vs Fractional Boiling Temperature vs Evaporation
Results
Kerosene
CAS# 8008-20-6
Kerosene
CAS# 64742-81-0
Initial Boiling Point 238 °C 362 °C
10% Components Evaporated 327 °C 392 °C
50% Components Evaporated 405 °C 434 °C
90% Components Evaporated 475 °C 488 °C
95% Components Evaporated 490 °C 506 °C

58
UNCLASSIFIED
The filament is formed into a simple serpentine pattern in order to fit within confines of the cage
screen shown. Figure 42 shows the catalytically active filament just before it is formed into a
serpentine pattern.
The upper portion of Figure 42 shows the basic physical structure of the filament. The filament
starts as a Kanthal A-1, 3-mil-diameter wire. The length of the wire is chosen to allow at least
4.5 ohms of resistance. This is obtained with about 4 inches of wire length.
The wire is then heat treated to allow a layer of oxide to appear. The wire is then coated in slurry
of alumina particles and heat treated again to form a ceramic layer. The ceramic is then
Figure 41. Top View of Assembled Catalytic Starter Device
Figure 42. Close-up View of Ceramic Coated Filament w/Catalyst Applied

59
UNCLASSIFIED
converted to gamma alumina to increase the microscopic surface. At this point is ready to be
coated with the noble metal catalyst.
The bottom portion of Figure 42 shows a close up view of the ceramic coating attached to the
oxidized wire core.
The next step is to provide a connection to the "outside world" of copper wire by cleaning the
ends (i.e., removing the oxide) of the wire and micro-welding 30 gauge copper wire to each end.
At this point the welds are protected with shrink wrap. The filament is then positioned onto an
unfolded portion of the cage screen and topped with a gossamer-like layer of catalyst coated,
alumina micro-fibers. Figure 43 shows the cage screen before the filament is inserted. Note that
although the filament is in direct contact with the cage screen it is electrically insulated by virtue
of the oxidized coating and the baked on ceramic layer. Also, the cage screen itself is oxidized
to further electrically isolate the two components.
The purpose of the cage screen component is four-fold:
To support and align the catalytic fibrous alumina mat with the catalytically active
joule heating filament.
To thermally isolate (mildly) the active igniter components (e.g., filament & alumina
mat) from direct contact with the combustor plate.
To provide physical support and mechanical integrity to the whole assembly.
To act as a collector of the fuel droplets by intercepting and holding onto (i.e., by
capillary action) them using the intrinsic surface properties of the diamond shaped
pores (i.e., screen openings).
To further insure a quick light-off, a second catalytically active component that has a relatively
large projected area (i.e., larger than the filaments projected area) is required. The large planar
surface area of this ultra low density catalytic structure is placed directly over the electrically
heated filament.
Figure 43. Catalytic Starter Cage Close-up

60
UNCLASSIFIED
To fulfill this requirement, a planar mat of ultra low density micro alumina fibers were coated
with a noble metal catalyst. An example of these catalytically-coated micro fibers is shown
below in Figure 44. The left portion of the figure shows a microscopic view of the pure alumina
before it has absorbed the noble metal catalyst. The fibers are about 5 to 10 microns in diameter.
This particular alumina material is so low in density that it is very fragile. Without the cage to
protect it, it would fall apart with ordinary handling. The low density is an advantage, however,
when it comes to enhancing the light-off properties of the catalyst.
Because of its low average density, the electrical filament heat energy raises the outer surface
temperature of the micro fibers to an incandescent radiant state, causing a chain reaction
throughout the mat (i.e., as long as there is enough local fuel/air supply). This is somewhat
analogous to the way tinder is used to start a normal flame combustion fire. Because each fiber
has extremely low thermal mass, only minute amounts of energy are required to bring the micro
fibers to a high temperature nearly instantly.
To investigate the peak temperature that might occur during the igniter start-up sequence, it is
necessary to plot the surface temperatures over the surfaces of both the filament and the cage
screen structure. CFD calculations were done for both the steady state and the transient
conditions.
Only the transient calculations are shown here. The transient plots capture both the peak
temperatures and the time necessary to reach these values. This impacts the choice of battery
chemistry to assure a long battery life. Figure 45 shows the time dependent calculation for a
5-volt pulse driving the starter assembly. This is equivalent to an electrical power of 5.5 watts.
Figure 44. Microscopic View of Catalytic Starter “Light-Off” Promoter

61
UNCLASSIFIED
The steady state surface plots (not shown) indicate that portions of the filaments surface do reach
TC, even though in Figure 45, the integrated average temperature does not. The cage screen
however, does not show any portion of the surface reaching the critical temperature. The
transient plots indicate that in a two-second period, even the filament falls below this critical
temperature.
Figure 46 shows the time dependent calculation for the case where the starting pulse was
increased to a 10-volt level. This is equivalent to an electrical power of 22 watts
The steady-state surface temperature plots (not shown) for a 10-volt source show that the
filament will just about reach the thermal limit of the cage material (i.e., 1050 °C) if left on for
an extended period (10 of seconds). Realistically, the power required to do this is not something
that would ordinarily be available from a small lightweight battery.
Figure 45. Transient Temperature Calculations for 5 Volts
Figure 46. Transient Temperature Calculations for 10 Volts

62
UNCLASSIFIED
Actual system performance data shows that an intermediate voltage value (6.5–9.5 watts),
applied for about 5 to 10 seconds, would work well for all anticipated circumstances. This is
because once the catalytically active filament and promoter light-off, the extra energy from the
catalytic heat reaction will quickly add to the battery supplied energy, causing all the surface
temperatures to successfully reach the flameless ignition point.
The small 123 type lithium battery is an example of a battery type that could perform this
function if limited to a couple of seconds and very low duty cycle (i.e., starting the unit a few
times per day).
Future igniter designs might focus on further optimizing the igniter to allow even less power for
a reliable light-off.
Prototype testing was performed by system integrator Creare, Inc. to measure performance of the
catalytic pass-through water heater using JP-8 as the fuel. To provide a rational guide for
improving the performance of the device, based on the input from Creare, CDI developed a
computer model.
A series of eleven modeling experiments were performed requiring about 100 hours of computer
time and several days set-up time per model, to establish design criteria for each of the eleven
models. Figure 47 shows the CFD experimental design.

63
UNCLASSIFIED
The goal in this study was to perform an array of "what if" scenarios where specific features of
the design are modified based on either first principles or scientific intuition and then to calculate
the result to see if the scientific intuition is justified.
The results of this modeling provided recommendations to modifying the current design in order
to achieve improved performance. The recommendations primarily addressed the following
three issues:
What can be done to eliminate unburned fuel "pass-through" condition?
What can be done to increase overall device heat transfer efficiency to the water?
What can be done to reduce weight and size of the unit?
The first step in the process is to select the basic CAD geometry, component materials and
boundary conditions that best represent the real world conditions of the current device.
Figure 48, shows the basic CAD geometry and calls out the boundary conditions used
throughout most of the experiment.
Figure 47. Flow Chart Showing Areas of Potential Heat Transfer Improvements

64
UNCLASSIFIED
In particular, the four basic components of the model consist of:
(a) The mixing chamber; which is made from aluminum and has a radiant emissivity of
polished aluminum for both the interior and exterior. The only exception to this is in
experiments B4 and B5 where the interior emissivity is changed to a black body -- with
dramatic results.
(b) The receptor plate; which is aluminum and had the bottom side set with a boundary
condition that simulates a water heat sink set to 90 °C and a top side (facing combustor
plate) that is a black body surface.
(c) The combustor plate; which is made from an insulating like material that simulates the
porous ceramic properties. It has radiant surfaces that are black body in nature.
(d) The reverberatory screen, that is made from stainless steel and was modeled in two
basic configurations, one that has a 10 mil wire diameter and 10 mil spacing and the
second which has a 5 mil wire diameter and a 15 mil spacing.
Each of the eleven model scenarios included heat losses from radiation, convection, and
conduction.
Figure 48. Illustration of CAD Model Used in CFD Study
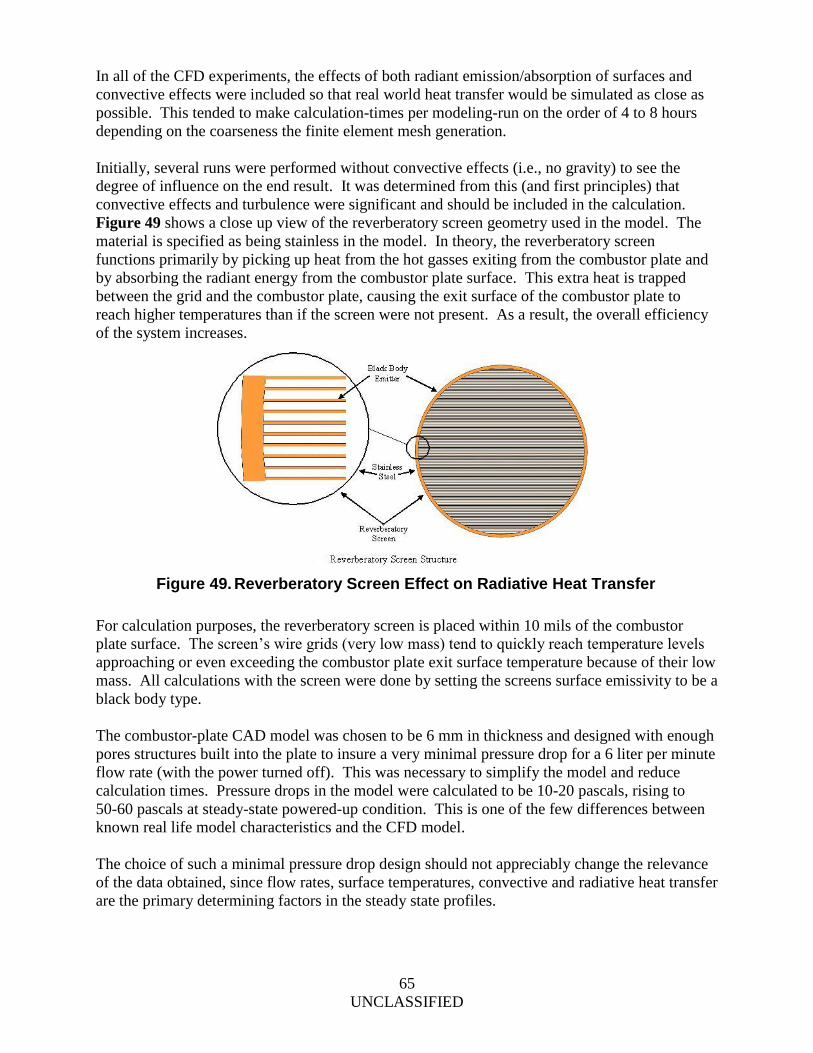
65
UNCLASSIFIED
In all of the CFD experiments, the effects of both radiant emission/absorption of surfaces and
convective effects were included so that real world heat transfer would be simulated as close as
possible. This tended to make calculation-times per modeling-run on the order of 4 to 8 hours
depending on the coarseness the finite element mesh generation.
Initially, several runs were performed without convective effects (i.e., no gravity) to see the
degree of influence on the end result. It was determined from this (and first principles) that
convective effects and turbulence were significant and should be included in the calculation.
Figure 49 shows a close up view of the reverberatory screen geometry used in the model. The
material is specified as being stainless in the model. In theory, the reverberatory screen
functions primarily by picking up heat from the hot gasses exiting from the combustor plate and
by absorbing the radiant energy from the combustor plate surface. This extra heat is trapped
between the grid and the combustor plate, causing the exit surface of the combustor plate to
reach higher temperatures than if the screen were not present. As a result, the overall efficiency
of the system increases.
For calculation purposes, the reverberatory screen is placed within 10 mils of the combustor
plate surface. The screen’s wire grids (very low mass) tend to quickly reach temperature levels
approaching or even exceeding the combustor plate exit surface temperature because of their low
mass. All calculations with the screen were done by setting the screens surface emissivity to be a
black body type.
The combustor-plate CAD model was chosen to be 6 mm in thickness and designed with enough
pores structures built into the plate to insure a very minimal pressure drop for a 6 liter per minute
flow rate (with the power turned off). This was necessary to simplify the model and reduce
calculation times. Pressure drops in the model were calculated to be 10-20 pascals, rising to
50-60 pascals at steady-state powered-up condition. This is one of the few differences between
known real life model characteristics and the CFD model.
The choice of such a minimal pressure drop design should not appreciably change the relevance
of the data obtained, since flow rates, surface temperatures, convective and radiative heat transfer
are the primary determining factors in the steady state profiles.
Figure 49. Reverberatory Screen Effect on Radiative Heat Transfer

66
UNCLASSIFIED
Actual laboratory data show pressure drops during operation that are on the order of 100 Pa.
This is not too much higher than the model selection. However, this is still very low
(i.e., 0.5 inches of water pressure), with the resulting effect on fluid viscosity, stored energy (in
the air) and air flow patterns likely to be negligible. Thus, the model is felt to be “trustworthy”.
The calculation shows that the use of a smaller combustor plate in the model achieves plate
temperatures that are at least 200 °C higher than the larger 3.0" diameter combustor plate used in
the early prototypes, even though the total energy generated by catalysis (350 watts) and the flow
rates (6 liters per minute) are exactly the same in both models. The principal reason for this is
that a higher power density is obtained in the smaller combustor plate.
An important concern with the current table top demo version has to do with fuel not completing
combustion and passing through the combustor plate into the environment and re-condensing as
droplets.
Temperature profiles were compared across the large plate and the smaller 2.4" O.D. plate.
One feature that was clearly revealed on the larger plate, is a rapid drop in plate temperature,
starting at about 1 cm from the mixing chamber wall. The smaller plate still retains a reasonable
temperature near the wall of the chamber (about 500 °C) as compared to the much lower 350 °C
temperature of the large plate. This suggests a possible scenario where the outer edges of the
larger combustor plate are simply not reaching the critical value needed to insure complete
combustion. This result supports the idea of using a smaller plate size with its higher
combustion temperatures.
Of course, reducing the combustor plate size increases the surface temperatures of the
surrounding mixing chamber with the potential for increased convective and radiative losses and
thus might, at first consideration, counter the benefits of this approach. This was examined
further and was found to not be an important issue according to model calculations.
The net energy absorbed by the receptor plate (i.e., heat exchanger) is the ultimate judge of the
effects of any design change on the efficiency of the device. That is because the receptor
represents the part of the model where all the heat is intended to be transferred (i.e., for the
purpose of heating water).
The top surface of the receptor is placed within 0.1 inches of the mixing chamber exit rim.
All the experiments except B4 and B5 were carried out with a receptor size of 3.6" O.D.
The experiment B4 was with a receptor O.D of 2.6". Experiment B5 was the same as B4, but
with the receptor edge made into a 1"-high lip to help recuperate some of the exhaust gasses.
Results showed that the receptor was able to receive about 60% of the energy generated in the
combustor plate (i.e., 60% of 350 watts).
The top image in Figure 50 shows the fluid (air) temperature and flow patterns in and around the
top of the receptor plate. The top portion of the receptor plate is where all of the heat energy is
transferred to the water flowing in the heat exchanger.

67
UNCLASSIFIED
The simplest way to model this is to set the bottom of the receptor plate at a fixed temperature
(90 °C). In this way, the CFD model treats the receptor bottom as an infinite heat sink,
absorbing as much energy as the combustor puts out. Since the actual device is under the control
of a feedback-loop to maintain the water temperature (by increasing or decreasing the water flow
rate) at a constant value, this boundary condition closely resembles reality.
The bottom image in Figure 50 shows the model being altered to determine if it is worthwhile to
increase the path length over which the hot exhaust gasses travel before being expelled into the
atmosphere. In principal, this should increase the efficiency of the system by recovering the
energy in the hot exhaust exiting from the combustor plate. Model results indicate that an extra
10 percentage points in efficiency is achieved when the lip is added.
Figure 48 showed a set of experiments labeled C2, C3 and C4. These are respectively:
(a) A condition where the air enters the top of the mixing chamber with fully developed
spin;
(b) Air enters the top of the chamber with no spin but is fully developed; and
(c) Air enters the top of the chamber but the heat is turned off to examine the effect on
the flow patterns.
Figure 50. Recuperative Heat Design Change
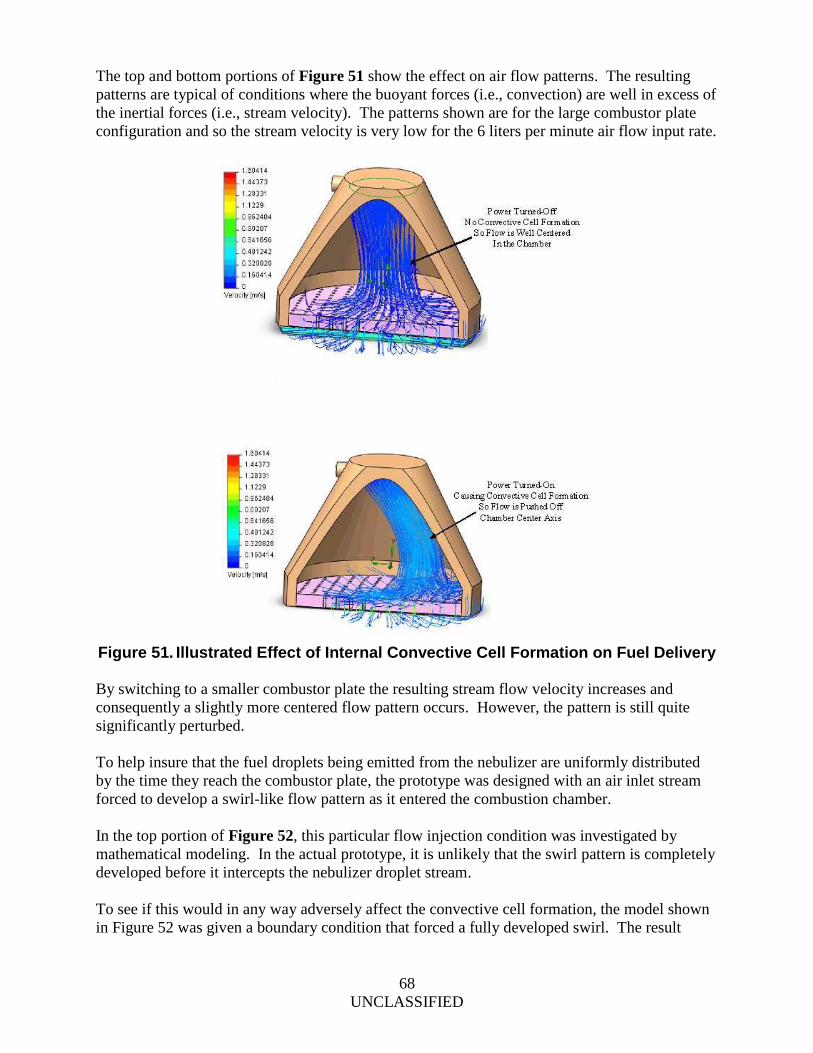
68
UNCLASSIFIED
The top and bottom portions of Figure 51 show the effect on air flow patterns. The resulting
patterns are typical of conditions where the buoyant forces (i.e., convection) are well in excess of
the inertial forces (i.e., stream velocity). The patterns shown are for the large combustor plate
configuration and so the stream velocity is very low for the 6 liters per minute air flow input rate.
By switching to a smaller combustor plate the resulting stream flow velocity increases and
consequently a slightly more centered flow pattern occurs. However, the pattern is still quite
significantly perturbed.
To help insure that the fuel droplets being emitted from the nebulizer are uniformly distributed
by the time they reach the combustor plate, the prototype was designed with an air inlet stream
forced to develop a swirl-like flow pattern as it entered the combustion chamber.
In the top portion of Figure 52, this particular flow injection condition was investigated by
mathematical modeling. In the actual prototype, it is unlikely that the swirl pattern is completely
developed before it intercepts the nebulizer droplet stream.
To see if this would in any way adversely affect the convective cell formation, the model shown
in Figure 52 was given a boundary condition that forced a fully developed swirl. The result
Figure 51. Illustrated Effect of Internal Convective Cell Formation on Fuel Delivery

69
UNCLASSIFIED
showed that non-uniform flow patterns appear regardless of whether the swirl is fully developed
or not.
However, in the bottom portion of Figure 52, we see the result of a very simple change, whereby
the interior of the mixing chamber is painted black to force a black body type radiative boundary
condition. In doing this, the gas convection cells were smaller and, perhaps more importantly,
arranged in a symmetrical pattern around the central axis of the mixing chamber. So it appears
that if the interior is coated with a high-temperature black paint, the flow stream maintains a
central axis orientation.
The importance of this is that the fuel droplets will then be directed more uniformly across the
plate. It not known at this time whether the axial off-set of the flow pattern, predicted in these
models is a significant contributing factor to the fuel leakage (i.e., unburned fuel crossing the
plate) reported by Creare, but it seems prudent to suspect it was a contributing factor and
eliminate it if the other concluding recommendations are not sufficient.
One potential drawback to making the interior of the mixing chamber into a blackbody radiator
is that the interior temperature increases and may adversely affect the nebulizer device operation.
However, it is felt that if there was an adverse effect, it could be mitigated by a variety of
Figure 52. Convective Cell Formation with Fully Developed Air Swirl Input

70
UNCLASSIFIED
approaches. It is interesting to note that the overall efficiency does not suffer (when compared to
B2) as might be expected from the higher temperatures of the mixing chamber (e.g., convective
heat transfer losses) probably due to a compensating effect of increased radiative heat transfer.
Thus, from a purely efficiency perspective, the higher operating temperature is not a detriment.

71
UNCLASSIFIED
6. Conclusions/Recommendations
Error! Not a valid bookmark self-reference. summarizes the recommendations arrived at through
the use of a detailed CFD modeling study covering 11 different model variants shown Figure 47.
Two of the four recommended design changes were implemented in the final prototype and
provided performance improvements. The reverberatory screen and recuperative geometry were
not implemented in the prototype due to lack of time.
The anomalous behavior experienced by Creare’s regarding uncombusted JP-8 fuel condensate
leaking from the combustor plate, after a short period of operation, was reported to have been
resolved through the use of the new metal foam combustor material structure and a reduction in
combustion plate diameter
Overall efficiency of heat transfer to the receptor was also improved by adapting a smaller
diameter combustor plate.
It was determined that flow injection conditions such as fully-developed linear or swirl-type
injection of the air into the mixing chamber appeared to have no substantial effect on the
formation of asymmetrical flow patterns. These asymmetries are thought to be a contributing
factor to the fuel droplets not being consumed in the catalytic process.
Independent of the fuel pass-through issue, asymmetrical flow patterns generally are undesirable
because of the non-uniform heat distribution within the catalytic combustor plate. Non-uniform
surface temperatures are inevitable but the magnitude of the temperature gradients are difficult to
predict since the flow patterns are irregular.
The thermal properties of the porous metal combustor plate, as discussed in section 5.2.9 may
have mitigated much of the expected gradients by rapidly diffusing heat build-up in any portion
of the plate.
By applying all of the modifications recommended in this report it is believed that not only will
the unit function at higher efficiencies, complete fuel combustion, but also be lighter and more
compact.

72
UN
CL
AS
SIF
IED
Table 5. CFD Recommended Design Changes and Conclusions
Description RecommendNot
RecommendedUndecided Comments
-- Higher edge & central temperatures for combustor plate
-- Higher Russell number (i.e., ratio of inertial to buoyant
forces) causing smaller and fewer convective cells
-- Better effect of reverberatory screen
-- Faster starting
-- Increases overall heat transfer efficiency
-- Addition of catalyst will act as afterburner for any fuel pass-
through.
-- Counters the formation of convective cells and increase
symmetry of cells
-- The increase in internal mixing chamber temperatures that
occur with this change may be a problem for the vibrating
mesh operation
Receptor Plate Size Reduction
and Geometry ChangeYes
-- 15 % more heat transfer from exhaust gas with one inch
recuperative lip on edge of receptor
-- No substantial differences noticed in the model
Low Thermal Mass & Low
Thermal Conductivity
Combustor Plate
Yes-- This has already been implemented successfully in prototype
form.
Increase Emissivity of Mixing
Chamber InteriorYes
Changing Flow Injection Type Yes
Smaller Diameter Combustor
Plate Yes
Addition of Catalytic
Reverberatory ScreenYes
10/018