development of an hplc method for the …
TRANSCRIPT

This article was downloaded by: [Juan Carlos Beltrán Prieto]On: 02 January 2013, At: 06:57Publisher: Taylor & FrancisInforma Ltd Registered in England and Wales Registered Number: 1072954 Registered office: Mortimer House,37-41 Mortimer Street, London W1T 3JH, UK
Journal of Liquid Chromatography & RelatedTechnologiesPublication details, including instructions for authors and subscription information:http://www.tandfonline.com/loi/ljlc20
DEVELOPMENT OF AN HPLC METHOD FOR THEDETERMINATION OF GLYCEROL OXIDATION PRODUCTSJuan Carlos Beltrán-Prieto a , Jiří Pecha a , Věra Kašpárková b c & Karel Kolomazník a
a Department of Automation and Control Engineering, Faculty of Applied Informatics, TomasBata University in Zlín, Zlín, Czech Republicb Centre of Polymer Systems, University Institute, Tomas Bata University in Zlín, NadOvčírnou, Zlínc Department of Fat, Surfactant and Cosmetics Technology, Faculty of technology, TomasBata University in Zlín, ZlínAccepted author version posted online: 02 Jan 2013.
To cite this article: Juan Carlos Beltrán-Prieto , Jiří Pecha , Věra Kašpárková & Karel Kolomazník (2013): DEVELOPMENT OFAN HPLC METHOD FOR THE DETERMINATION OF GLYCEROL OXIDATION PRODUCTS, Journal of Liquid Chromatography & RelatedTechnologies, DOI:10.1080/10826076.2012.725695
To link to this article: http://dx.doi.org/10.1080/10826076.2012.725695
Disclaimer: This is a version of an unedited manuscript that has been accepted for publication. As a serviceto authors and researchers we are providing this version of the accepted manuscript (AM). Copyediting,typesetting, and review of the resulting proof will be undertaken on this manuscript before final publication ofthe Version of Record (VoR). During production and pre-press, errors may be discovered which could affect thecontent, and all legal disclaimers that apply to the journal relate to this version also.
PLEASE SCROLL DOWN FOR ARTICLE
Full terms and conditions of use: http://www.tandfonline.com/page/terms-and-conditions
This article may be used for research, teaching, and private study purposes. Any substantial or systematicreproduction, redistribution, reselling, loan, sub-licensing, systematic supply, or distribution in any form toanyone is expressly forbidden.
The publisher does not give any warranty express or implied or make any representation that the contentswill be complete or accurate or up to date. The accuracy of any instructions, formulae, and drug doses shouldbe independently verified with primary sources. The publisher shall not be liable for any loss, actions, claims,proceedings, demand, or costs or damages whatsoever or howsoever caused arising directly or indirectly inconnection with or arising out of the use of this material.

ACCEPTED MANUSCRIPT
ACCEPTED MANUSCRIPT 1
Development of an HPLC method for the determination of glycerol oxidation products
Juan Carlos Beltrán-Prieto1,*, Jiří Pecha1, Věra Kašpárková2,3, Karel Kolomazník1
1Department of Automation and Control Engineering, Faculty of Applied Informatics,
Tomas Bata University in Zlín, Zlín, Czech Republic, 2Centre of Polymer Systems, University Institute, Tomas Bata University in Zlín, Nad Ovčírnou, Zlín, 3Department of
Fat, Surfactant and Cosmetics Technology, Faculty of technology, Tomas Bata University in Zlín, Zlín
*Correspondence Email: [email protected]
Abstract
An HPLC method for the separation of glycerol oxidation products, namely
glyceraldehyde, dihydroxyacetone, mesoxalic, tartronic, glycolic and glyceric acids on an
ion-exchange 8% crosslinked calcium sulfonated divinylbenzene-styrene resin column
was developed and validated. The conditions reported include temperature (70 °C), flow
rate (0.5 mL/min) and concentration of the mobile phase (3 mM H2SO4) using isocratic
elution with ultraviolet and refractometric detectors. The effect of the mobile phase flow
rate and concentration as well as column temperature on the resolution of peaks is
described. Excellent correlation coefficient in the calibration model was observed for all
analytes over the concentration range of 0.5 to 10 mg/mL. The method was also validated
in terms of intra-day precision, sensitivity, accuracy, and detection and quantification
limits. The method conditions were applied to the identification of products derived from
the chemical oxidation of glycerol.
KEYWORDS: glycerol oxidation; HPLC method; ion exchange; validation;
1. INTRODUCTION
Dow
nloa
ded
by [
Juan
Car
los
Bel
trán
Pri
eto]
at 0
6:57
02
Janu
ary
2013
ACCEPTED MANUSCRIPT
ACCEPTED MANUSCRIPT 2
Glycerol (1,2,3-propanetriol) is an important side product of the triacylglycerol
transesterification process. The search for alternative energy sources has increased its
worldwide market as a result of the biodiesel production. Moreover, it is an important
molecule from which several compounds can be formed through a variety of chemical
reactions. The three hydroxyl groups, that the glycerol molecule contains, are susceptible
to hydrogenation, (trans)esterification, dehydration, etherification, oxidation, pyrolysis,
oligomerization, polymerization, and carboxylation. Among them, the oxidation of
glycerol draws a special attention due to the practical valuable compounds that are
formed as it is shown in Figure 1. Namely products of mild glycerol oxidation, such as
dihydroxyacetone are of commercial value.[1] However, in practice, several glycerol
oxidation products are formed simultaneously, due to the reactivity of primary and
secondary hydroxyl groups.[2] As a result, the selectivity for a specific product is not easy
to achieve and still remains as a challenge.[2] Therefore, it is important to have accurate
and rapid methods for the analysis, identification and quantification of these compounds.
Especially, an analytical method able to simultaneously determine all products of mild
oxidation can significantly reduce and simplify the development of new catalysts and
oxidation techniques. Such a method is also of value for the characterization of final
products because it will in most cases contain also other substances formed during the
glycerol oxidation due to the reason discussed above. Techniques such as Thin Layer
Chromatography[3] and HPLC have been used for the identification, yield and
quantitative determination of glycerol oxidation products. In particular, HPLC has been
Dow
nloa
ded
by [
Juan
Car
los
Bel
trán
Pri
eto]
at 0
6:57
02
Janu
ary
2013

ACCEPTED MANUSCRIPT
ACCEPTED MANUSCRIPT 3
broadly employed for this purpose as it provides short elution times and easy sample
preparation with no need of derivatization.[4]
Many authors dealt with simultaneous determination of glycerol derivatives by means of
HPLC. Analytical conditions of these published methods are listed in Table 1. As can be
seen, cation exchange columns were mainly used, since they are able to facilitate
separation of carbohydrates as well as simple organic acids (see Table 1).
Demirel et al.[5,7], used cation exchange column operated at 60 °C and 10 mM solution of
sulfuric acid as a mobile phase to separate glycerol oxidation products. Virtually the same
conditions were also used by Brandner.[6] The detailed insight into the analytical method
and results published in[6,7] shows that under reported chromatographic conditions peaks
of oxidation products, especially peaks of dihydroxyacetone (DHA) and glycerol, were
overlapped. On the other hand, advantageous connection of ultraviolet (UV) and
refractometric (RI) detectors in series allowed qualitative and quantitative determination
of glycerol and DHA, since only DHA can be selectively identified on UV detector at
210 nm. Similar conditions with lower concentration of sulfuric acid (5 mM) were
reported in.[10–13] Kwon and Koper[12] pointed out that namely peaks of glyceraldehyde
and glyceric acid strongly overlap at lower temperatures (30 °C) and recommended to
increase the column temperature up to 80 °C. The higher column temperature improved
the difference between retention times of glyceraldehyde and glyceric acid from former
value of 0.06 minutes to 0.93 minutes. However, the resolution between peaks of
glyceraldehyde and glycolic acid was significantly reduced at higher temperature.
Dow
nloa
ded
by [
Juan
Car
los
Bel
trán
Pri
eto]
at 0
6:57
02
Janu
ary
2013
ACCEPTED MANUSCRIPT
ACCEPTED MANUSCRIPT 4
Analogous method is also described in papers[14–19,21–25] dealing with glycerol oxidation.
Unfortunately, in some cases[20–26] the method conditions are not fully specified. In
addition, to the best author's knowledge, these published methods were not rigorously
optimized and validated (in terms of precision, accuracy, sensitivity, etc.) because the
experiments were primarily focused on the process of glycerol oxidation and catalyst
preparation. There is one exception, paper[21] of Chen et al., which focus on development
of HPLC method and contains complete information about the analytical methodology
and results of its validation. Chen et al.,[21] also reported problems with separation of
glycerol and DHA using an HPX-87H ion exclusion column with H2SO4 as mobile phase
in studied concentration range of 5 mM to 20 mM. The use of a mobile phase composed
of deionized water-acetonitrile containing 0.5 mM H2SO4 (65:35) promoted the
separation of glycerol and DHA with good resolution. However, this paper is limited to
simultaneous determination of glycerol, DHA, 3-hydroxypropionaldehyde and 1,3-
propanediol. Resolution improvement with similar mobile phase (i.e. deionized water-
acetonitrile) was observed also in the paper;[19] nevertheless, the resolution limited to five
glycerol oxidation products was presented and detailed validation data were not provided
since the experimental work was not focused on analytical method development. To
summarize the above information, the reliability of analytical methods for determination
of glycerol oxidation products and derivatives is insufficient and can be further improved,
especially in terms of peak identification, resolution and validation parameters.
The objective of this work was, hence, to optimize and validate an HPLC method for the
simultaneous quantification of glycerol mild oxidation products, namely mesoxalic acid,
Dow
nloa
ded
by [
Juan
Car
los
Bel
trán
Pri
eto]
at 0
6:57
02
Janu
ary
2013

ACCEPTED MANUSCRIPT
ACCEPTED MANUSCRIPT 5
tartronic acid, glyceraldehyde, glyceric acid, glycerol, glycolic acid and
dihydroxyacetone. The special emphasis was placed on the improvement of separation of
overlapping peaks of glycerol, dihydroxyacetone, glycolic acid, glyceric acid and
glyceraldehyde by optimizing the chromatographic conditions. Resolution between the
consecutive peaks was calculated and validation parameters such as linearity, intra-day
precision, accuracy, sensitivity, limit of detection and quantification, were determined.
This is, to our best knowledge the first systematic study focused on optimization and
validation the method for the simultaneous separation of a wide spectrum of glycerol
oxidation products by means of HPLC.
2. EXPERIMENTAL
2.1. Instrument
Analyses were carried out using a modular Waters HPLC instrument with manual
injection. The system comprises a Waters 600E pump, a vacuum degasser VD 040
(Watrex, Czech Republic), a refractive index detector (Waters 2414), and an ultraviolet
detector UV200 (Watrex, Czech Republic). Data analysis and acquisition were performed
with Clarity Chromatography Station.[27] A reversed-phase column Aminex HPX-87C,
sulfonated divinylbenzene-styrene resin , 300 mm × 7.8 mm; (Bio-Rad) was employed
for HPLC separation.
2.2. Chemicals And Reagents
Deionized water was used in all procedures (Millipore). Glycerol (Propane-1,2,3-triol),
glyceraldehyde (2,3-Dihydroxypropanal), dihydroxyacetone (1,3-Dihydroxypropan-2-
Dow
nloa
ded
by [
Juan
Car
los
Bel
trán
Pri
eto]
at 0
6:57
02
Janu
ary
2013
ACCEPTED MANUSCRIPT
ACCEPTED MANUSCRIPT 6
one), tartronic acid (2-Hydroxypropanedioic acid), glycolic acid (2-Hydroxyethanoic
acid), glyceric acid (2,3-Dihydroxypropanoic acid), and mesoxalic acid
(Oxopropanedioic acid) standards were obtained from Sigma-Aldrich (Czech Republic).
Sulfuric acid (H2SO4), chromium trioxide (CrO3), sodium bicarbonate (NaHCO3) and
ethyl methyl ketone (Butan-2-one) were analytical grade chemicals purchased from
Merck (Czech Republic).
2.3. Sample Preparation
Stock solutions of each standard were prepared. 100 mg of the respective compound were
weighted, dissolved and diluted with deionized water to a final volume of 10 mL. Prior
analyses, the samples were filtered through a nylon Millipore filter (0.22 �m). Standard
solutions with concentrations ranging from 0.5 to 10 mg/mL were prepared for
calibration. A 0.01 M H2SO4 stock solution was made by weighing 1.024 g of 95 %
H2SO4 (0.54 mL), pouring it into a 1 L volumetric flask and diluting in deionized water.
From this stock solution, mobile phases with different concentrations of sulfuric acid
were prepared to be used for the method development.
For the purpose of oxidation of glycerol, Jones reagent was prepared by adding 5.75 mL
of H2SO4 over 6.69 g of CrO3 and the solution was diluted in deionized water (25 mL).
Glycerol solution was prepared by weighing 1.7 g of the alcohol and diluting to 10 mL
with ethyl methyl ether.
2.4. Chromatographic Method Development
Dow
nloa
ded
by [
Juan
Car
los
Bel
trán
Pri
eto]
at 0
6:57
02
Janu
ary
2013

ACCEPTED MANUSCRIPT
ACCEPTED MANUSCRIPT 7
The analysis of the glycerol oxidation products was performed using an ion exchange
Aminex HPX-87C (300 mm × 7.8 mm) column in an isocratic mode with aqueous H2SO4
solution as mobile phase. Analytes were monitored by UV detection of carbonyl groups
from carboxylic acids, ketones and aldehydes at 210 nm coupled in series with RI
detector. In order to reveal the order of elution and the individual retention time of each
of the standards, a first set of experimental conditions including mobile phase flow rate:
0.7 mL/min, temperature: 60 °C, and 0.01 M aqueous H2SO4 was used. The temperature
of the refractometric detector remained constant at 30 °C. After the introductory
experiment was conducted, a solution containing a mixture of the standards was analyzed
and influence of the following variables on chromatographic separation was investigated;
1) temperature of 30, 60 and 70 °C 2) flow rate of 0.2, 0.5 and 0.7 ml/min and 3)
concentrations of H2SO4 in mobile phase 1, 3, 5, and 10 mM. The final chromatographic
conditions were set as follows: column temperature was increased to 70 °C, the injection
volume used was 20 �L, flow rate of 0.5 ml/min, mobile phase with 3 mM H2SO4 and
the temperature of the RI detector remained constant at 30 °C. Triplicates of all standards
were analyzed.
2.5. Chromatographic Method Validation
Based on the results from method development given in section 3.1, the optimized
method conditions were used for the method validation. Detection limit test was carried
out by analyzing different concentrations of each compound. Dilutions were prepared
sequentially from a solution that presented a signal to noise (S/N) ratio of at least 30 until
the S/N ratio was approximately 3. The intra-day precision test was carried out by
Dow
nloa
ded
by [
Juan
Car
los
Bel
trán
Pri
eto]
at 0
6:57
02
Janu
ary
2013
ACCEPTED MANUSCRIPT
ACCEPTED MANUSCRIPT 8
performing seven replicate measurements at a specific concentration on the same day by
the same analyst. For the HPLC calibration curves, six different concentrations of the
standards (0.5, 1, 2, 5, 7, and 10 mg/mL) were prepared and evaluated by means of linear
regression. Sensitivity of both detectors was measured by using a ±5 % variation in the
response (mV·s) at six different concentrations (mg/mL). Accuracy was determined using
the method of standard addition in terms of percent recovery. Three different fortified
levels were prepared by adding solutions of specific concentration (2, 5 and 10 mg/mL)
to a pre-analyzed, un-fortified sample. The percent recovery, R (%), was calculated using
the equation (1), where CB represents the difference in concentration between the
fortified and un-fortified samples, and CA stands for the concentration added in the
fortified sample.
R (%) = (CB / CA) x 100 (1)
The standard score (Z-score) was calculated to know the closeness of the accordance
between the concentrations measured in the sample and the standard reference solution as
shown in equation (2), where σ represents the standard deviation of the population.
Normally, Z-score values between -2 and 2 are considered to be acceptable.[28]
Z-score = (CA - CB) / σ (2)
Generally, during the development of a chromatographic method, a multivariate
experimental design is recommended to optimize values for capacity factor (k),
Dow
nloa
ded
by [
Juan
Car
los
Bel
trán
Pri
eto]
at 0
6:57
02
Janu
ary
2013

ACCEPTED MANUSCRIPT
ACCEPTED MANUSCRIPT 9
selectivity (� efficiency (N) and resolution (Rs) by changing variables such as mobile
and stationary phase composition and temperature. Optionally it is possible to vary
column conditions (flow rate, columns length or particle size).[29] As showed in equation
(3), Rs is usually expressed as a function of k, �and N, therefore this value was used as
the variable response for the optimization purpose. Calculation of Rs value for two
adjacent peaks (represented as “A” and “B”) was performed according to equation (4),
where tB and tA corresponds to the retention time of both compounds, and W represents
the bandwidths at half height of both peaks. For completely separated peaks, an Rs value
higher than 1.5 is usually required.[30]
Rs = (1/4) (α - 1) N1/2 {k / (1 + k)} (3)
Rs = 1.18 (tB - tA) / (W0.5,A + W0.5,B) (4)
2.6. Method Application
The developed and validated method was applied to analyze the chemical oxidation
products of glycerol obtained via reaction with Jones reagent. Briefly, 10 mL of a
chromium trioxide solution in sulfuric acid were added dropwise to a 10 mL glycerol
diluted solution (1.7 %) in an ice bath. The addition was slow and proceeded for
approximately 20 min. After the entire chromium oxide solution was added, the reaction
mixture was neutralized by the addition of a saturated aqueous solution of NaHCO3 and 5
mL of ethyl methyl ketone were used for extraction. Finally, the extract containing
oxidation products was filtered, diluted with water (1:10 ratio) and analyzed by means of
HPLC.
Dow
nloa
ded
by [
Juan
Car
los
Bel
trán
Pri
eto]
at 0
6:57
02
Janu
ary
2013

ACCEPTED MANUSCRIPT
ACCEPTED MANUSCRIPT 10
3. RESULTS AND DISCUSSION
3.1. Method Development
The primary aim of this work was to improve separation of glycerol mild oxidation
products, namely mesoxalic acid, tartronic acid, glyceraldehyde, glyceric acid, glycerol,
glycolic acid and dihydroxyacetone. As it was written above, the simultaneous analysis of
these products is complicated by poor resolution resulting in peak overlapping. In order
to suppress this phenomenon, the effect of column temperature, flow rate and
concentration of aqueous H2SO4 (used as mobile phase) was examined; it was observed
that the separation of glycerol oxidation products on a sulfonated divinylbenzene-styrene
resin column is dependent on all these factors.
Analytical conditions which were examined during method optimization, with the
corresponding Rs values are listed in Table 2. At first, mobile phase comprising of 0.01
M H2SO4, temperature of 60 °C and flow rate of 0.7 mL/min were used. These
preliminary tests showed that namely peaks of glyceraldehyde – glyceric acid – glycerol
(first group) and peaks of glycolic acid – DHA (second group) were overlapped as it was
indicated in the literature. The effort was therefore focused on the improvement of
resolution between substances in these two groups. Due to the fact that the RI detector
allows the identification of all the compounds, the Rs values reported in Table 2 are for
this type of detector. The experiments showed that resolution between glyceraldehyde
and glyceric acid increased with the raise in flow rate and concentration of sulfuric acid
Dow
nloa
ded
by [
Juan
Car
los
Bel
trán
Pri
eto]
at 0
6:57
02
Janu
ary
2013
ACCEPTED MANUSCRIPT
ACCEPTED MANUSCRIPT 11
in mobile phase as it is presented also in Supplemental Figure 1. A maximum resolution
of 1.26 between these two substances was achieved at a flow rate of 0.7 mL/min and with
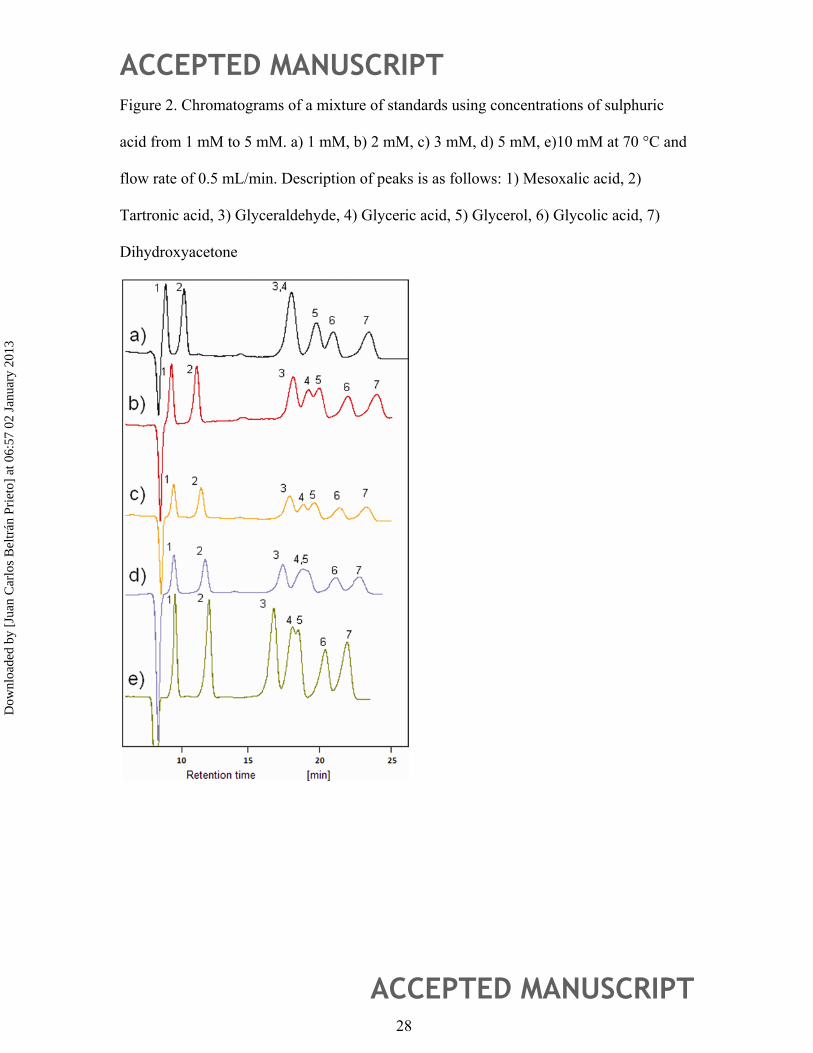
10 mM H2SO4 (pH=1.7). On the contrary, decreasing the concentration of H2SO4 below 5
mM (2 < pH < 2.7) improved the separation between glyceric acid and glycerol, allowing
the qualitative determination of these compounds. However, additional decrease of
concentration up to 1 mM (pH > 2.7), did not further improved separation as illustrated in
Figure 2. In fact, the glyceraldehyde peak overlapped with glyceric acid and glycerol
peak started to overlap with glycolic acid at these conditions. A similar effect was
observed for peaks of mesoxalic and tartronic acids, both showing reduced resolution at
lower concentrations of sulfuric acid. Figure 2 clearly documents the influence of sulfuric
acid concentration on separation between all compounds. The use of 3 mM H2SO4 as
mobile phase with a flow rate of 0.5 mL/min allowed a resolution of 0.6 between glycerol
and glyceric acid. However, glyceric acid can be identified with good resolution and
without overlapping by UV detector, since glycerol does not show absorption at the
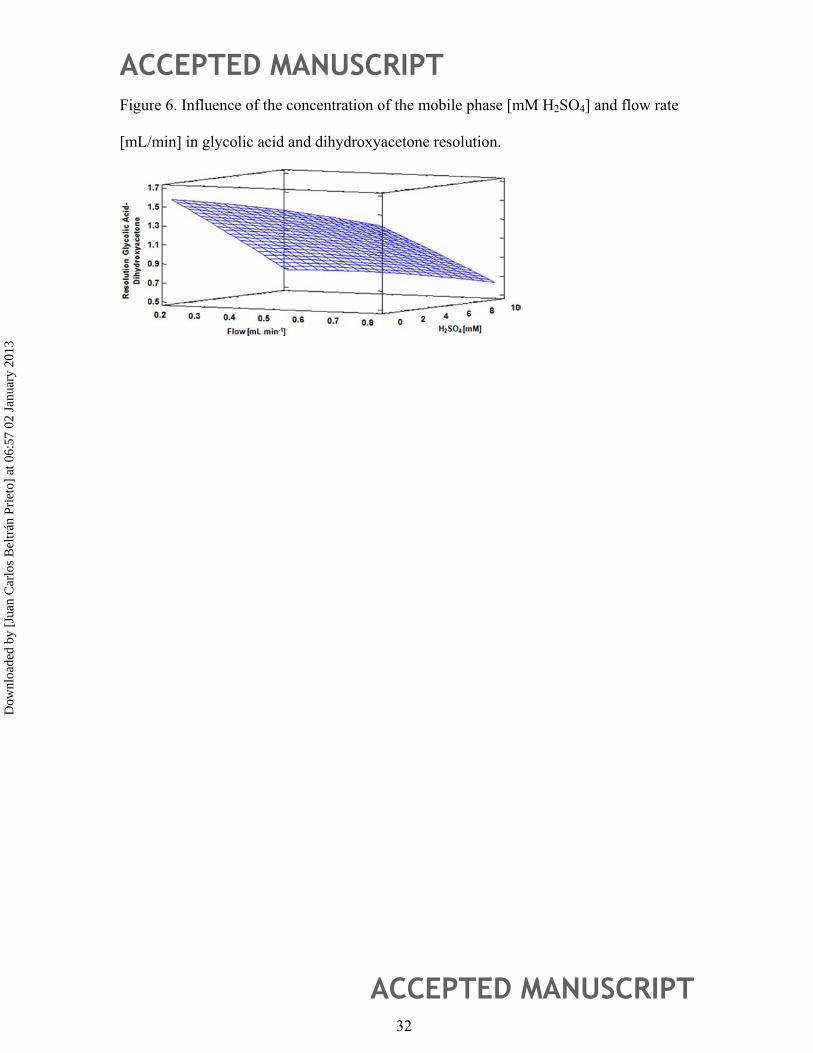
wavelength applied. Moreover, the decrease of H2SO4 concentration positively influences
the Rs value between glycolic acid and dihydroxyacetone (as illustrated also in
Supplemental Figure 2). In summary, the choice of the sulfuric acid concentration
presents a compromise between resolution of glyceraldehyde and glyceric acid on the one
hand and glyceric acid and glycerol on the other hand. The best resolution between these
three compounds was achieved with 3 mM H2SO4 at a flow rate of 0.5 mL/min, showing
Rs values of 3.13 (mesoxalic and tartronic acid), 0.73 (glyceraldehyde and glyceric acid),
0.61 (glyceric acid and glycerol) and 1.27 (glycolic acid and dihydroxyacetone).
Dow
nloa
ded
by [
Juan
Car
los
Bel
trán
Pri
eto]
at 0
6:57
02
Janu
ary
2013
ACCEPTED MANUSCRIPT
ACCEPTED MANUSCRIPT 12
The separation was also significantly affected by temperature. At 30 °C, the peaks were
highly asymmetric with a notable fronting observed. However, this situation was
overcome by increasing the column temperature to 70 °C. A similar observation was
done by Moore and Stein[31] during the separation of amino acids using a Dowex-50, 0.9
× 100 cm column, in the sodium form with different temperature conditions and mobile
phase with buffers that progressively increased the pH. The temperature of 70 °C was
used based on the recommendations of the column manufacturer, as usually a maximum
operating temperature of 80-85 °C is proposed to avoid damage of the column.
The best overall results for the separation of seven different glycerol oxidation products
were achieved using a concentration of 3 mM H2SO4, 70 °C, and flow of 0.5 mL/min. At
these conditions, it is possible to clearly distinguish all compounds of interest. Though,
the peaks of glyceraldehyde, glyceric acid and glycerol are still overlapped, these
conditions allow for better separation of glycerol oxidation products in comparison with
published results. Especially glycerol and DHA are clearly separated and the resolution
values between other compounds (e.g. glyceraldehyde and glyceric acid) were improved.
Hence, these conditions were chosen as acceptable and reliable for the simultaneous
determination of oxidation products and the method was further validated in order to
examine its accuracy for the purposes of quantification.
3.1.2. Validation Parameters
Quantification of glycerol oxidation products was performed by means of calibration
curves based on the UV and RI spectrophotometric response of known amounts of the
Dow
nloa
ded
by [
Juan
Car
los
Bel
trán
Pri
eto]
at 0
6:57
02
Janu
ary
2013
ACCEPTED MANUSCRIPT
ACCEPTED MANUSCRIPT 13
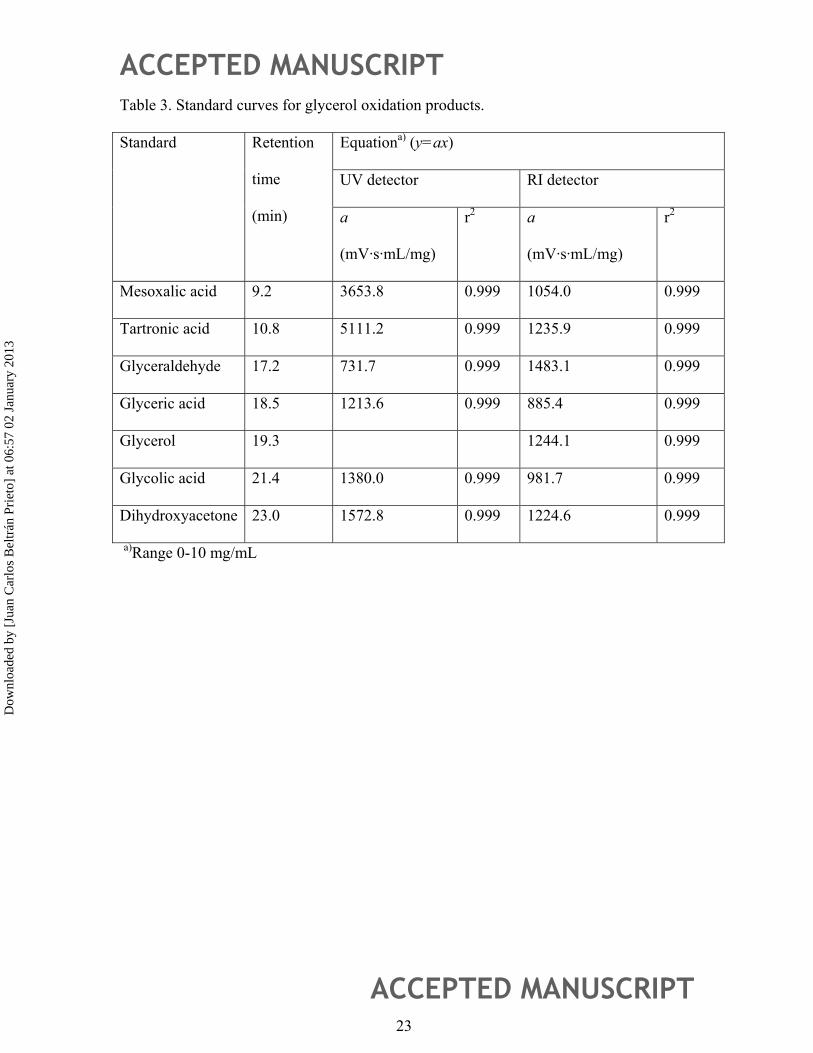
standards in aqueous solutions. Table 3 presents the analyses in a concentration range of
0.5-10 mg/mL. A flow rate of 0.5 mL/min was used with 3 mM H2SO4 as mobile phase at
70 °C. Linearity was determined by means of the calculation of the linear least square
regression. All calibration curves showed a good linear correlation (r2 > 0.999) within the
entire concentration range used.
The relative standard deviation (RSD) is presented as a percentage in Table 4. The range
is from 2.3 to 4.2 % for the UV detector and from 1.75 to 6.39 % for the RI detector
which indicates satisfactory values for precision of the instrument. Similarly, the detector
sensitivity test performed at six different concentrations showed acceptable RSD values,
as presented in Table 5. In order to determine the detection limit, the respective
concentration was taken into consideration when the S/N ratio in triplicate exceeded the
value of three. Under this condition, the concentrations of each compound that could be
detected by the instrument are reported in Table 5. The limit of quantification (LOQ) is
included and was calculated according to.[32] Linearity plot presented in Figure 3
illustrates the dependence between sensitivity and concentration showing the ranges of
constant response for glyceric acid within a 5 % level of deviation. The method showed
reliable quantification over the range of 1 to 10 mg/mL for all the compounds and using 8
% deviation the value of 0.5mg/ml is also inside the linear response for all the standards.
Values outside the linear range of the detector sensitivity can be considered as the limit of
quantification, however according to Ribani et al.,[32] the value obtained by the signal to
noise ratio is generally lower than the one obtained by the sensitivity test.
Dow
nloa
ded
by [
Juan
Car
los
Bel
trán
Pri
eto]
at 0
6:57
02
Janu
ary
2013

ACCEPTED MANUSCRIPT
ACCEPTED MANUSCRIPT 14
3.2. Method Application
In order to verify the method performance on a real sample, the products of chemical
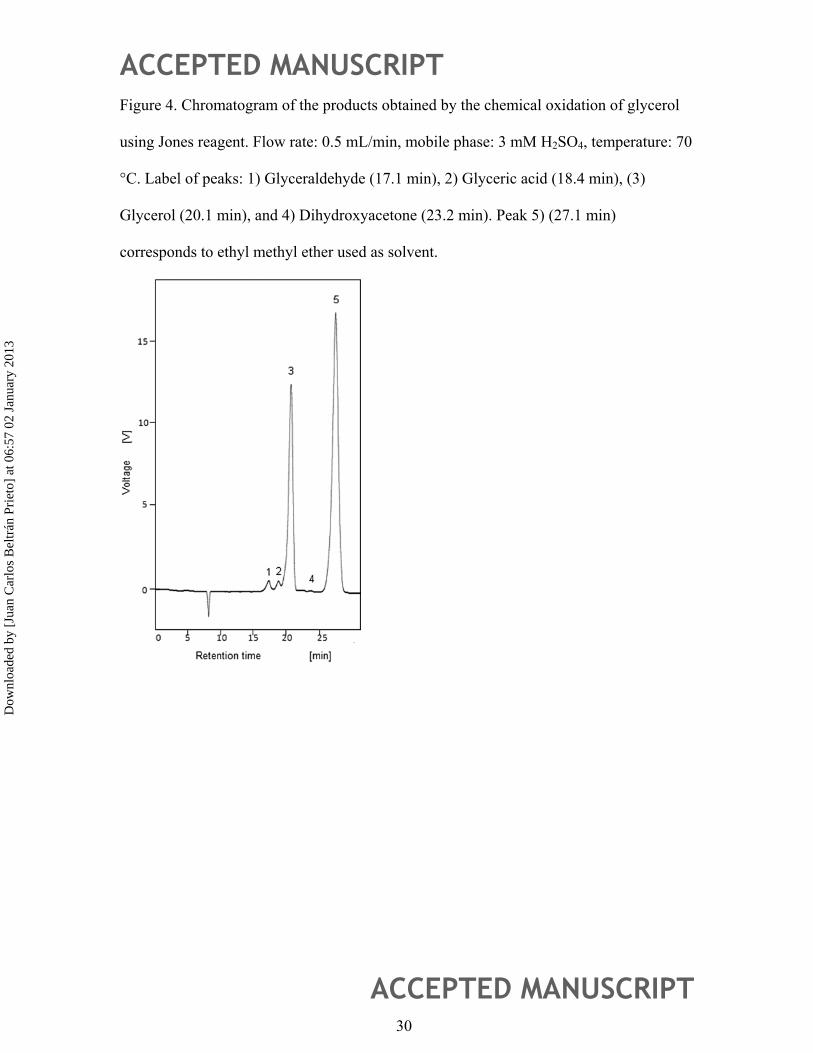
glycerol oxidation were analyzed. The chromatogram of the sample from Jones oxidation
of glycerol is presented in Figure 4. It was seen that the real oxidation products were
clearly identified using the developed and validated HPLC method. The concentrations of
the products were: glycerol (90 ±0.04 mg/mL), glyceraldehyde (4.14 ±0.03 mg/mL),
glyceric acid (5.85 ±0.029 mg/mL), and dihydroxyacetone (1.54 ±0.036 mg/mL).
Accuracy was determined using the sample obtained from the oxidation of glycerol as
un-fortified solution. Table 6 presents the percent recoveries and Z-score at the respective
fortified level for each compound determined in triplicate. In all cases, it was found a
recovery from 96.5 to 103.3 % (both detectors) for the studied levels and a Z-score within
the acceptance limits of -2 to 2. The combination of partial separation and selective
response of the RI and UV detectors allowed the reliable quantification of the analytes.
This demonstrates the method suitability in the identification and also quantification of
glycerol oxidation products by HPLC.
4. CONCLUDING REMARKS
There are only a few HPLC methods published that discuss the identification and
separation of glycerol oxidation compounds. Moreover, these methods do not clearly
state a methodology for the optimization of the chromatographic conditions and the
results of their rigorous validation were not reported. In this work, a simple method
capable of simultaneous determination of seven different glycerol oxidation products was
proposed. Though this method is based on previously published procedures, the
Dow
nloa
ded
by [
Juan
Car
los
Bel
trán
Pri
eto]
at 0
6:57
02
Janu
ary
2013
ACCEPTED MANUSCRIPT
ACCEPTED MANUSCRIPT 15
separation of oxidation compounds was noticeably improved and chromatographic
conditions that allowed reproducible elution of individual peaks and acceptable resolution
between analytes with closer retention time were proposed. The proposed method implies
the use of a sulfonated divinylbenzene-styrene resin column in the calcium ionic form
(Aminex HPX-87C), which was effective for the analysis with a flow rate of 0.5 mL/min,
3 mM of H2SO4 as mobile phase, and a temperature of 70 °C.
Since a simultaneous separation of such a number of glycerol derivatives with similar
structure is a challenging task, the peak overlapping was not fully eliminated with the
optimized method; however, it was noticeably reduced in comparison to currently known
methods. Due to the reason that the simple simultaneous determination is of significant
practical value, this method was further validated and its accuracy was successfully
verified with the real sample of oxidation products. Briefly, the results of intra-day
precision, detection and quantification limit, linearity, accuracy and sensitivity were
reported. It was therefore proved that the method is reliable enough and thus useful e.g. in
the area of new glycerol oxidation processes development.
ACKNOWLEDGEMENTS
The project was financially supported by the European Regional Development Fund
(ERDF) under the Project CEBIA-Tech No. CZ.1.05/2.1.00/03.0089, with support of
Operational Program Research and Development for Innovations co-funded by the ERDF
and national budget of Czech Republic, within the framework of project Centre of
Polymer Systems (reg. number: CZ.1.05/2.1.00/03.0111) and Tomas Bata University
Dow
nloa
ded
by [
Juan
Car
los
Bel
trán
Pri
eto]
at 0
6:57
02
Janu
ary
2013

ACCEPTED MANUSCRIPT
ACCEPTED MANUSCRIPT 16
Internal Grant (IGA/FAI/2012/029). One author (B-P.) is also grateful for the doctoral
scholarship provided by Tomas Bata University in Zlín and the National Council of
Science and Technology (CONACYT) in Mexico.
REFERENCES
[1] Katryniok, B.; Kimura, H.; Skrzynska, E.; Girardon, J.; Fongarland, P.; Capron, M.;
Ducoulombier, R.; Mimura, N.; Paul, S.; Dumeignil, F. Selective catalytic oxidation of
glycerol: perspectives for high value Chemicals. Selective catalytic oxidation of glycerol:
perspectives for high value Green Chemistry. 2011, 13 (8), 1960–1979.
[2] Pagliaro, M.; Ciriminna, R.; Kimura, H.; Rossi, M.; Della Pina, C. From Glycerol to
Value-Added Products. Angewandte Chemie International Edition. 2007, 46 (24), 4434–
4440.
[3] Claridge, C.; Hendlin, D. Oxidation of glycerol by streptococcus faecalis. Journal of
Bacteriology. 1962, 84 (6), 1181–1186.
[4] Wyman, C. Handbook on Bioethanol: Production and Utilization, CRC Press:
Applied Energy Technology Series, 1996.
[5] Demirel, S.; Lehnert, K.; Lucas, M.; Claus, P. Use of renewables for the production of
chemicals: Glycerol oxidation over carbon supported gold catalysts. Applied Catalysis B-
Environmental. 2007, 70 (1-4), 637–643.
[6] Brandner, A. From yellow fields to green chemistry. About the selective deactivation
in the oxidation of glycerol to dihydroxyacetone on platinum-bismuth catalysts. Ph.D.
Thesis, Technische Universität Darmstadt, 2010.
Dow
nloa
ded
by [
Juan
Car
los
Bel
trán
Pri
eto]
at 0
6:57
02
Janu
ary
2013
ACCEPTED MANUSCRIPT
ACCEPTED MANUSCRIPT 17
[7] Demirel, S. Liquid-phase oxidation of glycerol on gold catalysts. Ph.D. Thesis,
Technische Universität Darmstadt, 2008.
[8] Liebminger, S.; Siebenhofer, M.; Guebitz, G. Oxidation of glycerol by 2,2,6,6-
tetramethylpiperidine-N-oxyl (TEMPO) in the presence of laccase. Bioresource
Technology. 2009, 100 (20), 4541–4545.
[9] Aguirre, D. Influence of the preparation method in catalytic properties of supported
gold in glycerol activation. Master thesis, Universidad Nacional de Colombia, 2010.
[10] Ketchie, W.; Fang, Y.; Wong, M.; Murayama, M.; Davis, R. Influence of gold
particle size on the aqueous-phase oxidation of carbon monoxide and glycerol. Journal of
Catalysis. 2007, 250 (1), 94–101.
[11] Zope, B.; Davis, R. Inhibition of gold and platinum catalysts by reactive
intermediates produced in the selective oxidation of alcohols in liquid water. Green
Chemistry. 2011, 13, 3484–3491.
[12] Kwon, Y.; Koper, M. Combining Voltammetry with HPLC: Application to Electro-
Oxidation of Glycerol. Analytical Chemistry. 2010, 82 (13), 5420–5424.
[13] Augugliaro, V.; Hamed El Nazer, Loddo, V.; Mele, A.; Palmisano, G.; Palmisano,
L.; Yurdakal, S. Partial photocatalytic oxidation of glycerol in TiO2 water suspensions.
Catalysis Today. 2010, 151 (1-2), 21–28.
[14] Carrettin, S.; McMorn, P.; Johnston, P.; Griffin, K.; Kiely, C.; Attard, G.; Hutchings,
G. Oxidation of glycerol using supported gold catalysts. Topics in Catalysis. 2004, 27 (1–
4), 131-136.
[15] Roquet, L.; Belgsir, M.; Léger, J.; Lamy, C. Kinetics and mechanisms of the
electrocatalytic oxidation of glycerol as investigated by chromatographic analysis of the
Dow
nloa
ded
by [
Juan
Car
los
Bel
trán
Pri
eto]
at 0
6:57
02
Janu
ary
2013

ACCEPTED MANUSCRIPT
ACCEPTED MANUSCRIPT 18
reaction products: Potential and pH effects. Electrochimica Acta. 1994, 39 (16), 2387–
2394.
[16] Musialska, K.; Finocchio, E.; Sobczak, I.; Busca, G.; Wojcieszak, R.; Gaigneaux, E.;
Ziolek, M. Characterization of alumina- and niobia-supported gold catalysts used for
oxidation of glycerol. Applied Catalysis A: General. 2010, 384 (1-2), 70–77.
[17] Hu, W.; Knight, D.; Lowry, B.; Varma, A. Selective Oxidation of Glycerol to
Dihydroxyacetone over Pt-Bi/C Catalyst, Optimization of Catalyst and Reaction
Conditions. Industrial & Engineering Chemistry Research. 2010, 49 (21), 10876–10882.
[18] Kimura, H.; Tsuto, K. Selective oxidation of glycerol on a platinum-bismuth
catalyst. Applied Catalysis A. 1993, 96 (2), 217–228.
[19] Liang, D.; Gao, J.; Sun, H.; Chen, P.; Hou, Z.; Zheng, X. Selective oxidation of
glycerol with oxygen in a base-free aqueous over MWNTs supported Pt catalysts
solution. Applied Catalysis B:Environmental 2011, 106 (3-4), 423-432.
[20] Biella, S.; Castiglioni, G.; Fumagalli, C.; Prati, L.; Rossi, M. Application of gold
catalysts to selective liquid phase oxidation. Catalysis Today. 2002, 72 (1-2), 43–49.
[21] Chen, H.; Fang, B.; Hu, Z. Simultaneous HPLC determination of four key
metabolites in the metabolic pathway for production of 1,3-Propanediol from Glycerol.
Chromatographia. 2007, 65 (9-10), 629–632.
[22] Demirel, S.; Lucas, M.; Claus, P. Liquid phase oxidation of glycerol over carbon
supported gold catalysts. Catalysis Today. 2005, 102-103, 166–172.
[23] Ernst, M.; Marr, R.; Ahn, E.; Hilber, T.; Siebenhofer, M.; New products from partial
oxidation of glycerol, Annual Meeting of the AIChE Austin, TX, 2004.
Dow
nloa
ded
by [
Juan
Car
los
Bel
trán
Pri
eto]
at 0
6:57
02
Janu
ary
2013
ACCEPTED MANUSCRIPT
ACCEPTED MANUSCRIPT 19
[24] Garcia, R.; Besson, M.; Gallezot, P. Chemoselective catalytic oxidation of glycerol
with air on platinum metals. Applied Catalysis A. 1995, 127 (1-2):165–176.
[25] Liang, D.; Gao, J.; Wang, J.; Chen, P.; Hou, Z.; Zheng, X. Selective oxidation of
glycerol in a base-free aqueous solution over different sized Pt catalysts. Catalysis
Communications. 2009, 10 (12), 1586–1590.
[26] Fordham, P.; Besson, M.; Gallezot, P. Selective catalytic oxidation of glyceric acid
to tartronic and hydroxypyruvic acids. Applied Catalysis A, 1995, 133 (2), LI79–L184.
[27] Clarity Chromatography Station Software, (version 2.8.2.648) DataApex, Czech
Republic
[28] Kall, M. A. Determination of total vitamin B6 in foods by isocratic HPLC: a
comparison with microbiological analysis. Food Chemistry. 2003, 82 (2), 315–327.
[29] Bulusu, S.; Mills, G.; Walker, V. Analysis of Organic Acids in Physiological Fluids
by High Performance Liquid Chromatography. Journal of Liquid Chromatography. 1991,
14 (9), 1757–1777.
[30] Snyder, L.; Kirkland, J.; Glajch, J. Practical HPLC Method Development, Wiley-
Interscience, 1997.
[31] Moore, S.; Stein, W. Chromatography of amino acids on sulfonated polystyrene
resins. Journal of Biological Chemistry. 1951, 192 (2), 663–681.
[32] Ribani, M.; Collins, C.; Bottoli, C. Validation of chromatographic methods:
evaluation of detection and quantification limits in the determination of impurities in
omeprazole. Journal of Chromatography A. 2007, 1156 (1-2), 201–205.
Dow
nloa
ded
by [
Juan
Car
los
Bel
trán
Pri
eto]
at 0
6:57
02
Janu
ary
2013

ACCEPTED MANUSCRIPT
ACCEPTED MANUSCRIPT 20
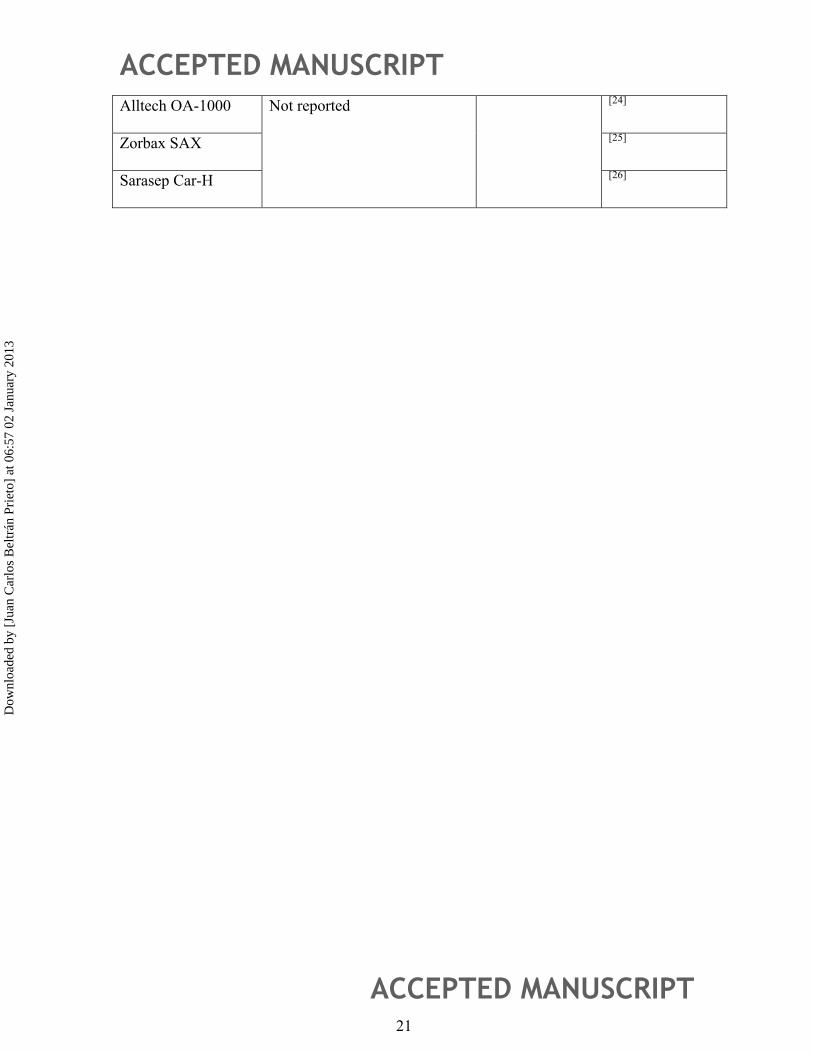
Table 1. Method conditions reported in literature for the identification of glycerol
oxidation products by HPLC.
Column Mobile phase Column
temperature (°C)
Reference
Aminex HPX-87H 10 mM H2SO4 60 [5,6]
Aminex HPX 87C 10 mM H2SO4 60 [7]
Aminex HPX-87H 5 mM H2SO4 60 [8,9]
Aminex HPX-87H 5 mM H2SO4 55 [10]
Aminex HPX 87H 5 mM H2SO4 45 [11]
Aminex HPX-87H 5 mM H2SO4 30 [12]
Alltech IOA 1000 5 mM H2SO4 25 [13]
Alltech QA-1000 4 mM H2SO4 70 [14]
Aminex HPX-87H 4 mM H2SO4 30 [15]
ICPak Ion Exclusion 0.4 mM H2SO4 70 [16]
Hitachi GL-C610-S Water 60 [17,18]
Zorbax SAX H3PO4 (0.1 % w/w) in H2O-
acetonitrile (1/2 v/v)
25 [19]
Alltech OA-1000 10 mM H2SO4/10 mM H3PO4 Not reported [20]
Aminex HPX-87H 65:35 H2O–acetonitrile
containing 0.5 mM H2SO4
[21]
Aminex HPX-87H 0.01 M H2SO4 [22]
Rezex ROA 0.01 N H2SO4 [23]
Dow
nloa
ded
by [
Juan
Car
los
Bel
trán
Pri
eto]
at 0
6:57
02
Janu
ary
2013
ACCEPTED MANUSCRIPT
ACCEPTED MANUSCRIPT 21
Alltech OA-1000 Not reported [24]
Zorbax SAX [25]
Sarasep Car-H [26]
Dow
nloa
ded
by [
Juan
Car
los
Bel
trán
Pri
eto]
at 0
6:57
02
Janu
ary
2013

ACCEPTED MANUSCRIPT
ACCEPTED MANUSCRIPT 22
Table 2. Summary of the experiments realized for the identification of the standards
analyzed with the respective resolution achieved using refractive index detector.
Tempe
rature
(°C)
H2SO4 (mM) in
mobile phase
pH Flow rate
(mL/min)
Resolutiona)
Mesoxalic-
Tartronic
acid
Glyceraldehyde-
Glyceric acid
Glyceric
acid-
Glycerol
Glycolic acid-
Dihydroxyacetone
70 10 1.7 0.7 3.5 1.2 0 0.74
70 5 2 0.7 3.4 1.59 0 1.06
70 3 2.2 0.7 3.1 0.96 0.51 1.22
70 1 2.7 0.7 2.68 0.85 0.5 1.32
70 10 1.7 0.5 3.172 1.25 0 0.88
70 5 2 0.5 3.45 0.87 0 1.11
70 3 2.2 0.5 3.11 0.73 0.61 1.27
70 2 2.4 0.5 3 0.85 0.56 1.35
70 1 2.7 0.5 2.67 0.51 0.58 1.44
70 10 1.7 0.2 3.08 0.59 0 1.04
70 5 2 0.2 3.17 0.54 0 1.23
70 3 2.2 0.2 2.83 0.19 0.8 1.35
70 1 2.7 0.2 2.26 0 1.15 1.49
60 10 0.01 0.7 2.48 0.99 0 0.67
60 10 0.01 0.8 2.64 0.93 0 0.66
a) Resolution was calculated according to the expression (4)
Dow
nloa
ded
by [
Juan
Car
los
Bel
trán
Pri
eto]
at 0
6:57
02
Janu
ary
2013
ACCEPTED MANUSCRIPT
ACCEPTED MANUSCRIPT 23
Table 3. Standard curves for glycerol oxidation products.
Standard Retention
time
(min)
Equationa) (y=ax)
UV detector RI detector
a
(mV·s·mL/mg)
r2 a
(mV·s·mL/mg)
r2
Mesoxalic acid 9.2 3653.8 0.999 1054.0 0.999
Tartronic acid 10.8 5111.2 0.999 1235.9 0.999
Glyceraldehyde 17.2 731.7 0.999 1483.1 0.999
Glyceric acid 18.5 1213.6 0.999 885.4 0.999
Glycerol 19.3 1244.1 0.999
Glycolic acid 21.4 1380.0 0.999 981.7 0.999
Dihydroxyacetone 23.0 1572.8 0.999 1224.6 0.999
a)Range 0-10 mg/mL
Dow
nloa
ded
by [
Juan
Car
los
Bel
trán
Pri
eto]
at 0
6:57
02
Janu
ary
2013
ACCEPTED MANUSCRIPT
ACCEPTED MANUSCRIPT 24
Table 4. Intra-day precision test of the HPLC method for the determination of glycerol
oxidation products expressed as a peak area
Standard UV detector RI detector
Mean peak area
(N = 7) (mV·s)
Standard
deviation
RSD
(%)
Mean peak area
(N = 7) (mV·s)
Standard
deviation
RSD
(%)
Mesoxalic acid 588.1 14.1 2.4 200 5.5 2.7
Tartronic acid 920.4 21.2 2.3 226.5 6.8 3
Glyceraldehyde 102.8 4.3 4.2 246 15.7 6.4
Glyceric acid 203.2 5.7 2.8 384.7 6.8 1.7
Glycerol n.a n.a n.a 206.5 3.14 1.4
Glycolic acid 177.2 7 3.9 129.4 5.1 3.9
Dihydroxyacetone 192.5 6.5 3.3 152.2 6.1 4
n.a. not applicable
Dow
nloa
ded
by [
Juan
Car
los
Bel
trán
Pri
eto]
at 0
6:57
02
Janu
ary
2013
ACCEPTED MANUSCRIPT
ACCEPTED MANUSCRIPT 25
Table 5. Determination of sensitivity using UV and RI detectors and determination of
LOD and LOQ values for each compound
Compound UV detector RI detector LOD LOQ
Mean
Sensitivity
(mV·s·mL/mg)
RSD
(%)
Mean
Sensitivity
(mV·s·mL/mg)
RSD
(%)
(mg/mL) (mg/mL)
Mesoxalic acid 3865.2 5.3 1075.1 3.1 0.013 0.043
Tartronic acid 5408.3 5.4 1249.5 2.4 0.014 0.046
Glyceraldehyde 703.0 4.3 1494.8 1.5 0.017 0.056
Glyceric acid 1223.3 2.1 901.7 3.9 0.010 0.033
Glycerol n.a n.a 1266.2 3.0 0.015 0.049
Glycolic acid 1387.9 1.7 995.6 3.2 0.010 0.033
Dihydroxyacetone 1598.0 2.0 1238.4 1.7 0.014 0.046
n.a. not applicable
Dow
nloa
ded
by [
Juan
Car
los
Bel
trán
Pri
eto]
at 0
6:57
02
Janu
ary
2013
ACCEPTED MANUSCRIPT
ACCEPTED MANUSCRIPT 26
Table 6. Accuracy test expressed as Percent recovery
RI detector UV detector
Compound Fortified
level
(mg/mL)
Detected
Level
(mg/mL)
Recovery
(%)
Z-
score
Detected
Level
(mg/mL)
Recovery
(%)
Z-
score
Glycerol 2 1.95 97.50 -1.77 n.a. n.a. n.a.
5 4.94 98.80 -1.69 n.a. n.a. n.a.
10 9.90 98.97 -1.80 n.a. n.a. n.a.
Glyceraldehyde 2 2.05 102.33 0.37 2.01 100.67 0.18
5 4.96 99.27 -0.75 4.95 99.07 -0.95
10 10.04 100.37 0.75 10.05 100.47 0.71
Glyceric acid 2 1.94 96.83 -1.72 1.93 96.50 -0.64
5 4.94 98.73 -1.92 5.05 101.00 0.59
10 9.83 98.33 -1.76 10.06 100.63 0.93
DHA 2 2.02 101.17 0.26 2.03 101.67 1.27
5 4.97 99.33 -0.35 5.07 101.40 1.08
10 9.93 99.33 -0.96 10.33 103.30 0.78
n.a. not applicable
Dow
nloa
ded
by [
Juan
Car
los
Bel
trán
Pri
eto]
at 0
6:57
02
Janu
ary
2013
ACCEPTED MANUSCRIPT
ACCEPTED MANUSCRIPT 27
Figure 1. Glycerol oxidation pathway.
Dow
nloa
ded
by [
Juan
Car
los
Bel
trán
Pri
eto]
at 0
6:57
02
Janu
ary
2013
ACCEPTED MANUSCRIPT
ACCEPTED MANUSCRIPT 28
Figure 2. Chromatograms of a mixture of standards using concentrations of sulphuric
acid from 1 mM to 5 mM. a) 1 mM, b) 2 mM, c) 3 mM, d) 5 mM, e)10 mM at 70 °C and
flow rate of 0.5 mL/min. Description of peaks is as follows: 1) Mesoxalic acid, 2)
Tartronic acid, 3) Glyceraldehyde, 4) Glyceric acid, 5) Glycerol, 6) Glycolic acid, 7)
Dihydroxyacetone
Dow
nloa
ded
by [
Juan
Car
los
Bel
trán
Pri
eto]
at 0
6:57
02
Janu
ary
2013

ACCEPTED MANUSCRIPT
ACCEPTED MANUSCRIPT 29
Figure 3. Sensitivity test for quantification of glyceric acid in RI detector.
Dow
nloa
ded
by [
Juan
Car
los
Bel
trán
Pri
eto]
at 0
6:57
02
Janu
ary
2013
ACCEPTED MANUSCRIPT
ACCEPTED MANUSCRIPT 30
Figure 4. Chromatogram of the products obtained by the chemical oxidation of glycerol
using Jones reagent. Flow rate: 0.5 mL/min, mobile phase: 3 mM H2SO4, temperature: 70
°C. Label of peaks: 1) Glyceraldehyde (17.1 min), 2) Glyceric acid (18.4 min), (3)
Glycerol (20.1 min), and 4) Dihydroxyacetone (23.2 min). Peak 5) (27.1 min)
corresponds to ethyl methyl ether used as solvent.
Dow
nloa
ded
by [
Juan
Car
los
Bel
trán
Pri
eto]
at 0
6:57
02
Janu
ary
2013

ACCEPTED MANUSCRIPT
ACCEPTED MANUSCRIPT 31
Figure 5. Influence of the concentration of the mobile phase [mM H2SO4] and flow rate
[mL/min] in the resolution of glyceraldehyde and glyceric acid.
Dow
nloa
ded
by [
Juan
Car
los
Bel
trán
Pri
eto]
at 0
6:57
02
Janu
ary
2013
ACCEPTED MANUSCRIPT
ACCEPTED MANUSCRIPT 32
Figure 6. Influence of the concentration of the mobile phase [mM H2SO4] and flow rate
[mL/min] in glycolic acid and dihydroxyacetone resolution.
Dow
nloa
ded
by [
Juan
Car
los
Bel
trán
Pri
eto]
at 0
6:57
02
Janu
ary
2013

ACCEPTED MANUSCRIPT
ACCEPTED MANUSCRIPT 33
Figure 7. Influence of the concentration of the mobile phase [mM H2SO4] and flow rate
[mL/min] in mesoxalic and tartronic acid resolution.
Dow
nloa
ded
by [
Juan
Car
los
Bel
trán
Pri
eto]
at 0
6:57
02
Janu
ary
2013