development of in-place density method for cold in-place
TRANSCRIPT
NDOT Research Report
Report No. 224-14-803
Task Order 9
Development of In-Place Density Method for
Cold In-Place Recycling
January 2018
Nevada Department of Transportation
1263 South Stewart Street
Carson City, NV 89712
Disclaimer
This work was sponsored by the Nevada Department of Transportation. The contents of
this report reflect the views of the authors, who are responsible for the facts and the
accuracy of the data presented herein. The contents do not necessarily reflect the official
views or policies of the State of Nevada at the time of publication. This report does not
constitute a standard, specification, or regulation.

Final Report January 2018
DEVELOPMENT OF IN-PLACE DENSITY METHOD FOR COLD IN-PLACE RECYCLING
SOLARIS Consortium, Tier 1 University Transportation Center Center for Advanced Transportation Education and Research Department of Civil and Environmental Engineering University of Nevada, Reno Reno, NV 89557
Peter E. Sebaaly, PhD, PE Pavement Engineering & Science Program Department of Civil and Environmental Engineering University of Nevada, Reno Reno, NV 89557

ii
DISCLAIMER:
The contents of this report reflect the views of the authors, who are responsible for the facts and accuracy of the information presented herein. This document is disseminated under the sponsorship of the U.S. Department of Transportation’s University Transportation Centers Program, in the interest of information exchange. The U.S. Government assumes no liability for the contents or use thereof.

i
Technical Report Documentation Page
1. Report No.
224-14-803 TO 9
2. Government Accession No. 3. Recipient’s Catalog No.
4. Title and Subtitle
Development of In-Place Density Method for Cold In-Place
Recycling
5. Report Date
January 2018
6. Performing Organization Code
University of Nevada, Reno
7. Author(s)
Peter E. Sebaaly, Jorge A.Castro, Elie Y. Hajj, and Peter S.
Sebaaly
8. Performing Organization Report No.
WRSC-UNR-UTC-CIR-1
9. Performing Organization Name and Address
Western Regional Superpave Center
Pavement Engineering & Science Program
Department of Civil and Environmental Engineering
University of Nevada
1664 N. Virginia Street/Mail Stop 258
Reno, Nevada 89557
10. Work Unit No.
11. Contract or Grant No.
12. Sponsoring Agency Name and Address
SOLARIS University Transportation Center
Center for Advanced Transportation Education and Research
Department of Civil & Env. Engineering
University of Nevada
Reno, NV 89557
13. Type of Report and Period Covered
Final
14. Sponsoring Agency Code
15. Supplementary Notes
16. Abstract
This report presents the results of a research study funded by the Nevada DOT and the SOLARIS University
Transportation Center. The research developed a method for measuring the in-place density of the cold in-place
recycled (CIR) layer immediately after compaction. A laboratory experiment was conducted that measured the
density of the compacted CIR slabs using the rubber balloon and sand cone methods and compared these
measurements to the densities of cores. Based on the statistical analyses of the collected data, it was concluded that
measuring the in-place density of the compacted CIR layer using the sand cone method leads to the estimation of
in-place air voids that are the closest to air voids of cores obtained from the CIR layer bulked with the Parafilm
method. Based on this conclusion, the following recommendation is made:
• Use the sand cone method to measure the in-place density of the of the compacted CIR layer
• Measure the maximum theoretical specific gravity of the CIR mix following AASHTO T209
• Calculate the in-place air voids of the CIR layer using the in-place sand cone bulk density of the CIR
layer along with the maximum theoretical specific gravity of the CIR mix following AASHTO T269
• Add 2.8% to the in-place air voids calculated from the sand cone measurement to calculate the adjusted
in-place air voids
• There is 95% confidence that the adjusted in-place air voids will be: -0.9% to +0.5% from the actual in-
place air voids measured on cores using the Parafilm method
17. Key Words
Asphalt Pavement, Cold In-Place Recycling, Sand
Cone, Water Balloon, In-Place Density
18. Distribution Statement
No restriction.
19. Security Classif. (of this report)
Unclassified
20. Security Classif. (of this page)
Unclassified
21. No. of Pages
41
22. Price
Free

ii
SI* (MODERN METRIC) CONVERSION FACTORS
APPROXIMATE CONVERSIONS TO SI UNITS
Symbol When you know Multiply by To find Symbol
LENGTH
in inches 25.4 millimeters mm
ft feet 0.305 meters m
yd yards 0.914 meters m
mi miles 1.61 kilometers km
AREA
in2 square inches 645.2 square millimeters mm2
ft2 square feet 0.093 square meters m2
yd2 square yard 0.836 square meters m2
ac acres 0.405 hectares ha
mi2 square miles 2.59 square kilometers km2
VOLUME
fl oz fluid ounces 29.57 milliliters mL
gal gallons 3.785 liters L
ft3 cubic feet 0.028 cubic meters m3
yd3 cubic yards 0.765 cubic meters m3
NOTE: volumes greater than 1000 L shall be shown in m3
MASS
oz ounces 28.35 grams g
lb pounds 0.454 kilograms kg
T short tons (2000 lb) 0.907 megagrams (or "metric ton") Mg (or "t")
TEMPERATURE (exact degrees)
oF Fahrenheit 5 (F-32)/9
or (F-32)/1.8 Celsius oC
ILLUMINATION
fc foot-candles 10.76 lux lx
fl foot-Lamberts 3.426 candela/m2 cd/m2
FORCE and PRESSURE or STRESS
lbf poundforce 4.45 newtons N
lbf/in2 poundforce per square inch 6.89 kilopascals kPa
APPROXIMATE CONVERSIONS TO SI UNITS
Symbol When you know Multiply by To find Symbol
LENGTH
mm millimeters 0.039 inches in
m meters 3.28 feet ft
m meters 1.09 yards yd
km kilometers 0.621 miles mi
AREA
mm2 square millimeters 0.0016 square inches in2
m2 square meters 10.764 square feet ft2
m2 square meters 1.195 square yards yd2
ha hectares 2.47 acres ac
km2 square kilometers 0.386 square miles mi2
VOLUME
mL milliliters 0.034 fluid ounces fl oz
L liters 0.264 gallons gal
m3 cubic meters 35.314 cubic feet ft3
m3 cubic meters 1.307 cubic yards yd3
MASS
g grams 0.035 ounces oz
kg kilograms 2.202 pounds lb
Mg (or "t") megagrams (or "metric ton") 1.103 short tons (2000 lb) T
TEMPERATURE (exact degrees) oC Celsius 1.8C+32 Fahrenheit oF
ILLUMINATION
lx lux 0.0929 foot-candles fc
cd/m2 candela/m2 0.2919 foot-Lamberts fl
FORCE and PRESSURE or STRESS
N newtons 0.225 poundforce lbf
kPa kilopascals 0.145 poundforce per square inch lbf/in2
iii
TABLE OF CONTENTS
INTRODUCTION ------------------------------------------------------------------------------------------- 1
OBJECTIVE ................................................................................................................................ 2 RESEARCH PROGRAM ---------------------------------------------------------------------------------- 3
TASK 1: REVIEW OF CIR PROJECTS..................................................................................... 3
Evaluation of Cores ................................................................................................................ 3 Performance Evaluations........................................................................................................ 4
TASK 2: LABORATORY EXPERIMENT ................................................................................ 7 Sand Cone Method .................................................................................................................. 8
Rubber Balloon Method .......................................................................................................... 9 Field Permeability Method ................................................................................................... 10 Laboratory Evaluations ........................................................................................................ 11
Analysis of In-place Density Test Results ............................................................................. 17
Selected Approach ................................................................................................................ 25 TASK 3: FIELD VERIFICATION AND IMPLEMENTATION ............................................. 25
CIR Project in Fernley, NV ................................................................................................... 25
CIR Project in Ely, NV .......................................................................................................... 28 FINDINGS AND RECOMMENDATIONS ----------------------------------------------------------- 28
ACKNOWLEDGEMENT -------------------------------------------------------------------------------- 29 APPENDIX A ------------------------------------------------------------------------------------------------ 30

iv
LIST OF FIGURES
Figure 1. Cold in-place recycling train components. ..................................................................... 1 Figure 2. The CIR mix is picked up by the paver and roller compacted. ...................................... 2 Figure 3. Surface of Red Rock Road in December 2017. .............................................................. 6 Figure 4. Surface of Sandpiper Drive in December 2017. ............................................................. 6 Figure 5. Sand cone apparatus on the CIR mat. ............................................................................. 8
Figure 6. Rubber balloon apparatus on the CIR mat...................................................................... 9 Figure 7. NCAT Field Permeameter apparatus on the CIR mat. ................................................. 10 Figure 8. Laboratory CIR mixture production and compaction using concrete mixer and
vibratory plate compactor. ............................................................................................................ 11
Figure 9. CIR slabs density measurement plan. ........................................................................... 12 Figure 10. Water leaks during the permeability test. ................................................................... 13 Figure 11. Washed fines after performing the permeability test.................................................. 13 Figure 12. Coring of the CIR slabs. ............................................................................................. 15
Figure 13. Test methods for bulk specific gravity of cores: left – Parafilm, right – Corelok. .... 15
Figure 14. Relationship between air voids of cores from Parafilm and Corelok methods. ......... 16 Figure 15. Relationship between air voids from parafilm and Corelok methods (Zhang et al,
2014) (VTM: Voids in Total Mix). ............................................................................................... 16
Figure 16. Comparison of in-place air voids and cores air voids using Parafilm for Slab-1. ...... 17 Figure 17. Comparison of in-place air voids and cores air voids using Parafilm for all 7 slabs. 17
Figure 18. Comparison of in-place air voids and cores air voids using Corelok for all 7 slabs. . 18
Figure 19. Difference between the air voids from the cores using Parafilm and the estimated air
voids using the balloon method. ................................................................................................... 19 Figure 20. Difference between the air voids from the cores using Corelok and the estimated air
voids using the balloon method. ................................................................................................... 19 Figure 21. Difference between the air voids from the cores using Parafilm and the estimated air
voids using the sand cone method. ............................................................................................... 20
Figure 22. Difference between the air voids from the cores using Corelok and the estimated air
voids using the sand cone method. ............................................................................................... 20
Figure 23. Comparison of in-place air voids (sand cone and rubber balloon methods) and air
voids of cores using Parafilm. ....................................................................................................... 21 Figure 24. Corrected equality line for in-place air voids (rubber balloon method) vs air voids of
the cores using Parafilm. ............................................................................................................... 22 Figure 25. Corrected equality line for estimated air voids (rubber balloon method) vs air voids of
the cores using Corelok. ................................................................................................................ 22 Figure 26. Corrected equality line for estimated air voids (sand cone method) vs air voids of the
cores using Parafilm. ..................................................................................................................... 23
Figure 27. Corrected equality line for estimated air voids (sand cone method) vs air voids of the
cores using Corelok....................................................................................................................... 23 Figure 28. CIR construction on the Fernley CIR project. ............................................................ 26 Figure 29. In-place density on the Fernley CIR project: rubber balloon and sand cone. ............ 26

v
LIST OF TABLES
Table 1. Properties of Cores from the Red Rock CIR Project without Lime slurry. ..................... 4 Table 2. Properties of Cores from the Sandpiper CIR Project with Lime. .................................... 4 Table 3. Properties of the Laboratory Slabs for In-Place Density Measurements. ...................... 12 Table 4. Balloon and Sand Cone Test Results for Slab 1. ........................................................... 14 Table 5. Quartile and IQR Calculations of the Difference in Air Voids. ..................................... 18
Table 6. T-test Results on the Differences of the Air Voids for all the Combinations. ............... 24 Table 7. Verification of the In-Place Air Voids estimated by the Rubber Balloon Method from
the Fernley Project. ....................................................................................................................... 27 Table 8. Verification of the In-Place Air Voids estimated by the Sand Cone Method from the
Fernley Project. ............................................................................................................................. 27 Table 9. Air Voids from the Rubber Balloon, Sand Cone, and Field Cores from the Ely Project.
....................................................................................................................................................... 28

1
INTRODUCTION
Cold in-place recycling (CIR) is an on-site 100 percent pavement recycling process to a typical
treatment depth of 2 – 5 inch. An additive or combination of additives (asphalt emulsions,
rejuvenating agents, foamed asphalt, lime, fly ash, or cement) may be used. The CIR construction
process can be summarized by the following steps:
1. Milling and crushing of the existing pavement
2. Mixing and addition of a recycling agent
3. Lay down
4. In-place compaction
5. Placement of the wearing course
Figure 1 shows the CIR process using a train of equipment (tankers, trucks, milling machines,
crushing and screening units, and mixer). The water tanker supplies the optimum water content
to achieve the maximum density of the compacted CIR material. The optimum water content and
maximum density are determined in the laboratory through the modified proctor compaction
method as specified in AASHTO T180.
Figure 1. Cold in-place recycling train components.
The milling machine pulverizes the existing asphalt concrete (AC) layer to the specified depth of
the CIR process. The milled material is referred to as reclaimed asphalt pavement (RAP). It should
be noted that some water is added (i.e., 1.0 – 1.5% by weight of RAP) to cool the milling heads
which should be accounted for in the calculation of the amount of additional water needed to
achieve the optimum water content. The recycling unit crushes the RAP material to meet the
2
gradation specification of the project and mixes the RAP material with the asphalt emulsion. Some
projects apply full gradation specification while other projects may only apply a maximum size
specification. The emulsion tank is connected to the recycling unit and delivers the amount of
asphalt emulsion specified per the job mix formula (JMF). The final CIR mix is laid-down in a
windrow behind the recycling unit.
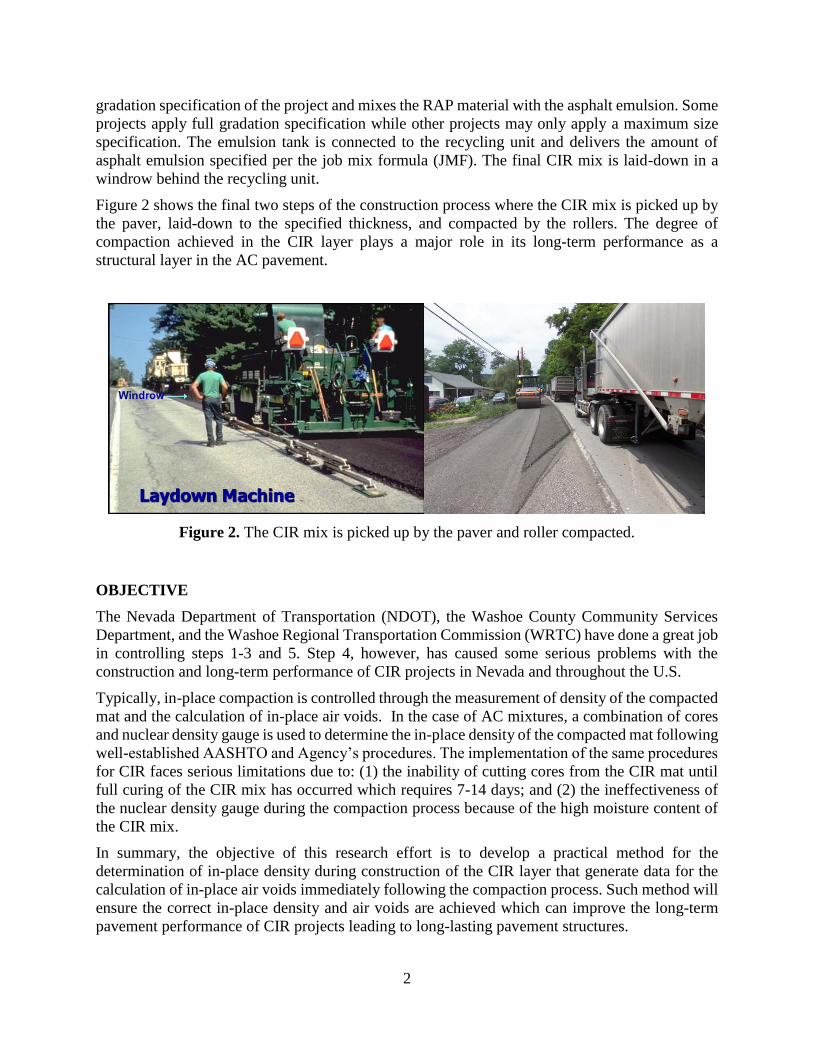
Figure 2 shows the final two steps of the construction process where the CIR mix is picked up by
the paver, laid-down to the specified thickness, and compacted by the rollers. The degree of
compaction achieved in the CIR layer plays a major role in its long-term performance as a
structural layer in the AC pavement.
Figure 2. The CIR mix is picked up by the paver and roller compacted.
OBJECTIVE
The Nevada Department of Transportation (NDOT), the Washoe County Community Services
Department, and the Washoe Regional Transportation Commission (WRTC) have done a great job
in controlling steps 1-3 and 5. Step 4, however, has caused some serious problems with the
construction and long-term performance of CIR projects in Nevada and throughout the U.S.
Typically, in-place compaction is controlled through the measurement of density of the compacted
mat and the calculation of in-place air voids. In the case of AC mixtures, a combination of cores
and nuclear density gauge is used to determine the in-place density of the compacted mat following
well-established AASHTO and Agency’s procedures. The implementation of the same procedures
for CIR faces serious limitations due to: (1) the inability of cutting cores from the CIR mat until
full curing of the CIR mix has occurred which requires 7-14 days; and (2) the ineffectiveness of
the nuclear density gauge during the compaction process because of the high moisture content of
the CIR mix.
In summary, the objective of this research effort is to develop a practical method for the
determination of in-place density during construction of the CIR layer that generate data for the
calculation of in-place air voids immediately following the compaction process. Such method will
ensure the correct in-place density and air voids are achieved which can improve the long-term
pavement performance of CIR projects leading to long-lasting pavement structures.
3
RESEARCH PROGRAM
In order to achieve the research objective, the following activities were completed during the
course of this study:
TASK 1: REVIEW OF CIR PROJECTS
This task reviewed CIR pavements on two Washoe County projects: Red Rock Road and
Sandpiper Drive. The research team carried the following steps to evaluate the two CIR Projects:
• Evaluated cores from the projects
• Obtained and analyzed the available performance data
• Visited the projects and conducted condition surveys
Evaluation of Cores
The current limitations in the measurements of in-place density of the CIR layer led to the
construction of CIR projects without the effective control of compaction. On the request of Washoe
County Community Services Department, the Pavement Engineering & Science (PES) Program at
the University of Nevada, Reno (UNR) assessed the in-place densities obtained on two CIR
projects: Red Rock Road and Sandpiper Drive. The CIR layer on Red Rock Road was constructed
in summer 2013 and the CIR layer on Sandpiper Drive was constructed in summer 2014. The cores
from both projects were sampled on October 21, 2014. The air voids of the cores were determined
following ASTM D1188 (with parafilm) and the resistance to moisture damage was determined
following AASHTO T283. Research activities on Nevada’s CIR mixtures over the past 20 years
have led to the following recommendations:
• CIR mixtures achieving unconditioned tensile strength (TS) property at 77oF above 50 psi
are expected to experience good field performance.
• The resistance of the CIR mixture to moisture damage is assessed through the tensile
strength ratio (TSR) defined as the ratio of moisture conditioned TS over the unconditioned
TS at 77oF. Typically, CIR mixtures achieving TSR values above 70% are expected to
provide good resistance to moisture damage.
• The addition of lime slurry has shown significant improvement in the unconditioned TS
and TSR properties of CIR mixtures used on several projects in Nevada.
The data on air voids and moisture damage are summarized in Table 1 for the Red Rock Road and
in Table 2 for the Sandpiper Drive. A close review of the data in Table 1 andTable 2 leads to the
following observations:
• Red Rock Road: the CIR mix was well compacted (air voids 12 – 15%) and achieved a
good level of unconditioned tensile strength, however, the lack of lime slurry significantly
reduced the conditioned tensile strength which may lead to severe moisture damage of the
pavement.
• Sandpiper Drive: the CIR mix was poorly compacted (air voids 22 – 25%) and did not
achieve good levels of unconditioned and conditioned tensile strengths which may lead to
severe moisture damage of the pavement.
The presented data clearly indicate that good in-place compaction to achieve in-place air voids in
the range of 12-15% is absolutely necessary to produce CIR mixtures that have good resistance to

4
moisture damage and the addition of lime slurry does not compensate for poor compaction. Hence,
there is a great need to develop a reliable method for determining the in-place density of the CIR
mixture during the compaction process.
Table 1. Properties of Cores from the Red Rock CIR Project without Lime slurry.
Location Property Field Cores
North
Bound
Core Number 8 4 6 10 5 7 9 11
Air Voids (%) 14.3 12.1 14.1 13.6 12.8 13.0 14.3 13.9
Un-conditioned Tensile Strength @77oF, psi 70 71 71 83
Average Un-conditioned Tensile Strength @77oF,
psi
74
Conditioned Tensile Strength @77oF, psi 37 44 31 35
Average Conditioned Tensile Strength @77oF, psi 37
Tensile Strength Ratio (TSR) @77oF, % 50
South
Bound
Core Number 21 23 25 26 19 20 22 24
Air Voids (%) 14.7 14.3 14.1 15.0 14.9 14.5 13.9 14.8
Un-conditioned Tensile Strength @77oF, psi 53 60 62 64
Average Un-conditioned Tensile Strength @77oF,
psi
60
Conditioned Tensile Strength @77oF, psi 11 12 21 12
Average Conditioned Tensile Strength @77oF, psi 14
Tensile Strength Ratio (TSR) @77oF, % 23
Table 2. Properties of Cores from the Sandpiper CIR Project with Lime.
Location Property Field Cores
North
Bound
Core Number 1 3 2 4 5
Air Voids (%) 22.8 22.2 22.5 22.7 23.6
Un-conditioned Tensile Strength @77oF,
psi
41 42
Average Un-conditioned Tensile
Strength @77oF, psi
42
Conditioned Tensile Strength @77oF, psi 33 34 30
Average Conditioned Tensile Strength
@77oF, psi
32
Tensile Strength Ratio (TSR) @77oF, % 76
South
Bound
Core Number 17 19 23 24 25 16 18 20 22 26
Air Voids (%) 25.0 25.0 24.1 24.9 25.2 22.3 25.0 26.0 24.3 25.0
Un-conditioned Tensile Strength @77oF,
psi
32 31 32 31 28
Average Un-conditioned Tensile
Strength @77oF, psi
31
Conditioned Tensile Strength @77oF, psi 24 22 22 26 22
Average Conditioned Tensile Strength
@77oF, psi
23
Tensile Strength Ratio (TSR) @77oF, % 74
Performance Evaluations
This effort evaluated the field performance of the two CIR projects. Prior to examining the field
performance of the projects, the unique characteristics of each project must be examined and their
contributions toward the field performance should be carefully examined and well recognized:
• Red Rock Road:
o This facility is an Arterial: ADT ≥ 10,000
5
o The CIR layer was constructed in 2013 with a 2-inch AC overlay
o The pavement received a microsurfacing in 2016
o The in-place air voids of the CIR layer were: 14 -15%
o The CIR mix had the following characteristics:
▪ No lime slurry
▪ High unconditioned TS due to the low in-place air voids
▪ Low conditioned TS due to the lack of lime slurry
• Sandpiper Drive:
o This facility is a Collector: ADT < 10,000
o The CIR layer was constructed in 2014 with a Cape Seal
o The pavement did not receive any maintenance treatment since construction
o The in-place air voids of the CIR layer were: 24 -26%
o The CIR mix had the following characteristics:
▪ Lime slurry
▪ Low unconditioned TS due to the high in-place air voids
▪ Low conditioned TS due to the high in-place air voids
The historical condition surveys of the two projects indicated the following:
• Red Rock Road:
o PCI in 2013 after CIR and AC overlay: 100
o PCI in 2015: 99
o PCI in 2016 after microsurfacing: 100
o PCI in 2017: 95
• Sandpiper Drive:
o PCI in 2014 after CIR and Cape Seal: 100
o PCI in 2015: 99
The research team conducted condition surveys on both project during December 2017. Figure 3
and Figure 4 show the surface conditions of the Red Rock and Sandpiper projects, respectively.
Based on the December 2017 condition surveys conducted by the research team, the following
observation can be made.
• Red Rock Road:
o The pavement received a 2-inch AC overlay over the CIR layer due to its
classification as Arterial.

6
Figure 3. Surface of Red Rock Road in December 2017.
Figure 4. Surface of Sandpiper Drive in December 2017.
o The exact reason for the application of the microsurfacing in 2016 could not be
established due to the lack of performance data between 2013 and 2016, however,
two justifications can be speculated: a) due to some deterioration of the pavement
surface or b) as part of a pavement preservation program
o The 2017 pavement surface condition shows medium severity raveling of the
microsurfacing
o In light of the above observations, it can be concluded that the 2-inch AC overlay
provided excellent protection to the CIR layer which prevented the occurrence of

7
structural failures due to the CIR mixture’s low resistance to moisture damage as
depicted by the low conditioned TS property
• Sandpiper Drive:
o The pavement received a cape seal over the CIR layer to its classification as a
Collector.
o The 2017 pavement surface condition shows medium severity transverse cracking
and non-wheelpath medium severity longitudinal cracking
o In light of the above observations, the following conclusions can be made:
▪ The cape seal did not provide sufficient protection to the CIR layer from
thermal stresses which resulted in the formation of transverse cracks due
to the high in-place air voids which led to the low TS properties of the CIR
layer
▪ The formation of the non-wheelpath longitudinal cracks was caused by the
inability of the cape seal to resistance the reflection of the construction
joints from the CIR layer
In summary, the evaluations of the two CIR projects on Red Rock Road and Sandpiper Drive
further emphasized the need for the development of an effective mix design for the CIR layer and
achieving good field compaction in terms of in-place air voids less than 14%.
TASK 2: LABORATORY EXPERIMENT
This task conducted an extensive laboratory experiment to develop a reliable and practical test
method to determine the in-place density of CIR mixtures during the field compaction process.
The laboratory experimental program evaluated three methods: sand cone (ASTM D1556), rubber
balloon (ASTM D2167), and field permeability by completing the following steps:
• Obtain field samples of recycled asphalt pavement (RAP) and prepare CIR mixtures.
• Compact slabs of CIR mixtures in the laboratory.
• Measure the density of the compacted CIR slabs using the sand cone and rubber balloon
methods.
• Measure the permeability of the compacted CIR slabs using the NCAT method.
• Fully cure the compacted CIR slabs and repeat the density and permeability
measurements.
• Cut cores from the cured compacted CIR slabs and measure the density.
• Calculate the in-place air voids estimated by the three methods and measured on the
cores.
8
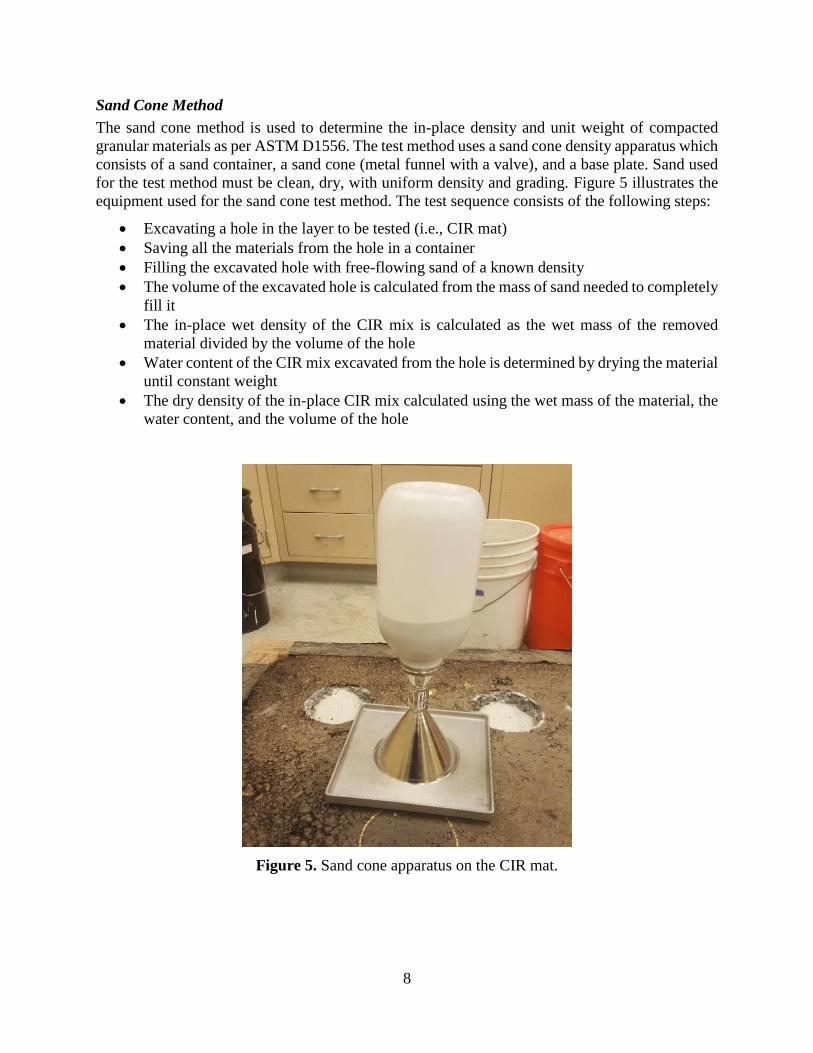
Sand Cone Method
The sand cone method is used to determine the in-place density and unit weight of compacted
granular materials as per ASTM D1556. The test method uses a sand cone density apparatus which
consists of a sand container, a sand cone (metal funnel with a valve), and a base plate. Sand used
for the test method must be clean, dry, with uniform density and grading. Figure 5 illustrates the
equipment used for the sand cone test method. The test sequence consists of the following steps:
• Excavating a hole in the layer to be tested (i.e., CIR mat)
• Saving all the materials from the hole in a container
• Filling the excavated hole with free-flowing sand of a known density
• The volume of the excavated hole is calculated from the mass of sand needed to completely
fill it
• The in-place wet density of the CIR mix is calculated as the wet mass of the removed
material divided by the volume of the hole
• Water content of the CIR mix excavated from the hole is determined by drying the material
until constant weight
• The dry density of the in-place CIR mix calculated using the wet mass of the material, the
water content, and the volume of the hole
Figure 5. Sand cone apparatus on the CIR mat.

9
Rubber Balloon Method
The rubber balloon method is used to determine the in-place density and unit weight of compacted
or firmly bonded granular material as per ASTM D2167. The test method uses a rubber balloon
density apparatus which consists of a calibrated vessel containing water within a thin, flexible,
elastic membrane (rubber balloon), designed for measuring the volume of the hole and a base plate.
Figure 6 illustrates the equipment used for the rubber balloon test method. The test method consists
of the following steps:
• Before excavating the hole, the operational pressure (determined during the calibration of
the equipment) must be applied to the test location (i.e., should be reasonably plane and
level) to measure the initial volume reading
• Excavating a hole in the layer to be tested (i.e., CIR mat)
• Saving all the materials from the hole in a container
• The apparatus is placed on the excavated hole and the operational pressure is applied to
completely fill the hole with the balloon
• Measuring the final volume reading
• The total volume of the hole is the difference between the final and the initial volume
readings
• The in-place wet density is calculated as the wet mass of the removed material divided by
the volume of the hole
• Water content of the CIR mix excavated from the hole is determined by drying the material
until constant weight
• The dry density of the in-place CIR mix is calculated using the wet mass of the material,
the water content, and the volume of the hole
Figure 6. Rubber balloon apparatus on the CIR mat.
10
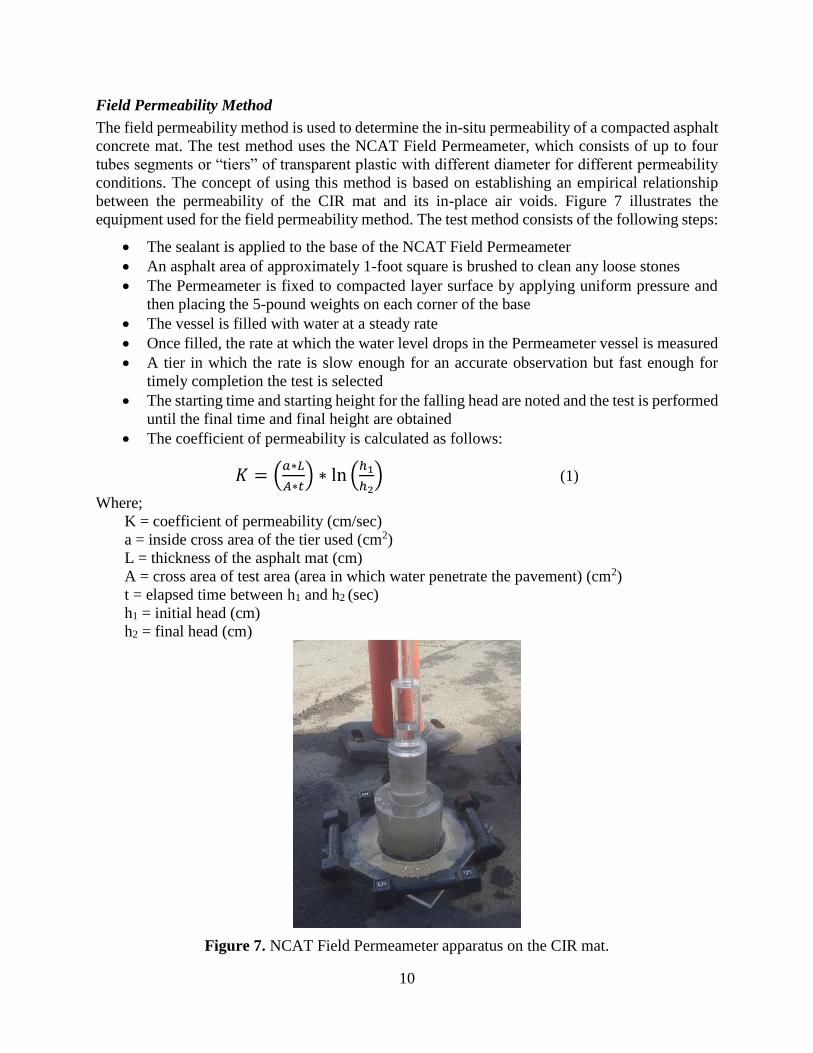
Field Permeability Method
The field permeability method is used to determine the in-situ permeability of a compacted asphalt
concrete mat. The test method uses the NCAT Field Permeameter, which consists of up to four
tubes segments or “tiers” of transparent plastic with different diameter for different permeability
conditions. The concept of using this method is based on establishing an empirical relationship
between the permeability of the CIR mat and its in-place air voids. Figure 7 illustrates the
equipment used for the field permeability method. The test method consists of the following steps:
• The sealant is applied to the base of the NCAT Field Permeameter
• An asphalt area of approximately 1-foot square is brushed to clean any loose stones
• The Permeameter is fixed to compacted layer surface by applying uniform pressure and
then placing the 5-pound weights on each corner of the base
• The vessel is filled with water at a steady rate
• Once filled, the rate at which the water level drops in the Permeameter vessel is measured
• A tier in which the rate is slow enough for an accurate observation but fast enough for
timely completion the test is selected
• The starting time and starting height for the falling head are noted and the test is performed
until the final time and final height are obtained
• The coefficient of permeability is calculated as follows:
𝐾 = (𝑎∗𝐿
𝐴∗𝑡) ∗ ln (
ℎ1
ℎ2) (1)
Where;
K = coefficient of permeability (cm/sec)
a = inside cross area of the tier used (cm2)
L = thickness of the asphalt mat (cm)
A = cross area of test area (area in which water penetrate the pavement) (cm2)
t = elapsed time between h1 and h2 (sec)
h1 = initial head (cm)
h2 = final head (cm)
Figure 7. NCAT Field Permeameter apparatus on the CIR mat.
11
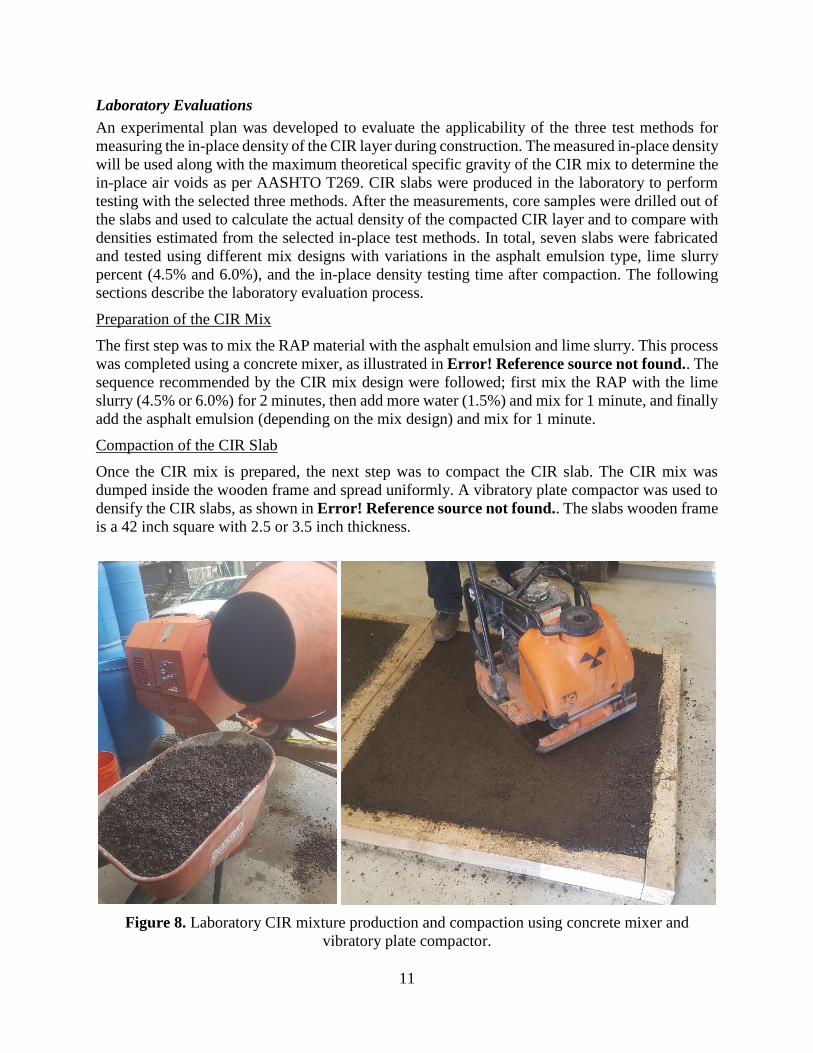
Laboratory Evaluations
An experimental plan was developed to evaluate the applicability of the three test methods for
measuring the in-place density of the CIR layer during construction. The measured in-place density
will be used along with the maximum theoretical specific gravity of the CIR mix to determine the
in-place air voids as per AASHTO T269. CIR slabs were produced in the laboratory to perform
testing with the selected three methods. After the measurements, core samples were drilled out of
the slabs and used to calculate the actual density of the compacted CIR layer and to compare with
densities estimated from the selected in-place test methods. In total, seven slabs were fabricated
and tested using different mix designs with variations in the asphalt emulsion type, lime slurry
percent (4.5% and 6.0%), and the in-place density testing time after compaction. The following
sections describe the laboratory evaluation process.
Preparation of the CIR Mix
The first step was to mix the RAP material with the asphalt emulsion and lime slurry. This process
was completed using a concrete mixer, as illustrated in Error! Reference source not found.. The
sequence recommended by the CIR mix design were followed; first mix the RAP with the lime
slurry (4.5% or 6.0%) for 2 minutes, then add more water (1.5%) and mix for 1 minute, and finally
add the asphalt emulsion (depending on the mix design) and mix for 1 minute.
Compaction of the CIR Slab
Once the CIR mix is prepared, the next step was to compact the CIR slab. The CIR mix was
dumped inside the wooden frame and spread uniformly. A vibratory plate compactor was used to
densify the CIR slabs, as shown in Error! Reference source not found.. The slabs wooden frame
is a 42 inch square with 2.5 or 3.5 inch thickness.
Figure 8. Laboratory CIR mixture production and compaction using concrete mixer and
vibratory plate compactor.
12
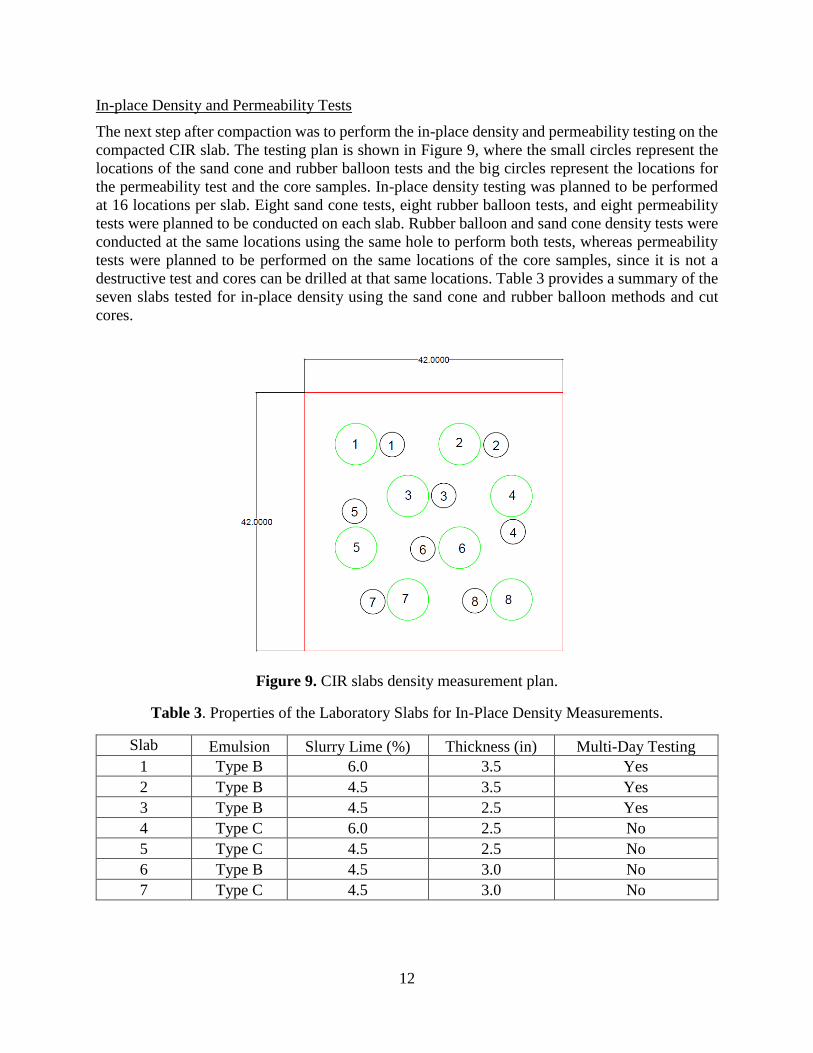
In-place Density and Permeability Tests
The next step after compaction was to perform the in-place density and permeability testing on the
compacted CIR slab. The testing plan is shown in Figure 9, where the small circles represent the
locations of the sand cone and rubber balloon tests and the big circles represent the locations for
the permeability test and the core samples. In-place density testing was planned to be performed
at 16 locations per slab. Eight sand cone tests, eight rubber balloon tests, and eight permeability
tests were planned to be conducted on each slab. Rubber balloon and sand cone density tests were
conducted at the same locations using the same hole to perform both tests, whereas permeability
tests were planned to be performed on the same locations of the core samples, since it is not a
destructive test and cores can be drilled at that same locations. Table 3 provides a summary of the
seven slabs tested for in-place density using the sand cone and rubber balloon methods and cut
cores.
Figure 9. CIR slabs density measurement plan.
Table 3. Properties of the Laboratory Slabs for In-Place Density Measurements.
Slab Emulsion Slurry Lime (%) Thickness (in) Multi-Day Testing
1 Type B 6.0 3.5 Yes
2 Type B 4.5 3.5 Yes
3 Type B 4.5 2.5 Yes
4 Type C 6.0 2.5 No
5 Type C 4.5 2.5 No
6 Type B 4.5 3.0 No
7 Type C 4.5 3.0 No

13
The permeability test was difficult to perform on the CIR slabs using the NCAT Field Permeameter
due to water leaks on the base of the equipment. As a first attempt, the test was conducted following
the user manual of the equipment with the recommended weight (20 lb) to prevent water leaking,
as shown in the left photo of Error! Reference source not found.. Since this attempt was not
successful, the test was repeated using a higher weight (120 lb) which led to the same issue as
shown in the right photo of Error! Reference source not found..
Also, as shown in Figure 11, some of the fines were washed from the CIR mix by the water while
performing the permeability test. Since it was planned to drill the core samples at that same
locations as the permeability tests, the core density results would have been affected. It was
decided to abandon the permeability test for determining the in-place density of the compacted
CIR layer.
Figure 10. Water leaks during the permeability test.
Figure 11. Washed fines after performing the permeability test.

14
The in-place density testing of the first three slabs was performed on multiple days following
compaction. The balloon and sand cone measurements started on compaction day and finished on
the 14th day after compaction. The days the tests were performed on the first three slabs were; 0,
1st, 2nd, 3rd, 6th, 9th, 12th and 14th after compaction. Table 4 presents an example of the in-place
density test results for slab 1.
Table 4. Balloon and Sand Cone Test Results for Slab 1.
Balloon Day
Avg. Std. Dev. CV
(%) 0 1 2 3 6 9 12 14
Wet Density (g/cm3) 1.935 1.995 1.946 2.015 1.920 2.000 1.985 1.911 1.963 0.040 2.0
Dry Density (g/cm3) 1.827 1.913 1.867 1.934 1.874 1.951 1.948 1.873 1.898 0.045 2.4
Air Voids (%) 22.0 18.3 20.3 17.4 20.0 16.7 16.8 20.0 18.9 0.019 10.1
Wc (%) 5.95 4.26 4.25 4.20 2.49 2.52 1.90 2.00
Sand Cone Day
Avg. Std. Dev. CV
(%) 0 1 2 3 6 9 12 14
Wet Density (g/cm3) 2.033 1.902 1.931 2.042 1.979 1.982 1.973 1.951 1.974 0.047 2.4
Dry Density (g/cm3) 1.921 1.818 1.850 1.959 1.927 1.933 1.933 1.912 1.907 0.048 2.5
Air Voids (%) 17.9 22.3 21.0 16.3 17.7 17.4 17.4 18.3 18.5 0.020 11.0
Wc (%) 5.81 4.59 4.39 4.23 2.68 2.50 2.10 2.01
The data on slab 1 summarized in Table 4 showed no significant difference in performing the in-
place density tests at multiple days after compaction. Since the focus of this research was to
determine the in-place density for a CIR field project after compaction, it was decided to perform
all the in-place density testing one hour after compaction is completed.
It is important to note the practical limitations for each of the in-place density tests. For the sand
cone test method, the standard (ASTM D1556) states that for a mixture with maximum particle
size of 1 inch the minimum test hole size is 130 in3. With a base plate diameter of 6 inch and the
depths of the CIR layer between 2.5 and 3.5 inch, the volume of the hole varied approximately
between 70 in3 and 98 in3 which is lower than the minimum requirement.
The same limitation was encountered with the rubber balloon test method, in which the standard
(ASTM D2167) states that for a mixture with maximum particle size of 1 inch the minimum test
hole size is 130 in3. With a base plate diameter of 4 inch and the depths of the CIR layer between
2.5 and 3.5 inch, the volume of the hole varied approximately between 31 in3 and 43 in3 which is
lower than the minimum requirement.
To increase the volume of the excavated hole as much as possible, to be closer to the specification
limits, it was decided to compact the first two slabs to a thickness of 3.5 inch. However, the thicker
slabs and larger excavated hole did not improve the results while still below the minimum
requirement. Finally, since it was not possible to achieve the required minimum volume on a
realistic CIR mat thickness, it was decided to perform the testing with this limitation.
Coring of the Laboratory CIR Slabs
The last step was to cut cores from the compacted CIR slabs and determine their densities in the
laboratory. Cores were obtained after the CIR mixture was fully cured; 14 days after compaction.

15
The cores were drilled right next to each excavated hole where the in-place density tests were
performed, as shown in Figure 12. It was assumed that, since the core location was very close to
the in-place density test location, the density at both locations would be the same.
Figure 12. Coring of the CIR slabs.
Due to the anticipated high air voids contents of the cores, two test methods were performed to
obtain their bulk specific gravity: Parafilm method (ASTM D1188) and Corelok method (ASTM
D6752) as shown in Figure 13. Figure 14 compares the air voids contents of the cores measured
following the two standards.
Figure 13. Test methods for bulk specific gravity of cores: left – Parafilm, right – Corelok.

16
Figure 14. Relationship between air voids of cores from Parafilm and Corelok methods.
The trends in the measured data are very similar to the results reported by Zhang et al. in 2014
(Determining volumetric properties and permeability of asphalt-treated permeable base mixtures)
as shown in Figure 15. In general terms, the air voids content obtained from the parafilm method
are about one percent higher than the air voids content obtained from the Corelok method. This
difference might be due to a more realistic volume representation by the vacuum sealing of the
Corelok method, which eliminates some of the air pockets that can be produced in the wrapping
process of the Parafilm method. Without the artificial air pockets, the samples would have a
smaller volume, which would lead to lower air voids content.
Figure 15. Relationship between air voids from parafilm and Corelok methods (Zhang et al,
2014) (VTM: Voids in Total Mix).
y = 0.9583x - 0.3186R² = 0.9117
10
15
20
25
30
10 15 20 25 30
Air
Vo
ids
by
Co
relo
k M
eth
od
(%
)
Air Voids by Parafilm Method (%)
Parafilm Method versus Corelok Method
CIR Slab Cores Equality Line Linear (CIR Slab Cores)

17
Analysis of In-place Density Test Results
The air voids contents of the cores using the two bulk specific gravity test methods were compared
with the estimated air voids contents obtained from the two in-place test methods conducted on
the CIR slabs. In-place air voids contents obtained from the sand cone and rubber balloon methods
were compared with the air voids contents of the cores cut from the close-by location. As an
example, Figure 16 compares the air voids contents obtained from rubber balloon and sand cone
methods to the air voids contents of the cores using the parafilm method for Slab 1. Appendix A
includes the results for all the slabs, using Parafilm and Corelok methods for obtaining the bulk
specific gravity of the cores.
Figure 16. Comparison of in-place air voids and cores air voids using Parafilm for Slab-1.
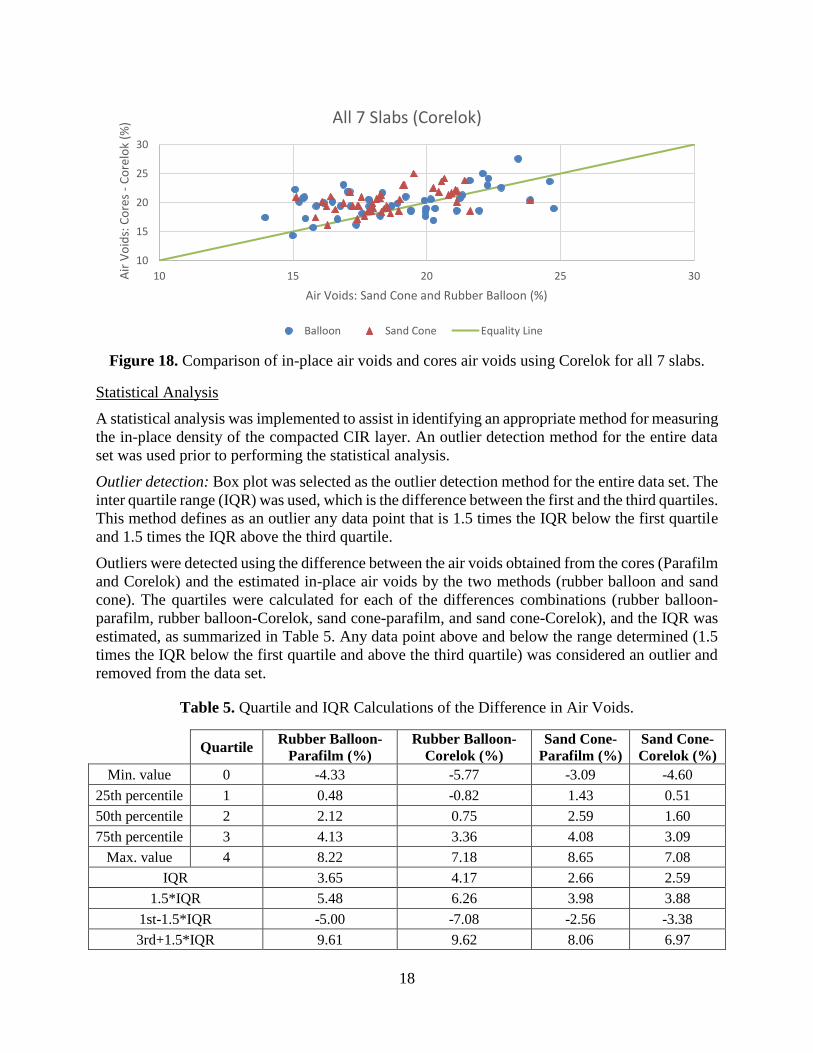
Figure 17 and Figure 18 show the overall summary of the data obtained from the seven slabs for
the Parafilm and Corelok methods, respectively. It can be observed that the Corelok method
produced air voids closer to the in-place methods than the Parafilm method for the possible reason
discussed earlier. It is interesting to note that the majority of the data are above the equality line,
which shows that in most of the cases the air voids content estimated by the in-place test methods
is lower than the true air voids content obtained from the cores.
Figure 17. Comparison of in-place air voids and cores air voids using Parafilm for all 7 slabs.
10
15
20
25
30
10 15 20 25 30
Air
Vo
ids:
Co
res
-p
araf
ilm (
%)
Air Voids: Sand Cone and Rubber Balloon (%)
Slab 1 [Parafilm]
Balloon Sand Cone Equality Line
10
15
20
25
30
10 15 20 25 30
Air
Vo
ids:
Co
res
-p
araf
ilm (
%)
Air Voids: Sand Cone and Rubber Balloon (%)
All 7 Slabs (Parafilm)
Balloon Sand Cone Equality Line
18
Figure 18. Comparison of in-place air voids and cores air voids using Corelok for all 7 slabs.
Statistical Analysis
A statistical analysis was implemented to assist in identifying an appropriate method for measuring
the in-place density of the compacted CIR layer. An outlier detection method for the entire data
set was used prior to performing the statistical analysis.
Outlier detection: Box plot was selected as the outlier detection method for the entire data set. The
inter quartile range (IQR) was used, which is the difference between the first and the third quartiles.
This method defines as an outlier any data point that is 1.5 times the IQR below the first quartile
and 1.5 times the IQR above the third quartile.
Outliers were detected using the difference between the air voids obtained from the cores (Parafilm
and Corelok) and the estimated in-place air voids by the two methods (rubber balloon and sand
cone). The quartiles were calculated for each of the differences combinations (rubber balloon-
parafilm, rubber balloon-Corelok, sand cone-parafilm, and sand cone-Corelok), and the IQR was
estimated, as summarized in Table 5. Any data point above and below the range determined (1.5
times the IQR below the first quartile and above the third quartile) was considered an outlier and
removed from the data set.
Table 5. Quartile and IQR Calculations of the Difference in Air Voids.
Quartile Rubber Balloon-
Parafilm (%)
Rubber Balloon-
Corelok (%)
Sand Cone-
Parafilm (%)
Sand Cone-
Corelok (%)
Min. value 0 -4.33 -5.77 -3.09 -4.60
25th percentile 1 0.48 -0.82 1.43 0.51
50th percentile 2 2.12 0.75 2.59 1.60
75th percentile 3 4.13 3.36 4.08 3.09
Max. value 4 8.22 7.18 8.65 7.08
IQR 3.65 4.17 2.66 2.59
1.5*IQR 5.48 6.26 3.98 3.88
1st-1.5*IQR -5.00 -7.08 -2.56 -3.38
3rd+1.5*IQR 9.61 9.62 8.06 6.97
10
15
20
25
30
10 15 20 25 30Air
Vo
ids:
Co
res
-C
ore
lok
(%)
Air Voids: Sand Cone and Rubber Balloon (%)
All 7 Slabs (Corelok)
Balloon Sand Cone Equality Line
19
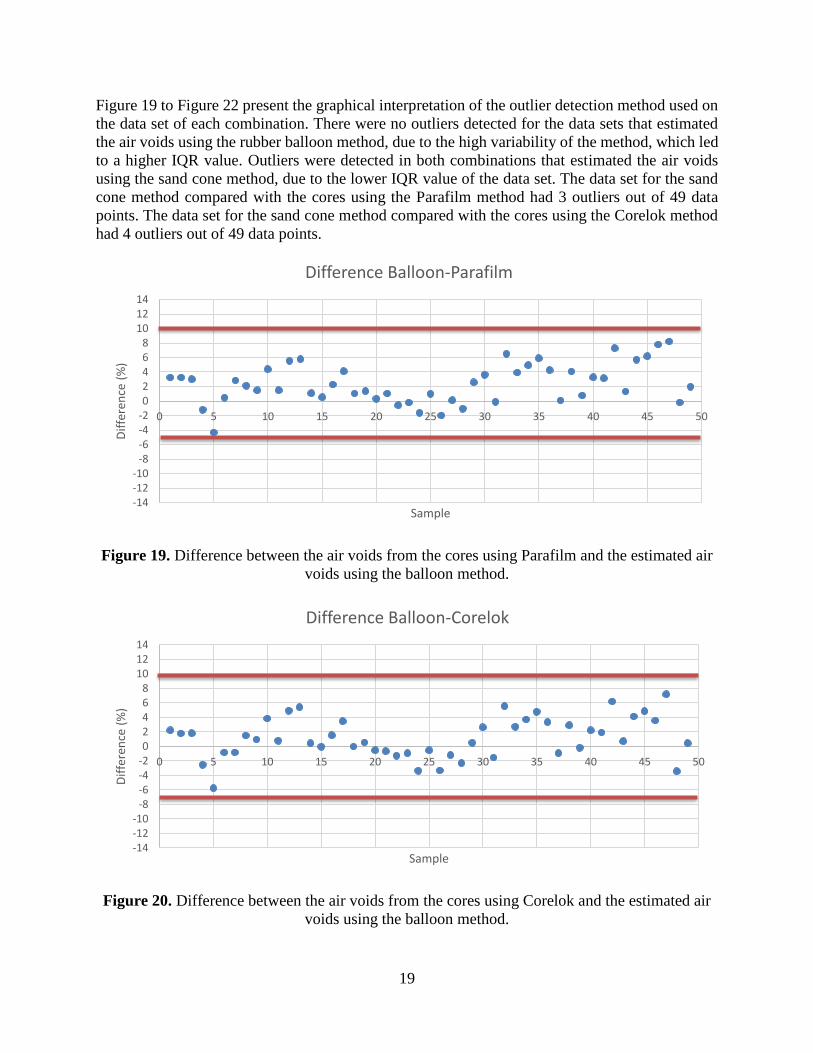
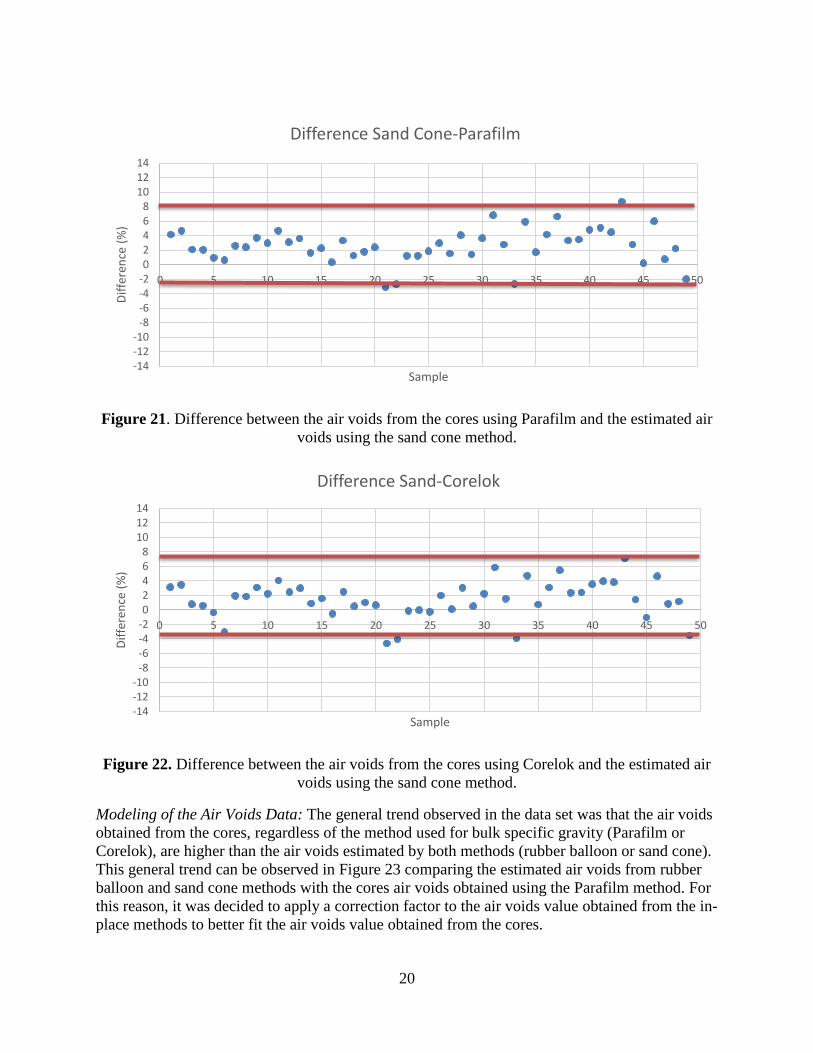
Figure 19 to Figure 22 present the graphical interpretation of the outlier detection method used on
the data set of each combination. There were no outliers detected for the data sets that estimated
the air voids using the rubber balloon method, due to the high variability of the method, which led
to a higher IQR value. Outliers were detected in both combinations that estimated the air voids
using the sand cone method, due to the lower IQR value of the data set. The data set for the sand
cone method compared with the cores using the Parafilm method had 3 outliers out of 49 data
points. The data set for the sand cone method compared with the cores using the Corelok method
had 4 outliers out of 49 data points.
Figure 19. Difference between the air voids from the cores using Parafilm and the estimated air
voids using the balloon method.
Figure 20. Difference between the air voids from the cores using Corelok and the estimated air
voids using the balloon method.
-14-12-10
-8-6-4-202468
101214
0 5 10 15 20 25 30 35 40 45 50
Dif
fere
nce
(%
)
Sample
Difference Balloon-Parafilm
-14-12-10
-8-6-4-202468
101214
0 5 10 15 20 25 30 35 40 45 50
Dif
fere
nce
(%
)
Sample
Difference Balloon-Corelok
20
Figure 21. Difference between the air voids from the cores using Parafilm and the estimated air
voids using the sand cone method.
Figure 22. Difference between the air voids from the cores using Corelok and the estimated air
voids using the sand cone method.
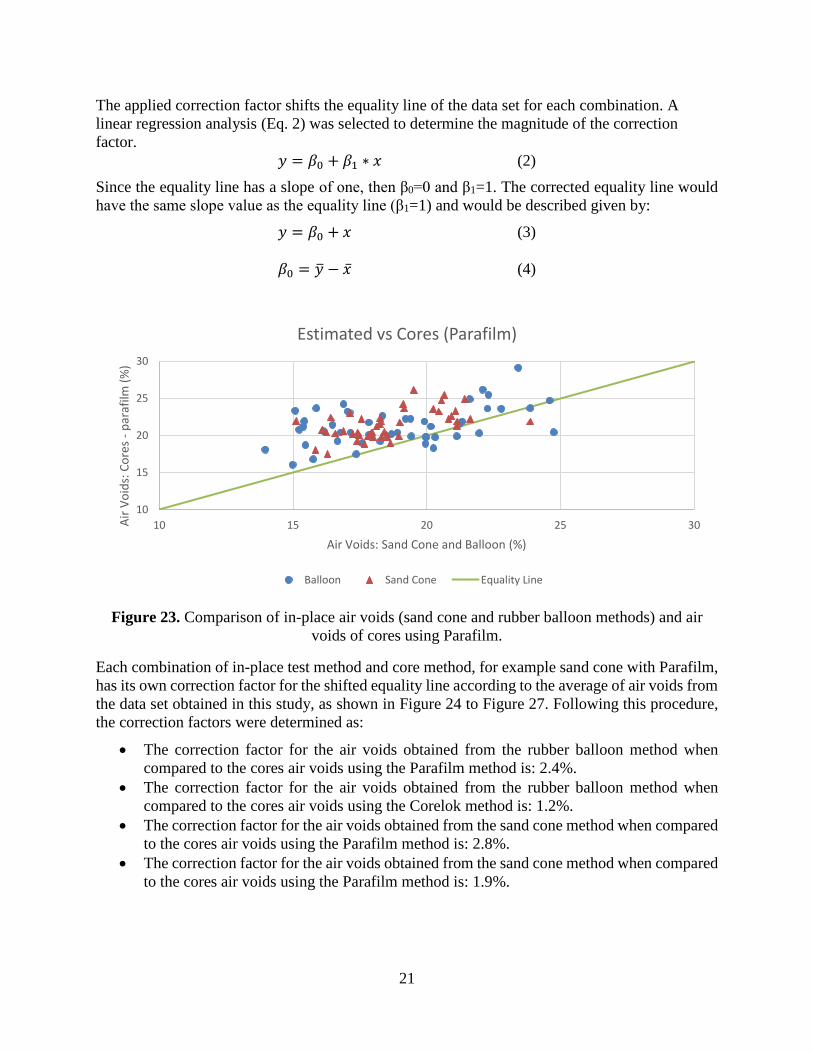
Modeling of the Air Voids Data: The general trend observed in the data set was that the air voids
obtained from the cores, regardless of the method used for bulk specific gravity (Parafilm or
Corelok), are higher than the air voids estimated by both methods (rubber balloon or sand cone).
This general trend can be observed in Figure 23 comparing the estimated air voids from rubber
balloon and sand cone methods with the cores air voids obtained using the Parafilm method. For
this reason, it was decided to apply a correction factor to the air voids value obtained from the in-
place methods to better fit the air voids value obtained from the cores.
-14-12-10
-8-6-4-202468
101214
0 5 10 15 20 25 30 35 40 45 50
Dif
fere
nce
(%
)
Sample
Difference Sand Cone-Parafilm
-14-12-10
-8-6-4-202468
101214
0 5 10 15 20 25 30 35 40 45 50
Dif
fere
nce
(%
)
Sample
Difference Sand-Corelok
21
The applied correction factor shifts the equality line of the data set for each combination. A
linear regression analysis (Eq. 2) was selected to determine the magnitude of the correction
factor.
𝑦 = 𝛽0 + 𝛽1 ∗ 𝑥 (2)
Since the equality line has a slope of one, then β0=0 and β1=1. The corrected equality line would
have the same slope value as the equality line (β1=1) and would be described given by:
𝑦 = 𝛽0 + 𝑥 (3)
𝛽0 = �̅� − �̅� (4)
Figure 23. Comparison of in-place air voids (sand cone and rubber balloon methods) and air
voids of cores using Parafilm.
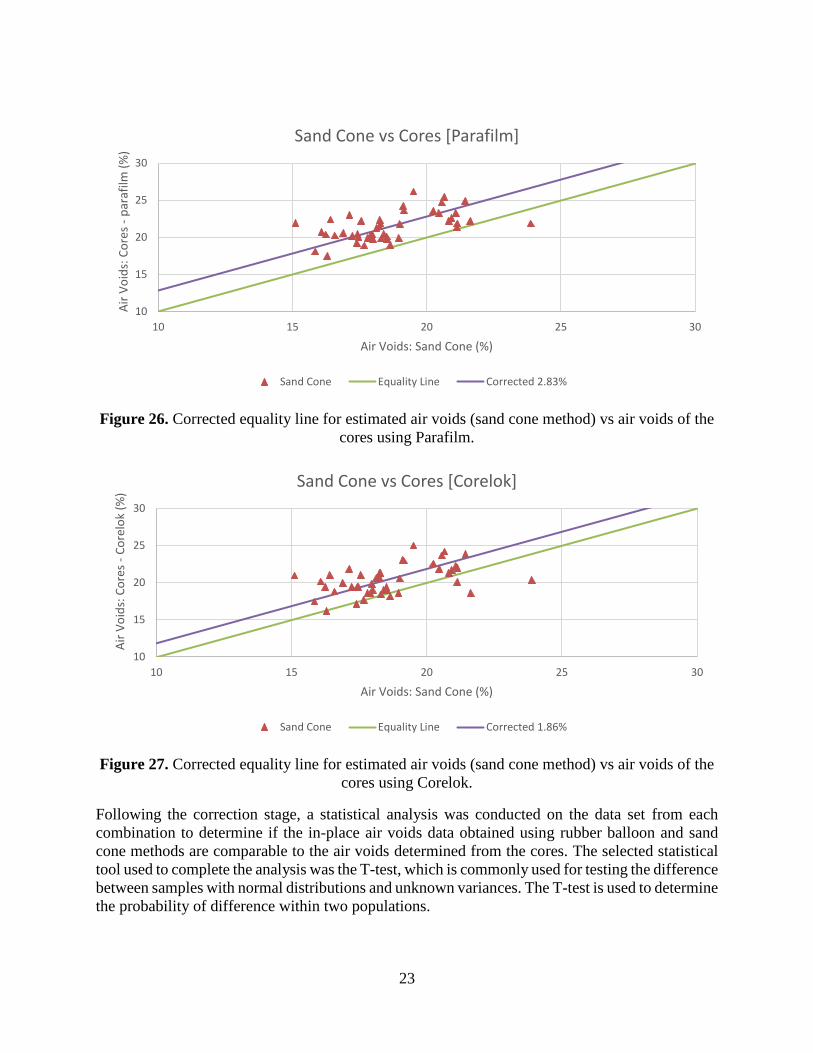
Each combination of in-place test method and core method, for example sand cone with Parafilm,
has its own correction factor for the shifted equality line according to the average of air voids from
the data set obtained in this study, as shown in Figure 24 to Figure 27. Following this procedure,
the correction factors were determined as:
• The correction factor for the air voids obtained from the rubber balloon method when
compared to the cores air voids using the Parafilm method is: 2.4%.
• The correction factor for the air voids obtained from the rubber balloon method when
compared to the cores air voids using the Corelok method is: 1.2%.
• The correction factor for the air voids obtained from the sand cone method when compared
to the cores air voids using the Parafilm method is: 2.8%.
• The correction factor for the air voids obtained from the sand cone method when compared
to the cores air voids using the Parafilm method is: 1.9%.
10
15
20
25
30
10 15 20 25 30Air
Vo
ids:
Co
res
-p
araf
ilm (
%)
Air Voids: Sand Cone and Balloon (%)
Estimated vs Cores (Parafilm)
Balloon Sand Cone Equality Line

22
Figure 24. Corrected equality line for in-place air voids (rubber balloon method) vs air voids of
the cores using Parafilm.
Figure 25. Corrected equality line for estimated air voids (rubber balloon method) vs air voids of
the cores using Corelok.
10
15
20
25
30
10 15 20 25 30
Air
Vo
ids:
Co
res
-p
araf
ilm (
%)
Air Voids: Balloon (%)
Balloon vs Cores [Parafilm]
Balloon Corrected 2.38% Equality Line
10
15
20
25
30
10 15 20 25 30
Air
Vo
ids:
Co
res
-C
ore
lok
(%)
Air Voids: Balloon (%)
Balloon vs Cores [Corelok]
Balloon Corrected 1.15% Equality Line
23
Figure 26. Corrected equality line for estimated air voids (sand cone method) vs air voids of the
cores using Parafilm.
Figure 27. Corrected equality line for estimated air voids (sand cone method) vs air voids of the
cores using Corelok.
Following the correction stage, a statistical analysis was conducted on the data set from each
combination to determine if the in-place air voids data obtained using rubber balloon and sand
cone methods are comparable to the air voids determined from the cores. The selected statistical
tool used to complete the analysis was the T-test, which is commonly used for testing the difference
between samples with normal distributions and unknown variances. The T-test is used to determine
the probability of difference within two populations.
10
15
20
25
30
10 15 20 25 30
Air
Vo
ids:
Co
res
-p
araf
ilm (
%)
Air Voids: Sand Cone (%)
Sand Cone vs Cores [Parafilm]
Sand Cone Equality Line Corrected 2.83%
10
15
20
25
30
10 15 20 25 30
Air
Vo
ids:
Co
res
-C
ore
lok
(%)
Air Voids: Sand Cone (%)
Sand Cone vs Cores [Corelok]
Sand Cone Equality Line Corrected 1.86%
24
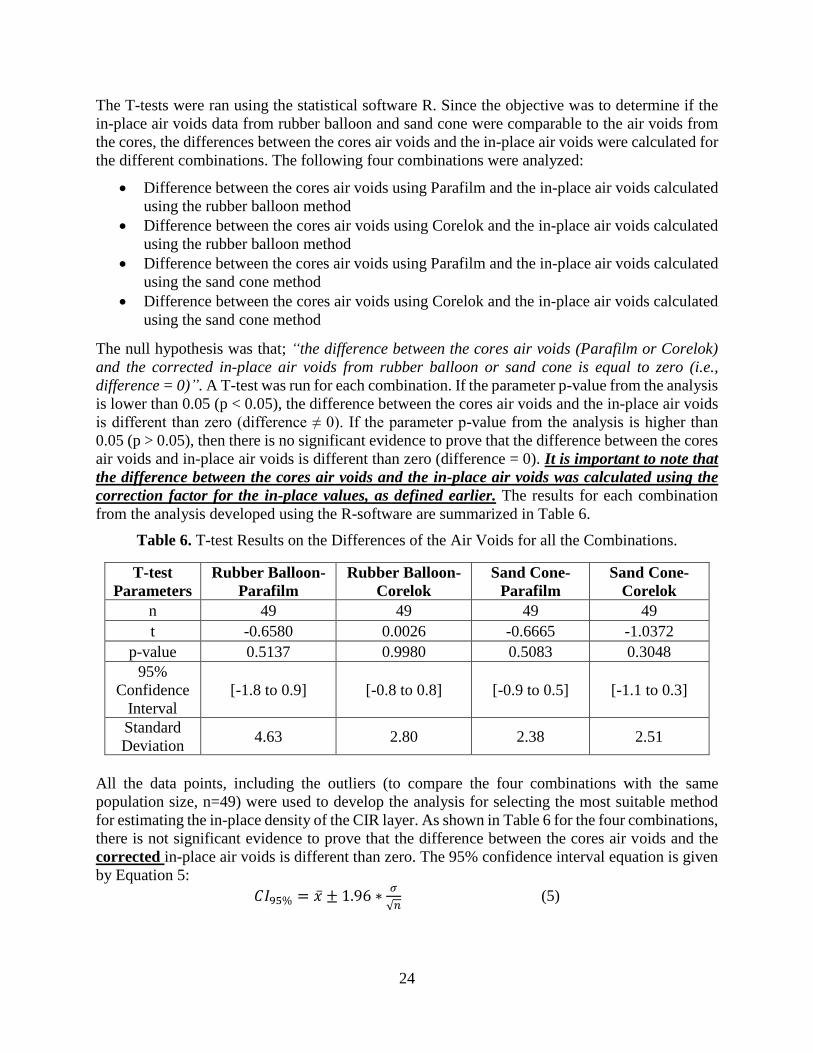
The T-tests were ran using the statistical software R. Since the objective was to determine if the
in-place air voids data from rubber balloon and sand cone were comparable to the air voids from
the cores, the differences between the cores air voids and the in-place air voids were calculated for
the different combinations. The following four combinations were analyzed:
• Difference between the cores air voids using Parafilm and the in-place air voids calculated
using the rubber balloon method
• Difference between the cores air voids using Corelok and the in-place air voids calculated
using the rubber balloon method
• Difference between the cores air voids using Parafilm and the in-place air voids calculated
using the sand cone method
• Difference between the cores air voids using Corelok and the in-place air voids calculated
using the sand cone method
The null hypothesis was that; “the difference between the cores air voids (Parafilm or Corelok)
and the corrected in-place air voids from rubber balloon or sand cone is equal to zero (i.e.,
difference = 0)”. A T-test was run for each combination. If the parameter p-value from the analysis
is lower than 0.05 (p < 0.05), the difference between the cores air voids and the in-place air voids
is different than zero (difference ≠ 0). If the parameter p-value from the analysis is higher than
0.05 (p > 0.05), then there is no significant evidence to prove that the difference between the cores
air voids and in-place air voids is different than zero (difference = 0). It is important to note that
the difference between the cores air voids and the in-place air voids was calculated using the
correction factor for the in-place values, as defined earlier. The results for each combination
from the analysis developed using the R-software are summarized in Table 6.
Table 6. T-test Results on the Differences of the Air Voids for all the Combinations.
T-test
Parameters
Rubber Balloon-
Parafilm
Rubber Balloon-
Corelok
Sand Cone-
Parafilm
Sand Cone-
Corelok
n 49 49 49 49
t -0.6580 0.0026 -0.6665 -1.0372
p-value 0.5137 0.9980 0.5083 0.3048
95%
Confidence
Interval
[-1.8 to 0.9] [-0.8 to 0.8] [-0.9 to 0.5] [-1.1 to 0.3]
Standard
Deviation 4.63 2.80 2.38 2.51
All the data points, including the outliers (to compare the four combinations with the same
population size, n=49) were used to develop the analysis for selecting the most suitable method
for estimating the in-place density of the CIR layer. As shown in Table 6 for the four combinations,
there is not significant evidence to prove that the difference between the cores air voids and the
corrected in-place air voids is different than zero. The 95% confidence interval equation is given
by Equation 5:
𝐶𝐼95% = �̅� ± 1.96 ∗𝜎
√𝑛 (5)
25
Where; “σ” is the standard deviation and “n” is the population size. Since the population is fixed
for the four combinations, the lower the standard deviation and the lower the variability of the
method would define the best alternative to determine the in-place air voids.
From the statistical analysis of the data generated in this experiment as summarized in Error!
Reference source not found., it was found that the best alternative to estimate the in-place air
voids is to use the sand cone method and compare the results with the cores air voids using the
Parafilm method for measuring bulk specific gravity. As can be seen, the selected alternative has
the lowest standard deviation of 2.38. The 95% Confidence Interval of Difference provides the
range over which there is 95% confidence that the mean of the differences will be contained.
Selected Approach
Based on the statistical analysis of the data generated from the laboratory testing on CIR slabs
using the rubber balloon and sand cone methods and the measurements of the air voids on cores
using the Parafilm and Corelok methods, the following process is recommended to estimate in-
place air voids of the compacted CIR layer.
• Use the sand cone method to measure the in-place air voids of the compacted CIR layer as
described in this report.
• Use the 95% Confidence Interval of Difference for the sand cone method and the cores
with Parafilm shown below:
𝐷𝑖𝑓𝑓𝑒𝑟𝑒𝑛𝑐𝑒 = 𝐴𝑉%𝑃𝑎𝑟𝑎𝑓𝑖𝑙𝑚 − (𝐴𝑉%𝑆𝑎𝑛𝑑 𝐶𝑜𝑛𝑒 + 𝐶𝐹) (6)
𝐷𝑖𝑓𝑓𝑒𝑟𝑒𝑛𝑐𝑒 = 𝐴𝑉%𝑃𝑎𝑟𝑎𝑓𝑖𝑙𝑚 − (𝐴𝑉%𝑆𝑎𝑛𝑑 𝐶𝑜𝑛𝑒 + 2.8%) (7)
−0.9% < 𝐷𝑖𝑓𝑓𝑒𝑟𝑒𝑛𝑐𝑒 < 0.5% (8)
• Apply the above relationship as follows:
• Use the sand cone method to measure the in-place air voids of the compacted CIR
layer
• Add 2.8% to the in-place air voids calculated from the sand cone measurement to
calculate the adjusted in-place air voids
• There is 95% confidence that the adjusted in-place air voids will be: -0.9% to +0.5%
from the actual in-place air voids measured on cores using the Parafilm method
TASK 3: FIELD VERIFICATION AND IMPLEMENTATION
Field verifications of the in-place density methods were conducted on two CIR construction
projects in Nevada. The in-place densities were measured using the rubber balloon and sand cone
methods at multiple locations on each construction project right after the compaction of the CIR
layer. Cores were taken next to the area where the in-place densities were measured 7 – 10 days
after compaction to verify the estimated in-place density and air voids.
CIR Project in Fernley, NV
In-place densities were measured using the rubber balloon and the sand cone methods on the CIR
construction project located on US-95 south of Fernley, Nevada. Testing was conducted at two

26
different locations within the project. At each location, three tests, separated by 50 feet, were
conducted using each method. The density testing (rubber balloon and sand cone methods) were
conducted after the rolling pattern was completed and the full compaction was considered
achieved. Figure 28 and Figure 29 show the CIR construction process and the in-place density
measurements using the rubber balloon and sand cone methods, respectively.
Figure 28. CIR construction on the Fernley CIR project.
Figure 29. In-place density on the Fernley CIR project: rubber balloon and sand cone.

27
The verification of the 95% Confidence Interval of Difference for each method was conducted by
comparing the air voids obtained from the rubber balloon and sand cone methods with the air voids
obtained from the cores using the Parafilm and the Corelok methods, as shown in Table 7 and
Table 8. The 95% Confidence Interval of Difference was only met for the estimated air voids
using the sand cone method and the cores using the Parafilm method. The difference between the
average air voids from the cores using Parafilm (22.0%) and the average air voids from sand cone
plus the correction factor (19.4%+2.83%) is inside the 95% Confidence Interval of Difference.
Table 7. Verification of the In-Place Air Voids estimated by the Rubber Balloon Method from
the Fernley Project.
Rubber Balloon - Parafilm Rubber Balloon - Corelok
Avg. AV: Balloon,
% 22.7
Avg. AV: Balloon,
% 22.7
Corrected Avg. AV:
Balloon, % 25.1
Corrected Avg. AV:
Balloon, % 23.8
Avg. AV: Cores, % 22.0 Avg. AV: Cores, % 20.0
Difference -3.1
No
Difference -3.8
No 95% Confidence
Interval for the
Difference [-1.8 to 0.9]
95% Confidence
Interval for the
Difference [-0.8 to 0.8]
Table 8. Verification of the In-Place Air Voids estimated by the Sand Cone Method from the
Fernley Project.
Sand Cone - Parafilm Sand Cone - Corelok
Avg. AV: Sand
Cone, % 19.4
Avg. AV: Sand
Cone, % 19.4
Corrected Avg. AV:
Sand Cone, % 22.2
Corrected Avg. AV:
Sand Cone, % 21.3
Avg. AV: Cores, % 22.0 Avg. AV: Cores, % 20.0
Difference -0.30
YES
Difference -1.3
No 95% Confidence
Interval for the
Difference [-0.9 to 0.5]
95% Confidence
Interval for the
Difference [-1.1 to 0.4]
The data in Table 7 show the air voids estimated by the rubber balloon method are higher than the
air voids measured on the cores. This was not the regular trend found on the laboratory testing of
the CIR slabs. Therefore, applying the correction factor obtained from the CIR slabs leads to higher
difference from the cores. This difference in the trend might be due to the higher variability of the
rubber balloon test method.
The data in Table 8 show that the 95% Confidence Interval of Difference was met for the sand
cone method with using the Parafilm method on the cores, but it was not met for the sand cone
method using the Corelok method on the cores.

28
CIR Project in Ely, NV
In-place densities were measured using the rubber balloon and the sand cone methods on the CIR
construction project located on US-6 south of Ely, Nevada. Testing was conducted at three
locations separated by 50 feet. The density testing (rubber balloon and sand cone methods) were
conducted after the rolling pattern was completed and the compaction was considered achieved.
Table 9 summarizes the air voids results from the rubber balloon method, sand cone method, and
from the field cores using parafilm and Corelock to obtain the bulk specific gravity of the samples.
Table 9. Air Voids from the Rubber Balloon, Sand Cone, and Field Cores from the Ely Project.
Avg. AV: Rubber Balloon, % 24.1
Avg. AV: Sand Cone, % 19.1
Avg. AV: Cores (parafilm), % 16.5
Avg. AV: Cores (Corelok), % 15.2
Opposite from the general trends found in the laboratory experiments on CIR slabs, the estimated
air voids obtained from the rubber balloon and sand cone methods were higher than the air voids
obtained from the cores. This might be due to field consolidation of the CIR layer between the day
the estimated densities were measured and the day the cores were obtained; about 10 days later.
The road section where the densities were tested was a one-lane per direction. It is possible that
during traffic control and re-opening to traffic, vehicles further compacted the CIR mix at the
locations of the density measurements. Since the data for US-6 in Ely, Nevada did not follow the
general trends found in the laboratory CIR slabs experiments, this project was not used for
verification of the 95% Confidence Interval of Difference.
FINDINGS AND RECOMMENDATIONS
The objective of this research was met by carrying out a laboratory experiment that measured the
density of the compacted CIR slabs using the rubber balloon and sand cone methods and compared
these measurements to the densities of cores. Based on the statistical analyses of the collected data,
it was concluded that measuring the in-place density of the compacted CIR layer using the sand
cone method leads to the estimation of in-place air voids that are the closest to air voids of cores
obtained from the CIR layer bulked with the Parafilm method. Based on this conclusion, the
following recommendation is made:
• Use the sand cone method to measure the in-place density of the of the compacted CIR
layer
• Measure the maximum theoretical specific gravity of the CIR mix following AASHTO
T209
• Calculate the in-place air voids of the CIR layer using the in-place sand cone bulk density
of the CIR layer along with the maximum theoretical specific gravity of the CIR mix
following AASHTO T269
• Add 2.8% to the in-place air voids calculated from the sand cone measurement to calculate
the adjusted in-place air voids

29
• There is 95% confidence that the adjusted in-place air voids will be: -0.9% to +0.5% from
the actual in-place air voids measured on cores using the Parafilm method
ACKNOWLEDGEMENT
The research team would like to acknowledge the Nevada Department of Transportation for the
financial support of this research through the SOLARIS University Transportation Center and for
providing access to the CIR projects in Fernley and ELY and the support of Washoe County Community Services Department for providing all the necessary cores and performance data for
the CIR projects on Red Rock Road and Sandpiper Drive.

30
APPENDIX A Comparison of Slabs in-place Air voids
Figure A1. Slab 1 comparison of estimated air voids vs cores air voids using Parafilm.
Figure A2. Slab 1 comparison of estimated air voids vs cores air voids using Corelok.
10.0%
15.0%
20.0%
25.0%
30.0%
10.0% 15.0% 20.0% 25.0% 30.0%
Air
Vo
ids
Co
res
Air Voids Sand Cone and Balloon (%)
Slab 1 [Parafilm]
Balloon Sand Cone Equity Line
10.0%
15.0%
20.0%
25.0%
30.0%
10.0% 15.0% 20.0% 25.0% 30.0%
Air
Vo
ids
Co
res
Air Voids Sand Cone and Balloon
Slab 1 [Corelok]
Balloon Sand Cone Equality Line

31
Figure A3. Slab 2 comparison of estimated air voids vs cores air voids using Parafilm.
Figure A4. Slab 2 comparison of estimated air voids vs cores air voids using Corelok.
10.0%
15.0%
20.0%
25.0%
30.0%
10.0% 15.0% 20.0% 25.0% 30.0%
Air
Vo
ids
Co
res
Air Voids Sand Cone and Balloon
Slab 2 [Parafilm]
Balloon Sand Cone Equiality Line
10.0%
15.0%
20.0%
25.0%
30.0%
10.0% 15.0% 20.0% 25.0% 30.0%
Air
Vo
ids
Co
res
Air Voids Sand Cone and Balloon
Slab 2 [Corelok]
Balloon Sand Cone Equiality Line
32
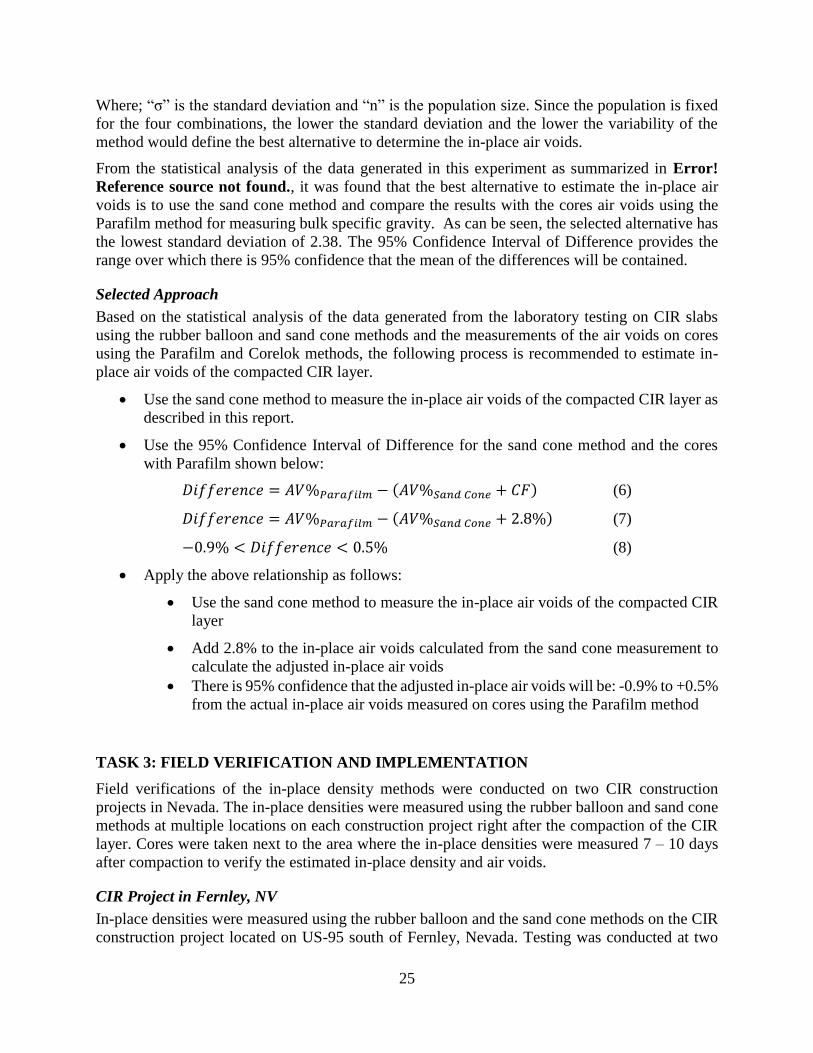
Figure A5. Slab 3 comparison of estimated air voids vs cores air voids using Parafilm.
Figure A6. Slab 3 comparison of estimated air voids vs cores air voids using Corelok.
10.0%
15.0%
20.0%
25.0%
30.0%
10.0% 15.0% 20.0% 25.0% 30.0%
Air
Vo
ids
Co
res
Air Voids Sand Cone and Balloon
Slab 3 [Parafilm]
Balloon Sand Cone Equiality Line
10.0%
15.0%
20.0%
25.0%
30.0%
10.0% 15.0% 20.0% 25.0% 30.0%
Air
Vo
ids
Co
res
Air Voids Sand Cone and Balloon
Slab 3 [Corelok]
Balloon Sand Cone Equiality Line

33
Figure A7. Slab 4 comparison of estimated air voids vs cores air voids using Parafilm.
Figure A8. Slab 4 comparison of estimated air voids vs cores air voids using Corelok.
10.0%
15.0%
20.0%
25.0%
30.0%
10.0% 15.0% 20.0% 25.0% 30.0%
Air
Vo
ids
Co
res
Air Voids Sand Cone and Balloon
Slab 4 [Parafilm]
Balloon Sand Cone Equiality Line
10.0%
15.0%
20.0%
25.0%
30.0%
10.0% 15.0% 20.0% 25.0% 30.0%
Air
Vo
ids
Co
res
Air Voids Sand Cone and Balloon
Slab 4 [Corelok]
Balloon Sand Cone Equiality Line
34
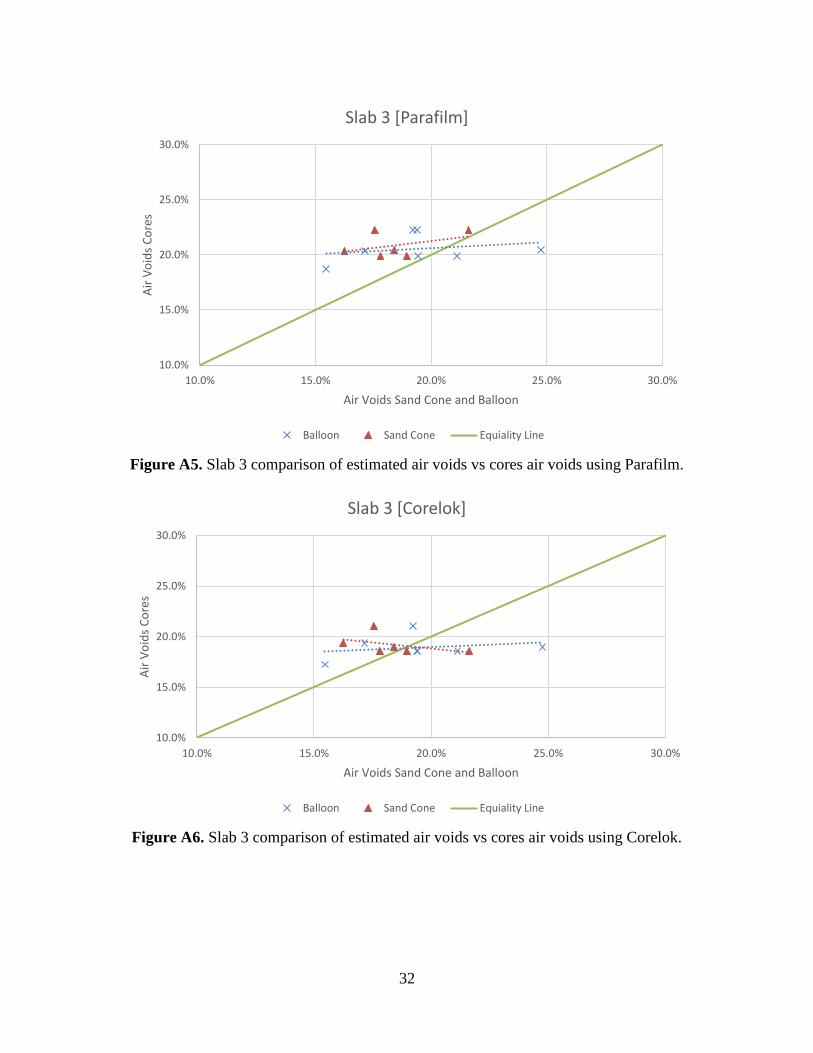
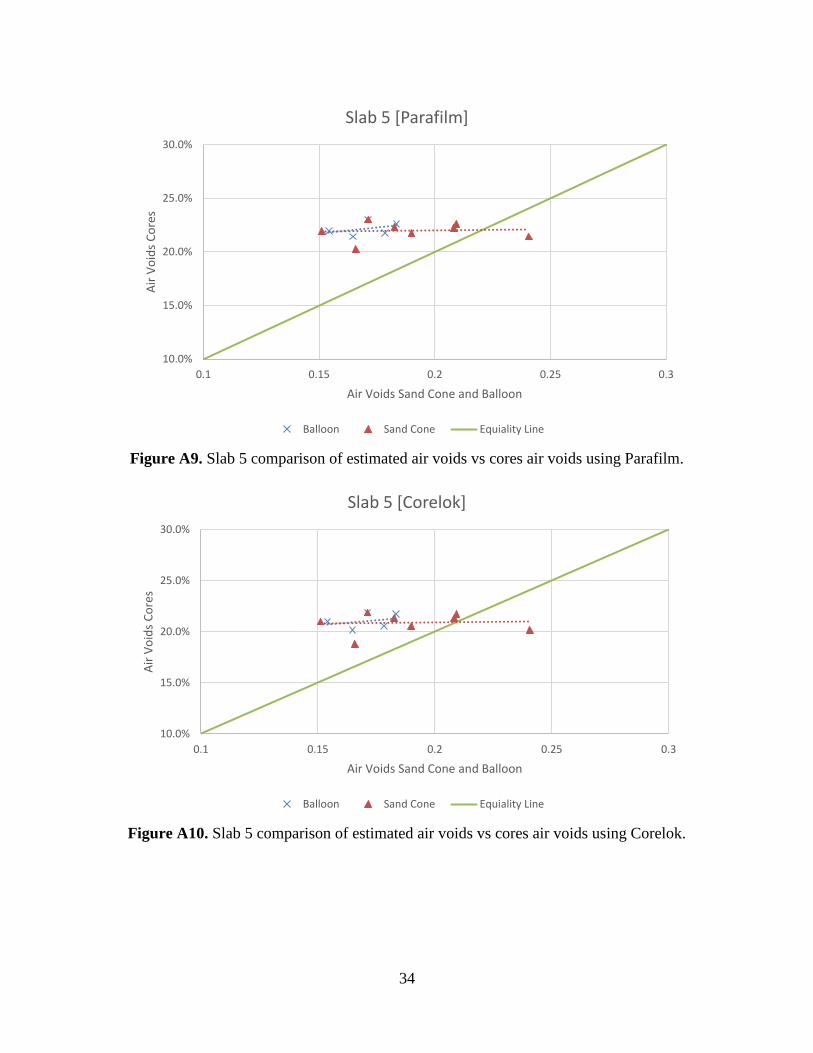
Figure A9. Slab 5 comparison of estimated air voids vs cores air voids using Parafilm.
Figure A10. Slab 5 comparison of estimated air voids vs cores air voids using Corelok.
10.0%
15.0%
20.0%
25.0%
30.0%
0.1 0.15 0.2 0.25 0.3
Air
Vo
ids
Co
res
Air Voids Sand Cone and Balloon
Slab 5 [Parafilm]
Balloon Sand Cone Equiality Line
10.0%
15.0%
20.0%
25.0%
30.0%
0.1 0.15 0.2 0.25 0.3
Air
Vo
ids
Co
res
Air Voids Sand Cone and Balloon
Slab 5 [Corelok]
Balloon Sand Cone Equiality Line

35
Figure A11. Slab 6 comparison of estimated air voids vs cores air voids using Parafilm.
Figure A12. Slab 6 comparison of estimated air voids vs cores air voids using Corelok.
10.0%
15.0%
20.0%
25.0%
30.0%
10.0% 15.0% 20.0% 25.0% 30.0%
Air
Vo
ids
Co
res
Air Voids Sand Cone and Balloon
Slab 6 [Parafilm]
Balloon Sand Cone Equiality Line
10.0%
15.0%
20.0%
25.0%
30.0%
10.0% 15.0% 20.0% 25.0% 30.0%
Air
Vo
ids
Co
res
Air Voids Sand Cone and Balloon
Slab 6 [Corelok]
Balloon Sand Cone Equiality Line

36
Figure A13. Slab 7 comparison of estimated air voids vs cores air voids using Parafilm.
Figure A14. Slab 7 comparison of estimated air voids vs cores air voids using Corelok.
10.0%
15.0%
20.0%
25.0%
30.0%
10.0% 15.0% 20.0% 25.0% 30.0%
Air
Vo
ids
Co
res
Air Voids Sand Cone and Balloon
Slab 7 [Parafilm]
Balloon Sand Cone Equiality Line
10.0%
15.0%
20.0%
25.0%
30.0%
10.0% 15.0% 20.0% 25.0% 30.0%
Air
Vo
ids
Co
res
Air Voids Sand Cone and Balloon
Slab 7 [Corelok]
Balloon Sand Cone Equiality Line

Nevada Department of Transportation
Rudy Malfabon, P.E. Director
Ken Chambers, Research Division Chief
(775) 888-7220
1263 South Stewart Street
Carson City, Nevada 89712