development of inclusive markets in agriculture and … vc report 2012.pdf · development of...
TRANSCRIPT
Development of Inclusive Markets in Agriculture and Trade (DIMAT)
Value Chain Analysis (VCA) of the Cassava Sub-sector in Uganda


A Value Chain Analysis of the Cassava Sub-sector in Uganda
Development of Inclusive Market in Agriculture and Trade (DIMAT) Project
November, 2012

About DIMATDevelopment of Inclusive Markets in Agriculture and Trade (DIMAT) in Uganda is a project supported by the United Nations Development Program (UNDP) and the Government of Uganda (GoU). Enterprise Uganda (EUg) is the implementing partner while Kilimo Trust (KT) and Private Sector Development Companies (PSDCs) are the Responsible Parties (RPs) for the project. The aim of the project is to contribute to Programme 2 of the Uganda’s Agriculture Development Strategy Investment Plan (DSIP) in relation to “enhancing Market Access and Value Addition”. The project focuses on building strong business linkages and inclusive business approaches to link small and medium scale producers and enterprises to profitable markets at national, regional and global levels.
About this ReportThe report was developed from both secondary literature and primary data gathered from various bean growing and trading districts of Uganda in July, 2012. The report provides a background of the DIMAT project, the purpose of the VCA, the methodology applied, the status of the sector and the value chain characteristics of demand and supply, the characteristics of the cassava value chain actors, processes, services, relationships and key partners. It also highlights the constraints the actors face and the opportunities available within the value chain. It finally presents conclusions and recommendations of strategic interventions for the project, regarding entry points to the Cassava Value Chain in Uganda.
AcknowledgementAvailability of data and information is a challenge in Uganda. The authors thank all the organizations, private companies and individuals who provided information and data to support the study.All photography is used with permission from Food And Agriculture Organisation, Matthias Mugisha and Shutterstock Images.
DisclaimerThe views and conclusions contained in this report are entirely those of the authors and do not necessarily reflect the policy and views of UNDP, GoU or Kilimo Trust.
CitationKilimo Trust, 2012. Development of Inclusive Markets in Agriculture and Trade (DIMAT): The Nature and Markets of Cassava Value Chains in Uganda

DEVELOPMENT OF INCLUSIVE MARKETS IN AGRICULTURE AND TRADE (DIMAT) i
EXECUTIVE SUMMARYquantities featuring in supermarkets. Dried cassava value chain has more actors than fresh cassava value chain, mainly due to long shelf life of dry cassava and high demand by the processing industry.
Inadequate and poor quality planting material and high prevalence of diseases especially the devastating Cassava Brown Streak Disease (CBSD) are the main problems facing cassava producers in addition to inadequate access to finance. The study identified the leading cassava varieties in terms of yields as Akena and TME14. The least yielding varieties were Fadepu and AK 203. With the changing climatic conditions, drought has become a challenge especially for rain-fed cassava production which is the sole production system. Actors shy away from irrigated cassava due to high operation costs coupled with the expected low returns from the enterprise. The major challenges at processing level are high cost of processing, poor quality and erratic supply of cassava. The low volume of cassava supplied is a challenge as it drives the operational costs even higher as the processors operate far below capacity. At farm level, men largely dominate cassava production, pruning and marketing activities while women dominate planting. Men and women are equally involved in fertilizer and pesticide application.
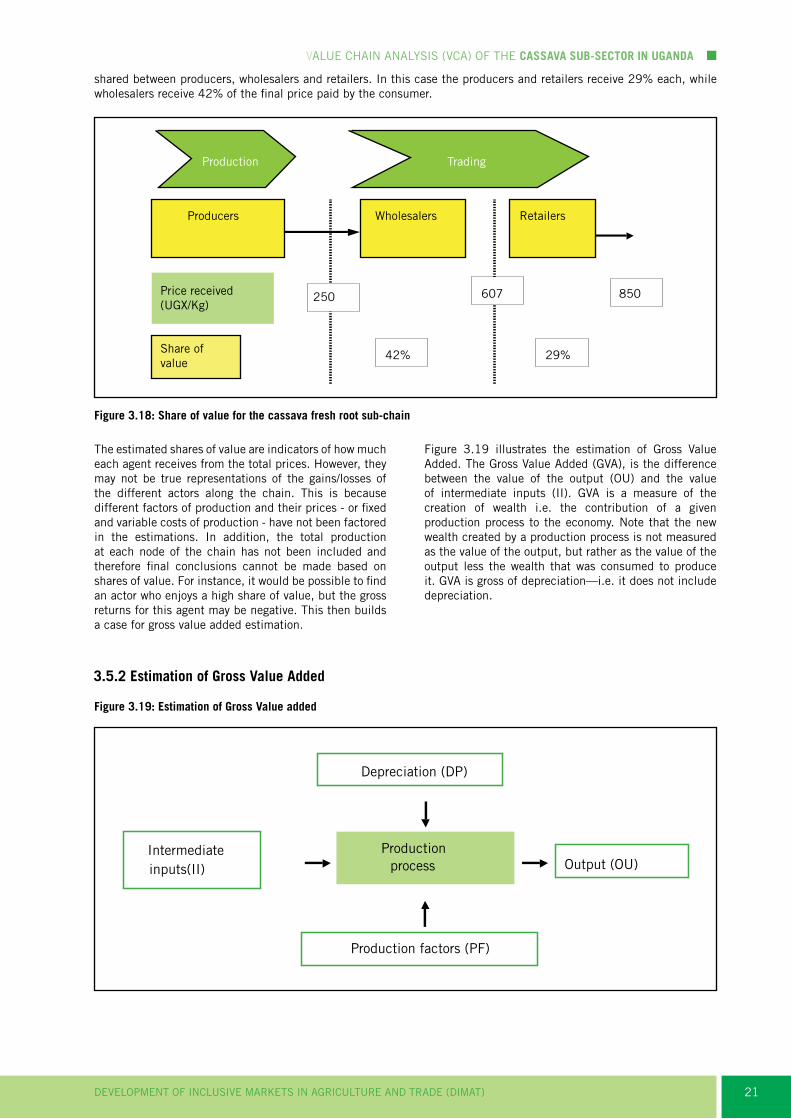
Analysis of the cassava value chain pricing showed that processors buy cassava chips at 550 Ush/Kg from the producers and sell at 950 Ush/Kg to the wholesalers who in turn sell to retailers at 1204 Ush/kg. The final consumers buy the product at 1421 Ush/Kg. To estimate the actors’ share of value (price distribution along the value chain), the margin for each actor was expressed as a ratio of the end (retail) price. In this case, producers’ share of value was 39%, the processors share of value was 28%, wholesalers gained 18%, while retailers gained 15%. In the cassava fresh root sub- value chain, the final consumer price is Ush. 850 which is shared between producers, wholesalers and retailers. In this case the producers and retailers receive 29% each, while wholesalers receive 42% of the final price paid by the consumer. The gross value added estimations show that retailers had the highest gross value added of 551 Ush/kg, followed by farmers with a gross value added of 515 Ush/Kg while wholesalers add the least value of 357 Ush/kg. Cassava producers get free services from BMO’s in which they are registered members. Such services include capacity building through training, extension services, post-harvest technologies, market information and access to disease-free cassava varieties. The proposed Cassava Centre of Excellence at Namulonge will address some of the key constraints in cassava production and commercialization.
Uganda is the sixth largest producer of cassava in Africa with 4.2 million metric tonnes having been produced in 2010. Cassava is the second most important staple crop after bananas in the country. The main cassava growing regions based on production volumes of 2008/2009 are; eastern region (37%), northern region (34%), western region (15%) and central region (14%). The national average yield of cassava is 12.5MT/ha with production being dominated by smallholders having farm sizes of between 0.4 and 0.8 hectares. The crop is grown for food and income and is traded as cassava flour (50%), dried cassava chips/pellets (45%) and raw cassava (5%). Fresh cassava trading is driven by the high perishability of the fresh roots and by the price premium that consumers are willing to pay for the freshness. Consumers particularly like the red-skinned variety of cassava grown almost exclusively in Masindi district. Although prices are majorly seasonal, they also vary on daily basis depending on the quantities supplied.
Given the importance of cassava in Uganda, it was necessary to understand what the situation of the cassava sub-sector is in the country in terms of production, marketing and consumption and also map the different actors in the value chain. The study employed the value chain analysis and SWOT analysees approaches to achieve its objectives. The value chain approach is an accounting framework which uses both functional and economic analysis (at market prices) of an identified value chain while SWOT analysis is a simple framework for generating strategic alternatives by identifying strengths and weaknesses, opportunities and threats.The analysis of the cassava value chain was based on a desk literature search and primary data gathered from a sample of thirteen cassava growing, consuming and trading districts in Uganda.
Purposive sampling was used to select the districts to be included in the analysis. The choice of the districts was guided by a criteria focusing on a) districts where the production of cassava is significant by volume; and/or b) where there is significant trade of cassava and/or cassava products; and/or; c) areas where the consumption of cassava by volume is significantly high to provide attractive markets. An in-depth analysis was conducted with regard to each of the participants in the value chain.
In its dry form, cassava is sold either as chips or flour. However, dried cassava is sold almost entirely by farmers as chips. About 200,000 MT of cassava flour are consumed per annum in Uganda, with most of it being traded in traditional informal markets and negligible

DEVELOPMENT OF INCLUSIVE MARKETS IN AGRICULTURE AND TRADE (DIMAT)ii
VALUE CHAIN ANALySIS (VCA) OF THE CASSAVA SUb-SECTOR In UgAnDA
Financial service providers mainly offer services and products to input suppliers, farmers, traders and processors. Most financial service providers (62%) charge interest rates of between 23%-30% per annum. This was reported by the actors as high making it hard for many value chain actors to access credit. From the study, 16% of the BMO’s are supporting at least three stages of the cassava value chain with only Namutumba traders association supporting the entire cassava value chain. In the cassava value chain, there is a concentration of provision of BDS to cassava farmers.
Input suppliers in the cassava value chain constitute 8% of all the input suppliers interviewed with the rest preferring to support the other commodity sectors - Coffee, Rice, Honey and Beans. Most of the input dealers (60%) had subscribed to the Uganda National Agro-Dealers Association (UNADA), the umbrella organization of input dealers.
There is potential for the cassava sub sector to grow exponentially if the various actors in the value chain are linked properly for efficient functioning of the chain. For example, 70% of the cassava processors who did not have any formal contracts with their suppliers are ready and willing to enter into formal contracts. In addition, 40% of cassava traders are also ready to enter into formal contracts with producers for as long as they are assured of reliable supply of clean cassava without foreign material such as stones and other debris.
The study recommends that BMO’s be encouraged to focus on the entire value chain. Financial service provision should be leveraged to support cassava farmers so that more cassava is produced to bridge the supply gap. Also, innovative financial mechanisms such as leasing of processing technologies should be explored to complement provision of these vital services to the sub-sector. Multiplication of cuttings of improved cassava varieties at community level as a way of speeding up adoption of these varieties is highly recommended. Further, the study recommends that cassava producers be encouraged to register with BMO’s so that they reap the benefits of membership such as access to market information, capacity building, extension services and postharvest technologies. Private sector investment is recommended in various points of the cassava value chain such as provision of trucks for transporting both raw and dried cassava to the main markets.
DEVELOPMENT OF INCLUSIVE MARKETS IN AGRICULTURE AND TRADE (DIMAT) iii
TAbLE OF COnTEnTS
LIST OF ACROnYMS & AbbREVIATIOnS iV
1 InTRODUCTIOn 1
1.1 Situation Analysis 1
1.2 Objectives of the Study 1
2 METHODOLOgY 3
2.1 Value Chain and SWOT Analyses 3
2.2 Data Needs and Sources 3
2.3 Sampling and Data Collection 3
2.4 Data Analysis 5
3 RESULTS AnD DISCUSSIOnS 7
3.1 Cassava production and supply in Uganda 7
3.2 Cassava marketing and Consumption in Uganda 9
3.3 Cassava Exports and Imports in Uganda 12
3.4 Functional Analysis 13
3.5 Financial Analysis of Cassava Value Chain 20
3.6 Linkage of Cassava Value Chain with Meso and Macro-level Institutions 23
3.7 Cassava Value Chain Supporting Policies and Institutions 31
3.8 SWOT Analysis 32
4 SUMMARY 37
4.1 Lessons from Cassava Situation Analysis 37
4.2 Lessons from Cassava Value Chain Analysis 37
4.3 Lessons from SWOT Analysis 38
5 RECOMMEnDATIOnS 41
5.1 Preliminary Outlines of Potential Interventions 41
REFEREnCES 47
APPENDIX 1: DETAILED LIST OF CONSTRAINTS AND OPPORTUNITIES AS IDENTIFIED By STAKEHOLDERS INTERVIEWED 48
APPENDIX 2: RECOMMENDATIONS AND SUGGESTED INTERVENTIONS MADE By STAKEHOLDERS 49
APPENDIX 3: EXISTENCE AND WILLINGNESS OF TRADER AND PROCESSOR COMPANIES TO ENTER INTO CONTRACTUAL AGREEMENTS WITH SUPPLIERS 50

DEVELOPMENT OF INCLUSIVE MARKETS IN AGRICULTURE AND TRADE (DIMAT)iv
ACP Africa Caribcassava Pacific
AgGDP Agricultural Gross Domestic Product
AGRA Alliance for a Green Revolution in Africa
ASERECA Association for Strengthening Agricultural Research in Eastern and Central Africa
ATAAS Agriculture Technology and Agribusiness Advisory Services
BCtA Business call to action
BDS Business Development Service
BMO Business Membership Organizations
CIAT International Centre for Tropical Agriculture
COMESA Common Market for Eastern and Southern Africa
CSO Civil Society Organization
DANIDA Danish International Development Agency
DIMAT Development of Inclusive Markets for Agriculture and Trade
DRC Democratic Republic of Congo
DSIP Development Strategy Investment Plan
EAC East African Community
FAO Food and Agriculture Organization
FDI Foreign Direct Investment
FG Producers Group
Fy Financial year
GDP Gross Domestic Product
GoU Government of Uganda
Ha Hectare
IDO International Development Organization
IFAD International Fund for Agricultural Development
IFPRI International Food Policy Research Institute
ITC International Trade Centre
JICA Japan International Cooperation Agency
KRC Kabarole Research and Resource Centre
KT Kilimo Trust
LEAD Livelihoods and Enterprises for Agricultural Development
MAAIF Ministry of Agriculture, Animal Industry and Fisheries
LIST OF ACROnYMS & AbbREVIATIOnS

DEVELOPMENT OF INCLUSIVE MARKETS IN AGRICULTURE AND TRADE (DIMAT) v
VALUE CHAIN ANALySIS (VCA) OF THE CASSAVA SUb-SECTOR In UgAnDA
MDI Microfinance Deposit-taking Institution
MEPE Mini-estates and Processing Enterprises
MSME Micro, Small and Medium Enterprise (MSME)
MT Metric Tons
NAADS National Agricultural Advisory Development Services
NAP National Agricultural Policy
NARO National Agricultural Research Organization
NGO Non-Governmental Organization
PABRA Pan-Africa Cassava Research Alliance
PMA Plan for the Modernization of Agriculture
RIC-NET Rwenzori Information Centre Network
R&D Research and development
SACCO Savings and Credit Cooperative Society
SMS Short Message Service
SSA Sub-Saharan Africa
SWOT Strengths, weakness, opportunities, and threats
UBOS Uganda National Bureau of Statistics
UEPB Uganda Export Promotion Board
UGX Uganda Shillings
UIA Uganda Investment Authority
UNADA Uganda National Agro-Input Dealers Association
UNBS Uganda National Bureau of Standards
UNDP United Nations Development Programme
UNFFE Uganda National Farmers Federation
USAID United States Agency for International Development
USDA United States Department of Agriculture
VCA Value Chain Analysis
VSLA Village Savings and Loan Association
WFP World Food Programme
WRS Warehouse Receipt Systems

DEVELOPMENT OF INCLUSIVE MARKETS IN AGRICULTURE AND TRADE (DIMAT)vi

DEVELOPMENT OF INCLUSIVE MARKETS IN AGRICULTURE AND TRADE (DIMAT) 1
1.1 Situation AnalysisThis subsection gives a preview of cassava production, marketing and consumption in Africa as well as globally. The aim is to provide the reader with background information on the supply and demand of cassava and build a case for value chain mapping and analysis in Uganda.
1.1.1 Cassava Production, Marketing and Consumption
The top 5 world producers of cassava--Nigeria, Brazil, Indonesia, Thailand and the Democratic Republic of Congo together produce up to 53% of world production (FAOSTAT, 2012). In 2010, Africa’s consolidated production of cassava was estimated at 53% of the world production. Nigeria, Democratic Republic of Congo, Angola, Ghana, Mozambique and Uganda are the largest producers in the continent. Cassava yields in Africa have increased from 6 MT/ha to 10 MT/ha which is only 20% of the world average and 89% below the potential of between 75 MT/ha to 90 MT/ha from on-farm trials (Fermont et al., 2009; Ntawuruhunga et al., 2006). Cassava is frequently cultivated on marginal soils (FAO, 2004). According to Hillocks (2002), the observed increase in area cultivated is related to general decline in soil fertility in Africa.
At 63% (90% of the global starch trade and 70% of dried cassava trade) share of global export value, Thailand is the leading exporter of cassava. Unlike most of the other countries where cassava is produced as a food crop, in Thailand, it is produced as an industrial crop. Other important exporters are Vietnam and Indonesia accounting for 27% and 2% of the global trade respectively. China imports 60% of the globally traded cassava, displacing the EU (ITC, 2012). In spite of the low tariff rate, preferential quota for cassava-based feedstuff, falling grain prices coupled with environmental concerns and animal diseases have depressed demand for cassava in the EU (Prakash, Undated). Out of the 242 million MT produced in 2009, only one-fifth was traded (FAO, 2009). Seventy percent of cassava trade is in the form of pellets and chips and the balance is mainly in form of flour for food processing and industrial use. Very little is traded as fresh roots due to the bulky nature of the commodity and its short shelf life in that form.
In Uganda, cassava is the second most important staple crop after bananas and Uganda is the sixth largest
1 InTRODUCTIOn
producer of cassava in Africa, producing 4.2 million metric tonnes in 2010 (MAAIF, 2011). The main cassava growing regions based on production volumes of 2008/2009 were; the eastern region (37%), northern region (34%), western region (15%) and central region (14%). The national average cassava yield in Uganda is 12.5MT/ha. Cassava is an annual crop, which takes between 6 – 8 months to mature. Once mature, the roots harvested per plant weigh up to 3 kg and can be stored for up to 2 years under-ground.
1.2 Objectives of the Study The situation analysis described above has demonstrated the importance of cassava both as a food crop and as a commodity that can be used to enhance the economy of Uganda. Given its importance, it is necessary to understand what the situation of the cassava value chain in the country is in terms of production, marketing and consumption. It is also important to have a knowledge on who the players in the cassava value chain are, as well as identify the constraints and opportunities by the different players. Understanding the policies and institutional frameworks guiding the operations of the cassava sub-sector is also important as they will determine the smooth operation and competitiveness of the cassava value chain. However, hitherto no study has been carried out to disentangle the micro, meso and macro level factors influencing the cassava value chain in Uganda or conducted a SWOT analysis of the sub-sector to identify any opportunities as well as bottle necks hindering the up-scaling of the VC. It is against this background that this study was carried out to aid in understanding these factors. Using the value chain and the SWOT approaches, this study was carried out in key cassava producing districts of Uganda.
The specific objectives of this study were to:• Compile and assess baseline information with respect
to the cassava commodity sub-sector;• Undertake a cassava value chain analysis with the
aim of mapping the main characteristics of the value chain;
• Identify and examine constraints and opportunities within the cassava value chain;
• Identify the underlying policies, institutional and infrastructural issues that affect competitiveness of the chain;
• Identify the potential of upgrading the cassava value chain; and
• Identify bilateral partners, NGOs, facilitating organizations and private sector players within the value chain and specific regions of operations.

DEVELOPMENT OF INCLUSIVE MARKETS IN AGRICULTURE AND TRADE (DIMAT)2
VALUE CHAIN ANALySIS (VCA) OF THE CASSAVA SUb-SECTOR In UgAnDA

DEVELOPMENT OF INCLUSIVE MARKETS IN AGRICULTURE AND TRADE (DIMAT) 3
2.1 Value Chain and SWOT AnalysesThis study employed the value chain and SWOT analyses approaches to achieve its objectives. The value chain approach is an accounting framework which uses both the functional and economic analysis (at market prices) of an identified value chain (FAO, 2005). The functional analysis was used to define the actors in the value chains while the financial analysis was used to analyze the economic returns by the different agents.
In the functional analysis, different players in the chain and the roles they play in the chain were identified. The functional analysis involves: a) identification of physical flows; b) identification of technical functions of the chain; c) identification of players and; c) quantification of physical flows. After the players in the value chain were mapped and their functions defined, the volumes of cassava they were handling was quantified.
The financial analysis involved identification of the inputs and outputs used in a particular activity in a value chain and attaching financial value to them. The aim of financial analysis is to determine whether: a) every player is generating a surplus; b) the surplus is adequate to ensure sustainability of the agents’ activities (e.g. maintenance and replacement of equipment, ability to cover financial charges); c) the surplus is sufficient, acceptable return on investment; e) there are winners and losers in the chain; and f) the prices between agents correctly reflect production costs as well as value added.
SWOT analysis was used to categorize the internal and external factors from the situation analysis. It serves as an interpretative filter to reduce the information to a manageable quantity of key issues. The SWOT analysis classifies the internal aspects as strengths or weaknesses and the external situational factors as opportunities or threats. Strengths can serve as a foundation for building a competitive advantage by value chain actors, whilst weaknesses may hinder it. By understanding these four aspects of its situation, the cassava value chain actors can better leverage their strengths, correct their weaknesses, capitalize on golden opportunities, and deter potential threats.
2.2 Data needs and Sources
Secondary and primary data were used in the analysis. The specific sources of secondary data included Civil Society Organizations (CSOs), Food Security Research Projects, Food and Agriculture Organization (FAO), COMESA, International Trade Centre reports, Uganda Bureau of Statistics, MAAIF, Business Membership Organizations (BMOs), development agencies, and other Value Chain Analysis (VCA) studies.
2 METHODOLOgY
More specifically, the following information on cassava sub-sector in Uganda was assembled from secondary data: a) global, regional and national structure of demand for raw cassava and finished products; b) production and trade volumes and trends in the past 10 years; c) inputs and products’ prices and trends in last 5 years; d) key drivers of demand of products globally, regionally and nationally and how these affect market shares of key industry players; e) relationship between commodity sector contributions and broader macroeconomic indicators (e.g. GDP, inflation, employment, foreign earnings and tax revenues); e) potential public and private sector players (including market leaders) that may influence the flow of trade; f) underlying policies, institutional, and infrastructural issues that affect the competitiveness of the value chain; and g)the current and planned investments and priorities by governments and development agencies in the sector.
The following primary data specific to cassava sub-sector was collected:
• Costs, production, sales volumes, values and margins.
• Types of financial facilities and services offered, loan terms and conditions and levels of lending to arable farming, processing and marketing. These were collected from finance institutions.
• Other services to the cassava value chain, trade volumes, storage facilities, cost data and margins, constraints and opportunities. These data was collected from traders and trade associations. Some of the traders were market off-takers and their data further included actual demanded volumes from suppliers, demand projections, pricing mechanisms, willingness to enter into contractual arrangements with other actors and operators along the value chain and conditions for these contractual agreements.
• Other value chain institutions like market information providers, input suppliers, technology providers also provided data on nature of services, who receives these services, constraints and opportunities.
2.3 Sampling and Data Collection
Purposive sampling was used to select the districts to be included in the analysis. The choice of the districts was guided by a criteria focusing on: a) districts where the production of cassava is significant by volume; and/or b) where there is significant trade of cassava and/or cassava products; and/or; c) areas where the consumption of cassava by volume is significantly high to provide attractive markets.

DEVELOPMENT OF INCLUSIVE MARKETS IN AGRICULTURE AND TRADE (DIMAT)4
VALUE CHAIN ANALySIS (VCA) OF THE CASSAVA SUb-SECTOR In UgAnDA
Table 2.1: List of Districts Selected for Cassava VCA
Selected districts
Reason for Selection for Cassava VCA
ApacSignificant production and trading activities
Arua Significant trading activities
BusiaSignificant production and trading activities
Gulu Significant production
Jinja Significant trading activities
Kampala Significant trading activities
Kibuku Significant production
MasakaSignificant production and trading activities
Nebbi Significant production
Ntungamo Significant production
Soroti Significant production
The sample size was determined using precision criterion determination approach which assumes that, the dominant characteristics of the study would occur if the confidence interval is set at 95%. A total of 366 respondents were sampled shown in Table 2.2.

DEVELOPMENT OF INCLUSIVE MARKETS IN AGRICULTURE AND TRADE (DIMAT) 5
VALUE CHAIN ANALySIS (VCA) OF THE CASSAVA SUb-SECTOR In UgAnDA
The final step of the analysis was a SWOT analysis. Factors which influence the internal operations of the chain were categorised into strengths and weaknesses, while those influencing the chain from outside were categorised as opportunities and threats. The aim was to determine the factors that improve the competitive advantage of the chain, so as to capitalize on them; but also identify those that may weaken or threaten the chain so as to take measures of mitigating their potential negative impacts.
Dist
rict
Dist
rict
Offi
cial
s
bMOs
Fina
ncia
l Ser
vice
s
Cons
umer
s
Inst
itutio
nal b
uyer
s
Tran
spor
ters
Inpu
t Sup
plie
rs
Farm
er g
roup
s
Proc
esso
rs
Trad
ers
Reta
ilers
Sum
Apac 1 1 3 3 2 2 5 2 1 4 24
Arua 1 2 3 11 3 2 3 4 2 2 3 36
Busia 1 3 4 10 16 6 4 1 6 4 55
Gulu 1 2 3 10 6 5 4 2 33
Jinja 3 10 4 3 4 1 3 1 29
Kampala 5 1 27 21 2 2 58
Kibuku 1 3 1 2 1 4 2 2 3 19
Masaka 1 3 6 7 15 4 2 38
Nebbi 1 2 3 10 5 1 2 2 26
Ntungamo 1 3 5 10 1 20
Soroti 1 1 3 4 2 5 2 3 4 3 28
Total 9 22 37 95 73 24 27 20 12 20 27 366
2.4 Data AnalysisThe collected data for the different value chain actors were entered in spread sheets and cleaned of any outliers and entry errors. The first step of the analysis involved describing characteristics of cassava production, consumption and marketing in Uganda.
The second step of the analysis involved functional analysis of the cassava value chain. The functional analysis of the value chain involved mapping of the value chain, identification of the roles of the different actors at different stages and quantification of flows (volumes) of cassava along the value chain. At this stage, it was important to categorize the chain actors into different categories based on the volumes of flows they deal in.
The third step was a financial analysis of the value chain which involved attaching prices to the various quantities of outputs and inputs along the value chain. The aim was to determine the financial returns for the respective agents of the value chain and also determine the value added at each stage of the chain.
Table 2.2: number of respondents by category of value chain actors

DEVELOPMENT OF INCLUSIVE MARKETS IN AGRICULTURE AND TRADE (DIMAT)6

DEVELOPMENT OF INCLUSIVE MARKETS IN AGRICULTURE AND TRADE (DIMAT) 7
3.1 Cassava Production and Supply in Uganda
Cassava production in Uganda is dominated by smallholders who cultivate between 0.4 and 0.8 hectares of land as a family enterprise for daily food, food security and income. It was estimated that, producers sold about 22% of cassava in 2008/09 with Northern Uganda had the biggest market share of 30% while eastern region
1061983
440 410
Prod
uctio
n in
MT
Eastern
Regions
Northern Western Central
3 RESULTS AnD DISCUSSIOnS
having the least share of 18% (UCA, 2010). Compared to the previous years, cassava marketing at farm gate has been on a decrease with 23% of cassava produced being marketed in 2005/2006 compared to 61% in 1999/2000 (PMA, 2008). The key production regions in order of importance are eastern, Northern, Western and Central (Figure 3.1).
Although cassava has for long been known as a “poor man’s crop”, this perception is changing. For example, a study on intensification of smallholder farming in East Africa contend that households belonging to all income categories in East Africa planted, consumed and marketed significant quantities of cassava (Fermont, 2009). Consequently, cassava has been identified as one of the 10 strategic commodities expected to contribute to the transformation of the agricultural sector in Uganda (MAAIF, 2010).
Figure 3.1: Cassava production by region 2008/2009 Source: MAAIF, 2010, 2011

DEVELOPMENT OF INCLUSIVE MARKETS IN AGRICULTURE AND TRADE (DIMAT)8
VALUE CHAIN ANALySIS (VCA) OF THE CASSAVA SUb-SECTOR In UgAnDA
Perc
ent r
espo
nden
ts
20 20
17
13
11
7
3 3 3 3
Bao Akena Nigeria TME 14 Deludelu Omungole Telongole Teleka Oxfam MH97/2961
Percent respondents
Production trends show a decrease in cassava production from 5.5 million MT in 2004 to 4.9 million MT in 2006 and thereafter an increase to 5.3 million MT in 2010 (MAAIF, 2010; 2011). Over the period 2005 - 2010, cassava production increased by 7% in volume and 12% in land under cultivation as reflected in Figure 3.2 (MAAIF, 2010). The abrupt decrease in production in 2005/2006 was attributed to the effects of cassava brown streak virus and cassava mosaic disease spread by whiteflies which led to yield loss of over 40%.
The increase in production of cassava from 2007 is attributed to the germ-plasm received by the National Cassava Program from CIAT Colombia, with special traits resistant to cassava mosaic disease. In addition, between 2008 and 2009, the International Centre for Tropical Agriculture in coordination with the Cassava Community of Practice (CoP) in Africa, initiated another project to enhance beta-carotene content, protein content and delayed physiological deterioration in cassava.
Figure 3.3: Major cassava varieties grown by producers
Figure 3.2: Trends in cassava production and area cultivated Source: MAAIF, 2010, 2011
55005576
49264973
50725179
5293
407
387379 386
398411
424
production (MT) Area (Ha)
2004 2005 2006 2006 2007 2008 2009
Pro
duct
ion
(00
0’s
MT)
Are
a (0
00
’s H
a)

DEVELOPMENT OF INCLUSIVE MARKETS IN AGRICULTURE AND TRADE (DIMAT) 9
VALUE CHAIN ANALySIS (VCA) OF THE CASSAVA SUb-SECTOR In UgAnDA
The acreage under cassava production in Uganda ranges from 0.25 acres to 8 acres per household. The major cassava varieties reported to be grown are TME 14, Akena (TMS 192/0067), Bao (Land race), Nigeria (TMS 30572), Ariwara, Omongole (TMS 192/0057 ) and Telengole. Others include Deludelu, Ariwara, Nyakakawa, Nyapamito, Angarova, Fadepu, Malukwa, Abiria, Gotta, Caritas 0014, 4271, Wasa 4, AK 203, Teleka and Oxfam, Migyera and MH97/2961.
Akena is preferred because it is early maturing, high yielding, has a good taste and is resistant to cassava mosaic disease; Bao is relatively bigger in size; TME is early maturing, high yielding, palatable and highly marketable while Nigeria is preferred because it is disease resistant. Table 3.1 illustrates the recorded mean yields by farmers for different varieties against the potential yields. From the available data, the production gap ranges from 52% to 81%, indicating a potential of more than doubling cassava production in the country.
Table 3.1: Yields of different cassava varieties
Variety Average
farmer’s yield (kg/acre)
Potential yield (kg/
acre)
Yield gap (%)
TME 14 3,667 16,200 -77.4
Akena 9,660 20,200 -52.2
MH97/2961 2,000 14,200 -86
Nigeria 3,500 16,200 -78.4
Omongole 3,050 16,200 -81
Bao 2,475
Ariwara 2,500
Deludelu 1,825
Nyakakawa 2,500
Nyapamito 1,000
Angarova 2,500
Fadepu 400
Malukwa 2,000
Abiria 4,000
Gotta 1,750
Caritas 0014 1,500
4271 1,700
Wasa 4 3,000
AK 203 800
Oxfam 2,000
3.2 Cassava marketing and consumption in Uganda
The first trading activity of cassava is between local traders (popularly known as middlemen and/or assemblers) and farmers. The local traders purchase from individual farmers and farmer groups. Then the cassava is sold at open markets and also to medium and large scale traders and/or processors. However, most of the traders procure directly from either fellow traders or individual farmers (Figure 3.4).
Fellow traders
56.5
43.5
SchoolsFellow traders
Major fresh Cassava buyers
41
25.6
15.4
10.3
7.3
Individualfarmers
Middlemen Farmer groups Processors
Source of cassava by traders
Perc
ent r
espo
nden
tsPe
rcen
t res
pond
ents
Figure 3.4: Source of cassava and major fresh cassava buyers from TradersSource: DIMAT Survey, 2012

DEVELOPMENT OF INCLUSIVE MARKETS IN AGRICULTURE AND TRADE (DIMAT)10
VALUE CHAIN ANALySIS (VCA) OF THE CASSAVA SUb-SECTOR In UgAnDA
Most of the travelling traders sell to fellow traders or schools. Price is mainly determined through negotiations for 63% of the transactions. Supply and demand forces, determination by buyers or by sellers are each used to determine prices for 13% of the transactions.
Cassava traders do not get the amount of cassava they demand. More often than not, there is a supply gap caused by low harvested volumes, poor road network which hinders access to production areas by traders (Figure 3.5). Even though the supply gap for cassava is low, the cassava supply deficit is still reflected at the traders’ level where the traders indicated that, often they were not able to obtain up to 26% of the required volumes.
Figure 3.5: Expected and actual supply, and causes of supply gap
At the retail level, raw cassava has the lowest price compared to chips, flour and crisps. However it is the least traded indicating that price is not a key determinant of volumes traded (Figure 3.6)
Figure 3.6: Major traded forms of cassava and their mean retail prices
2010
12
26
2011 2012
43.5
26.1
13 13
4.6
Poor roadnetwork
Poor qualitycassava
Labourshortage
Pest anddiseases
Low harvestedvolumes
Causes of Supply GapExpected Actual Supply Gap
Expe
cted
, Act
ual s
uppl
y (M
T)
Perc
ent r
espo
nden
ts
163
151159
133
114
Fresh cassavaroots
cassava chipscassava flourcassava crips
cassava crips cassava pellets/chips Fresh cassava roots
Major cassava traded forms Mean retail prices of cassava products
8501,000
1,400
3,00050
45
5
Mea
n re
tail
pric
es (
Ush
./kg)
Perc
ent r
espo
nden
ts

DEVELOPMENT OF INCLUSIVE MARKETS IN AGRICULTURE AND TRADE (DIMAT) 11
VALUE CHAIN ANALySIS (VCA) OF THE CASSAVA SUb-SECTOR In UgAnDA
Figure 3.7: Contribution of local production and imports in total supplySource: MAAIF, 2011 and ITC, 2012
Cassava traded in the country is mainly locally produced though there is also a small percentage that is imported (Figure 3.7).
Consumption of cassava in Uganda was estimated at 96 kg/capita/annum in 2009 (own calculations based on FAOSTAT data). Much of this demand came from the northern and eastern parts of the country and is in part attributed to the crop being regarded as a food security crop due to its drought resistance attributes and minimal processing requirements for preservation (Sewanyana and Kasirye, 2010). This survey found out that the key drivers of the demand for cassava include availability, affordability, and wide range of use; desire to change diet (variety on starch menu) and ease of preparation.
It is estimated that, about 200,000 MT of cassava flour are consumed per annum in Uganda, an equivalent of between 600,000 MT to 800,000 MT of fresh cassava (22% of all consumed cassava). In its dry form, cassava is sold either as chips or flour. However, dried cassava is sold almost entirely by farmers as chips. It is in the subsequent stages of the value chain that chips are milled into flour. Cassava flour may be sold as composite flour mixed with finger millet or sorghum. It is assumed that most of the flour in Uganda is sold in traditional markets as very small amounts are stocked in supermarkets and shops (CAVA, 2009).
Flow of fresh cassava is particularly dynamic and involves heavy concentration of marketing services. Rural to rural flows are, by comparison, much more diffuse. Unfortunately for our purposes, the data source that yielded consumption data for dried cassava cannot be used to provide a similar insight to fresh cassava consumption. While the Ugandan Household Survey records fresh cassava purchases and consumption from own production, it uses heaps of unspecified weight as the most common unit of measurement. Heaps vary in size between urban and rural areas, and also according to region and season. The study did not find credible
Loca
l pro
duct
ion
and
impo
rts
(000
’s)
2007 2008
0.012
1.66
20.38
5179
5293
50724973
0.024
Local production Imports
2009 2010
conversion factors to transform heaps into weights and therefore were unable to provide fresh cassava consumption figures.
Urban consumers prefer sweet flavoured, medium sized cassava roots. Many of the new cassava mosaic resistant varieties are reportedly unpopular due to their bitter taste. From the traders’ point of view, roots that have relatively long shelf life are more preferred. Several traders expressed preference for roots with an outer bark-like skin that peels easily to reveal a thick, often reddish, inner skin.
An analysis of fresh cassava marketing in Uganda by Collinson (2003) concluded that: a) trade in fresh cassava is driven by the high perishability of the roots and the price premium that consumers are willing to pay for freshness; Consumers tend to prefer sweet flavoured varieties, medium-sized cassava roots and they particularly like the red-skinned variety of cassava grown almost exclusively in Masindi area and pay a premium price for it (C:AVA, 2009); b) there seems to be no evidence of retail price seasonality, although prices vary on a daily basis in response to the quantities offered for sale. There also seems to be a positive long-term price increase; and c) the marketing chain for fresh cassava seems to be highly streamlined with relatively few number of actors as compared to those dealing with cassava chips.
Supply of fresh cassava vary with season. Harvesting during the dry season is particularly labour intensive and often results in broken roots. No such problems exist in the wet season and consequently supply tends to be higher. There is also a clear positive long term price trend (statistically significant at the 5% level: t = 4.66). We cannot provide a definitive reason for this, although increased demand caused by urbanization is almost certainly a factor. More importantly, anecdotal evidence gathered from traders suggests that, reserves of fresh cassava cultivated near Kampala have been over-exploited. Supplies are now sourced from far thereby adding to transport costs and hence the high and increasing retail price of fresh cassava.

DEVELOPMENT OF INCLUSIVE MARKETS IN AGRICULTURE AND TRADE (DIMAT)12
VALUE CHAIN ANALySIS (VCA) OF THE CASSAVA SUb-SECTOR In UgAnDA
3.3 Cassava Exports and Imports in UgandaUgandan cassava exports have fluctuated over the past five years with the highest volumes reported in 2007 (20,506 MT) and least in 2009 (897MT) (ITC, 2012) as shown in Figure 3.8. The main destinations of these exports are Burundi, Rwanda, Kenya and informal trade of dried cassava with South Sudan. Although Uganda exports fresh cassava to Kenya in dried or fresh form she imports high quality products (starch) back from Kenya that are expensive implying there is demand of starch in Uganda.
Exported volumes of fresh and dried cassava fell from 20,506 MT in 2007 to 897 MT in 2009 and then rose again to 11,397 MT in 2010 (Figure 3.8). The fall in exports was due to the effects of the brown streak virus and cassava mosaic disease. In 2011, Uganda exported cassava to Burundi (5,174 MT), Kenya (638MT) and Rwanda (9 MT).
Figure 3.8: Cassava import and export trendsSource: ITC, 2012
Cassava is mainly imported into Uganda as fresh, dried and as starch. The imports are mostly from Tanzania (24 MT in 2010 and 877 MT in 2011), while most of the cassava starch is imported from Kenya (2 MT in 2011) (ITC, 2012). In 2010, Uganda produced about 5.3 million MT of cassava and imported 24 MT from Tanzania (ITC, 2012). The survey confirmed that cassava is mainly traded as cassava flour. This is followed by cassava pellets and a small percentage as fresh cassava. Importation of starch has been constant since 2007 (Figure 3.9), with the main users being pharmaceutical industries (53%), Paperboard industries (32%), food processors (13.5%) and laundry operators (1%).
Figure 3.9: Ethyl Alcohol and starch imports and sources of starchSource: ITC, 2012
Impo
rts a
nd E
xpor
ts (M
T)
20506
9143
20377
11397
5823
87724897
165512
2007 2008 2009 2010 2011
Cassava ExportsCassava Imports
Volume of starch exports
Kenya201020092008
Ethyl Alcohol Starches
2007
21 1
2
10
14
16
18
USA India Brazil UAE
230
56
98
483
Volu
me
(000
’s M
T)
Year Country of origin

DEVELOPMENT OF INCLUSIVE MARKETS IN AGRICULTURE AND TRADE (DIMAT) 13
VALUE CHAIN ANALySIS (VCA) OF THE CASSAVA SUb-SECTOR In UgAnDA
ConsumptionRuralconsumers
Ruralretailers
Urban foodretailers
Food exportes
Feedwholesalers
Urban foodWholesaler
District levelWholesalers
Service millers
Rural assemblers/Middlemen
Urban traders
Individual smallholderproducers
Producer Organizations (POs)
Individual smallholder producers Producer Organization (POs)
Neighbours NAADS NGOs egWorld Vision
Conventionalinputs dealers in urban centres
Operators consumers Chain integrationFunctions
Legends:
Input supply
Production
Farm levelprocessing
Assembling/Bulking
Processing(Milling)
Tradiing
Inputs (Cassava cutting)
Urban millers(Food and Feed processors)
POs
Urbanconsumers
Bakeries Livestockfarmers
RegionalConsumers
3.4 Functional Analysis
3.4.1 Mapping of Cassava Value Chain in Uganda
The first step of the functional analysis was to map the actors in the cassava value chain as presented in figure 3.10.
Figure 3.10: Core processes of the cassava value chain

DEVELOPMENT OF INCLUSIVE MARKETS IN AGRICULTURE AND TRADE (DIMAT)14
VALUE CHAIN ANALySIS (VCA) OF THE CASSAVA SUb-SECTOR In UgAnDA
Maize starch constitutes 95% of all imported starch, wheat starch constitutes 4%, and cassava starch about 0.2%, while all the other starches combined contribute 1.4% of total starch imports. This presents opportunities for value addition with the aim of producing premium products like starch and ethanol. For instance, the total national demand for ethanol was 16,435 MT (worth about USD 17M in value) in 2010. This was consumed by laboratories in schools, hospitals and distillers (MEPE, 2012).
Consumption
Trading
Assembling
Production
Input supplying
Legend:
Function Operators Consumers
Neighbours NAADS NGOs egWorld Vision
Conventionalinputs dealers inurban centres
Individual smallholder producers Producer Organisation (POs)
Village assemblers
Traveling traders
Wholesalers
retailers of fresh, roasted or friedCassava
Ruralconsumers/Households
Urbanconsumers
Cassava cuttings Cassava tubers
3.4.2 Identification of technical functions of actors in the cassava value chain
This step involved identification of the different stages of cassava value chain in Uganda, the functions at each stage, the actors playing different roles and the outputs at the different stages of the chain.
Input suppliers: The study covered 11 districts in which a total of 68 input suppliers were interviewed. A majority (68%) of the input supply businesses were owned by men. The input supply business is male dominated some of whom have been in the business for over 30 years. Over 80% of the input suppliers had registered their businesses with the relevant authorities showing the growing trend of formalizing businesses across the country.
Input suppliers in the cassava value chain constituted 8% of all the input suppliers interviewed. The main type of input was cassava cuttings and varieties provided by input suppliers including the Zonal Agricultural Research Institute in the West Nile region are; Akena, TME, Nigeria, M2961, NASE 3 and NASE
A bag of improved cassava cuttings costs between Ush. 10,000 and Ush. 40,000. Major buyers of cassava cuttings are individual farmers who account for 37% of the buyers of inputs, farmer groups (80%), support institutions and NGOs (24%), and schools (1%)
Figure 3.11: Map of core processes of cassava fresh roots value chain

DEVELOPMENT OF INCLUSIVE MARKETS IN AGRICULTURE AND TRADE (DIMAT) 15
VALUE CHAIN ANALySIS (VCA) OF THE CASSAVA SUb-SECTOR In UgAnDA
Producers: Majority (70%) of the interviewed farmer groups were registered either as Cooperatives/Associations or as Community Based Organizations (CBOs). The farmer groups had an average membership of 29 nineteen of which were females indicating that, women dominate cassava production. Groups which reported lack of involvement of men in cassava production were strictly those formed to empower women, for example Opliyo women voluntary group. The land acreage under cassava production was ranging from 0.25 acres to 40 acres. The major cassava varieties grown by the farmer groups are Bao, Nigeria, Ariwara and Derodero. The yields of these varieties are Nigeria (1.4 MT/ha), Bao (1.1 MT/ha) and Abiria (1.6 MT/ha).
Producer groups are involved in different activities which include: training, production and marketing. The activities that are least undertaken collectively are: access to credit services, access to inputs and access to processing services. The major post harvest activities that the cassava farmer groups undertake include peeling, slicing into chips, drying and packing into sacks (33%), with 18% milling their cassava after it has dried. Fourty nine percent (49%) of the farmer groups ferment their cassava after peeling and then dry it before packing in an attempt to give the flour a better taste.
Post harvest losses are a major reason for inadequate supply. For instance losses per 100 kg bag of cassava were reported to range between 2 – 30 kg per bag. Such high losses was as a result of inadequate storage facility as reported by most of the farmer groups (59%) for their cassava hence using individual stores and family houses. The capacity of the storage facilities ranged from a minimum of 0.6 MT to a maximum of 20 MT with the current utilization of such stores by the farmer groups ranging from 0.1 MT to 10 MT.
Most of the cassava is traded as cassava flour, dried pellets and raw cassava in that order. Trading in these forms was attributed to; availability of ready market, high demand from schools, high returns and preference of cassava chips by customers. The major customers for raw cassava, flour and dried pellets are fellow traders and schools who mainly prefer Nijera, Akena and Boro (Migyera) varieties in that order.

DEVELOPMENT OF INCLUSIVE MARKETS IN AGRICULTURE AND TRADE (DIMAT)16
VALUE CHAIN ANALySIS (VCA) OF THE CASSAVA SUb-SECTOR In UgAnDA
Processors: Most of the local cassava processors serve individual farmers who have their cassava processed for home consumption.
When the processors receive the raw material in the form of dried cassava pellets, they sort them to remove foreign matter after which, they mill and pack the flour in polythene bags, sacks or standardized custom-made packages ready to be supplied to the supermarkets. However, for those processors who receive fresh cassava tubers, they clean, peel, chip and dry them ready for milling into flour and packaging.
Traders: Cassava is mainly traded within the country. This may be attributed to the perishability nature of fresh cassava roots and limited value addition to produce premium products like starch and alcohol. In this study, a total of 20 traders consisting of wholesalers and exporters were interviewed. Cassava businesses are mainly run by sole proprietors with 67% of the interviewees running these businesses as owners/director/ proprietor. Most of these traders work in isolation with 68% percent of them not belonging to any association. The few who belong to associations have been members for 8 years on average and identified Soroti Development Network and West Nile Cassava Traders Association as the ones they subscribe to.
Input Supply
InformalCassava
other farmers:Government& NGO’sprograms:
Supply farmimplementsand cassava
Extensionservices to thecassavaproducers
Land
Weeding,
PeelingChippingDrying andpackaging intosacks
Bulking,
behalf ofproducers
Loading and off-loadingchecking formoisture content,
Drying, MillingQuality control,Packaging,Some dowholesaling(selling directlyto retailers),
fresh and drycassava),Packing andTransport
Drying,
CleaningStoringStorageselling(flour,freshroasted orfriedcassava) tofinalconsumers
Producers(individual andproducergroups,
Villages
assembler:
middlemen
Processors:
(Food/Feed
manufacturers
Travelingtraderswholesalers
Retailers offresh,roastedand friedcassava
Production Assembly Processing Trading
Retailer: A total of 27 respondents were interviewed from 24 sub counties in 11 districts. Key activities carried out by most cassava retailers are; drying (for products which are not well dried), sorting, packing and storing. Another key activity is bagging and this is mainly for pellets and cassava flour ready for sale and transportation to different destinations.
Cassava retail businesses are mainly operated by the owners who also employ few people. Out of 26 cassava retailers interviewed, 62% were not formally registered. This means that majority of cassava retailing businesses are not formally recognized by the authorities and therefore do not access many of the formal services from different institutions.
Majority of the retailers get cassava products (cassava chips and fresh cassava) from the producers. About 30% of them source cassava chips and flour mainly from wholesalers. The other suppliers include: middlemen, processors and mass market traders. Cassava retailers indicated that majority of suppliers especially producers are mainly from Soroti and Busia while others are from Apac and Palisa.
Transporters: A total of 57 transporters were interviewed. Most of them engage in transportation of multiple commodities with 23% transporting cassava only. Most of them prefer transporting cassava pellets, dried cassava,
Figure 3.13: Technical functions of actors along the Cassava Value Chain

DEVELOPMENT OF INCLUSIVE MARKETS IN AGRICULTURE AND TRADE (DIMAT) 17
VALUE CHAIN ANALySIS (VCA) OF THE CASSAVA SUb-SECTOR In UgAnDA
flour and fresh cassava in that order reason being that dry pellet and flour are lighter and easy to handle compared to fresh roots. About 34% of interviewed transporters offer their services to local traders, farmers (28%), exporters (18%), processors (15%) and importers (6%). Other target recipients of transport services are retailers.
The requirement for transporting cassava is that; the truck must be covered with tarpaulin to protect the cassava, must have a metallic top, commodity must be in sacks and the transporters must have a license. Rain, bag wear & tear, sorting and cleaning, mechanical problem, loading & offloading, poor packaging and theft are the major causes of losses incurred during transportation.
P
R
O
D
U
C
E
R
S
ASSEMBLERS
RETAILERS
C
O
N
S
U
M
E
R
S
Sale of fresh cassava to assemblers (5%)
Sale of dried pellets to assemblers (21%)
Sale of dried pellets to processors (41%)
Sale of fresh cassava direct to consumers (8%)
Own consumption (25%)
Sale of fresh cassava to urban traders
Sale of fresh cassava to wholesalers
Sale of dried pellets to processors (19%)
Sale of cassava flour to wholesalers (55%)
Sale of cassava flour direct to consumers (25%)
Sale of cassava flour to retailers
Sale of cassava flour direct to consumers
Production Bulking Processing Trading Consumption
P
R
O
C
E
S
S
O
R
S
WHOLESALERS
3.4.3 Quantification of Physical flows in the cassava value chain
This section attempts to quantify the physical flows of cassava handled by different players along the cassava value chain. Producers get an average of 23 MT/Ha of cassava per acre and out of it about 15 MT is sold (as fresh and dried cassava) and only 7.5 MT is consumed by farmers themselves which accounts for about 33% of cassava produced. About 5% is sold as fresh cassava through local village aggregators who sell directly to wholesalers and urban fresh cassava retailers.
Figure 3.14: Proportion of cassava flowing through different channels
Farmers also do some farm level processing by peeling and drying fresh roots into cassava chips which they sell to processors. This takes about 62% of what comes from producers (individual farmers or farmer groups), while 19% of supply comes from village assemblers and the remaining is sourced from open markets. This is later milled into cassava flour.
In yet another alternative channel, about 62% of cassava is sold as dried chips. The dried cassava chips (pellets) are sold through village assemblers who later sell to processors. About 55% of cassava flour coming from processors is sold to the wholesalers, while 25% goes directly to the consumers (individuals, institutions and hotels) and remaining 20% goes to the secondary processors.

DEVELOPMENT OF INCLUSIVE MARKETS IN AGRICULTURE AND TRADE (DIMAT)18
VALUE CHAIN ANALySIS (VCA) OF THE CASSAVA SUb-SECTOR In UgAnDA
Figure 3.14: geographical Trade Flows of Cassava
Figure 3.14 shows the geographical trade flows of cassava from different districts in Uganda. Cassava trading flow involves three main products, i.e. fresh cassava, dried cassava chips and cassava flour. Most of these cassava products flow from the eastern region (Soroti, Pallisa and Iganga), northern region (Apac, Gulu, Arua and Nebbi) and western region (Masindi and Kibale).
In the eastern region, Soroti is the main producer of cassava. Fresh cassava from Soroti is partly consumed within the district or is supplied to Kumi and Mbale. The major flow of Soroti’s dried cassava chips involves supplying dried chips to Kampala and Busia. The minor flow goes through Jinja, where exporters collect the
Freshh Cassava Dried Cassavaa Chips Caassava Flour
Fresh cassava Cassava chips Cassava flour
chips and transport it to Kenya through Busia. Soroti producers also process cassava flour and supply it to DRC, Rwanda and South Sudan. Chips from Pallisa and Iganga are mainly supplied to Mbale, Busia and Kampala. It should be noted that Busia, being the major trading district in the eastern region, receives a lot of dried cassava chips from other districts which are then sold to Kenyan traders.
Nebbi and Apac districts are the main producers of cassava in the northern region. Fresh cassava from Apac district is mostly supplied to Lira town, in addition to some of it being consumed within the district. The dried

DEVELOPMENT OF INCLUSIVE MARKETS IN AGRICULTURE AND TRADE (DIMAT) 19
VALUE CHAIN ANALySIS (VCA) OF THE CASSAVA SUb-SECTOR In UgAnDA
chips are transported to Kampala, Gulu and DRC, where some of the chips go to South Sudan through Kitgum district and other minor routes. Cassava from Nebbi is traded in Arua (fresh cassava), Gulu (dried chips) and DRC (flour). The dried chips flowing into Gulu districts are bulked and transported to South Sudan through major flow routes.
In the western region, Masindi district is the largest producer of cassava followed by Kibale district. Approximately 60% of Masindi cassava is transported to Kampala as fresh or dried chips. The remaining percentage is consumed within the district; transported to Gulu as dried chips and processed into flour and sold to DRC cross-border traders. The Kibale cassava is traded to Kampala as fresh roots while some of is traded in DRC as dried chips.
3.4.4 Employment in the Cassava Value Chain
Profiling of employment across the cassava value chain from data collected during the survey indicated that, both men and women are employed at the various levels of the value chain. Employment at various stages of the value chain is mainly on temporary basis. Further, it emerged that management of cassava enterprises is synonymous to ownership. In addition, managers of cassava enterprises across the chain earn in several folds high than their casual employees.
Employment at the production level: Farmers are self- employed on their farms and therefore make up the labor force at the production level. Planting, weeding and harvesting are not gender balanced. Men largely dominate the production, pruning and marketing activities while women dominate planting only. Women and men equally carry out fertiliser and pesticide application and weeding at 40% and 15%, respectively (Figure 3.15).
P roduction Transport
Processing
Trading R etailing
Actors
Farmer Groups
Average employees (self employed)
Male: 75
Female: 112
Actors
Drivers and turn- boys
Average employees Total= 4
Actors
Processors
Average employees
Management=2
Casuals: 5
Actors
Traders
Average employees
Management
Male:1 Female:0
Casuals:
Male: 7 Female: 1
Actors
Retailers
Average employees
Management Male: 1
Female: 1
Casuals
Male: 2
Female: 2
Figure 3.15: Levels of employment along the cassava value chain

DEVELOPMENT OF INCLUSIVE MARKETS IN AGRICULTURE AND TRADE (DIMAT)20
VALUE CHAIN ANALySIS (VCA) OF THE CASSAVA SUb-SECTOR In UgAnDA
Figure 3.16: Workload distribution by gender at production
3.5 Financial Analysis of Cassava Value Chain
In this section, we first determined the value shares of the different chain actors in order to determine price distribution along the chain. Second, we attached market price to the different activities, inputs and outputs and then estimated the gross value for each player along the value chain. The aim was to determine the value added and how much of it accrued to each player.
LandPreparation
Planting Fertilizer &pesticide
application
Weeding CassavaPruning
Harvesting Marketing
Activity
Mainly men
80
70
55
35
10 5
2020
40
4034 33
33
10
35
40
3525
60
50
40
30
20
10
0
Perc
enta
ge
Mainly women Both men & women
Production
Producers Processors Wholesalers Retailers
Price received(UGX/Kg)
Share ofvalue
550 950 1204 1421
15%18%28%39%
Processing Trading
3.5.1 Estimation of shares of value
Cassava flour value chain pricing map (Figure 3.17) shows that processors buy cassava chips at 550 Ush/Kg from the producers and sell at 950 Ush/Kg to the wholesalers. Wholesalers in turn sell to retailers at 1204 Ush/kg who in turn sell the final product at 1421 Ush/Kg to consumers. To estimate the actors’ share of value (price distribution along the value chain), the margin for each actor were expressed as a ratio of the end (retail) price. In this case, producers’ share of value was 39%, the processors value share was 28%, wholesalers gained 18%, while retailers gained 15%.
In the cassava fresh root value sub-chain (Figure 3.18), the final consumer price is Ush. 850/Kg which is
DEVELOPMENT OF INCLUSIVE MARKETS IN AGRICULTURE AND TRADE (DIMAT) 21
VALUE CHAIN ANALySIS (VCA) OF THE CASSAVA SUb-SECTOR In UgAnDA
shared between producers, wholesalers and retailers. In this case the producers and retailers receive 29% each, while wholesalers receive 42% of the final price paid by the consumer.
Figure 3.18: Share of value for the cassava fresh root sub-chain
Production
Producers Wholesalers Retailers
Price received(UGX/Kg)
Share ofvalue
Trading
250
42%
607 850
29%
Depreciation (DP)
Production factors (PF)
Productionprocess Output (OU)
Intermediateinputs(II)
The estimated shares of value are indicators of how much each agent receives from the total prices. However, they may not be true representations of the gains/losses of the different actors along the chain. This is because different factors of production and their prices - or fixed and variable costs of production - have not been factored in the estimations. In addition, the total production at each node of the chain has not been included and therefore final conclusions cannot be made based on shares of value. For instance, it would be possible to find an actor who enjoys a high share of value, but the gross returns for this agent may be negative. This then builds a case for gross value added estimation.
Figure 3.19 illustrates the estimation of Gross Value Added. The Gross Value Added (GVA), is the difference between the value of the output (OU) and the value of intermediate inputs (II). GVA is a measure of the creation of wealth i.e. the contribution of a given production process to the economy. Note that the new wealth created by a production process is not measured as the value of the output, but rather as the value of the output less the wealth that was consumed to produce it. GVA is gross of depreciation—i.e. it does not include depreciation.
Figure 3.19: Estimation of gross Value added
3.5.2 Estimation of gross Value Added

DEVELOPMENT OF INCLUSIVE MARKETS IN AGRICULTURE AND TRADE (DIMAT)22
VALUE CHAIN ANALySIS (VCA) OF THE CASSAVA SUb-SECTOR In UgAnDA
Table 3.2a: gross value added for different players in the chain (secondary data)
Case 1: FIT Uganda document
Producers Village Assembler Travelling Trader* Urban Wholesalers Urban Retailer
Buying price of fresh cassava/100Kg= 10,000Transport= 1,176Selling price= 12,000
Buying Price/100Kg= 12,245Labor= 700Transport= 3,529Milling= 1,000Packaging= 500District Levy= 200Market Levy= 500Selling price= 20,000
Buying price/100Kg= 20,000Capital= 150Overheads= 250Selling price= 22,000
Buying price= 22,000Overheads= 4,875Other costs= 300Selling price= 30,000
Gross Margin/100Kg= 824
Gross Margin/100Kg= 1,326
Gross Margin/100Kg= 1,600
Gross Margin/100Kg= 2,825
GVA/Kg= 8.24 GVA /Kg= 13.26 GVA /Kg= 16 GVA /Kg= 28.25
Case 2: ASARECA report
Fresh Tubers Cassava Chips Flour
Ploughing/Acre(1st and 2nd)= 40,000Cuttings/Acre= 15,000Planting/Acre= 12,000Gapping/Thinning/Acre= 5,000Weeding/Acre= 80,000Harvesting/Acre= 100,000Total cost/Acre= 252,000Cost/Kg= 63Selling price/Kg= 200
Conversion ratio tubers : chips= 3: 1 Raw material/Kg (63*3)= 189Chopping/Kg= 10Total cost/Kg of chips= 199
Selling price/Kg= 250
Conversion ratio chips: flour = 1 : 1 Raw material/Kg= 199Milling/Kg= 40Total cost/Kg= 239
Selling price/Kg= 450
GVA /Kg= 137 GVA /Kg= 51 GVA /Kg= 211
Source: FIT and ASARECA ReportsAll prices, costs and margins are in Uganda Shillings
In Case 3, primary data collected during the survey was used to calculate gross value added of the various actors. Retailers had the highest gross value added of 551 Ush /kg, followed by farmers with a gross value added of 515 Ush/kg and wholesalers made the least gross value added of 357 Ush/kg (Table 3.2b).
The Cassava value chain in Uganda is characterized by actors dealing in four major products namely; fresh roots, dry chips, flour and crisps. The channels of fresh cassava roots, dried chips and flour involve producers, village assemblers, travelling traders, wholesalers and retailers as illustrated from estimations using secondary data in Cases 1 and 2 (Table 3.2 a).
In Case 1, the urban wholesalers and retailers make the highest margins from the fresh roots channel earning 16 Ush/Kg and 28 Ush/Kg, respectively. In Case 2, the highest margins are obtained by traders dealing in cassava flour making 211 Ush/Kg, followed by producers who get 137 Ush/Kg, while those dealing in dried chips obtain the least gross margin of Ush. 51/kg.

DEVELOPMENT OF INCLUSIVE MARKETS IN AGRICULTURE AND TRADE (DIMAT) 23
VALUE CHAIN ANALySIS (VCA) OF THE CASSAVA SUb-SECTOR In UgAnDA
Table 3.2b: gross value added for different players in the chain (Primary data)
Case 3: FROM KT PRIMARy DATA
Producers Traders Processors Wholesalers Retailers
Ploughing/Acre(1st and 2nd)= 147,000Cuttings/Acre= 98,000Planting/Acre= 52,000Gapping/Thinning/Acre= 24,000Weeding/Acre= 110,000Harvesting/Acre= 116,000Total cost/Acre= 547,000Cost/Kg= 160Selling price/Kg= 520
Raw material/Mnth= 856Transport/Mnth= 1.17Loading/Off loading= 0.19Storage/Rent /Mnth= 0.32Electricity/Mnth= 0.8Water/Mnth= 0.02Taxes/Mnth= 0.15Packaging/Mnth= 0.06Handling/Mnth= 0.05Marketing/Mnth= 0.16Salary= 0.8Total costs/Kg/Mnth= 4.53
Data N/A Revenue/kg = 1,218Purchase/kg = 856Transport/kg = 1.17Loading/offloading/kg = 0.19Storage/kg = 0.32Electricity/kg = 0.80Water/kg = 0.02Taxes/kg = 0.15Processing/kg = 0.81Packaging/kg = 0.06Handling/kg = 0.05Marketing/kg = 0.16Casual labourers wages/kg = 0.19Mgmt salary/kg = 0.47Drivers & turnboys wages/kg = 0.13Total costs/kg = 865Gross margins/kg = 357
Revenue sweet cassava/kg = 1,249Revenue cassava flour/kg = 1,400Purchase sweet cassava/kg = 1,015Purchase cassava flour/kg = 1,033Transport/kg = 3.33Loading/offloading/kg = 2.05Electricity/kg = 2.07Water/kg = 0.78Taxes/kg = 3.29Processing/kg = 15.84Packaging/kg = 2.86Handling/kg = 1.81Bulking/kg = 1.58Casual labourers wages/kg = 1.47Mgmt salary/kg = 4.49Drivers &turnboys wages/kg = 0.63Total costs/kg = 2,097Gross margins/kg = 551
GVA/Kg= 515 GVA /Kg= N/A GVA /Kg= 357 GVA /Kg= 551
NOTE: Costs are in Uganda Shillings
3.6 Linkage of Cassava Value Chain with Meso and Macro-level Institutions
This section explores the intra value chain linkages between the micro level cassava value chain actors (e.g. producers, collectors, processors, retailers), and also the inter linkages between the micro level actors with meso level actors (such as input providers and financial service providers) and macro level actors (e.g. government agencies and development agencies). The linkages are either horizontal or vertical, and the strength/weaknesses of these linkages influence the operation of the chain.
3.6.1 Horizontal and Vertical Linkages of Micro-level Cassava Value Chain actors
Cassava value chain horizontal and vertical linkages start from the input supply stage. Through horizontal relationships, producers share cassava cuttings among themselves. Once cassava matures, two main cassava product chains emerge; fresh and dry cassava.
In the fresh cassava roots channel, village assemblers and fresh cassava traders are the main vertical link between producers and the market. Village assemblers collect and bulk the fresh cassava from the individual producers and sell them to traders. Producer organizations, usually sell the cassava directly to the traders. Traders then sell the cassava to retailers. Some traders have established a linkage, where they sell the fresh cassava roots directly to final consumers, especially schools. Some traders also export the cassava to nearby countries such as; South Sudan, Rwanda and Burundi. At the retail level, some street food vendors buy the cassava from mass market, roast it and sell to final consumers as snacks.

DEVELOPMENT OF INCLUSIVE MARKETS IN AGRICULTURE AND TRADE (DIMAT)24
VALUE CHAIN ANALySIS (VCA) OF THE CASSAVA SUb-SECTOR In UgAnDA
Figure 3.20: Map of Horizontal and Vertical Linkages
The dry cassava value channel is controlled by traders dealing with cassava pellets and cassava chips. These traders sell the cassava to primary processors who mill the cassava to flour. From the processors, three sub-chains emerge. These are the cassava flour, cassava starch and cassava peels which are used for animal feed.
All the interviewed cassava traders did not have contracts with suppliers and only 40% were willing to enter into contractual arrangement. The underlying reasons for lack of contracts are; lack of trust by the farmers, poor quality produce supplied, unreliable supply, price fluctuations, delay in supply and contractual arrangements becoming expensive in the long run.
Bulking /transport
Retailers
Established Linkages
Weak Linkages
Production W.sale/retail
NGOs and Government
Programs
Agro Dealers / Stockiests
Producers
Individual Smallholder Producers
Producer Organizations
Local Agents / Village
Assemblers/ Middlemen/
S ll
Fresh Cassava Traders
Primary
Processing Units
Wholesalers
Final Consumer
Animal Feeds
Export
Animal Feed Wholesalers
Dry Cassava Traders
Secondary
Processing Units
Cassava Roasters/
Fryers
Final Consumer
Retailers
Export
Flour
Starch
Fresh Cassava Processors
Crisps & chips
Input Supply Processing

DEVELOPMENT OF INCLUSIVE MARKETS IN AGRICULTURE AND TRADE (DIMAT) 25
VALUE CHAIN ANALySIS (VCA) OF THE CASSAVA SUb-SECTOR In UgAnDA
Based on these stated factors affecting contractual arrangements, traders recommended that suppliers would have to do the following in order to operate under formal agreements; ensure timely delivery, ensure high quality supplies through postharvest handling, legalize contract arrangements, use of drought resistant varieties, engage in shorter term renewable contracts and provide storage facilities for reliable supply.
About 36% of the processors had contracts with their suppliers, 72% of whom said that the contracts did not satisfy their demand. This was largely due to side-selling and poor quality raw materials. However, all the processors who had contracts with their suppliers were willing to enter into more contractual arrangements. In addition, about 70% of the processors who did not have contracts said they were willing to have contractual arrangements with their suppliers. The remaining 30%, who did not want to have contractual arrangements with their suppliers, cited existence of few cassava growers willing to enter into contractual arrangements (67%) and cassava price fluctuations (33%) as the main reasons.
The following are the conditions currently fulfilled by the processors who had contracts with their suppliers: offering credit support to suppliers especially producers who are the major suppliers, verification of the existence of cassava fields by inspecting them physically and assurance to purchase the agreed volumes. Other conditions recommended are; involving the local authorities when entering into agreements with the suppliers to ensure amicable arbitration in case of disputes, building producers capacity on the benefits of contract farming and enforcement of quality requirements and delivery time of the raw materials to the letter.
0
5
10
15
20
25
30
35
Lacin
Per
cent
Res
pond
ents
29
ck of trustn farmers
P
14
Poor qualityproduce
14
Unreliablesupply
14
Pricefluctuations
14
sDelay insupply
14
n Cost ocontrac
ofct
On the other hand, suppliers are supposed to: supply cassava to the processor without fail throughout the contract period and the cassava supplied should be of agreed quality.
3.6.2 Linkages between Micro-level Cassava Value Chain Actors and Service Providers
Cassava VC actors are limitedly receiving different support services along the chain in the form of finance (mainly loans and savings), extension (mainly to producers), inputs (mainly to producers) and market information (mainly commodity prices).
Out of 25 respondents from cassava retailers, only 28% receive business services from different sources. The major reason for this is that cassava is not considered as a business crop by players as well as institutions or organizations dealing with it, but as a food security crop.
Figure 3.21: Reasons for Lack of Formal Agreements with Suppliers

DEVELOPMENT OF INCLUSIVE MARKETS IN AGRICULTURE AND TRADE (DIMAT)26
VALUE CHAIN ANALySIS (VCA) OF THE CASSAVA SUb-SECTOR In UgAnDA
Figure 3.22: Map of value chain services
Input service providers: The suppliers of inputs in the cassava subsector include; agro-input dealers mostly registered under UNADA, some government programmes like NAADs and NGOs.
Financial service providers: A total of 77 different types of financial service providers categorized under four tiers were interviewed in this study. Tier 1 comprised of banks, Tier 2 Credit institutions, Tier 3 Micro Deposit taking Institutions (MDIs) and Tier 4 all other financial intermediaries including SACCOs, VSLAs, NGOs, risk capital providers such as money lenders and traders who offer pre-financing services to their suppliers. Nearly
Serviceprovider
Banksand MFIs
SACCO VSLAs
LoanssavingTrainings onFinancial literacy
type of service
Inputdealers Producers Aggregator Processors Wholesalers Exporters
Type ofservices
ServicesProviders
NAADS, NGOsBMOs/producer unionsAgro-dealers/stockists
DBICs, FIT(U) NARO, Local fabricators, and
Inputs ExtensionMarket
R & D AgriculturalTechnology
strong linkage weak link
all (96%) finance providers indicated that they offer financial products and services within the agricultural sector. Tier 4 institutions took the lead at 52% (SAACOs at 73%, VSLAs at 20%, NGOs at 5% and risk capital providers at 2%) followed by Tier 1 institutions at 27%, Tier 3 institutions at 20%and lastly Tier 2 institutions at 1% (Figure 3.23). Notably, the financial service providers that are taking lead in agricultural financing are mainly small and medium based institutions rather than large commercial banks.

DEVELOPMENT OF INCLUSIVE MARKETS IN AGRICULTURE AND TRADE (DIMAT) 27
VALUE CHAIN ANALySIS (VCA) OF THE CASSAVA SUb-SECTOR In UgAnDA
Figure 3.23: Type of financial service providers
The main products and services offered by the financial service providers include; loans which are categorized as agricultural, asset, business, microfinance, group, land title processing and animal traction loans. They also provide products such as savings accounts, commodity financing, working capital, financing towards agricultural production and livestock production enhancement, input supplies and trainings in agriculture specifically offered by the VSLAS.
The financial service providers mainly offer services and products to all key players along the value chain namely input suppliers, farmers, traders and processors. The main beneficiaries of the services are farmers (44%) and traders (30%).
Figure 3.24: Proportion of actors receiving financial services
Perc
enta
ge
Financial service Providers
Tier 4 (All otherFinancial
intermediaries)
Tier 1 (Banks) Tier 3 (MDIs) Tier 2 creditInstitutions
1.3
19.5
27.3
51.9
Farmers
3
13%
Traders
0%
10%
3%
Processors
44%
Input supplliers Assemblers

DEVELOPMENT OF INCLUSIVE MARKETS IN AGRICULTURE AND TRADE (DIMAT)28
VALUE CHAIN ANALySIS (VCA) OF THE CASSAVA SUb-SECTOR In UgAnDA
Most of the banks are not ready to directly support cassava value chain players, and financial service providers supporting agriculture seem to be leaning much to other commodities like maize, rice and beans other than cassava. This is mainly because, cassava is not considered as a commercial crop but rather a food security crop and the returns are also relatively low.
Most of the providers of financial services indicated that they prefer lending to individuals rather than groups of input suppliers, farmers, traders and processors mainly due to ease of managing individuals in case of default and availability of the individuals who come to the financial institutions looking for financial support. In addition, loans and account operations are on individual basis and most banks as a policy require collateral which is easier to get from individuals. Market Information Providers: A total of 29 market information service providers were interviewed and the findings showed that most of them (66%) are private
The most popular modes of delivering information are pre-recorded radio programs, mobile phone SMS, Radio/TV talk-shows and field visits to groups (Figure 3.25). The SMS system costs between 50 to 220 Ush/text and was handy in delivering information on prices on domestic markets. A majority (83%) of those interviewed indicated having disseminated market prices than any other type of information.
Electronic mass media which included pre-recorded radio programs and radio/TV talk shows was the most expensive mode of delivering information. At 500,000 Ush/program. However, it was the second preferred (by 28% of the respondents) mode of information delivery. The field visits encompass producer field schools (FFS) and groups formed by NAADS for purposes of delivery of advisory services.
companies including radio stations. Government agencies and NGOs are also involved and these constituted 35% of the providers interviewed. Out of the 29 respondents, 35% were members of relevant association(s) such as the Uganda Business Information Network (UBIN), a component within the United Nations Industrial Development Organization (UNIDO) supported by Uganda Integrated Program (UIP). Arua Business Information Center and Iganga District Business Information center are some of the members under UBIN.
The most common types of information provided cover commodities and inputs prices, quality requirements, areas of demand locally and internationally and a few on consumer preferences. The major clients for the market information providers are producer groups, individual farmers and traders in that order. The information is packaged in the form of printed materials, posters, fliers, SMS, talk-shows, magazines and audio tapes translated into local languages.
114%
14%
28%
8%
%
36%
Field visits Electronic mass media Group trainings
Mobile phone/SMS Internet (websites/emails)
Figure 3.25: Modes of delivery of information
The major sources of information for the market information providers include major markets, the internet, government departments and other market information providers. Government departments mentioned to be sources of information included: NaCCRI, NAADS - District commercial offices, UEPB and Uganda Investment Authority (UIA). Most of the information from these organizations is obtained from their websites or through the various workshops they organize. Market information providers have contacts in the major markets who update them with the current information on prices, demand and supply.
Technical/ business Development Service (T&bDS) Providers: NGOs dominate the provision of BDS, accounting for 35% of the providers interviewed compared to only 17% who are government organizations. The focus of

DEVELOPMENT OF INCLUSIVE MARKETS IN AGRICULTURE AND TRADE (DIMAT) 29
VALUE CHAIN ANALySIS (VCA) OF THE CASSAVA SUb-SECTOR In UgAnDA
services provided by the 52 BDS actors interviewed were R&D, technological advice and extension and agronomic extension. There were very few (4%) of BDS providers dealing with business development and/or issues on the development of structured trade such as Warehouse Receipt Systems (WRS).
Extension services are mainly provided by government institutions (mainly NAADS) and to some extent other NGO’s like CARITAS, World Vision, and FIT. This is mainly through field visits and training. Under the training component, the main focus has been on enterprise selection procedures, pest management, collective marketing, postharvest handling and storage practices and record keeping.
Access to technology in the cassava value chain has been limited to few players. Majority of the innovations are coordinated by the National Agricultural Research Organization (NARO) and local fabricators. The mechanical innovations are developed by the Agricultural Engineering and Appropriate Technology Research Center (AEATREC) of NARO. Public universities like Makerere University in partnership with the private sector involve students in the development of appropriate technologies. Some of the available technologies are cassava graters, cassava pressing machines.
3.6.3 Interventions by Macro-level Cassava Value Chain Actors
Besides linkages between micro and meso-level actors, the cassava value chain is supported by other organizations/institutions at the macro-level. These include bilateral partners, NGOs, government ministries and related agencies and private sector organisations including business development service providers. These organizations have different roles and responsibilities from technology development, dissemination, production, processing, transporting and marketing. They also have projects/ programs related to the various functions of the value chain such as production, bulking, processing and marketing. The roles of these organizations are hereunder discussed.
bilateral organizations: There are quite a number of partners providing support across different stages of the cassava value chain. Many of them are supporting research related activities. These include: Cassava Biotechnology Network, Kawanda Agricultural Research Institute and International Development Research Centre. Others cut across production, bulking, processing and marketing. These include MAAIAF and UCDP. Some focus on bulking and others marketing -TRIAS, USAD-PLA 480-Food Security, NANEC and AfDB while a few others focus on policy related programs - IFAD, World Bank, IFPRI and the EAC.
ngOs and facilitating organizations: Development agencies such as FAO, CARITAS and AFARD dominate provision of BDS to the cassava sub-sector. In addition, district based private development centers such as Soroti Rural Development Agency and Ankole Private Sector Promotion Center provide extension, marketing information and capacity building services to cassava value chain actors.
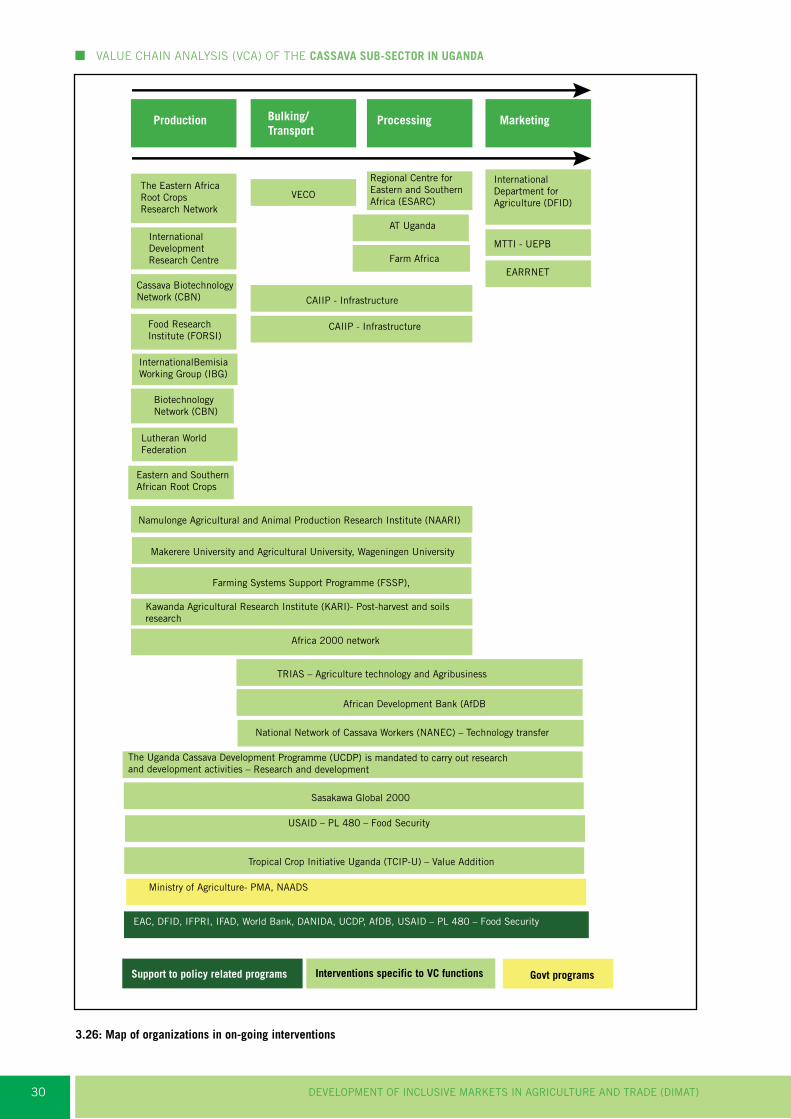
DEVELOPMENT OF INCLUSIVE MARKETS IN AGRICULTURE AND TRADE (DIMAT)30
VALUE CHAIN ANALySIS (VCA) OF THE CASSAVA SUb-SECTOR In UgAnDA
Production
Ministry of Agriculture- PMA, NAADS
Kawanda Agricultural Research Institute (KARI)- Post-harvest and soils research
Bulking/Transport
Processing Marketing
The Eastern AfricaRoot CropsResearch Network
InternationalDevelopmentResearch Centre
VECO
CAIIP - Infrastructure
Regional Centre forEastern and SouthernAfrica (ESARC)
InternationalDepartment forAgriculture (DFID)
MTTI - UEPB
TRIAS – Agriculture technology and Agribusiness
USAID – PL 480 – Food Security
EARRNET
CAIIP - Infrastructure
African Development Bank (AfDB
Africa 2000 network
Tropical Crop Initiative Uganda (TCIP-U) – Value Addition
Namulonge Agricultural and Animal Production Research Institute (NAARI)
The Uganda Cassava Development Programme (UCDP) is mandated to carry out research and development activities – Research and development
Sasakawa Global 2000
National Network of Cassava Workers (NANEC) – Technology transfer
AT Uganda
Farm Africa
Cassava BiotechnologyNetwork (CBN)
Food ResearchInstitute (FORSI)
InternationalBemisia Working Group (IBG)
BiotechnologyNetwork (CBN)
Lutheran World Federation
Eastern and Southern African Root Crops
Makerere University and Agricultural University, Wageningen University
Farming Systems Support Programme (FSSP),
EAC, DFID, IFPRI, IFAD, World Bank, DANIDA, UCDP, AfDB, USAID – PL 480 – Food Security
Support to policy related programs Interventions specific to VC functions Govt programs
3.26: Map of organizations in on-going interventions

DEVELOPMENT OF INCLUSIVE MARKETS IN AGRICULTURE AND TRADE (DIMAT) 31
VALUE CHAIN ANALySIS (VCA) OF THE CASSAVA SUb-SECTOR In UgAnDA
Public institutions: These collaborate to support cassava development and include: The Ministry of Agriculture, Animal Industry and Fisheries (MAAIF) which offers overall guidance and policy direction as provided by the directorate of crop production and marketing. Structurally, the MAAIF consists of the headquarters which focuses on Quality Managed Practises for cassava quality control; seven semi-autonomous organizations and departments devolved to district level. Some of the semi-autonomous bodies and current and planned programs relevant to the cassava sub-sector are NAADS (extension& advisory services) and NARO (research).
In the cassava VC, NARO focuses on intercropping and cultural management, cassava varietal improvement, integrated pest management, cyanide studies and socio- economic studies - adoption.
The National Agricultural Advisory Services (NAADS) has five components namely: advisory and information services to farmers, technology development and linkages with markets, quality assurance - regulation and technical auditing of service providers, private sector institutional development and program management and monitoring and evaluation. NAADS provides the following services to cassava farmers in Uganda: training on good agronomic practices, technology development and promotion, supporting farmers to establish market linkages and market information.
bMOs: Out of the 37 respondents, 14% of the BMOs support cassava at the different stages of the value chain. Most of the different actors along the value chains are affiliated to business member organizations which are apex bodies. The BMOs mainly advocate for a favorable policy environment for their members. All the respondents indicated that the services are for free for as long as an actor is a member of the respective BMO.Some of the BMOs are Busia District Farmers’ Association which had been in operation for 25 years and supports approximately 800 actors along the cassava value chain in Busia sub-county. Apac DFA on the other hand had been operating for 14 years supporting cassava traders and processors in Apac town council subcounty. Masaka district farmers association has supported cassava value chain for 15 years. Other BMO’s which have supported cassava value chain are Shubira Multi-Purpose Cooperative Society and Bugiri District Farmers Association.
Cassava input suppliers access different services from the BMO’s they subscribe to. For instance, Nebbi BMOs advances finance to its members. To be able to stock processing equipment, the input BMOs support their members on condition that they contribute 50% of the total cost of the equipment. Other services offered by the BMOs are support to the input suppliers to; access cassava cuttings which are disease free as well post-harvest handling technologies. Producers too have a range of services they access from the BMO’s such as: extension, capacity building through training, post- harvest handling and storage, market information and access to disease free cassava varieties. Finally,
BMOs serving traders mainly offer market information, extension and information on post-harvest handling techniques.
3.7 Cassava value chain supporting Policies and Institutions
This section discusses some of the policies designed to support development of the cassava sub-sector in Uganda. They are discussed under two key policies of DSIP and Agricultural zoning, agro-processing and marketing policy.
Agriculture Sector Development Strategy and Investment Plan (DSIP): DIMAT is designed to support the implementation of Agriculture Sector Development Strategy and Investment Plan (DISP) (2010/11-2014/15). The DSIP is a guiding vision of an agricultural sector in Uganda that is: “Competitive, Profitable and Sustainable”. The mission is to “transform subsistence farming to commercial agriculture”. Therefore, DIMAT needs to ensure that its interventions directly or indirectly lead to a critical number of producers “graduating” from subsistence farming to farming as business operating sustainable commercial small and medium size enterprises. Certainly the cassava sub-sector provides a good opportunity for this.
To adequately support the mission of DSIP, it is suggested that, with respect to the cassava sub-sector, DIMAT focuses on contributing to the following indicators of DISP:• Percentage of household’s agricultural output
marketed, by district – DIMAT can contribute to this in the cassava sub-sector because a large percentage of the cassava produced by targeted households is already being marketed. The main area of intervention will be to improve the structure of the trade, increase value added by producers, as well as the quality of products sold – so as to ensure profitability and commercial sustainability of the producers’ enterprises.
• Number of processing plants increased – This and other studies have shown that there is a highly developed value chain for dried cassava but few processors. Therefore, DIMAT should focus on postharvest handling and processing. This should be done while supporting medium scale handling and primary processing systems partly owned by producers to enhance success of its interventions in the other indicator above.
• Percentage of rural population using formal banking services – Most financial service providers are not financing cassava related enterprises. However, DIMAT should focus on supporting cost-effective financing models that will support SMEs of producers and other actors in the value chain to build assets and profitability so as to become attractive to formal banking institutions. This is because many “short-cut” approaches have been tried in the past and failed.

DEVELOPMENT OF INCLUSIVE MARKETS IN AGRICULTURE AND TRADE (DIMAT)32
VALUE CHAIN ANALySIS (VCA) OF THE CASSAVA SUb-SECTOR In UgAnDA
• Percentage of farmers who are Farmers Group (FG) members; Number of FGs collectively marketing by district; Percentage change in sales of selected agro-enterprises; and Value of supported agro-processing initiatives by district – supporting this set of indicators is a pre-requisite for other indicators mentioned above.
• Acreage under irrigation as percent of all agricultural land. Agricultural water management and irrigation is critical to profitable enterprises of producers. DIMAT interventions should focus on supporting robust analyses to advocate for investment by others as well as to build technical extension service for management of agricultural water and irrigation.
Agricultural zoning, agro-processing and marketing policy: Cassava is among government’s priority commodities selected by the government for support in Agriculture Sector Development Strategy and Investment Plan: 2010/11-2014/15 (MAAIF, 2010).
With regards to the agricultural zoning, agro-processing and marketing policy for the next five years (i.e. 2010/11 - 2014/15), the Government of Uganda will be pursuing a commodity-focused approach to support value chains that are considered to be strategic enterprises. The strategic commodities to be supported are coffee, tea, maize, beans, cassava, bananas, fish, cattle, beef and poultry. Among the factors that guided the selection of these commodities include: returns on investment (profitability), the zoning criteria, contribution to exports and poverty reducing effect. Coffee, tea, cassava, maize and bananas are the major traditional crops that have always received and continue to receive government support.
Although it is stated that in addition to these specific enterprises, government will continue to promote the
production, marketing and value addition of other commodities through programs such as advisory services, research and regulatory services, it is evident that Uganda’s policies in these areas still do not generally favour the production and wider use of orphaned crops (Naluwairo, 2011)
3.8 SWOT Analysis
The SWOT analysis classifies the internal aspects as strengths or weaknesses and the external situational factors as opportunities or threats. The strengths and opportunities of each actor are first presented and discussed. These are then followed by the weaknesses and threats.
3.8.1 Strengths and Opportunities
Input suppliers: Could exploit the opportunity of supportive government policies to enhance their operations.
Producers: These could take advantage of organizations and institutions supporting cassava R&D such as NARO and CAVA to take up better yielding cassava varieties. These actors enjoy high domestic and regional demand of their produce. The high domestic demand for cassava (42.1%) as well as the external demand (e.g. from Kenya, southern Sudan, DRC, and Rwanda) can be exploited by the producers to ensure they bridge the supply gap. There is also increasing urban demand of cassava due to increase in population. This further presents an opportunity to exploit. The Ugandan government is also establishing the cassava centre of excellence at Namulonge, which will address some of the key constraints to cassava production and commercialization.
Table 3.3: Strengths and opportunities
Input Suppliers Producers Middlemen Processors Traders Consumers
Availability of new technologies
High domestic demand and external demand
Government support
High demand of cassava products
High demand of cassava flour and dried chips by regional and International countries
Availability of new technologies
Available financial services
Support from the government
High demand of cassava
Support from the government
Long shelf life of dried cassava
Available financial services
Developed seed trade- Existence of Uganda Seed Trade Association
Availability of research Institutions & organizations such as NARO
Developed seed trade- Existence of Uganda Seed Trade Association

DEVELOPMENT OF INCLUSIVE MARKETS IN AGRICULTURE AND TRADE (DIMAT) 33
VALUE CHAIN ANALySIS (VCA) OF THE CASSAVA SUb-SECTOR In UgAnDA
Input Suppliers Producers Middlemen Processors Traders Consumers
Lack of awareness of farmers about improved inputs
The perception that cassava is a food crop and not a cash crop
High cost of labor
Limited processing facilities
Limited processing facilities
Lack of awareness of farmers about improved inputs
Unfavorable financial products
Pests and diseasesIrregular supply of cassava
High processing costs
High processing costsUnfavorable financial products
Low commitment to pre-financing
Low soil fertilityPoor transport facilities
Irregular supply of cassava for processing
Irregular supply of cassava for processing
Low commitment to pre-financing
High cost of laborLow volumes supplied
Low volumes supplied
Inadequate extension support Poor quality & inadequate planting materials Poor seed multiplication and delivery systemsUnreliable weather condition
Producers: The major production weaknesses and threats facing cassava farmers were pests and diseases, unpredictable and unfavorable weather conditions, limited access to improved cassava varieties for planting and high labour costs. Others were high production costs, limited extension services, limited land for production, limited access to improved farm equipment and soil degradation.
Middlemen: these are the link between producers and larger traders. Their strength is the good relationship they have and easy access to producers and other traders. They can also exploit the high demand by ensuring that the products from the farmers to traders are of high quality.
Processors: These have the support of the government. They could take advantage of processing cassava into ‘more hygienic’ chips and flour to capture markets targeting confectionaries. Besides, well dried cassava can last longer and supplement other food stuffs during seasons of low supply. In addition, there is demand for exports of cassava products (flour and dried chips) from other countries such as DRC and South Sudan where the same is consumed highly. This is already happening but more opportunities can be tapped.
There is also potentially high demand for industrial use of cassava (up to 10% substitution of wheat flour in bakery, 1000 MT/yr of cassava in manufacture of starch-based adhesives in the paperboard industry and 400 MT/yr in animal feed sector and use of 2,500 MT/yr as an adjunct in the beer industry).
Traders: Cassava production in the country is also increasing and so are consumers and this presents opportunities for the traders to trade in more cassava.
Consumers: Due to their increased demand of quality products, more processors are investing in value addition of cassava. In addition, there is supply of different cassava varieties, which gives consumers a wide range of choice based on their purchasing power.
3.8.2 Weaknesses and threats
Table 3.4: Weaknesses and Threats

DEVELOPMENT OF INCLUSIVE MARKETS IN AGRICULTURE AND TRADE (DIMAT)34
VALUE CHAIN ANALySIS (VCA) OF THE CASSAVA SUb-SECTOR In UgAnDA
Figure 3.27: Cassava production weaknesses and threats
Farmers also face postharvest handling weaknesses and threats such as shortage of tarpaulins for drying, limited access to storage facilities, storage postharvest pests and diseases, labour shortage and thieves that steal cassava after it has been harvested.
The major marketing weaknesses and threats are low cassava prices, limited access to reliable markets, poor road infrastructures, limited access to market information, price fluctuation of cassava and its products as well high transportation costs (Figure 3.28).
Figure 3.28: Post harvest and marketing weaknesses and threats
Processors: The challenges encountered by the processors ranged from poor quality of cassava, irregular supplies and price fluctuations to poor storage facilities (Figure 3.29).
High transportation cost
Price Fluctuations of Cassa and Cassava products
Limited Access to maret Information
Poor road infrastructure
Limited Access to reliable markets
0 10 20 30 40 50 60
55%
18%
14%
9%
4%
28%
28%
25%
9%
7%
3%
Low cassava prices
Thieves at formers level
labour Shortage
Pests
Limited Access to storage facilities
Shortage of tarpaulinsPost
har
vest
Han
dlin
gCh
alle
nges
Cass
ava
Farm
ers
Mar
ketin
g Ch
alle
nges

DEVELOPMENT OF INCLUSIVE MARKETS IN AGRICULTURE AND TRADE (DIMAT) 35
VALUE CHAIN ANALySIS (VCA) OF THE CASSAVA SUb-SECTOR In UgAnDA
Figure 3.29: Weaknesses and threats by Cassava Processors
Traders: There are two main categories of weaknesses and threats facing cassava traders; 1) those emanating from the suppliers (farmers) and, 2) those that affect cassava sector as a whole. The first category includes; poor quality of produce supplied, inadequate supplies, transport problems, high prices, few processors to handle large quantities, delay in delivery of supplies, price fluctuations, lack of efficient farming machines.
Figure 3.30: Challenges faced by Traders When Dealing with Farmers
Retailers: The marketing weaknesses and threats faced by retailers include; poor quality of delivered cassava and its products (49%), price fluctuations (18%) and irregular supply during off-season. Others were limited capital, faulty weighing scales and high cassava prices from traders.
Challenges
Perc
enta
ge
44.4
22.2
Poor storagefacilities
Poor driedCassava
IrregularSupply
PriceFluctuation
22.2
11.2
Low Cassava Supplies
Limited sources of market information
Limited Technical expertise
Inadequate Funding
Bad Roads
Poor Quality of Cassava
Unfavorable climate conditions
0 15105 20 25
24%
17%
17%
12%
7%
8%
8%
7%
Increasing prices of cassava
Over
all C
assa
va S
ub-s
ecto
r Ch
alle
nge

DEVELOPMENT OF INCLUSIVE MARKETS IN AGRICULTURE AND TRADE (DIMAT)36
VALUE CHAIN ANALySIS (VCA) OF THE CASSAVA SUb-SECTOR In UgAnDA
Figure 3.32: Challenges Faced by Retailers
Perc
enta
ge
Challenges
48.7
17.9
10.37.7 7.7
5.12.6
Poor qualityof cassavasupplied
PriceFluctuations
Limitedcapital
Faultyweighing
scales
Untimelysupply
Low/irregularsupply volumes
Highcassavaprices

DEVELOPMENT OF INCLUSIVE MARKETS IN AGRICULTURE AND TRADE (DIMAT) 37
4.1 Lessons from Cassava Situation AnalysisCassava is the second most important staple crop in Uganda produced by 3.12 million households with a majority of the producers having between 1 and 2 acres of farmland. The sub-sector also has MSMEs of traders and brokers and has the potential to potential to reduce poverty through increased productivity and food security.
Farm level productivity of fresh cassava roots is relatively low at 12 MT/Ha which is comparable to that of Africa as a whole (6 – 10 MT/Ha) but below the world average of 40MT/Ha. However, based on on-farm trials, some key cassava varieties have a potential of producing 75 – 90MT/Ha hence a huge potential to increase cassava productivity in Uganda.
The key cassava production areas in Uganda are the northern and eastern parts of the country with a 70% share of the cassava produced by volume. Therefore, targeted enhanced productivity in these regions is a strong option for addressing poverty as these areas also have higher incidences of poverty in the country.
Given the sharp decline in cassava production recorded in 2005/06—attributed to cassava brown-streak virus and cassava mosaic disease--and the subsequent recovery recorded between 2007 and 2011, farmers are clearly adopting the resistant, highly productive and early maturing varieties. The survey results showed that 70% of the farmers are planting up-to four (4) varieties that have characteristics of resistance, higher productivity and are highly demanded.
Per capital cassava consumption in Uganda is estimated at 96kg per year. Drivers of fresh cassava include: high demand in famine areas, the need to keep food stocks of cassava available at household level, affordability (low prices), the desire for alternative sources of starchy foods in households, and ease of preparation. About 80% of all the cassava consumed is fresh, while 20% is consumed as flour.
There are recent initiatives to improve the beta-carotene and protein content of cassava as well as delaying its physiological deterioration. These are all aimed at improving the value of cassava as a food security crop. Cassava sub-sector also has the potential to reduce poverty through enhanced value-addition.
4 SUMMARY
4.2 Lessons from Cassava Value Chain Analysis
4.2.1 Functional Analysis and meso-level linkages of value chain
There are three main sub-chains in the cassava value chain: 1) fresh cassava roots sub-chain which ends with fresh, boiled and/or roasted cassava being sold to consumers; 2) cassava flour sub-chain (including pellets) and animal feeds; and 3) cassava chips sub-chain. The recorded traded cassava flour and pellets constitute 70%, while cassava chips consitute 25% of the fresh cassava produced. This implies that, proportion of traded fresh cassava roots is low (5% and below). There is a well developed value chain for dry cassava, perhaps due to the long shelf-life and the possible derivatives from it such as chips and flour among other industrial uses.The inputs part of the cassava value chain is dominated by NGOs. This could be explained by the more recent need to distribute highly productive varieties that are resistant and the need to promote food security in the hunger prone areas. It also reflects potential involvement of the private sector in the seeds supply chain in the medium to long term.
About 65% of the recorded trade takes place among traders and processors and only 35% is taking place between farmers and traders/processors. Traders and processors are therefore the most important actors of cassava trade in the sub-sector. The least recorded trade transactions are between producer organizations and others in the sub-sector (15% of the total trade in the sector). This highlights the opportunity to integrate more producer groups and farmer organizations in the different cassava sub-chains.
Analysis of trade flow shows that, local traders and brokers provide the first and biggest off-take opportunity of fresh cassava producers. This is further confirmed by the strong linkages in the fresh cassava channel starting right from the input (cassava cuttings) supplied by individual farmers through to the retailing of fresh cassava.
Value addition to fresh cassava enhances the chances of earning higher incomes across the chain. Farm gate price of fresh cassava roots range from 250 Ush/Kg to 350 Ush/Kg. Retail prices of cassava flour average 1,400 Ush/Kg, those of cassava pellets average 1,000 Ush/Kg while those of fresh cassava roots average Ush. 850/Kg. Thus, farm gate producers capture less than

DEVELOPMENT OF INCLUSIVE MARKETS IN AGRICULTURE AND TRADE (DIMAT)38
VALUE CHAIN ANALySIS (VCA) OF THE CASSAVA SUb-SECTOR In UgAnDA
30% of the retail price of fresh cassava, while traders and processors capture up to 70% of the retail prices.
While this may reflect the advantage of arbitrage and the need to cover marketing costs, such a high proportion of price captured also provides more scope for improving profitability than is presently available at the producer level. Farmers involved in the trading of cassava flour are capturing up to 70% of the retail prices. This shows a potential 40% increment in captured prices. This increment in captured price however, does not take into consideration the risks and investments farmers would incur to participate in cassava flour sub-chain.
Men and Women are engaged at all levels of the chain. At the production level, the involvement of women is high and there is gender balance in activities such as planting, weeding, and harvesting. Men tend to dominate in land preparation and marketing activities, while women dominate in planting and harvesting activities.
All other core processes along the chain are dominated by men especially trading, transportation, wholesaling and retailing. In these processes, men dominate both the managerial and casual employment opportunities. In addition, remuneration among the actors upstream of the chain, especially trading is higher than at the lower levels. The largest disparity in remuneration is however, reported between the traders and all others in the chain. Thus, there are strong incentives for those lower in the chain to upgrade or those in retailing to integrate backwards.
All actors in the chain reported that, the most prevalent way of price setting is through negotiation and to a lesser extent, use of the prevailing market prices. This implies that, farmers with access to market intelligence and those closer to the markets are benefiting more than those upstream in the chain. Traders and processors reported an annual unmet demand of between 10 – 15% of their expected quantities. This could be attributed to low cassava volumes and pests and diseases.
The best off-take opportunity for farmers in the cassava pellets sub-chain is by processors who take 40% of the volume, compared to 20% off-take by local traders. This is also confirmed by the reported strong linkages in the cassava flour channel that starts with individual farmers supplying cuttings through to wholesale and retails points in the chain. Beyond these points, linkages are stronger with consumers, but very weak with food processors. This provides a strong opportunity for developing the linkage with the food processing sector.
At industrial level, demand for cassava is driven by demand for ethanol and cassava starch in the pharmaceutical and food industries. However, even with the high demand for starch, importers of starch prefer that made from maize to that from cassava. The end market channel for animal feeds is also notably weak, in spite of its potential.
There are different service providers for all actors in the cassava value chain. In financial services, the main sources of finance for all actors along the value chain are SACCOS and MFIs. Most financial service providers
(62%) charge high interest rates (between 23%-30% per annum), which limits the value chain actors from accessing credit.
There are strong linkages between agricultural technology providers and actors along all the stages of the value chain. The main technology providers are NARO and the private sector, including local fabricators. Notable weak links are between research and development, and the inputs and production stages of the chain.
4.2.2 Sector Polices and Macro-level linkages
There are quite a number of organizations providing support across different stages of the cassava value chain. The Ministry of Agriculture provides overall guidance and policy direction for the sector. Others include; Cassava Biotechnology Network, Kawanda Agricultural Research Institute and International Development Research Centre, UCDP, TRIAS, USAD-PLA 480-Food Security, NANEC, AfDB, IFAD, World Bank, IFPRI, ASERACA and the EAC.
Actors along the chain have subscribed to different BMOs. Cassava producers get free services from BMOs, as long as the producers are registered members of the BMOs. Such services include capacity building through training, extension services, post-harvest technologies, market information and access to disease-free cassava varieties. However, most of the BMOs are still weak and cannot adequately provide the services required by their members. Other support institutions include market information providers and extension service providers. They have potential for establishing formal linkages
Generally, Uganda’s policies still do not generally favour the production and wider use of orphan crops. However, cassava is recognized as one of the priority crops in the agricultural zoning, agro-processing and marketing policy.
4.3 Lessons from SWOT Analysis
The study identified a number of strengths, weaknesses, opportunities and threats to the various actors along the cassava value chain as listed below.
4.3..1 Strengths
• The sub-sector has a critical mass of actors at each stage of the chain and this gives a very strong basis for upgrading the value chain.
• There is availability of proven products, affordable technologies and practices for improving cassava productivity and quality of final products.
• There are a significant number of large off-takers in the sub-sector that can facilitate efficient access to markets.
• Cassava can be planted at any time of the year, provided there is enough moisture for the stem cuttings to take root. As a result, farmers grow the crop all year round.

DEVELOPMENT OF INCLUSIVE MARKETS IN AGRICULTURE AND TRADE (DIMAT) 39
VALUE CHAIN ANALySIS (VCA) OF THE CASSAVA SUb-SECTOR In UgAnDA
4.3.2 Weaknesses
• Trade along the chain is unstructured e.g. there is lack of enforcement of standard rules, lack of fool-proof quality assurance systems and low trust.
• There exists a weak vertical integration among the players in the chain.
• Players along the chain operate small economic units e.g. small farms, small premises and are unable to take advantage of economies of scale.
• There are weak or non-existent value chain institutions; and their numbers are low to cause noticeable influence along the chain.
• There is weak technology transfer to take advantage of new technologies adopted by other countries throughout the value chain, in particular production (new varieties, and best practices) and processing (new technologies, better management techniques).
4.3.3 Opportunities
• There is high domestic demand for cassava (42.1%) as well as the external demand (e.g. from Kenya) which can be tapped by the producers as they ensure they bridge the supply gap.
• Cassava can be processed into ‘more hygienic’ chips and flour which lasts longer than fresh roots and therefore can supplement food needs during off-peak seasons.
• Processing of cassava into high value products like starch and ethanol fetches higher prices. For example; total national demand for ethanol was 16,435 MT (valued at about USD 17M in value) in 2010. This was consumed by laboratories in schools, hospitals, distillers etc. A litre of ethanol is sold at Ush. 15,000 (diluted) or Ush. 50,000 (concentrated). Competition is still very low, as almost all ethanol is currently imported into the country (Kilimo Trust, 2012).
• The Ugandan government has established the cassava center of excellence at Namulonge, which will address some of the key constraints to cassava production and commercialization.
• There is potentially high demand for industrial use of cassava (up to 10% substitution of wheat flour in the bakery industry, 1,000 tonnes of cassava required in manufacture of starch-based adhesives in the paperboard industry, 400 tonnes required in animal feed sector, use as an adjunct in the beer industry (2,500 MT required per annum).
• Potential for more produce from farmers if market is guaranteed and brought closer to the farmers to reduce transportation costs.
• Presence of organizations and institutions supporting cassava R&D such as NARO, CAVA, ASERECA, IITA.
• There is willingness by market off-takers to enter into formal contracts with producers.
• There are new varieties being released to combat cassava brown streak disease (CBSD) to increase supply of disease free cassava.
• Industries are lobbying with Government of Uganda introduce ethanol as fuel for cars; if this is successful then large quantities of cassava to produce ethanol.
4.3.4 Threats
• Inadequate infrastructure to effectively connect different VC actors located in different geographic areas.
• High district level levies
• High costs of power and frequent power outages
• High transport costs
• Inadequate supply of raw cassava as raw material for processing.
• High and prohibitive interest rates and the fact that the banks are not willing to finance cassava enterprises
• High competition from other substitute products such as maize and sorghum.
• Fresh cassava trading is driven by the high perishability of the roots and by the price premium that consumers are willing to pay for freshness.
• Lending to the food marketing sector is not only constrained by high transaction costs and poor loan security but also by conservative attitudes among potential borrowers.

DEVELOPMENT OF INCLUSIVE MARKETS IN AGRICULTURE AND TRADE (DIMAT)40
VALUE CHAIN ANALySIS (VCA) OF THE CASSAVA SUb-SECTOR In UgAnDA

DEVELOPMENT OF INCLUSIVE MARKETS IN AGRICULTURE AND TRADE (DIMAT) 41
5.1 Preliminary Outlines of Potential Interventions
Results from the SWOT analysis were used to identify potential areas of intervention as shown in the matrix of intervention (Table 5.1). These are classified in to short term, medium term and long term interventions.
5.1.1 Proposed Short Term Interventions
The interventions proposed in the short-term would be designed to enhance and to put into place the identified strengths in the cassava value chain in Uganda, so as to fully utilize opportunities available to the sub-sector. There are four such interventions as discussed below.
a. Expand the utilization of existing technologies, products and practices to exploit markets: Post-harvest handling technologies such as chipping and sun-drying albeit rudimentary, are practiced by various actors along the cassava value chain. Due to the fact that cassava is mainly consumed as fresh roots or flour at household level, there has not been much incentive to ensure quality of these products. However, for industrial use, quality of cassava is of utmost importance especially in the face of competition from traditional substitutes such as wheat (in the bakery industry) and barley (in the brewing industry). With sensitization of actors on the need to ensure quality of cassava right from the farm using basic post harvest technologies, the good features of cassava products such as the right moisture content and colour can still be achieved at low or no cost. These measures would be a good starting point but it should be noted that to exploit available opportunities in production of cassava and cassava products, there would be need to invest in more advanced technologies such as artificial drying technologies. Adoption of these technologies would influence the demand for cassava products such as HQCF which is already being experimented by bakery, brewery and the paper industries in Uganda. Indeed, a study by CAVA (2012) revealed that 805 tonnes of HQCF was sold between March 2011 and March 2012. The pull from increased industrial demand of cassava products is clear evidence that there will be increased demand and evolving uses of cassava products that warrants investment in the sub-sector.
b. Facilitate multiplication of improved cassava varieties at community level: Among the key weaknesses and threats include; pests and diseases, low yield which is associated with limited utilization of improved varieties and perceptions that cassava is a subsistence
5 RECOMMEnDATIOnS
crop. However, there is potential opportunity for commercialization as exhibited by substituting wheat with cassava products in the confectionary industry. To exploit this potential, a viable entry point would be increasing production of cassava. This can be achieved through facilitation of adoption of improved cassava varieties which have higher productivity than the traditional varieties. A step towards this course could be organization of farmers into groups that can engage in improved cassava cuttings multiplication, which can then be disseminated to farmers. To roll out distribution of initial cassava cuttings, relevant stakeholders such as development agencies and district authorities would buy and sell the same to other producers at subsidized rates. The result would be; high incomes for the cuttings multipliers and high adoption rates of improved cassava varieties by producers which will ultimately boost cassava production.
c. Strengthening market linkages among actors of cassava Value chain: Market linkages connect all micro-level chain actors with the available markets but also with meso and macro-level actors. However, to the high perishability of the commodity and the fragmentation of trade in cassava, there is minimal drive for innovations in cassava uses. In addition, there is little organization of actors at any level of the cassava value. Consequently, supply of fresh cassava and cassava products is inconsistent and access to vital support services such as extension and finance is greatly hampered. There is also low demand for cassava produced for other uses other than food. Cassava market is driven by seasonality with low prices during harvest period. Facilitating market linkages by aggregation of actors especially at production level will be a big boost to bridge the gap between demand and supply and also value chain support services.
d. Innovative financing of the cassava value chain: Limited financing of agricultural value chains coupled with decreasing Official Development Assistance (ODA) is commonplace in Uganda and the cassava value chain is not an exception. Although there are modest measures towards making cassava sub-sector attractive to investors by showcasing high value cassava products such as HCQF, the chain is still majorly overlooked by the mainstream financial institutions. In addition, investment into processing of high quality cassava products requires high investments. However, innovative financing mechanisms such as; establishment of community based lending, saving associations and leasing of processing technologies would catalyze investment into the cassava sub-sector and make it a viable enterprise that would ultimately attract attention of
DEVELOPMENT OF INCLUSIVE MARKETS IN AGRICULTURE AND TRADE (DIMAT)42
VALUE CHAIN ANALySIS (VCA) OF THE CASSAVA SUb-SECTOR In UgAnDA
systems: As has been noted in other sections of this report, poor storage and post harvest handing methods of cassava and cassava products contribute to losses and low demand by potential industrial users. Storage of fresh cassava is constrained by perishability of the roots. This underscores the importance of development of innovative and cost effective post harvest and storage systems of dried cassava either as chips or flour particularly at farm level. As such, producers need to be sensitized on elementary post harvest handling and storage methods such as drying cassava in clean tarpaulins, isolation from potential contaminants and use of storage facilities that will enhance rather than deteriorate quality of dried cassava.
5.1.3 Proposed Medium Term Interventions
The interventions proposed for the medium term would be designed to enhance and to put into use the identified strengths to reduce and/or mitigate the effect of the threats to the cassava sub-sector. It is recommended that the interventions should focus on strengthening extension service provision to increase adoption of disease tolerant cassava varieties so as to fully respond to the expanding markets for main products and by-products of cassava. This will be done using the following approaches at the various levels.
a. Economies of Scale at Production: At the production level, farmers need to produce more competitively. Exploiting economies of scale is one of the most important factors towards being more competitive. This can be achieved via collective actions (marketing / trading) that enable farmers to gain from reduced input costs and increased output prices.
b. Improved production systems: This would be through increasing farm level productivity, reducing costs of production per unit of output, increasing product value while maintaining or lowering cost of production, improving agronomic practices, and improving multiplication and distribution of farmer preferred varieties.
c. Improve dissemination of extension services: through improving linkages with other agencies such as NGOs, donors, private sector and international research agencies to enhance research funding base.
d. Support formation and capacity building of farmers to engage in collective marketing and also purchasing of farm inputs.
e. Improve post-harvest handling: this will be through utilizing drying technologies and improve processing technologies for cassava chips and flour to achieve desired attributes and improve linkages between farmers and processors in urban centers.
f. Marketing interventions: At the market linkage level, all development partners are recommended to assist producers and processors towards a more cohesive, competitive, market-led agricultural sector. There is need to establish a marketing analysis unit in each of the selected regions to undertake market analysis and provide market intelligence.
other financiers. Such innovative instruments would leverage private investment into the cassava value chain that would benefit all actors across the chain.
5.1.2 Proposed Short - Medium Term Interventions
The interventions proposed for the short to medium term would be designed to remove the identified weaknesses in the cassava value chain to fully utilize opportunities available to the sub-sector. There are three such interventions.
a. Development of structured trade for cassava in Uganda: The problem of lack of trust could be reduced by: adopting improved varieties that would act as an incentive to adopt the warehouse receipt system (WRS); out-grower schemes built around mini-estates and processing enterprises (MEPE) owned by cooperatives of producers; and the adoption of a private sector driven code of “Good Agricultural Practices for Uganda Cassava” (GAPUC). Another major deterrent of development of the cassava value chain was lack of assured supply and market on the part of the processors and producers of cassava, respectively. Cassava is produced in large volumes that can satisfy the processors demand but, there is little demand from the processors who would not want to develop a dependency on cassava as a substitute raw material because supply of the same is not assured. For example, Britannia—a potential industrial user of HQCF--had an unfortunate experience when, after some successful trials using cassava flour, they were badly let down when the supplier who had committed to supplying cassava failed to deliver the required quality at the correct time (CAVA,2012). To curb this, development of structured trade models such as contract farming will ensure that there is a consistent demand from cassava processors to warrant sustained supply from producers. Implicitly thus, aggregation of cassava producers to facilitate bulking and collective marketing of cassava will be necessary. Furthermore, these groups will have an incentive to ensure high quality of cassava and cassava products as demanded by the processors.
b. Strengthen cassava value chain institutions to improve governance of the chain:
c. Poor quality of cassava products such as dried chips and flour (HQCF) hinder uptake of the same as raw material into several industrial uses. Although there exists standards to ensure quality of cassava products, they are seldom enforced to the detriment of market demand. Ultimately, production of this high quality cassava product depends on post-harvest handling right from the farm and the subsequent stages that lead to eventual processing of cassava into HQCF. The biggest culprit of poor quality is contamination with foreign materials and E coli. As such, quality assurance and traceability mechanisms need to be enhanced if commercialization of cassava products is to be exploited to the benefit of cassava value chain actors.
d. Facilitate access to storage and post harvest handing

DEVELOPMENT OF INCLUSIVE MARKETS IN AGRICULTURE AND TRADE (DIMAT) 43
VALUE CHAIN ANALySIS (VCA) OF THE CASSAVA SUb-SECTOR In UgAnDA
g. Improving access to market information: This is a necessary, cost effective and simple means of providing vital, decision-making information on market dynamics to cassava farmers.
h. Institutional support through: 1) public-private sector partnerships for improved response to plant nutrition practices, research infrastructure, training of scientists, farmers, organizations and cassava Networks; 2) development and supporting institutional links along the commodity chain to promote market efficiency; and 3) coordinate all cassava activities among various institutions in the country through establishment of a cassava working group.
i. Fresh cassava storage: Research should be conducted into the feasibility of adapting CIAT/NRI fresh cassava storage technology for use by Ugandan traders. Costs and benefits to the traders should form the central theme of the research.
j. Supportive policy and institutional arrangements: Policy should be directed towards more efficient production systems that lower per unit cost of production while increasing yields.
k. Assure continuous availability of planting material: The development of new varieties of cassava has increased the options of genotypes that farmers have to meet the varied requirements from cassava for home and market. In Uganda, mean on- station yields has increased over the last ten years from about 8MT/ha for local cultivars to about 50MT/ha for the improved genotypes. Although IITA has developed improved varieties which are now available across the region, adoption has been rather slow as a result of limited capacity for multiplication and distribution. Regional NARS have formed partnerships with local and international NGOs to accelerate the phase of multiplication and distribution of the material.
Interventions of others in post-harvest
a. CIAT has developed storage technology that increased fresh cassava shelf life from three days to between two and three weeks. It relies on the selection of good quality roots, which are bagged in polythene soon after harvest. The high humidity that develops in the bags significantly reduces perishability but also promotes fungal growth. The latter is controlled by dipping the roots in fungicide before bagging. However, commercial application of this technology to supply Colombian supermarkets with fresh roots failed. The reasons for failure are not entirely clear, although high cost of using the technology has been suggested. An alternative explanation is that, individuals who had vested interests in maintaining the status quo of the fresh cassava trade, applied pressure on the technology adherents to cease their activities.
b. NRI subsequently adapted the technology for use in Ghana and Tanzania. Storage costs were reduced by avoiding the use of fungicides and by simplifying packaging requirements. Although uptake has been low, NRI staff involved in the project has expressed confidence in the technology’s efficacy and believe that insufficient resources were spent on promoting it
to the intended beneficiaries. If simple fresh storage techniques prove effective in the Ugandan fresh cassava trading, then at least some of the efficiencies outlined above could be realized and ultimately reduce the cost of fresh cassava marketing for the benefit of farmers, traders and consumers.
Interventions on development of innovative and accessible financing models:
a. Travelling traders who regularly supply Kampala’s market co-operate to regulate the supply of fresh cassava. They do this by agreeing to space their arrivals in the market evenly throughout the week, thereby avoiding volatile daily prices. The co-operation also extends to the creation of an informal revolving credit fund, which traders contribute to and then utilize on a rotating basis. This example of innovation within the fresh cassava marketing underlines the dynamism of the system and can be emulated across the chain.
b. There is need to provide both the encouragement and the correct legal environment for the formation of trader associations. Formal lenders could reduce their transaction costs by lending to the association rather than to a number of small traders. Loan security could be improved if the association possesses physical assets (such as a warehouse) or if association members’ stock can be used as collateral by holding it in secure warehouses (inventory credit). Both approaches would require tightening of legislation to allow lenders to seize the collateral of defaulting borrowers.
c. Investigate different finance options to improve rural finance, including loans to farmer associations and venture capital arrangements with specialist organizations, traders and processors. Retailers are not only constrained by lack of capital, but also by poor business skills and risk averseness. Innovative solutions to these constraints will have to be found if consumers and entrepreneurial retailers are to benefit from retail economies of scale.
d. Liquidity problems limit the scale of individual trading businesses, leading to significant cost inefficiencies at the retail and wholesale levels. Very few traders interviewed during our surveys reported access to formal credit, although most claimed to borrow informally at zero rate of interest from friends and family. Even with more formal credit, cautiousness among traders might well limit its uptake. Several traders regarded formal loans as risky because they entail regular interest and principal payments. This attitude reveal booms and burst in business performance leading to periods when formal loans could not be serviced, but may also indicate that periodic demand for money to pay domestic bills would compete with loan repayments. Ultimately, increasing the amount of capital available to traders can only be achieved through increase in affordable (low interest rate) lending, which in turn relies upon low transaction costs and good loan security. These ideal conditions for lending to small businesses are far from being achieved in Uganda. One approach is being followed by USAID, which acts as a loan guarantor for traders who borrow from commercial banks.

DEVELOPMENT OF INCLUSIVE MARKETS IN AGRICULTURE AND TRADE (DIMAT)44
VALUE CHAIN ANALySIS (VCA) OF THE CASSAVA SUb-SECTOR In UgAnDA
e. Capital is less of a constraint for village assemblers and as well as chips assemblers handle would help to bring down drying costs. It would be prudent to encourage drying innovation at this level though the profitability of this activity should be assessed before any moves towards technology adaptation and promotion are made.
Interventions for Development of mechanisms to deal with flooding: This is in the floods prone areas which also happen to be the major cassava growing areas. This will involve working in collaboration with the departments of Early warning systems to;
a. Construct dams to stop excess water from inundating farms.
b. Divert floodwaters away from populated areas to planned areas of flood storage where flood control reservoirs are maintained partially empty to take in floodwater when the need arises. These reservoirs will then release the water at a slower rate than would occur under flood conditions and give the soil time to absorb the excess water.
c. “Hazard zoning” flood plains and “minimizing encroachment”. In hazard zoning, planners look at historical records of 40-year floods, geological maps and aerial photographs to predict likely areas where flooding could occur. Rather than relocating populations, hazard zoning is used for planning the location of new settlements. Minimizing encroachment means carefully planning where buildings are located so that they do not restrict the flow of water or cause water to pond excessively; however, as long as people choose to live in low-lying, flood-prone areas, scientists and engineers can only do so much to protect them from the risks of floods caused by both natural conditions and human activities.
5.1.4 Proposed Long Term Intervention
The interventions proposed for the long term would be designed to remove the identified weaknesses to reduce and/or mitigate the threats facing the cassava sub-sector un Uganda. There is one such intervention being recommended and it is considered long term because, without raising market efficiencies, it would be difficult to achieve commercial adoption of productivity-enhancing technologies and practices.
a. Improvement of infrastructure like valley dams, roads and rail to facilitate transportation of cassava to urban markets, and strengthening of enforcement mechanisms for cassava quality standards.
b. Improve the legal framework for trade and enforcement of regulations to build trust and equity in the market place and along the commodity chain.
c. Ensure that Government policy supports that access to information is also improved in the rural areas via radio, telephone and internet. Other measures would include reduction of the number of roadblocks and other forms of control that increase the cost of marketing.
d. Develop private sector support groups and work closely with private sector associations. Cohesion of these sectors should be encouraged so as to ease lobbying the Government and donors.
e. Several wholesalers claimed that they deliberately hold stocks in order to take advantage of inter-seasonal price movements while others claimed hoard stocks storage if they had sufficient capital. There is therefore a clear need for better planned wholesale markets. The new markets should provide affordable facilities that will optimize the efficiency of food delivery and storage, while maintaining good sanitary conditions and easy access for retailers. Improve physical market infrastructure in the major urban centres (space, storage, sanitation etc.) to reduce transaction costs at the market level. The development of such markets can only be achieved by close consultation between urban authorities and traders.
f. Flour quality declines significantly during the wet season, which in combination with a general scarcity of chips of all grades leads to higher prices during the wet season. In theory, significant benefits could be derived from a technology that could dry cassava effectively during the wet season. Farmers (the principal dryers of cassava) would gain more income, prices would be lower for urban consumers and national food security would improve.
g. Theft of cassava and cassava product is reportedly common place, due to the open market arrangement. Sensitization and lobby for appropriate market infrastructure will help to build long-standing relationships between travelling traders and their commission agents and help build an atmosphere of trust.
h. Transport charges are among the highest marketing costs. This is because fresh cassava traders are unable to easily hire trucks elsewhere except in Kampala. Transport costs between farms and the assembly points are disproportionately large. For dried cassava, the farm-assembly point journey costs between Ush. 1.2 and Ush. 2.4 /kg/km, whereas transport between the assembly point and the market costs approximately Ush. 0.1 to Ush. 0.14 USh /kg/km. Local transport will always be more expensive than long-distance transport but in this case, the large discrepancy in costs suggests that public investments in local access routes and intermediate forms of transport should be appraised alongside investment in feeder and trunk roads. It may be that the benefit cost ratios of the former types of investment are higher.
Interventions in Popularizing of alternative industrial uses of cassava
a. Increase utilization: This will be done through; a) diversifying consumable cassava products, b) improving the quality and standardization of existing products through improved technologies, c) promoting industrial use of cassava especially in the animal feeds, food and other industrial applications, d) developing and disseminating appropriate feed meal formulations for different stock, e) developing and disseminating cassava recipes and extension

DEVELOPMENT OF INCLUSIVE MARKETS IN AGRICULTURE AND TRADE (DIMAT) 45
VALUE CHAIN ANALySIS (VCA) OF THE CASSAVA SUb-SECTOR In UgAnDA
manual for use in nutrition training by extension staffs, f) promoting industrial use of cassava such as in large-scale milling and confectionary
b. Industrial processing of cassava is still underdeveloped and Uganda can benefit from further commercialization and improvement of home, village-level and large scale processing of animal feeds, starches for food and other industry e.g. improvement of processing and presentation of chikwangue in DRC and Burundi. Increased understanding of the cassava chain will pave way for value-addition. New cassava varieties, machines for processing and techniques will lead to better incomes for the same amount of farm investments. COSCA studies have indicated that where processing technology and market innovation have taken place such as gari in Nigeria, adoption levels of improved technologies have been higher. As industrial use of cassava becomes a major focus, demand for special varieties with high starch content, longer shelf life or high soluble sugars is expected to rise. Recent evidence suggests that, market assisted selection may be effective in selecting these traits.
c. The focus at household level should include improving the quality of cassava chips that is processed for marketing. Additional attention should also be given to training of farm households to diversity their processed cassava products which may include baked products, home based animal feeds compounding etc. Due to the fact that each individual household only manages small quantities of cassava chips for markets, community level bulking and grading should be encouraged.
d. Cassava starch has high potential for growth, both for industrial and human uses. Unmodified starches might be changed by using micro-organisms to meet specific market needs. Focus should then be promotion of production of cassava starch for the food industry and industrial use such as in packaging industry.
e. Interventions that assure access to quality and quantity of cassava to starch processors would encourage investment in this area. Again, this calls for strong linkages between producers and industrial users of cassava.
f. Cassava flour has potential in many developing countries, particularly in Africa where there is a large consumption of bread made from 100 percent imported wheat. The use of cassava flour in the
baking is currently hampered by inefficient market supplies, lack of quality and standards and poor image of cassava especially among urban consumers. Interventions should focus on improving the quality of cassava flour supplied to the baking industry by addressing processing technologies for cassava chips, drying, storage and transportation to avoid contamination. Research will be needed to evaluate different proportions of cassava/wheat flour, working in partnership with the bakery industry.
g. The other potential intervention is to support flour millers to package the flour in attractive packages for sale in supermarkets. This will also require introduction of grading and standards of the flour and the chips from which the flour is milled.
h. Specific policy measures include; a) promoting cassava for food security, b) making a deliberate attempt to promote improved processing technologies for cassava, c) revising punitive taxes that discourage cassava trade and, d) promoting market efficiency through provision of information.
Possible interventions by UnDP
a. UNDP should take advantage of the existing cassava producers across various agro-ecological zones in Uganda and improved cassava varieties to mobilize and facilitate mass production of planting materials of different varieties by the cassava producers. This will have double-dividends of income generation by the producers multiplying the cuttings and acceleration of adoption of improved cassava varieties that are disease tolerant and higher yielding.
b. Marketing stage of the cassava value chain has been overlooked by previous and on-going interventions. As such, UNDP should facilitate development of market linkages by encouraging bulking of cassava and collective marketing.
c. UNDP should also offer training on processing of cassava into High Quality Cassava Flour (HQCF) and facilitate acquisition of processing technology by interested investors.
This matrix of proposed actions summarises the short term, medium term and long term interventions discussed in the previous section.

DEVELOPMENT OF INCLUSIVE MARKETS IN AGRICULTURE AND TRADE (DIMAT)46
VALUE CHAIN ANALySIS (VCA) OF THE CASSAVA SUb-SECTOR In UgAnDA
Table 5.1: Proposed Matrix of interventions
Factors INTERNAL to the Value Chain – (from Input Suppliers to Consumers)
Factors EXTERNAL to the Value Chain
STREngTHS• The value chain has attracted
support in development of various proven technologies e.g. through the established center of excellence
• Cassava is widely grown
• Cassava keeps for long in the ground
• Cassava is cheaper than its substitutes for both processing and consumption.
• Cassava is a priority commodity in some regions e.g the Eastern and Northern region
WEAKnESSES• Low quality standards of cassava products
with respect to quality demanded by the market – ethanol and flour for industrial use (breweries)
• High costs of operation along the chain especially investment costs for high quality processing
• Inadequate availability of market information at users’ level, control of pests and diseases
• Weak value chain institutions – low bulking, low access to markets
• Unattractive economies of scale (production for processing due to competing uses for cassava)
• High level of soil nutrient mining
• High prevalence of disease – brown streak and low yielding varieties
OPPORTUnITIES• Processors (e.g. breweries
and confectioneries) are keen to using cassava as a substitute.
• High demand for cassava and its products in both Uganda and the export market (42%)
• High potential for increasing cassava yield/productivity
• Changing consumer preferences with urbanization and health consciousness in the long run
Intervention Plan – Short Term (picking the low-hanging ripe fruits)• Expand the utilization of
existing technologies, products and practices to exploit markets
• Facilitate multiplication of improved cassava varieties at community level
• Strengthening market linkages between producers, traders, processors to ensure good quality of cassava and cassava products and their markets.
• Formal lending to the cassava marketing sector
Intervention Plan – Short - Medium Term (picking the low-hanging but not yet ripe fruits)
• Develop more structured trade models e.g contract farming to improve access to more non-traditional markets
• Strengthen cassava value chain institutions such as BMOs to improve governance of the chain
• Facilitate access storage and post harvest handing systems to ensure quality of cassava products
THREATSAttitude - Cassava is seen as a subsistence crop and is unattractive to private sector service providers e.g. banks, market information providers etcDiseases are difficult to controlFlooding in high producing areas in the eastern regionChanging consumer preferences with urbanization in the short term
Intervention Plan –Medium Term (picking fruits high up the tree)• Strengthening of extension
service provision to increase adoption of disease tolerant cassava varieties
• Development of innovative and accessible financing models to encourage investment into the cassava sub-sector
• Development of mechanisms to deal with flooding in the floods prone areas including use Early warning systems.
Intervention Plan –LOng Term (grow new fruit tree)• Improvement of infrastructure like valley
dams, roads to facilitate transportation of cassava to urban markets, Strengthening of enforcement mechanisms for cassava quality standards
• Popularizing of alternative industrial uses of cassava as a boost to production

DEVELOPMENT OF INCLUSIVE MARKETS IN AGRICULTURE AND TRADE (DIMAT) 47
Balagopalan, C. 2002. Cassava Utilisation in Food, Feed and Industry. In: Hillocks, R. J., Belloti, A. & Thresh, J. M. (eds.) Cassava: Biology, Production and Utilisation. London: CABI International Wellington UK.
CAVA 2009. Market Value Chain Analysis Uganda. NRI.
CHEMONICS 2010. Market Assessment and Baseline Study of Staple Foods: Country Report Uganda Chemonics & USAID.
Collinson, S., Wanda, K., Muganga, A. and Ferris, S. 2003. A Market Opportunities Survey for Value-Added Utilisation of Cassava-Based Products in Uganda: Part 2. ASARECA.
Collinson, C., Wanda, K., Muganga, A. and Ferris, R.S.B. 2000. Cassava Marketing in Uganda: Constraints and Opportunities for Growth and Development. International Institute of Tropical Agriculture, submitted to FIT Uganda.
Fermont, A. 2009. Cassava and Soil Fertility in Intensifying Smallholder Farming Systems of East Africa. PhD, Wageningen University.
FIT 2011. Market Analysis Report 2011: Advancing Agribusiness in Uganda Through Knowledge. FIT Uganda.
GOU 2005. Focus on Wealth Creating: Sectors’ Approach to Growth and Prosperity.
MAAIF 2010. The Agricultural Sector Development Strategy and Investment Plan 2010/2011 -2014/15.
Mbwika, M. J., Whyte, J. B., Bua, A. and Sserunkuma, D. 2001. Cassava Sub-Sector Analysis: Report of a Literature Review.
Kimathi, M., Ngeli, P. and Wanjiru, J. 2007. Value Chain Analysis for Cassava Flour and Related Products, ‘A case study of Uganda and Kenya, submitted to ASARECA.
Naluwairo, R. 2011. Investing In Orphan Crops to Improve Food and Livelihood Security of Uganda’s Rural Poor - Policy Gaps, Opportunities and Recommendations.
NRI and FOODNET. 2002. Transaction Cost Analysis for Selected Agricultural Commodities: Study for the Plan for Modernisation of Agriculture. PMA.
PMA. 2011. Agricultural Financing year Book 2010. Plan for the Modernisation of Agriculture & Bank of Uganda.
Prakash, A. Undated. Cassava International Market Profile: Background Paper for the Comparative Competitive Agriculture in Sub-Saharan Africa (CCAA) Study. Rome: Trade and Markets Division, FAO.
UBOS. & MAAIF. 2010. Uganda Census of Agriculture 2008/2009. Kampala: Uganda Bureau of Statistics and Ministry of Agriculture, Animal Industry and Fisheries.
REFEREnCES

DEVELOPMENT OF INCLUSIVE MARKETS IN AGRICULTURE AND TRADE (DIMAT)48
VALUE CHAIN ANALySIS (VCA) OF THE CASSAVA SUb-SECTOR In UgAnDA
APPEnDIX 1: DETAILED LIST OF COnSTRAInTS AnD OPPORTUnITIES AS IDEnTIFIED bY STAKEHOLDERS InTERVIEWED
Producers Processors Traders
Pests and diseases High costs of processing - district level levies and 18% VAT charged on power
Poor quality of produce supplied
Unpredictable and unfavorable weather conditions
High transport costs. Inadequate supplies
Limited access to improved cassava varieties for planting
Inadequate supply of raw materials.
Transport problems
High labour cost Frequent power outages. Increasing prices
High production costs Inability to access financial services
Few processors to handle large quantities required
Limited extension services High competition from other processors and substitute products
Delay in delivery of supplies
Limited land for production Price fluctuations
Limited access to improved farm equipment and soil degradation
Lack of good/efficient farming machines
Poor post harvest handling Limited ways of getting market information
Limited access to storage facilities,
Theft
Low cassava farm gate prices
Limited access to reliable markets,
Limited access to market information
Opportunities
Opportunities
Producers Processors Traders
Cassava can sustain itself with little rains in marginal land
Long shelf life of chips and flour Potential for increased supply – land still available
Crop is easily stored – can remain in the field
Growing demand – substitution in the beer an bakery industry.
Growing demand from export countries (Kenya and South Sudan)
Long shelf life of chips and flour Substitute imports of starch and ethanol
Tested processing technologies in the EAC

DEVELOPMENT OF INCLUSIVE MARKETS IN AGRICULTURE AND TRADE (DIMAT) 49
VALUE CHAIN ANALySIS (VCA) OF THE CASSAVA SUb-SECTOR In UgAnDA
APPEnDIX 2: RECOMMEnDATIOnS AnD SUggESTED InTERVEnTIOnS MADE bY STAKEHOLDERS
Producersa. The main recommendations suggested by farmer groups to address their challenges included;
b. Provision of improved farm inputs and agrochemicals to farmers at a reduced or subsidized rate (21.7%),
c. Linking of farmers to good and reliable markets (18.3%),
d. Supporting farmers to enable them access improved farm tools and equipments and
e. Linking of farmers to financial or credit institutions in order to meet the necessary costs of production.
Processorsa. Improvement of the feeder roads in the rural areas and roads in the urban areas to ease access to suppliers and the
markets,
b. Increased multiplication of improved cassava varieties by NARO coupled with robust extension and advisory services from NAADS would boost production,
c. The government to consider subsidizing electricity to encourage more SME’s to venture into value addition of cassava including processing into high quality cassava flour (HQCF),
d. Having contracts with suppliers,
e. Training on post-harvest handling of cassava
f. Increased production by the farmers
Traders a. Boost supplies through construction of bulking centres,
b. Collective marketing,
c. Procurement of trucks to facilitate transportation,
d. Farmers should be trained to improve quality of their supplies,
e. Use of tarpaulins for drying cassava,
f. Procuring processing factory to add value,
g. Improvement of road network

DEVELOPMENT OF INCLUSIVE MARKETS IN AGRICULTURE AND TRADE (DIMAT)50
VALUE CHAIN ANALySIS (VCA) OF THE CASSAVA SUb-SECTOR In UgAnDA
Appendix 3: EXISTEnCE AnD WILLIngnESS OF TRADER AnD PROCESSOR COMPAnIES TO EnTER InTO COnTRACTUAL AgREEMEnTS WITH SUPPLIERS
Company willing to formally engage suppliers
Location (Districts)Projected volumes 2012 (MT)
Current Suppliers
Alehiya General Stores Apac 25Individual farmersfarmer groups
Dakabela Rural Women Development Association
Soroti 12TradersProcessorsIndividual farmers
Mangeni Godfrey Busia 20 Traders
Margaret Oguttu Busia 2 Traders
Okello Robert Nebbi 130 Traders
Omogo General Stores Arua 200 Traders
Ssembajjwe Ronald Jinja 100TradersProcessors
Tibaga and Sons Jinja 20TradersProcessors

DEVELOPMENT OF INCLUSIVE MARKETS IN AGRICULTURE AND TRADE (DIMAT) 51
VALUE CHAIN ANALySIS (VCA) OF THE CASSAVA SUb-SECTOR In UgAnDA


DEVELOPMENT OF INCLUSIVE MARKETS IN AGRICULTURE AND TRADE (DIMAT) 53
VALUE CHAIN ANALySIS (VCA) OF THE CASSAVA SUb-SECTOR In UgAnDA

United Nations Development ProgrammePlot 11, yusuf Lule Road
P.O. Box 7184, Kampala, UgandaTelephone: +256 417 112 128 Fax: +256 414 344 801