development of indels markers in oilseed rape...
TRANSCRIPT
Development of INDELs markers in oilseed rape(Brassica napus L.) using re-sequencing data
Sammina Mahmood . Zhaohong Li .
Xiaopeng Yue . Bo Wang . Jun Chen . Kede Liu
Received: 4 February 2016 / Accepted: 30 May 2016 / Published online: 9 June 2016
� Springer Science+Business Media Dordrecht 2016
Abstract Insertions/deletions (INDELs), a type of
abundant length polymorphisms in the plant genomes,
combine the characteristics of both simple sequence
repeats (SSRs) and single-nucleotide polymorphisms
(SNP), and thus can be developed as desired molecular
markers for genetic studies and crop breeding. There
has been no large-scale characterization of INDELs
variations in Brassica napus yet. In this study, we
identified a total of 538,691 INDELs in size range of
1–10 bp by aligning whole-genome re-sequencing
data of 23 B. napus inbred lines (ILs) to the B. napus
genome sequence of ‘Darmor-bzh.’ Of these, 104,190
INDELs were uniquely mapped on the pseudochro-
mosomes of the reference genome. A set of 595 unique
INDELs of 2–5 bp in length was selected for exper-
imental validation in the 23 ILs. Of these INDELs, 530
(89.01 %) produced a single PCR product and were
single locus. A total of 523 (87.9 %) INDELs were
found polymorphic among the 23 ILs. A genetic
linkage map containing 108 single-locus INDELs and
89 anchor SSR markers was constructed using 188
recombinant ILs. The majority of INDELs markers on
the linkage map showed consistency with the pseu-
dochromosomes of the B. napus cultivar ‘Darmor-
bzh.’ The INDELs variations and markers reported
here will be valuable resources in future for genetic
studies and molecular breeding in oilseed rape.
Keywords Brassica napus � Next-generationsequencing � Insertions/deletions � Single-locusmarker
Introduction
Molecular markers are important tools for a wide
range of genetics and genomics studies such as linkage
map construction, gene mapping, association analysis,
diversity evaluation and marker-assisted selection
(MAS). Molecular marker technology has advanced
from laborious and expensive restriction fragment
length polymorphism (RFLP) to high-throughput
sequence-based markers such as simple sequence
repeat (SSR) and single-nucleotide polymorphism
(SNP). SSRs are versatile type of marker and have
found their own positions in molecular breeding and
genomic studies in many plant species. This is partly
because SSRs are easily detectable by PCR, amenable
to high-throughput analysis, codominantly inherited,
Sammina Mahmood and Zhaohong Li have contributed equally
to this work.
Electronic supplementary material The online version ofthis article (doi:10.1007/s11032-016-0501-z) contains supple-mentary material, which is available to authorized users.
S. Mahmood � Z. Li � X. Yue � B. Wang �J. Chen � K. Liu (&)
National Key Laboratory of Crop Genetic Improvement,
Huazhong Agricultural University, Wuhan 430070, China
e-mail: [email protected]
123
Mol Breeding (2016) 36:79
DOI 10.1007/s11032-016-0501-z

multi-allelic, highly polymorphic, abundant and
evenly distributed in genomes (Gupta and Varshney
2000), and partly because they can be easily developed
from piles of genomic and expressed DNA sequences.
SNPs are the most abundant variations in the genome
and are an important type of genetic markers for major
crop species. They are abundant, bi-allelic, codomi-
nant and amenable to high-through detection plat-
forms, also important for genetics and genomics
studies. A number of studies have been conducted to
identify SNPs in the genomes of diverse crops (Bekele
et al. 2013; Ching et al. 2002; Delourme et al. 2013;
Huang et al. 2013). However, recent technological
developments demonstrated that SNPs did not capture
all the meaningful genomic variations that contribute
to phenotypic differences. Hence, it is imperative to
develop and use other genome-wide informative
sequence-based genetic markers in order to delineate
functionally important genetic variation for genomics-
assisted crop improvement.
Insertions/deletions (INDELs), after SNPs are the
second major source of structural variations widely
distributed across the genomes of diverse plant
species (Li et al. 2015; Liu et al. 2012; Ollitrault
et al. 2012; Shen et al. 2004; Yang et al. 2014).
INDELs serve as centers of mutagenesis by increasing
nearby mutation rates and thus fuel the evolutionary
process. INDELs like SSRs are also a type of length
polymorphism, originated from a single mutation
event which occurs at a low frequency and is unlikely
to present recurrent mutations. The probability of two
INDELs mutations to occur at the same genetic
position and has exactly the same length is minimal.
Thus, INDELs are generally bi-allelic, single-locus in
nature. Shared INDELs represent identity by des-
cent in phylogenetic analysis (Shedlock and Okada
2000). Unlike SNPs, INDELs have more pronounced
phenotypic effects and generally considered more
deleterious. INDELs have myriad the desirable
inherent genetic characteristics of both SNPs and
SSRs markers, such as codominance, abundance and
random distribution across the genome (Li et al. 2013;
Lv et al. 2014; Mills et al. 2006; Pan et al. 2008) and
hence a valuable complement for both SNPs and SSRs
markers and make their own position in crop genomic
studies. Small INDELs can be analyzed in short
amplicons and genotyped in regular genetics and
breeding laboratories with polyacrylamide gel elec-
trophoresis (PAGE) or microcapillary sequencers in a
high-throughput manner as done with SSRs. Thus,
small INDELs are increasingly receiving attention,
and great efforts have been put on identification and
mapping INDELs in a number of plant species.
Arabidopsis and rice are the two first completely
sequenced plant genomes using the Sanger sequenc-
ing. Genome-wide DNA polymorphisms including
INDELs and SNPs have been identified between the
reference and one re-sequenced genomes, and data-
bases have been constructed for easy selection of
suitable INDELs and SNP markers (Arai-Kichise
et al. 2011; Jander et al. 2002; Shen et al. 2004). The
minimal start-to-finish time of a map-based cloning
project has been shortened significantly with the aid of
such a database, making it possible to identify the
causal mutation within one year from a mutant with
desirable phenotype in Arabidopsis (Jander et al.
2002). With the advent of next-generation sequencing
technologies, many plant species have been
sequenced, re-sequenced, and genome-wide INDELs
mined in these species (Li et al. 2013, 2015; Ollitrault
et al. 2012; Shen et al. 2004; Yang et al. 2014).
Oilseed rape (Brassica napus L., 2n = 38, AACC)
is an economically important oil crop worldwide. It is
an allotetraploid originated from relatively recent
natural interspecific hybridization between the two
diploid progenitors, B. rapa (2n = 20, AA) and B.
oleracea (2n = 18, CC). Several genome sequencing
projects for B. napus and its two diploid progenitors
have been conducted, and a large amount of genomic
and expressed DNA sequences had been released
(Chalhoub et al. 2014; Lim et al. 2006; Liu et al. 2014;
Wang et al. 2011). Extensive efforts have been made
to characterize the distribution patterns of SSRs in the
genomes and to develop thousands of SSR markers in
Brassica species in recent years (Cheng et al. 2009; Li
et al. 2010; Shi et al. 2014; Xu et al. 2010; Wang et al.
2011), which are important genetic resources for gene
mapping and molecular breeding. However, in B.
napus, most of the SSR markers usually display
multiple loci, which make it hard to integrate genetic
linkage maps and compare genes/QTLs detected using
different genetic populations. Thus, we must use the
SSR markers with caution in gene mapping and MAS,
especially in map-based gene cloning. It is necessary
to differentiate which locus of the multi-locus marker
linked to the gene of interest. The single-locus nature
of INDELs could resolve this drawback of multi-locus
SSRs. In recent years, INDELs have been mined in
79 Page 2 of 13 Mol Breeding (2016) 36:79
123
Brassica species. In B. rapa, 6753 INDELs in the gene
spaces have been identified and characterized by re-
sequencing 1398 sequence-tagged sites (STSs) in
eight genotypes (Park et al. 2010). Whole-genome re-
sequencing revealed a total of 108,558 putative short
INDELs (1–5 bp) between two B. rapa varieties,
Chiifu-402-41 and L144 (Li et al. 2013). In addition, a
large number of INDELs markers have been devel-
oped and applied to construct genetic linkage maps
and gene mapping in both B. rapa and B. oleracea (Li
et al. 2013; Lv et al. 2014).
Although INDELs markers have been widely used
in genetics and breeding research in many plant
species, their potential for such purpose has not been
explored in B. napus yet. In this study, we identified a
total of 538,691 small INDELs in size range of
1–10 bp by aligning whole genome re-sequencing
data of 23 B. napus inbred lines to the B. napus
genome sequence of ‘Darmor-bzh.’ A subset of 595
INDELs were validated by PCR amplification of
genomic DNA in the 23 inbred lines, and 108 INDELs
mapped to a genetic linkage map. The main objective
of this study was to identify and develop a set of user
friendly single-locus INDELs markers for genetics
and breeding studies in oilseed rape.
Materials and methods
Plant materials
Twenty-two B. napus inbred lines (ILs) with ample
differences in trait architecture were selected for re-
sequencing and initial polymorphism screening of
INDELs. These ILs have different geographic origins,
i.e. China, Japan, Europe and Canada (Table 1). They
are parents of a nested association mapping (NAM)
population with Zhongshuang 11 (ZS11) as the
common parent, which is a widely cultivated elite
open-pollinated cultivar in China and has been de novo
sequenced by the International Brassica Genome
Sequencing Consortium led by the Oil Crop Research
Institute (OCRI), Chinese Academy of Agriculture
Science. An IL, ‘M201,’ was selected to cross with
‘352’ for the development of recombinant inbred lines
(RILs). ‘M201’ is an IL with high oil content, long
siliques and large seeds, while ‘352’ is an IL with low
oil content, short siliques and small seeds. A popula-
tion consisting of 188 recombination inbred lines
(RILs) was derived from the cross between ‘M201’
and ‘352’ using single seed descent (SSD) method and
selfed to F6 generation. These RILs were used to
construct a genetic linkage map for the confirmation of
marker order and genetic location of INDELs markers
on the pseudochromosomes of B. napus genome.
Construction of whole-genome shotgun libraries
and sequencing
Fresh young leaf samples were collected from these
ILs. Total DNA was extracted by using the
cetyltrimethyl ammonium bromide method. One
microgram (lg) of genomic DNA was sheared to
yield an average size of 500 bp using an ultrasonic
Bioruptor (Diagenode; Liege, Belgium). Short insert
libraries (350–450 bp) of the 22 ILs were constructed
according to the manufacturers’ instructions (Illu-
mina, USA) and sequenced using the Illumina
HiSeq2000 platform to produce paired-end 100-bp
(PE100) reads. To minimize mapping errors, we
removed low-quality PE reads with 30 bases’ Phred
quality score less than Q20 using NGS QC Toolkit
(Patel and Jain 2012). The Illumina sequence data
have been deposited in the NCBI, Sequence Read
Archive (GenBank: SRA045576).
Procedures for INDELs discovery
The genome sequences of B. napus (http://www.
genoscope.cns.fr/brassicanapus), B. rapa (http://
brassicadb.org/brad) and B. oleracea (http://www.
oilcrops.com.cn) were used as reference for short
reads alignment and INDELs mining. The PE100
reads from individual ILs were aligned to the reference
genome sequences using the Burrows–Wheeler
Alignment tool (BWA version 0.7.0) (Li and Durbin
2009) with the following parameters: At most three
mismatches or one gap for each single PE100 read,
with gap extension 1–10 bp. To overcome the inter-
ference of paralogues and homeologues in INDELs
identification, only the reads with both ends uniquely
aligned to and located within a range of appropriate
insert sizes (350–450 bp) on the reference sequences
were kept for downstream analysis. The alignment
Mol Breeding (2016) 36:79 Page 3 of 13 79
123

results were converted to the BAM format using
SAMTools (version 0.1.18) (Li et al. 2009). Dupli-
cated reads caused by PCR in the process of
sequencing library construction were removed using
Picard package (version 1.91) (http://picard.
sourceforge.net).
INDELs detection was performed by Genome
Analysis Toolkit (GATK, version 2.4-9-g532efad)
(McKenna et al. 2010) and SAMTools. Reads around
INDELs were realigned using the local realignment
tool in GATK to minimize the number of mismatches
and to improve the specificity in variant calling
(DePristo et al. 2011). The base quality was recali-
brated using the base quality score recalibrate (BQSR)
package in GATK. Due to the absence of prior SNP
and INDEL database available for B. napus, the
common variants called by both GATK and SAM-
Tools were selected and used as prior information for
BQSR. INDELs calling for all accessions was
achieved by using the GATK UnifiedGenotyper
module, and the INDELs confidence score greater
than 30 was kept for further analysis.
Development of single-locus INDELs markers
The following criteria was employed for the selection
of INDELs markers. (1) The variation should be
random nucleotide INDELs, rather than simple
sequence length polymorphisms. (2) The INDELs
variations should be 2–5 nucleotides in length for
multiplexing and easy scoring on PAGE or capillary
sequencer. (3) The INDELs should be uniquely
mapped to the reference genome sequences to ensure
that they are of single locus. For this, 150-bp flanking
sequences on both sides of the INDELs mutation sites
were extracted and searched against the reference
genome sequences using the BLAST program with a
search score B 1e-10. If the flanking sequences
matched to multiple sites with more than 60 %
identity, these INDELs were removed from query list.
Table 1 Sequencing data
and short reads mapping to
the genome of B. napus
SW semi-winter, S spring
Variety Raw data (Gb) Mapped (Gb) Origin Growth habit
Zhongza 12.9 10.1 China SW
84001 17.1 13.6 China SW
Zhongshuang2 18.9 15.4 China SW
G1044 16.6 12.1 Japan SW
Baihua 14.9 11.4 Europe S
Quantum 12.9 10.6 Canada S
Chuan91 10.9 9.0 China SW
Huyou9 12.8 9.5 China SW
Bugle 12.7 10.2 Canada S
DH 4 15.7 11.4 China SW
Norin22 11.0 6.7 Europe SW
DH5 11.6 8.7 China SW
G1178 15.0 12.4 Japan SW
CAo3Ho-4 20.5 16.5 Canada SW
2012 13.2 10.1 China SW
Fuyou1 14.7 10.8 China SW
Cao221171 17.1 13.9 China SW
s2 35.2 27.3 China SW
352 17.8 13.6 China SW
264_1 20.7 16.4 China SW
Zheyou7 16.7 12.5 China SW
M201 16.2 13.0 China SW
Zhongshuang11 13.0 11.6 China SW
Average 16.0 12.4
79 Page 4 of 13 Mol Breeding (2016) 36:79
123

Only uniquely and perfectly matched INDELs were
retained to avoid multiple loci. (4) INDELs distributed
in distances of 1.0–5.0 Mb along the B. napus, B. rapa
and B. oleracea genomes were selected for marker
development.
Experimental validation of INDELs
polymorphism and construction of genetic linkage
map
PCR primers were designed with the following
requirements: primer length ranging from 18 to
23 bp, product length varying from 80 to 200 bp,
melting temperature ranging from 50�C to 70�C with
an optimum around 55�C and GC content ranging
from 30 to 70 % with an optimum around 50 %. To
further ensure that the selected INDELs are single
locus, in silico PCR (Shi et al. 2014) was conducted by
aligning the primers to the reference genome
sequences with the following settings: 2-bp mismatch,
1-bp gap and 50-bp margin. The primer pairs were
synthesized by Generay Biotech Company (Shanghai,
China).
PCR amplifications were performed in a volume of
10 ll containing 50 ng genomic DNA, 1 9 Taq
buffer, 2 mM MgCl2, 0.2 mM dNTPs, 0.2 lM each
primer and 0.25 U Taq DNA polymerase (Fermentas).
The reaction mixture was initially denatured at 94 �Cfor 3 min, followed by 35 cycles of amplification at
94 �C for 30 s, 56 �C for 30 s and 72 �C for 30 s, and
a final extension at 72 �C for 5 min. PCR products
were separated on denaturing polyacrylamide gels and
staining with silver nitrate.
A genetic map was constructed using JoinMap 3.0
software. The threshold for goodness of fit was set toB
5.0, with a recombination frequency of \0.4. Loci
were assembled into groups with minimum logarithm
of odds (LOD) scores of 2.0. The likelihoods of
different locus-order possibilities for linkage map
were compared and the one having the highest
likelihood was selected for each linkage group. All
genetic distances were expressed in centimorgan (cM)
as derived by the Kosambi function (Kosambi 1944).
In order to assign the INDELs markers to specific
linkage groups (LGs), 89 single-locus SSRs were
selected from previous linkage maps (Cheng et al.
2009; Li et al. 2010; Xu et al. 2010) and used as anchor
markers. LGs from the A and C subgenomes were
designated as A01–A10 and C01–C09, respectively.
Results
Whole-genome re-sequencing of the 22 ILs
Twenty-two ILs were chosen for re-sequencing. The
22 ILs were selected from four clusters based on the
genotypes of 451 single-locus SSR markers and
represented the highest level of diversity in 307
oilseed rape accessions (Xiao et al. 2012). The 22 ILs
are parents of a NAM population consisting of 3200
recombinant inbred lines (RILs) derived from 21
crosses with ZS11 as the common parent. Genomic
libraries with insert size ranging from 350 to 450 bp
were constructed for 22 ILs except for ZS11 and
sequenced on the HiSeq2000 platform. A total of
351.2 GB high-quality sequence data comprised of
1.756 9 109 PE100 reads were as obtained. A range of
54.5–176.0 million reads were generated for individ-
ual ILs, which corresponded to a range of
10.9–35.2 Gb sequence data (Table 1) and a coverage
depth of 9.0–27.3 9 of the B. napus genome (Chal-
houb et al. 2014). A total of 65 million random PE100
reads were in silico generated from the assembled
scaffold sequences of ZS11 (http://www.oilcrops.
com.cn/), which correspond to 13.0 Gb sequence
data (Table 1) and a coverage depth of 10.8 9 B.
napus genome.
Genomic distribution of INDELs variations
The PE100 reads of each IL were mapped to the B.
napus reference sequence of Darmor-bzh using the
BWA software (0.7.0). A total of 538,691 non-
redundant INDELs with 1–10 bp in length were
mined (Table 3). The INDELs could be further
divided into insertions/deletions of single base pair
and multiple base pairs. The single-base INDELs
accounted for 63.6 % with the A and T insertions/
deletions being the most abundant (Table 2). The
frequencies of the two- and three-base random
nucleotide INDELs were 10.5 and 6.1 %, respectively,
with the AT and TA insertions/deletions being the
most abundant. The 4–10 base random nucleotide
INDELs accounted for 16.6 % (Table 2). The average
density in the whole genome of B. napus was 0.63
INDELs/kb DNA (Table 3). The A subgenome had
311,927 INDELs with an average density of 0.99
INDELs/kb, while the C subgenome had 224,752
INDELs with an average density of 0.43 INDELs/kb.
Mol Breeding (2016) 36:79 Page 5 of 13 79
123

Chromosome C03 had the largest number of INDELs
(44,149, 0.66 INDELs/kb), and chromosome C05 had
the least number of INDELs (12,058, 0.26 INDELs/kb)
(Table 3). The distribution of INDELs across the
genome was uneven. Some chromosomes such as
chromosome C02, C05, C06, C08 and C09 had much
less INDELs than the average level across the genome.
Development of INDELs markers
The 150-bp flanking sequences on both sides of the
target INDELs were searched against the reference
Table 2 Number of INDELs with different length of
nucleotides
INDEL length Nucleotides Number
Single bases (63.6 %) A 138,449
C 33,194
G 32,799
T 138,242
Two bases (10.5 %) AA 1226
AC 3592
AG 5315
AT 12,732
CA 2024
CC 446
CG 804
CT 3319
GA 2484
GC 872
GG 448
GT 1994
TA 11,557
TC 4809
TG 3861
TT 1226
Three bases (6.1 %) AAA 172
AAC 483
AAG 691
AAT 646
ACA 220
ACC 133
ACG 132
ACT 198
AGA 256
AGC 137
GAA 602
GAC 185
TAA 642
GAG 340
TAC 378
TAG 304
GAT 322
TAT 681
GCA 117
GCC 58
TCA 369
GCG 44
TCC 227
Others 25,323
Table 2 continued
INDEL length Nucleotides Number
4–10 bases (16.6 %) 89,572
Total 538,691
Table 3 Number of INDELs distributed on each chromosome
Chromosome Length (Mb) No. of INDELs INDELs/kb
chrA01 26.0 25,566 0.99
chrA02 26.4 23,082 0.87
chrA03 35.8 44,063 1.23
chrA04 20.6 25,506 1.24
chrA05 26.1 26,008 1.00
chrA06 26.7 33,009 1.24
chrA07 26.1 31,635 1.21
chrA08 21.1 23,103 1.10
chrA09 38.0 35,529 0.93
chrA10 19.7 21,898 1.11
chrAnn 48.7 22,528 0.46
A subgenome 315.2 311,927
chrC01 43.2 21,564 0.50
chrC02 51.4 25,158 0.49
chrC03 67.1 44,149 0.66
chrC04 53.4 21,665 0.41
chrC05 46.9 12,058 0.26
chrC06 40.6 13,685 0.34
chrC07 47.7 21,334 0.45
chrC08 43.0 20,079 0.47
chrC09 52.9 20,074 0.38
chrCnn 80.7 24,986 0.31
chrUnn 8.3 2012 0.24
C subgenome 535.2 224,752
Total 850.3 538,691 0.63
79 Page 6 of 13 Mol Breeding (2016) 36:79
123

genomes using BLASTn program (e value was set as
1e-10) to screen for unique INDELs. A total of
104,190 INDELs were uniquely matched to only one
position on the reference genomes, which were ideal
for marker development. To investigate the authen-
ticity of these identified INDELs, a subset of 595
unique INDELs distributed along chromosomes with
intervals of 1–5 Mb selected for experimental valida-
tion (Supplementary Table 1). PCR primers were
designed to amplify the INDELs variations. PCR
products were amplified from the 23 ILs and separated
on PAGE. Of these 595 INDELs, 592 (99.5 %)
successfully amplified, while only three (0.5 %)
failed. Of the 592 amplified INDELs, 530 (89.1 %)
only amplified a single PCR product, which are
putative single-locus markers, and 62 (10.4 %) ampli-
fied two or more PCR products. A subset of 523
(87.9 %) INDELs verified to be polymorphic in the 23
ILs, indicating that the majority of INDELs polymor-
phisms discovered was correct. Of the polymorphic
INDELs, 478 detected two alleles in the 23 ILs, and
only 39 and 6 detected three and four alleles,
respectively. In the 478 bi-allelic INDELs, 416 were
codominant and 62 dominant.
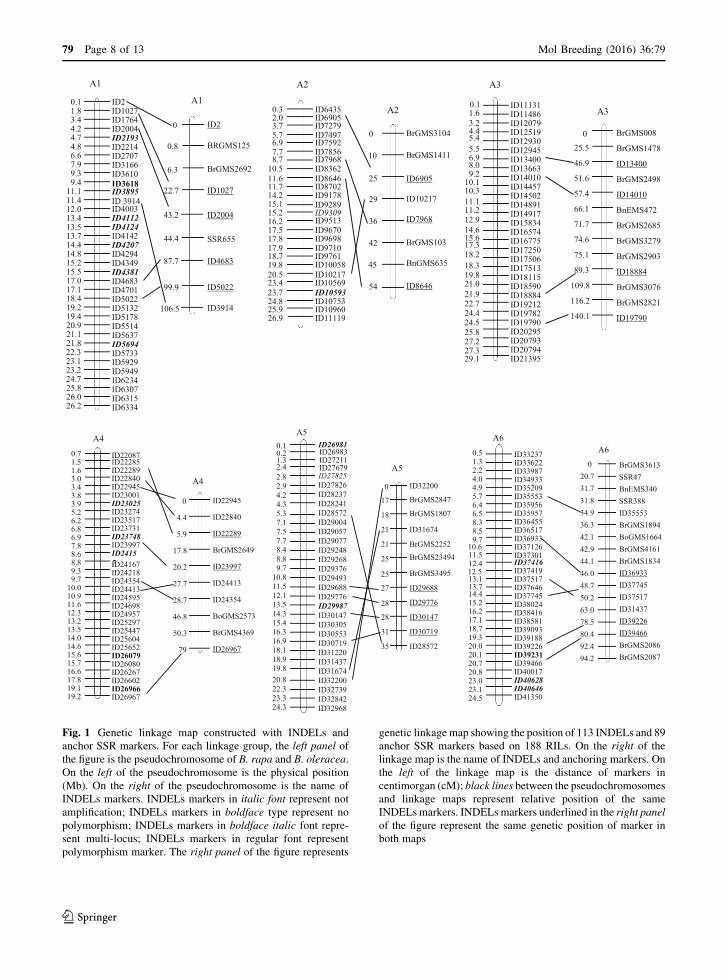
Genetic mapping of INDELs
To highlight the usefulness of these INDELs markers,
a segregating population containing 188 RILs derived
from the cross ‘M201’ 9 ‘352’ was used to construct
a genetic map. Of the 595 INDELs, 134 showed
polymorphisms between ‘M201’ and ‘352.’ The
polymorphic INDELs were subjected to population
assay. All polymorphic INDELs segregated as codom-
inant single-locus markers and were very useful for
multiplexed loading. A genetic map containing 108
single-locus INDELs and 89 anchor SSR markers was
constructed. The linkage map consisted of 19 linkage
groups (LGs) and covered a total length of 1356.9 cM.
The distribution of INDELs markers across the 19
chromosomes was uneven. Chromosome C03 had the
maximum number of INDELs markers (22), followed
by A08 (8) and C04 (8). C08 had the least number of
INDELs markers (1). The genetic map showed good
colinearity with the pseudochromosomes of B. rapa
and B. oleracea with some inversions on chromo-
somes A4, A5, A6, A8, C3, C4 and C6 (Fig. 1). Seven
INDELs markers (ID31437, ID68635, ID71342,
ID71337, ID70476, ID70404 and ID94273) were
mapped on chromosomes different from the pseu-
dochromosomes of B. rapa and B. oleracea. Among
these markers, ID71342, ID71337, ID70476, ID70404
and ID94273, all mapped to the C03 chromosome
which was consistent with the pseudochromosomes of
the B. napus reference genome of ‘Darmor-bzh.’
These results suggested that the scaffolds conferring
these INDELs may be mis-assembled or mis-assigned
in the B. oleracea draft reference genome. It is also
possible that chromosome re-arrangements occurred
during diploidization after the hybridization of B. rapa
and B. oleracea.
Discussion
INDELs have been proved to be a simple and efficient
marker type in plant species (Pan et al. 2008; Pacurar
et al. 2012; Zeng et al. 2013). A large number of
INDELs have been identified in several plant species
including Arabidopsis, rice, citrus, pepper, tomato and
B. rapa using whole-genome re-sequencing data (Li
et al. 2013, 2015; Ollitrault et al. 2012; Pacurar et al.
2012; Yang et al. 2014; Zeng et al. 2013). Although the
oilseed rape genome sequences have been widely used
for SSR discovery (Cheng et al. 2009; Li et al. 2012;
Wang et al. 2011), large-scale identification of
INDELs has not been reported yet. In this study, we
identified 538,691 INDEL variations with 1–10 bp in
length by mapping re-sequencing data to the reference
genome sequence of the B. napus cultivar ‘Darmor-
bzh.’ Given that the PE readswere 100 bp in length, we
only mined INDELs in the size range of 1–10 bp to
avoid mis-alignment, which definitely lead to an
underestimation of the real distribution of INDELs in
theB. napus genome. The average density across theB.
napus genome was estimated to be 0.63 INDELs/kb,
which is much higher than that in the human genome
(Mills et al. 2006), but lower than that in the rice
genome (Shen et al. 2004). The density of INDELs in
the A subgenome (0.99 INDELs/kb) was significantly
higher than that in the C subgenome (0.43 INDELs/kb)
(Table 3) and also much higher than that identified in
the B. rapa genome (0.43 INDELs/kb) (Li et al. 2013).
Map-based gene cloning relies on the availability of
a large number of genetic markers with information of
position in the genome. PCR-based INDELs are
extensively used markers in initial mapping when
Mol Breeding (2016) 36:79 Page 7 of 13 79
123
ID2ID1027ID1764ID2004ID2193ID2214ID2707ID3166ID3610
ID3895ID3618
ID 3914ID4003ID4112ID4124ID4142ID4207
ID4349ID4294
ID4381ID4683ID4701ID5022
ID5178ID5514ID5637
ID5132
ID5694
ID5929ID5733
ID5949ID6234ID6307ID6315ID6334
0.1
3.41.8
4.74.2
4.86.67.99.39.4
11.111.412.013.4
13.713.5
14.414.815.215.517.017.118.419.219.420.921.121.822.323.123.2
26.226.025.824.7
A1
0
0.8
6.3
43.2
22.7
44.4
87.7
99.9
106.5
ID2
BRGMS125
ID1027
SSR655
ID2004
ID4683
ID5022
BrGMS2692
ID3914
A1
A2ID6435ID6905ID7279
BrGMS1411ID7968ID8362ID8646ID8702ID9178
ID9309ID9513ID9670ID9698ID9710ID9761ID10058ID10217ID10569ID10593ID10753ID10960ID11119
ID9289
ID7497
ID7856
0.32.0
5.73.7
6.97.78.7
10.511.611.714.2
15.215.1
16.217.517.817.918.719.820.523.423.724.8
26.925.9
ID7592
ID6905
ID10217
ID7968
BrGMS103
BnGMS635
ID8646
BrGMS31040
10
25
29
36
42
45
54
A2
ID11131ID11486ID12079
ID13400ID13663ID14010ID14457ID14502ID14891ID14917ID15834ID16574ID16775ID17250ID17506ID17513ID18115ID18590ID18884ID19212ID19782ID19790ID20295ID20793ID20794
ID12519
ID12945
0.11.6
4.43.2
5.45.56.98.09.2
10.110.3
11.211.1
12.914.615.617.318.218.319.821.021.922.7
29.127.327.225.824.524.4
ID12930
ID21395
A3
BrGMS1478
ID13400
BrGMS2498
ID14010
BnEMS472
BrGMS2685
BrGMS3279
BrGMS2903
ID18884
BrGMS3076
BrGMS2821
ID19790
BrGMS008
109.8
116.2
140.1
025.5
46.9
51.6
57.4
66.1
71.7
74.6
75.1
89.3
A3
A4
ID220870.71.5
3.01.6
3.43.83.95.26.26.86.9
8.67.8
8.89.39.7
10.010.911.612.313.213.514.0
19.117.816.615.715.614.6
19.2
ID22285ID22289
ID23025ID23274ID23517ID23731ID23748ID23997ID24157ID24167ID24218ID24354ID24413ID24595ID24698ID24957ID25297ID25447ID25604ID25652ID26079ID26080ID26267ID26602
ID22840
ID23001ID22945
ID26966ID26967
A4
ID22840
ID22289
BrGMS2649
ID23997
ID24413
ID24354
BoGMS2573
BrGMS4369
ID26967
ID229450
4.4
5.9
17.8
20.2
27.7
28.7
46.8
50.3
79
ID28237ID28241ID28572ID29004ID29057ID29077ID29248ID29268ID29376ID29493ID29688ID29776ID29987ID30147ID30305ID30553ID30719ID31220ID31437ID31674ID32200ID32739
ID26981ID26983ID27211ID27679
ID27826ID27825
0.10.2
2.41.3
2.82.94.24.35.37.17.5
8.47.7
8.89.7
10.811.512.113.514.315.416.316.9
23.322.320.819.818.918.1
24.3ID32842ID32968
A5
A5
0
17
18
21
21
25
25
27
28
28
31
35
BrGMS2847
BrGMS1807
ID31674
BrGMS2252
BrGMS3495
ID29688
ID29776
ID30147
ID30719
ID28572
ID32200
BrGMS23494
A6
BrGMS2087
SSR47BnEMS340SSR388ID35553BrGMS1894BoGMS1664BrGMS4161BrGMS1834ID36933ID37745ID37517ID31437ID39226ID39466BrGMS2086
BrGMS3613020.731.731.834.936.342.142.944.146.048.750.263.078.580.492.494.2
ID33237ID33622ID33987
ID35956ID35957ID36455ID36517ID36933ID37126ID37301ID37416ID37419ID37517ID37646ID37745ID38024ID38416ID38581ID39093ID39188ID39226ID39231ID39466ID40017ID40628
ID34933
ID35553
12.5
ID35209
0.51.3
4.02.2
4.95.76.46.58.38.59.7
11.510.6
12.4
13.113.714.415.216.217.118.719.3
23.123.020.820.720.120.0
24.5ID40646ID41350
A6
Fig. 1 Genetic linkage map constructed with INDELs and
anchor SSR markers. For each linkage group, the left panel of
the figure is the pseudochromosome of B. rapa and B. oleracea.
On the left of the pseudochromosome is the physical position
(Mb). On the right of the pseudochromosome is the name of
INDELs markers. INDELs markers in italic font represent not
amplification; INDELs markers in boldface type represent no
polymorphism; INDELs markers in boldface italic font repre-
sent multi-locus; INDELs markers in regular font represent
polymorphism marker. The right panel of the figure represents
genetic linkagemap showing the position of 113 INDELs and 89
anchor SSR markers based on 188 RILs. On the right of the
linkage map is the name of INDELs and anchoring markers. On
the left of the linkage map is the distance of markers in
centimorgan (cM); black lines between the pseudochromosomes
and linkage maps represent relative position of the same
INDELsmarkers. INDELsmarkers underlined in the right panel
of the figure represent the same genetic position of marker in
both maps
79 Page 8 of 13 Mol Breeding (2016) 36:79
123

using map-based cloning strategy to identify unknown
genes in Arabidopsis (Jander et al. 2002) and rice
(Shen et al. 2004; Zeng et al. 2013). Bulked segregant
analysis (BSA) combined with evenly distributed
high-quality INDELs markers enables the mapping of
a gene in an unprecedented speed than ever before
(Lukowitz et al. 2000). Once the gene is mapped,
further fine mapping in completely sequenced plant
species just requires enlarging the segregating popu-
lation and selecting more molecular markers currently
available or developed from the genome-wide DNA
polymorphism databases such as in Arabidopsis and
rice (Jander et al. 2002; Shen et al. 2004). In this study,
538,691 INDELs with 1–10 bp length were identified
in the B. napus genome, which are sufficiently
adequate for map-based cloning in oilseed rape. More
importantly, all INDELs have known genetic position
in relation to the reference genome, which makes it
possible to develop INDELs markers within target
genome regions and thus will speed up map-based
cloning and marker-assisted trait selection in oilseed
rape.
The allotetraploid genome of B. napus contains
many triplicated blocks of paralogous and orthologous
segments within and between subgenomes (Chalhoub
et al. 2014; Cheung et al. 2009; Liu et al. 2014; Udall
et al. 2005) that promote to homeologous pairing in
genome (Cai et al. 2014; Jiang et al. 2011). The
complexity of the B. napus genome renders the multi-
locus nature of most RFLP and SSR markers. Thus,
cautions should be taken while using the multi-locus
markers for fine mapping and marker-assisted selec-
tion. Single-locus INDELs markers could significantly
minimize homoplasy which is usually encountered
BrGMS3929
BrGMS2025
BrGMS3317
BrGMS3912
A8
ID49289
ID48433
ID48970
ID49098
ID50816
ID50750
ID52470
ID53630
0
1.8
2.0
4.9
5.4
6.6
7.0
16.7
20.9
48.8
73.3
20.1
A7
BnEMS620
BrGMS2989
BrGMS3976
ID47045
BoGMS612
ID47527
BrGMS29890
11.8
12.6
33.7
47.5
50.8
56.6
0.71.3
2.92.4
5.95.96.47.68.79.6
10.7
11.311.3
12.212.913.713.814.515.316.016.516.617.5
22.522.020.720.619.417.6
22.623.425.7
ID41705ID41910ID42176
ID42736ID43035ID43280ID43597ID43836ID43959ID43965ID44129ID44536ID44859ID44863ID45035ID45289ID45567ID45809ID45820ID46199ID46200ID46676ID47038ID47045ID47415
ID42253
ID42605ID42604
ID47527ID47534ID47604ID48062
A70.71.5
3.62.2
4.46.27.07.38.59.6
11.610.7
12.712.813.414.114.516.417.318.218.919.8
20.320.0
ID48192ID48377ID48433
ID49098ID49123ID49289
ID49510ID49511ID49781ID49938ID50274ID50343ID50545ID50750ID50816ID51674ID52115ID52470ID53017ID53390ID53491ID53630
ID48636
ID48970ID48738
A8
ID61378
ID54119ID54270ID54336
2.9
ID57321
ID54664ID54715ID54874ID55008ID55023ID55227ID55235ID55350ID55352ID55661ID55662ID55828ID56008ID56078ID56140ID56263ID56630ID56692ID56859ID56860ID56962ID57084
ID54565
ID54622ID54612
ID57397ID57708ID57723ID57986ID58314ID58807ID59618ID59627ID60249ID60346ID60375
ID61004
ID57093
3.7
5.24.2
5.86.06.97.98.79.59.6
10.610.5
11.511.513.113.215.816.817.518.219.320.5
24.324.223.222.422.321.3
25.426.027.127.227.828.830.031.431.533.033.233.334.935.037.5
ID60098
A9
A9
BoGMS778
ID54336ID54565ID56008
BrGMS2096BrGMS2248BnEMS857ID57321
BrGMS3064
ID58807BrGMS2161
BrGMS985
BrGMS2581BnGMS319BrGMS2199BrGMS1208BnEMS300
BrGMS3258
041650
52.152.754.867.769.579.189.389.891.992.192.393.997.9100.5101.8
BnEMS214
A10
BoGMS1114
BrGMS2240
ID63723
ID61680
ID61836
ID62141
BnEMS480
4.7
32.5
47.2
50.4
56
64.2
0.71.6
3.72.6
3.95.26.38.69.09.39.8
11.411.0
12.313.314.715.5
ID61680ID61836ID62141
ID62836ID63541ID63723ID63842ID63985ID64521ID64699ID65193ID65471ID66061ID66363
ID62481
ID62612ID62500
A10
Fig. 1 continued
Mol Breeding (2016) 36:79 Page 9 of 13 79
123

ID66886ID67073ID67265ID67409ID67599ID67771ID68108ID68190ID68319ID68396ID68635ID68854ID68961ID69106ID69211ID69226ID69346ID69381
ID69456ID69398
ID69505ID69688ID69717ID69863ID69910ID70044ID70067ID70103ID70226ID70404ID70476ID70531ID70561
10.911.211.514.5
16.920.3
21.122.122.422.9
24.326.626.728.428.629.329.830.832.433.934.535.737.2
0.71.42.13.23.95.7
16
21
24
10.6
C1
BoGMS2752
BoGMS156517.4
C1SSR123
ID69106
SSR77
ID70531
0
2.3
6.9
3.6
12.9
ID70687ID70729ID70757ID70801ID70820ID70879ID70928ID70931ID71013ID71061ID71109ID71181ID71337ID71342ID71483ID71500ID71534ID71599ID71733ID71991ID72095ID72144
ID72358ID72429ID72471ID72480ID72570ID72815
ID72244
ID73046
5.911.311.712.512.713.413.813.915.215.51617
21.421.423.924.629.229.93134
34.535.235.736.837.438.138.238.940.842.2
C2
BrGMS3854
BoGMS2239
BoGMS3028
C2
BnEMS287
BnEMS281
ID71991
ID73046
ID71534
ID72815
ID68635
ID71181
0
10.5
15.9
16.3
21
27.9
31.8
38.4
38.7
47.8
52.2
ID73514ID73711ID74014ID74413ID74417ID74717ID74952ID75340ID75404ID75470ID75694ID75758ID75895
ID76183ID76068
ID76395ID76566ID76805ID77078ID77264ID77416
ID77795ID75404
ID77807ID77902ID78230ID78356ID78523ID78744ID78845ID79097ID79281
ID79679ID79786
ID79883ID79794
ID79961
ID79282ID79446ID79555
ID80103ID80258ID80403ID80533ID80641ID80857ID81001ID81132ID81380ID81444
ID81765ID80103
ID81799ID81935ID82067ID82193ID82430ID80103
2.22.93.95.15.16
6.98.38.99.2
10.510.711.1
12.711.9
13.914.915.717
18.319.3
21.519.9
21.622.524.625.626.427.729.230.931.6
34.835.4
36.535.5
37.4
31.732.833.7
3940.241
42.443.444.945.846.647.848.3
50.649.8
5151.752.754.155.256.2
C3
ID73514ID73711ID71342ID71337ID74413ID74952ID70476ID70404BrGMS2203ID79786ID78356ID78230ID78744
ID79097ID77264
ID79679SSR600ID79555ID79446ID94273ID80857
BoGMS678ID75404
ID82430ID82193
154.7
9.315.116.116.926.326.828.734.454.477.778
82.3100.6102.7104.6106.4106.6107
119.2120.8129.5147.6152.1
0C3
ID84702
ID83180
ID84630
ID83438
BoGMS836
ID83962
ID84316
BnGMS275
ID85015
BoGMS2306
BnGMS359
BoGMS1031
ID84962
SSR45
BoGMS3532
0
2.8
10
13.2
19.3
19.6
22.6
34.3
34.7
36.5
39.6
38.5
37.7
79.7
83.6
C4ID82921ID83127ID83180
ID83438
ID83673
ID83962ID84089ID84125
ID84341
ID84630
ID84862
ID85015
ID83253
ID83626
ID83706ID83832ID83862
ID84171ID84316
ID84442
ID84702
ID84948ID84962
ID85224ID85348ID85625ID85740
1.53.74.24.77.18.2
10.110.711.311.512.112.713
14.215.416.417.119.621.125.526.627
27.528.530.936.237.1
C4
ID86298
ID87883
ID86571
ID86603ID86597
ID87020ID86752
ID87100ID87103ID87150ID87234ID87241ID87410ID87508ID87554ID87573ID87596ID87806
ID87972ID88006ID88085
0.31.82
2.62.1
5.97.17.214
14.314.417.4
19.118
24.921.9
27.126
28.428.831.1
C5
C5
86
75.2
10.1
5.6
0 ID86571
SSR25
ID86752
ID87883
ID87972
C6
ID92336
ID92882
0
1.7
9.1
24
37.1
67.3
80.7 ID88271
BoGMS1727
ID90852
ID90279
BrGMS1476
0.10.31.33
4.24.95.15.87
11.312.112.5
14.313.3
31.8
22.5
41.6
43.3
37.736.2
38.839.8
42.4
34.933.4
3130.229
28.326.725.1
44.5
ID89477
45.6
ID88158ID88187ID88271ID88391
ID88596
ID88528
ID88804ID88671
ID88580
ID88890ID88994ID89046ID89166ID89275
ID89584ID89815ID89851ID89879ID90051
ID90279ID90501ID90692ID90852ID91123
ID90184
ID91391
ID91970ID91670
ID92106ID92336ID92882ID93178
C6
Fig. 1 continued
79 Page 10 of 13 Mol Breeding (2016) 36:79
123

when using SSR markers. Thus, single-locus INDELs
markers are more user-friendly than SSRs and have
been extensively used in forensic analysis (da Costa
Francez et al. 2012; Murthy et al. 2015; Pereira et al.
2009). In this study, 523 out of 595 INDELs markers
confirmed to be polymorphic among the 23 ILs, and
only 69 INDELs markers were monomorphic, sug-
gesting that the INDELs identified using re-sequenc-
ing data are reliable. The monomorphic INDELs
might be confounded by paralogous or homeologous
sequences. Furthermore, 530 out of 595 (86.9 %)
INDELs were detected to be single locus in the 23
inbred lines. Further survey in a segregating popula-
tion of RILs with 134 polymorphic INDELs markers
confirmed that they are truly single locus. The high
rate of single-locus marker indicated that the screening
for uniqueness is efficient for improving the rate of
single-locus marker. In addition, these INDELs vari-
ations were in the size range of 2–5 bp in length, thus
could be easily separated and scored on PAGE gels
and on capillary sequencers with multiple loadings.
We believe that these INDELs markers identified in
this study will greatly promote gene mapping and
marker-assisted oilseed rape breeding.
Acknowledgments This work was supported by the National
Hi-Tech R&D Program (2013AA102602) and the National
Natural Science Foundation of China (31071452).
Authors’ contribution statement SM, XY and JC performed
the experiments. JC developed the RILs. ZL and BW performed
the bioinformatics analyses. KL, SM and ZL wrote the paper.
KL conceived and supervised this study. The manuscript was
read and approved by all authors.
Compliance with ethical standards
Conflict of interest The authors declare that they have no
conflict of interest.
References
Arai-Kichise Y, Shiwa Y, Nagasaki H, Ebana K, Yoshikawa H,
Yano M, Wakasa K (2011) Discovery of genome-wide
DNA polymorphisms in a landrace cultivar of Japonica rice
by whole-genome sequencing. Plant Cell Physiol
52:274–282
Bekele WA, Wieckhorst S, Friedt W, Snowdon RJ (2013) High-
throughput genomics in sorghum: from whole-genome
resequencing to a SNP screening array. Plant Biotechnol J
11:1112–1125
Cai G, Yang Q, Yi B, Fan C, Edwards D, Batley J, Zhou Y
(2014) A complex recombination pattern in the genome of
allotetraploid Brassica napus as revealed by a high-density
genetic map. PLoS ONE 9:e109910
Chalhoub B, Denoeud F, Liu S, Parkin IAP, Tang H, Wang X,
Chiquet J, Belcram H, Tong C, Samans B, Correa M, Da-
Silva C, Just J, Falentin C, Koh CS, Clainche IL, Bernard
M, Bento P, Noel B, Labadie K, Alberti A, Charles M,
Arnaud D, Guo H, Daviaud C, Alamery S, Jabbari K, Zhao
M, Edger PP, Chelaifa H, Tack D, Lassalle G, Mestiri I,
Schnel N, Le-Paslier M, Fan G, Renault V, Bayer PE,
Golicz AA, Manoli S, Ho Lee T, Thi VHD, Chalabi S, Hu
Q, Fan C, Tollenaere R, Lu Y, Battail C, Shen J, Sidebot-
tom CHD, Wang X, Canaguier A, Chauveau A, Berard A,
0.11.82.33.25.35.56
7.79.49.910.412.213.414.315.916.216.918.520.121.621.822.223.623.724.125.226
26.527.528.329.433.235
35.537.539.2
ID93774ID93800ID93878ID93948ID94157ID94197ID94273ID94471ID94584ID94607ID94629ID94719ID94850ID94882ID94961ID95017ID95033ID95257ID95348ID95402ID95444ID95484ID95515ID95539ID95579ID95650ID95713ID95797ID95902ID96029ID96116ID96306ID96391ID96471ID96569ID96593
C7
C7ID96593
ID94850
ID95902
BnGMS965
0
6.6
10.8
14.4
11.32.43.73.85
7.58.38.79.1
10.610.712.814.318.119.724.624.726.227.129.129.730.431.333.434.434.835.336.436.536.937.838.8
ID96800ID96844ID96888ID96922ID96925ID96974ID97045ID97141ID97211ID97249ID97283D97285ID97346ID97390ID97472ID97517ID97898ID97914ID98009ID98122ID98361ID98522ID98732ID98999ID99536ID99791ID99875ID99978ID100221ID100258ID100320ID100565ID100723
C8
BnEMS1070
C8
BoGMS927
BoEMS44
BnEMS612
ID100320
0
9.5
17.7
11.3
40.7
4.45.36.16.58.88.79.510.611.713.318.222.123.224.126.326.828.6
30.431.333.134.535.73636.63838.8
29.3
ID100980
ID101162ID101040
ID101189ID101380ID101415
ID102178
ID101534ID101598ID101717ID101769ID101806ID101993ID102108
ID102236ID102301ID102367ID102450ID102602ID102717ID103056ID103265ID103493ID103562ID103647ID103913ID104010
C9
C9
BoGMS1283
ID103265
ID101189
ID101534
SSR548
0
0.5
16.1
21.8
24.5
Fig. 1 continued
Mol Breeding (2016) 36:79 Page 11 of 13 79
123

Deniot G, Guan M, Liu Z, Sun F, Lim YP, Lyons E, Town
CD, Bancroft I, Wang X, Meng J, Ma J, Pires JC, King GJ,
Brunel D, Delourme R, Renard M, Aury J, Adams KL,
Batley J, Snowdon RJ, Tost J, Edwards D, Zhou Y, HuaW,
Sharpe AG, Paterson AH, Guan C, Wincker P (2014) Early
allopolyploid evolution in the post-Neolithic Brassica
napus oilseed genome. Science 345:950–954
Cheng X, Xu J, Xia S, Gu J, Yang Y, Fu J, Qian X, Zhang S, Wu
J, Liu K (2009) Development and genetic mapping of
microsatellite markers from genome survey sequences in
Brassica napus. Theor Appl Genet 118:1121–1131
Cheung F, Trick M, Drou N, Lim YP, Park J, Kwon S, Kim J,
Scott R, Pires JC, Paterson AH, Town C, Bancroft I (2009)
Comparative analysis between homoeologous genome
segments of Brassica napus and its progenitor species
reveals extensive sequence-level divergence. Plant Cell
21:1912–1928
Ching A, Caldwell KS, Jung M, Dolan M, Smith OS, Tingey S,
Morgante M, Rafalski AJ (2002) SNP frequency, haplo-
type structure and linkage disequilibrium in elite maize
inbred lines. BMC Genet 3:164
Da Costa Francez PA, Rodrigues EMR, de Velasco AM, dos
Santos SEB (2012) Insertion–deletion polymorphisms—uti-
lization on forensic analysis. Int J Legal Med 126:491–496
Delourme R, Falentin C, Fomeju BF, Boillot M, Lassalle G,
Andre I, Duarte J, Gauthier V, Lucante N, Marty A, Pau-
chon M, Pichon J, Ribiere N, Trotoux G, Blanchard P,
Riviere N, Martinant J, Pauquet J (2013) High-density
SNP-based genetic map development and linkage dise-
quilibrium assessment in Brassica napus L. BMC Genom
14:156
DePristo MA, Banks E, Poplin R, Garimella KV, Maguire JR,
Hartl C, Philippakis AA, Angel G, Rivas MA, Hanna M,
McKenna A, Fennell TJ, Kernytsky AM, Sivachenko AY,
Cibulskis K, Gabriel SB, Altshuler D, Daly MJ (2011) A
framework for variation discovery and genotyping using
next-generation DNA sequencing data. Nat Genet
43:491–498
Gupta PK, Varshney RK (2000) The development and use of
microsatellite markers for genetic analysis and plant
breeding with emphasis on bread wheat. Euphytica
113:163–185
Huang S, Deng L, Guan M, Li J, Lu K, Wang H, Fu D, Masson
AS, Liu S, Hua W (2013) Identification of genome-wide
single nucleotide polymorphisms in allopolyploid Brassica
napus. BMC Genom 14:717
Jander G, Norris SR, Rounsley SD, Bush DF, Levin IM, Last RL
(2002) Arabidopsis map based cloning in the post-genome
era. Plant Physiol 129:440–450
Jiang C, Ramchiary N, Ma Y, Jin M, Feng J, Li R, Wang H,
Long Y, Choi SR, Zhang C, Cowling WA, Park BS, Lim
YP, Meng J (2011) Structural and functional comparative
mapping between the Brassica A genomes in allotetraploid
Brassica napus and diploid Brassica rapa. Theor Appl
Genet 123:927–941
Kosambi DD (1944) The estimation of map distances from
recombination values. Ann Eugen 12:172–175
Li H, Durbin R (2009) Fast and accurate short read alignment
with Burrows–Wheeler transform. Bioinformatics
25:1754–1760
Li H, Handsaker B, Wysoker A, Fennell T, Ruan J, Homer N,
Marth G, Abecasis G, Durbin R, 1000 Genome Project
Data Processing Subgroup (2009) The sequence alignment/
map format and SAMtools. Bioinformatics 25:2078–2079
Li H, Chen X, Yang Y, Xu J, Gu J, Fu J, Qian X, Zhang S, Wu J,
Liu K (2010) Development and genetic mapping of
microsatellite markers from whole genome shotgun
sequences in Brassica oleracea. Mol Breed 28:585–596
Li H, Younas M, Wang X, Li X, Chen L, Zhao B, Chen X, Xu J,
Hou F, Hong B, Liu G, Zhao H, Wu X, Du H, Wu J, Liu K
(2013) Development of a core set of single-locus SSR
markers for allotetraploid rapeseed (Brassica napus L.).
Theor Appl Genet 126:937–947
LiW, Cheng J, Wu Z, Qin C, Tan S, Tang X, Cui J, Zhang L, Hu
K (2015) An INDEL-based linkage map of hot pepper
(Capsicum annuum). Mol Breed 35:32–37
Lim YP, Plaha P, Choi SR, Uhm T, Hong CP, Bang JW, Hur YK
(2006) Toward unraveling the structure of Brassica rapa
genome. Physiol Plant 126:585–591
Liu B, Wang Y, Zhai W, Deng J, Wang H, Cui Y, Cheng F,
Wang X, Jian Y, Wu J (2012) Development of INDEL
markers for Brassica rapa based on whole-genome re-se-
quencing. Theor Appl Genet 126:231–239
Liu S, Liu Y, Yang X, Tong C, Edwards D, Parkin IAP, ZhaoM,
Ma J, Yu J, Huang S, Wang X, Wang J, Lu K, Fang Z,
Bancroft I, Yang T, Hu Q, Wang X, Yue Z, Li H, Yang L,
Wu J, Zhou Q, Wang W, King GJ, Pires JC, Lu C, Wu Z,
Sampath P, Wang Z, Guo H, Pan S, Yang L, Min J, Zhang
D, Jin D, Li W, Belcram H, Tu J, GuanM, Qi C, Du D, Li J,
Jiang L, Batley J, Sharpe AG, Park B, Ruperao P, Cheng F,
Waminal NE, Huang Y, Dong C, Wang L, Li J, Hu Z,
Zhuang M, Huang Y, Huang J, Shi J, Mei D, Liu J, Lee T,
Wang J, Jin H, Li Z, Li X, Zhang J, Xiao L, Zhou Y, Liu Z,
Liu X, Qin R, Tang X, Liu W, Wang Y, Zhang Y, Lee J,
Kim HH, Denoeud F, Xu X, Liang X, Hua W, Wang X,
Wang J, Chalhoub B, Paterson AH (2014) The Brassica
oleracea genome reveals the asymmetrical evolution of
polyploid genomes. Nat Commun 5:3930Lukowitz W, Gillmor CS, Scheible W (2000) Positional cloning
in Arabidopsis: why it feels good to have a genome ini-
tiative working for you. Plant Physiol 123:795–805
Lv H, Wang Q, Zhang Y, Yang L, Fang Z, Wang X, Liu Y,
Zhuang M, Lin Y, Yu H, Liu B (2014) Linkage map con-
struction using INDEL and SSR markers and QTL analysis
of heading traits in Brassica oleracea var. capitata L. Mol
Breed 34:87–98
McKenna A, Hanna M, Banks E, Sivachenko A, Cibulskis K,
Kernytsky A, Garimella K, Altshuler D, Gabriel S, DalyM,
DePristo MA (2010) The genome analysis toolkit: a
mapreduce framework for analyzing next-generation DNA
sequencing data. Genome Res 20:1297–1303
Mills RE, Luttig CT, Larkins CE, Beauchamp A, Tsui C, Pittard
WS, Devine SE (2006) An initial map of insertion and
deletion (INDEL) variation in the human genome. Genome
Res 16:1182–1190
Murthy V, Jia LF, Vijaya VP, Kademane K (2015) Forensic
identification by using insertion-deletion polymorphisms.
Int J Hum Genet 15:55–59
Ollitrault F, Terol J, Martin AA, Pina JA, Navarro L, Talon M,
Ollitrault P (2012) Development of indel markers from
79 Page 12 of 13 Mol Breeding (2016) 36:79
123

Citrus clementina (Rutaceae) BAC-end sequences and
interspecific transferability in Citrus. Am J Bot 99:268–273
Pacurar DI, Pacurar ML, Street N, Bussell JD, Pop TI, Gutierrez
L, Bellini C (2012) A collection of INDEL markers for
map-based cloning in seven Arabidopsis accessions. J Exp
Bot 63:2491–2501
Pan CH, Li AH, Dai Z, Zhang H, Liu G, Wang Z, Ma Y, Yin Y,
Zhang Y, Zuo S, Chen Z, Pan X (2008) INDEL and SNP
markers and their applications in map-based cloning of rice
genes. Rice Sci 15:251–258
Park S, Yu HJ, Mun JH, Lee SC (2010) Genome-wide discovery
of DNA polymorphism in Brassica rapa. Mol Genet
Genomics 283:135–145
Patel RK, Jain M (2012) NGS QC toolkit: a toolkit for quality
control of next generation sequencing data. PLoS ONE
7:e30619
Pereira R, Phillips C, Alves C, Amorim A, Carracedo A, Gus-
mao L (2009) Insertion/deletion polymorphisms: a multi-
plex assay and forensic applications. Forensic Sci Int Genet
Suppl Ser 2:513–515
Shedlock AM, Okada N (2000) SINE insertions: powerful tools
for molecular systematics. Bio Essays 22:148–160
Shen YJ, Jiang H, Jin JP, Zhang ZB, Xi B, He YY, Wang G,
Wang C, Qian L, Li X, Yu QB, Liu HJ, Chen DH, Gao JH,
Huang H, Shi TL, Yang ZN (2004) Development of gen-
ome-wide DNA polymorphism database for map-based
cloning of rice genes. Plant Physiol 135:1198–1205
Shi J, Huang S, Zhan J, Yu J, Wang X, Hua W, Liu S, Liu G,
Wang H (2014) Genome-wide microsatellite
characterization and marker development in the sequenced
Brassica crop species. DNA Res 21:53–68
Udall JA, Quijada PA, Osborn TC (2005) Detection of chro-
mosomal rearrangements derived from homologous
recombination in four mapping populations of Brassica
napus L. Genetics 169:967–979
Wang Y, Sun S, Liu B, Wang H, Deng J, Liao Y, Wang Q,
Cheng F, Wang X, Wu J (2011) A sequence-based genetic
linkage map as a reference for Brassica rapa pseu-
dochromosome assembly. BMC Genom 12:239
Xiao Y, Cai D, Yang W, Ye W, Younas M, Wu J, Liu K (2012)
Genetic structure and linkage disequilibrium pattern of a
rapeseed (Brassica napus L.) association mapping panel
revealed by microsatellites. Theor Appl Genet 125:437–
447
Xu J, Qian X, Wang X, Li R, Cheng X, Yang Y, Fu J, Zhang S,
King GJ, Wu J, Liu K (2010) Construction of an integrated
genetic linkage map for the A genome of Brassica napus
using SSR markers derived from sequenced BACs in B.
rapa. BMC Genom 11:594
Yang J, Wang Y, Shen H, YangW (2014) In silico identification
and experimental validation of insertion-deletion poly-
morphisms in tomato genome. DNA Res 21:429–438
Zeng YX, Wen ZH, Ma LY, Ji ZJ, Li XM, Yang CD (2013)
Development of 1047 insertion-deletion markers for rice
genetic studies and breeding. Genet Mol Res 12:5226–
5235
Mol Breeding (2016) 36:79 Page 13 of 13 79
123

本文献由“学霸图书馆-文献云下载”收集自网络,仅供学习交流使用。
学霸图书馆(www.xuebalib.com)是一个“整合众多图书馆数据库资源,
提供一站式文献检索和下载服务”的24 小时在线不限IP
图书馆。
图书馆致力于便利、促进学习与科研,提供最强文献下载服务。
图书馆导航:
图书馆首页 文献云下载 图书馆入口 外文数据库大全 疑难文献辅助工具