development of monoclonal antibody and enzyme linked
TRANSCRIPT

Louisiana State UniversityLSU Digital Commons
LSU Historical Dissertations and Theses Graduate School
1999
Development of Monoclonal Antibody andEnzyme Linked Immunosorbent for Detection ofOff -Flavor Compound 2-Methylisoborneol.Eun Sung ParkLouisiana State University and Agricultural & Mechanical College
Follow this and additional works at: https://digitalcommons.lsu.edu/gradschool_disstheses
This Dissertation is brought to you for free and open access by the Graduate School at LSU Digital Commons. It has been accepted for inclusion inLSU Historical Dissertations and Theses by an authorized administrator of LSU Digital Commons. For more information, please [email protected].
Recommended CitationPark, Eun Sung, "Development of Monoclonal Antibody and Enzyme Linked Immunosorbent for Detection of Off -FlavorCompound 2-Methylisoborneol." (1999). LSU Historical Dissertations and Theses. 7054.https://digitalcommons.lsu.edu/gradschool_disstheses/7054
INFORMATION TO USERS
This manuscript has been reproduced from the microfilm master. UMI films the text directly from the original or copy submitted. Thus, some thesis and dissertation copies are in typewriter face, while others may be from any type of computer printer.
The quality of this reproduction is dependent upon the quality of the copy submitted. Broken or indistinct print, colored or poor quality illustrations and photographs, print bleedthrough, substandard margins, and improper alignment can adversely affect reproduction.
In the unlikely event that the author did not send UMI a complete manuscript and there are missing pages, these will be noted. Also, if unauthorized copyright material had to be removed, a note will indicate the deletion.
Oversize materials (e.g., maps, drawings, charts) are reproduced by sectioning the original, beginning at the upper left-hand comer and continuing from left to right in equal sections with small overlaps.
Photographs included in the original manuscript have been reproduced xerographically in this copy. Higher qualify 6" x 9* black and white photographic prints are available for any photographs or illustrations appearing in this copy for an additional charge. Contact UMI directly to order.
Bell & Howell Information and Learning 300 North Zeeb Road, Ann Arbor, Ml 48106-1346 USA
mvLf800-521-0600
Reproduced with permission of the copyright owner. Further reproduction prohibited without permission.

Reproduced with permission of the copyright owner. Further reproduction prohibited without permission.

DEVELOPMENT OF MONOCLONAL ANTIBODY AND ENZYME LINKED IMMUNOSORBENT ASSAY FOR DETECTION OF OFF-FLAVOR
COMPOUND 2-METHYLISOBORNEOL
A Dissertation
Submitted to the Graduate Faculty o f the Louisiana State University and
Agricultural and Mechanical College in partial fulfillment of the
requirements for the degree o f Doctor o f Philosophy
in
The Department of Food Science
byEun Sung Park
B.S., Korea University, 1991 M.S., Korea University, 1993
December 1999
Reproduced with permission of the copyright owner. Further reproduction prohibited without permission.

UMI Number 9951614
___ <g>
UMIUMI Microform9951614
Copyright 2000 by Bell & Howell Information and Learning Company. All rights reserved. This microform edition is protected against
unauthorized copying under Title 17, United States Code.
Bell & Howell Information and Learning Company 300 North Zeeb Road
P.O. Box 1346 Ann Arbor, Ml 48106-1346
Reproduced with permission of the copyright owner. Further reproduction prohibited without permission.
DEDICATION
To my lovely wife Young Ju Lee, whose love and patience gave me the
power to overcome whenever there were troubles and difficulties. I am glad that I
have a chance to show my love and my appreciation to her.
To my lovely boy Han Bin Park, his presence in this world brings the most
joy and happiness to me. My boy, I will try hard to be a good father.
To my mother and father, I wouldn’t have been able to complete this study
without their love and support. I have always loved you and I am proud of you.
a
Reproduced with permission of the copyright owner. Further reproduction prohibited without permission.

ACKNOWLEDGEMENT
I would like to thank to Dr. Leslie Plhak for her help, support and
wonderful advice as my major advisor. I also thank Dr. Douglas L. Park, Dr. J.
Samuel Godber and Dr. Ronald J. Siebeling for their kind advice, suggestions,
encouragement and support on this thesis.
I would like to thank to Dr. Witoon Prinyawiwatukul and Dr. Joan M.
King for their encouragement and advice whenever I had a frustration and
difficulties. It was really big help for me to overcome the difficulties while I was
in this Ph. D. program.
I feel that 1 had enjoyed studying in this food science department and I
really appreciate the help and support from all o f the students and faculty in this
department.
iii
Reproduced with permission of the copyright owner. Further reproduction prohibited without permission.
TABLE OF CONTENTS
DEDICATION........................................................................................................... ii
ACKNOWLEDGEMENT....................................................................................... iii
LIST OF TABLES...................................................................................................-vi
LIST OF FIGURES.................................................................................................vii
ABSTRACT............................................................................................................... x
CHAPTER 1. INTRODUCTION............................................................................ 1
CHAPTER 2. REVIEW OF LITERATURE......................................................... 32.1 Off-flavor problem in water and aquaculture industries............................ 3
2.1.1 Off-flavor problems in water and aquaculture industries............... 32.1.2 Occurrence of off-flavor compounds in natural waters...................52.1.3 Earthy-musty or muddy flavor in fish..............................................72.1.4 Off-flavor problems in the catfish industry......................................92.1.5 Economic burden............................................................................. 112.1.6 Detection thresholds o f off-flavor compounds...............................13
2.2 Production of off-flavor compounds by microorganism........................ 152.2.1 Production of off flavor compounds by actinomycetes.................152.2.2 Production of off-flavor compounds by blue-green algae.............16
2.3 Control o f off-flavor compounds in the aquacuture industry................ 232.3.1 Uptake of odorous compounds in fish............................................242.3.2 Depuration of off-flavor compounds from fish .............................272.3.3 Pond management and off-flavor....................................................30
2.4 Analysis o f off-flavor compounds............................................................332.4.1 Analysis of off-flavor compounds by gas chromatography mass
spectrometry (GC-MS)..................................................................... 342.4.2 Analysis o f off-flavor compounds by sensory analysis................ 392.4.3 Analysis o f off-flavor compounds by enzyme linked immuno
sorbent assay (ELISA)..................................................................... 392.5 Enzyme immunoassay and production o f monnoclonal antibody 40
2.5.1 Enzyme immunoassay..................................................................... 402.5.2 Development o f monoclonal antibody........................................... 41
2.6 Current research objectives....................................................................... 44
CHAPTER 3. MATERIALS AND METHODS.................................................453.1 Materials...................................................................................................... 453.2 Procedures................................................................................................... 46
3.2.1 Preparation of immunogen and solid phase protein conjugates... 463.2.1.1. Preparations o f bomeol-hemisuccinate, isobomeol-
hemisuccinate and MIB-hemisuccinate................................. 46
iv
Reproduced with permission of the copyright owner. Further reproduction prohibited without permission.

3.2.12 . Preparation of immunogens.................................................. 483.2.1.3 Preparation of solid phase protein conjugates.....................49
3.2.2 Preparation o f monoclonal antibody............................................. 513.2.2.1 Immunization..........................................................................513.2.2.2 Cell fusion and selection........................................................ 513.2.2.3 Cell cloning.............................................................................533.2.2.4 Ammonium sulfate precipitation o f monoclonal antibody ...54
3.2.3 Enzyme immunoassay (E l).............................................................563.2.3.1 Testing mice sera for determination of antibody tite r.........563.2.3.2 Competitive enzyme immunoassay......................................57
CHAPTER 4. RESULTS AND DISCUSSION...................................................614.1 Production o f immunogen and solid phase protein conjugate................ 6 14.2 Production o f monoclonal antibody......................................................... 68
4.2.1 Test o f mouse polyclonal antibody................................................684.2.2 Fusion and screening of mouse 1 and 2 immunized with
MIB-LPH......................................................................................... 744.2.3 Fusion and screening o f mouse 3 that had been immunized with
bomeol-LPH.................................................................................... 784.2.4 Cloning of anti bomeol monoclonal antibody..............................78
4.3 Effects o f Ab and solid phase conjugate concentrations on the sensitivity of ELISA................................................................................ 804.3.1 Effect of Ab concentration on the sensitivity o f ELISA............ 804.3.2 Effect of solid phase conjugate concentrations on the sensitivity
o f ELISA........................................................................................ 924.4 Effect o f solid phase conjugate protein structure on the sensitivity o f
ELISA.......................................................................................................... 984.5 Specificity o f antibody............................................................................. 1054.6 Standard curve..........................................................................................110
CHAPTER 5. SUMMARY AND CONCLUSION...........................................114
REFERENCES...................................................................................................... 117
APPENDIX I. EPITOPE DENSITY DETERMINATION............................... 130APPENDIX H. SCREENING (1)........................................................................ 131APPENDIX Iff. SCREENING (2)....................................................................... 132APPENDIX IV. RESULT OF 1st CLONING..................................................... 133APPENDIX V. RESULT OF 2nd CLONING..................................................... 134APPENDIX VI. RESULT OF 3rd CLONING.................................................... 137
VITA.......................................................................................................................138
V
Reproduced with permission of the copyright owner. Further reproduction prohibited without permission.
LIST OF TABLES
Table
Table
Table
Table
Table
Table
Table
Table
Table
Table
Table
Table
. Threshold odor concentrations o f geosmin and MIB reported in the literature.......................................................................................... 14
L Blue green algae previously reported to produce geosmin in the literature........................................................................... 19
. Blue green algae previously reported to produce MIB in the Literature.................................................................................................. 21
k Gas chromatography Mass spectrometry method reported in the literature for the detection o f off-flavor compounds, geosmin and M IB............................................................................................................. 37
k R f values o f hemisuccination reaction product...................................... 67
Molecular weight and hapten numbers o f solid phase protein conjugates. Each molecular weight was determined by M ALDI............................. 71
r. Effects o f Ab concentrations on the sensitivity o f ELISA when MIB- BSA was used as coating protein..............................................................86
!. Effects o f Ab concentrations on the sensitivity o f ELISA when bomeol-BSA was used as coating protein.............................................. 91
k Effects o f solid phase conjugate (MIB-BSA) concentrations on the sensitivity o f ELISA................................................................................. 97
0. Effects o f solid phase conjugate (bomeol-BSA) concentrationson the sensitivity o f ELISA................................................................... 102
1. Test of solid phase structure effect...................................................... 109
2. Cross reactivity o f compounds that have similar structurewith M IB ................................................................................................I l l
vi
Reproduced with permission of the copyright owner. Further reproduction prohibited without permission.
LIST OF FIGURES
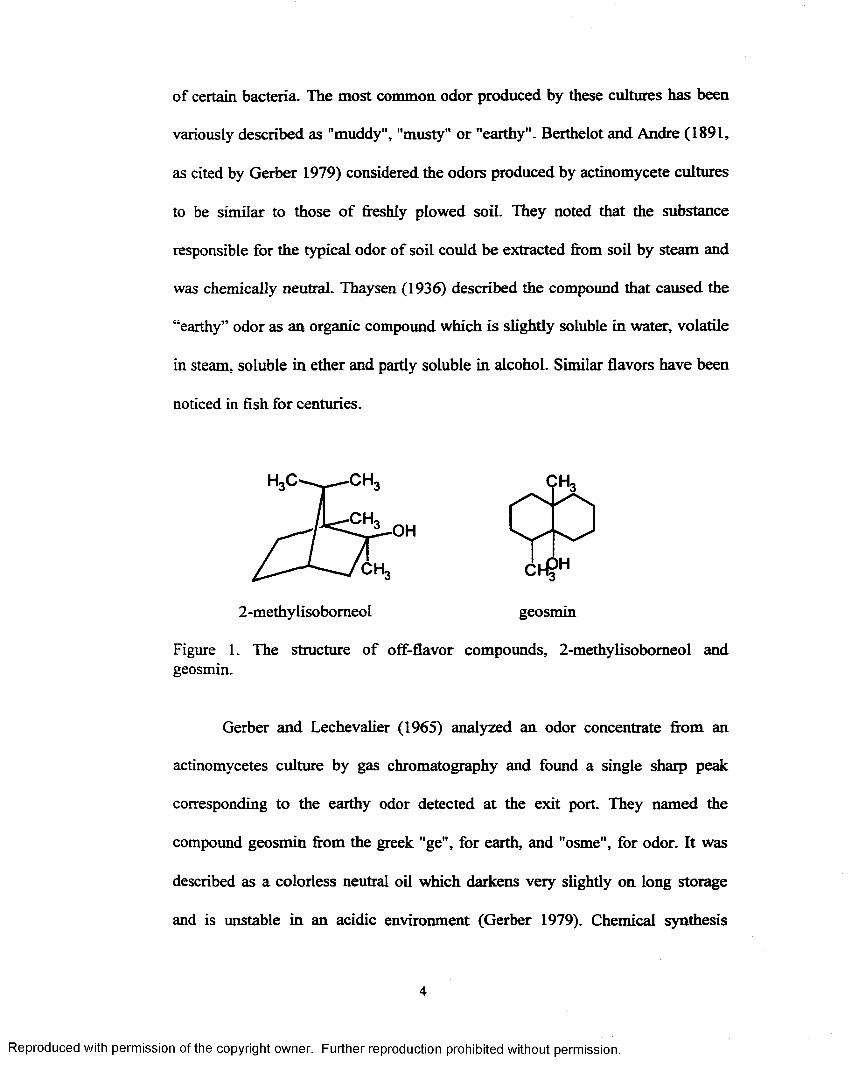
Figure 1. The structure o f off-flavor compounds, 2-methyIisobomeoland geosmin................................................................................................ 4
Figure 2. Preparation o f immunogen (bomeol-LPH)...........................................47
Figure 3. Production of monoclonal antibody by fusion o f splenocytes o fmouse with myeloma cells.......................................................................55
Figure 4. Procedure of competitive ELISA...........................................................59
Figure 5. Structures o f compounds that are used for the conjugation o fimmunogen and solid phase conjugate, 2-methylisobomeol, bomeol and isobomeol........................................................................................... 64
Figure 6. TLC result of MIB-hemisuccination..................................................... 65
Figure 7. TLC result of bomeol-hemisuccination........................................ 66
Figure 8. Matrix assisted laser desorption ionization (MALDI) spectrums for bovine serum albumin (BSA) and 2-methylisobomeol (MIB)-BSA conjugate....................................................................................................69
Figure 9. Matrix assisted laser desorption ionization (MALDI) spectrums for isobomeol-bovine serum albumin (BSA) and bomeol-BSA conjugate....................................................................................................70
Figure 10. Checker board ELISA o f mice (mouse land 2) sera afterimmunization of MIB-LPH two times................................................. 72
Figure 11. Checker board ELISA o f mice (mouse 3and 4) sera afterimmunization of bomeol-LPH two times............................................ 73
Figure 12. Test of mouse sera for the competitive inhibition o f binding to solid phase protein conjugate..........................................................................75
Figure 13. Cloning of cells for the production of Ab that specifically bind to free MIB after fusion o f splenocytes of mouse 2 (immunized with MIB-LPH) with myeloma cells............................................................77
Figure 14. Screening o f cells for the production of antibody after 5 days and 9 days fsuion o f splenocyets (mouse 3 immunized with bomeol-LPH) with myeloma cells...................................................... 79
vii
Reproduced with permission of the copyright owner. Further reproduction prohibited without permission.

Figure 15. Standard curves constructed using cell culture supernatants fromthree times cloned cell line f6b4g7b4.................................................. 81
Figure 16. Test o f primary Ab concentrations effect when high concentration(1 pg/ml) o f MIB-BSA was used as coating protein........................... 83
Figure 17. Test o f primary Ab concentrations effect when medium concentration (0.5pg/ml) of MIB-BSA was used as coating protein.............84
Figure 18. Test o f primary Ab concentrations effect when low concentration(0.25pg/ml) o f MIB-BSA was used as coating protein...................... 85
Figure 19. Test of primary Ab concentrations effect when high concentration(lpg/m l) o f bomeol-BSA was used as coating protein....................... 88
Figure 20. Test o f primary Ab concentrations effect when medium concentration (0.5pg/mi) of bomeol-BSA was used as coating protein....... 89
Figure 21. Test of primary Ab concentrations effect when low concentration(0.25pg/ml) o f bomeol-BSA was used as coating protein..................90
Figure 22. Test o f solid phase protein conjugate (MIB-BSA) concentrations effect when high concentration o f Ab (F6b4g7b4, 1/125 times) was used as a 1st A b ...................................................................................... 94
Figure 23. Test of solid phase protein conjugate (MIB-BSA) concentrations effect when medium concentration o f Ab (F6b4g7b4, 1/250 times) was used as a 1st A b............................................................................ 95
Figure 24. Test of solid phase protein conjugate (MIB-BSA) concentrations effect when low concentration o f Ab (F6b4g7b4,1/500 times) was used as a 1st A b............................................................................... 96
Figure 25. Test o f solid phase protein conjugate (bomeol-BSA) concentrations effect when high concentrations o f Ab (F6b4g7b4, 1/125 times) was used as a 1st A b...............................................................................99
Figure 26. Test o f solid phase protein conjugate (bomeol-BSA) concentrations effect when medium concentration o f Ab (F6b4g7b4,1/250 times) was used as a Ist A b............................................................................ 100
Figure 27. Test o f solid phase protein conjugate (bomeol-BSA) concentrations effect when low concentration o f Ab (F6b4g7b4, 1/500 times) was used as a 1st A b .................................................................................... 101
viii
Reproduced with permission of the copyright owner. Further reproduction prohibited without permission.

Figure 28. Comparison o f Ab titer using three different solid phase proteinconjugates ............................................................................................ 106
Figure 29. Comparison o f Solid phase conjugate affinity to anti bomeolmonoclonal antibody (F6b4g7b4)....................................................... 106
Figure 30. Test o f solid phase conjugate structure effect using 1/250 times o f 1st Ab (Cell line f6b4g7b4) and 0.5 pg/ml o f solid phase conjugates.............................................................................................. 107
Figure 31. Test o f solid phase conjugate structure effect using 1/125 times of 1st Ab (Cell line f6b4g7b4) and 1 pg/ml o f solid phase conjugates ............................................................................................ 108
Figure 32. Standard curve constructed using Ab concentration o f 1/250(f6b4g7b4) and 0.5 fig/ml o f MIB-BSA as a solid phase protein conjugate ............................................................................................ 113
ix
Reproduced with permission of the copyright owner. Further reproduction prohibited without permission.

A B S T R A C T
2-Methylisobomeol (MIB) is a secondary metabolite o f cyanobacteria and
fungi that causes earthy and musty taste and odor. This is a significant problem in
the aquaculture industry and large scale water supplies. Water and aquaculture
products exposed to this compound may become unacceptable to consumers.
Especially the accumulation of this compound in the fish flesh is a major problem
for the channel catfish industry. To monitor the levels o f this compound for
quality control and abatement, rapid, sensitive and inexpensive methods are
needed.
This research reports the development o f an indirect enzyme linked
immunosorbent assay (ELISA) for MIB using monoclonal antibodies. For the
preparation o f monoclonal antibodies against MEB, MLB-Limitius polyphemus
hemocyanin (LPH) and bomeol-LPH were synthesized as an immunogen. In
order to compare and optimize the effect of solid phase conjugate structure,
bomeol-bovine serum albumin (BSA), isobomeol-BSA, MIB-BSA were
synthesized as a solid phase protein conjugate. To produce monoclonal
antibodies, two mice (3-4 weeks, female, BALB/c) were immunized with
bomeol-LPH protein conjugate and another two mice were immunized with MIB-
LPH. Hybridoma cells were made by the fusion o f myeloma cells and spleen cells
o f the mice that showed high antibody titer and specificity. Hybridoma cells that
secreted high affinity monoclonal antibodies were cloned by the limiting dilution
method three times to ensure clonality. For the optimization o f ELISA, different
x
Reproduced with permission of the copyright owner. Further reproduction prohibited without permission.
Ab concentrations and different solid phase conjugate concentrations were tested.
At lower concentrations of antibody and solid phase conjugate, the sensitivity was
greatest, however the signal also began to decrease. The effect o f solid phase
conjugate structure was studied by comparing the sensitivity o f ELISA using
bomeol-BSA, isobomeoI-BSA, and MIB-BSA as a solid phase conjugate. When
MIB-BSA was used as a solid phase conjugate, the affinity for the free MIB was
improved against the affinity to MIB-BSA and the sensitivity o f ELISA was
greatest. By using anti-bomeol monoclonal antibody (1/250) and MIB-BSA (0.5
pg/ml) as a solid phase conjugate, standard curve was constructed from 100 mg/L
to 0.1 ng/L range. The linear range o f this standard curve was found to occur
between lng/L and I mg/L MIB. The detection limit, defined as the MIB
concentration giving an A/Ao value of 0.8, was found to be approximately lng/L.
xi
Reproduced with permission of the copyright owner. Further reproduction prohibited without permission.

CHAPTER 1. INTRODUCTION
Geosmin and 2-methylisobomeol are produced by blue green algae,
filamentous bacteria and fungi (Gerber, 1967; Dionigi et al., 1992; Safferman et
al., 1967; Lovell and Sackey, 1973). These compounds can impart musty and
earthy off-flavors to potable water, aquaculture raised fishes and food, causing
economic losses in these and related industries (Lorio et al., 1992). As low
amounts of these compounds are required for “off-flavor” and microorganisms
that produce these compounds are ubiquitous, the musty flavor compounds
geosmin and 2-methylisobomeol are a problem in the potable water and
aquaculture industries.
These two main compounds responsible for earthy and musty flavors are
synthesized by blue green algae and actinomycetes. They are taken up through the
gills and accumulate in the fatty tissues (Tucker and Martin, 1991).
Farm raised catfish (Ictalurus punctatus) has gained wide acceptance
among consumers as a high quality product with a mild flavor. Fish producers are
most affected by the off-flavor problem because o f their inability to market their
fish crop when desired. The first step of quality control in the processing o f farm
raised catfish is a flavor evaluation to check for the presence of off-flavors. Off-
flavor fish can not be harvested and brought to the market. If harvested fish arrive
at a processing plant and are determined to be off-flavor, they are returned to the
pond. The most often used practice for off-flavor improvement is depurating the
1
Reproduced with permission of the copyright owner. Further reproduction prohibited without permission.
undesirable odor or flavor by changing the environment and holding for an
indefinite period o f time (Arganosa and Flick, 1992).
Producers are doing a thorough job o f screening and taste testing fish and
water for flavor quality to maintain standards (Chung et al., 1991). Sensory
evaluation is the most sensitive method o f analysis currently available (Johnsen
and Kelly, 1990). However, as it is a subjective method, it may show large
variation between tasters and between replicate samples.
Gas chromatographic (GC) methods for the determination o f geosmin
have been developed and are non-subjective. However the lack o f sensitivity,
expense, technical training, extensive sample preparation and variability limit the
application of these methods by industry.
Immunochemical methods can be accurate, simple and sensitive. There is
a great demand for a rapid, sensitive and non-subjective method for monitoring
off-flavor problems in the catfish production and processing industries as well as
for research.
Polyclonal antibody produced by Chung et al. (1990) was not acceptable
because of poor sensitivity. In this study a ELISA system was developed specific
for MIB and having a detection limit low enough to detect MIB from fish or water
without sample concentration.
Reproduced with permission of the copyright owner. Further reproduction prohibited without permission.

CHAPTER 2. REVIEW OF LITERATURE
2.1 Off-flavor problem In water and aquaculture industries
2.1.1 Off-flavor problems in water and in aquaculture industries
"Off-flavors" are objectionable tastes or odors in water or foods. Off-
flavors in fish can be caused by feed ingredients, natural foods, post-mortem
oxidative rancidity, or odorous compounds absorbed from the environment.
Sources o f environment related off-flavors include chemical pollution and extra
cellular metabolites of aquatic bacteria or algae. Organic compounds responsible
for off-flavors are rapidly absorbed by fish from water and stored in lipid rich
tissues; elimination is relatively slow (Tucker and Martin, 1991).
Two metabolites, which are the primary compounds responsible for earthy
or musty "off-flavor" in fresh catfish, are geosmin (la , 10b-dimethyl-9a-decalol)
(Figure 1) and 2-methylisobomeol (1-R-exo-l,2,7,7,-tetramethyl-bicycIo-[2.2.1]-
heptan-2-ol) (MIB) (Figure 1). These two compounds are metabolites synthesized
by some cyanobacteria, actinomycetes and fungi, and cause problems for the
potable water and aquaculture industries because o f the ubiquitousness of the
organisms that produce these metabolites (Hansen, 1964; Gerber, 1967;
Safferman et al., 1967; Lovell and Sackey, 1973; Izaguire et al., 1982; Persson,
1982; Yagi, 1983; Yagi et al., 1983; Aoyama, 1990; Izaguire and Taylor,1995).
A causal relationship between certain odors in surface waters and aquatic
microorganisms was suspected before the turn of the century. This relationship
was suggested by the similarity o f odors in water and odors produced in cultures
3
Reproduced with permission of the copyright owner. Further reproduction prohibited without permission.
of certain bacteria. The most common odor produced by these cultures has been
variously described as "muddy", "musty" or "earthy". Berthelot and Andre (1891,
as cited by Gerber 1979) considered the odors produced by actinomycete cultures
to be similar to those o f freshly plowed soil. They noted that the substance
was chemically neutral. Thaysen (1936) described the compound that caused the
“earthy” odor as an organic compound which is slightly soluble in water, volatile
in steam, soluble in ether and partly soluble in alcohol. Similar flavors have been
noticed in fish for centuries.
Figure 1. The structure o f off-flavor compounds, 2-methylisobomeol andgeosmin.
Gerber and Lechevalier (1965) analyzed an odor concentrate from an
actinomycetes culture by gas chromatography and found a single sharp peak
corresponding to the earthy odor detected at the exit port. They named the
compound geosmin from the greek "ge", for earth, and "osme", for odor. It was
described as a colorless neutral oil which darkens very slightly on long storage
and is unstable in an acidic environment (Gerber 1979). Chemical synthesis
responsible for the typical odor of soil could be extracted from soil by steam and
2-methylisobomeol geosmin
4
Reproduced with permission of the copyright owner. Further reproduction prohibited without permission.

revealed that geosmin had four isomers, but only one gave the earthy odor
(Marshall and Hochestettler, 1968).
Soon after the identity o f geosmin was known, another earthy-smelling
metabolite of actinomycetes was described (Gerber, 1969; Medsker et al., 1969).
This compound, 2-methyisobomeoI, was previously known as a synthetic product
prepared by methylation o f camphor. The odor of 2-methyisobomeol is musty or
earthy in dilute solution, but camphorous in concentrated solutions. This
compound has been isolated from soils and fresh waters worldwide (Tucker and
Martin, 1991). MIB is a small terpenoid compound with a boiling point o f 210 °C
(Rosen etal., 1970).
Geosmin and 2-methyIsiobomeol are synthesized via the isoprenoid
biosynthetic pathway (Bentley and Meganathan, 1981). Geosmin is probably
derived from a C-15 sesquiterpenoid by loss o f an isopropyl side group. 2-
methylisobomeol appears to be derived from methyl addition to a monoterpenoid.
Intermediate products and mechanisms controlling bisosynthesis are unknown.
The biosynthetic pathways for geosmin and 2-methylisobomeol are presumably
common to all organisms found to produce these compounds (Tucker and Martin,
1991).
2.1.2. Occurrence o f off-flavor compounds in natural waters
Offensive tastes and odors in potable water may arise in the raw water
supply, during treatment procedures at water works (chlorination), or by microbial
growth in the distribution systems. Off-flavors in fish are generally due to the
same compounds that cause a bad taste and odor in the water (Persson, 1983). In
5
Reproduced with permission of the copyright owner. Further reproduction prohibited without permission.

U.S. water supplies, offensive odors have been noticed since the 1850s, and in
European and Australian fisheries have been recorded since the beginning o f the
century. Off-flavors in natural waters have been known for a long time and they
are a world wide problem (Persson, 1983).
Various water supply systems have experienced elusive taste and odor
episodes not attributable to planktonic algae or actinomycetes. One such system is
that o f The Metropolitan Water District o f Southern California (U.S j V). It is a
major water wholesaler, serving about 12 million people in six counties, that
receives its water from the Colorado river and from northern California via the
massive State Water Project. In late 1974 and early 1975, there was an off-flavor
problem affecting the Colorado river portion o f the system, but no cause was
conclusively pinpointed. Again in September and October o f 1979, numerous
complaints o f musty taste were received, but despite extensive sampling
throughout the system, nothing was found that could explain the problem. In
September 1980, there was a recurrence o f earthy-musty odor in the water, but by
then the analytical methods for detecting odorous compounds in water had been
developed, and the problem was traced to MIB from a large source water reservoir
(McGuire et al., 1981; Izaguire et al., 1983).
The practical consequences o f off-flavors are obvious and include
consumer dissatisfaction, high treatment costs for water works, economic losses
for fisheries and reduced aesthetic value o f recreational areas (Persson, 1983). In
Finland, 75 water areas have been affected by off-flavors (Persson, 1978).
6
Reproduced with permission of the copyright owner. Further reproduction prohibited without permission.
Lake Biwa is the largest lake in Japan. A musty odor was first found in
1969, and since then musty odor problems commonly occurred from May to early
June due to the metabolites produced by Phormidium tenue in 1970s. The
problem in the summer of 1981 was found to be caused by an algal bloom o f
Anabaena macrospora. MIB was found to be produced by Phormidium tenue,
whereas geosmin by Anabaena macrospora (Yagi et al., 1983).
2.1.3. Earthy-musty or muddy flavor in fish
The first complete description o f the origin and nature of earthy off-flavors
in fish was provided by Thayson (1936) and Thayson and Pentelow (1936). They
associated the cause o f off-flavor in Atlantic salmon (Salmo salar) from certain
rivers in Scotland with actinomycetes present in decaying beds o f submerged
reeds along the river bank. Thayson (1936) speculated that the earthy compound
produced by these actinomycetes is absorbed across the gills and transported to
various tissues via the bloodstream. The earthy flavor was also experimentally
produced in fish exposed to concentrated distillates from cultures of
actinomycetes (Thayson and Pentelow, 1936). A casual relationship between
certain odors in surface waters and aquatic microorganisms was suspected before
the turn o f the century and production o f earthy odors by cultures of
actinomycetes has been recognized since before 1900 (Thaysen, 1936).
In experimental aquaculture areas in Manitoba studied by Tabachek and
Yurokowski (1976), 30% of the lakes were affected by muddy odor. In the
autumn o f 1969, a severe problem o f muddy odor in fish in the Oulu sea area in
Finland caused hundreds o f fisherman to lose income (Persson, 1974). A muddy-
7
Reproduced with permission of the copyright owner. Further reproduction prohibited without permission.

earthy flavor in rainbow trout (Salmo gairdnert), channel catfish (Ictalurus
punctatus) and carp (Cyprinrts carpio) has been associated with the presence of
species o f actinomycetes and blue green algae in aquatic environments (Arganosa
and Flick, 1992). The culturing o f rainbow trout in prairie pot-hole lakes in central
Canada has been impaired by the occurrence of this muddy-earthy flavor. Off-
flavor also has been reported as a comm on occurrence in carp ponds in China,
Japan, and Europe (Arganosa and Flick, 1992). Considerable research has been
conducted on earthy flavors in rainbow trout (Oncorhyncfms mykiss) cultured in
prairie pot-hole lakes in central Canada. Two highly odorous compounds,
geosmin and MIB, were confirmed as causes of the flavors, and cyanobacteria
capable o f producing these compounds were isolated and identified (Yurokowski
and Tabachek, 1974; Tabachek and Yurokowski, 1976). These two compounds
also caused off-flavor in walleye (Stizostedium vitreum), cisco (Coregonus
artedii), lake whitefish (Coregonus clupeaformis) and northern pike (Esox lucius)
from Cedar lake, an important commercial fishery in Manitoba, Canada
(Yurokowski and Tabachek, 1980).
Kuusi and Suihko (1983) surveyed off-flavors in fish from Finland from
1969 to 1981. Most o f the off-flavors were related to man-made pollution, but
earthy off-flavors were common, particularly in carp. Ashner et al. (1967)
reported from Israel that carp cultured in a sandy soil pond which was practically
mud-free and was supplied by water rich in plant nutrients were off-flavor. They
suspected the blue-green alga Oscillatora tenuis that was present in the pond to be
the cause o f earthy flavor.
8
Reproduced with permission of the copyright owner. Further reproduction prohibited without permission.
Bream, Abramis brama, from a shallow eutropic brackish water bay in the
Gulf o f Finland had a muddy flavor. This flavor was significantly correlated with
the amount o f Oscillatoria agardhii in the area (Persson, 1978, 1979, 1981).
Oscillatoria agardii and O. princeps were also suspected o f being the cause o f an
off-flavor which affected a lake in Germany (Comellius and Bandt, 1933 as cited
by Aschner et al., 1967).
Lovell (1971) reported that a characteristic, objectionable earthy-musty
flavor is frequently found in intensively cultured catfish in south-central and
southeastern United States. Heavy concentrations o f odor-producing
actinomycetes and blue-green algae have been identified in ponds with “earthy-
musty” flavored catfish and were suspected of being the organisms responsible for
the problem (Lovell and Sackey, 1973). It is clear from this evidence that an
earthy-musty or muddy flavor in fish is a common problem throughout the world
(Persson, 1983).
2.1.4. Off-flavor problems in the catfish industry
Off-flavors, associated with algal blooms in aquaculture are a major
problem for the channel catfish industry. These undesirable tastes in catfish result
from accumulation o f geosmin and 2-methylisobomeol in fish flesh. Warm water
temperature and high feeding rates are associated with the incidence of off-flavor
in catfish ponds ( Johnsen, 1989 and Johnsen and Dupree, 1991).
Earthy off-flavors in pond raised channel catfish were initially described
by Lovell and Sackey (1973) and Malgalig et al. (1973). The incidence o f off-
9
Reproduced with permission of the copyright owner. Further reproduction prohibited without permission.

flavor in channel catfish has increased dramatically as culture practices have
changed to increase fish yields (Brown and Boyd, 1982).
When ‘musty’ fish cannot be harvested and brought to the market, the fish
are held and fed until deemed “on-flavor’ by an experienced human taster
employed by the processing plant. Earthy/musty flavors constitute a significant
restriction to the growth o f the catfish industry. Fish that do not meet the
processor’s quality standards are called off-flavor and are not harvested until
flavor quality has improved enough for fish to be considered acceptable to
consumers. If the flavor of the fish sampled is unacceptable, the fish are rejected
for processing; fish are either not harvested or returned to the pond from the
transport truck (Tucker and Martin, 1991). The Research Committee o f the
Catfish Fanners o f America identified off-flavor as the most serious problem in
the industry. Reasons for the seriousness o f the problem are the high rate of
occurrence o f off-flavor, the damage that can be done to product image if off-
flavor fish get into market channels, and the lack of control measures for off-
flavor (Lelana, 1987).
Sensory scores for channel catfish sampled from four experimental ponds
at Stoneville, Mississippi (Tucker and Martin, 1991) illustrate the dynamic nature
of the incidence and severity o f off-flavor. On the initial sampling in July, all four
ponds were judged to contain acceptably flavored fish; in early October, three of
the four samples were judged off-flavor to varying degrees. Off-flavor episodes
varied from two weeks to over three months. The highest incidence o f off-flavor
occurred in September and October with samples from 10 of the 14 ponds judged
10
Reproduced with permission of the copyright owner. Further reproduction prohibited without permission.
off-flavor. The most intense off-flavors also occurred at this time; the flavor
described as "blue-green" (confirmed as being caused by MIB) was most common
and the most severe (Tucker and Martin, 1991). Studies of catfish culture ponds in
Alabama showed fish from 50-75 % o f the ponds sampled in late summer or early
fall were off-flavor and unacceptable for harvesting (Brown and Boyd, 1982;
Armstrong et al., 1986; Lovell et al., 1986). These two off-flavor compounds,
MIB and geosmin, afflicted 50-70% of the ponds involved in channel catfish
culture in Western Mississippi (Martin et al., 1987). The predominant off-flavor
was "earthy-musty". Geosmin was confirmed in 80% o f the fish with earthy-
musty off-flavors; MIB was not detected in any fish sampled (Lovell et al., 1986).
The reasons for the different chemical etiologies o f earthy-musty off-flavors in
Alabama and Mississippi are not known.
Total incidence of ponds with off-flavor fish, and the incidence o f earthy-
musty flavors increased during the summer growing season as phytoplankton
biomass increased in response to higher water temperatures and amounts o f feed
added to ponds. During the summer and autumn months approximately half o f the
commercially cultured channel catfish presented for processing at a given time,
are rejected because of objectionable flavor and odor (Martin et al., 1988a and
1990; Brown, 1996).
2.1.5. Economic burden
Producers o f channel catfish consistently identify environment related off-
flavors as their major production problem (Tucker and Martin, 1991). Pond
culture o f channel catfish is the largest aquaculture industry in the United States.
11
Reproduced with permission of the copyright owner. Further reproduction prohibited without permission.
In 1988, over 150 million kg o f fish were produced. About 80% o f the total was
produced in a limited geographical area o f west central Mississippi. In 1990,
about 62,000 ha of water were used to produce about 164 million kg o f catfish in
the United States. Alabama and Mississippi had about 12% and 60% of the total
area and catfish production (Hariyadi et al., 1994).
Keenum and Waldrop (1988) attempted to estimate the effects o f off-
flavor on production costs of Mississippi pond-raised channel catfish. When off-
flavor occurred during the winter, the only additional cost charged was an
opportunity cost for delayed income. When off-flavor occurred during the
summer growing season, interest was charged on the quantity o f fish that couldn't
be sold. Other potential costs accruing from off-flavor are difficult to estimate.
Fish may be lost to infectious diseases or poor water quality while the fish are in
inventory waiting for off-flavor to abate. Market constraints (not being able to sell
fish when they reach market size, also called quotas) also impact annual
production cost.
After production o f geosmin or MIB ceases, the compound is purged from
the fish. However the costs associated with delayed harvest o f off-flavor fish can
be substantial. For example, it has been estimated that environment-derived off-
flavor may add 10-20% to the cost o f producing channel catfish in the
southeastern United States (Paerl and Tucker, 1995). Holding market size fish in
inventory because o f off-flavor, restricts sales and cash-flow and increase the cost
of production by $0.02-0.20/lb fish because of feeding, aeration, and lost
opportunities to sell fish (Weirich, 1995).
12
Reproduced with permission of the copyright owner. Further reproduction prohibited without permission.
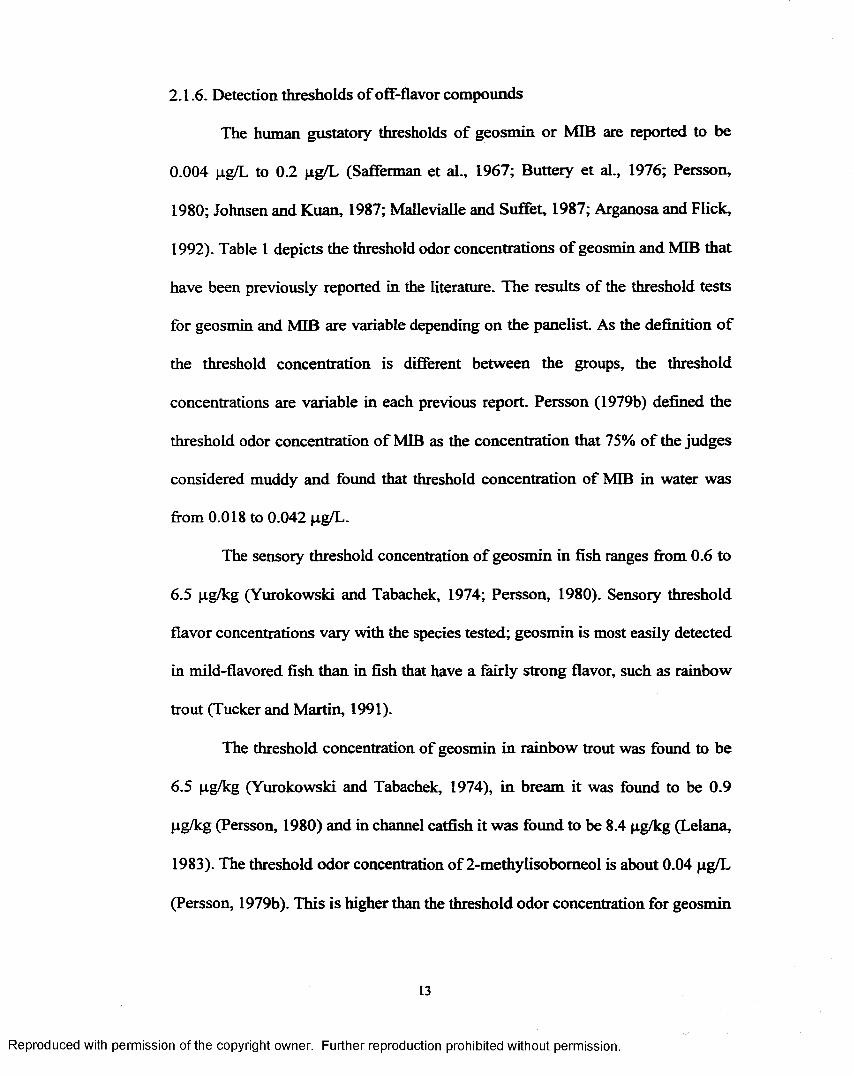
2.1.6. Detection thresholds o f off-flavor compounds
The human gustatory thresholds o f geosmin or MIB are reported to be
0.004 pg/L to 0.2 pg/L (Safferman et al., 1967; Buttery et al., 1976; Persson,
1980; Johnsen and Kuan, 1987; Mallevialle and Suffet, 1987; Arganosa and Flick,
1992). Table 1 depicts the threshold odor concentrations o f geosmin and MIB that
have been previously reported in the literature. The results of the threshold tests
for geosmin and MIB are variable depending on the panelist. As the definition o f
the threshold concentration is different between the groups, the threshold
concentrations are variable in each previous report. Persson (1979b) defined the
threshold odor concentration o f MIB as the concentration that 75% o f the judges
considered muddy and found that threshold concentration of MIB in water was
from 0.018 to 0.042 pg/L.
The sensory threshold concentration o f geosmin in fish ranges from 0.6 to
6.5 pg/kg (Yurokowski and Tabachek, 1974; Persson, 1980). Sensory threshold
flavor concentrations vary with the species tested; geosmin is most easily detected
in mild-flavored fish than in fish that have a fairly strong flavor, such as rainbow
trout (Tucker and Martin, 1991).
The threshold concentration o f geosmin in rainbow trout was found to be
6.5 pg/kg (Yurokowski and Tabachek, 1974), in bream it was found to be 0.9
pg/kg (Persson, 1980) and in channel catfish it was found to be 8.4 pg/kg (Lelana,
1983). The threshold odor concentration of 2-methylisobomeol is about 0.04 pg/L
(Persson, 1979b). This is higher than the threshold odor concentration for geosmin
13
Reproduced with permission of the copyright owner. Further reproduction prohibited without permission.
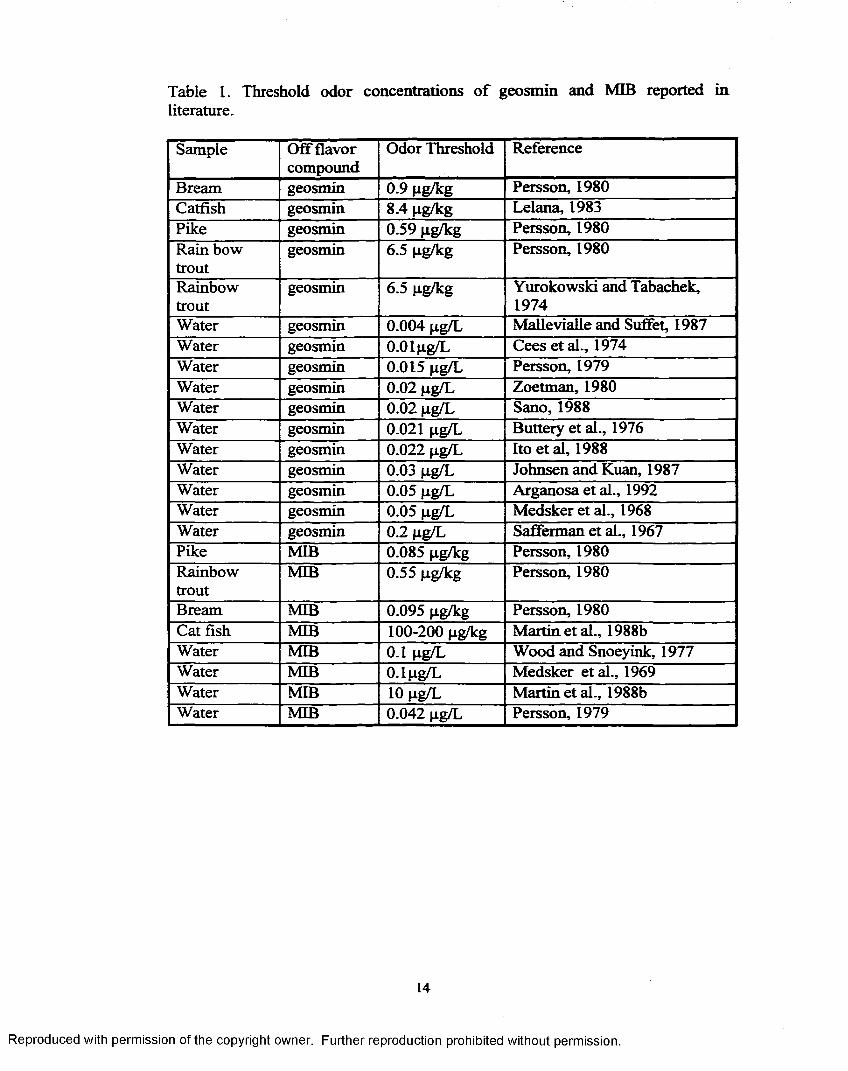
Table 1. Threshold odor concentrations of geosmin and MIB reported inliterature.
Sample Off flavor compound
Odor Threshold Reference
Bream geosmin 0.9 pg/kg Persson, 1980Catfish geosmin 8.4 pg/kg Lelana, 1983Pike geosmin 0.59 pg/kg Persson, 1980Rain bow trout
geosmin 6.5 pg/kg Persson, 1980
Rainbowtrout
geosmin 6.5 pg/kg Yurokowski and Tabachek, 1974
Water geosmin 0.004 pg/L Mallevialle and Suffet, 1987Water geosmin O.OIpg/L Cees et al., 1974Water geosmin 0.015 pg/L Persson, 1979Water geosmin 0.02 pg/L Zoetman, 1980Water geosmin 0.02 pg/L Sano, 1988Water geosmin 0.021 pg/L Buttery et al., 1976Water geosmin 0.022 pg/L Ito et al, 1988Water geosmin 0.03 pg/L Johnsen and Kuan, 1987Water geosmin 0.05 pg/L Arganosa et al., 1992Water geosmin 0.05 pg/L Medsker et al., 1968Water geosmin 0.2 pg/L Safferman et al., 1967Pike MIB 0.085 pg/kg Persson, 1980Rainbowtrout
MIB 0.55 pg/kg Persson, 1980
Bream MIB 0.095 pg/kg Persson, 1980Cat fish MIB 100-200 pg/kg Martin etal., 1988bWater MIB 0.1 pg/L Wood and Snoeyink, 1977Water MIB 0.1 pg/L Medsker et al., 1969Water MIB 10 pg/L Martin etal., 1988bWater MIB 0.042 pg/L Persson, 1979
14
Reproduced with permission of the copyright owner. Further reproduction prohibited without permission.
in water. However, the flavor imparted to fish by 2-methyisobomeol appears to be
detected by taste panels at concentrations about an order of magnitude lower than
geosmin. The sensory threshold concentration in pike is about 0.09 |ig/kg, and in
rainbow trout about 0.6 pg/kg (Persson 1980).
2.2 Production of off-flavor compounds by microorganism
2.2.1 Production of off flavor compounds by actinomycetes
Actinomycetes are unicelluar, filamentous microorganisms that frequently
occupy a position between the fungi and the bacteria as a separate group.
Actinomycetes are widely distributed in nature and account for a large part o f the
normal microbial populations o f soils, and lake and river muds (Romano and
Safferman, 1963).
Actinomycetes are most abundant in eutrophic lakes or ponds than in
nutrient poor waters. Abundance o f actinomycetes increase dramatically
following development of phytoplankton blooms. This suggests that
actinomycetes are important in the decomposition o f organic matter produced by
phytoplankton (Silvey and Wyatt, 1970).
Thaysen (1936) investigated a salmon rich stream in the British isles for
the origin o f earthy taints in fish, and he found that those odors varied with the
degree o f actinomycete growth at the place o f sampling. Since the isolation of
geosmin from cultures of Streptomyces griseus (Gerber and Lechevalier, 1965),
production o f geosmin has been confirmed in numerous actinomycetes, most
notably species o f Streptomyces and Norcardia. MIB was initially isolated from
15
Reproduced with permission of the copyright owner. Further reproduction prohibited without permission.

cultures of Streptomyces antibioticus, S. praecox and S1 griseus (Medsker et al.,
1969) and has also been found in cultures o f several other actinomycetes.
Production o f geosmin and 2-methylisobomeol by actinomycetes in
culture varies with carbon source, temperature, and pH. Geosmin production by a
strain of Streptomyces was greatest at 25 °C and a culture pH o f 10 (Weete et al.,
1977). Geosmin was not produced at a temperature below 15 °C and geosmin
production was markedly decreased at pH values less than 7. Growth o f
Streptomyces and subsequent production o f geosmin is greatest in environments
with high dissolved oxygen concentration (Blevins, 1980; Wood et al., 1983).
2.2.2. Production o f off-flavor compounds by blue-green algae
Cyanobacteria occur in a wide variety o f environments (Carr and Whitten
1982; Reynolds, 1984), and represent at least 22 genera, including over 90 species
that have been identified from freshwater habitats.
Development o f cyanobacterial blooms is favored under conditions o f high
nutrient loading rates, low rates of vertical mixing and warm water temperature.
Unique physiological attributes of cyanobacteria such as N2 fixation and
buoyancy regulation allow cyanobacteria to compete effectively with other
phytoplankton and make cyanobacteria the dominant phytoplankton communities
(Paerl and Tucker, 1995).
Symploca muscorum is the first blue green algae that was identified to
produce gesomin in culture medium and this discovery lead to the idea that
organisms other then actinomycetes could be possible sources o f earthy and odor
problems in water supplies (Safferman et al., 1967).
16
Reproduced with permission of the copyright owner. Further reproduction prohibited without permission.
Ashner et al. (1967) provided the first complete account o f earthy off-
flavors in fish produced by cyanobacteria. They reported that Oscillatoria tenuis
growing in fish culture ponds in Israel was responsible for earthy off-flavors in
carp, Cyprinus carpio, and suggested that the fish acquired the off-flavor either by
absorbing the compound from the water or by ingesting masses o f cyanobacteria.
During the spring o f 1969, a bloom o f Anabaena circinalis occurred in
Garza-little Elm Reservoir, which serves as the water supply for Denton, Texas.
Coincident with this bloom occurrence, a taste and odor problem o f the earthy to
musty variety developed in the Denton municipal water supply. The isolation of
Anabaena circinalis into unialgal culture and analysis o f noxious odorous
metabolites was conducted by North Texas State University and geosmin was
identified to be responsible for the odorous nature of the water supply during the
algal bloom incident (Henley, 1970).
Eleven axenic or unialgal cultures o f blue green algae, 10 producing
geosmin and 1 producing MIB were isolated from saline lakes in southwestern
Manitoba- Algae producing geosmin were Oscillatoria cf. prolifica (Greville)
Gomont, O. tenuis Agardh, O. cf. cortiana Meneghini, O. cf. variabilis Rao, O.
agardhii Gomont, O. cf. splendida Greville, O. sp., Symploca cf. muscorum
(Agardh) Gomont, Lyngbya cf. aestuarii (Mertens) Liebman.
O f the geosmin producing blue green algae isolated from the saline lakes
in Manitoba, it has been reported that Oscillatoria agardhii, O. prolifica, O.
tenuis and Symploca muscorum produced muddy odors. (Cornelius and Bandt,
1933; Ashner et al., 1967; Safferman et al., 1967; Medsker et al., 1968) and the
17
. . . I '•
Reproduced with permission of the copyright owner. Further reproduction prohibited without permission.
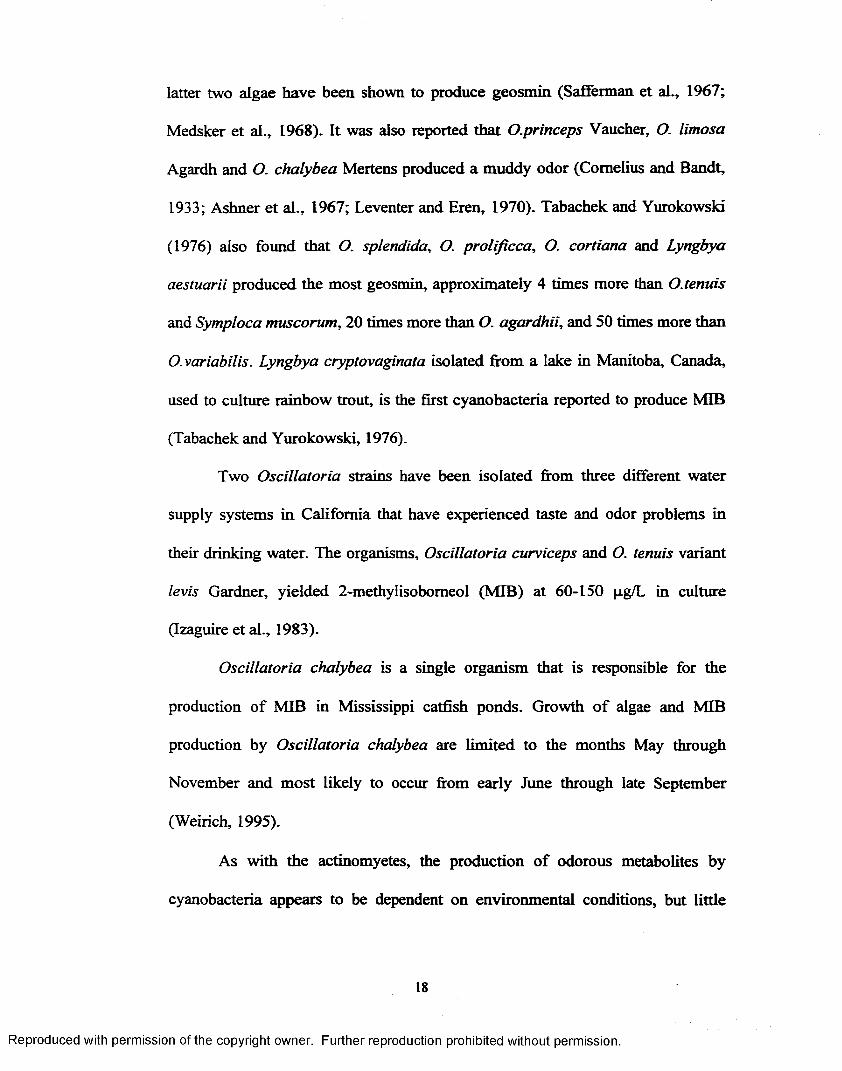
latter two algae have been shown to produce geosmin (Safferman et al., 1967;
Medsker et al., 1968). It was also reported that O.princeps Vaucher, O. limosa
Agardh and O. chalybea Mertens produced a muddy odor (Cornelius and Bandt,
1933; Ashner et al., 1967; Leventer and Eren, 1970). Tabachek and Yurokowski
(1976) also found that O. splendida, O. prolificca, O. cortiana and Lyngbya
aestuarii produced the most geosmin, approximately 4 times more than O. tenuis
and Symploca muscorum, 20 times more than O. agardhii, and 50 times more than
O.variabilis. Lyngbya cryptovaginata isolated from a lake in Manitoba, Canada,
used to culture rainbow trout, is the first cyanobacteria reported to produce MIB
(Tabachek and Yurokowski, 1976).
Two Oscillatoria strains have been isolated from three different water
supply systems in California that have experienced taste and odor problems in
their drinking water. The organisms, Oscillatoria curviceps and O. tenuis variant
levis Gardner, yielded 2-methylisobomeol (MIB) at 60-150 pg/L in culture
(Izaguire et al., 1983).
Oscillatoria chalybea is a single organism that is responsible for the
production o f MIB in Mississippi catfish ponds. Growth o f algae and MIB
production by Oscillatoria chalybea are limited to the months May through
November and most likely to occur from early June through late September
(Weirich, 1995).
As with the actinomyetes, the production o f odorous metabolites by
cyanobacteria appears to be dependent on environmental conditions, but little
18
Reproduced with permission of the copyright owner. Further reproduction prohibited without permission.

Table 2. Blue green algae reported to produce geosmin in the literature.
Blue green algae off -flavor compound
reference
Anabaena circinalis geosmin Henley, 1970Anabaena laxa geosmin Rashash et al., 1995Anabaena macrospora geosmin Yagi, 1983Anabaena macrospora geosmin Yagi et al., 1983Anabaena macrospora klebahn
geosmin Negoro et al., 1988
Anabaenascheremetievi
geosmin Izaguire, 1982
Anabaena viguieri geomin Wu et al., 1991Aphanizomenon flos- aquae
geosmin Matsumoto and Tsuchiya, 1988
Lyngbya cf. aestarii (Mertens) Liebman
geosmin Tabachek and Yurokowski, 1976
Nostoc sp geosmin, MIB HuandChiang, 1996Oscillatoria agardhii geosmin Persson, 1979aOscillatoria agardhii Gomont
geosmin Tabachek and Yurokowski, 1976
Oscillatoria amoena geosmin Matsumoto and Tsuchiya, 1988Oscillatoria animalis geosmin Kaji, 1974 (cited in Yagi et al.,
1983)Oscillatoria bometii f. tenuis
geosmin Berglind et al., 1983
Oscillatoria brevis geosmin Naes et al., 1989Oscillatoria cf. Prolifica (Greville) Gomont
geosmin Tabachek and Yurogowski, 1976
Oscillatoria cf. Splendida Greville
geosmin Tabachek and Yurokowski, 1976
Oscillatoria cf. Variabilis Rao
geosmin Tabachek and Yurokowski, 1976
Oscillatoria cf.cortiana Meneghini
geosmin Tabachek and Yurokowski, 1976
Oscillatoriasimplicissima
geosmin Izaguire et al., 1982
Oscillatoria splendida geosmin Matsumoto and Tsuchiya, 1988Oscillatoria tenuis Agardh
geosmin Tabachek and Yurokowski, 1976
Oscillatoria tenuis geosmin, MIB Wu and Juttner, 1988
19
Reproduced with permission of the copyright owner. Further reproduction prohibited without permission.

Table 2. continued.
Phormidium calcicola geosmin, MIB R ash ash et al., 1995Schizothrix mulleri geosmin Hariyama et al., 1972 (cited in
Yagi e ta l., 1983)Symploca muscorum geosmin Safferman et al., 1967Symploca muscorum (Agardh) Gomont
geosmin Tabachek and Yurokowski, 1976
20
Reproduced with permission of the copyright owner. Further reproduction prohibited without permission.
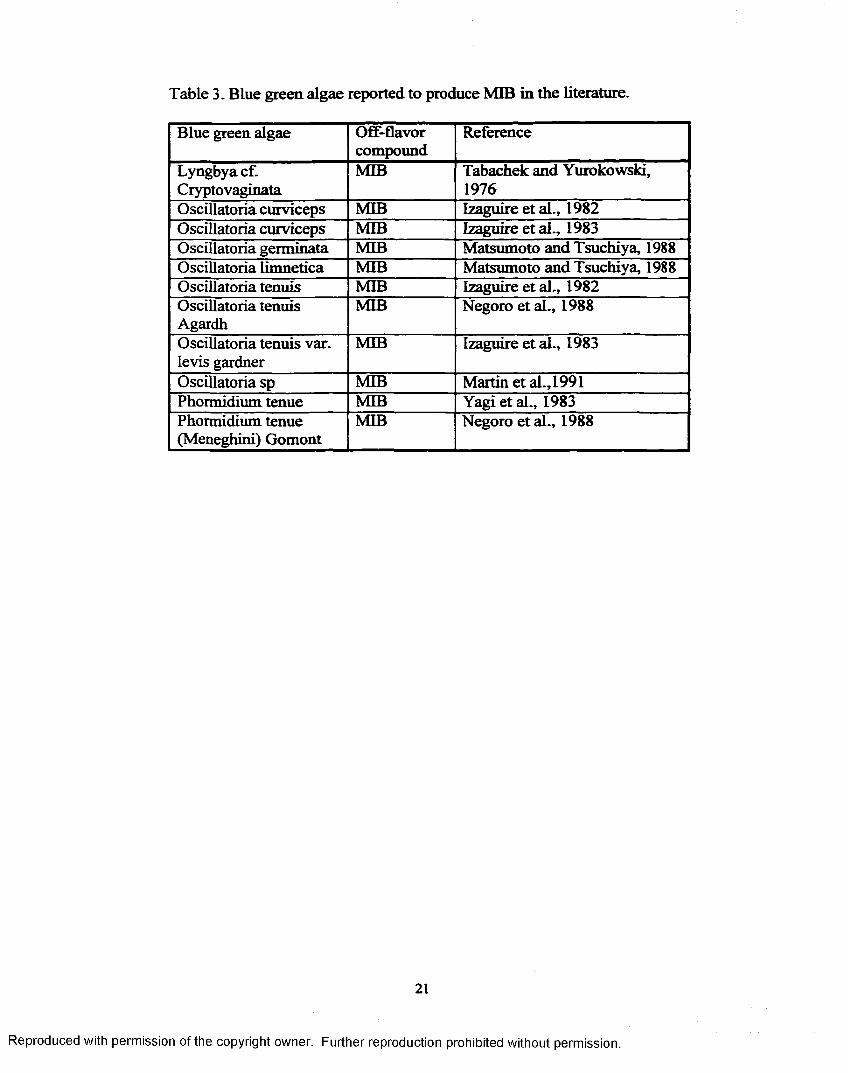
Table 3. Blue green, algae reported to produce MIB in the literature.
Blue green algae Off-flavorcompound
Reference
Lyngbya cf. Cryptovaginata
MIB Tabachek and Yurokowski, 1976
Oscillatoria curviceps MIB Izaguire et al., 1982Oscillatoria curviceps MIB Izaguire et al., 1983Oscillatoria germinata MIB Matsumoto and Tsuchiya, 1988Oscillatoria limnetica MIB Matsumoto and Tsuchiya, 1988Oscillatoria tenuis MIB Izaguire et al., 1982Oscillatoria tenuis Agardh
MIB Negoro et al., 1988
Oscillatoria tenuis var. levis gardner
MIB Izaguire et al., 1983
Oscillatoria sp MIB Martin et al., 1991Phormidium tenue MIB Yagi etal., 1983Phormidium tenue (Meneghini) Gomont
MIB Negoro eta l., 1988
21
Reproduced with permission of the copyright owner. Further reproduction prohibited without permission.
information is available describing these interactions (Tucker and Martin, 1991).
The majority of odor and taste episodes in eutropic lakes and ponds (such as
aquaculture ponds) are believed to be caused by proliferation o f cyanobacteria
rather than actinomycetes (Persson 1981, 1982,1983).
The continuous addition o f large amounts o f nutrients in the form o f fish
waste makes channel catfish ponds ideal habitats for aquatic plants. Although
filamentous algae and vascular plants at times become established and grow
luxuriantly, the most common plant form is phytoplankton.
Phytoplankton density and taxonomic composition differ among ponds at
any given time, but in general, phytoplankton growths are dominated by
cyanobacteria during the summer months and diatoms during the winter months.
The most common cyanobacteria found during the warmer months are species of
Microcystis, Oscillatoria, Rhaphidopsis and Anabaena (Tucker and Martin,
1991).
Primary production by phytoplankton is the base o f the food chain in pond
cultures that depend upon natural foods to support fish or crustacean production.
They are part o f the pond microbial community that acts to maintain adequate
environmental conditions for culture. They are net producers o f dissolved oxygen,
they assimilate ammonia as a nitrogen source for growth, thereby reducing the
accumulation o f un-ionized ammonia, which can be toxic to aquatic animals at
relatively low concentrations (Paerl and Tucker, 1995).
The sudden death o f dense, nearly monospecific cyanobacterial
communities can have disastrous consequences in aquaculture ponds. As dead
22
Reproduced with permission of the copyright owner. Further reproduction prohibited without permission.
algal cells decompose, photosynthetic oxygen production nearly ceases and large
amounts o f dissolved oxygen are consumed. The odorous metabolites produced
by certain species are released when cells decompose. The occurrence o f earthy,
musty off-flavors in pond-raised fish is episodic, coinciding with the appearance
and eventual disappearance o f the cyanobacterial species responsible for synthesis
of odorous compounds.
2.3 Control o f off-flavor compounds In the aquacutnre industry
Research related to quality control o f catfish flavor has been focused at the
pond level by studying factors that influence the growth o f algae or fungi
populations such as water quality, pH, oxygen levels, soil quality, fish density,
treatment of algicide, feed quality and application rates, and water temperature
(Tucker and Boyd, 1978a, 1978b; Lovell, 1983; Tucker et al., 1983; Persson,
1984; Tucker and Llyod, 1987; Johnsen, 1989; Johnsen and Dupree, 1991;
Tucker and Martin, 1991; Whitmore and Denny, 1992; Dionigi, 1994; Dionigi
and Ingram, 1994; Dionigi, 1995; Dionigi and Champagne, 1995; Petersson et
al., 1995; Velzeboer et al., 1995).
Because o f the large numbers o f factors that affect algae/fungal growth,
controlling the “off-flavor” by pond management has proven difficult. Three
approaches have been used to deal with off-flavor in pond-raised fish; manage
around off-flavor episodes, prevent off-flavor episodes, or remove the flavor from
the fish once they have developed it (Tucker and Martin, 1991).
Reproduced with permission of the copyright owner. Further reproduction prohibited without permission.

2.3.1. Uptake o f odorous compounds in fish
It is generally believed that odorous compounds are absorbed across the
gills and deposited in the flesh (Weirich, 1995). MIB is also taken up by fish
through their gills and stored in fatty tissue (Martin et al., 1988c and 1990;
Persson, 1984). Fish with higher fat reserves are more prone to “musty” flavor
(Johnsen et al., 1996). In freshwater fish, due to osmoregulation, water is
absorbed into the body through the gills and the excess water in the body excreted
through the kidney (Smith, 1983). Therefore, many compounds or ions that
dissolve in water will enter the body through the gills and be distributed in the
body through the circulatory system. Thaysen (1936) demonstrated that live fish
absorb flavor compounds from their environment but dead fish do not.
Channel catfish, which were put into water containing dimethyl-sulfide or
2-pentanone at concentrations o f 25 to 125 mg/L, absorbed sensorily detectable
levels of those chemicals within 10 to 15 minutes (Maligalig et al., 1975b). Lovell
and Sackey (1973) produced earthy-musty flavored channel catfish by placing the
fish in water containing either a culture of geosmin producing blue green algae or
a filtrate of the culture. Fish held in tanks containing algae free filtrate from algae
culture tanks acquired the off-flavor but at a slower rate than the fish in the culture
tanks.
Johnsen (1989) transferred catfish to temperature controlled experimental
tanks when they were exposed to geosmin and MIB. A t 20 °C, fish exposed to 1
pg/L of geosmin showed a rapid uptake of material. The concentration o f geosmin
24
Reproduced with permission of the copyright owner. Further reproduction prohibited without permission.

in the tissue increased to 3.5 pg/L within two hours. Studies with MIB indicated
that concentrations o f 0.5 pg/L can flavor fish in two hours when evaluated by
sensory panels (Arganosa and Flick, 1992).
The absorption o f organic compounds from water can occur at the gills,
through the skin, or across the intestinal epithelium from water swallowed while
drinking or incidentally while feeding. From and Horlyck (1984) placed geosmin
producing cyanobacteria Symploca muscorum at isolated locations on live
rainbow trout and recorded the development of earthy off-flavor in fillets obtained
after various exposure periods. The most rapid absorption occurred through the
gills, with only 6 min o f exposure required to obtain an earthy flavor. Absorption
was slower through the skin (1.5 h), small intestine (4 h) and stomach (7 h).
Lovell and Sackey (1973) and Maligalig et al. (1975) also suggested that
gills are the major routes o f uptake o f odorous compounds from water. However
Persson and York (1978) noted that total uptake o f 2-methylisobomeol from water
was higher in fish that were fed compared to those not fed. They speculated that
the alimentary tract may be a significant route o f uptake o f odorous compounds
and that these compounds are absorbed from water incidentally swallowed during
feeding.
The uptake o f earthy flavor in fish increases during feeding (Persson,
1980), but the earthy-odor compounds in the water is alone sufficient to taint fish.
Ingestion o f organisms is o f minor importance in the development o f off-flavor in
intensively cultured fish because virtually all nutrients are derived from feeds. The
25
Reproduced with permission of the copyright owner. Further reproduction prohibited without permission.
major route o f uptake is absorption o f the compounds from water across the gills
(Tucker and Martin, 1991). Uptake o f odorous compounds by fish is rapid and
elimination is relatively slow.
Martin et al. (1988b) studied the uptake o f 2-methylisobomeol at two
concentrations in water by small (5-10 g) channel catfish. At steady state, the
concentration o f 2-methylisobomeol in fish muscle was about 10 times greater
than in water. Assuming a sensory threshold concentration o f about 0.1 mg/kg,
these fish would have developed a detectable off-flavor in less than 2 hr exposure
to either concentration o f 2-methylisobomeol. Highest concentrations of 2-
methylisobomeol were found in lipid rich tissues such as skin and visceral fat;
concentrations o f 2-methylisobomeol in visceral fat were almost 100 fold greater
than in water.
According to Lelana (1987), if the concentration o f geosmin in water were
1 mg/L, only about 2 hr would be required for the fish to absorb enough geosmin
to reach the sensory threshold concentration (estimated to be 8 mg/kg). I f the
concentration of geosmin in the water were 3 mg/L, the time to reach the sensory
threshold is reduced to only about 2 min (Tucker and Martin, 1991).
Factors affecting the rate o f uptake are the concentration of odorous
compounds in the fresh water and exposure time, the species of fish, the
physiological state of fish, water temperature and other environmental conditions
(Persson, 1984).
26
Reproduced with permission of the copyright owner. Further reproduction prohibited without permission.
2.3.2. Depuration o f off-flavor compounds from fish
Nonpolar, lipophilic compounds are eliminated from fish by passive
diffusion across the gills or skin, or by metabolism to more polar compounds that
are excreted from the kidney or secreted in gallbladder bile. Elimination through
the gills is probably the major route, but this may not be true for strongly
lipophilic substances that are not readily partitioned from lipid stores into the
blood (Tucker and Martin, 1991).
The purging rate is affected by quality o f holding water and holding
condition (static vs continuous flow), water temperature and the amounts o f
odorous compounds absorbed (Iredale and York, 1979; Lovell, 1974; Maligalig et
al., 1975).
Iredale and York (1979) determined the length o f time required to purge
undesirable flavor taints from pond cultured rainbow trout transferred to two
different clear water environments. Sensory data from trained judges showed that
this required 5 days for fish transferred to a rapidly changing, purified, artificial
water environment and 16 days for fish transferred to a relatively static natural
water environment to reduce this taint to or below threshold levels o f recognition.
Lovell and Sackey (1973) held channel catfish in a 25 °C tank having a
distinct earthy-musty flavor for 14 days. The fish were then placed in a clean
water aquarium; and after 3, 6, 10 and 15 days, fish were removed and evaluated
for flavor by four experienced judges. After 3 days in clean water at 25 °C, the
flavor o f fish had significantly (P<0.05) improved. After 10 days, the flavor was
27
Reproduced with permission of the copyright owner. Further reproduction prohibited without permission.

not significantly (P<0.05) different from that o f control fish that had never been
exposed to algae.
Water temperature must be 16 °C to allow rapid purging. MIB off-flavor is
expected to disappear within a week to 2 weeks when water temperatures are
above 20 °C. Fish transfer may cause fish to be stressed and become more
susceptible to disease. Fish should not be transferred during hot weather or when
nitrite is present in the purging pond. Fish lose weight during the purging process
unless they are feed (Weirich, 1995).
As with the uptake o f MIB, the depuration o f MIB was affected by time
and temperature. Removing MIB related off-flavors at temperatures below 15 °C
is not practical for fish with fat contents that exceed 7%. Fish with a high fat
content held at low water temperature (15% fat, 6.5 °C) did not regain acceptable
flavor until after 72 hrs o f depuration. Under most favorable conditions (5% fat,
34 °C), it required 61 hrs for fish containing the greatest MIB burden (11.4 pg
MIB/kg fish) to regain an acceptable flavor. When water temperature exceeds 30
°C, recovery o f flavor quality may occur in less than 80 hrs (Johnsen et al., 1996).
At 25 °C, 50 to 100 % o f the geosmin in sterile solutions was lost within
24 hrs. On the other hand, data presented by Lalezary et al. (1984) indicate that
geosmin and 2-methyisobomeol were not readily volatilized from aqueous
solutions. It is generally known that aeration or air stripping is not a practical
method o f removal o f geosmin or 2-methylisobomeol from drinking water
supplies (Mallevialle and Suffet, 1987; Tucker and Martin, 1991).
28
Reproduced with permission of the copyright owner. Further reproduction prohibited without permission.
The time required to purge fish o f earthy flavors varied from 6 to 18 days
for channel catfish (Lovell and Sackey, 1973; Maligalig et al., 1973) and 5 to 16
days for rainbow trout (Iredale and York, 1976). The chemical causes o f the
earthy off-flavors were not identified in these studies. Lovell (1983) also used
sensory analysis to evaluate the effect o f temperature on rate o f loss of an "earthy-
musty" off-flavor from channel catfish. Disappearance o f the off-flavor was most
rapid at the highest water temperature.
Geosmin appears to be eliminated somewhat more slowly from rainbow
trout than from channel catfish, probably because o f the effect of cooler water
temperatures on the elimination. Yurokowski and Tabachek (1974) found that 5 to
7 days was required to remove a muddy flavor caused by geosmin in rainbow
trout. Although this is similar to the time Lelana (1987) used to purge channel
catfish of geosmin related flavor, the initial geosmin concentration in rainbow
trout (11 mg/kg) was much lower than in channel catfish (90mg/kg).
Elimination of 2-methylisobomeol from fish appears to be more rapid than
for geosmin. Martin et al. (1988) exposed small (5-10 g) channel catfish to 2-
methylisobomeol at concentrations o f 5 and 50 pg/L. Fish were exposed for 7
days and steady-state conditions were achieved. Concentrations o f 2-
methylisobomeol in both groups o f fish declined to less than 2 pg/kg over a 48 hr
period after the fish were removed to water free o f the compound (Tucker and
Martin, 1991).
Reproduced with permission of the copyright owner. Further reproduction prohibited without permission.
2.3.3. Pond management and off-flavor
Feeding flsh causes similar effects as fertilizing the pond in enhancing
algae blooms (Boyd, 1979). This nutrient input will cause phytoplankton blooms
that are possibly associated with the incidence o f off-flavor in fish. Brown and
Boyd (1982) found a significant correlation between daily feeding rate and off-
flavor in the fish; as daily feeding rate increased, incidence o f off-flavor
increased.
Several methods have been proposed to control off-flavor in channel
catfish ponds. Application of copper sulfate to thin phytoplankton blooms is
claimed to be effective in Alabama catfish ponds. Unfortunately, this practice can
cause oxygen depletion; also phytoplankton develop resistance to copper sulfate
after continuous exposure, requiring increased application rate (Boyd, 1979).
Application o f hydrated lime in many production ponds in west Alabama in 1981-
1982 to control off-flavor was discontinued because no effect was noticed, and
also because hydrated lime can increase the pH very suddenly which might kill
the fish (Armstrong, 1984).
Because cyanobacteria are frequently implicated as the major source of
these compounds in eutropic waters, most research in off-flavor has concerned the
use of algicide to reduce cyanobacterial abundance. Algicide causes a temporary
deterioration o f water quality because they reduce oxygen production and
ammonia removal by algae. The use o f algicide is not without risk to fish health
and fish survival and must be restricted to ponds with healthy fish and facilities
for emergency aeration (Weirich, 1995).
30
Reproduced with permission of the copyright owner. Further reproduction prohibited without permission.
Copper sulfate is very toxic to algae but it can also be toxic to fish and
must be applied with great caution (Weirich, 1995). The copper sulfate
application eliminates most but not all MIB-producing algae and the remaining
algae cause a new bloom because ponds remain favorable for the growth o f algae
and off-flavor compounds production (Weirich, 1995). Simazine is a widely used
algicide for aquatic macrophyte control in fish ponds. Application o f simazine to
channel catfish ponds for the control of phytoplankton resulted in extended
periods o f low dissolved oxygen and decreased fish yields (Tucker et al., 1983).
Tucker and Boyd (1978a) investigated the effects o f periodic application
of copper sulfate and simazine for phytoplankton control in catfish ponds.
Treatment o f channel catfish (Ictalurus punctatus) production ponds with
biweekly application o f 0.84 kg o f copper sulfate/ha did not reduce phytoplankton
density. Three periodic applications o f simazine totaling 1.3 mg/L drastically
reduced phytoplankton density. However it also resulted in decreased fish yields
and poor feed conversion ratios compared to control ponds. This is at least partly
the result o f exposure to chronically low dissolved oxygen concentration.
The effects o f simazine treatment on channel catfish and blue gill
production ponds were studied by Tucker and Boyd (1978b). They found a 19%
reduction in channel catfish yields and poorer feed conversion by fish when
compared to control ponds. The prolonged persistence o f simazine (0.2 mg/L for
more than 4 months) resulted in a lower average chlorophyll "a" concentration in
treated ponds (p<0.1) and the magnitude of chlorophyll "a" values were lower in
treated ponds than control ponds throughout the growing season. Use o f sim azine
31
Reproduced with permission of the copyright owner. Further reproduction prohibited without permission.
in catfish ponds resulted in extended periods o f decreased concentrations o f
dissolved oxygen when compared to those in control ponds and exposure to
prolonged periods o f lowered oxygen concentration was possibly responsible for
the poorer growth observed.
When fed at libitum, fish exposed constantly to dissolved oxygen levels
60% o f saturation gained 21% less weight than those o f 100% o f saturation. The
rapid destruction and decomposition o f algal and macrophyte biomass can
contribute to increased biological oxygen demand and oxygen depletion. Oxygen
depletion can result in extensive fish mortality (Johnsen and D ionigi, 1994).
Dionigi and Champagne (1995) investigated the effects o f copper sulfate
on geosmin and biomass biosynthesis by heterotrophic cultures of the bacterium
Streptomycetes tendae and Fungus Penicillium expansum. Cultures o f S. tendae
with 12.7 mg Cu/L (copper sulfate) accumulated 44.6% more biomass and the
mycelium contained five-fold greater concentrations o f geosmin than controls.
Additionally, P. expansum cultures exposed to 12.7 mg Cu/L accumulated 9.2%
more biomass and 18-fold greater concentrations o f geosmin than controls. It is
probably because copper is an essential nutrient that contributes to biomass and
metabolic biosynthesis by heterotrophs.
Treatment of a fish culture pond with an algicide to kill cyanobacteria may
be ineffective if actinomycets are responsible for the off-flavor episode. In fact,
such a treatment may aggravate the problem by supplying actinomycetes with
nutrients (dead cyanobacteria and algae) for further growth.
32
Reproduced with permission of the copyright owner. Further reproduction prohibited without permission.
Velzeboer et al. (1995) investigated release o f geosmin by Anabaena
circinalis following treatment with alum inum sulfate. Flocculation o f Anabaena
circinalis by alum inum sulfate was tested under laboratory condition to simulate
operating water treatment plants and resulted in removal o f cells in a healthy
condition with no additional release o f gosmin. Removal o f intact cyanobacterial
cells significantly reduced the concentrations o f taste and odor metabolites present
in water. Removal o f cells by flocculation under laboratory conditions varied 57-
81% when all cells were removed in a healthy state, with no additional release of
geosmin as a result o f alum flocculation.
Copper algicide application did not consistently improve the flavor of
farm raised channel catfish (Dionigi and Champagne, 1995; Tucker and Boyd,
1978). Several reports indicated that over 90% o f the total geosmin present was
contained within the cells rather than excreted into the media (Wu and Juttner,
1988; van der Ploeg and Boyd, 1991; Dionigi et al., 1992). As the greatest portion
of geosmin in algal cultures is contained in the cells, algicide induced lysis of
algal cells could release endogenous pools o f geosmin and increase metabolite
absorption by fish. Algicide induced destruction and decomposition o f biomass
could contribute nutrients to subsequent algal blooms and release copper-resistant
strains for competition (Dionigi and Champagne, 1995).
2.4. Analysis o f ofif-flavor compounds
The problem hindering the development o f solutions to the ‘musty flavor’
in aquaculture products is the difficulty in measuring the metabolites responsible
at the extremely low concentrations at which they cause the “musty” flavor.
33
Reproduced with permission of the copyright owner. Further reproduction prohibited without permission.
Human tasters and gas chromatography (GC) are the two main methods that have
been used to quantitate both geosmin and MIB. Fish producers and water
suppliers are most affected by the off-flavor problem. Producers are used to doing
a thorough job o f screening and taste testing fish and water for flavor quality to
maintain standards (Chung et al., 1991).
2.4.1 Analysis o f off-flavor compounds by gas chromatography mass spectrometry (GC-MS)
Gas chromatography (GC) determination o f geosmin and MIB has been
the primary non-subjective method used to measure geosmin and MIB
(Yurokowski and Tabachek, 1974; Izaguire et al., 1982; Krasner, 1988;
Tanchotikul and Hsieh, 1990; Dionigi and Ingram, 1994; Stahl and Parkin, 1994).
Table 3 illustrates GC-MS methods that have been reported to date for the
detection o f off-flavor compounds from water samples and fish samples.
Closed loop stripping analysis, purge trap analysis and solvent extraction
are the three most popular methods for the extraction and concentration o f trace
organic compounds in water.
Closed loop stripping analysis was first developed by Grob (1973) and
used widely for the analysis o f nonpolar volatile compounds having intermediate
molecular weight. The organic compounds are stripped from the water by a
recirculating stream o f air in a closed circuit system. The organic compounds are
removed from the gas phase by a filter containing activated carbon and then the
organic compounds are extracted form the filter with carbon disulfide or
methylene chloride. This analysis is based on the extraction o f water sample by
34
Reproduced with permission of the copyright owner. Further reproduction prohibited without permission.

evaporation followed by trapping o f the organic substances on charcoal (Grob,
and Grob, 1975). As it uses very small amounts o f solvent (lOpl) for the
extraction, it does not need a solvent concentration step and shows high sensitivity
and recovery rate. It usually showed ng/L levels o f sensitivity. Krasner et al.
(1981) used closed loop stripping analysis for the determination o f geosmin and
MIB in water, sediments and culture. Hwang et al. (1984) reported an increase in
sensitivity and stripping rate in the analysis of earthy-musty odorants in potable
water supply systems by raising the ionic strength o f the water samples with
sodium sulfate before stripping. By combining 80 g o f Na^SC^ with 1 L water
sample, stripping time was shortened to 1.5 hr and the sensitivity o f the analysis
increased to 0.8 ng/L.
The purge and trap technique is a commonly used method for the
determination o f low concentrations o f volatile organic compounds in air and
water. It is most applicable to nonpolar, low molecular weight volatile compounds
with low water solubility (Krasner et al., 1988). As the sensitivity o f this method
is low compared to the closed loop stripping analysis, usually selective ion
monitoring (SIM) is used to achieve low ng/L levels o f detection.
Johnsen et al. (1992) developed a purge trapping method for the analysis
o f MIB from the cattish. In this method, the sample is sparged with nitrogen and
trapped under vacuum (74.5kpa). Carbopack and Carbosieve HI were used as
trapping materials. It showed 38.9% recovery efficiency for MIB, 59% for
geosmin and 83% for internal standard undecanone. Its detection limit was
35
Reproduced with permission of the copyright owner. Further reproduction prohibited without permission.
0.1 pg/kg in a 50g sample with valid quantification above 0.5 pg/kg. Stahl and
Parkin (1994) reported determination o f gesomin and MIB from soil samples by a
purge and trap extraction method. It showed 15% recovery for geosmin and 24%
recovery for MIB. The detection limit o f MIB and geosmin in soil sample was
1 pg/kg.
Solvent extraction is simple and has a wide range o f applications to
semivolatile compounds having a range o f polarities and molecular weights. Even
though it is a simple, rapid method, accumulation o f solvent impurities and severe
loss o f extracted substances during the concentration step makes this method
impracticable for the detection o f extreme trace concentrations o f organic
compounds in water (Grob and Grob, 1975). Yasuhara and Fuwa (1979) reported
determination o f geosmin in water by GC-MS after direct extraction o f water
sample (1L) with 50 ml dichloromethane. It showed a detection limit 10 pg/L
geosmin and recovery rate of 69%.
Vacuum distillation /solvent extraction has been used to determine the
levels o f geosmin in fish (Yurokowski and Tabachek, 1974). Tanchotikul and
Hsieh (1990) used an internal standard coupled with multiple-level addition to
determine amounts o f geosmin in clam samples and to determine the efficiency of
a relaying procedure for geosmin reduction.
A microwave cooking method was developed for the isolation o f MIB
from channel catfish (Ictalulus punctatus) that had been declared off-flavor
organoleptically (Martin et al., 1987). This method involves microwave cooking
36
Reproduced with permission of the copyright owner. Further reproduction prohibited without permission.
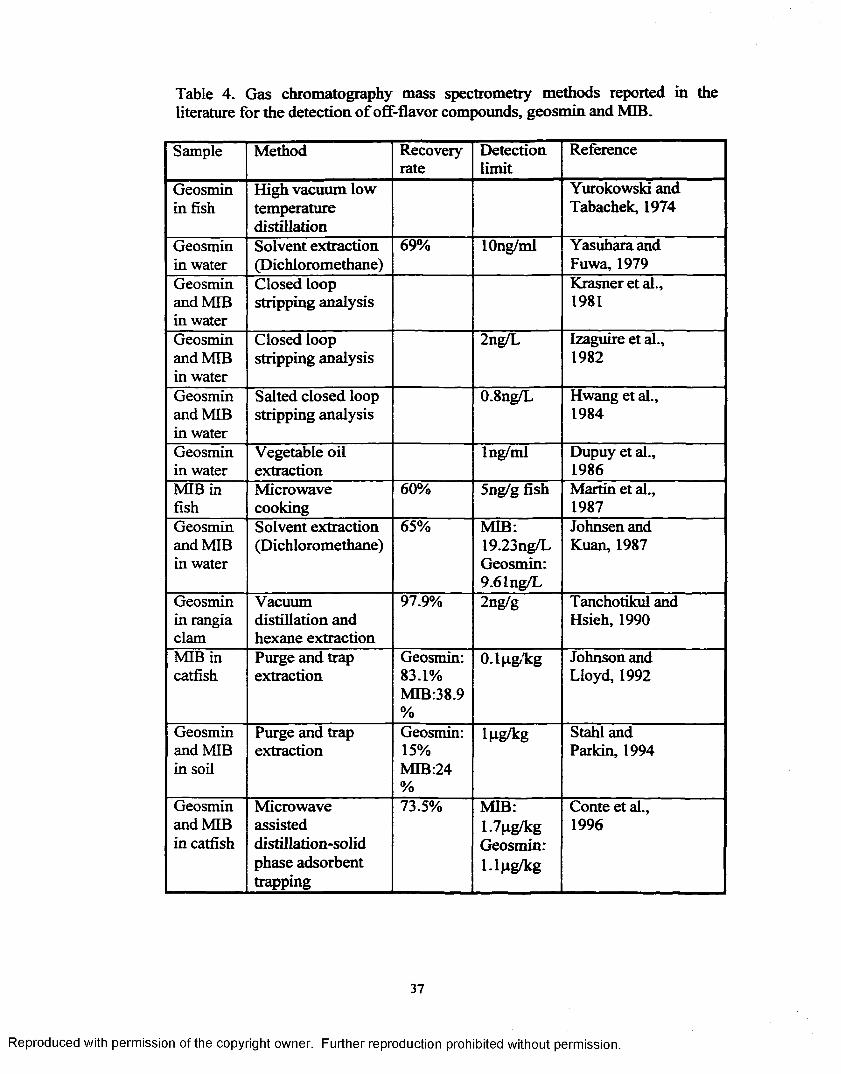
Table 4. Gas chromatography mass spectrometry methods reported in the literature for the detection o f off-flavor compounds, geosmin and MIB.
Sample Method Recoveryrate
Detectionlimit
Reference
Geosmin in fish
High vacuum lowtemperaturedistillation
Yurokowski and Tabachek, 1974
Geosmin in water
Solvent extraction (Dichloromethane)
69% lOng/ml Yasuhara and Fuwa, 1979
Geosmin and MIB in water
Closed loop stripping analysis
Krasner et al., 1981
Geosmin and MIB in water
Closed loop stripping analysis
2ng/L Izaguire et al., 1982
Geosmin and MIB in water
Salted closed loop stripping analysis
0.8ng/L Hwang et al., 1984
Geosmin in water
Vegetable oil extraction
Ing/ml Dupuy et al., 1986
MIB in fish
Microwavecooking
60% 5ng/g fish Martin et al., 1987
Geosmin and MIB in water
Solvent extraction (Dichloromethane)
65% MIB:19.23ng/LGeosmin:9.61ng/L
Johnsen and Kuan, 1987
Geosmin in rangia clam
Vacuum distillation and hexane extraction
97.9% 2ng/g Tanchotikul and Hsieh, 1990
MIB in catfish
Purge and trap extraction
Geosmin:83.1%MIB:38.9%
0.1 pig/kg Johnson and Lloyd, 1992
Geosmin and MIB in soil
Purge and trap extraction
Geosmin:15%MIB:24%
lpg/kg Stahl and Parkin, 1994
Geosmin and MIB in catfish
Microwaveassisteddistillation-solid phase adsorbent trapping
73.5% MIB:1.7pg/kgGeosmin:l.lpg /kg
Conte et al., 1996
37
Reproduced with permission of the copyright owner. Further reproduction prohibited without permission.

fish under a nitrogen stream and trapping the condensate at —80 °C. The fish
condensate was extracted with hexane and was reduced to 100 p i and analyzed by
GC. Concentration as low as 5 ng o f MIB/g fish was detected.
Conte et al. (1996) modified a microwave distillation-cold trapping
procedure (Martin et al., 1987), and used a thermostated condenser containing a
solid phase adsorbent instead o f using cryogen (acetone cooled with dry ice to
make -80 °C). Solid phase adsorbent analysis has the advantages o f selectivity,
collection efficiency and ease o f sample recovery compared to solvent extraction.
It gave 80% recovery o f geosmin and 85% recovery o f MIB. Detection limits of
geosmin and MIB were 1.1 pg/L for geosmin and 1.7 pg/L for MIB using
selective ion monitoring.
Quantifications of MIB and geosmin by GC are very difficult because the
concentrations o f MIB and geosmin in water are extremely low in comparison
with other organic compounds. This method requires extensive sample clean up,
specialized equipment and procedures and is time consuming. Fish samples must
be extracted and prepared using complicated procedures that suffer from low
recovery rates and reproducibility. These procedures are not acceptable for
screening a large number o f samples. More importantly, the GC methods require a
great deal of skill and training and are not adaptable to mass industry screening
needs.
Reproduced with permission of the copyright owner. Further reproduction prohibited without permission.
2.4.2 Analysis o f off-flavor compounds by sensory analysis
Individual panelists perceive flavor intensity differently, because o f
variations in detection thresholds, adaptation, fatigue and enhancement or
suppression. Panelists experienced difficulty in determining intensity differences
o f MTR between sessions, but could determine differences in intensity o f MIB
within a session (Bett and Johnsen, 1996). Sensory evaluation is the most
sensitive method o f detection currently available, but suffers from being a
subjective method with a large degree o f variation between tasters and between
tests of the same taster (Persson, 1979; Persson, 1980; Bett and Johnsen, 1996).
Despite this problem, necessity has dictated the use o f a staff flavor-taster at
catfish processing plants with the authority to accept or reject catfish prior to
harvest or delivery-
2.4.3 Analysis o f Off-flavor compounds by enzyme linked immunosorbent assay (ELISA).
Recently, enzyme linked immunosorbent assay (ELISA) for MIB was
developed by Chung et al. (1990) and they produced polyclonal antibody (PAb)
by binding a compound similar in structure to MIB (camphor) to the carrier
protein. This PAb was found to be unacceptable because of high non-specific
binding resulting in poor sensitivity. The sensitivity achieved using this PAb was
only 1 mg/L. Thus this PAb was not useful for measuring the very small amounts
o f MIB that cause musty smells in either potable waters or in food (Chung et al.,
1990). In this immunoassay system, the antibodies were raised against a camphor
conjugate and its affinity for this compound is greater than that for MIB. Chung et
39
Reproduced with permission of the copyright owner. Further reproduction prohibited without permission.
al. (1990) used BSA for the protein conjugate o f immunogen and ovalbumin for
the protein conjugate o f solid phase. However bovine serum albumin and
ovalbumin may be structurally related and polyclonal antibodies o f camphor-BSA
can recognize ovalbumin. This may be another cause o f high background and low
sensitivity.
2.5 Enzyme immunoassay and production of monnoclonal antibody
2.5.1 Enzyme immunoassay
Immunoassays are analytical methods that take advantage o f the
specificity o f antibody (Ab)-antigen (Ag) interaction. There are many types o f
immunoassays including radioimmunoassay, enzyme linked immunosorbent
assay (ELISA), immunofluorescence assay and luminoimmunoassay, depending
on the label used; or competitive, noncompetitive or sandwich, depending on the
set-up or whether Ab or Ag are limiting. Interaction between Ab and Ag can occur
in solution, at a solid-liquid interphase, can give rise to a soluble product or
precipitate. The method that will be used in this research is an Ab capture
competitive indirect ELISA. The binding between Ab and Ag is noncovalent and
reversible. Attractive forces include hydrophobic, Van der Waals, electrostatic
and hydrogen bonding.
Immunoassays are sensitive, simple and have advantages over other more
expensive methods. Many samples can be assayed simultaneously and
immunoassays due to their sensitivity and specificity, can eliminate the problem
of extraction and purification which has been a drawback o f previous methods
40
Reproduced with permission of the copyright owner. Further reproduction prohibited without permission.

(Brimfield et al., 1985; Li et al., 1991; Schneider and Hammock 1992;
Meulenberg et al., 1995).
An immunoassay is accurate, simple, sensitive, and many immunoasssays
are developed for the detection o f small organic compound in the food and
environmental sciences. Plhak and Spoms (1992 and 1994) report the
development of PAb and monoclonal antibody (MAb) for glycoalkaloids. Several
types o f Ab have been developed for the detection o f pesticides, toxins, and drugs.
Thomas (1993) produced MAb for atrazine. With microtiter plate ELISA, atrazine
could be determined in the range from 0.03 to I pg/L. In dipstick format, it
showed quick visual detection of atrazine in concentrations above 0.5pg/L. An
ELISA for the herbicide bentazon was developed by Seiber et al. (1991) and its
detection limit was O.lpg/L. Stanker et al. (1993) also reported development o f a
monoclonal-based ELISA for the coccidiostat, salinomycin.
Vallejo et al. (1982) investigated effects o f hapten structure and bringing
groups on antisera parathion immunoassay developments. They improved the
sensitivity of the assay by enhancing the specificity o f the antibody response.
2.5.2. Development o f monoclonal antibody
Monoclonal antibodies produced by a single clone o f B cells offer
particular advantages such as uniform affinity and specificity o f binding,
homogeneity, and the ability to be produced in unlimited quantities (Deshpande,
1996). Monoclonal antibody production, usually using mouse cells, involves the
generation of a cloned cell line, derived from a B lymphocyte, that secretes a
41
Reproduced with permission of the copyright owner. Further reproduction prohibited without permission.

homogeneous supply o f Ab. Plasma cells grow poorly or not at all in vitro but can
proliferate when fused with myeloma cells. The resulting hybrid cells are called
hybridoma.
Monoclonal antibody is useful because o f its specificity o f binding, its
homogeneity, and its ability to be produced in unlimited quantities. Monoclonal
antibodies give uniform affinity constants, greater reproducibility and continuity
of supply, larger linear ranges in immunoassays, more highly defined specificity
and the ability to combine different monoclonal antibodies and analyze several
analytes simultaneously. Once hybridoma is produced, production of monoclonal
antibody in vitro has many advantages. Cell culture can be done using relatively
well defined media, allowing for scale-up and continuous culture to produce a
virtually endless supply o f antibody (Plhak and Spoms, 1994).
Kohler and Milstein (1975) developed a technique that allowed the clonal
growth o f cell populations secreting antibodies with a defined specificity. By
fusing two cells, each having properties necessary for a successful hybrid cell line,
hybridoma cells can be made. The two cells that are commonly used in these
fusions are antibody secreting cells isolated from immunized animals and
myeloma cells. The myeloma cells provide the correct genes for continued cell
division in tissue culture and the antibody-secreting cells provide the functional
immunoglobulin genes.
Myelomas are neoplasms o f antibody-producing cells, each tumor
representing the proliferation of a single clone o f antibody-forming cells (Liddell
and Cryer, 1991). Myeloma can be induced in a few strains o f mice by injecting
42
Reproduced with permission of the copyright owner. Further reproduction prohibited without permission.
mineral oil into the peritonium. Potter et al. (1972) isolated myelomas from
BALB/ C mice and these are the most commonly used partners for fusion.
The fusion between the myeloma cell and antibody secreting cell can be
affected by any fiisogen. Pontecorvo et al. (1975) first demonstrated polyethylene
glycol (PEG) as a fusing agent for mammalian cells and it is routinely used by
somatic cell genetists for hybridoma fusion. PEG fuses the plasma membranes o f
adjacent myeloma and antibody secreting cells, forming a single cell with two or
more nuclei. This heterokaryon retains these nuclei until the nuclear membranes
dissolves prior to mitosis. The cells from the immunized animal do not continue
to grow in tissue culture, however the myeloma cells are well adapted to tissue
culture.
In order to remove unfiised myeloma cells, drug selection is used.
Usually, myeloma has a mutation in one of the enzymes o f the salvage pathways
o f purine nucleotide biosynthesis (Littlefield, 1964). Selection with 8-azaguanine
yields a cell line harboring a mutated hypoxanthine-guanine phosphoribosyl
transferase gene (HGPRT). The addition of any compound that blocks the de novo
nucleotide biosynthesis pathway will force cells to use the salvage pathway.
Cells containing a nonfunctional HGPRT protein will die in these
conditions. Hybrids between myelomas with a nonfunctional HGPRT and cells
with a functional HPGRT will be able to grow. After fusion, parental myelomas
can be inhibited using a selective medium, with the remaining hybridoma cloned
and the desired MAb-producing cells selected.
43
Reproduced with permission of the copyright owner. Further reproduction prohibited without permission.
2.6. Current research objectives
There is a need for methods that are more reliable and facile than sensory
or gas chromatographic analyses currently available for the detection o f MIB from
water samples and fish samples. Immunoassay methods have the potential to meet
these requirements. As the ELISA currently developed by Chung et al. (1990) did
not provide great enough sensitivity for the analysis o f MIB from samples without
dilution, another method will be used to prepare immunogens and solid phase
protein conjugates in an attempt to improve enzyme immunoassay o f MIB.
The objective o f this study was to obtain a sensitive and reliable
immunoassay method to measure MIB. MAb specific to MIB was produced and
used in indirect ELISA. Three solid phase protein conjugates MIB-BSA,
isobomeol-BSA and bomeol-BSA were prepared and used as coating proteins in
ELISA. Bridge heterology effect was investigated by comparing these three solid
phase protein conjugates and the protein conjugate that showed most positive
results was used for the analysis o f MIB.
44
Reproduced with permission of the copyright owner. Further reproduction prohibited without permission.

CHAPTER 3. MATERIALS AND METHODS
3.1. Materials
Bomeol and isobomeol were purchased from Aldrich Chemical Co.,
Milwaukee, WL Succinic anhydride, 4-(Dimethyl amino) pyridine, anisaldehyde,
N-hydroxy succinimide, 1,3-dicyclohexylcarbodiimide, 2,2’-Azino-bis 3-
ethyIbenz-thiazoline-6-sulfonic acid (ABTS), ammonium carbonate, urea, bovine
serum albumin (BSA), Limulus polyphemus hemocyanin (LPH), and sterile
dimethyl sulfoxide (DMSO) were obtained from Sigma Chemical Co (St. Louis,
MO). Sterile polyethylene glycol (PEG 1500) in 75 |xM HEPES buffer was
purchased from Boehringer Mannheim (Indianapolis, IN). Ribi Adjuvant system
(for mice) was purchased from Ribi Immunochem Research, Inc. (Hamilton,
MA). Goat anti-mouse Ig G-peroxidase conjugate that was used as a secondary
antibody and was purchased from Sigma Chemical Co.
Phosphate-buffered saline (PBS) solution was made as 0.9% sodium
chloride in 0.01 M phosphate buffer, pH 7.3. To prepare PBST, tween 20 (0.05%,
v/v) was added before the pH was adjusted.
Serum-free RPMI consisted o f Rosewell Park Memorial Institute 1640
(Sigma) with the addition o f L-glutamine (2 mM), Na pyruvate (1 mM), penicillin
(100 units/mL) and streptomycin (100 pg/mL) (all purchased from Sigma).
Complete RPMI was serum free RPMI plus 20% (v/v) heat inactivated fetal
bovine serum (from Sigma). Heat inactivation was achieved at 56°C for 30 min.
HT medium consisted o f complete RPMI with 20% fetal bovine serum, sodium
45
Reproduced with permission of the copyright owner. Further reproduction prohibited without permission.
hypoxanthine(l 00 jiM) and thymidine (16 |jM). Hypoxanthine and thymidine
were purchased sterile as 100 x supplements from Gibco BRL (Gaithersburg,
MD). HAT medium consisted o f HT medium plus aminopterin (0.4 pM) (sterile
as 100 x from Gibco BRL).
3.2. Procedures
3.2.1. Preparation of immunogen and solid phase protein conjugates
Bomeol-LPH and MIB-LPH were prepared as immunogens. MIB-BSA,
isobomeol-BSA and bomeol-BSA were prepared as solid phase protein
conjugates. Figure 2 illustrates a scheme for the production o f bomeol-LPH
immunogen. Synthesis o f MIB-LPH, MIB-BSA, isobomeol-BSA and bomeol-
BSA followed this same procedure.
3.2.1.1. Preparation o f bomeol-hemisuccinate, isobomeol-hemisuccinate and MIB-hemisuccinate
For the preparation o f bomeol-hemisucinate, 4-dimethyl amino pyridine
(31.1 mg) was first added to 9.1 mL of pyridine prior to the addition o f succinic
anhydride (487.7 mg). Bomeol (168.4 mg) was added and the reaction mixture
was heated under reflux, with stirring for 4 days, 5 hours at 58°C. The reaction
was monitored by thin layer chromatography (TLC). The TLC assay used silica
gel 60 F264 (0.2 mm thick) aluminum sheets form E. Merck, (Darmstadt,
Germany) with a mobile phase o f ethyl acetate and methanol, and 1% aqueous
ammonia in a volume ratio o f 80:20:1.
Visualization was accomplished with a mixture o f anisaldehyde, glacial
acetic acid and concentrated sulfuric acid in a volume ratio o f 0.5:50:1. The
reaction was stopped with 20 mL of H2O. The resultant product was extracted
46
Reproduced with permission of the copyright owner. Further reproduction prohibited without permission.

bomeolSuccinic Anhydride
D imethy lam inopyridine
Pyridine
borneol-hemisuccinate
DimethylformamideN-hydroxysuccinimideN-N'-dicyclohexylcarbodiimide
bomeol-LPH
Figure 2. Preparation of immunogen (bomeol-LPH).
47
Reproduced with permission of the copyright owner. Further reproduction prohibited without permission.

three times, each time with 25 mL methylene chloride. The organic layer (lower
layer) was collected and rotaevaporated to dryness and then dried under vacuum
in the presence o f phosphorous pentoxide (P2O5).
Preparation o f MIB-hemisuccinate and isobomeol-hemisuccinate followed
the same procedure as for bomeol-hemisuccination. To prepare MIB
hemisuccinate, first 4-dimethylamino pyridine (38.4 mg) was added to 8.9 mL of
pyridine. Into this mixture, succinic anhydride (445.7 mg) was dissolved and then
2-methylisobomeol (82 mg) was added. The mixture was heated under reflux at
74°C and monitored with TLC as described above. After 3 days reaction, most of
the MIB was esterified with succinic anhydride to yield MIB-hemisuccinate. The
reaction product was extracted with methylene chloride and then rotaevaporated
to dryness following same procedure as for bomeol-hemisuccination. The final
weight of the MIB hemisuccinate was 154 mg.
In order to prepare isobomeol-hemisuccinate, 228.9 mg o f isobomeol,
58.6 mg o f dimethylaminopyridine and 786.2 mg o f succinic anhydride were
added to 9.5 mLof dried pyridine. The reaction was conducted at 58°C for 3 days
and extracted and rotaevaporated as described previously. The final weight o f the
reaction product was 387.3 mg.
3.2.1.2. Preparation o f immunogens
In order to prepare bomeol-Limulus polyphemus hemocyanin (LPH)
conjugate, all o f the bomeol hemisuccinate produced, as described above, was
dissolved in 4 mL anhydrous dimethyl formamide (DMF). N,N'-dicyclohexyl
carbodiimide (87.9 mg) and N-hydroxy succinimide (107 mg) were added and the
48
Reproduced with permission of the copyright owner. Further reproduction prohibited without permission.

mixture was stirred 12 hr at 4°C to form an active ester. LPH (25.1 mg) was
dissolved in 4 mL o f phosphate buffered saline (PBS), pH 7.4. Half of the active
ester reaction mixture was filtered through glass wool into the LPH/PBS solution.
The mixture was stirred 22 hr at 4°C and then dialyzed for 2 hr against 8 M urea
(0.9 L) then 1 hr against 50 mM ammonium carbonate (2 L) and finally overnight
against 25 mM ammonium carbonate(4 L). The final dialyzed product was
lyophilized to 23.1 mg.
For the preparation o f MIB-LPH conjugate, 92 mg o f MIB-hemisuccinate,
52.6 mg ofN-hydroxysuccinimide and 70.2 mg o f dicyclohexylcarbodimide were
dissolved in 3 ml o f dimethylformamide. After 1 day o f reaction, the active ester
reaction mixture was filtered through glass wool into LPH solution (50.3 mg of
LPH in 6 ml o f PBS buffer (pH 7.4). The mixture was stirred 48 hr at 4°C and
followed the same dialysis step described above. The final product after
lyophilization was 62.3 mg.
3.2.1.3. Preparation o f solid phase protein conjugates
Three solid phase protein conjugates were prepared in this research. The
solid-phase conjugate used in most ELISA assays was MIB-bovine serum
albumin conjugate. To make this conjugate, MIB hemisuccinate was prepared and
then reacted with bovine serum albumin (BSA). The MIB-hemisuccinate product
(62 mg) was dissolved in 2 ml anhydrous dimethylformamide; and then N-
hydroxysuccinimide (35 mg) and N,N'-dicyclohexylcarbodiimide (51 mg) were
added. The reaction mixture was stirred 24 hr at 4°C to form the active ester of
MIB-hemisuccinate. BSA (127.3 mg) was dissolved in 3 ml PBS. The active ester
49
Reproduced with permission of the copyright owner. Further reproduction prohibited without permission.

reaction mixture (2 mL) was filtered through glass wool into the BSA solution.
The mixture was stirred 2 days at 4°C and then dialyzed against three successive
solutions-first against 8 M urea (0.9 L) for 2 hr, then against 50 mM ammonium
carbonate (2 L) for 4 hr, and finally, against 25 mM ammonium carbonate (4 L) 5
hr. The dialyzed sample was lyophilized and resultant product weighed (102.5
mg). To obtain only soluble conjugate, the dialysis product (80.2 mg) was
dissolved in !5mL ammonium carbonate and centrifuged at 800 x g for 15min.
The supernatant was lyophilized again. The weight o f the final purified MIB-BSA
conjugate was 27.6 mg.
For the comparison o f solid phase protein conjugate structure effects on
the sensitivity o f ELISA, isobomeol-BSA and bomeol-BSA were prepared. In
order to prepare isobomeol-BSA, 51.6 mg o f isobomeol-hemisuccinate, 161.2 mg
of N-hydroxysuccinimde and 174.2 mg o f dicyclohexylcarbodimide were
dissolved in 2 ml o f dimethylformamide. After 2 days reaction at 4°C, the active
ester reaction product was added to BSA solution dissolved in PBS buffer (403
mg of BSA in 2 mL PBS pH7.4). The dialysis method described above was
followed after 1 day reaction. The weight o f the final purified isobomeol-BSA
conjugate was 305.8 mg.
For the preparation o f bomeol-BSA, 109.4 mg o f bomeol-hemisuccinate,
117.3 mg o f N-hydroxysuccinimide and 133.9 mg o f dicyclohexylcarbodimide
were dissolved in 4 ml of dimethylformamide. After 20 hr reaction at 4°C, the
active ester reaction product was combined into BSA solution (199.6 mg of BSA
in 10 mL PBS at pH 7.4). After 2 days reaction at 4°C, the dialysis method
50
Reproduced with permission of the copyright owner. Further reproduction prohibited without permission.

described above was followed and then the product was freeze dried. The final
weight after lyophilization was 196.8 mg.
3.2.2. Preparation o f monoclonal antibody
3.2.2.1. Immunization
BALB/c female mice at 4 months age were handled by the Life Science
Animal Service Facility at the Louisiana State University. Prior to immunization,
blood samples (200 pi) were obtained from four mice by ocular. Two mice,
mouse 1 and 2, were then immunized with 0.3 mg of MIB-LPH conjugate in 0.6
ml sterile PBS/Ribi adjuvant system and another two mice, mouse 3 and 4, were
immunized with 0.3 mg o f bomeol-LPH conjugate in 0.6 ml sterile PBS/Ribi
adjuvant system. Two 0.1 ml injections were made in each mouse, one
subcutaneously and the other intraperitoneally. Subsequent injection boosts were
made in the same manner on day 21, 46, and 67 after the initial injections for all
four mice. Mouse 2 was injected one more boost on day 154 and mouse I was
injected two more boosts on day 154 and 317. Blood samples were collected 1
wk after each immunization. Each blood sample was allowed to clot at 37°C for
30 min and then stored at 4°C overnight. The samples were then centrifuged at
15,000 x g to separate the serum from the blood cells. The serums were used to
assay for the presence o f antibodies to MIB.
3.2.2.2. Cell fusion and selection
Myeloma cells (NS-1, ATCC # TIB 18) were grown in sterile tissue
culture flasks using complete RPMI with 20 % fetal bovine serum at general
incubation conditions (37 °C, 5 % CO2 and 90-100 % humidity). Cells were
51
Reproduced with permission of the copyright owner. Further reproduction prohibited without permission.
subcultured every 2-4 days using dilutions in the range o f 1/10 to 1/20 to maintain
cell density from about 10s to 106 cells /mL. Viable cells were counted as a 1/10
or 1/5 dilution o f cell suspension in 0.25 % (w/v) trypan blue in PBS. On the day
of fusion, actively dividing myeloma cells were centrifuged at 250 x g for 10 min.
The cells were then combined and then washed twice with 15 mL serum free
RPMI. After the final washing, the cells were resuspended in 15 mL serum free
RPMI and the viable cells counted. Three days after final injection, the selected
mouse was asphyxiated using CO2 and its spleen was removed under sterile
conditions. The spleen was washed with 10 mL serum free RPMI and moved to a
petri dish containing another 10 mL serum free RPMI. Splenocytes were gently
teased and flushed from the spleen using two sterile needles (21 gauge) and
syringes. The splenocytes were transferred to a 15 mL-conical centrifuge tube and
centrifuged at 250 x g for 5 min. The cells were washed twice with 10 mL serum
free RPMI. After the last centrifugation, red blood cells were lysed by suspending
the cells in 4 mL o f 0.8 % NH4CI for 1.5 min. The remaining intact cells
(splenocytes) were then centrifuged at 250 x g for 10 min, resuspended in 10 mL
serum free RPMI, counted and immediately used for fusion.
Splenocytes and myeloma cells were combined in a ratio of 13:1. The
combined cells were gently mixed and centrifuged at 800 x g for 5 min. One (1)
mL of 1 % polyethylene glycol ("PEG") 1500 in HEPES buffer was added to the
cells with gentle mixing and stirring for an additional 2 min at room temperature.
Serum free RPMI (1 mL) was slowly added over the next 1 min and with an
additional 9 mL added over the next 3 min. The cell suspension was then
52
Reproduced with permission of the copyright owner. Further reproduction prohibited without permission.
centrifuged in 8 mL HAT medium and plated out by adding 100 p i cell
suspension to each well o f a 96 well sterile plate. Control myeloma cells were
added to 8 wells. The cells were cultured in HAT medium for the first 10 days.
For the next 10 days, cells were subcultured in HT medium. After 5 days,
supernatant from each well was screened for antibodies by incubating 20 pi
aliquots on microtiter plates. The plate had been previously coated with 10 pg/mL
MIB-BSA conjugate, blocked with 200 pi o f 1% BSA in PBS for I hr and washed
three times with 200 pi PBST for 5 min at room temperature. After incubating for
2 hr at room temperature wells were emptied and washed three times, as before,
with 200 pi PBST. Goat anti-mouse IgG-peroxidase conjugate was diluted 1/2000
and 200 pi of the diluted solution was added to each well. The plate was again
incubated 2 hr at room temperature and washed as before. A solution (200 pi) of
peroxidase substrate (2,2'-azino-bis(3-ethylbenz-thiazoline-6-sulfonic acid)
(ABTS), 0.5 mg/mL) with 0.01% hydrogen peroxide in 0.1 M citrate buffer (pH
3.8) was added to each well. The relative antibody (Ab) activity was expressed as
the absorbance (A 405nm) measured after 30 min peroxidase reaction at room
temperature. Cells that showed relative Ab activities o f greater than 1.0 were
subcultured in 24 well plates and cloned.
3.2.2.3. Cell cloning
Selected cells from wells producing an Ab specific for MIB were cloned
using the following method based on limiting dilution as described by Coding
(1986), Harlow and Lane (1988) and Barrett (1994). Conditioned medium was
prepared by growing myeloma cells in complete RPMI containing 20 % fetal
53
Reproduced with permission of the copyright owner. Further reproduction prohibited without permission.
bovine semm for 2 to 4 days, centrifuging the cell suspension at 250 x g for 10
min, and passing the supernatant through a 0.2 pm filter. This filtered medium
was fortified with 20% fetal bovine serum and 1% 200 pM glutamine.
Cells were plated at concentrations o f 10, 1 and 0.1 cells per 200 pi o f
conditioned medium in 96 well plates (30 wells of each concentration).
Macroscopic colonies, as seen by looking at the under surface o f the plate,
became visible 1 week after cloning commenced. Supernatants were assayed for
the presence o f Ab following the same procedure described previously after 10
days. Positive clones were transferred to 24 well plates to test cell viability and
activity. The cloning procedure was repeated three times to ensure stability o f cell
lines.
3.2.2.4. Ammonium sulfate precipitation o f monoclonal antibody
From 200 ml o f cell (cell line F6b4G7B4, cloned three times) suspensions
cultured in RPMI media with 10 % fetal bovine serum, supernatants were
collected by centrifuging at 200 x g for 5 min. The supernatants were centrifuged
at 16,300 x g for lOmin to remove any remaining cell debris and insoluble
proteins. Ammonium sulfate (62 g/200 mL) was slowly added as a powder to
obtain 50% saturation and stirred at 4°C overnight. The mixture was centrifuged
at 16,300 x g for lOmin to obtain precipitated proteins. Precipitated pellets of
proteins were dissolved in PBS and dialyzed against 2 L PBS, 3 times, at 4°C for
3 days. Dialyzed samples were made up to 15 mLwith PBS.
Reproduced with permission of the copyright owner. Further reproduction prohibited without permission.

splenocytes myeloma
Fusion with PEG 1500
HAT media
ScreeningCloning
Figure 3. Production o f monoclonal antibody by fusion o f splenocytes o f mouse with myeloma cells.
Y
55
Reproduced with permission of the copyright owner. Further reproduction prohibited without permission.
3.2.3. Enzyme immunoassay (El)
3.2.3.1. Testing mice sera for determination o f antibody titer
Ab titers o f mouse sera were tested using a checker board enzyme
immunoassay. A stock solution (100 pg/mL) o f the solid phase MIB-BSA
conjugate was prepared in PBS. This solution was serially diluted three times with
PBS to obtain four different concentrations: 100 pg/mL, 10 pg/mL, 1 pg/mL, 0.1
jig/mT. and 0 pg/mL. Each row o f a microtiter plate was filled with 100 pi o f one
o f the above concentrations. The plates were then stored overnight at 4°C. The
next day the solution was removed from the plate with a sharp shake o f wrist, and
each well was blocked with 200 pi of 1 % gelatin in PBS for 30 min at 37°C. The
wells were then washed three times with 200 pi PBST for 5 min at room
temperature.
Five different dilutions o f mouse serum (1/500, 1/1000, 1/5000, 1/10000,
1/100000) were prepared by adding 1 % BSA in PBS. Fifty (50) pi o f H2O was
added to each well o f the microtiter plate, immediately followed by 50 pi diluted
serum in a manner such that each column o f the microtiter plate contained a
different serum concentration. After incubating for 30 min at 37 °C, wells were
emptied and washed three times as before with 200 p i PBST. Goat anti-mouse
IgG-peroxidase conjugate was diluted 1/1000, and 100 pi o f the diluted solution
was added to each well. The plates were again incubated for 30 min at 37 °C and
washed as before. A solution (100 pi) o f peroxidase substrate (2,2'-azino-bis(3-
ethylbenz-thiazoline-6-sulfonic acid) (ABTS, 0.5 mg/mL) with 0.01 % hydrogen
56
Reproduced with permission of the copyright owner. Further reproduction prohibited without permission.

peroxide in 0.1 M citrate buffer (pH 3.8) was added to each well. After 30 min at
room temperature, the absorbances at 405 nm were measured.
To test the ability o f the antibody to bind to free MIB, an indirect
competitive ELISA was performed. Microplates were coated with MIB-BSA
conjugate (1 pg/mL) in PBS and then stored overnight at 4°C. The next day the
solution was removed from the plate with a sharp shake o f wrist, and each well
were blocked with 200 pi o f 1% gelatin in PBS for 30 min at 37°C. The wells
were then washed three times with 200 pi PBST for 5 min at room temperature.
Fifty (50) p i o f 5% methanol containing MIB was added to each well o f the
microtiter plate immediately followed by 50 pi diluted serum (1/5000). The MIB
solution had been serially diluted to generate different concentrations as described
above to obtain the standard curve. After incubating for 30 min at 37 °C, wells
were emptied and washed three times as before with 200 pi PBST. Goat anti
mouse IgG-peroxidase conjugate was diluted 1/1000, and 100 pi o f the diluted
solution was added to each well. The plates were again incubated for 30 min at
37°C and washed as before. A solution (100 pi) of peroxidase substrate (2,2-
azino-bis(3-ethylbenz-thiazoline-6-sulfonic acid) (ABTS, 0.5 mg/mL) with 0.01%
hydrogen peroxide in 0.1 M citrate buffer (pH 3.8) was added to each well. After
30 min at room temperature, the absorbance at 405 nm was measured.
3.2.3.2. Competitive enzyme immunoassay
Figure 4 shows the principle o f competitive ELISA. For competitive
assays, inhibition curves were constructed using 0.1 ng/L to 100 mg/L MIB in 10
% methanol. Optimum concentrations o f antibody and solid phase protein
57
Reproduced with permission of the copyright owner. Further reproduction prohibited without permission.

conjugate were predetermined by a checker board ELISA as described in the
previous section. Three different solid phase conjugates were used: MIB-BSA,
isobomeol-BSA and bomeol-BSA. Microplates were coated with different
concentrations o f solid phase protein conjugate (200 pl/well) and stored overnight
at 4°C. The next day the solution was removed from the plate with a sharp shake
of wrist, and each well blocked with 200 pi o f I % BSA in PBS 1 hr at room
temperature. The wells were then washed three times with 200 pi PBST for 5 min
at room temperature. Serially diluted MIB solution (from 10 ng/L to 100 mg/L) in
10 % methanol was added for the competition and then prediluted anti-bomeol
MAb (100 pi) was added as a primary antibody. After incubating for 2 hr at room
temperature in a shaker, the wells were washed three times with 200 pi PBST.
Prediluted goat anti-mouse IgG-peroxidase conjugate (1/2000) was added to the
wells for use as a secondary antibody and the wells were further incubated at
room temperature for 2 hr. The wells were then washed as before. A solution (100
pi) of peroxidase substrate (2,2'-azino-bis-3-ethylbenz-thiazoline-6-sulfonic acid
(ABTS, 0.5 mg/ml) with 0.01 % hydrogen peroxide in 0.1 M citrate buffer (pH
3.8)) was added to each well. After incubating for 30 min at room temperature,
the absorbance at 415nm was measured. Graphs were constructed with Ausnm
(absorbance at 415nm) as the y-axis and MIB concentration as the x-axis. The
results, expressed as A/Ao, were calculated as follows:
A/Ao= (A4i5nm sample)/( Ansnm blank)
The equations for inhibition curves were determined using SOFT max Pro
2.2 (Molecular Devices Corp. Sunnyvale, CA). The data collected for standard
58
Reproduced with permission of the copyright owner. Further reproduction prohibited without permission.
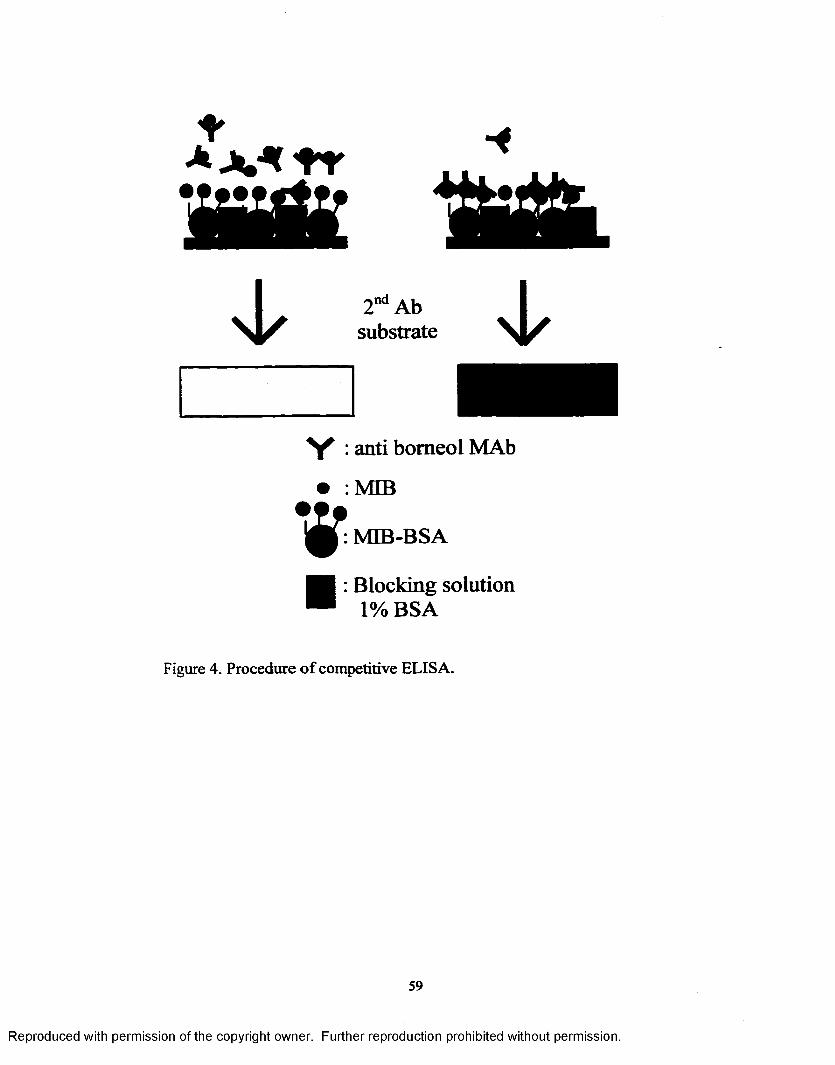
I 2nd Ab Isubstrate
Y : anti bomeol MAb
• : MIB
•<rMIB-BSA
: Blocking solution 1% BSA
Figure 4. Procedure o f competitive ELISA.
59
Reproduced with permission of the copyright owner. Further reproduction prohibited without permission.

solutions were used to determine values for the following parameters by the
equation:
y=(a-d)/[(l+(x/c)b] +d
In this equation, y is the response measurement (absorbance), x is MIB
concentration, a is the y-intercept, b is curvature parameter (i.e slope at the
inflection point), c is concentration o f MIB giving 50 % reduction in y ( I 5 0 value)
and d is the value o f y at infinite (saturating) x (i.e. background). Graphs are also
constructed with A/Ao as the y-axis and MIB concentration as the x-axis.
Cross reactivity was expressed as (I50 value o f MIB/ Is0 value o f the
compound tested) x 100 (%).
60
Reproduced with permission of the copyright owner. Further reproduction prohibited without permission.
CHAPTER 4. RESULTS AND DISCUSSION
4.1 Production of Immunogen and solid phase protein conjugate
Two protein conjugates, MIB-LPH and bomeol-LPH were prepared as
immunogens and three protein conjugates, MIB-BSA, isobomeol-BSA and
bomeol-BSA were prepared as solid phase protein conjugates. Because MIB and
bomeol are small molecular weight compounds, they must be bound to a large
molecule to elicit immune response and subsequently cause the production of
antibodies. By the esterification with succinic anhydride, carboxyl groups were
introduced to hydroxyl groups o f MIB, bomeol and isobomeol.
Molecular size o f the compound and degree o f foreignness are the two
most important factors determining their immunogenicity (Abraham and Grover,
1971). Molecules with a molecular weight in excess o f 10,000 tend to be good
antigens, whereas molecules with a molecular weight in the 1,000 to 5,000 ranges
are usually poor antigens (Abraham and Grover, 1971). Peptides with a molecular
weight o f less than 1000 have been immunogenic provided they are given in
complete adjuvant (Abraham and Grover, 1971). Non-protein, small organic
molecules are generally non-immunogenic but can produce an immune response
when they are bound to protein. These molecules are termed haptens.
When a hapten contains a hydroxyl group, carboxylic acid may be
introduced by the esterification with dicarboxylic acid anhyrides (e. g. succinic
anhydride) yielding hemisuccinates, which are unstable above pH 9. Another way
to introduce carboxylic acid to a hydroxyl-containing molecules is by
61
Reproduced with permission of the copyright owner. Further reproduction prohibited without permission.
carboxymethylation o f the hydroxyl group with bromo- or iodo-acetic acid and
reaction with pyogene. This results in the formation o f chlorocarbonates. For the
synthesis o f MIB-LPH and bomeol-LPH conjugates, a carboxylic acid group was
introduced to the MIB and bomeol. Esterification with succinic anhyride to yield
hemisuccinate derivatives has been reported in Abraham and Grover (1971) and
Plhak and Spoms (1992).
To monitor the reaction o f hemisuccination, thin layer chromatography
(TLC) was used. MIB (or bomeol) and succinic anhydride differ in their polarity,
so they can be easily separated depending on the mobile phase. As the succination
reaction proceeded, the amount o f MIB decreased and the amount o f MIB
hemisuccinate increased. When the reaction was complete, the MIB spot
disappeared.
To form covalent bonds between low molecular weight chemical
compounds, peptide bond formation is most commonly used and desirable
because it is a strong bond. For hapten-protein bond formation, carbodiimide
condensation is a common approach. Another method o f forming nonpeptide
bonds is the Schiffs base reaction using glutaraldehyde (Abraham and Grover,
1971). The coupling o f carboxyl-containing compounds to amino groups of the
polypeptide carrier is usually performed with an excess o f carboxyl groups and an
equivalent amount o f the water soluble carbodiimide around pH 5 at room
temperature. In some cases where the hapten is not water soluble, it is usually
dissolved in DMF or dioxane. In this experiment dicychlohexylcarbodiimde was
Reproduced with permission of the copyright owner. Further reproduction prohibited without permission.
used. Dicychlohexylurea, which was one product o f the reaction, was very
insoluble and precipitated in most solvents.
The percentage o f the MIB incorporated into the protein was determined
using Matrix Assisted Laser Desorption Ionization Mass Spectroscopy (MALDI-
MS) and the trinitrobenzene sulfonate method (TNBS). To form a covalent bond
between hemisuccination reaction product and protein (LPH and BSA), a peptide
bond was introduced by the carbodiimide condensation method and in this
experiment dichlohexylcarbodiimde (DCC) was used. MIB-hemisuccinate and
bomeol-hemisuccinate were conjugated to LPH by this active ester method and
used as an immunogen. Using the same method, MIB-BSA, isobomeol-BSA and
bomeol-BSA were synthesized and used as a solid phase protein conjugate in the
enzyme immunoassay.
The reactivity o f hydroxyl groups for the esterification .is different
depending on the structure o f the carbon bearing its hydroxyl groups. For this
SN2 reaction, the phenolic hydroxyl group is most reactive and 1°> 2°> 3°
alcohols (Abraham and Grover, 1971). For the synthesis o f MIB-hemisuccinate,
the reaction was accelerated with the addition o f the catalyst 4-dimethyIamino
pyridine and by increasing the temperature and reaction time. An alternative
method for the conjugation o f MIB was to use a hydroxylated derivative o f 2°
hydroxyl group, which is similar in structure to MIB. Bomeol and isobomeol
have similar structure compared with MIB except they lack one methyl group
(Figure 5). These two compounds have 2° hydroxyl groups. There would be less
Reproduced with permission of the copyright owner. Further reproduction prohibited without permission.

steric hindrance at these 2° hydroxyl groups in the esterification with succinic
anhydride.
CHCHCH
CHCHCH OHOH
OHCH
2-methylisobomeol bomeol isobomeol
Figure 5. Structures o f compounds that are used for the conjugation of immunogen and solid phase conjugate, 2-methylisobomeol, bomeol and isobomeol.
The reactions were monitored by TLC and visualized by anisaldehyde.
Figure 6 and Figure 7 are results o f MIB-hemisuccination and bomeol-
hemisuccination. Table 5 summarized the Rf values o f reaction products of
hemisuccination. R f values o f MIB, isobomeol and bomeol are 0.89, 0.88 and
0.88 and all three o f these compounds showed similar patterns in the TLC plate.
Rf value o f MIB-hemisuccinate was 0.63 and isobomeol-hemisuccinate and
bomeol-hemisuccinate were 0.76 and 0.78. These hemisuccination reaction
products were bound to the lysine group of LPH by the carbodiimide
condensation method. MIB-hemisuccinate and bomeol-hemisuccinate were bound
to LPH and used as immunogens. Binding o f MIB hemisuccinate to LPH was
confirmed using the TNBS method (Appendix I).
Using the same method, MIB-BSA, isobomeol-BSA, and bomeol-BSA
were prepared as a solid phase protein conjugates and effects on ELISA
64
Reproduced with permission of the copyright owner. Further reproduction prohibited without permission.

A B
Figure 6 . TLC result o f MEB-hemisuccination. Lane A is MIB and lane B is MIB- hemisuccinate after 3 days of reaction. Mixtures o f ethylacetate, methanol and 1% ammonium hydroxide with the ratio o f 80:20:1 was used as a mobile phase. Anisaldehyde solution dissolved in acetic acid and sulfuric acid (0.5:50:1) was used to visualize the compounds.
Reproduced with permission of the copyright owner. Further reproduction prohibited without permission.

A B
Figure 7. TLC result o f bomeol-hemisuccination. Lane A is bomeol and lane B is bomeol-hemisuccinate after 3 days o f reaction. Mixtures o f ethylacetate, methanol and 1% ammonium hydroxide with the ratio o f 80:20:1 was used as a mobile phase. Anisaldehyde solution dissolved in acetic acid and sulfuric acid (0.5:50:1) was used to visualize the compounds.
66
Reproduced with permission of the copyright owner. Further reproduction prohibited without permission.
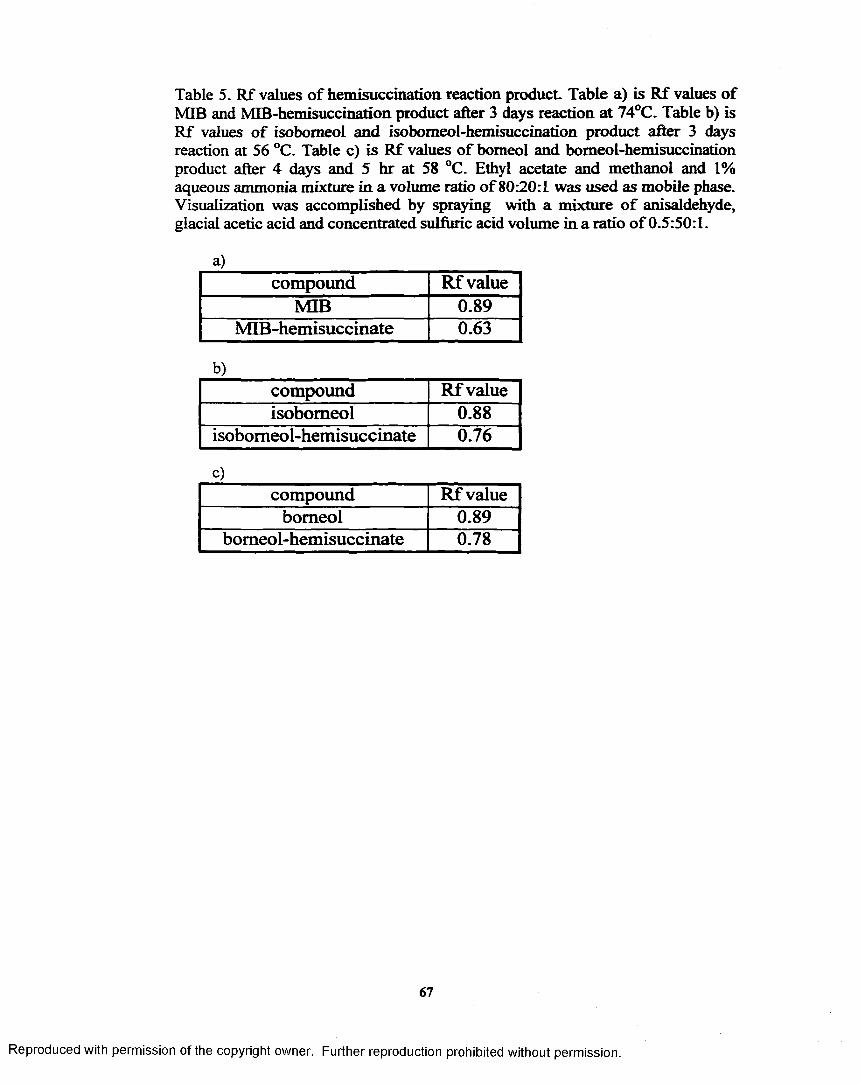
Table 5. R f values o f hemisuccination reaction product. Table a) is R f values o f MIB and MIB-hemisuccination product after 3 days reaction at 74°C. Table b) is R f values o f isobomeol and isobomeol-hemisuccination product after 3 days reaction at 56 °C. Table c) is R f values o f bomeol and bomeol-hemisuccination product after 4 days and 5 hr at 58 °C. Ethyl acetate and methanol and 1% aqueous ammonia mixture in a volume ratio o f 80:20:1 was used as mobile phase. Visualization was accomplished by spraying with a mixture o f anisaldehyde, glacial acetic acid and concentrated sulfuric acid volume in a ratio o f 0.5:50:1.
a)compound R f value
MIB 0.89MIB-hemisuccinate 0.63
b)compound R f valueisobomeol 0.88
isobomeol-hemisuccinate 0.76
c)compound R f value
bomeol 0.89bomeol-hemisuccinate 0.78
67
Reproduced with permission of the copyright owner. Further reproduction prohibited without permission.
sensitivity (measured in this case as I50 values) were compared. Molecular
weights o f these conjugate proteins were measured by MALDI (Figure 8 and
Figure 9) and bound numbers of hemisuccinates (MIB-hemisuccinate, isoboraeol-
hemisuccinate and bomeol-hemisuccinate) were calculated (Table 6).
The production o f solid phase protein conjugate through hemisuccination
yielded MIB-BSA containing 10 molecules o f MIB hemisuccinate per BSA,
isobomeol-BSA containing 15 molecules o f isobomeol-hemsuccinate per BSA
and bomeol-BSA containing 13 molecules o f bomeol-hemisuccinate per BSA.
Since LPH is an aggregated protein and has a broad range of relatively high
molecular weights, MALDI is not appropriate to determine molecular weight o f
LPH conjugates.
4.2. Production o f Monoclonal antibody
4.2.1. Test o f mouse polyclonal antibody
Four female BALB/c mice were used for immunization in an attempt to
produce monoclonal antibodies of MIB. Two mice (mouse 1 and mouse 2) were
immunized with MIB-LPH protein conjugate and another two mice (mouse 3 and
mouse 4) were immunized with bomeol-LPH protein conjugate.
Figure 10 and 11 show checker board ELISA of mice sera immunized
with MIB-LPH and bomeol-LPH two times. Five different concentrations o f mice
sera (1/500, 1/1,000, 1/5,000, 1/10,000 and 1/100,000) and preimmune sera were
used for the test. MIB-BSA was serially diluted from 100 gg/mL to 0.1 fig/mL by
1/10 times and used as a coating protein. After two immunizations, all four mice
showed positive response with a slight difference in titer depending on the mouse.
68
Reproduced with permission of the copyright owner. Further reproduction prohibited without permission.
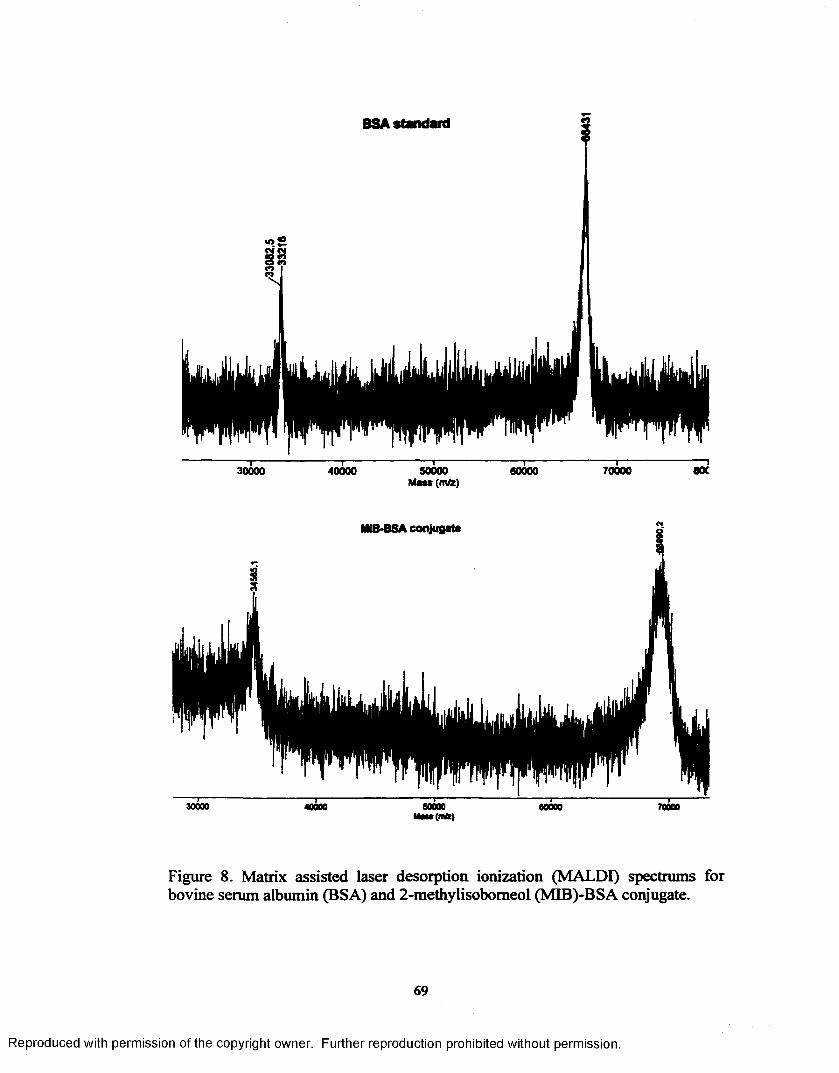
30000 40000 50000 60000 70000 80CMass (m/2)
MIB*BSA conjugate
30000 40000 80000(mfc)
ooooo 70000
Figure 8 . Matrix assisted laser desorption ionization (MALDI) spectrums for bovine serum albumin (BSA) and 2-methylisobomeol (MIB)-BSA conjugate.
69
Reproduced with permission of the copyright owner. Further reproduction prohibited without permission.
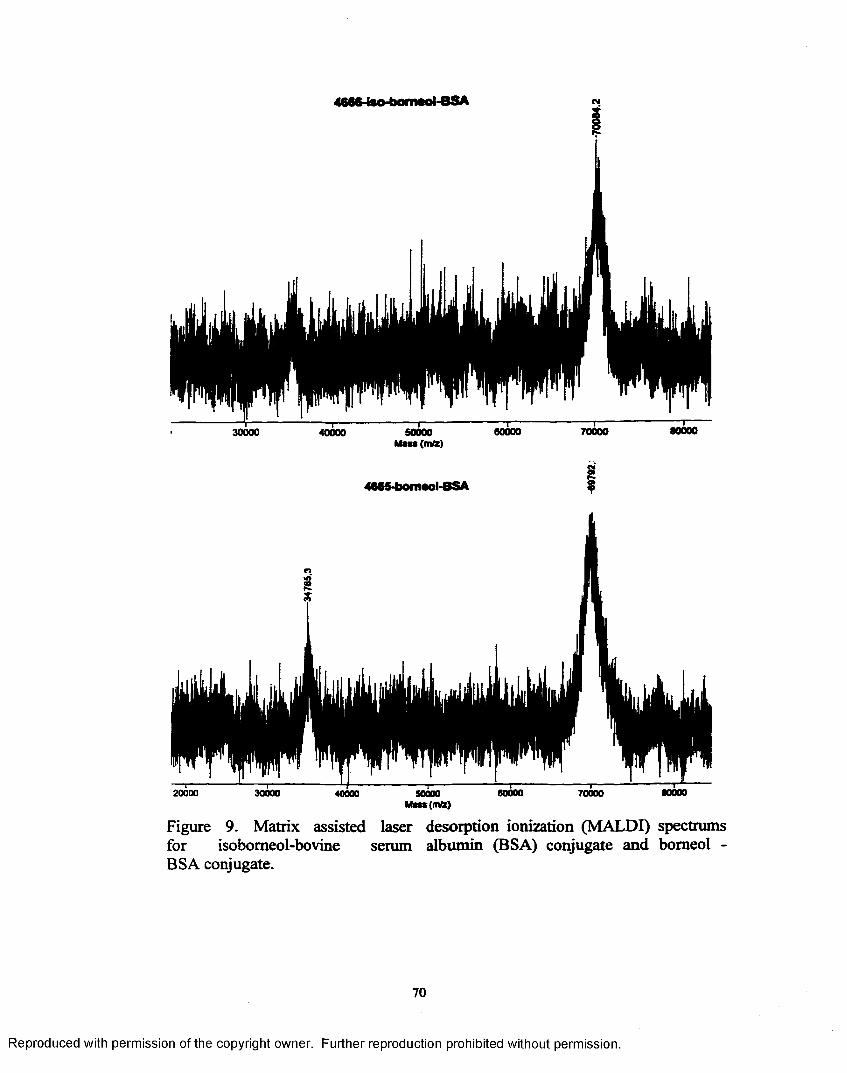
4666-tao-bomaol-BSA
30000
n
800006000020000 30000 7000040000
Figure 9. Matrix assisted laser desorption ionization (MALDI) spectrums for isobomeol-bovine serum albumin (BSA) conjugate and bomeol - BSA conjugate.
70
Reproduced with permission of the copyright owner. Further reproduction prohibited without permission.

Table 6 . Molecular weight and hapten numbers o f solid phase protein conjugates. Each molecular weight was determined by MALDI.
Molecularweight
Haptennumber
MIB-BSA 68990.2 10IsobomeoI-BSA 70084.2 15
Bomeol-BSA 69792.3 13BSA 66431 0
71
Reproduced with permission of the copyright owner. Further reproduction prohibited without permission.

Ecino•<r
a)2.5
2
1.5
1
0.5
0100 10 1 0.1
solid phase concentration (ug/ml)
Eeino
b)2
1.5
1
0.5
0100 10 1 0.1
solid phase concentration (ug/ml)
Figure 10. Checker board ELISA of mice (mouse 1 and 2) sera after immunization o f MIB-LPH two times. Five different concentrations of Ab (1/500, 1/1,000, 1/5,000, 1/10,000 and 1/100,000) were used as a primary Ab source and four different concentrations o f MIB-BSA (100pg/ml, 10|xg/ml, lpg/ml and O.lpg/ml) were used as a solid phase protein conjugates. Graph a) is checker board ELISA result of mouse #1 and graph b) is checker board ELISA result o f mouse #2 .
72
Reproduced with permission of the copyright owner. Further reproduction prohibited without permission.
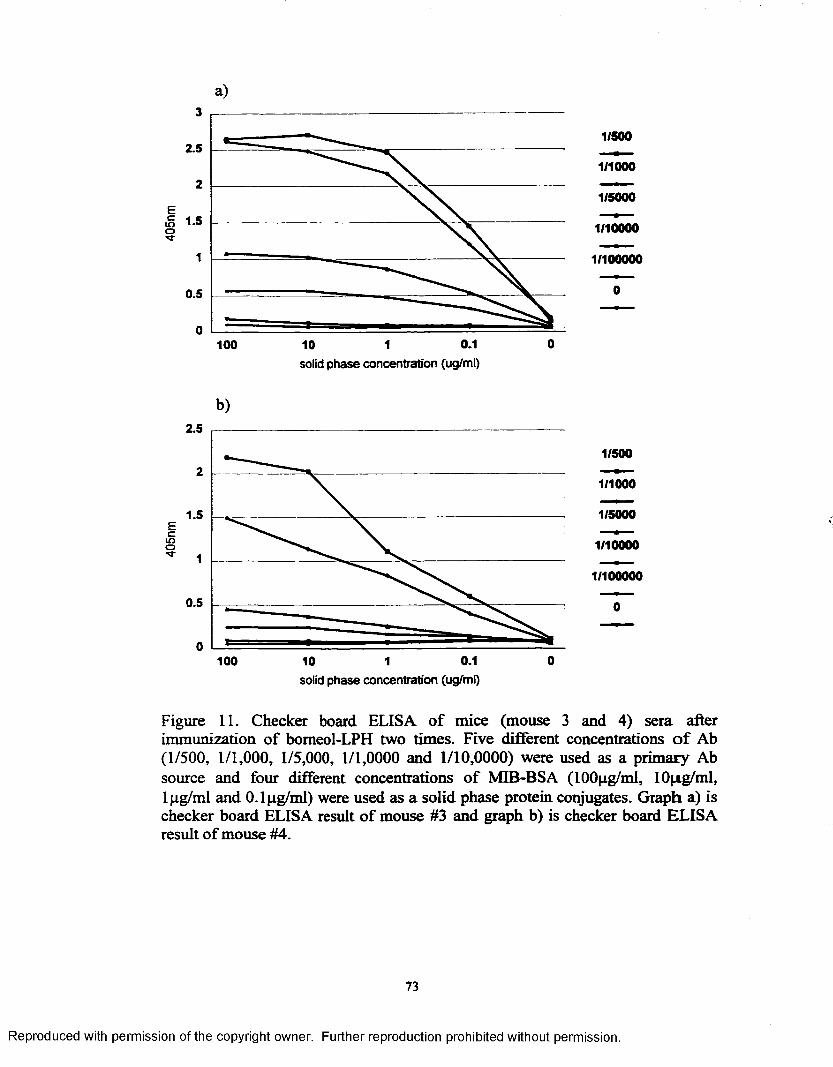
a)
2.5
0.5
00.1100 10 1solid phase concentration (ug/ml)
b)2.5
1.5Ei=ino■»r
0.5
0.1 0100 10 1solid phase concentration (ug/ml)
Figure 11. Checker board ELISA o f mice (mouse 3 and 4) sera after immunization of bomeol-LPH two times. Five different concentrations o f Ab (1/500, 1/1,000, 1/5,000, 1/1,0000 and 1/10,0000) were used as a primary Ab source and four different concentrations o f MIB-BSA (lOOpg/ml, 10ng/ml, lp-g/ml and O.lpg/ml) were used as a solid phase protein conjugates. Graph a) is checker board ELISA result o f mouse #3 and graph b) is checker board ELISA result o f mouse #4.
73
Reproduced with permission of the copyright owner. Further reproduction prohibited without permission.
To assure that the polyclonal antibody was binding free MIB, a competitive
ELISA was performed. Figure 12 shows the competitive ELISA results using
mouse sera after two immunizations. Ab concentration and solid phase conjugate
concentration were predetermined using checkerboard ELISA. Ab from serum
recognized solid-phase MEB conjugate and was competitively removed by free
MTB in the ELISA even at 0.1 (ig/mL o f MIB concentration.
4.2.2. Fusion and screening o f mouse I and 2 immunized with MIB-LPH
As the production o f anti MIB polyclonal antibody in the mouse was
identified by ELISA, fusion of splenocytes with myeloma was made to prepare
monoclonal antibody against MIB. Myeloma cells were previously cloned and
tested in HAT media. Mouse 2 was immunized five times before the fusion and
fusion was performed after three days of the last fusion. As a 10 to 1 ratio is
generally recommended for cell numbers (splenocytes vs myeloma cells), a total
of 8.5 x 10⁷ splenocytes were fused to 8.8625 x 10⁶ myeloma cells and distributed
in four 96 well tissue culture plates. Each plate had 4 wells of control cells
(myeloma).
After 5 days, fusion o f splenocytes o f mouse 2 with myeloma produced 2
to 6 hybridomas per well totaling approximately 1000 hybridoma. The first
screening o f supernatant was made 6 days after fusion. In the first screening 7
wells showed positive response binding to the MIB-BSA solid phase conjugate
and Ao values were from 0.301 to 0.593. In the second screening (10 days after
fusion), most o f the wells showed affinity to the MIB-BSA and cells from 42
Reproduced with permission of the copyright owner. Further reproduction prohibited without permission.
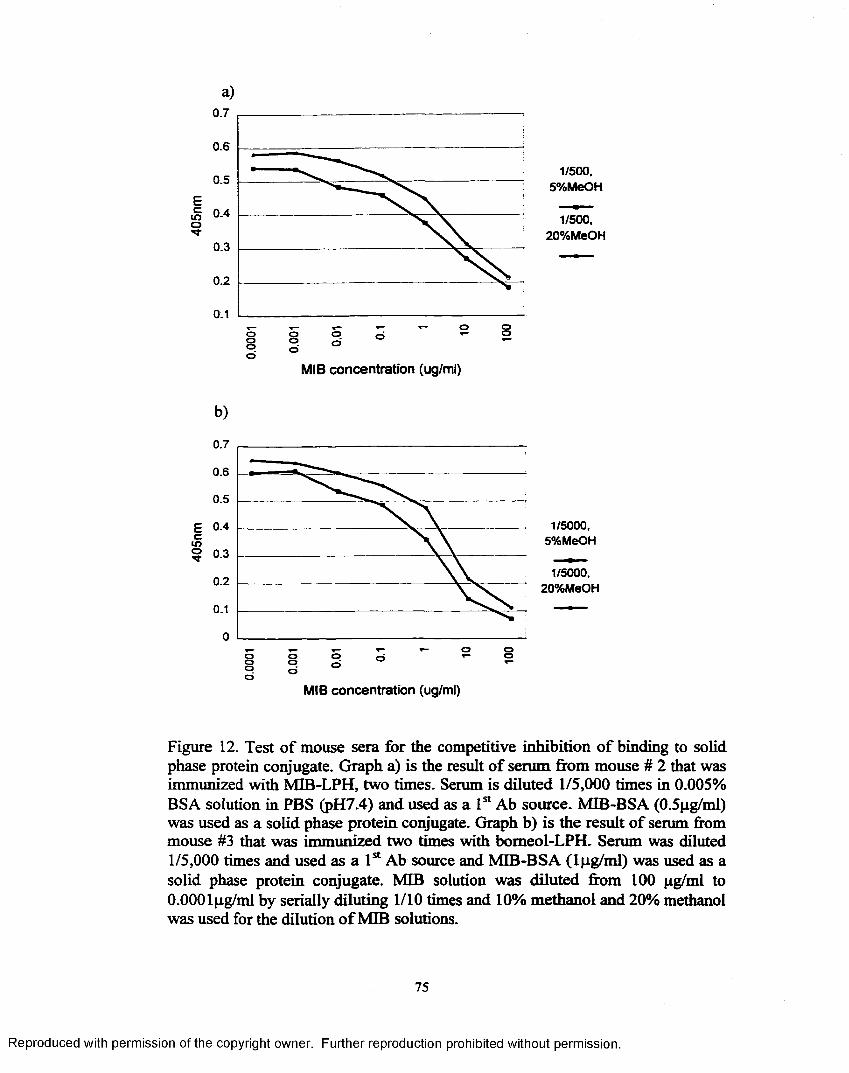
a)
Eeino•*r
0.7
0.6
0.5
0.3
0.2
0.1ooo
oo oo
o oo
1/500.5%MeOH
1/500,20%MeOH
b )
MIB concentration (ug/ml)
Cm
0.7
0.6
0.5
0.4
0.3
0.2
0.1
0oooo
ooo
oo’
MIB concentration (ug/ml)
oo
1/5000,5%MeOH
1/5000,20%MeOH
Figure 12. Test o f mouse sera for the competitive inhibition o f binding to solid phase protein conjugate. Graph a) is the result o f serum from mouse # 2 that was immunized with MIB-LPH, two times. Serum is diluted 1/5,000 times in 0.005% BSA solution in PBS (pH7.4) and used as a 1st Ab source. MIB-BSA (0.5|ig/ml) was used as a solid phase protein conjugate. Graph b) is the result o f serum from mouse #3 that was im m u n iz e d two times with bomeol-LPH. Serum was diluted 1/5,000 times and used as a 1st Ab source and MIB-BSA (lpg/m l) was used as a solid phase protein conjugate. MIB solution was diluted from 100 jig/ml to 0 .0 0 0 lpg/ml by serially diluting 1/10 times and 10% methanol and 20% methanol was used for the dilution o f MIB solutions.
75
Reproduced with permission of the copyright owner. Further reproduction prohibited without permission.

wells were selected and transferred to 24 well tissue culture plates. Appendix II
depicts the result o f screening after 6 days and 10 days.
Cells from 42 wells transferred to 24 well tissue culture plates were tested
for their ability to be competitively removed from the solid phase in the presence
of 10 pg/mL o f MIB. Any of the wells tested did not show competitive inhibition
by free MIB (Appendix HI). In order to avoid potential loss o f positive cells that
can show inhibition by free MIB, 5 wells were chosen and used for the cloning of
the cells.
Figure 13 is the result of competitive inhibition test o f the cloned cells. All
cloned cells showed binding o f Ab to the MIB-BSA but did not show competitive
inhibition o f binding to the solid phase conjugate by free MIB.
As antibody was made against MIB-LPH, too high an affinity against
MIB-hemisuccinate could restrict inhibition o f binding by free MIB. A different
solid phase conjugate was tested to avoid this effect. Bomeol-BSA was used as a
solid phase protein conjugate o f ELISA and showed no difference from MIB-
BSA. High nonspecific binding was responsible for this result and it was finally
shown that these antibodies were binding to the BSA itself. This may be
nonspecific binding or possibly because the mouse may have been exposed to
BSA during the immunization or during feeding o f food to the mouse.
Mouse 1 was immunized (6x) with the same MIB-LPH conjugate, used for
the fusion with myeloma cells to make a hybridoma cell line that produced anti
MIB antibody. The same procedure was followed as for the fusion o f mouse 2,
except for cell numbers. A total o f 1.2 x 10⁸ splenocytes were fused to 1.1 x 10⁷
76
Reproduced with permission of the copyright owner. Further reproduction prohibited without permission.

a)
<0 CM tf)to .oCO CO 00*0 *0 *0CM CM CM
<sCO*0CM
No MIBMIB,1ppmMIB.10ppm
b)
No MIBMIB,1ppmMIB,10ppm
Figure 13. Cloning o f cells for the production o f Ab that specifically bind to free MIB after fusion o f splenocytes o f mouse 2 (immunized with MIB-LPH) with myeloma cells. Supernatants o f cell culture were diluted 1/15 with 0.05% BSA solution in PBS (pH7.4) and used as primary Ab source and MIB-BSA (lug/m l) was used as a solid phase protein conjugate. Goat anti mouse IgG-peroxidase (1/3000) was used as a secondary Ab. MIB solutions were diluted in 10% methanol solution.
77
Reproduced with permission of the copyright owner. Further reproduction prohibited without permission.
myeloma cells with a 12 to 1 cell ratio (splenocytes vs myeloma). After screening
with 1 mg/L of isobomeol-BSA as a solid phase conjugate, L44 wells were
selected and tested for the competitive inhibition o f binding to the solid phase
conjugate in the presence o f 5 pg/mL of MIB solution. All tested cells showed no
inhibition of binding of Ab to the solid phase conjugate-
4.2.3. Fusion and screening o f mouse 3 that had been immunized with bomeol- LPH
Mouse 3 was immunized four times with bomeol-LPH conjugate. The
fusion of splenocytes o f mouse 3 with myeloma cells gave rise to between 5 and
10 hybridoma per well, for a total o f approximately 400 hybridoma. These
hybridomas actively grew in the presence of aminopterin in HAT medium while
control cells (myeloma) did not. Five days after fusion, screening o f supernatant
revealed that three wells were producing Ab specific for MIB. O f these, cells
from wells dl 1 and f6 retained their ability to make Ab, whereas cells from well
c3 did not produce antibody at the screening 9 days after fusion.
Figure 14 depicts the result o f screening o f cell culture supernatant at 5
days and 9 days after fusion. Cells were subcultured to 24 well tissue culture
plates and tested again for the ability to produce antibodies. Cells were expanded
in 5ml of cell culture media and used for the cloning.
4.2.4. Cloning of anti bomeol monoclonal antibody.
Cells were selected for cloning from positive wells. This was based on
both Ab production and sensitivity in a competitive El, and on cell growth.
Cloning was performed three times from the cells o f d l 1 and f6 . All wells that
Reproduced with permission of the copyright owner. Further reproduction prohibited without permission.

Figure 14. Screening of cells for the production o f antibody after 5 days and 9 days fusion o f splenocytes (mouse 3 immunized with bomeol-LPH) with myeloma cells. Cell culture supernatant was collected (50 pi each) from the 96 wells of the cell culture plate at days 5 and 9 after fusion. MIB-BSA (10 pg/ml) was used as a solid phase protein conjugate. Cell culture supernatant (20 pi each) was used as a source o f 1st Ab. Goat anti-mouse IgG-peroxidase (1/4000) was used as a secondary Ab. ABTS was used as a substrate.
79
Reproduced with permission of the copyright owner. Further reproduction prohibited without permission.
showed cell growth after limiting dilution, were screened for the production o f
anti-bomeol Ab.
Appendix IV is the result o f screening after subculturing o f cells to 24
well plates. Cell culture supernatant (20pl) was used for the ELISA. From this
result five wells (dl lb3. dl lf4, dl lg3, d l lh 8 and f6b4) were chosen based on the
A/Ao values and propagated to 5 mL o f cell culture media. Cells were cloned two
more times to ensure clonality. Appendix V shows the results o f the second
cloning. Cells were again cloned from cell line f6b4g7. Appendix VI depicts
results of the 3rd cloning. Ao values varied from well to well depending on the cell
number and condition.
In competitive ELISA using isobomeoI-BSA (0.3 pg/mL), 10 pg/mL of
MIB was able to reduce A/Ao values for all cells cloned this times. Cell line
f6b4g7b4 was selected and propagated to use as the 1st Ab source in further
experiment. Figure 15 shows the standard curves using dilutions o f cell culture
supernatant o f cell line f6b4g7b4 and two coating concentrations o f isobomeol-
BSA.
4.3. Effect of Ab and solid phase conjugate concentrations on the sensitivity of ELISA
4.3.1. Effect o f Ab concentration on the sensitivity of ELISA
The effect o f Ab concentration was investigated when the solid phase
protein conjugate, MIB-BSA, was used. Optimal dilution of Ab and concentration
of solid phase protein conjugate were determined using checker board ELISA.
Three different concentrations of antibodies and solid phase conjugates that
showed absorbance o f more than 1 were compared in competitive ELISA for their
80
Reproduced with permission of the copyright owner. Further reproduction prohibited without permission.

a).
2.82.4
v 1-2
0.8
0.4
mo
MIB concentration
eCto
b)2.8
2.4
2
1.6
1.2
0.8
0.4
0CD2o
Q .Q .O
Q . AQ.a ..oQ.Q.o
Aa.a.£a.Q.
E EQ . Q.Q» Q-O Q
1/8
1/12
1/16
1/20
MIB concentrator!
Figure 15. Standard curves constructed using cell culture supernatants from three times cloned cell line f6b4g7b4. Cell culture supernatants diluted 1/8, 1/12, 1/16 and 1/20 times were used as a 1st Ab source and two concentrations o f isobomeol- BSA (0.5 {ig/ml and 0.2 pg/ml) were used as solid phase conjugates. Goat antimouse IgG-peroxidase (1/3000) was used as a secondary Ab and ABTS was used as a substrate. MIB solutions were serially diluted from 100 mg/L to 10 ng/L by 1/ 10 times in 10% methanol. Graph a) was coated with 0.5 |xg/ml o f isobomeol- BSA and Graph b) was coated with 0.2 pg/ml o f isobomeol-BSA.
81
Reproduced with permission of the copyright owner. Further reproduction prohibited without permission.

effects on sensitivity (measured as I50) and precision. Figures 16, 17, and 18
depict results relative to Ab concentration effects. Four different concentrations o f
Ab (1/125 times, 1/250 times, 1/500 times, 1/1000 times) were compared at three
different concentrations o f MIB-BSA. When a high concentration o f solid phase
conjugate (MIB-BSA, 1 pg/mL) was used as a coating solution, the sensitivity o f
ELISA (measured as I50) increased almost 20 times when the Ab concentration
was changed from 1/125 to 1/250. The Ao value decreased from 3.536 to 2.218,
still showing a high absorbance. Correlation coefficient values (R2) were 0.997
and 0.993. Low concentrations o f Ab (1/500 and 1/1000) showed high sensitivity,
however the Ao value decreased as did the correlation coefficient.
Figure 17 depicts the effect o f Ab concentration when MIB-BSA was used
at 0.5 pg/mL. The effect of changing Ab concentration was least apparent at this
MIB-BSA concentration. An Ab concentration of 1/250 had the highest
sensitivity and a high Ao value with a high correlation coefficient value. This
graph showed a wide linear range from lng/L to 100 mg/L MIB.
Table 7 summarizes maximum absorbance without MIB (Ao), I50 values
and correlation coefficient values (R2). Depending on the concentrations o f solid
phase conjugate, the effect of Ab concentration on the sensitivity of ELISA varied
from 20 times to 2 times. The effect o f Ab concentration on the sensitivity o f
ELISA was greatest when Ipg/mL MIB-BSA was used for coating; this is
probably because Ab concentration is a limiting factor when there is adequate
solid phase conjugate. By lowering solid phase conjugate concentrations, the
Reproduced with permission of the copyright owner. Further reproduction prohibited without permission.

a)
Ecin
4
3
2
1
0
•1_jca
O) o> o) o>O) 0>e a teoQ)
1/125
1/250
1/500
1/1000
MIB concentration
b)
m5o
1.2
0.8
0.2
oic d> a oi d «- O o T- O
o>
° IMIB concentration
0) 0) 0) E E E ■ < - 0 0 o
1/125
1/250
1/500
1/1000
Figure 16. Test of primary Ab concentrations effect when high concentration (1 ̂ g/ml) o f MIB-BSA was used as coating protein. Cell line, f6b4g7b4 was used as a 1st antibody source. Four different concentrations o f Ab (1/125, 1/250, 1/500 and 1/1000 concentrated by ammonium sulfate precipitation) were used as 1st Ab. Goat anti-mouse IgG-peroxidase conjugate (1/2000) was used as a secondary Ab. MIB was diluted in 10% methanol from 100 mg/L to 0.1 ng/L by serial dilution of 1/10 times. Graph a) is a result showed as a absorbance at 415nm and graph b) is a same result of graph a) expressed as a A/Ao.
83
Reproduced with permission of the copyright owner. Further reproduction prohibited without permission.

a)
EcID
b)
4
3
2
1
0
-1GO o>a>o>cs305as 05
MIB concentration
1.2
0.8
0.6
0.2
- 0.2—i—iGO
0505 05 as 05as 05
1/125
1/250
1/500
1/1000
1/125
1/250
1/500
1/1000
MIB concentration
Figure 17. Test o f primary Ab concentrations effect when medium concentration (0.5|ig/ml) o f MIB-BSA was used as coating protein. Cell line, f6b4g7b4 was used as a 1st antibody source. Four different concentrations o f Ab (1/125, 1/250, 1/500 and 1/1000 concentrated by ammonium sulfate precipitation) were used as 1st Ab. Goat anti-mouse IgG-peroxidase conjugate (1/2000) was used as a secondary Ab. MIB was diluted in 1.0% methanol from 100 mg/L to 0.1 ng/L by serial dilution o f 1/10 times. Graph a) is a result showed as a absorbance at 415nm and graph b) is a same result o f graph a) expressed as a A/Ao.
84
Reproduced with permission of the copyright owner. Further reproduction prohibited without permission.
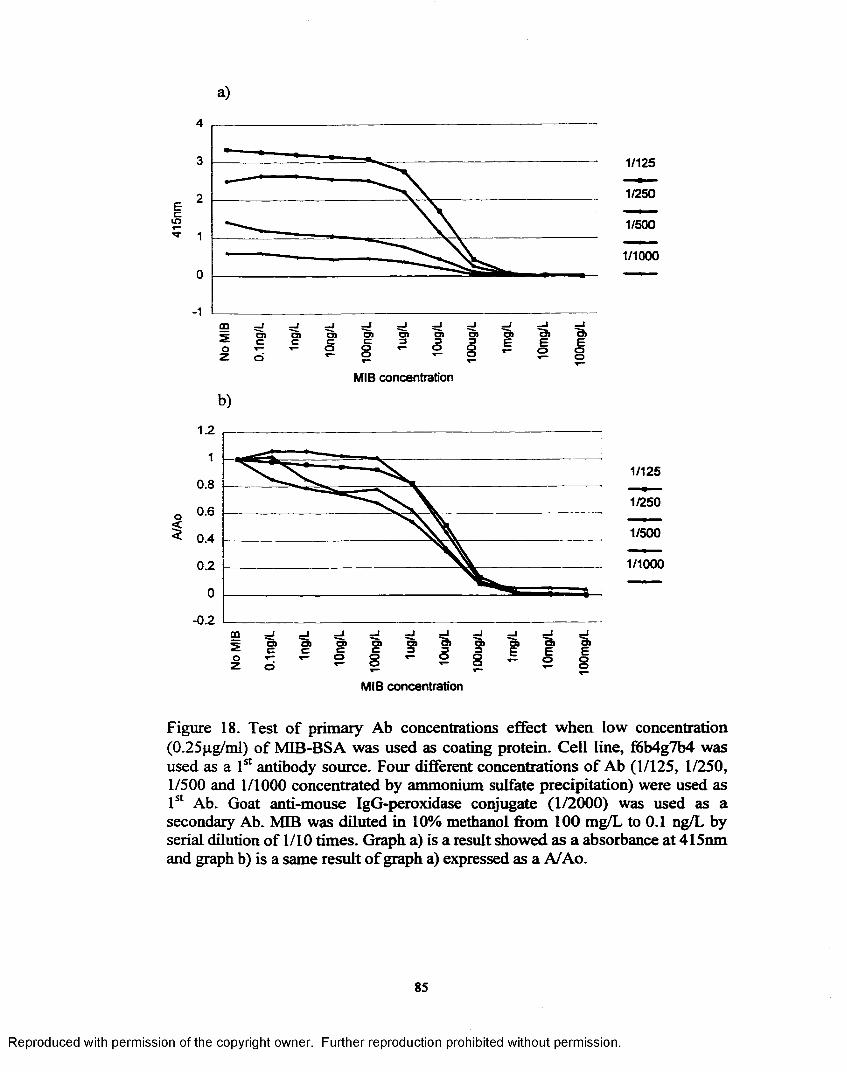
a)
b)
4
3
2cin
1
0
•1_!GQ - j at OlaiO)e
1/125
1/500
1/1000
MIB concentration
1.2
0.8
0.2
- 0.2—iCD
2 O)05 05c o>
1/125
1/250
1/500
1/1000
MIB concentration
Figure 18. Test o f primary Ab concentrations effect when low concentration (0.25pg/ml) o f MIB-BSA was used as coating protein. Cell line, f6b4g7b4 was used as a 1st antibody source. Four different concentrations o f Ab (1/125, 1/250, 1/500 and 1/1000 concentrated by ammonium sulfate precipitation) were used as Ist Ab. Goat anti-mouse IgG-peroxidase conjugate (1/2000) was used as a secondary Ab. MIB was diluted in 10% methanol from 100 mg/L to 0.1 ng/L by serial dilution o f 1/10 times. Graph a) is a result showed as a absorbance at 415nm and graph b) is a same result o f graph a) expressed as a A/Ao.
85
Reproduced with permission of the copyright owner. Further reproduction prohibited without permission.

Table 7. Effects o f Ab concentrations on the sensitivity o f ELISA when MIB- BSA was used as coating protein. These tables are results o f figure 16, 17, and 18 expressed as I50 values. Table a) is the result o f figure 16 and lpg/m l o f MIB- BSA was used as a coating solution. Table b) is the result o f figure 17 and 0.5 pg/ml o f MIB-BSA was used. Table c) is the result o f figure 18 and 0.25 ug/ml o f MIB-BSA was used.
a) solid phase conjugate: MIB-BSA lpg/m lAb concentration ■ A c a r
I 5 0 R -1/125 3.536 1 pg/L 0.9971/250 2.218 0.0426 pg/L 0.9931/500 1.047 0.125 pg/L 0.97
1/1000 0.61 0.0352 pg/L 0.972
b) solid phase conjugate: MIB-BSA 0.5pg/mlAb concentration Aw - ■ hom R2W
1/125 3.436 1 pg/L 0.9811/250 2.345 0.407 pg/L 0.9921/500 1.268 1 pg/L 0.996
1/1000 0.598 1 pg/L 0.988
c) solid phase conjugate: MIB-BSA 0.25pg/mlAb concentration ATar U P p2C9 - -
1/125 3.233 11 pg/L 0.9791/250 2.59 7 pg/L 0.9921/500 1.299 2 pg/L 0.964
1/1000 0.582 2 pg/L 0.962
a: absorbance when plate was saturated with Ab.b: the concentration o f MIB that shows 50% o f inhibition o f Ab binding to solid phase conjugate, c: correlation coefficient value.A, I50 and R were calculated by program soft max pro.
86
Reproduced with permission of the copyright owner. Further reproduction prohibited without permission.
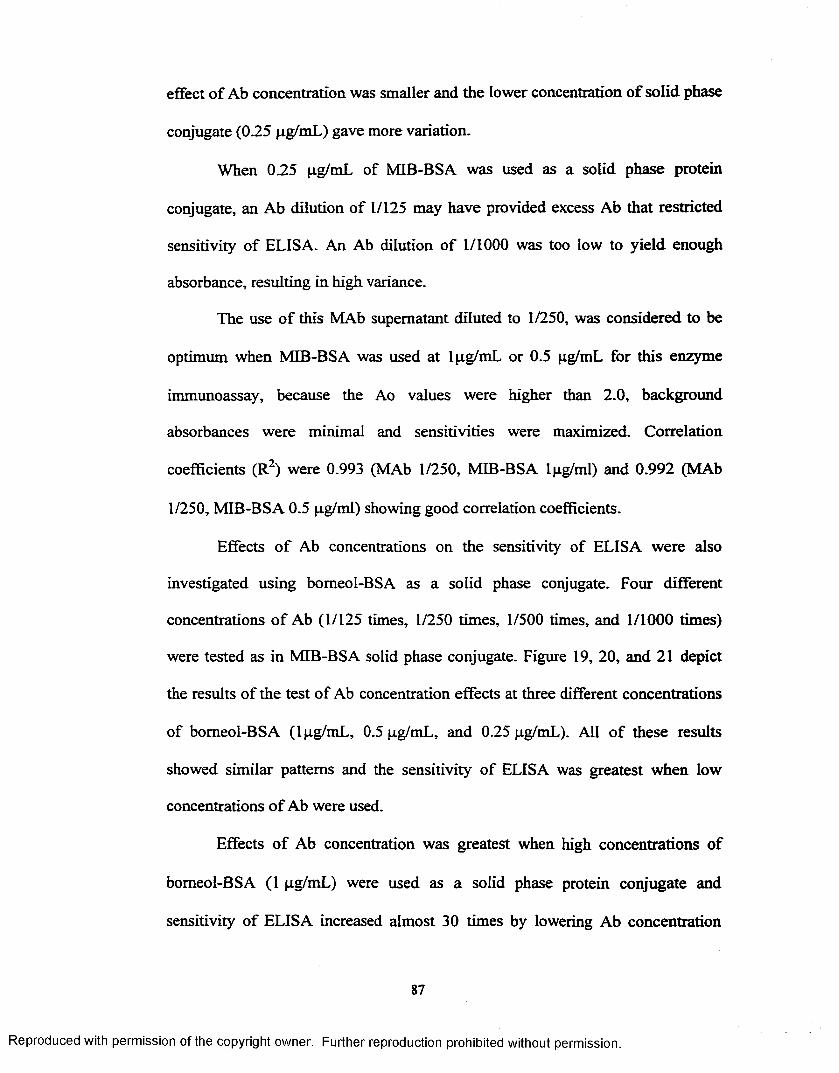
effect o f Ab concentration was smaller and the lower concentration o f solid phase
conjugate (0.25 pg/mL) gave more variation.
When 0.25 pg/mL of MIB-BSA was used as a solid phase protein
conjugate, an Ab dilution o f 1/125 may have provided excess Ab that restricted
sensitivity of ELISA. An Ab dilution o f 1/1000 was too low to yield enough
absorbance, resulting in high variance.
The use o f this MAb supernatant diluted to 1/250, was considered to be
optimum when MIB-BSA was used at 1 pg/mL or 0.5 pg/mL for this enzyme
immunoassay, because the Ao values were higher than 2.0, background
absorbances were minimal and sensitivities were maximized. Correlation
coefficients (R2) were 0.993 (MAb 1/250, MIB-BSA lpg/ml) and 0.992 (MAb
1/250, MIB-BSA 0.5 pg/ml) showing good correlation coefficients.
Effects o f Ab concentrations on the sensitivity of ELISA were also
investigated using bomeol-BSA as a solid phase conjugate. Four different
concentrations o f Ab (1/125 times, 1/250 times, 1/500 times, and 1/1000 times)
were tested as in MIB-BSA solid phase conjugate. Figure 19, 20, and 21 depict
the results of the test of Ab concentration effects at three different concentrations
of bomeol-BSA (lpg/mL, 0.5 pg/mL, and 0.25 pg/mL). All o f these results
showed similar patterns and the sensitivity o f ELISA was greatest when low
concentrations o f Ab were used.
Effects o f Ab concentration was greatest when high concentrations of
bomeol-BSA (I pg/mL) were used as a solid phase protein conjugate and
sensitivity of ELISA increased almost 30 times by lowering Ab concentration
87
Reproduced with permission of the copyright owner. Further reproduction prohibited without permission.

a)
Ecto?
4
3
2
1
0COso
O)co
OJc O) o) d)C C S o o T—o
O) o> 3 35 8
o>E
O)Eo oo
MIB concentration
b)
1.2
1
0.8
< 0.6
0.4
0.2
0CQ2o2
O)co
O) o>coOi O) O)3o
o> 'ftE
o>I
a>Eoo
1/125
1/1000
1/125
1/250
1/500
1/1000
MIB concentration
Figure 19. Test of primary Ab concentrations effect when high concentration (lpg/ml) of bomeol-BSA was used as coating protein. Cell line, f6b4g7b4 was used as a 1st antibody source. Four different concentrations o f Ab (1/125, 1/250, 1/500 and 1/1000 concentrated by ammonium sulfate precipitation) were used as 1st Ab. Goat anti-mouse IgG-peroxidase conjugate (1/2000) was used as a secondary Ab. MIB was diluted in 10% methanol from 100 mg/L to 0.1 ng/L by serial dilution o f 1/10 times. Graph a) is a result showed as a absorbance at 415nm and graph b) is a same result o f graph a) expressed as a A/Ao.
88
Reproduced with permission of the copyright owner. Further reproduction prohibited without permission.
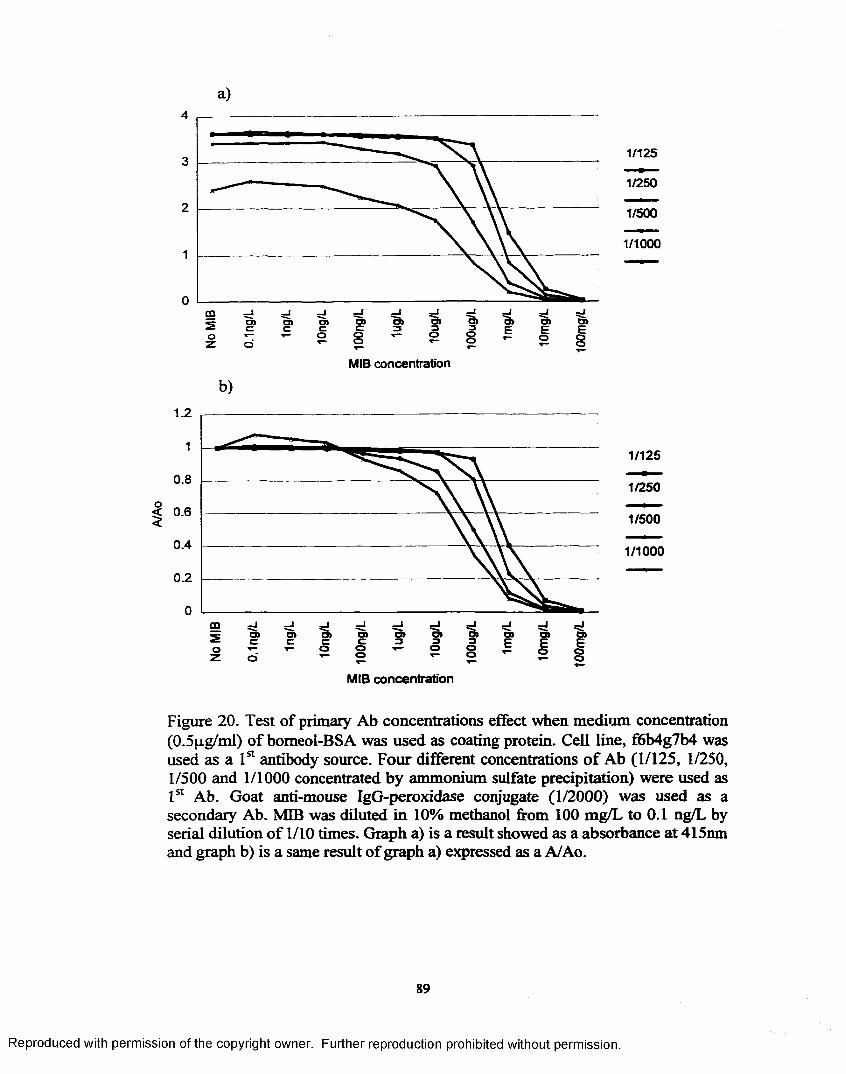
A/A
o
oo £ §MIB concentration
b)1.2
1
0.8
0.6
0.4
0.2
0go2o
o>co'
o> o> O)c c c^ ° §
o>3o oT- O
OJ o>E Eo ioo
1/125
1/250
1/500
1/1000
MIB concentration
Figure 20. Test of primary Ab concentrations effect when medium concentration (0.5{j.g/mi) o f bomeol-BSA was used as coating protein. Cell line, f6b4g7b4 was used as a 1st antibody source. Four different concentrations o f Ab (1/125, 1/250, 1/500 and 1/1000 concentrated by ammonium sulfate precipitation) were used as 1st Ab. Goat anti-mouse IgG-peroxidase conjugate (1/2000) was used as a secondary Ab. MIB was diluted in 10% methanol from 100 mg/L to 0.1 ng/L by serial dilution o f 1/10 times. Graph a) is a result showed as a absorbance at 415nm and graph b) is a same result o f graph a) expressed as a A/Ao.
89
Reproduced with permission of the copyright owner. Further reproduction prohibited without permission.

a)
Ecto
01
4
3
2
1
0
-1m
OJ o>OJOJOJcoo
1/125
1/250
1/500
1/1000
MIB concentration
b)
1.2
1
0.8
0.6
0.4
0.2
0
- 0.2m5o
OJco
OJc OJ "3j o jC C 3
5 § -O) O) O) O)3 3 £ £ E5 8 ^ 1 1
1/125
1/250
1/500
1/1000
MIB concentration
Figure 21. Test o f primary Ab concentrations effect when low concentration (0.25pg/ml) o f bomeol-BSA was used as coating protein. Cell line, f6b4g7b4 was used as a 1st antibody source. Four different concentrations o f Ab (1/125, 1/250, 1/500 and 1/1000 concentrated by ammonium sulfate precipitation) were used as 1st Ab. Goat anti-mouse IgG-peroxidase conjugate (1/2000) was used as a secondary Ab. MIB was diluted in 10% methanol from 100 mg/L to 0.1 ng/L by serial dilution o f 1/10 times. Graph a) is a result showed as a absorbance at 4l5nm and graph b) is a same result o f graph a) expressed as a A/Ao.
90
Reproduced with permission of the copyright owner. Further reproduction prohibited without permission.
Table 8 . Effects o f Ab concentrations on the sensitivity o f ELISA when bomeol- BSA was used as coating protein. These tables are results o f figure 19, 20, and 21 expressed as I50 values. Table a) is the result o f figure 19 and 1 pg/ml o f bomeol- BSA was used as a coating solution. Table b) is the result o f figure 20 and 0.5 pg/ml of bomeol-BSA was used. Table c) is the result o f figure 21 and 0.25pg/ml of bomeol-BSA was used.
a) solid phase conjugate: bomeol-BSA lpg/mlAb concentration A(a) ' ' IsoW R 2CC)
1/125 3.569 914pg/L 0.9981/250 3.488 294pg/L 0.9941/500 3.08 81pg/L 0.989
1/1000 1.89 31pg/L 0.973
b) solid phase conjugate: bomeol-BSA 0.5pg/mlAb concentration A» - - IsoW R2*)" '
1/125 3.582 728pg/L 0.9951/250 3.616 341pg/L 0.9981/500 3.381 99pg/L 0.998
1/1000 2.473 35pg/L 0.984
c) solid phase conjugate: bomeol-BSA 0.25pg/mlAb concentration A® IsoW R2(C)
1/125 3.528 254pg/L 0.9951/250 3.489 72pg/L 0.9941/500 3.298 15pg/L 0.991
1/1000 2.131 25pg/L 0.985
a: absorbance when plate was saturated with Ab.b: the concentration o f MIB that shows 50% of inhibition o f Ab binding to solid phase conjugate.c: R2 is correlation coefficient value.A, I50 and R2 were calculated by program soft max pro.
91
Reproduced with permission of the copyright owner. Further reproduction prohibited without permission.

from a dilution o f 1/125 to 1/1000. The effect of Ab concentration was least when
low concentrations o f bomeol-BSA (0.25 pg/mL) were used as a solid phase
protein conjugate and sensitivity o f ELISA increased by almost 10 times by
lowering Ab concentration from 1/125 to 1/1000. I50 values, however, for Ab
dilutions of l / l 000 were similar in all three tests using three different solid phase
conjugate concentrations. This is probably because Ab concentration became a
critical factor determining sensitivity of ELISA at low concentrations o f solid
phase protein conjugate (i.e. solid phase protein was limiting). When a high
concentration of solid phase protein conjugate was used as a coating protein, solid
phase conjugate also influenced the sensitivity of ELISA, decreasing sensitivity to
a great extent at a high concentration o f Ab.
When bomeol-BSA was used as a solid phase protein conjugate, the
ELISA was 10 to 1000 times less sensitive (measured as an increase in Iso),
depending on the concentrations of Ab and solid phase protein conjugate,
compared with MIB-BSA- Most ELISA (using bomeol-BSA as coating protein)
results showed detection limit s of ppb (parts per billion, ng/mL) when low
concentration o f Ab (1/1000 times) was used to obtain a maximum sensitivity.
4.3.2. Effect of solid phase conjugate concentrations on the sensitivity o f ELISA
Solid phase conjugate concentrations effect on the sensitivity o f ELISA
was investigated at three different concentrations o f 1stAb. Four different
concentrations of solid phase conjugates (MIB-BSA 1 pg/mL, 0.5 pg/mL, 0.25
pg/mL and 0.125 pg/mL) were compared using Ab dilutions o f 1/125, 1/250 and
Reproduced with permission of the copyright owner. Further reproduction prohibited without permission.
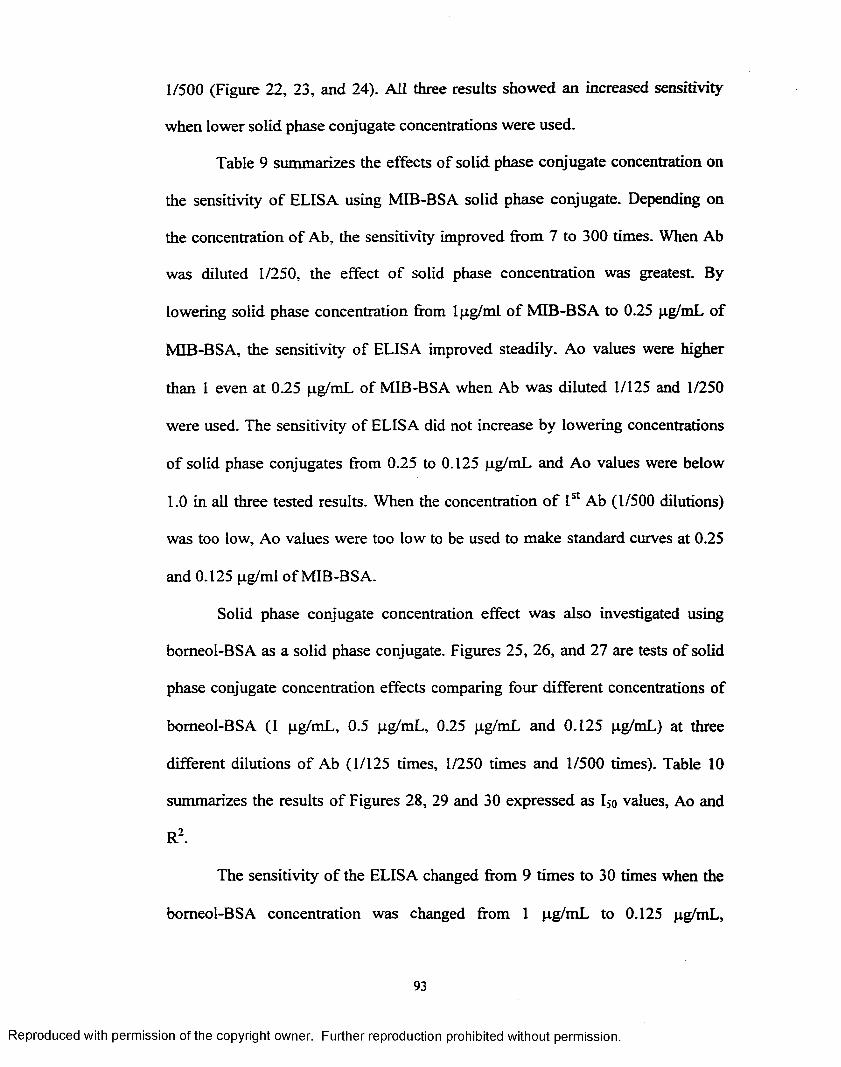
1/500 (Figure 22, 23, and 24). All three results showed an increased sensitivity
when lower solid phase conjugate concentrations were used.
Table 9 summarizes the effects of solid phase conjugate concentration on
the sensitivity o f ELISA using MIB-BSA solid phase conjugate. Depending on
the concentration o f Ab, the sensitivity improved from 7 to 300 times. When Ab
was diluted 1/250, the effect o f solid phase concentration was greatest. By
lowering solid phase concentration from lpg/ml o f MIB-BSA to 0.25 pg/mL of
MIB-BSA, the sensitivity o f ELISA improved steadily. Ao values were higher
than I even at 0.25 pg/mL of MIB-BSA when Ab was diluted 1/125 and 1/250
were used. The sensitivity of ELISA did not increase by lowering concentrations
of solid phase conjugates from 0.25 to 0.125 pg/mL and Ao values were below
1.0 in all three tested results. When the concentration o f 1st Ab (1/500 dilutions)
was too low, Ao values were too low to be used to make standard curves at 0.25
and 0.125 pg/ml of MIB-BSA.
Solid phase conjugate concentration effect was also investigated using
bomeol-BSA as a solid phase conjugate. Figures 25, 26, and 27 are tests of solid
phase conjugate concentration effects comparing four different concentrations of
bomeol-BSA (1 pg/mL, 0.5 pg/mL, 0.25 pg/mL and 0.125 pg/mL) at three
different dilutions o f Ab (1/125 times, 1/250 times and 1/500 times). Table 10
summarizes the results o f Figures 28, 29 and 30 expressed as I50 values, Ao and
R2.
The sensitivity of the ELISA changed from 9 times to 30 times when the
bomeol-BSA concentration was changed from 1 pg/mL to 0.125 pg/mL,
93
Reproduced with permission of the copyright owner. Further reproduction prohibited without permission.

a)
Ecm
b)
4
3
2
1
0
■1CD CJJco
Olo>o>c
0.5ug/ml
0.25ug/ml
0.125ug/ml
MIB concentration
1.5
01
-0.503 e»o> O) oi O)
1ug/ml
0.5ug/ml
0.25ug/ml
0.125ug/ml
MIB concentration
Figure 22. Test o f solid phase protein conjugate (MIB-BSA) concentrations effect when high concentration o f Ab (F6b4g7b4, 1/125 times) was used as a 1st Ab. Four different concentrations of solid phase protein conjugates (MIB-BSA, lpg/ml, 0.5pg/ml, 0.25pg/ml and 0.125pg/ml) were coated on the microtiter plate and compared. Goat anti-mouse IgG-peroxidase (1/2000) was used as a secondary antibody and MIB was diluted in 10% methanol from lOOmg/L to O.lng/L by serial dilution o f 1/10 times. Graph a) is a result showed as a absorbance at 415nm and graph b) is a same result o f graph a) expressed as a A/Ao.
94
Reproduced with permission of the copyright owner. Further reproduction prohibited without permission.

a)
3.5
2.5
Ec
0.5
-0.5—iCQ o>O) Ui Oi O)O) O)O)5
b)
1ug/ml
0.5ug/ml
0.25ug/ml
0.125ug/ml
MIB concentration
1.2
0.8
0.2
- 0.2—im o> Ol
1ug/ml
0.5ug/ml
0.25ug/ml
0.125ug/ml
MIB concentration
Figure 23. Test o f solid phase protein conjugate (MIB-BSA) concentrations effect when medium concentration o f Ab (F6b4g7b4, 1/250 times) was used as a 1st Ab. Four different concentrations o f solid phase protein conjugates (MIB-BSA, lpg/ml, 0.5pg/ml, 0.25pg/ml and 0.125pg/ml) were coated on the microtiter plate and compared. Goat anti-mouse IgG-peroxidase (1/2000) was used as a secondary antibody and MIB was diluted in 10% methanol from lOOmg/L to O.lng/L by serial dilution o f 1/10 times. Graph a) is a result showed as a absorbance at 415nm and graph b) is a same result o f graph a) expressed as a A/Ao.
95
Reproduced with permission of the copyright owner. Further reproduction prohibited without permission.
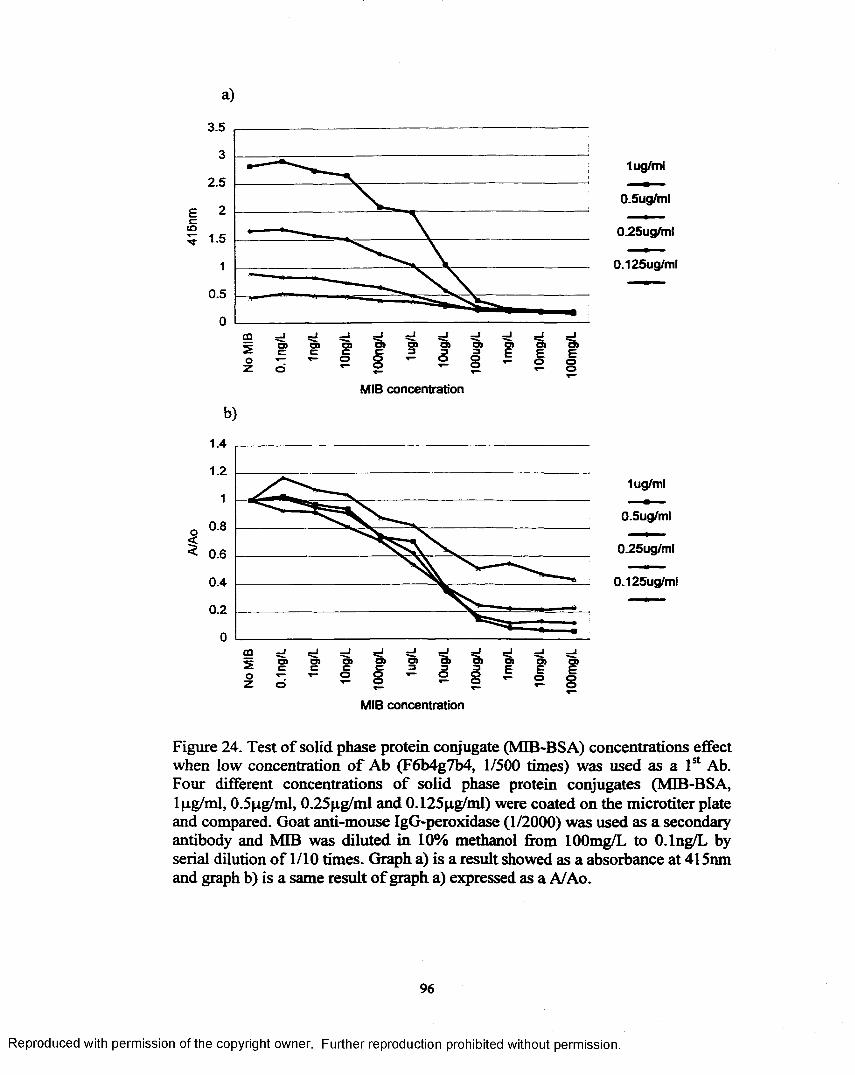
MIB concentration
o<
b)
1.4
1.2
1
0.6
0.4
0.2
0go2o
9 9e 9Co
9
Oo9 9OJ3 "3>E
lug/ml
0.5ug/ml
0.25ug/ml
0.125ug/ml
MIB concentration
Figure 24. Test o f solid phase protein conjugate (MIB-BSA) concentrations effect when low concentration o f Ab (F6b4g7b4, 1/500 times) was used as a 1st Ab. Four different concentrations o f solid phase protein conjugates (MIB-BSA, lpg/ml, 0.5pg/ml, 0.25pg/ml and 0.125pg/ml) were coated on the microtiter plate and compared. Goat anti-mouse IgG-peroxidase (1/2000) was used as a secondary antibody and MIB was diluted in 10% methanol from lOOmg/L to O.lng/L by serial dilution o f 1/10 times. Graph a) is a result showed as a absorbance at 415nm and graph b) is a same result o f graph a) expressed as a A/Ao.
96
Reproduced with permission of the copyright owner. Further reproduction prohibited without permission.
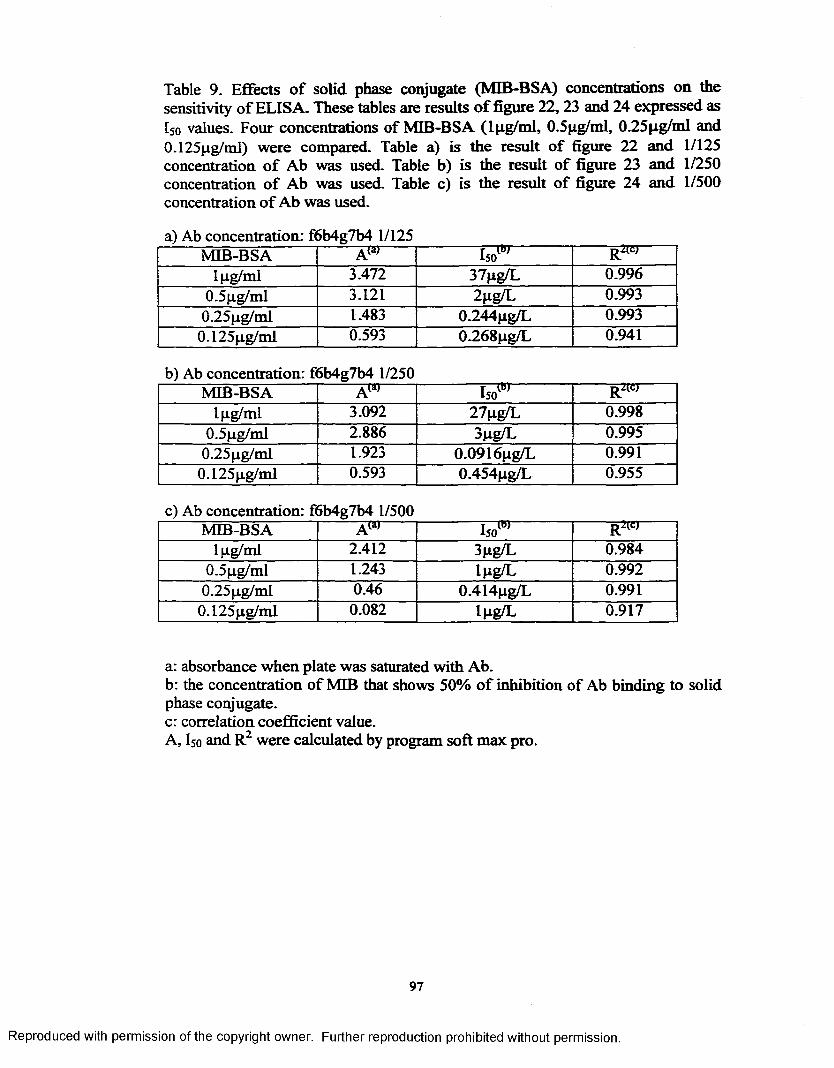
Table 9. Effects o f solid phase conjugate (MIB-BSA) concentrations on the sensitivity o f ELISA. These tables are results o f figure 22,23 and 24 expressed as Iso values. Four concentrations of MIB-BSA (lpg/m l, 0.5pg/ml, 0.25pg/ml and 0.125pg/ml) were compared. Table a) is the result o f figure 22 and 1/125 concentration o f Ab was used. Table b) is the result o f figure 23 and 1/250 concentration o f Ab was used. Table c) is the result o f figure 24 and 1/500 concentration o f Ab was used.
a) Ab concentration: f6b4g7b4 1/l25MIB-BSA A<a> U F ...............
RiW
lpg/ml 3.472 37pg/L 0.9960.5pg/ml 3.121 2pg/L 0.993
0.25pg/ml 1.483 0.244pg/L 0.9930.125pg/ml 0.593 0.268pg/L 0.941
b) Ab concentration: f6b4g7b4 1/250MIB-BSA - Aw Iso00 R 2(C,
lpg/ml 3.092 27pg/L 0.9980.5pg/ml 2.886 3pg/L 0.995
0.25pg/ml 1.923 0.0916pg/L 0.9910.125pg/ml 0.593 0.454pg/L 0.955
c) Ab concentration: f6b4g7b4 1/500MIB-BSA - - AGn- Uom Rm
lpg/ml 2.412 3pg/L 0.9840.5pg/ml 1.243 lpg/L 0.9920.25pg/ml 0.46 0.414pg/L 0.991
0.125pg/ml 0.082 lpg/L 0.917
a: absorbance when plate was saturated with Ab.b: the concentration o f MIB that shows 50% o f inhibition of Ab binding to solid phase conjugate, c: correlation coefficient value.A, I5o and R2 were calculated by program soft max pro.
97
Reproduced with permission of the copyright owner. Further reproduction prohibited without permission.

depending on Ab concentration. Solid phase conjugate concentration effect was
highest at high concentrations o f Ab (1/125 dilutions) and was lowest at low
concentrations o f Ab (1/500 dilution). This is probably because high
concentrations o f Ab provide enough chance to bind to extra solid phase
conjugate and low concentration o f Ab can also be a limiting factor in Ab binding
for solid phase conjugate binding.
There seems to be greater propensity to increase the sensitivity o f ELISA
by lowering solid phase conjugate concentrations because Ao values o f ELISA
3.406, when 0.125 pg/ml of bomeol-BSA, and Ab dilutions of 1/125 were used.
With bomeol-BSA as coating, it was found that the sensitivity o f ELISA did not
increase by lowering solid phase conjugate concentrations from 0.25pg/ml to
0.125pg/ml showing the same Iso values, 17pg/ml, when MAb was diluted by
1/500. Correlation coefficient values decreased from 0.993 to 0.932. These results
show that there is a limit in increasing the sensitivity o f ELISA by lowering Ab
concentrations and solid phase conjugate concentrations.
4.4. Effect of solid phase conjugate protein structure on the sensitivity of ELISA
Since the assay depends on the competition o f the antibody binding to
either the immobilized conjugate or the soluble MIB from the sample being
tested, sensitivity will be greatest if the antibody affinity for the soluble MIB is
enhanced relative to the immobilized conjugate.
The nature of hapten linkage to carrier protein is critical to the specificity
and sensitivity o f the immunoassay. Immunogens prepared by haptenation o f
protein often generate antibodies against the linkage. Three types of heterologies
98
Reproduced with permission of the copyright owner. Further reproduction prohibited without permission.
a)
Eeto
4
3
2
1
0mSo
cn o>c c1- o 8o>3O
o>3 O) o) '3)E E E- ? 8
MIB concentration
b)
1.2
1
0.8
0.6
0.4
0.2
0CQ - J2 go2 O
05 05c cT- o05c 05 05
3053
05 05 05E E E- £ 8
1ug/ml
0.5ug/ml
0.25ug/ml
0.125ug/ml
1ug/ml
0.5ug/ml
0.25ug/ml
0.125ug/ml
MIB concentration
Figure 25. Test o f solid phase protein conjugate (bomeol-BSA) concentrations effect when high concentrations o f Ab (F6b4g7b4, 1/125 times) was used as a 1st Ab. Four different concentrations o f solid phase protein conjugates (bomeol- BSA, lpg/ml, 0.5pg/ml, 0.25pg/ml and 0.125pg/ml) were coated on the microtiter plate and compared. Goat anti-mouse IgG-peroxidase (1/2000) was used as a secondary antibody and MIB was diluted in 10% methanol from lOOmg/L to O.lng/L by serial dilution o f 1/10 times. Graph a) is a result showed as a absorbance at 415nm and graph b) is a same result o f graph a) expressed as a A/Ao.
99
Reproduced with permission of the copyright owner. Further reproduction prohibited without permission.

a)
Ecto5
4
3
2
1
0
•1_jGO
OJ OJOJOJe O) OJ3oOJ
MIB concentration
b)
1.5
0.5
-0.5_iCQ o>co>c o>o>c o>
3oS
1ug/ml
0.5ug/ml
0.25ug/ml
0.125ug/ml
1ug/ml
0.5ug/ml
0.25ug/ml
0.125ug/ml
MIB concentration
Figure 26. Test o f solid phase protein conjugate (bomeol-BSA) concentrations effect when medium concentrations o f Ab (F6b4g7b4, 1/250 times) was used as a 1st Ab. Four different concentrations o f solid phase protein conjugates (bomeol- BSA, lpg/ml, 0.5pg/ml, 0.25pg/ml and 0.125pg/ml) were coated on the microtiter plate and compared. Goat anti-mouse IgG-peroxidase (1/2000) was used as a secondary antibody and MIB was diluted in 10% methanol from lOOmg/L to O.lng/L by serial dilution o f 1/10 times. Graph a) is a result showed as a absorbance at 415nm and graph b) is a same result o f graph a) expressed as a A/Ao.
100
Reproduced with permission of the copyright owner. Further reproduction prohibited without permission.
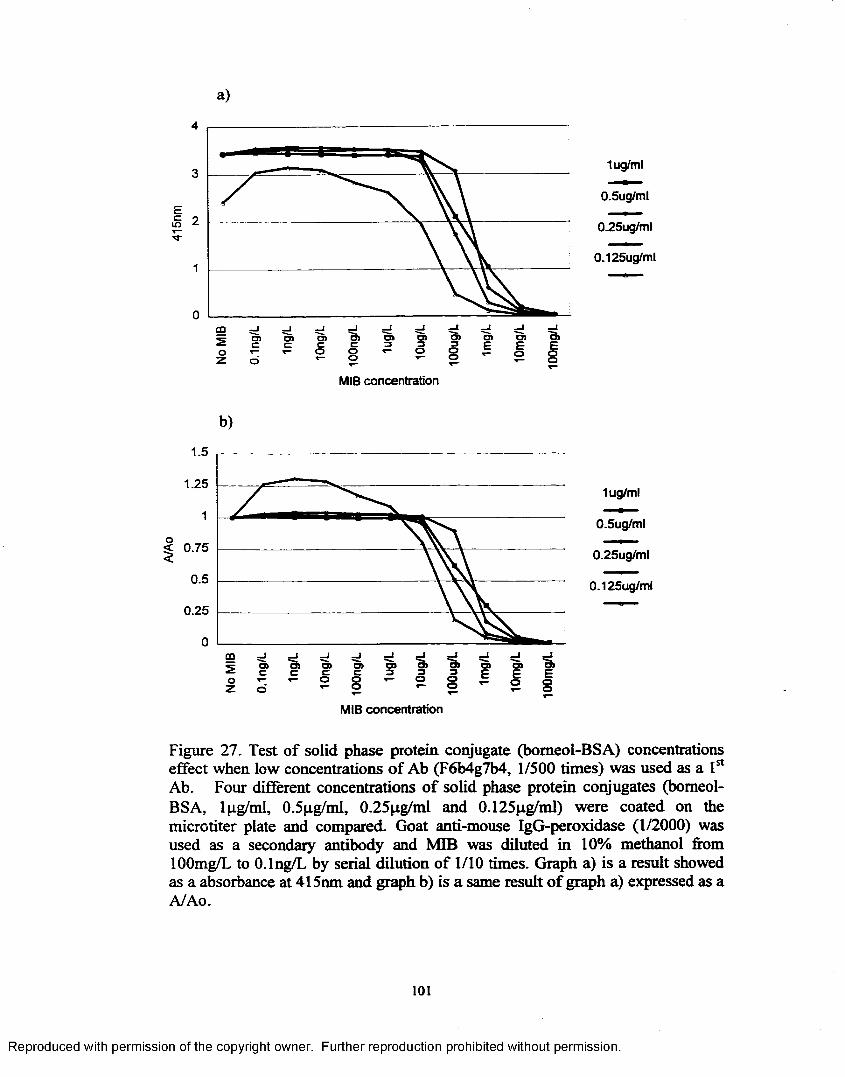
MIB concentration
b)
1.5
1.25
$ 0.75
0.5
0.25
—i—j _im o> OJOJ OJc OJ OJ
o
1ug/ml
0.5ug/ml
0.25ug/ml
0.125ug/ml
MIB concentration
Figure 27. Test o f solid phase protein conjugate (bomeol-BSA) concentrations effect when low concentrations of Ab (F6b4g7b4, 1/500 times) was used as a 1st Ab. Four different concentrations o f solid phase protein conjugates (bomeol- BSA, lpg/ml, 0.5pg/ml, 0.25pg/ml and 0.125pg/ml) were coated on the microtiter plate and compared. Goat anti-mouse IgG-peroxidase (1/2000) was used as a secondary antibody and MIB was diluted in 10% methanol from lOOmg/L to O.lng/L by serial dilution o f 1/10 times. Graph a) is a result showed as a absorbance at 415nm and graph b) is a same result o f graph a) expressed as a A/Ao.
101
Reproduced with permission of the copyright owner. Further reproduction prohibited without permission.
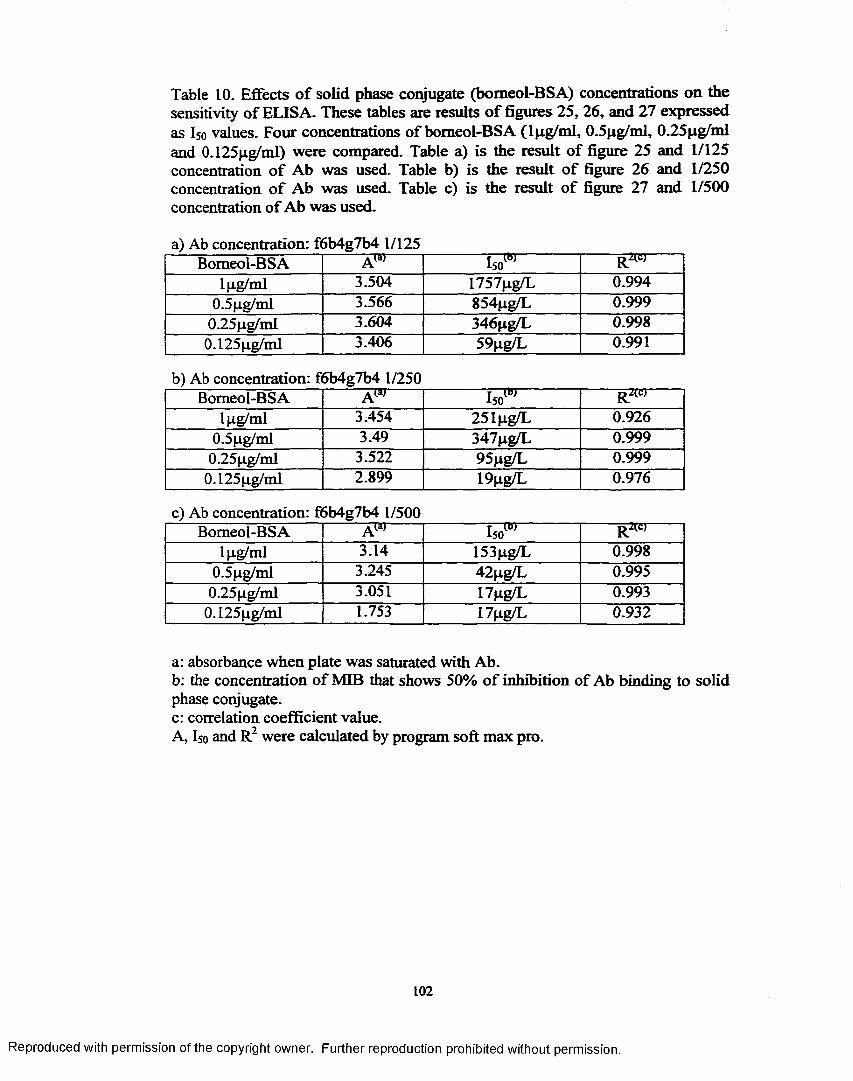
Table 10. Effects o f solid phase conjugate (bomeol-BSA) concentrations on the sensitivity o f ELISA. These tables are results o f figures 25,26, and 27 expressed as I50 values. Four concentrations o f bomeol-BSA (lpg/m l, 0.5pg/ml, 0.25pg/ml and 0.125pg/ml) were compared. Table a) is the result o f figure 25 and 1/125 concentration o f Ab was used. Table b) is the result o f figure 26 and 1/250 concentration o f Ab was used. Table c) is the result o f figure 27 and 1/500 concentration o f Ab was used.
a) Ab concentration: f6b4g7b4 1/125Bomeol-BSA 'A® I 5 0 ”
lpg/ml 3.504 1757pg/L 0.9940.5pg/ml 3.566 854pg/L 0.999
0.25pg/ml 3.604 346pg/L 0.9980.125pg/ml 3.406 59pg/L 0.991
b) Ab concentration: f6b4g7b4 1/250Bomeol-BSA A» IsoW " - - r2 W
lpg/ml 3.454 25 lpg/L 0.9260.5pg/ml 3.49 347pg/L 0.999
0.25pg/ml 3.522 95pg/L 0.9990.l25pg/ml 2.899 19pg/L 0.976
c) Ab concentration: f6b4g7b4 1/500Bomeol-BSA 'A ® Uow '
- r2 (C)
lpg/ml 3.14 153pg/L 0.9980.5pg/ml 3.245 42pg/L 0.995
0.25pg/ml 3.051 17pg/L 0.9930.125pg/ml 1.753 17pg/L 0.932
a: absorbance when plate was saturated with Ab.b: the concentration o f MIB that shows 50% o f inhibition of Ab binding to solid phase conjugate, c: correlation coefficient value.A, I 5 0 and R2 were calculated by program soft max pro.
102
Reproduced with permission of the copyright owner. Further reproduction prohibited without permission.

can be used to improve detectability. Hapten heterology can be introduced by
attaching different but related haptens through the same site by the same linkage.
Bridge heterology can be introduced using different linkers for coupling the
haptens to carrier protein and solid phase conjugate. Site heterology can be
introduced by attaching the same linking group to different sites o f the hapten. It
is critical to use at least one o f these three methods to improve sensitivity o f
ELISA (Deshpande, 1996). Vallejo et al.(1982) found by using two different
linking arms sensitivity o f an assay for parathion was improved.
In this study, there was not a large difference in the titer o f antibodies
when high concentrations o f solid phase conjugates (Ipg/mL) was used as coating
solution and antibodies were serially diluted from 1/125 to 1/64,000 by I in 2
times (Figure 28). This is because solid phase conjugates were not a limiting
factor in antibodies binding to solid phase conjugates.
The affinities o f solid phase conjugates to antibodies were compared in
which high concentrations of antibodies (1/125) and serially diluted solid phase
conjugates (Figure 29) were used for the test. When high concentrations of solid
phase conjugates concentrations (5 and 1 pg/mL) were used, plates were saturated
with antibodies showing maximum absorbance. However, solid phase conjugates
became a limiting factor in binding of antibodies to solid phase conjugates at low
concentrations o f solid phase conjugates concentrations (0.2 and 0.04 pg/mL) and
showed large differences in affinity o f solid phase conjugates to antibodies.
Bomeol-BSA showed the highest affinity to the antibodies and MIB-BSA
showed the lowest affinity to the antibodies. This is reasonable because antibodies
103
Reproduced with permission of the copyright owner. Further reproduction prohibited without permission.
were made using bomeol-LPH as an immunogen. The difference between the
isomers, bomeol and isobomeol, is the position o f hydroxyl: axial vs.equitorial.
As linking arms (hemisuccinate) are bound through these hydroxyl groups,
different position o f the same linking arm showed difference in affinity o f
antibodies and these difference in affinity provide position heterology effects in
competitive ELISA. The difference between isobomeol and 2-methylsiobomeoI
(MIB) was the presence of another methyl group in MIB. The presence o f another
methyl group resulted in a decrease in affinity o f MIB-BSA to the anti-bomeol
monoclonal antibody.
The effects o f these solid phase protein conjugates on the sensitivity o f
ELISA were investigated using three different combinations of antibodies and
solid phase protein conjugates. Figure 30 and figure 31 depict results o f the
comparison between these three solid phase conjugates and table 11 summarized
Iso values.
MIB-BSA provided approximately 550 times better sensitivity compared
to bomeol-BSA when MAb were diluted 1/125 and 1 pg/ml o f solid phase
conjugate were used. Depending on the concentrations of antibodies and solid
phase conjugates, the solid phase conjugate structure changed I50 values from 10
times to 550 times. All three tests showed maximum sensitivity when MIB-BSA
was used as the solid phase conjugate and minimum sensitivity when bomeol-
BSA was used as a solid phase conjugate.
These tests showed the same results with the tests o f solid phase conjugate
affinities to antibodies (Figure 29). This is mainly because o f the differences in
104
Reproduced with permission of the copyright owner. Further reproduction prohibited without permission.
the affinity of antibodies against solid phase conjugates. These results indicate
that sensitivity o f ELISA can be improved by lowering the relative affinity of the
Ab to the solid phase material, because the sensitivity o f ELISA is determined by
the competition o f free MIB against MIB, bomeol, or isobomeol bound to solid
phase conjugates.
4.5. Specificity of antibody
The specificity o f MAb was determined by comparing the cross reactivity
of several compounds that have similar structures to MIB. Table 12 summarizes
the results of the cross reactivity studies. MIB had a cross reactivity of 100% by
definition and showed the highest cross reactivity.
These MAb were made using bomeol-LPH immunogen. It was therefore
expected that bomeol will show higher cross-reactivity compared to MIB.
However, bomeol showed only 19.9% cross reactivity compared to MIB, which is
probably because the presence of the methyl group in MIB increased affinity
against antibody. The methyl group in MIB is in the same position as the
hemisuccinyl o f bomeol-LPH.
Bomeol and isobomeol showed similar low cross reactivities (19.9% and
19.6%). These results indicate that the position o f the hydroxyl group in those
compounds did not influence the binding of antibody.
The difference between camphor and bomeol is the presence of a ketone
group in camphor instead o f a hydroxyl group in bomeol. Camphor has very low
cross reactivity showing approximately 4%. This low cross reactivity may be
attributed to the presence o f a double bond o f ketone group in camphor. The
105
Reproduced with permission of the copyright owner. Further reproduction prohibited without permission.
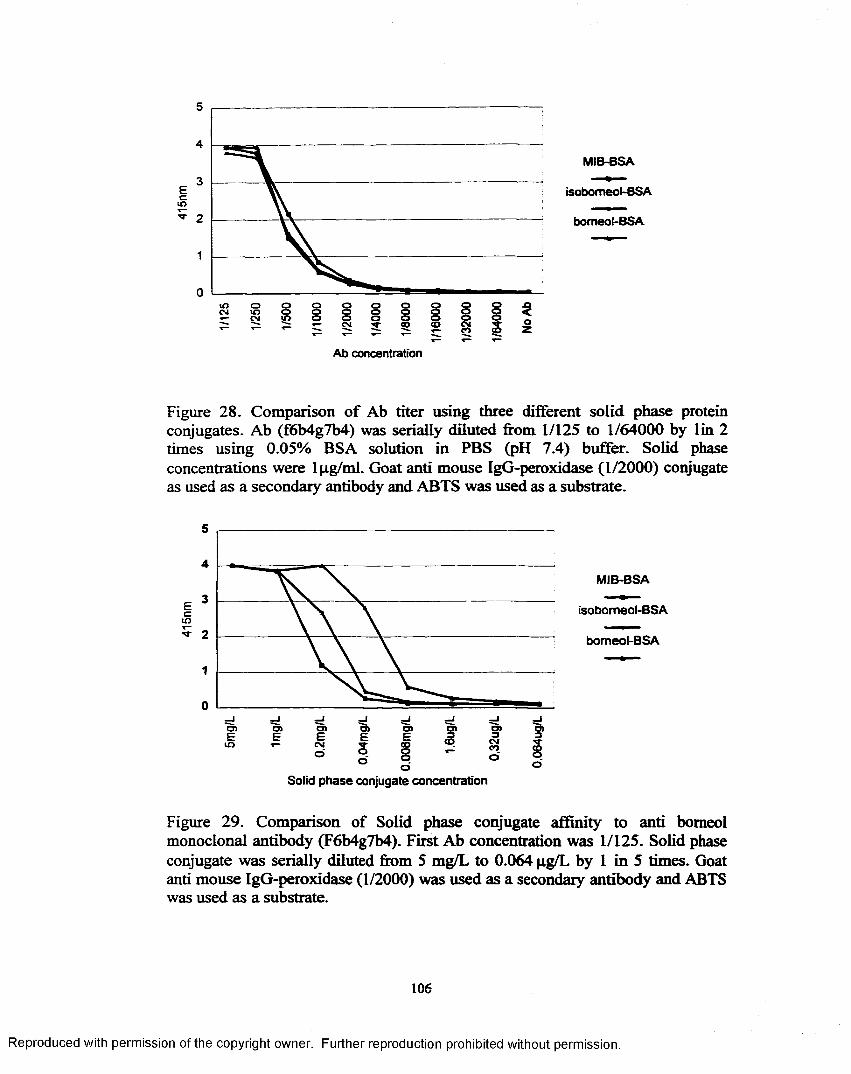
5
4
1
0oo o o
§ sCNL r r
ooo00 CMCO
MIB-BSA
isobomeol-BSA
bomeol-BSA
Ab concentration
Figure 28. Comparison o f Ab titer using three different solid phase protein conjugates. Ab (f6b4g7b4) was serially diluted from 1/125 to 1/64000 by lin 2 times using 0.05% BSA solution in PBS (pH 7.4) buffer. Solid phase concentrations were lpg/ml. Goat anti mouse IgG-peroxidase (1/2000) conjugate as used as a secondary antibody and ABTS was used as a substrate.
Ecin•"T
5
4
3
2
1
0
MIB-BSA
isobomeol-BSA
bomeol-BSA
O J ”o ) 0 1 O J O JE E E E Ein CM
O 3O
GO
8O
o>Z3<o 3
CMCOO
O)3
Solid phase conjugate concentration
Figure 29. Comparison of Solid phase conjugate affinity to anti bomeol monoclonal antibody (F6b4g7b4). First Ab concentration was 1/125. Solid phase conjugate was serially diluted from 5 mg/L to 0.064 pg/L by 1 in 5 times. Goat anti mouse IgG-peroxidase (1/2000) was used as a secondary antibody and ABTS was used as a substrate.
106
Reproduced with permission of the copyright owner. Further reproduction prohibited without permission.
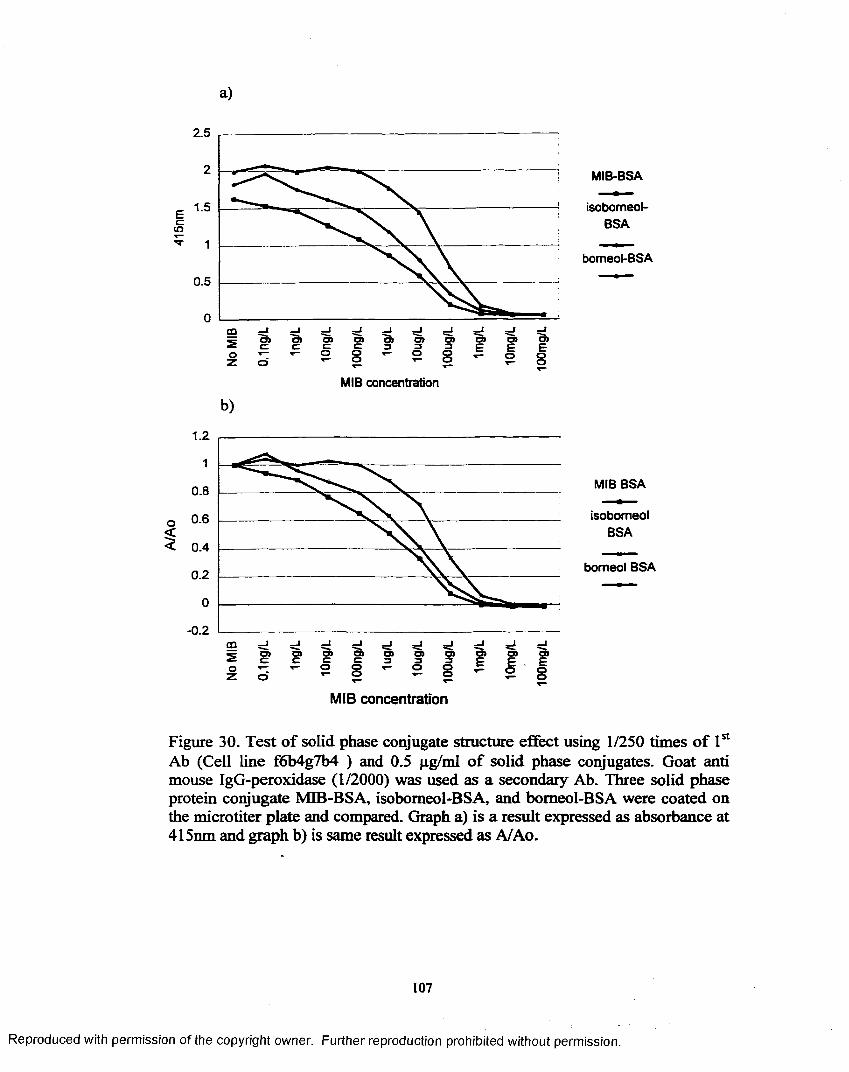
a)
01
CD2O
2.5
1.5Eein
0.5
CD o> o>o»c O)O)c o>o>
MIB concentration
b)
1.2
1
0.8
0.6
0.4
0.2
0
- 0.2
o>c o>coen O)3 O) O)3 o>
Eo>E
° I * 2 8MIB concentration
MIB-BSA
isobomeol-BSA
bomeol-BSA
MIB BSA
isobomeolBSA
bomeol BSA
Figure 30. Test o f solid phase conjugate structure effect using 1/250 times o f 1st Ab (Cell line f6b4g7b4 ) and 0.5 pg/ml o f solid phase conjugates. Goat anti mouse IgG-peroxidase (1/2000) was used as a secondary Ab. Three solid phase protein conjugate MIB-BSA, isobomeol-BSA, and bomeol-BSA were coated on the microtiter plate and compared. Graph a) is a result expressed as absorbance at 415nm and graph b) is same result expressed as A/Ao.
107
Reproduced with permission of the copyright owner. Further reproduction prohibited without permission.

MIB concentration
01
eg5o
b)1.2
1
0.8
0.6
0.4
0.2
0
- 0.2
O ) CD O ) O )c _ _ _O) O) O)c c c _ _ _ _s - 2 § S 8
o> *05 "5 i
- I 8
MIB-BSA
isobomeol-BSA
bomeol-BSA
MIB concentration
Figure 31. Test of solid phase conjugate structure effect using 1/125 times of 1st Ab ( Cell line f6b4g7b4 ) and 1 pg/ml of solid phase conjugates. Goat anti mouse IgG-peroxidase (1/2000) was used as a secondary Ab. Three solid phase protein conjugate MIB-BSA, isobomeol-BSA, and bomeol-BSA were coated on the microtiter plate. Graph a) is a result expressed as absorbance at 415nm and graph b) is same result expressed as A/Ao.
108
Reproduced with permission of the copyright owner. Further reproduction prohibited without permission.
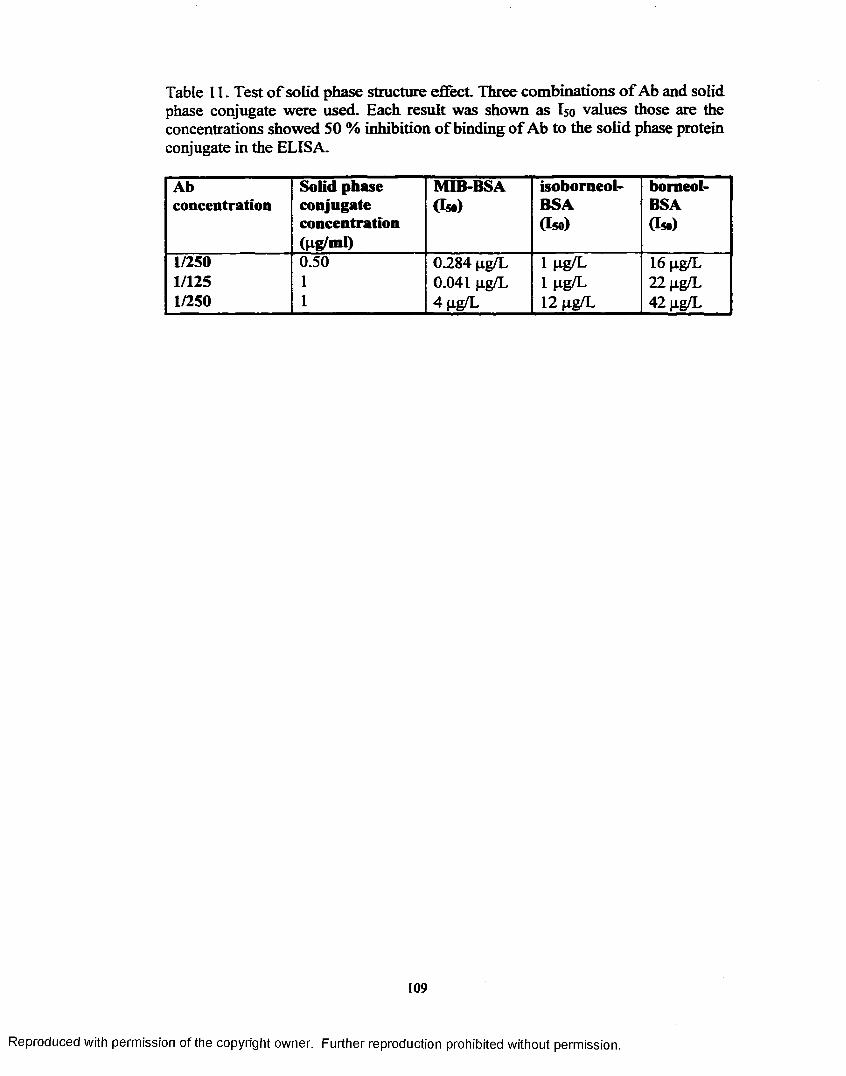
Table 11. Test o f solid phase structure effect. Three combinations o f Ab and solid phase conjugate were used. Each result was shown as Iso values those are the concentrations showed 50 % inhibition o f binding o f Ab to the solid phase protein conjugate in the ELISA.
Abconcentration
Solid phase conjugate concentration (pg/ml)
MIB-BSA(Iso)
isoborneol-BSA(Iso)
borneol-BSA(Iso)
1/250 0.50 0.284 pg/L 1 pg/L 16 pg/L1/125 1 0.041 pg/L 1 pg/L 22 pg/L1/250 1 4 pg/L 12 pg/L 42 pg/L
109
Reproduced with permission of the copyright owner. Further reproduction prohibited without permission.

presence o f a double bond would influence in the bond angles and lengths in the
ring structure and this may be responsible for the decrease in the affinity of
antibody recognition. This result may also explain why the polyclonal antibody
produced by Chung et al. (1990) showed low affinity against MIB and showed
low sensitivity in the ELISA. They produced polyclonal antibody by immunizing
with camphor-BSA immunogen.
Camphorquinone has an additional carbonyl group as compared to
camphor and showed some cross-reactivity with the antibody and a decrease in
cross-reactivity comparing to camphor. All o f these results indicated that antibody
was most specific to MIB and recognized the presence o f the methyl group.
2-Methyleneborane and 2-methyl-2-borene are dehydration products o f 2-
methylisobomeol and do not cause off-flavor (Korth et al., 1992). Martin et al.
(1988) isolated these two compounds from chronically off-flavored catfish flesh.
The cross reactivity o f these two dehydration products was not investigated in this
research. Further studies will be needed to determine whether their presence could
potentially yield false positives.
4.6. S tandard curve
From previous results o f antibody concentration effects, solid phase
conjugate concentration effects and solid phase conjugate structure effects,
optimum concentrations of antibodies and solid phase conjugate were determined
that would show maximum sensitivity o f ELISA.
A standard curve was constructed using anti-bomeol monoclonal antibody
diluted 1/250 times and 0.5 pg/mL o f MIB-BSA as a solid phase conjugate
n o
Reproduced with permission of the copyright owner. Further reproduction prohibited without permission.
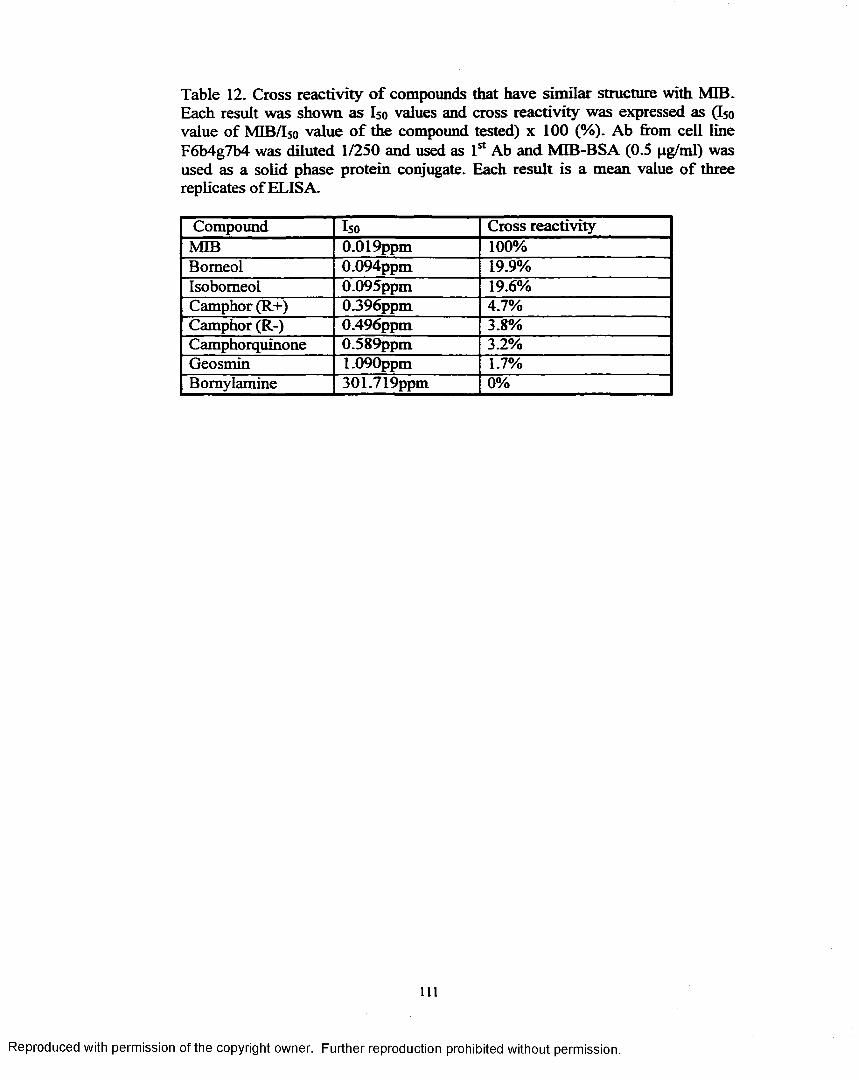
Table 12. Cross reactivity o f compounds that have similar structure with MIB. Each result was shown as I50 values and cross reactivity was expressed as (I50
value of MIB/Iso value o f the compound tested) x 100 (%). Ab from cell line F6b4g7b4 was diluted 1/250 and used as 1st Ab and MIB-BSA (0.5 pg/ml) was used as a solid phase protein conjugate. Each result is a mean value o f three replicates o f ELISA.
Compound I50 Cross reactivityMIB 0.019ppm 100%Bomeol 0.094ppm 19.9%Isobomeol 0.095ppm 19.6%Camphor (R+) 0.396ppm 4.7%Camphor (R-) 0.496ppm 3.8%Camphorquinone 0.589ppm 3.2%Geosmin 1.090ppm 1.7%Bomylamine 301.719ppm 0%
i l l
Reproduced with permission of the copyright owner. Further reproduction prohibited without permission.
(Figure 32). MIB was diluted in 10% methanol solutions from 100 mg/L to 0.1
ng/L by serially diluting I in 10 times. It showed a detection limit o f I ng/L when
the plate was incubated 30 min after adding substrate. Detection limit was defined
as the concentration of MIB showing A/Ao value o f 0.8. This value is the
concentration showing 20% inhibition in antibody binding to the solid phase
conjugate protein.
i l l
Reproduced with permission of the copyright owner. Further reproduction prohibited without permission.
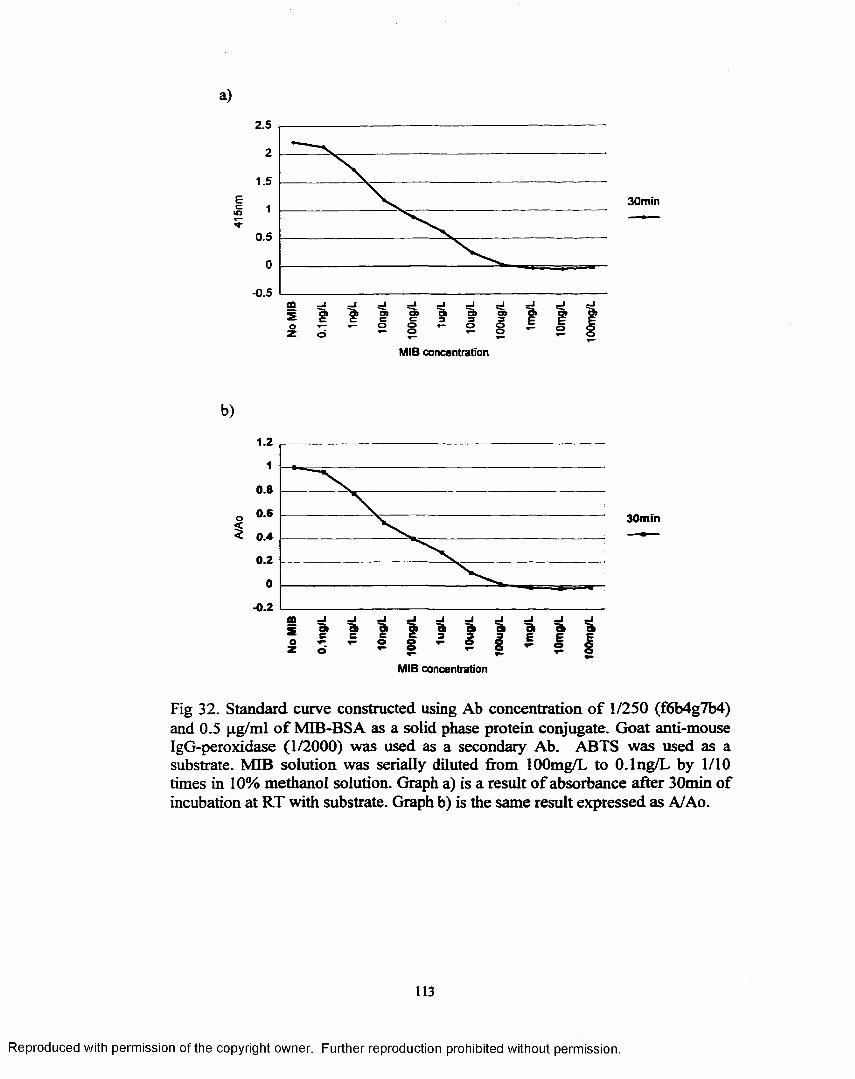
a)
ECto
2.5
2
1.5
1
0.5
0
-0.5tn at a»a»o> 01OJc
30min
MIB concentration
b)
1.2
0.8
0.2
-0.2a _i
'fts
MIB concentration
Fig 32. Standard curve constructed using Ab concentration o f 1/250 (f6b4g7b4) and 0.5 pg/ml o f MIB-BSA as a solid phase protein conjugate. Goat anti-mouse IgG-peroxidase (1/2000) was used as a secondary Ab. ABTS was used as a substrate. MIB solution was serially diluted from lOOmg/L to O.lng/L by 1/10 times in 10% methanol solution. Graph a) is a result o f absorbance after 30min o f incubation at RT with substrate. Graph b) is the same result expressed as A/Ao.
113
Reproduced with permission of the copyright owner. Further reproduction prohibited without permission.
CHAPTER 5. SUMMARY AND CONCLUSION
In order to produce monoclonal antibody against 2-methylisobomeol, 2-
methylisobomeol (MHS)-Limulus poyphemus hemocyanin (LPH) conjugate and
bomeol-LPH were prepared as immunogens. Immunization with these two
compounds produced polyclonal antibodies in mice sera after two immunizations
and those antibodies specifically recognized MIB in indirect competitive ELISA.
Fusions o f splenocytes from mice (mouse I and 2) immunized with MIB-
LPH to myeloma cells did not produce any cell line that specifically recognized
free MIB in the competitive ELISA. The antibodies from those hybridomas
showed high background and non-specific binding. Fusion o f splenocytes from
mouse 3 immunized with bomeol-LPH to myeloma cells yielded a cell line
producing monoclonal antibody that specifically recognized free MIB in the
indirect competitive ELISA.
After three clonings, cell line f6b4g7b4 was established and used as a
primary antibody source in the ELISA. The same methodology was used for the
preparation o f solid phase conjugates and three different kinds of solid phase
conjugates: MIB-BSA, isobomeol-BSA and bomeol-BSA, were prepared.
Tests o f Ab and solid phase conjugate concentrations showed that
sensitivity of ELISA could be improved by lowering concentrations o f Ab and
solid phase protein conjugates. However, use o f low amounts o f Ab and solid
phase protein conjugate also decreased maximum absorbance and increased
variation within samples. This indicates that there should be a compromise
between sensitivity o f assay and maximum absorbance.
114
Reproduced with permission of the copyright owner. Further reproduction prohibited without permission.
The bridge heterology effect can improve the valence o f antibody affinity
for the solid phase protein conjugate and soluble analytes. In this research, the
same conjugation methods were used for the introduction o f bridge to the
immunogen and solid phase protein conjugates by using the same
hemisuccination reaction. However, by using an isomer (isobomeol) of hapten
(bomeol) in immunogen for the preparation of solid phase conjugate, a site
heterology effect was introduced, and a hapten heterology effect was introduced
by using similar structure o f compound (MIB) with immunogen. Comparison of
these three different solid phase protein conjugates showed this anti-bomeol MAb
recognized the linking arm and distinguished the presence o f a methyl group in
the epitope.
In the test o f specificity o f antibody, the Ab showed highest cross
reactivity to MIB. Bomeol and isobomeol showed only 20% cross-reactivity
compared to MIB. The presence o f a methyl group in MIB increased affinity
against Ab. The methyl group in MIB is in the same position with hemisuccinate
of bomeol-LPH (immunogen) and this helped to increase the affinity against
antibody.
Standard curve from 0.1 ng/L of MIB solution to 100 mg/L of MIB
solution diluted in 10% methanol was constructed using prediluted MAb of
F6b4g7b4 (1/250 dilution) with a solid phase conjugate (MIB-BSA 0.5 pg/ml) in
indirect competitive ELISA. This result showed that the MAb could detect MIB
down to 1 ng/L (parts per trillion) levels. This result indicates that the assay has
Reproduced with permission of the copyright owner. Further reproduction prohibited without permission.
sufficient sensitivity for direct application to samples without any previous
concentration steps.
Regardless o f the extremely small size o f hapten, it was possible to
produce a monoclonal antibody that is highly sensitive to MIB. The affinity
characteristic o f this antibody and its supply will remain constant, because it was
produced as a monoclonal antibody. By using monoclonal antibody for this
compound, MIB can be easily tested from field samples.
116
Reproduced with permission of the copyright owner. Further reproduction prohibited without permission.
REFERENCES
Abraham, G.E. and Grover, P.E. 1971. Covalent linkage of steroid hormones to protein carriers for use in radioimmunoassay. In: Principles of Competitive Protein-Binding Assay (Owell, W.D., Daugheday, W.H., ed.) pp. 140-157. Lippincott, Philadelphia.
Aoyama, K., 1990. Studies on the earthy-musty odors in natural water IV. Mechanisms o f earthy-musty odor production o f Actinomycetes. Journal of Applied Bacteriology, 68: 405-410.
Arganosa, G.C. and Flick, JR.G.J. 1992. Off-flavors in fish and shellfish, In: Off-flavors in Food and Beverages. (G. Charlambous ed.) pp. 103-126. Elsevier Science Publishers B.V. New York, USA.
Armstrong, M.S. 1984. Environmental factors affecting off-flavor in catfish production ponds. Doctoral dissertation. Auburn University, Auburn, Albama. USA.
Armstrong, M.S., Boyd, C.E. and Lovell, R.T. 1986. Environmental factors affecting flavor of channel catfish from production ponds. Progressive Fish-Culturist. 48:113-119.
Ashner, M., Laventer, Ch. and Chorin-Kirsch, I. 1967. Off-flavor in carp from fish ponds in the coastal plain and the galil. Bamidgeh. 19:23-25.
Barrett, C.H. 1994. Hybridomas and monoclonal antibodies, In: Antibody Technique. (Malik, V.S. and Lillehoj, E.P. ed.) pp. 71-102, Academic Press.
Bentley, R. and Meganathan, R. 1981. Geosmin and 2-methylisobomeol biosynthesis in streptomyces: evidence for an isoprenoid pathway and its absence in non-differentiating isolates. Federation o f European Biochemical Societies. 125:220-222.
Berglind, L., Holton. H. and Skulberg, O.M. 1983. Case studies on off- flavors in some Norweigian lakes. Water Science and Technology. 15:199-210.
Berthelot, M and Andre, G. 1891. Sur Foduer propre de la terre. Compt. Rend. Acad. Sci. 112. 598.
Bett, K.L. and Johnsen, P.B. 1996. Challenges o f evaluating sensory attributes in the presence o f off-flavors (geosmin and 2-methylisobomeol). J. Sensory Studies. 11:1-17.
117
Reproduced with permission of the copyright owner. Further reproduction prohibited without permission.
Blevins, W.T. 1980. Geosmin and other odorous metabolites o f microbial origin. In: Introduction to Environmental Toxicology. (F.E. Guthrie and J J Perry ed.) pp.350-357, Elsevier, New York, USA.
Boyd, C.E. 1979. Water quality in warm water fish ponds. Alabama Agricultural Experiment Station, Auburn University, Auburn, Alabama, USA.
Brimfield, A.A., Lenz, D.E., Graham, C. Hunter, Jr, K.W. 1985. Mouse monoclonal antibodies against paraoxon: Potential reagents for immunoassay with constant im m unochem ical characteristics. J. Agric. Food Chem. 33:1237-1242.
Brown, R.H. 1996. Research search for answers on catfish-off-flavor. Feedstuff. 17.
Brown, S.W. and Boyd, C.E. 1982. Off-flavor in channel catfish from commercial ponds. Trans. Am. Fisheries Soc. I l l :3 79-3 83.
Buttery, R.G., Guadagni, D.G. and Ling, L.C. 1976. Geosmin, a musty off-flavor o f dry beans. J. Agr. Food Chem. 24:419-420.
Carr, N.G. and Whitten, B.A. editors. 1982. The biology of cyanobacteria. University of California Press, Berkley, California, USA.
Cee, B., Zoetman, J. and Piet, GJ. 1974. Cause and identification of taste and odor compounds in water. Sci. total Environ. 3:103-115.
Chung, S.Y., Johnsen, P.B., Klesieus, P.H. 1990. Development of an ELISA using polyclonal antibodies specific for 2-methylisobomeol. J. Agric. Food Chem. 38(2):410-415.
Chung, S. Y., Vercellotti, J. R., Johnsen, P. B., Kleisius, P. H. 1991. Development o f an enzyme-linked immunosorbent assay for geosmin. J. Agric. Food Chem. 39:764-769.
Coding, J.W. 1986. Production of monoclonal antibodies. In Monoclonal Antibodies: Principle and Practice, pp. 59-103. Academic Press.
Conte, E.D., Shen, C.-Y. Perschbacher, P.W., and Miller, D.W. 1996. Determination of geosmin and methylisobomeol in catfish tissue (Ictalurus punctatus) by microwave -assisted distillation-solid phase adsorbent trapping. J.Agric.Food Chem. 44(3):829-835.
Cornelius, W. O. und Bandt, HJ. 1933. Fischereischaedigungen durch starke vermehrung gewisser pflanzlicher planktoten insbesondere Geschmacks-
1 1 8
Reproduced with permission of the copyright owner. Further reproduction prohibited without permission.
Beeinflus-sung der Fische durch Oscillatorien. ZEITSCHRIFT FUER FISCHEREI UND DEREN HILF SWISSSCHAFTEN.
Desphande, S.S. 1996. Enzyme Immunoassay: From Concept to Product Development, Chapman and Hall, U.S.A.
D ionigi, C.P., Millie, D.F., Spanier, A.M. and Johnsen, P.B. 1992. Spore and geosmin production by Streptomycets tendae on several media. J. Agric. Food. Chem. 40(1) :122-125
Dionigi, C.P. 1994. Effects o f clamazone on biosynthesis o f geosmin by Streptomyces tendae and Penicilluium expansum. Weed Sci. 42:148-152.
Dionigi, C.P. 1995. The effects o f copper sulfate on geosmin biosynthesis by Streptomyces tendae, Streptomucets alibidoflavus, and Penicillium expansum. Wat.Sci. Tech., 31(11): 135-138,
Dionigi, C.P. and Ingram, D.A. 1994. Effects o f temperature and oxygen concentration on geosmin production by Streptomyces tendae and Penicillium expansum. J. Agric. Food Chem. 42:143-145.
Dionigi, C.P. and Champagne, E.T. 1995. Copper-containing aquatic herbicides increase geosmin biosynthesis by Streptomyces tendae and Penicillium expansum. Weed Sci. 43:196-200.
Dupuy, H.P., Flick, G.J., St Angelo, A J.., and Sumrell, G. 1986. Analysis for trace amounts of geosmin in water and fish. JAOCS. 63(7):905-908.
From, J and Horylick, V. 1984. Sites o f uptake o f geosmin, a cause of earthy flavor, in rainbow trout (Salmo gairdneri). Canadian Journal o f Fisheries and Aquatic Sciences 41: 1224-1226.
Gerber, N.N. 1967. Geosmin, an earthy-smelling substances isolated from Actinomycetes. Biotechnology and Bioengineering. 321-327.
Gerber, N.N. 1969. A volatile metabolite of actinomycetes, 2- methylisobomeol. The Journal o f Antibiotics. 508-509.
Gerber, N. N. 1979. Volatile substances from actinomycetes: their role in the odor pollution of water. CRC Critical Reviews in Microbiology. 191-214.
Gerber, N.N. and Lechevalier, H.A. 1965. Geosmin, an earthy-smelling substances isolated from actinomycetes. 935-938.
119
Reproduced with permission of the copyright owner. Further reproduction prohibited without permission.
Gorb, K. 1973. Organic substances in potable water and its precursor. Part I. Methods for their determination by gas-liquid chromatography. Journal o f Chromatography. 84:255-273.
Grob, K. and Grob, G. 1975. Organic substances in potable water and its precursor. III. The closed-loop stripping procedure compared with rapid liquid extration. Journal o f Chromatography. 106:299-315.
Hansen, R.E. 1964. The problem; musty water. Water Work and Wastes Eng. 1:45-51.
Harimaya, K.., Yano, H., Arimoto, T., Kikuchi, T. and Mimura, T. 1972. Identification o f geosmin produced by actinomycetes and blue green algae. Proceedings of 9* Conference o f Jap. Water Treat. Biol. 30.
Hariyadi,S., Tucker,C.S., Steeby,J.A., PIoeg,M.V., and Boyd,C.E. 1994. Environmental conditions and channel catfish Ictalurus puctatus production under similar pond management regimes in Alabama and Mississippi. Journal of the World Aquaculture Society. 25(2):236-249.
Harlow, E and Lane. D. 1988. Monoclonal antibodies. In: Antibodies; A Laboratory Manual, pp. 139-244. Cold Spring Harbor Laboratory.
Henrey, D.E. 1970. Odorous metabolites and other selected studies o f cyanophyta, Dissertation for Ph. D. Northern Texas State University. Denton. Texas. USA.
Hu, T.L. and Chiang, P.C. 1996. Odorous compounds from a cyanobacterium in a water purification plant in central Taiwan. Wat. Res. 30(10): 2522-2525.
Hwang, C.J., Krasner, S.W., Mcguire, M.J., Moylan, M.S. and Dale, M.S. 1984. Determination o f subnanogram per liter levels o f earthy-musty odorants in water by the salted closed-loop stripping method. Environ. Sci. Technol. 18:535- 539.
Iredale, G.D. and York, R.K. 1976. Purging a muddy-earthy flavor taint from rainbow trout (Salmo gciirdneri) by transferring to artificial and natural holding environments. Journal of Fisheries Research Board o f Canada. 33: 160- 166.
Ito, T., Okumura, T. and Yamamoto, M. 1988. The relationship between concentration and sensory properties o f 2-methylisobomeol and geosmin in drinking water. Water Science and Technology 20:11-17.
120
Reproduced with permission of the copyright owner. Further reproduction prohibited without permission.

Izaguire, G. Hwang, C.J., Krasner, S.W., and Mcquire. M.J. 1982. Geosmin and 2-methylisobomeol from cyanobacteria in three water supply systems. Appl. Environ. Microbiol- 43:708-714.
Izaguire, G. Hwang, C.J., Krasner, S.W. and Mcguire,M.J. 1983. Production o f 2-methylisobomeol by two benthic cyanophyta. Wat. Sci. Tech. 15:211-220.
Izaguire, G. and Taylor , W.D. 1995. Geosmin and 2-methylisobomeol production in a major aqueaduct system. Wat. Sci. Tech., 31(11):41-48.
Johnsen, P.B. 1989. Factors influencing the flavor quality o f farm-raised catfish. Food Tech. 43:94-97.
Johnsen, P.B. and Kuan, J-C.W. 1987. Simplified method to quantify geosmin and 2-methylisobomeol concentrations in water and microbiological cultures. J. Chromatograpy. 409:337-342.
Johnsen , P.B. and Kelly, C.A. 1990. A technique for the quantitative sensory evaluation o f farm raised catfish. Aquaculture. 96:139-150.
Johnsen, P.B. and Dupree, H. K. 1991. Influence o f feed ingredients on the flavor quality o f farm-raised catfish. Aquaculture. 96:139-150.
Johnsen, P.B., and Lloyd, S.W. 1992. Influence o f fat content on uptake and depuration o f the off-flavor 2-methylisobomeol by channel catfish (Ictalurns punctatus). CanJ.Fish.Aquat. Sci. 49:2406-2411.
Johnsen, P.B., and Dionigi, C.P. 1994 Physiological approaches to the management o f off-flavors in farm raised channel catfish Ictalurns punctatus. In: Recent Developments in Catfish Aquaculture (Douglas Tave and Craig S. Tucker ed) pp 141-161. The Haworth Press Inc
Johnsen, P.B., Lloyd, S.W., Vinyard, B.T. and Dionigi, C.P. 1996. Effects o f temperature on the uptake and depuration o f 2-methylisobomeol (MIB) in channel catfish Ictalurus punctatus. Journal of World Aquaculture Society. 27(1): 15-20.
Kaji, S. 1974. Musty odor substances produced by attached alage in lake Biwa. J. Jap. Water Works Assoc. No 473, 52.
Keenum, M.E. and Waldrup, J.E. 1988. Economic analysis o f farm raised catfish production in Mississippi. Mississippi Agricultural and Forestry Experimental Station Technical Bulletin 155. Mississippi State, Mississippi, USA.
121
Reproduced with permission of the copyright owner. Further reproduction prohibited without permission.

Kohler, G. and Milstein, C. 1975. Continuous cultures o f fused cells secreting antibody o f predefined specificity. Nature. 256:495-497.
Korth, W., Ellis, J., and Browmer, K. 1992. The stability o f geosmin and MIB and their denaturated analogues in surface waters and organic solvents. Wat. Sci. Tech. 25(2):l 15-122.
Krasner, S.W. 1988. Analytical methods for the identification of earthy/musty flavors in drinking water; A Review. Water Quality Bulletin. 13: 78- 83.
Krasner, S.W., Hwang, C.J., and McGuire, M.J. 1981. Development of a closed-loop stripping technique for the analysis of taste and odor-causing substances in drinking water. In: Advances in the Identification and Analysis of Organic Pollutants in Water. Vol. 2. (Keith.H. ed.) pp.689-710. Ann Arbor Science Publisher Inc.
Kuusi, T. and Suiko, M. 1983. Occurrence o f various off-flavors in fish in Finland from 1969 to 1981. Water Science and Technology. 15:47-58.
Lalezary, S., Pirbazari, M., McGuire, M.J. and Krasner, S.W. 1984. Air stripping of taste and odor compounds from water. Journal o f American Water Works Association. 55:169-176.
Lelana, I.Y.B. 1983. Sensory and objective analyses o f geosmin in channel catfish. Master Thesis, Auburn University. Auburn, Alabama, USA.
Lelana, I.Y.B. 1987. Geosmin and off-flavor in channel catfish. Dissertation for Ph.D. Auburn University. Auburn, Alabama, USA.
Leventer, H. and Eren, J. 1970. Taste and odor in the reservoirs of the Israel national water system, p. 19-37. In: Development in Water Quality Research. (H.I. Shuval ed.) Humphrey Science, Ann Arbor, Michigan.
Li, Q.X., Hammock, B.D., and SeiberJ.N. 1991. Development of an enzyme-linked immunosorbent assay for the herbicide bentazon. J. Agric. Food Chem. 39:1537-1544.
Liddell, J.E. and Cryer, A. 1991. A Practical Guide to Monoclonal Antibodies. John Wiley and Sons, Great Britain.
Littlefield, J.W. 1964. Selection of hybrids from matings o f fibroblasts in vitro and their presumed recombinants. Science. 145:709.
122
Reproduced with permission of the copyright owner. Further reproduction prohibited without permission.

Lorio, W.J., Pershbacher, P.W., and Johnsen, P.B. 1992. Relationship between water quality phytoplankton community and off-flavors in channel catfish (Ictalurus punctatus) production ponds. Aquaculture. 106:285-292.
Lovell, R.T. 1971. The earthy-musty flavor in intensively-cultured catfish. Proceeding o f the Association of Southern Agricultural Workers. 67:102.
Lovell, R.T. 1974. Environment related off-flavors in intensively cultured fish. In: Fishery Products (Kreuzer R. ed.) pp 259-262. Fishing News (Books) Ltd, Surrey.
Lovell, R.T. 1983. New off-flavors in pond-cultured channel catfish. Aquaculture. 30:329-334.
Lovell, R.T. and Sackey, L. 1973. Absorption by channel catfish o f earthy- musty flavor compounds synthesized by cultures of blue green algae. Trans. Amer. Fish. Soc. 4: 774-777.
Lovell, R.T., Lelana, I.Y., Boyd, C.E. and Armstrong, M.S. 1986. Geosmin and musty-muddy flavors in pond-raised channel catfish. Transactions of the American Fisheries Society. 115:485-489.
Maligalig, L.L., Caul, J.F. and Tiemeier, O.W. 1973. Aroma and flavor o f farm-raised channel catfish:effects o f pond condition, storage, and diet. Food Products Development. 7:86-92
Maligalig, L.L.. Bassette, R. and Tiemeier, O.W. 1975a. Flavoring live channel catfish {Ictalurus punctatus) experimentally effects of refrigerated storage and o f purging on retention of experimental flavors. J. Fd. Sci. 40:1946-1948.
Maligalig, L.L., Bassette, R. and Tiemeier, O.W. 1975b. Flavoring live channel catfish (Ictalurus punctatus) experimentally effects of concentration and exposure time. J. Fd. Sci. 40:1242-1245.
Mallevialle, J. and Suffet, I.H. 1987. Identification and treatment o f tastes and odors in drinking water. American Water Works Association, Denver, Colorado, USA.
Marshall, J. A., Hochestler, A.R. 1968. The synthesis of geosmin and the other 1, 10-dimethyl-9-decalol isomers. J. Org. Chem. 33:2593-2595.
Martin, J.F., McCoy, C.P., Greenleaf, W. and Bennett, L. 1987. Analysis o f MIB in w ater, mud, and channel catfish (Ictalurus punctatus) from commercial culture ponds in Mississippi. Can. J. Fish. Aquat. Sci. 44: 909-912.
123
Reproduced with permission of the copyright owner. Further reproduction prohibited without permission.

Martin, J.F., McCoy, C.P., Tucker, C.S., and Bennett, L.W. 1988a. 2- methylisobomeol implicated as a cause o f off-flavor in channel catfish, Ictalurus punctatus (Rafinesque), from commercial culture ponds in Mississippi. Aquaculture and Fisheries Management. 19:151-157.
Martin, J.F., Bennett, L.W., and Graham, W.H. 1988b. Off-flavor in the channel catfish (Ictalurus Punctatus) due to 2-methylisobomeol and its dehydration products. Wat. Sci. Tech. 20(8/9): 99-105.
Martin, J.F., Fisher, T.H., Bennett, L.W. 1988c. Musty odor in chronically off-flavored channel catfish: Isolation o f 2-methylenebomane and 2-methyl-2- bomene. J. Argic. Food Chem. 36: 1257-1260.
Martin, J.F.. Plankes, S.M., Holley, J. H. and Kitzman, J.V. 1990. Pharmacokinetics and tissue disposition o f the off-flavor compound 2- methylisobomeol in the channel catfish (Ictalurus punctatus). Can. J. Fish.Aquat. Sci. 47: 544-547.
Martin, J.F., Izaguirre, G. and Waterstart, P. 1991. A planktonic Oscillatoria speices from Missippi catfish ponds that produces the off-flavor compound 2-methylisoborneoI. Wat. Res. 25(12):1447-1451.
McGuire, M.J.. Krasner, S.W., Hwang, C.J. and Izzaguirre, G. 1981. Closed-loop stripping analysis as a tool for solving taste and odor problems. Journal of American Water Works Association. 75:520-537.
Matsumoto, A. and Tsuchiya, Y. 1988. Earthy-musty odor-producing cyanophytes isolated from five water areas in Tokyo. Wat.Sci.Tech. 20:179-183.
Medsker, L.L., Jenkins. D. and Thomas, J.F. 1968. Odorous compounds in natural waters. Environmental Science and Technology. 2:461-464.
Medsker, L.L., Jenkins, D. and Thomas, J.F. 1969. Odorous compounds in natural waters. 2-Exo-hvdroxy-2-methylborane, the major odorous compound produced by several actinomycetes. Environmental Science and Technology. 3(5):476-477.
Meulengerg, E.P.. Mudler, W.H. and Stoks, P.G. 1995. Immunoassays for pesticides. Environmental Sciences and Technology. 29:553-561.
Mumma, R.D., Bogus,E.R., Vallejo. R.P. 1982. Effect of hapten structure and bridging groups on antisera specificity in parathion immunoassay development. J. Agric. Food Chem. 30: 572-580.
124
Reproduced with permission of the copyright owner. Further reproduction prohibited without permission.
Naes, H., Utktlen. H.C. and Post, A.F. 1989. Geosmin production in the cyanobacterium Oscillatoria brevis. Arch Microbiol. 151:407-410.
Negoro, T.. Ando. M. and Ichikawa, N. 1988. Blue green algae in lake Biwa which produce earthy-musty odors. Wat. Sci. Tech. 20(8/9):! 17-123.
Paerl, H.W. and Tucker, C.S. 1995. Ecology o f blue green algae in aquacultre ponds. Journal o f the World Aquaculture Society. 26(2).
Persson, P.E. 1974. On flavour tainting of fish, with special reference to the Oulu Sea area (Bothnian Bay). Rep. Nat. Board Wat. Finland 65. 1-262.
Persson, P.E. 1978. Muddy off-flavor in bream (Abramis brama) from the Porvoo area, Gulf of Finland. Internationale Vereinigung for Theoretische und Angewandte Limnolgie Verhandlungen 20:2098-2102.
Persson, P.E. 1979. The source o f muddy odor in bream (Abramis brama) From the Porvoo sea area (Gulf o f Finland). J. Fish. Res. Board. Can. 36:883-890.
Persson.P.E. 1979. Notes on muddy flavor IV. Variability o f sensory response to 2-methylisobomeol. Aqua Fennica. 9:48-52.
Persson, P.E. 1980. Sensory properties and analysis o f two muddy odor compounds, geosmin and 2-methylisoborneol in water and fish. Water Research. 14:1113-1118.
Persson, P.E. 1981. The etiology of muddy odour in water and fish. Finnish Fisheries Research 4:1-13.
Persson, P.E. 1982. Muddy odor: a problem associated with extreme eutropication. Hydrobiologia. 86:161-164.
Persson, P.E. 1983. Off-flavors in aquatic ecosystems-an introduction. Wat. Sci. Tech. 15:1-11.
Persson, P.E. 1984. Uptake and release o f environmentally occurring odorous compounds by fish. Water Res. 18:1263-1271.
Persson, P.E. and York. R.fC. 1978. Notes on muddy odor: I. Sensory properties and analysis of 2-methylisobomeol in water and fish. Aqua Fennica. 8: 83-88.
Petterson, H. G.. Hrudev, S.E.. Cantin, I.A., Perley, T.R. and Kenefick.S.L. 1995. Physiological toxicity, cell membrane damage and the release
125
Reproduced with permission of the copyright owner. Further reproduction prohibited without permission.
of dissolved organic carbon and geosmin by Aphanizomenon flos-aquae after exposure to water treatment chemicals. Wat-Res. 29(6): 1515-1523.
Plhak, L.C. and Spoms, P. 1992. Enzyme immunoassays for potato glycoalkaloids. J. Agric. Food Chem. 40: 2533-2540.
Plhak. L.C. and Spom. P. 1994. Development and production o f monoclonal antibodies tor the measurement o f solanidine potato glycoalkaloid. American Potato Journal. 71: 297-315.
Pontecorvo. G. 1975. Production o f mammalian somatic cell hybrids by means o f polyethylene glycol treatment. Somatic Cell Genet. 1:397-400.
Potter, M. 1972. Immunoglobulin producing tumors and myeloma proteins o f mice. Physiol. Rev. 52: 631-719.
Rashash, D.M.C.. Dietrich. A.M.. Floehn, R.C. and Parker. B.C. 1995. The influence of growth conditions on odor-compound production by two chrysophytes and two cyanobacteria. Wat. Sci. Tech. 31(11): 165-172.
Reynolds, C.S. 1984. The ecology of freshwater phytoplankton. Cambridge University Press. Cambridge, England.
Romano, A.H. and Safferman. R.S. 1963. Studies on actinomycetes and their odors. J. Am. Water Works Assoc. 55:169-176.
Rosen, A.A.. Mashni. A.A. and Safferman, R.S.. 1970. Recent developments in the chemistry of odor in water: The cause of earthy/musty odor. Water Treatment and Examination. 19:106-119.
Safferman, R.S.. Rosen, A.A.. Mashni, C.I., and Morris. M.E. 1967. Earthy-smelling substances from a blue-green alga. Environmental Science and Technology. l(5):429-430.
Sano, H. 1988. The detection of taste and odor in Osaka's drinking water. Water Science and Technology. 20:37-42.
Schneider, P.. and Hammock, B.D. 1992. Influence of the ELISA format and the hapten- enzyme conjugation on the sensitivity of an immunoassay for s- triazine herbicides using monoclonal antiobodies. J. Agric. Food Chem. 40:525- 530.
Seiver J.N ., Qing Xiao Li. and Hammock.B.D. 1991. Development o f an enzyme-linked immunosorbent assay for the herbicide bentazon. J. Agric. Food Chem. 39:1537-1544.
126
Reproduced with permission of the copyright owner. Further reproduction prohibited without permission.
Silvey, JJC.G. and Wyatt. J.T. 1970. The interrelationship between freshwater bacteria, algae and actinomycetes in Southwestern reservoirs. Pages 249-275 in J. Cairns, editor. The Structure and Function o f Freshwater Microbial Communities. Research Division Monograph 3. Virginia Polytechnic Institute, Blacksburg, Virginia. USA.
Smith, L. 1983. Introduction to Fish Physiology. T.F.H. Publication. Neptune, New Jersey. USA.
Stahl, P.D. and Parkin. T.B. 1994. Purge and trap extraction of geosmin and 2-methylisobomeol from soil. Soil Sci. Soc. Am. J. 58: 1163-1167.
Stanker, L.H., Beier. R.C.. Elissalde, M.H. 1993. Devevelopment o f a monoclonal based enzyme -linked immunosorbent assay for the coccidiostat salinomycin. J. Agric. Food Chem. 41: 2167-2171.
Tabachek, J.-A. and Yurokowski. M. 1976. Isolation and identification of blue-green algae producing muddy odor metabolites, geosmin and 2- methylisobomeol. in saline lakes in Mannitoba. J. Fish. Board Can. 33(l):25-35.
Tanchotikul. U. and Hsieh. T.C.Y. 1987. Methodology for quantification of geosmin and levels in rangia clam (Rcingia cuneata) from commercial culture ponds in Mississippi. Can. J. Fish. Aquat. Sci. 44:909-912.
Tanchotikul, U. and Hsieh. T.C.Y. 1990. Methodology for quantification of geosmin and levels in rangia clam (Rangia cuneata). Journal of Food Science. 55(5):1233-1238.
Thaysen, A.C. 1936. The origin of an earthy or muddy taint in fish. I. The nature and isolations of the taint. Ann.Appl.Biol. 23:99-104.
Thaysen, A.C. and Pentelow, F.T.1C. 1936. The origin of an earthy or muddy taint in fish. II. The effect on fish of the taint produced by an odoriferous species of actinomyces. Annals of Applied Biology. 23:105-109.
Thomas, G. 1993. A new monoclonal antibody for the sensitive detection o f atrazine with immunoassays in microtiter plate and dipstick format. J. Agric. Food Chem. 41:1006-1011.
Tucker, C. S. and Boyd, C.E. 1978. Effects o f simazine treatment on channel catfish and bluegill production in ponds. Aquaculture. 15:345-352.
Tucker, C.S. and Boyd. C.E. 1978. Consequences o f periodic applications o f copper sulfate and simazine for phvtoplankton control in catfish ponds. Transactions o f the American Fisheries Society. 107:316-320.
127
Reproduced with permission of the copyright owner. Further reproduction prohibited without permission.
Tucker, C.S.. Busch. R.L. and LIyod, S.W. 1983. Effects o f simazine treatment on channel catfish production and water quality in ponds. J. Aquat. Plant Manage. 21:7-l I .
Tucker, C. S. and Llovd. S. W.. 1987. Evaluation o f potassium ricinoleate as a selective blue-green algicide in channel catfish ponds. Aquaculture. 65:M IMS.
Tucker, C. S. and Martin. J.F. 1991. Environment—related off-flavors in Fish. In: Aquaculture and Water quality. Advances in World Aquaculture (Brune,D.E.,and TormassomJ.R. ed.) pp 133-179. Vol. 3. The World Aquaculture Society.
Vallejo, R.P.. Bogus. E.R.. and Mumma, R.O. 1982. Effects o f hapten structure and bridging groups on antisera specificity in parathion immunoassay development. J. Agric. Food Chem. 30:572-580.
van der Ploeg . VI., and Boyd . C.E. 1991. Geosmin production by cyanobacteria (blue green algae) in fish ponds at Auburn, Alabama. Journal o f World Aquaculture Society. 22: 207-216.
Velzeboer. K... Drikas. VI.. Donati. C., Burch, M. and Steffensen, D. 1995. Release of geosmin by Anabeana circhudis following treatment with aluminum sulfate. Wat. Sci. Tech. 31(11):IS7-194.
Weete, J.D., Blevins. W.T.. Wilt. G.R. and Durham, D. 1977. Chemical, biological and environmental factors responsible for the earthy odor in the Auburn city water supply. Alabama Agricultural Experimental Station Bulletin 490. Auburn, Alabama. USA.
Weirich, C. 1995. management o f off-flavors in Mississippi farm-raised catfish. Mississippi 24th Annual Catfish Processors Workshop. August 12. Form No. 447. 27-29.
Whitmore, T.N. and Denny. S. 1992. Discussion o f the effect o f disinfectants on a geosmin producing strain of Streptomycetes grist-us. J. o f Appl. Bacteriol. 43:445-446.
Wie, S.L., and Hammock, B.D. 1984. Comparisons of coating and immunizing antigen structure on the sensitivity and specificity o f immunoassays for benzoylphenylurea insecticides. J. Agric. Food Chem. 32:1294-1301.
Wood, N.F and Snoeyink, V. L. 1977. 2-Methylisobomeol, improved synthesis and a quantitative GC method for trace concentrations producing odor in water. J. Chromatog. 132:405-420.
128
Reproduced with permission of the copyright owner. Further reproduction prohibited without permission.
Wood, S., Williams. S.T.. White. W.R. and Jones. F. 1983. Factors in f lu e n c in g geosmin production by a streptomycete and their relevance to the occurrence o f earthy taints in reservoirs. Water Science and Technology. 15: 191— 198.
Wu, J-T. and Juttner. F. 1988. DitTerential partitioning of geosmin and 2- methylisobomeol between cellular constituents in Oscillatiria cennuis. Arch Microbiol. 150:580-583.
Wu, J.-T., Ma. P.-l. and Chou T.-L. 1991. Variation of geosminb content in Anabaena cells and its relation to nitrogen utilization. Arch Microbiol. 157:66- 69.
Yagi, S. 1983. Taste and flavor of water. Journal of Japanese Water Works Association. 590: 65-79.
Yagi, M„ Kajino. M.. Matsuo. L'.. Ashitani, BC., Kita. T.. and Nakamura, T. 1983. Odor problems in Lake Biwa. Wat. Sci. Tech. 15 (6/7):3 I 1-321.
Yasuhara, A. and Fuwa. K. 1979. Determination o f geosmin by computer- controlled mass fragmentography. Journal of Chromatography. 172:453-456.
Yurokowski. M.. Tabachek, T.L. 1974. Identification, analysis, and removal o f geosmin from muddy flavored trout. J. Fish. Res. Board. Can. 3 1(12):1851-1858.
Yurokowski. M.. Tabachek, T.L. 1980. Geosmin and 2-methylisobomeol implicated as a cause of muddy odor and flavor in commercial fish from Cedar lake, Mannitoba. Can. J. Fish. Aquat. Sci. 37:1449-1450.
Zoetman, B.C.J. 1980. Sensory assessment of water quality. Pergamon series on Environment Science, vol.2. Pergamon Press Ltd, UR.
Zola, H, 1987. Monoclonal Antibodies: A Manual o f Techniques. CRC press, Boca Raton. Florida.
Reproduced with permission of the copyright owner. Further reproduction prohibited without permission.
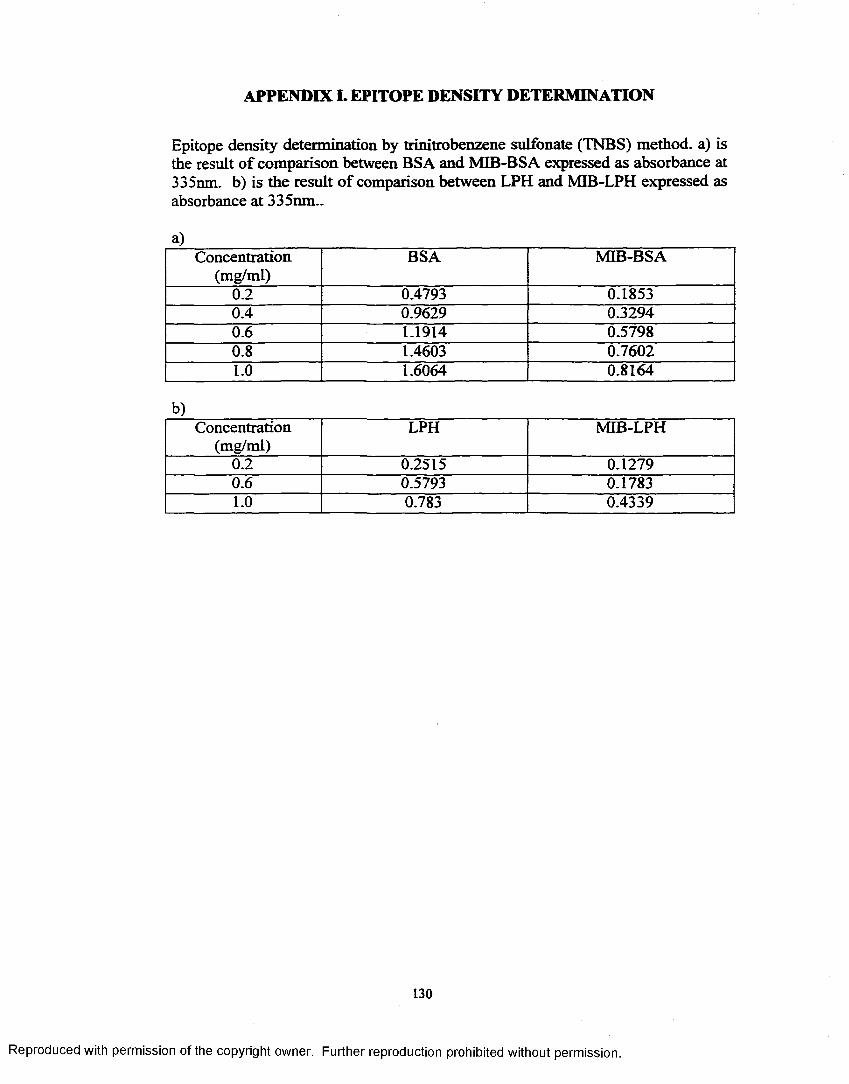
APPENDIX I. EPITOPE DENSITY DETERMINATION
Epitope density determination by trinitrobenzene sulfonate (TNBS) method, a) is the result o f comparison between BSA and MIB-BSA expressed as absorbance at 335nm. b) is the result o f comparison between LPH and MIB-LPH expressed as absorbance at 335nm..
a )
Concentration(mg/ml)
BSA MIB-BSA
0.2 0.4793 0.18530.4 0.9629 0.32940.6 1.1914 0.57980.8 1.4603 0.76021.0 1.6064 0.8164
b)Concentration
(mg/ml)LPH MIB-LPH
0.2 0.2515 0.12790.6 0.5793 0.17831.0 0.783 0.4339
130
Reproduced with permission of the copyright owner. Further reproduction prohibited without permission.

APPENDIX n . SCREENING (1)
Screening o f fused cells after fusion o f splenocytes (mouse 2, immunized with MIB-LPH) with myeloma cells in the days o f 6 and 10.20 |xl o f supernatant (6 days) and 50 p i o f supernatant (10 days) were used as 1st Ab source and MIB- BSA (1 pg/ml) was used as solid phase conjugate. Anti mouse IgG-peroxidase (1/2000) was used as secondary Ab.
6 days 10 days 6 days 10 daysIc2 0.174 1.865 3a6 0.228 0.705lc6 0.246 1.678 3a7 0.428 0.427
lclO 0.175 0.651 3b3 0.201 2.403le3 0.175 0.839 3bI0 0.194 2.247
le l l 0.201 1.256 3e7 0.19 0.871lf7 0.192 1.736 3f6 0.189 2.238lg8 0.172 0.618 3h3 0.208 2.431lh3 0.173 0.885 4a3 0.177 0.4732a3 0.192 1.319 4a8 0.19 0.3072a8 0.228 1.59 4al0 0.392 0.4022b6 0.173 0.693 4b6 0.575 0.7052 c ll 0.202 1.596 4b9 0.364 0.4472d8 0.196 2.199 4 c ll 0.179 0.332e7 0.224 2.056 4d6 0.575 0.705
2el0 0.221 0.819 4d9 0.2 0.442fl0 0.593 0.562 4e7 0.183 0.3512g6 0.183 0.712 4el0 0.203 0.66
2g ll 0.196 0.904 4fl0 0.301 2.2972h6 0.274 2.119 4a9 0.448 0.509
131
Reproduced with permission of the copyright owner. Further reproduction prohibited without permission.
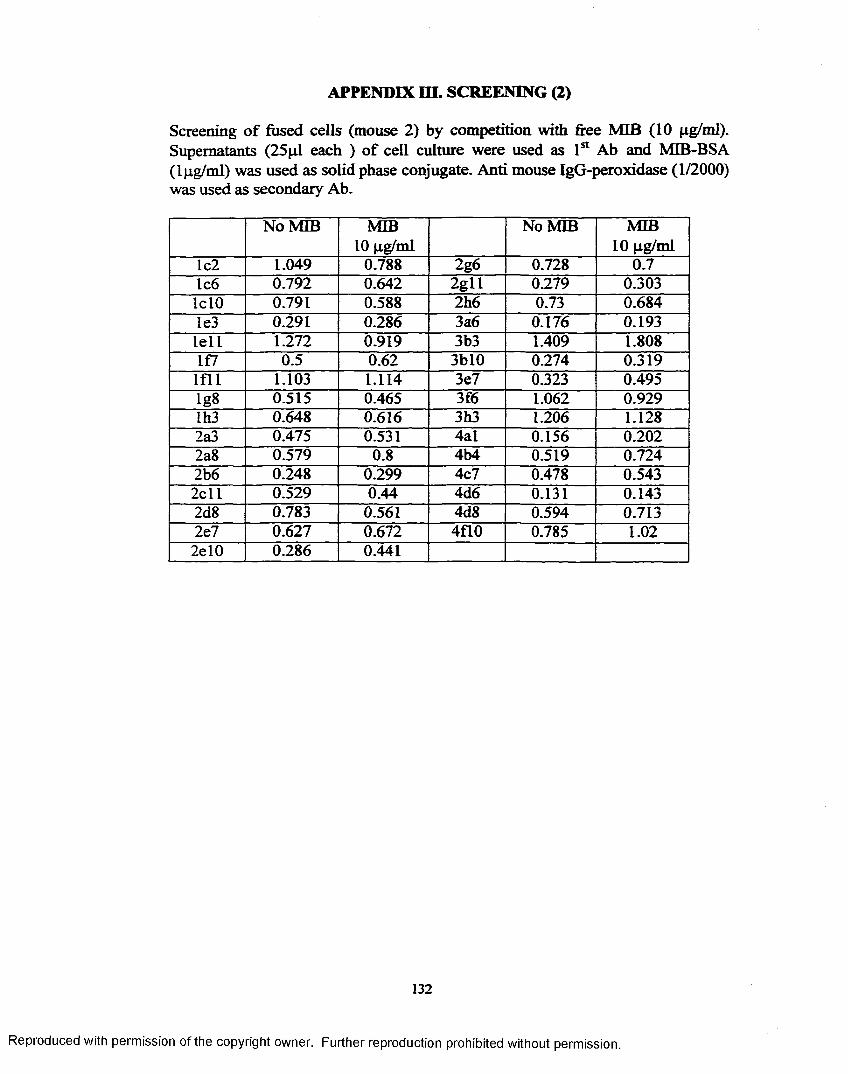
APPENDIX III. SCREENING (2)
Screening o f fused cells (mouse 2) by competition with free MIB (10 fig/ml). Supernatants (25pi each ) o f cell culture were used as 1st Ab and MIB-BSA (lpg/ml) was used as solid phase conjugate. Anti mouse IgG-peroxidase (1/2000) was used as secondary Ab.
No MIB MIB 10 pg/ml
No MIB MIB10 pg/ml
Lc2 1.049 0.788 2g6 0.728 0.7lc6 0.792 0.642 2 g ll 0.279 0.303lclO 0.791 0.588 2h6 0.73 0.684le3 0.291 0.286 3a6 0.176 0.193
le l l 1.272 0.919 3b3 1.409 1.808lf7 0.5 0.62 3bl0 0.274 0.319
l f l l 1.103 1.114 3e7 0.323 0.495lg8 0.515 0.465 3f6 1.062 0.929lh3 0.648 0.616 3h3 1.206 1.1282a3 0.475 0.531 4al 0.156 0.2022a8 0.579 0.8 4b4 0.519 0.7242b6 0.248 0.299 4c7 0.478 0.5432 c ll 0.529 0.44 4d6 0.131 0.1432d8 0.783 0.561 4d8 0.594 0.7132e7 0.627 0.672 4fl0 0.785 1.02
2el0 0.286 0.441
132
Reproduced with permission of the copyright owner. Further reproduction prohibited without permission.

APPENDIX IV. RESULT OF 1st CLONING
2
IDO
<8
■ NO bomeol
~ bomeol, lOppm
□ bomeol, lOOppm
Result of 1st cloning o f the cells from dl 1 and f6. Cell culture supernatants (20jal each) from cells subcultured in 24 well cell culture plate were used as an Ab source. Two concentrations o f bomeol (lOppm and lOOppm) were used for the competitive inhibition o f Ab binding to the solid phase conjugate (MIB-BSA, lppm).
133
Reproduced with permission of the copyright owner. Further reproduction prohibited without permission.

APPENDIX V. RESULT OF 2nd CLONING
| No MIB u MIB. lOppm
b)
1.4
1.2
1
E 0.8inu 0.6
0.4
0.2
0
No MIBMIB.10ppm
d11f4h6 d11f4h9 d11f4g4 d11f4g6
Result of 2nd cloning o f the cells from d l lb3 (graph a) and d l lf4 (graph b). Cell culture supernatants (5pl each) from cells subcultured in 24 well cell culture plate were used as an Ab source. Ten ppm o f MIB concentration was used for the competitive inhibition o f Ab binding to the solid phase conjugate (MIB-BSA,lppm).
134
Reproduced with permission of the copyright owner. Further reproduction prohibited without permission.

a)
1.2
0.8
mo■'j-0.4
0.2
wo
d11g3h4 d11g3g2 d11g3g8 d11g3g9 d11g3f3
b)
1.2
1
0.8
0.4
0.2
No MIBMIB.10ppm
No. MIBMIB.10ppm
d11h8h6 d11h8h10 d11h8g7 d11h8g10 d11h8f3
Result o f 2nd cloning of the cells from dl lg3 (graph a) and d l lh8 (graph b). Cell culture supernatants (5ul each) from cells subcultured in 24 well cell culture plate were used as an Ab source. Ten ppm o f MIB concentration was used for the competitive inhibition of Ab binding to the solid phase conjugate (MIB-BSA, lppm).
135
Reproduced with permission of the copyright owner. Further reproduction prohibited without permission.
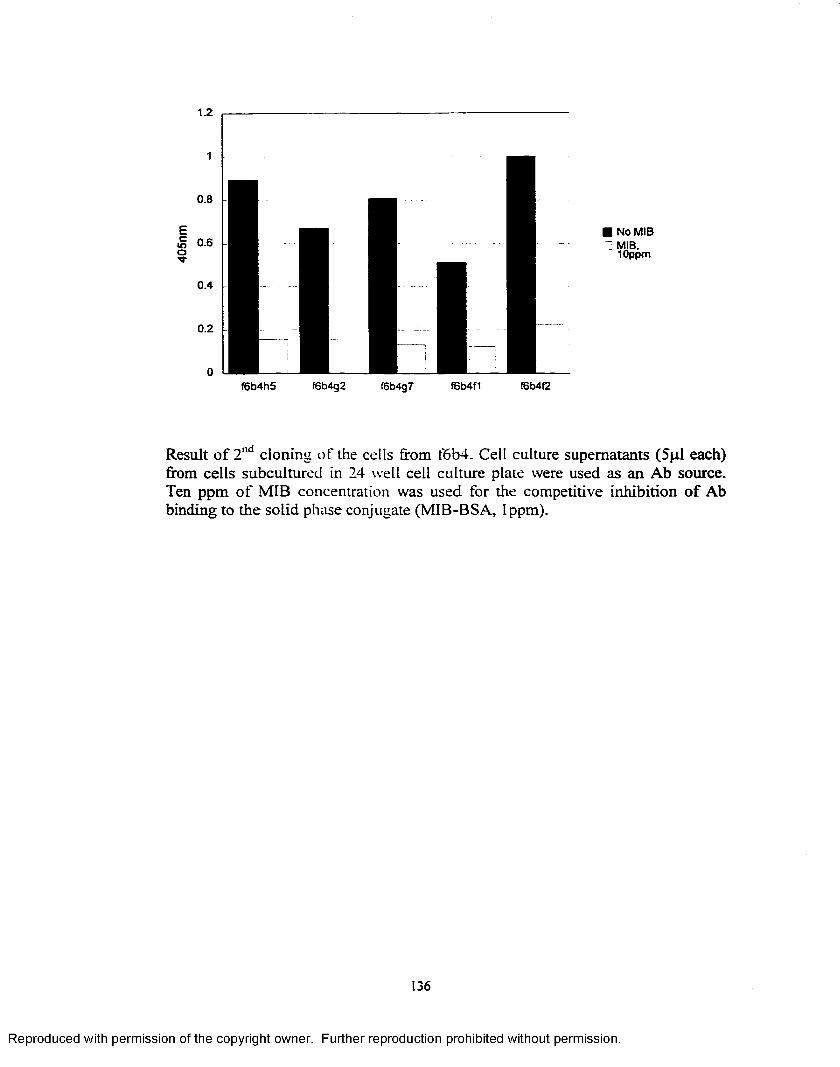
1.2
0.8
ino
0.4
0.2
f6b4h5 f6b4g2 f6b4g7 f6b4f1 f6b4f2
No MIBMIB.10ppm
Result o f 2nd cloning of the cells from f6b4. Cell culture supernatants (5pl each) from cells subcultured in 24 well cell culture plate were used as an Ab source. Ten ppm o f MIB concentration was used for the competitive inhibition o f Ab binding to the solid phase conjugate (MIB-BSA, I ppm).
136
Reproduced with permission of the copyright owner. Further reproduction prohibited without permission.
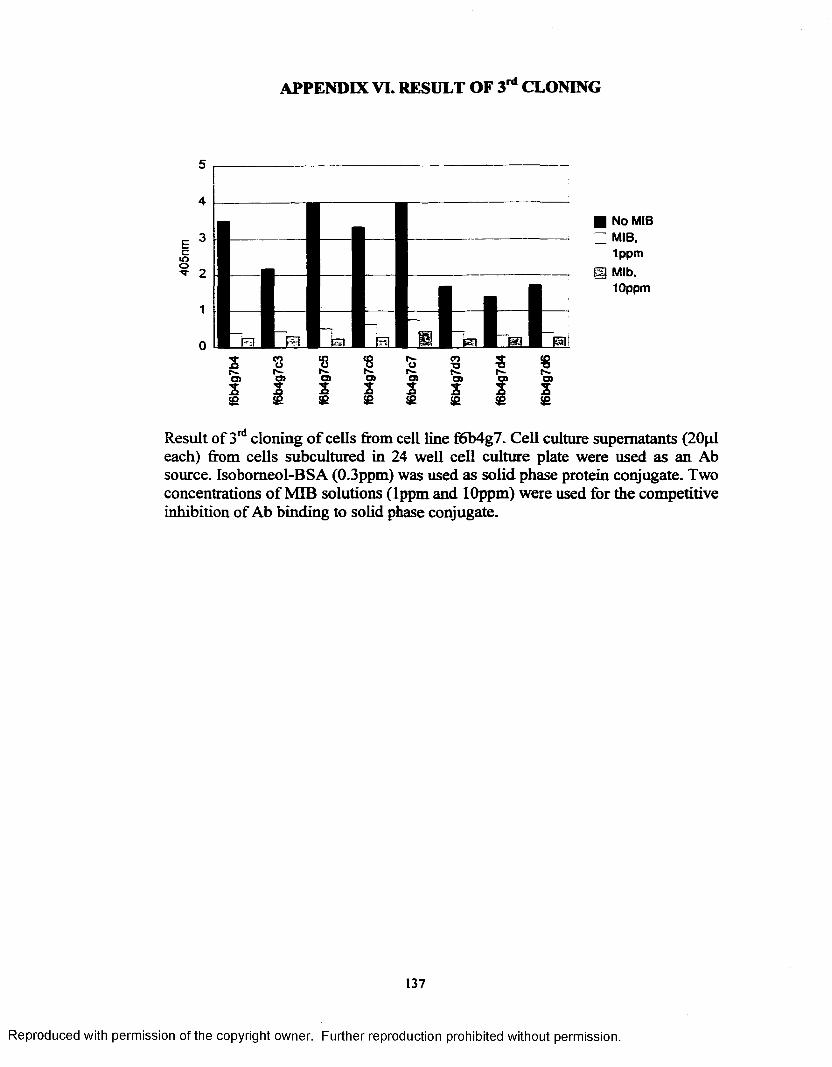
APPENDIX VL RESULT OF 3rd CLONING
5
■ No MIB ~ MIB,
1ppma Mlb,
10ppm
Result of 3 rd cloning o f cells from cell line f6b4g7. Cell culture supernatants (20pl each) from cells subcultured in 24 well cell culture plate were used as an Ab source. Isobomeol-BSA (0.3ppm) was used as solid phase protein conjugate. Two concentrations o f MIB solutions (lppm and lOppm) were used for the competitive inhibition of Ab binding to solid phase conjugate.
137
Reproduced with permission of the copyright owner. Further reproduction prohibited without permission.
VITA
The author was bom in Jeju, Korea, on July 20, 1966. He entered Korea
University in March. 1985. and was graduated in February, 1991, with a bachelor
o f science degree in agricultural chemistry.
The author was admitted by the Graduate School o f Korea University in
August, 1991, and received a master o f science degree in agricultural chemistry in
July, 1993.
The author was accepted to the Graduate School of Louisiana State
University through the Department of Food Science in August. 1995. He worked
as a graduate research assistant for Dr. Leslie C. Plhak.
The author is currently a candidate for the degree o f Doctor in Philosophy
in Food Science, which will be conferred in December, 1999.
138
Reproduced with permission of the copyright owner. Further reproduction prohibited without permission.
DOCTORAL EXAMINATION AND DISSERTATION REPORT
Candidate; Eun Sung Park
Major Field: Food Science
Title of Dissertation: Development of Monoclonal Antibody and EnzymeLinked Immunosorbent Assay for Detection of Off-flavor Compound 2-Methylisobomeol
Approved:
Professor
iduate ScnoolDean of
EXAMINING COMMITTEE:
Zt- v m/ f i .
May 7, 1999
Reproduced with permission of the copyright owner. Further reproduction prohibited without permission.