development of srf spoke cavities for low and intermediate ...development of srf spoke cavities for...
TRANSCRIPT

DEVELOPMENT OF SRF SPOKE CAVITIES FOR LOW AND INTERMEDIATE ENERGY ION LINACS
G. Olry*, J-L. Biarrotte, S. Blivet, S. Bousson, F. Chatelet, T. Junquera, A. Le Goff, J. Lesrel, C. Miélot, A. C. Mueller, H. Saugnac, P. Szott, CNRS/IN2P3/IPNO, Orsay, France
Abstract The fabrication of the first European spoke cavity
prototype has been achieved in July 2002. A series of mechanical and RF tests at warm and cold temperature was performed this year. These tests have demonstrated, on the one hand, the good feasibility, stiffness and tunability of the spoke cavity and, on the other hand, its excellent RF performances with a maximum accelerating field of 12.5 MV/m reached at 4.2K.
INTRODUCTION Spoke cavities have been studied for 3 years at IPN
Orsay. Beam dynamics studies [1] dedicated to the EURISOL [2] and XADS [3] European projects have pointed out that this kind of cavity is particularly suited to be used from typically 20 MeV up to 100 or 150 MeV (for proton linacs). In this framework, IPN has studied a 2-gap, beta 0.35, 352 MHz spoke cavity. The optimization of the RF parameters (done with MAFIA [4]) and the structural analysis (done with ACORD-CP [5]) are presented in [6-8]. The prototype has been fabricated, from February to July 2002, by the French company Cerca [9] and a series of tests started since the delivery date.
First of all, we will describe the measurements performed at room temperature to know in particular the mechanical properties of the cavity like its sensitivity versus displacement and load, its mechanical stiffness, the frequency shift due to fabrication and vacuum load, the accelerating field profile… Then, we will show the results obtained during the three tests, in January, March and July 2003, performed at 4.2K into our new vertical cryostat. Finally, the recent developments made on the new beta=0.15 spoke cavity will be presented.
TESTS AT ROOM TEMPERATURE
Dimensional Controls Before the tests, we studied the frequency variation (i.e.
∆f~+300 kHz) observed between the “theoretical” value calculated with MAFIA (fcalculated=358.55 MHz) and the frequency measured at the delivery (fmeasured=358.85 MHz). Note: calculations and measurements have been done for the cavity at atmospheric pressure.
Thanks to the dimensional measurements of the main cavity pieces (e.g. the spoke bar, the cavity length…) done by Cerca during the fabrication process and the respective sensitivities calculated with MAFIA, we had estimated the frequency variation due to fabrication
errors. As we can see in Table 1, the estimation (i.e. +455 kHz) is in good agreement with the measurement. On one hand, the little difference between the “theoretical” frequency and the “real” one and on the other hand, the very good accelerating field flatness due to strong magnetic coupling between both cells (see section above) means that spoke cavity doesn’t need to be tuned at room temperature. It’s a strong advantage as compared to elliptical cavities for instance.
Table 1: Estimation of the frequency variation due to
fabrication errors.
Areas Sensitivity
with MAFIA (kHz/mm)
Errors (mm)
Frequency variation
(kHz)
Cavity diameter 950 -0.1 +95
Spoke base diameter 650 -0.2 -130
Racetrack width 800 -0.2 +160
Racetrack thickness 600 +0.2 -120
Wall-to-wall cavity length 450 +1.0 +450
Total variation +455
The Test Set Up
Figure 1: The spoke cavity on the test bench during the tuning sensitivity measurements. Red arrows symbolize
the efforts applied on the cavity. ___________________________________________
Sliding plate Fixed plate
RF pickup Sensors Nut
Screwed rod
Tuning force
Proceedings of the 11th Workshop on RF Superconductivity, Lübeck/Travemünder, Germany
476 TUP55

The test set up used to check mechanical properties is shown on Figure 1. The cavity is settled between two plates which are maintained by three screwed rods. The pulling (or pushing) efforts are applied by means of three nuts. Displacements were measured with the sensors placed on each flanges (one of them, behind the fixed sheet, is not visible). The frequency shift is read directly on a Network analyser.
Before each vacuum pumping or fixed displacement, the cavity is prestressed by pulling the cavity of about 0.4 mm (the maximum elongation is 1 mm in order to stay below the Niobium yield strength limit of 50 MPa). Note: while we were testing the frequency variation due to vacuum pumping, we checked the sealing of the weldings. No leakage was observed (the minimum threshold of gauge detection was 1.0 10-9 mbar.l/s).
Sensitivity Versus Vacuum Load Two series of several pumping cycles each were done
to measure the frequency shift of the cavity (1 cycle means making the vacuum inside the cavity and to go up back to the atmospheric pressure). The total average frequency shift observed was about ±110 kHz. The results of the measurements are noticed in Table 2. From these values, and taking into account the frequency correction due to the permitivity change (here, it’s about –110 kHz from vacuum to Patm), we have deduced the frequency shift due to the cavity deformations during the pumping, i.e. ±220 kHz (+ for vacuum→Patm and – for Patm→vacuum).
Table 2: Frequency shift measurements during the
pumping cycles
Series n°1 ∆f (kHz)
Series n°2 ∆f (kHz)
Vacuum→Patm +117 +103
Patm→Vacuum -117 -124
Vacuum→Patm +104 +103
Patm→Vacuum -104 -105
Vacuum→Patm +112 +103
Average ±111 ±108
Sensitivity Versus Displacement Measurements of the frequency variation as a function
of the elongation along the beam axis have been done using the test set up shown on Figure 2. Taking into account the prestress of the cavity, we took care of not exceeding 1 mm of total elongation. That’s why the displacement shown on x-coordinate is limited to 0.4 mm at maximum.
8 measurements were done (6 during the first series and 2 during the last one for which we have “shaked” the test bench in order to see a possible effect on the measurements). The mean value of all measurements is
575 ± 25 kHz/mm (minimum 535 kHz/mm and maximum 610 kHz/mm). Note: differences between values at the origin (i.e. zero-displacement) are due to different prestresses values.
This measured tuning sensitivity is consistent with the estimations calculated with MAFIA software (450<∆f/∆z<800 kHz/mm) and more recently with COSMOS/MICAV software (∆f/∆z=630 kHz/mm).
Sensitivity versus displacement
358.9
359.0
359.1
359.2
359.3
0.00 0.05 0.10 0.15 0.20 0.25 0.30 0.35 0.40Displacement (mm)
Freq
uenc
y (M
Hz)
Series n°2(test bench "shaked")
Series n°1
Figure 2: Frequency variation versus displacement.
Measurements (points) and fit functions (lines).
Sensitivity Versus Load Unfortunately, we were not be able to measure the load
applied on the cavity during the tuning sensitivity measurements done at IPN. So, we used the tensile testing machine installed at the LAL/Orsay (Figure 3).
The loading process and the data acquisition were fully controlled by a computer. The maximum displacement was computed up to 0.8 mm. We noted the values of the frequency every 0.1 mm.
Figure 3: The spoke cavity placed between both jaws.
The result of this test is shown in Figure 4. As for the tuning sensitivity, the slope of the fit function (blue line) gives us the sensitivity of the cavity versus the load, i.e. ∆f/∆F=243 Hz/N.
Sensor
RF pickup
Fixed jaw
Moving jaw
Force
Proceedings of the 11th Workshop on RF Superconductivity, Lübeck/Travemünder, Germany
TUP55 477

Frequency versus load
fit functiony = 0.000243x + 358.946239
358.96358.98359.00359.02359.04359.06359.08359.10359.12359.14
0 100 200 300 400 500 600 700 800Load (N)
Freq
uenc
y (M
Hz)
Figure 4: Frequency variation versus the load.
Stiffness Based on the previous sensitivities measurements, we
deduced the stiffness of the cavity, that is to say Kmeasured=2366 ± 103 N/mm. Calculations performed with two mechanical codes (i.e. ACORD-CP and SAMCEF software [10]) showed considerable differences. We found the following values: KACORD=3625 N/mm and KSAMCEF=3300 N/mm, that is to say a variation of +46% compared to the average value of 3465 N/mm.
This big variation was also observed for the Los Alamos [11] and Argonne [12] type spoke cavities (i.e. respectively +56% and +29%). Note: the measured value is always lower than that predicted. Therefore, we have to improve the model we used with these simulation codes, which does not take into account important details such as the weld beads or the niobium thickness change caused by the chemistry process, for instance.
Accelerating Field Profile Measurement Conventional bead-pull measurement method was used
to obtain the accelerating field profile on the cavity axis (see Figure 5).
Accelerating field profile
-1.0-0.8-0.6-0.4-0.20.00.20.40.60.81.0
5 10 15 20 25 30 35 40 45
cavity axis (cm)
Eac
c/E
max
Measurements MAFIA
Figure 5: Accelerating field profile.
We measured about sixty points and compared them with the profile given by MAFIA. As we said before, the field is similar on both gaps due to the very strong magnetic coupling between each cell of the cavity. By modelling the 2-gap cavity with its RLC equivalent circuit, one can calculate this coupling coefficient (Eq. 1):
(1)
where K is the coupling coefficient, fπ the frequency of the fundamental mode (π-mode) and fπ/2 the frequency of the harmonic (π/2-mode). With the frequencies fπ and fπ/2 of our spoke cavity, we found K=21% (compared, for instance, to a few percent for the elliptical cavities).
TESTS AT T=4.2K The β0.35 spoke cavity was tested 3 times this year
(respectively, in January, March and July 2003). All tests were done at 4.2K but we planned to perform a new test at 2K, in December, thanks to an upgrade of the cryogenic lines and the cryostat. As one can see on Figure 6 below, due to the large dimensions of the cavity, we had to build a new vertical cryostat.
A 200W RF power amplifier was used to feed power into the cavity. We used a capacitive coupling in two different conditions: i.e. in March, a fixed antenna attached to one of the beam tube and, in January and July, a movable coupler attached to the “nominal” coupler port. In both cases, transmitted power was picked up with a antenna attached to one of the radial port (see Figure 9).
Figure 6: New vertical cryostat during installation at
IPN/Orsay.
K211
ff
2+
=π
π
800 mm
Insulation vacuum pumping system
Passive (co-netic sheets) and active (4 coils) magnetic shielding
Proceedings of the 11th Workshop on RF Superconductivity, Lübeck/Travemünder, Germany
478 TUP55
Cavity Preparation The chemistry and the cleaning of the cavity were made
using the CEA/Saclay existing facilities. Buffered Chemical Polishing (BCP) (Figure 7) and High Pressured Rinsing system (HPR) with ultra pure water at 80 bars were used. For HPR, the cavity is spinning while the nozzle goes up and down inside the cavity (Figure 8). We turned over the cavity after a complete cycle of cleaning. The final assembly (i.e. the antenna, the coupler the pick up and the beam tube flanges) was done inside a class 100 clean room (also at CEA/Saclay, see Figure 9).
Figure 7: Spoke cavity into the acid bath.
Figure 8: HPR process.
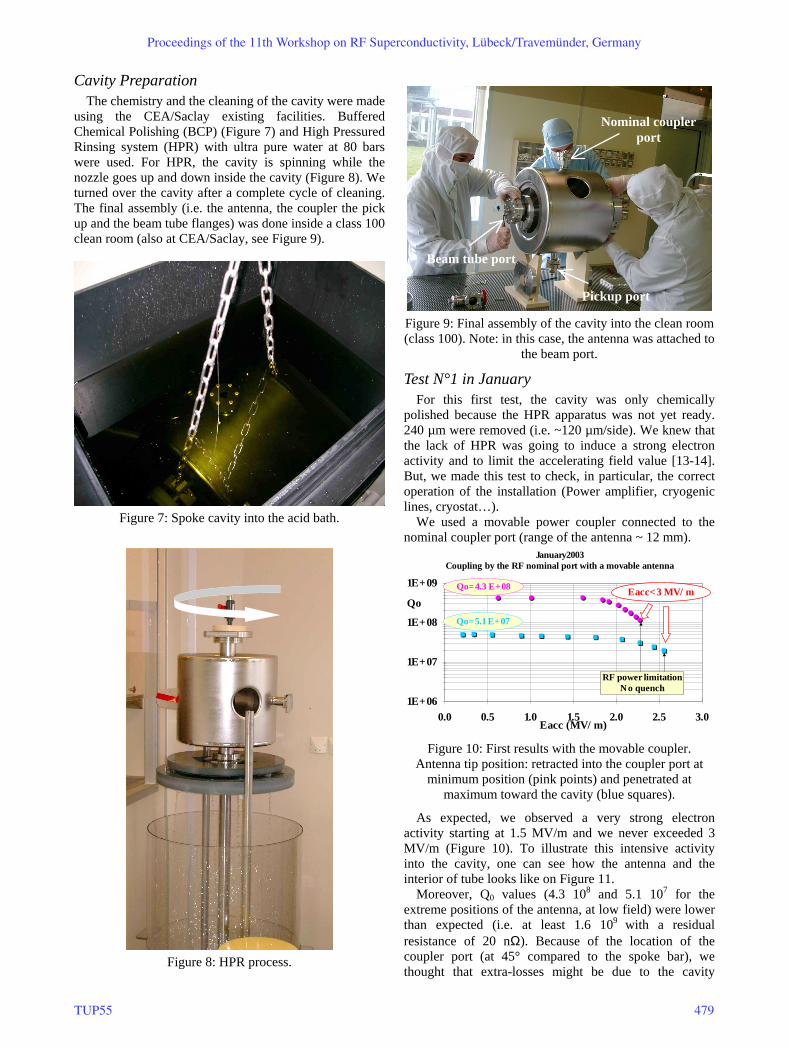
Figure 9: Final assembly of the cavity into the clean room (class 100). Note: in this case, the antenna was attached to
the beam port.
Test N°1 in January For this first test, the cavity was only chemically
polished because the HPR apparatus was not yet ready. 240 µm were removed (i.e. ~120 µm/side). We knew that the lack of HPR was going to induce a strong electron activity and to limit the accelerating field value [13-14]. But, we made this test to check, in particular, the correct operation of the installation (Power amplifier, cryogenic lines, cryostat…).
We used a movable power coupler connected to the nominal coupler port (range of the antenna ~ 12 mm).
January2003Coupling by the RF nominal port with a movable antenna
1E+06
1E+07
1E+08
1E+09
0.0 0.5 1.0 1.5 2.0 2.5 3.0Eacc (MV/m)
QoEacc<3 MV/mQo=4.3 E+08
Qo=5.1 E+07
RF power limitationNo quench
Figure 10: First results with the movable coupler.
Antenna tip position: retracted into the coupler port at minimum position (pink points) and penetrated at
maximum toward the cavity (blue squares).
As expected, we observed a very strong electron activity starting at 1.5 MV/m and we never exceeded 3 MV/m (Figure 10). To illustrate this intensive activity into the cavity, one can see how the antenna and the interior of tube looks like on Figure 11.
Moreover, Q0 values (4.3 108 and 5.1 107 for the extreme positions of the antenna, at low field) were lower than expected (i.e. at least 1.6 109
with a residual resistance of 20 nΩ). Because of the location of the coupler port (at 45° compared to the spoke bar), we thought that extra-losses might be due to the cavity
Beam tube port
Nominal coupler port
Pickup port
Proceedings of the 11th Workshop on RF Superconductivity, Lübeck/Travemünder, Germany
TUP55 479

magnetic field surrounding the antenna. Actually, at fixed input power level, we saw that the external quality factor changed when varying the position of the antenna whereas it should have been constant (Figure 12).
Figure 11: Pictures of the antenna (top) and the coupler
port tube (bottom).
External quality factor versus the antenna position inside the coupler port
1.E+07
1.E+08
1.E+09
1.E+10
0 5 10 15 20 25 30Position (mm)
Qext
Figure 12: Variation of the external quality factor versus
the antenna position. Note: the origin on x-coordinate represents the beginning of the tube.
Total cavity losses versus the antenna displacement
0
50
100
150
200
5 10 15 20 25Distance from the coupler port/cavity transition
(mm)
Tot
al lo
sses
(mW
)
Mesurements Mafia calculations Losses without magnetic field
Figure 13: Total losses into the cavity versus the position of the antenna. The input power was fixed to 170 mW.
More recently, we performed a MAFIA simulation in order to study the losses we measured during this test. As one can see on Figure 13, calculations explain these losses due to the magnetic field around the antenna tip.
This problem was affecting the design of our new prototype. That’s why, the power coupler port was shifted of 45° where there is no magnetic field at all (see Figure 16). We checked also that we could fed without difficulties the cavity through the port, at this specific location.
Test N°2 in March There were two principal differences with the first test:
• a complete cleaning with HPR process. • a fixed coupler attached to one of the beam
tube in order to avoid the extra-losses due to the magnetic field.
We reached 10.3 MV/m with a low-field Q0 value of
2.0 109. Strong electron activity started around 5 MV/m and we proceeded, in a few minutes, a “light” multipacting barrier around 1.5 MV/m. Helium processing allowed us to reach 12.2 MV/m without quenching (limitation came from the power amplifier). Cavity performances exceeded the XADS requirements of Eacc=6.2 MV/m at Q0=5 108.
March2003Coupling by the beam tube port with a fixed antenna
1.E+07
1.E+08
1.E+09
1.E+10
0 1 2 3 4 5 6 7 8 9 10 11 12 13Eacc (MV/m)
Qo
Before He processing After He processing
Multipacting
Qo=2.0 E+09
RF power limitationNo quench
Eacc=12.2 MV/m
XADS Goal
Figure 13: Results of the second test.
We measured also the Lorentz force detuning factor K. We found K=-5.6 Hz/(MV/m)2, which underlines the stiffness of the cavity.
Frequency shift versus Eacc²
fit functiony = -5.6x + 359178599.1
359177700359177800359177900359178000359178100359178200359178300359178400359178500359178600359178700
0 20 40 60 80 100 120 140Eacc² (MV/m)²
f (Hz)
Figure 14: Frequency variation versus Eacc2. The slope of the fit function gives the Lorentz force detuning factor K.
Sputtered particles of titanium coming from the end of the antenna
Proceedings of the 11th Workshop on RF Superconductivity, Lübeck/Travemünder, Germany
480 TUP55

At last, we studied the “100K” effect. After warming up the cavity between 80K and 100K during 67 hours, the
residual resistance grew up from 10 nΩ to 70 nΩ.
Test N°3 in July This test was carried out to complete the study on the
extra-losses which we measured during the first test and to validate the RF performances reached during the second one.
So, we saw the same variation of the external quality factor as depicted in Figure 12. Secondly, we reached 12.5 MV/m with a low-field Q0=4.8 108 (Figure 15). At this accelerating field value, the corresponding peak magnetic field is 103 mT. Again, the limitation was the RF power available but no thermal quench.
July 2003
Coupling by the nominal port with a movable antenna
1E+07
1E+08
1E+09
1E+10
0 1 2 3 4 5 6 7 8 9 10 11 12 13 14Eacc (MV/m)
Qo Eacc=12.5 MV/m
RF power limitationNo quench
Qo=4.8 E+08
Figure 15: Test results with the movable coupler.
CONCLUSION Tests performed on the β0.35 spoke cavity prototype
have demonstrated the great potential of this type of cavity in term of RF performances (Eacc=12.5 MV/m) and mechanical behavior (very low sensitivity to errors fabrication, good stiffness, accelerating field flatness…).
Figure 16: 2D drawing of the new prototype β0.15 spoke cavity.
A new prototype (β0.15, 350 MHz, 2-gap), equipped with a stainless steel helium tank, will be ordered in November. The main goals will be to validate the location of the power coupler (locaced at 90° compared to the spoke bar) and the new stiffening system (see Figure 16).
ACKNOWLEDGMENTS Authors would like to thank P. Maccioni, M. Gauthier
and M. Febvre from Cerca company, L. Grandsire from LAL/Orsay, A. Aspart, J.P Poupeau and Y. Gasser from CEA/Saclay.
REFERENCES [1] J-L. Biarrotte et al., “High intensity proton SC Linac using spoke cavities”, EPAC2002, Paris, France, June 2002. [2] EURISOL website: http://www.ganil.fr/eurisol [3] XADS website: http://www.neutron.kth.se:8001 [4] MAFIA Version 4.24, CST GmbH, Darmstadt, Germany. [5] ACORD-CP Version 3.0.10 [6] G. Olry & al, “Study of a spoke cavity for low beta applications”, SRF2001, Tsukuba, Japan, September 2001. [7] G. Olry, “RF design of the beta=0.35 spoke cavity: Amanda”, Workshop on the advanced design of spoke resonators, Los Alamos, USA, October 2002. [8] G. Olry, “Mechanical study of Amanda”, Workshop on the advanced design of spoke resonators, Los Alamos, USA, October 2002. [9] CERCA website: http://www.cerca.fr/index-uk.htm [10] SAMCEF website: http://www.samtech.fr/ [11] T. Tajima et al., “Test results of the LANL 350 MHz, beta 0.175, 2-gap spoke resonator”, LINAC2002, Gyeongju, Korea, August 2002. [12] T. Tajima et al., “Results of room temperature tests on ANL spoke cavity (340 MHz, beta 0.291)”, LANSCE division, Group LANSCE-1, LANSCE-1:01-044, April 2001 [13] M.P. Kelly et al., “Cold tests of a spoke cavity prototype for RIA”, PAC2001, Chicago, USA, June 2001. [14] M.P. Kelly et al., “High-pressure rinse and chemical polish of a spoke cavity”, SRF2001, Tsukuba, Japan, September 2001.
RF coupler port placed at
90°/spoke bar
New stiffener half-tube
Proceedings of the 11th Workshop on RF Superconductivity, Lübeck/Travemünder, Germany
TUP55 481