development of test platform of fpga interconnect...
TRANSCRIPT

i
DEVELOPMENT OF TEST PLATFORM OF FPGA
INTERCONNECT TO CAPTURE MARGINAL OPEN DEFECT
By
FAHMY HAFRIZ BIN MOHAMED SULTAN
A Dissertation submitted for partial fulfilment of the requirement for
the degree of Master of Science (Electronic Systems Design
Engineering)
August 2015

ii
Acknowledgement
First and foremost I would like to thank God for giving me the strength to
achieve my graduate degree. I would like to express my special appreciation and thanks
to my supervisor, Dr Zuraini Binti Dahari for giving me the opportunity to work under
her supervision, for encouraging my research and allowing me to grow through this
research activities. Your guidance has been priceless. I would also like to thank my
managers, Tan Kian Hong, Steve Ong and Pei Chen for keeping up my motivation and
encouragement on this research topic. To Altera colleagues, Yien Yien, Jia Tian, Zhi
Ying and Prem Kumar. I am thankful for all your valuable discussion on this research
topic.
A special thanks to my parents, friends and relatives who encouraged me to take
up this course and provide ideas to complete this research. A special thanks to my
beloved wife and daughter, who sacrificed so much for me and was always my support
in the moment that matters. And finally not to forget the Ministry of Education and
Altera Corporation Sdn. Bhd for the education funding.

iii
Table of Contents
Acknowledgement............................................................................................................. ii
Table of Contents ............................................................................................................. iii
List of Figures .................................................................................................................. vi
List of Tables.................................................................................................................... ix
List of Abbreviation .......................................................................................................... x
Abstrak ............................................................................................................................ xii
Abstract .......................................................................................................................... xiii
CHAPTER 1 ...................................................................................................................... 1
INTRODUCTION ............................................................................................................. 1
1.1 Background ........................................................................................................ 1
1.2 Problem Statements ............................................................................................ 2
1.3 Objectives ........................................................................................................... 3
1.4 Research Scope .................................................................................................. 4
1.5 Research Contribution ........................................................................................ 4
1.6 Thesis Organization ........................................................................................... 5
CHAPTER 2 ...................................................................................................................... 7
LITERATURE REVIEW.................................................................................................. 7
2.1 Introduction ........................................................................................................ 7
2.2 FPGA Architecture............................................................................................. 7
2.3 Interconnect Resource Routing ........................................................................ 13
2.4 IC Manufacturing Defect Background ............................................................. 17
2.5 Interconnect Delay Approximation .................................................................. 21

iv
2.6 Existing Stuck-At Interconnect Test ................................................................ 24
2.7 Register Scan Features for Interconnect Test................................................... 28
2.8 Interconnect At-speed Test .............................................................................. 35
2.8.1 Launch on Capture (LOC) ..................................................................... 37
2.8.2 Launch on Shift (LOS) .......................................................................... 39
2.9 Related Works on At-speed Test to Capture Marginal Open Defect ............... 44
2.10 Summary .......................................................................................................... 49
CHAPTER 3 .................................................................................................................... 50
DESIGN METHODOLOGY AND IMPLEMENTATION ........................................... 50
3.1 Introduction ...................................................................................................... 50
3.2 Research Framework ........................................................................................ 51
3.3 PLL Design ...................................................................................................... 53
3.4 At-speed Clock Network Design ..................................................................... 57
3.5 Scan Enable Pipeline Design ........................................................................... 62
3.6 Interconnect At-speed Test Pattern Generation ............................................... 65
3.7 Simulation ........................................................................................................ 69
3.8 Silicon Implementation .................................................................................... 72
3.8.1 Power Consumption .............................................................................. 74
3.8.2 Timing Consideration ............................................................................ 76
3.8.3 Optimum Frequency Determination ...................................................... 79
3.9 Summary .......................................................................................................... 81
CHAPTER 4 .................................................................................................................... 82
RESULTS AND DISCUSSION ..................................................................................... 82

v
4.1 Introduction ...................................................................................................... 82
4.2 Simulation Results ........................................................................................... 82
4.2.1 PLL Design Verification ....................................................................... 83
4.2.2 GCLK Burst Enable Verification .......................................................... 85
4.2.3 At-speed Clock Network Design Verification ....................................... 86
4.2.4 Scan Enable Pipeline Design Verification ............................................. 88
4.2.5 At-speed Pattern Simulation .................................................................. 90
4.3 Silicon Implementation Results ....................................................................... 95
4.3.1 Power Consumption .............................................................................. 96
4.3.2 Timing Issues ......................................................................................... 98
4.3.3 Optimum Frequency Determination .................................................... 102
4.4 Summary ........................................................................................................ 105
CHAPTER 5 .................................................................................................................. 107
CONCLUSION AND FUTURE RECOMMENDATION ............................................ 107
5.1 Introduction .................................................................................................... 107
5.2 Conclusion ..................................................................................................... 107
5.3 Future Recommendation ................................................................................ 109
REFERENCES ............................................................................................................... 111
APPENDIX A ......................................................................................................................
APPENDIX B ......................................................................................................................
APPENDIX C ......................................................................................................................
APPENDIX D ......................................................................................................................
APPENDIX E ......................................................................................................................

vi
List of Figures
Figure 2-1: Altera Stratix® V FPGA Architecture and Features (Altera, 2014) .............. 8
Figure 2-2: Types of Interconnects Routing ................................................................... 10
Figure 2-3: Detailed Routing Showing the Interconnect Wire Crossing the LAB Blocks
............................................................................................................................... 11
Figure 2-4: Types of PIPs ............................................................................................... 12
Figure 2-5: Multiplexer Design with CRAM Bit ............................................................ 14
Figure 2-6: Routing Graph .............................................................................................. 14
Figure 2-7: Basic Routing Algorithm ............................................................................. 16
Figure 2-8: Hard Defect and Marginal Defect ................................................................ 17
Figure 2-9: X-ray Image of an Open Defect (Elena, 2007) ............................................ 18
Figure 2-10: X-ray Image of Marginal Open Defect (Elena, 2007) ............................... 18
Figure 2-11: Bridging Fault ............................................................................................ 19
Figure 2-12: Stuck-At Routing Elements ........................................................................ 19
Figure 2-13: Marginal Open Delay Model...................................................................... 20
Figure 2-14: RC Delay Model for NMOS and PMOS (Weste and Harris, 2011) .......... 23
Figure 2-15: Equivalent Circuit for an Inverter (Weste and Harris, 2011) ..................... 24
Figure 2-16: ITG Routing ............................................................................................... 25
Figure 2-17: Interconnect Stuck-At Testing ................................................................... 26
Figure 2-18: Group of Interconnect Resources Configured Together ............................ 27
Figure 2-19: Detailed LAB Block Diagram with an Example of Routing Possibilities
(Altera, 2015) ......................................................................................................... 28
Figure 2-20: Interconnect Test Flow Using REGSCAN Features .................................. 30
Figure 2-21: Configuration Image to Route Source and Destination Registers.............. 31
Figure 2-22 : Common Multiplexer Based Scan Register (Gefu Xu and Singh, 2006) . 32
Figure 2-23: Test Input Data Loaded During REGSCAN Mode .................................... 32
Figure 2-24: Source Register Value Propagated to the Destination Registers during
USER Mode. .......................................................................................................... 34
Figure 2-25: Final Values Scanned Out to be Compared with Expected Values ........... 34
Figure 2-26: Interconnect At-speed Testing ................................................................... 37
Figure 2-27: Launch on Capture Concept ....................................................................... 38

vii
Figure 2-28: Launch On Capture Timing Diagram......................................................... 38
Figure 2-29: Launch On Shift Concept ........................................................................... 40
Figure 2-30: Launch On Shift Timing Diagram ............................................................. 41
Figure 2-31: (a) The Basic Scan Enable Circuit with Clock Alignment Logic (b) Timing
Diagram for the Circuit (Gefu Xu and Singh, 2006) ............................................. 42
Figure 2-32: Pipeline Scan Enable Register (Ahmed et al., 2005) ................................. 43
Figure 2-33: Distribution of Metal Open Resistance (Montanes, De Gyvez and Volf,
2002) ...................................................................................................................... 47
Figure 2-34: Distribution of Contact and Via Open Resistance (Montanes, De Gyvez
and Volf, 2002) ...................................................................................................... 48
Figure 2-35: Detection Marginal Defects in Interconnect with Different Branches
(Elena, 2007).......................................................................................................... 49
Figure 3-1: Research Framework .................................................................................... 51
Figure 3-2: Overall Test Architecture Design ................................................................. 52
Figure 3-3: Basic PLL Block (Altera Phase-Locked Loop IP Core User Guide, 2015) . 54
Figure 3-4: GCLK Networks in Stratix® V Devices ...................................................... 58
Figure 3-5: GCLK Multiplexer Simplified Diagram ...................................................... 59
Figure 3-6: Hierarchical Clock Networks in Each Spine Clock Per Quadrant (Altera,
2015) ...................................................................................................................... 59
Figure 3-7: At-speed Clock Network Block Diagram .................................................... 60
Figure 3-8: GCLK Burst Mode Circuitry........................................................................ 61
Figure 3-9: Launch-on-shift transition test timing .......................................................... 63
Figure 3-10: Existing REGSCAN Enable Circuit ........................................................... 63
Figure 3-11: Launch on Shift DFT Circuit Implementation ........................................... 64
Figure 3-12: Registers Arrangement and At-speed Data Flow ....................................... 65
Figure 3-13: Interconnect At-speed Test Using REGSCAN features ............................. 70
Figure 3-14: FlowManager VCS ..................................................................................... 71
Figure 3-15: Vector Display Window Showing Scanned Out Register Values .............. 72
Figure 3-16: Overall Silicon Test Setup on ATE ............................................................ 73
Figure 3-17: Setup and Hold Time Requirement ............................................................ 77
Figure 3-18: Marginal Open Transition Delay Fault Detection ...................................... 80
viii
Figure 4-1: (a) Overall PLL Design Overall Signal and (b) Detailed Close Up on the
Reference and PLL Output Clock.......................................................................... 84
Figure 4-2: PLL Settings on OmniMap .......................................................................... 85
Figure 4-3: GCLK Burst Circuitry Simulation Results................................................... 86
Figure 4-4: Actual Routing Generated by OmniMap Showing PLL, GCLK, SCLK and
RowCLK0 Routing ................................................................................................ 87
Figure 4-5: At-speed Clock Network Simulation Results .............................................. 88
Figure 4-6: Simulation Results for Scan Enable Pipeline Design .................................. 89
Figure 4-7: Interconnect At-speed Test Pattern Coverage .............................................. 90
Figure 4-8: Passing Registers Information from Vector Display Debug Tool ............... 92
Figure 4-9: Regscan Map to Identify Routing Under Test Destination Registers .......... 92
Figure 4-10: OmniMap View of Source and Destination Registers ............................... 93
Figure 4-11: Cadence Schematic overview of the LAB and M20k Block ..................... 93
Figure 4-12: Overall Launch and Capture Simulation on Destination Register ............. 94
Figure 4-13: Voltage Fluctuation Due to High Power Consumption ............................. 96
Figure 4-14: Short Interconnect Path Causing Hold Time Issue .................................... 99
Figure 4-15: (a) First Part (b) Second Part of Long Interconnect Path Causing Setup
Time Issue ............................................................................................................ 100
Figure 4-16: Frequency Performance at Minimum and Maximum Voltage Specification
............................................................................................................................. 104

ix
List of Tables
Table 2-1: Truth Table of the Scan Enable Alignment Circuit ....................................... 43
Table 2-2: LOC and LOS Characteristics ....................................................................... 46
Table 3-1: PLL Design Variables ................................................................................... 55
Table 3-2: PLL Block Interface Ports ............................................................................. 56
Table 3-3: Clock Network Elements ............................................................................... 60
Table 3-4: Commands Used for Interconnect At-speed Test Development ................... 67
Table 4-1: Trial Sequence and Voltage Fluctuation Appearance ................................... 97
Table 4-2: Customer and Factory Voltage Specifications .............................................. 98
Table 4-3: Interconnect At-speed Test Pattern Performance ........................................ 105

x
List of Abbreviation
Abbreviation Meaning
ATE Automated Test Equipment
ATPG Automated Test Pattern Generation
CPU Central Processing Unit
CRAM Configuration Random Access Memory
DFT Design For Test
DSP Digital Signal Processor
DUT Device Under Test
FPGA Field Programmable Gate Array
GCLK Global Clock
HSSI High Speed Serial Interface
IC Integrated Circuit
IO Input Output
IP Intellectual Property
LAB Logic Array Block
LOC Launch On Shift
LOS Launch On Shift
LUT Look Up Table
M20K 20 Kilo Byte Internal Memory Block
MHz Mega Hertz
MOSFET Metal Oxide Semiconductor Field Effect Transistor
µs Micro Second

xi
mV Mili Voltage
NMOS Negative Channel Metal Oxide Semiconductor
PFD Phase Frequency Detector
PIP Programmable Interconnect Point
PLL Phase Locked Loop
PMOS Positive Channel Metal Oxide Semiconductor
REGSCAN Register Scan
RowCLK Row Clock
RTL Register Transfer Level
SCLK Spine Clock
SE Scan Enable
SRAM Static Random Access Memory
TCL Tool Command Language
TD Test Development
TDF Transition Delay Fault
V Voltage
VCO Voltage controlled Oscillator
VCS Verilog Compiler Simulator
VLSI Very Large Scale Integration
WUT Wire Under Test

xii
PEMBANGUNAN PELANTAR UJIAN LITAR SALINGHUBUNG
FPGA UNTUK MENGESAN LITAR TERBUKA MARGINAL
Abstrak
Kajian ini menekankan pembangunan pelantar ujian litar salinghubung FPGA
untuk mengesan litar terbuka marginal dalam peranti Stratix® V. Keperluan untuk ujian
secara laju ini disebabkan oleh peningkatan jumlah kecacatan rintangan terbuka, akibat
daripada komplikasi proses pembuatan transistor yang semakin mengecil menuju skala
nanometer (nm). Kecacatan ini tidak dapat dikesan oleh ujian yang sedia ada semasa
operasi pembuatan dan kajian ini menggunakan pelancaran bit semasa peralihan (LOS)
untuk mengesan kecacatan marginal. Dalam pelaksanaan kajian ini, beberapa reka
bentuk yang unik dilaksanakan untuk menjana isyarat jam secara laju dan isyarat
pemboleh imbas saluran data untuk menyokong kaedah LOS. Sementara itu, keupayaan
untuk menguji litar salinghubung pada frekuensi tinggi memerlukan pembolehubah
untuk mengawal jarak laluan yang perlu diuji dan mengawal penggunaan kuasa peranti.
Pemboleh ubah ini dan metodologi perlaksanaan ujian ini dibincangkan dengan teliti di
dalam kajian ini. Ujian secara LOS dalam kajian ini dapat mengesan 81 % daripada
keseluruhan sumber salinghubung secara berkesan. Ujian ini juga telah berjaya
mengesan kecacatan ini pada frekuensi sehingga 400 MHz dan terbukti ujian ini sensitif
pada kelewatan data yang perlu dikesan. Keupayaan untuk mengesan kecacatan dengan
hanya 0.56 kΩ rintangan adalah lebih baik daripada sasaran 3 kΩ pada awal kajian ini.
Ia juga adalah lebih baik daripada kesusasteraan lain dengan sasaran dalam lingkungan 6
kΩ to 10 kΩ sahaja.

xiii
DEVELOPMENT OF TEST PLATFORM OF FPGA
INTERCONNECT TO CAPTURE MARGINAL OPEN DEFECT
Abstract
This research highlights the development of test platform of FPGA interconnect
to capture marginal open defect on Altera® Stratix V devices. The need for at-speed test
was due to the increasing number of marginal open defects, resulting from
manufacturing process complexity anticipated from continuously shrinking transistors
towards nanometer (nm) scale. The defect was unable to be captured by current stuck-at
test and this research utilized the Launch on Shift (LOS) transition delay method to
detect the marginal open defects. Towards the final implementation, there are few
unique design implemented in order to generate the at-speed clocks and the pipelined
scan enable signals to support LOS method. Meanwhile, the ability to test the
interconnect on at-speed frequency required new routing tool control variables to limit
the interconnect path lengths and device power consumption. The control variables are
discussed further in this research. The LOS test patterns used in this research managed
to cover up to 81% of the overall routing resources for marginal open defect effectively.
Furthermore, the test was successfully implemented at frequencies up to 400 MHz and
proven to be sensitive to routing delay to capture marginal open defects. The ability to
capture the defect with only 0.56 kΩ resistance is better than the initial 3 kΩ target in
this research. It is also better than other literatures which targeted between 6 kΩ to 10
kΩ only.

1
CHAPTER 1
INTRODUCTION
1.1 Background
The Field Programmable Gate Array (FPGA) is an Integrated Circuit (IC) that
can be programmed after fabrication for unlimited number of times (Renovell et al.,
2000). FPGA meets many of the requirements necessary for next generation products
due to its flexible design. A single device can be used in many applications ranging from
digital networking, display, military, medical, automotive and many others. Due to its
programmable nature, it also allows rapid prototyping of a design which shorten the
time to market and allows the ability to reprogram the final product in the field
remotely.
As they continue to evolve, the latest FPGA families are integrating various
other intellectual properties (IP) to provide more functions while lowering the cost and
power consumption. Today, the FPGA fabrics are getting more complicated and consist
of various combinations of Logic Array Blocks (LAB), Memories, Digital Signal
Processors (DSP), high speed transceivers, high speed input outputs, and routing
network. The routing network, also known as the interconnect plays an important role in
connecting various IP blocks to function as a complete design. However, the continuous

2
shrinking of die size towards nanometer designs, increased number of interconnect
layers and gate density have given rise to manufacturing complexity (Wu et al., 2011).
Moreover, the manufacturing complexity directly increases the chances of high
manufacturing defect which contributes to timing errors due to marginal open defect
(Gefu Xu and Singh, 2006). The FPGA manufacturing test is also complicated due to
the fact that their interconnections are programmable as it should be tested in all the
possible form of functional operations (Stroud et al., 1996). Furthermore, the
interconnect resources consist of 80% to 90% of the overall die layout (Elena, 2007;
Chamelar, 2004; Marrakchi et al., 2009) and this shows that the interconnect test is very
crucial to screen for manufacturing defects (Yoneda et al., 2011). The defects are not
always detected with the conventional static-based tests, also known as stuck-at tests.
This research will explore the possibilities of capturing the resistive or marginal open
defects by transitioning the test input data patterns. The transition should be tested at the
actual speed of interconnect network design. In industrial term, the actual speed test is
known as at-speed testing.
1.2 Problem Statements
Marginal open failure is an important defect to be captured in the latest advanced
semiconductor industry due to the manufacturing process and material complexity
(Marrakchi et al., 2009). Unlike the common open defect in which the connections
between two nodes are totally broken, the marginal open defect is resistive and
3
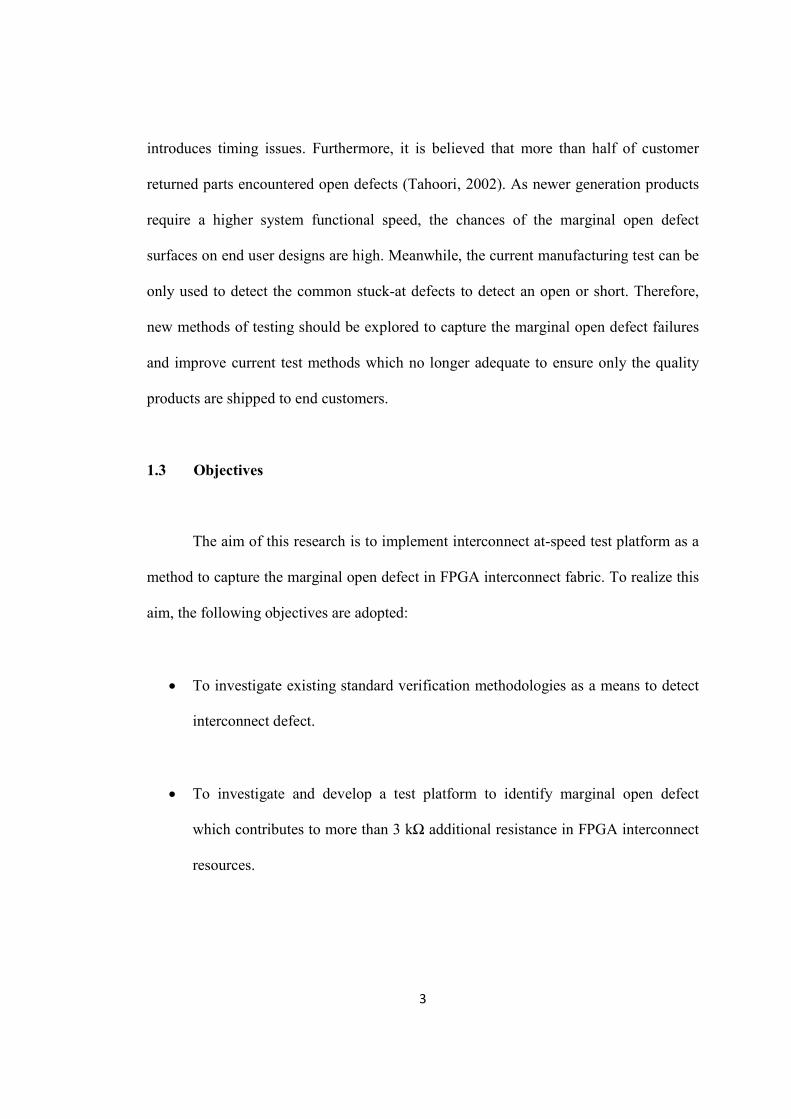
introduces timing issues. Furthermore, it is believed that more than half of customer
returned parts encountered open defects (Tahoori, 2002). As newer generation products
require a higher system functional speed, the chances of the marginal open defect
surfaces on end user designs are high. Meanwhile, the current manufacturing test can be
only used to detect the common stuck-at defects to detect an open or short. Therefore,
new methods of testing should be explored to capture the marginal open defect failures
and improve current test methods which no longer adequate to ensure only the quality
products are shipped to end customers.
1.3 Objectives
The aim of this research is to implement interconnect at-speed test platform as a
method to capture the marginal open defect in FPGA interconnect fabric. To realize this
aim, the following objectives are adopted:
• To investigate existing standard verification methodologies as a means to detect
interconnect defect.
• To investigate and develop a test platform to identify marginal open defect
which contributes to more than 3 kΩ additional resistance in FPGA interconnect
resources.

4
1.4 Research Scope
FPGA Interconnect covers a large range of design blocks, this research scope is
limited to the external interconnects towards the interface of IP blocks such as Logic
Array Block (LAB), Digital Signal Processor (DSP) and Memory. The IP functionality
will not be covered in this research as it is assumed that the IP block’s functionality will
be covered in their respective test coverage. The research focus on the interconnect
resource delay testing using synchronous digital circuits such as flip-flop or registers.
The research also confined to a single device and the concept should be applicable to
future generation of Altera® product families. This allows better focus on the test
implementation strategy.
1.5 Research Contribution
This research will present the implementation of the interconnect at-speed testing
for routing resources in Stratix® V FPGA. The DFT implementation, pattern generation
and actual silicon implementation of interconnect at-speed test are presented.
Furthermore, practical measures of at-speed test pattern generation have been discussed
in this research.
The ability to test the timing of interconnect at-speed pattern requires the
development of new control variables such as PATH_LENGTH, POWER_FACTOR
and MAX_PATH_TO_ROUTE. This research will discuss these new control variables,
5
manufacturing challenges as well as lessons learned based on the 28nm Stratix® V test
development. Finally, this research will provide recommendations to proliferate the
interconnect at-speed test solution across the FPGA product families to achieve the
desired quality test standard.
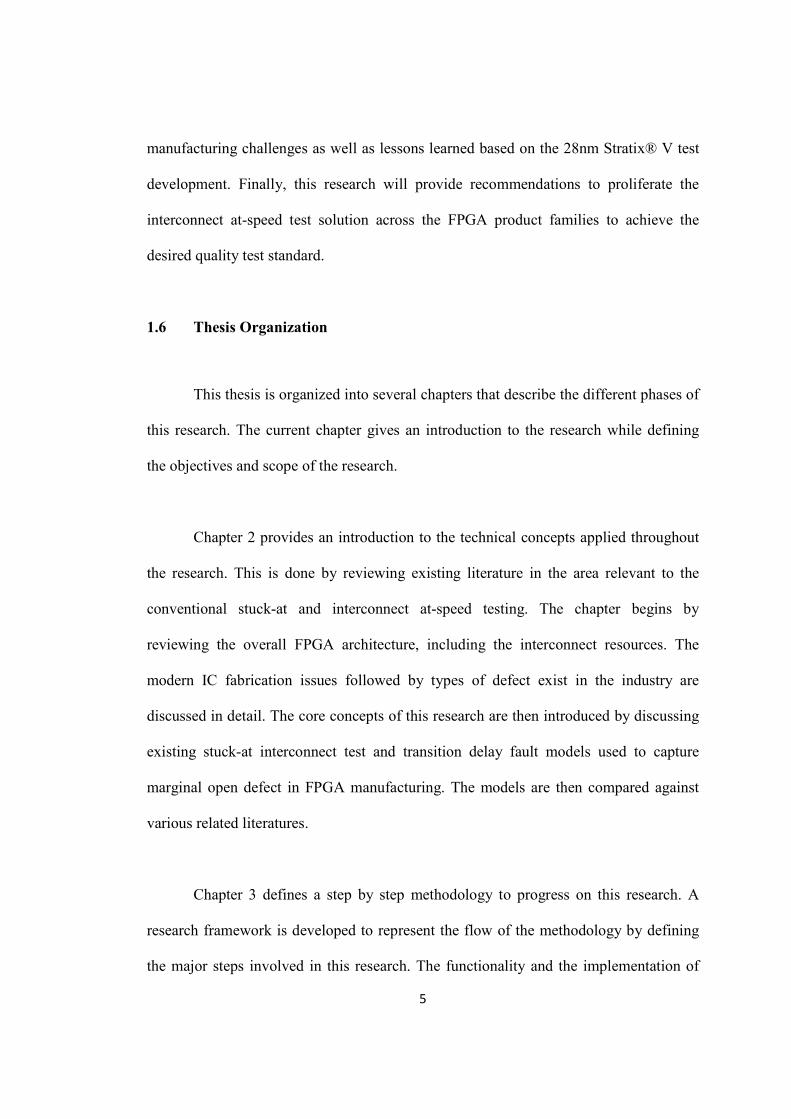
1.6 Thesis Organization
This thesis is organized into several chapters that describe the different phases of
this research. The current chapter gives an introduction to the research while defining
the objectives and scope of the research.
Chapter 2 provides an introduction to the technical concepts applied throughout
the research. This is done by reviewing existing literature in the area relevant to the
conventional stuck-at and interconnect at-speed testing. The chapter begins by
reviewing the overall FPGA architecture, including the interconnect resources. The
modern IC fabrication issues followed by types of defect exist in the industry are
discussed in detail. The core concepts of this research are then introduced by discussing
existing stuck-at interconnect test and transition delay fault models used to capture
marginal open defect in FPGA manufacturing. The models are then compared against
various related literatures.
Chapter 3 defines a step by step methodology to progress on this research. A
research framework is developed to represent the flow of the methodology by defining
the major steps involved in this research. The functionality and the implementation of

6
each component of the DFT design features will be discussed in detail. This chapter also
discusses the tools and equipment used to implement the design. This chapter concludes
with multiple design integration to support interconnect at-speed test implementation.
Simulation and actual silicon implementation results are discussed in Chapter 4.
This chapter starts with the simulation results where the test feature functionality of the
designs are verified. Furthermore, the design also implemented in an actual silicon test
environment and tested for reliability. Towards the end of the chapter, the reliability and
the challenges of the test implementation will be discussed with various voltage and
operating frequency.
Finally, Chapter 5 involved the final conclusion and recommends future works
that can be conducted in this area. It summarizes the findings and contributions of the
research while some ideas and recommendation are proposed.

7
CHAPTER 2
LITERATURE REVIEW
2.1 Introduction
This chapter explores the existing literature on standard methods to detect FPGA
interconnect defects. A discussion of modern FPGA design architectures initiated to
understand the major components and interconnections between circuit blocks on entire
device. Current FPGA interconnect test shows limitations of testing at unknown
transition speed which is not optimized to capture trending marginal open defect. The
existing stuck-at test design is shown in detail while some proposals from existing
literature on at-speed test methodology were examined for effectiveness and design
practicality. Finally, the design implementation ideas from various papers are discussed
and considered for this research.
2.2 FPGA Architecture
Static Random Access Memory (SRAM) FPGA which can be programmable are
the most common FPGA that allows their interconnection to be modified in the field
(Renovell et al., 2000; Khellah, Brown and Vranesic, 1994). In most of the literature, a
basic FPGA consist of 3 main elements. They are Logic Array Block (LAB),

8
Interconnects and Input Output (IO) pins. However, recent advancement of the FPGAs
from Altera® and Xilinx® integrated other blocks such as memories, Digital Signal
Processors (DSP), Phase Locked Loop (PLL), high speed transceivers and even hard
processors into their architecture which drastically reduced the physical size of the final
circuit board design. Figure 2-1 shows the Altera Stratix® V FPGA device architecture
used in this research (Altera, 2014).
Figure 2-1: Altera Stratix® V FPGA Architecture and Features (Altera, 2014)
A LAB or core logic fabric contains Look Up Tables (LUT) connected with
multiplexers, flip flops and logic gates (Renovell et al., 2000). Variable-precision DSP
blocks provides features to perform complex multiplication to support complicated
embedded system deployment. M20K internal memory block shown in the Figure 2-1, is
the internal memory blocks that can be used to supplement the FPGA system design.
Other hard IP blocks such as Gigabit Ethernet PCS, PCI Express, high speed serial

9
transceivers and PLL are also embedded in modern FPGAs. Embedded system
engineers use softwares such as Altera® Quartus or Xilinx® ISE to program the FPGA
according to their design needs. Complicated designs can be constructed by using the
tools provided by the software. Usually, the FPGA design engineer should not worry
about the optimal routing between the LABs or to other blocks since the accompanied
tools can be used to route the wires based on the design provided by the designer.
A Stratix® V FPGA is a typical island style FPGA which contains multiple tiles
grouping an interconnect resources and LAB/M20K/DSP IP blocks (Harris and Tessier,
2002). It is basically a series of IP blocks with a lot of interconnection resources in
between. The IP blocks are all arranged in a large M x N array as shown in Figure 2-2
and the interconnection organized as row and column wires can be programmed based
on its routability. It may cross over the entire row or column of the device or only a
small segment covering a few IP blocks in a segmented area shown in Figure 2-2. A
typical FPGA design implementation requires a combination of wire traces and
switching resources to form a connection between various IP blocks.
The wires are fabricated in various designs to optimize routing performance. In
Stratix® V, there are 5 types of wires in various lengths and directions. They are V4,
V14, H3, H6 and H24. The first prefix H or V on the wire denotes whether it is
horizontally routed (H) or vertically routed (V). While the numbers after the prefix
denotes the length of the wires in terms of the number of IP row or column it crosses.
For example H6 wires travels 6 IP blocks horizontally.

10
Figure 2-2: Types of Interconnects Routing
Meanwhile, Figure 2-3 shows close up detail of the interconnect wires. It also
explains how a LAB block could be able to connect to another LAB block utilizing the
interconnect fabrics. The output of a LAB will go through a Programmable Interconnect
Point (PIP) located at the edge of the yellow lines shown in Figure 2-3. The PIP also
referred as a switch matrix in some literatures.
The routing to the various IP blocks can be achieved by utilizing the PIP which
connects the wires to either an input of an IP block or to other wires of interconnects.
The edge refers to PIP shown in Figure 2-3 consists of multiplexers which are
programmable using Configuration Random Access Memory (CRAM) bits. The CRAM
configuration required to configure the direction of the signal propagation. The term
edge is used by the software team to represent all the possible routing in a particular
multiplexer attached to the CRAM setting. The router uses the information from the
available routing database to connect between fan in and fan out resources. The routing
database contains information about each and every resources available in the device
and its possible connections.
Legend
Row Interconnect Column Interconnect
LAB/M20K/DSP Blocks
Segmented Interconnects

11
Figure 2-3: Detailed Routing Showing the Interconnect Wire Crossing the LAB Blocks
The horizontal and vertical wires can be connected using the PIP to form a
complete signal source to destination path. There are many types of PIPs in FPGA
architecture as shown in Figure 2-4 such as break-point PIP, cross-Point PIP, compound
cross-point and multiplexer PIP. Break-point PIP connects or disconnects two wires,
cross-point allows turning left, right, top or bottom directions. More complex compound
cross-point PIP utilizes 6 break-point PIP to route two different signals. However,
Stratix® V devices utilize multiplexer PIP which is most commonly used in modern
FPGAs where only one output can be propagated out of N-inputs (Wang, Stroud and
Touba, 2008).
Programmable
Interconnect
Point (PIP)
Edges

12
(a) Break-point
(b) Cross-point
(c) Compound Cross-point
(d) Multiplexer
Figure 2-4: Types of PIPs
The main purpose of an interconnect test is to cover all the resources from the
routing wires, buffers and routing multiplexers associated with a path that should be
tested. The path may originate and terminate from any of the LAB, M20K and DSP IP
blocks which contains registers that can hold or capture a test value. In the later sections
in this chapter, the common methods used to route and test the interconnect resources
will be discussed in detail.

13
2.3 Interconnect Resource Routing
Multiple interconnect resources in an FPGA device discussed in previous section
need to be connected together in order to be tested for successful signal propagation.
Therefore, the FPGA should be configured to obtain desired register to register
connection before applying any test patterns (Stroud et al., 1998). Therefore, the routing
between the source and destination registers should be defined and programmed into the
FPGA. The routings are achieved by multiple combinations of wires and edges. An edge
is defined as any In → Out connection of a switch box multiplexer. For example a 4:1
multiplexer with inputs [A:D] and output F has 4 edges – A→F, B→F, C→F and D→F.
An edge contains information on the fan in and fan out resources together with its
CRAM values to turn on a particular resource path. Each edge represents a
possible/potential connectivity, i.e. between the two nodes using various Configuration
Random Access Memory (CRAM) bit combinations as shown in Figure 2-5. The
CRAM bits are organized in an array of SRAM memory cells embedded in the device to
support routing and device configuration features. CRAM bits are required in order to
turn on the path through the multiplexer. The figure also shows an example of multi
stage multiplexer which is used to connect multiple interconnect wires.
The FPGA contains a large number of multiplexers to connect the interconnect
wires which is represented by edges. The largest Stratix® V device involves around 155
million edges. In order to provide a more structured format of representing the edges for
software interface, the multiplexer routing architecture with edge information is

14
represented by a routing graph shown in Figure 2-6 below. Each node of the routing
graph represents a routing resource in FPGA such as input pins, output pins or wires
(e.g. three column wide horizontal (H3), four row height vertical (V4) lines and etc).
Figure 2-5: Multiplexer Design with CRAM Bit
Figure 2-6: Routing Graph
The presence of multiple fan ins in a routing graph implies a multiplexer. A large
group of multiplexer and its connections forms an ultimate graph called routing
database. A routing tool will be required to connect the resources for desired coverage.

15
The purpose of generating a routing database is to guide the routing tool to configure the
patterns based on the edge information provided and thus allows to test every
interconnect piece for stuck-at and continuity faults. Every device has its own routing
database that needs to be loaded into routing tool during routing and interconnect pattern
generation.
Since the test configuration image programming consumes more test time than
the actual test pattern application, the router should cover as much as routing as possible
in a single configuration and reduce the total number of configuration needed for the
overall coverage (Chmelar, 2004; Renovell et al., 2000). The ultimate goal of a router is
to route as much as interconnect resources while minimizing the test configuration
patterns. Furthermore, the extra configuration patterns due to routing inefficiency
indirectly increases the test cost due to test time increase (Smith, Xia and Stroud, 2006).
Figure 2-7 shows the basic routing algorithm flow on generating a routing
between two registers. The routing starts with an edge defined in the edge list file. The
edge list file contains all the edges available in the device. Then it will attempt to route
the edge to a destination and source register with a combination of other edges along the
path. The edges covered along source to destination will be marked as covered and will
not be used in the following configuration. A special mechanism is also embedded in the
routing tool to avoid routing the resources that have been already covered on previous
patterns. The algorithmic method together with this mechanism ensures that the
coverage is optimized. Naturally, the routing coverage saturates as the pattern number

16
increases, this is because as most of the resources has been already covered, the routing
algorithm have more difficulties to route the remaining uncovered path.
Figure 2-7: Basic Routing Algorithm
Load Edge File
Edge List Empty?
Pick an edge and attempt
to route to a destination
No
Successful?
Attempt to route the Edge
to a source
Yes
Successful?
Mark all edges involved
from source to destination
as covered
Yes
Edge List Empty?
Copy templist to Edgelist
and Increment to next
pattern
Yes
Move the edge to
templist
NoNo
End
Yes

17
2.4 IC Manufacturing Defect Background
The previous section discussed on the routing methodology used to implement
the interconnect test. This section however, highlights on the types of common defect
found in modern IC manufacturing industry. As the IC manufacturing industries adopts
new process technology to meet higher performance together with area and power
reduction challenges, a random defect may manifest as hard and or marginal open
defects. Hard defects such as stuck-at logic 0 or 1 failures are dominant, but marginal
defects must also be covered to ensure quality with current contemporary fabrication
process. The wiring traces are prone to marginal defects as the industry approaches
nanometer (nm) scale fabrication.
Figure 2-8 shows an illustration of hard and marginal defect that could occur on
IC manufacturing line. The figure also shows that the marginal defect traces are
connected but the wire can be thin enough to affect the signal propagation speed. Figure
2-9 and Figure 2-10 shows x-ray images of an open defect and marginal defect
respectively in silicon IC fabrication.
Figure 2-8: Hard Defect and Marginal Defect

18
Figure 2-9: X-ray Image of an Open Defect (Elena, 2007)
Figure 2-10: X-ray Image of Marginal Open Defect (Elena, 2007)
Other types of defect such as bridging fault are defects that were unintentionally
connected to two or more adjacent parallel wires (Elena, 2007). Bridging fault can be
detected by alternating binary values across the parallel wire segment connected to the
switching matrix. Similar patterns also can detect stuck-at defects. Figure 2-11 shows a
graphical illustration of bridging fault where WUT 2 and WUT 3 are unintentionally
connected.

19
Figure 2-11: Bridging Fault
Stuck-at fault is a defect where the wires are stuck to a low or high logic state
during interconnect test as shown in Figure 2-12. The first WUT is stuck to 0 (ground)
while the last WUT is stuck to 1 (Vss). It can be detected by applying a stimulus of high
or low logic and compare the expected logic on the other side of the interconnect
network. An interconnect test also detects open defect when the values propagated
through the WUT is not propagated and captured on the destination side.
Figure 2-12: Stuck-At Routing Elements
Fin
al
De
sti
na
tio
n
So
urce
Fin
al
De
sti
na
tio
n
So
urc
e

20
The resistive open could happen in any of the following interconnection wires,
transistors and multiplexers. The resistive open defect can be captured by measuring the
propagation delay since additional resistance contributes to delay (Elena, 2007). The test
development for interconnect at-speed testing will be optimized to perform at
approximated delay caused by the interconnect and switching elements. Figure 2-13
shows the marginal open delay model, if there are additional delay on top of the
interconnect routing delay, the routing is assumed to be impacted by resistive defect.
This is the reason why the marginally open defects are also called resistive open defects.
Figure 2-13: Marginal Open Delay Model
The functionality can be verified by measuring the time it takes for the
transitioning signal to propagate from the source to destination register. In this way the
timing performance can be tested by allowing a constrained time interval between
launch and capture. This method is referred as at-speed test, which will be discussed
further in Section 2.8. The open and stuck-at defect can be also detected using at-speed
test. Furthermore, Section 2.8 will also highlight the two common transition delay fault
models discussed on most of the literatures.
Defect

21
2.5 Interconnect Delay Approximation
The stuck-at fault model is used to generate tests for hard defects, while marginal
defect coverage requires use of the transition delay models. The marginal defect causes
the signal propagation to slow down and can be captured by propagating a transition on
the WUT and examine the propagation speed. Besides the marginal defect which causes
the signal to propagate slower, the speed performance is affected by 2 main factors:
propagation delay in programmable interconnects (wire and multiplexers that used to
connect the IP blocks) and combinational path within an IP block (Khellah, Brown and
Vranesic, 1994; Wang, Stroud and Touba, 2008).
The interconnect resource delay can be estimated from the resistance and
capacitance of the interconnect resources using the RC Delay equation shown in Eq.
(2.1) (Weste and Harris, 2011). The equation is not accurate compared to circuit level
simulation, but it is good enough to understand the concept of marginal open defect. The
resistance and capacitance are depending on the trace width and length. The resistance
of any material can be computed using Eq. (2.2). Eq. (2.2) also shows that the resistance
is inversely proportional to the cross sectional area of the trace. Thus, whenever there is
a reduction in the interconnect cross sectional area, the resistance increases. Referring
back to Eq. (2.1), the propagation delay increases proportionally as the resistance
increases due to the abrupt reduction in the cross sectional area of the interconnect trace.

22
TDelay = R x C (2.1)
R =
(2.2)
Where
TDelay = Propagation delay.
R = Trace resistance.
C = Trace Capacitance.
ρ = Material resistivity constant.
A = Cross sectional area
L = Trace Length
FPGA transition delay test implementation is complex due to the desire to cover
all the possible routing resources with various timing specifications due to several
different trace lengths, which has unique resistance and capacitance (Stroud et al., 1996;
Harris and Tessier, 2002). To complicate this further, the FPGA routing path length
varies depending on the routing and it is difficult to fix an operating frequency for the
test. Every unique path has various operating speeds and the pattern generation needs to
be strategized accordingly.
Furthermore, all the routing elements that are usually constructed using Metal
Oxide Semiconductor Field Effect Transistor (MOSFET) which has significant series
resistance and parasitic capacitance that could also contribute to the overall delay

23
(Weste and Harris, 2011). Each and every PIP multiplexer are constructed with multiple
MOSFET which contributes to overall delay. The variety of operating frequency is also
due to multiple pass gates, bend switches and buffers along the path that could
contribute to delay (Khellah, Brown and Vranesic, 1994). Figure 2-14 shows the RC
delay model for N-type NMOS and P-type PMOS MOSFET which contains some
resistance on their nodes, the k values shown in the figure are the technology dependent
parameter. Meanwhile, double inverter usually used in CMOS design to construct a
buffer. Figure 2-15 shows an inverter designed with NMOS and PMOS devices which
forms an equivalent RC delay approximation circuit. The model only considers the R
and C values on the output; therefore the non-switching capacitors will be ignored in the
model. Hence, during the interconnect test routing, all the non-defect propagation delay
factors need to be factored into determining the final operation frequency. The path with
large number of interconnect resources will need to consider all these non-defect delays.
Figure 2-14: RC Delay Model for NMOS and PMOS (Weste and Harris, 2011)
kg
s
d
g
s
d
kCkC
kCR/k
kg
s
d
g
s
d
kC
kC
kC
2R/k
NMOS PMOS

24
Figure 2-15: Equivalent Circuit for an Inverter (Weste and Harris, 2011)
2.6 Existing Stuck-At Interconnect Test
The next two sections introduce the existing stuck-at interconnect test
methodology to provide an overall idea of the routing and data scanning methods which
is common in both stuck-at and interconnect at-speed test. The stuck-at and interconnect
at-speed test are only differ in terms test vector application. Hence, it is necessary to
review the stuck-at interconnect coverage methodology before proceeding with at-speed
methodology.
A stuck-at fault is commonly due to short or open of the wires due to
manufacturing process. The stuck-at fault also caused by defective PIP. The connected
path will be stuck-at logical 0, 1 or X if the defect symptom persists. In order to capture
the defect, the stuck-at fault Interconnect test covers the stuck-at fault by sending both
‘0’ and ‘1’ from a source to a destination register through interconnect at different times
and check if the value are propagating properly. If the value propagates to the