dhs scorecard data dictionary q1-2017 - state of oregon ... · dhs scorecard data dictionary ......
TRANSCRIPT

DHS SCORECARD DATA DICTIONARY
Updated June 2017
Contents Priority 1 – Every Oregon child and youth in our care deserves to grow up safely ................................................. 1
Priority 2 – Every Oregon adult lives safely – free from abuse, neglect and financial exploitation...................... 10
Priority 3 – Every Oregonian lives as independently as possible – with dignity, choice and self-determination 16
Priority 4 – Every Oregonian can work to the best of their abilities to contribute to their family and their
community ................................................................................................................................................................. 21
Priority 5 – All Oregonians deserve efficient and effective services from DHS ..................................................... 29

1
Priority 1 – Every Oregon child and youth in our care deserves to grow up safely
DHS Scorecard MeasureDHS Scorecard MeasureDHS Scorecard MeasureDHS Scorecard Measure Program Program Program Program
AreaAreaAreaArea
Measure OwnerMeasure OwnerMeasure OwnerMeasure Owner
1.1 Child Re-abuse Rate CW Laurie Price
1.2 Child Abuse Rate DD Lilia Teninty
1.3 Face to Face Contact CW Laurie Price
1.4 Safety in Foster Care CW Laurie Price
1.5 Children Safely Maintained with Parents
a) Exit to intact family closure
b) In-home not experiencing abuse
c) Successful trial home visits
d) Trial home visits not experiencing abuse
CW Laurie Price
1.6 Inconclusive Disposition of Investigation (children) DD Lilia Teninty
1.7 Timeliness of Calls Assigned CW Laurie Price
1.8-1.9 Timeliness of Investigation Completion CW Laurie Price
DD Lilia Teninty
DHS Priority 1 1 1 1 –––– Child SafetyChild SafetyChild SafetyChild Safety
Measure Name 1.11.11.11.1 Child Child Child Child ReReReRe----abuse rateabuse rateabuse rateabuse rate (CW)(CW)(CW)(CW)
Measure Calculation % of children experiencing re% of children experiencing re% of children experiencing re% of children experiencing re----abuse within 12 months of initial incidentabuse within 12 months of initial incidentabuse within 12 months of initial incidentabuse within 12 months of initial incident
Measure Owner Laurie Price
Data Provider Judy Helvig
Data Source ROM Report SA.02 (Fed) Recurrence of Maltreatment 12 months from 1st Victimization
Frequency Quarterly
Measure Details
Reports re-abuse rate for “in-home status”, “foster care”, and “closed case”.
12121212----Month Target PeriodMonth Target PeriodMonth Target PeriodMonth Target Period - The first 12 months of the 2 year measurement period ending in the
reporting period.
Report DatesReport DatesReport DatesReport Dates – The report received date will be used to determine if a child is counted in the
12-month target period (regardless of disposition date), and is used to determine whether
maltreatment recurrence occurred within 12 months.
ExclusionsExclusionsExclusionsExclusions –
Subsequent Reports – Subsequent reports will not be counted as a recurrence if the
subsequent report of maltreatment was within 14 days of the earlier report or if it has the
same incident date (if provided) as the earlier report.
Youth 18 Years – Reports of youth age 18 or more are excluded from the calculation of the
indicator.
Unit of Analysis:Unit of Analysis:Unit of Analysis:Unit of Analysis: A child
Calculation / Count:Calculation / Count:Calculation / Count:Calculation / Count:
Numerator: Of children counted in the denominator, total children that had another
substantiated or indicated report of maltreatment within 12 months of their initial report,
Divided By Denominator: Number of children with at least one substantiated or indicated
report of maltreatment in a rolling 12-month target period.
Q1-2017 ACTUAL 9.3%
Target 0%
Red >13%
Yellow 9.1-13%
Green <9.1%
Why this measure is
important
This measure is important as our mission is to protect children from abuse and neglect and
maintain them safely at home whenever possible. It’s important to know if we manage child

2
safety effectively whether children are able to remain home or must enter substitute care. This
measure helps us see how effectively we are assessing and planning around risk and safety.
This measure is our goal, to identify safety issues, plan with the family or substitute caregiver
to manage or remove safety threats in a way that children do not experience another incident
of abuse within a 12 month period.
Action
What does it mean if the measure is high?
What does it mean if the measure is low?
What action does this prompt? This is an early warning sign of what?
DHS Priority 1 1 1 1 –––– Child SafetyChild SafetyChild SafetyChild Safety
Measure Name 1.21.21.21.2 Child Child Child Child Abuse Rate (DD)Abuse Rate (DD)Abuse Rate (DD)Abuse Rate (DD)
Measure Calculation %%%% of substantiated abuse/neglect of childrenof substantiated abuse/neglect of childrenof substantiated abuse/neglect of childrenof substantiated abuse/neglect of children in licensedin licensedin licensedin licensed residential service settingsresidential service settingsresidential service settingsresidential service settings
Measure Owner Lilia Teninty
Data Provider Jason Stein
Data Source OAAPI Database
Frequency Quarterly
Measure Details
This measure only includes children receiving DD services in residential service settings
(approximately 200 children). It does not include children who are involved with Child Welfare.
Numerator = # of children receiving residential services with a substantiated abuse allegation
Denominator = Total population of children receiving residential services
This measure is reporting a small sub-section (approximately 200) of all children receiving DD
services (approximately 5,000).
Q1-2017 3.8%
Target 0%
Red >1.5%
Yellow .75-1.5%
Green <.75%
Why this measure is
important
This measure reports on children receiving state case managed care. They have the highest
level of acuity on the behavioral spectrum (highly violent/high risk behaviors), and have a high
frequency of dual diagnosis (mental health). These settings are typically considered “last
resort”. Some are moved out of their county of origin based on where there’s capacity, taking
them away from their natural support systems (e.g. moved from rural Eastern Oregon to
Portland).
Action
There are a number of ways to dig deeper into the data to understand what’s happening and
what action to take. Tier 2 and Tier 3 measures are needed. Analysis of types of abuse/neglect
to better inform action.
DHS Priority 1 1 1 1 –––– Child SafetyChild SafetyChild SafetyChild Safety
Measure Name 1.31.31.31.3 Face to face contactFace to face contactFace to face contactFace to face contact (CW)(CW)(CW)(CW)
Measure Calculation % of % of % of % of visits made by caseworkers on a monthly basis to children served in home, children in foster visits made by caseworkers on a monthly basis to children served in home, children in foster visits made by caseworkers on a monthly basis to children served in home, children in foster visits made by caseworkers on a monthly basis to children served in home, children in foster
care, and their parentscare, and their parentscare, and their parentscare, and their parents
Measure Owner Laurie Price
Data Provider Judy Helvig
Data Source WB-5001-S Caseworker Family Face to Face All Contacts Summary Report
Frequency Quarterly
Measure Details
Children Served in Home, Children in Foster Care, and their parents, who are on the F2F report
when pulled on the 8th day of the following month of the reporting period.
Numerator: All Persons with at least one contact
Denominator: All Persons requiring contact
3
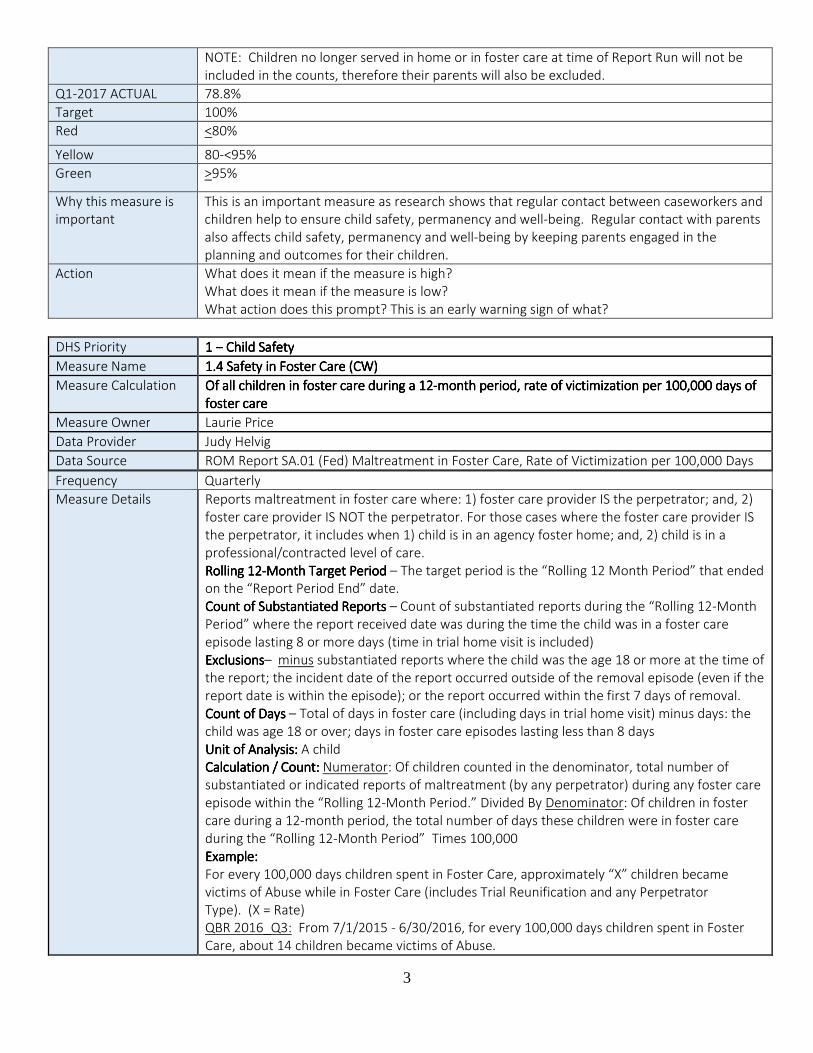
NOTE: Children no longer served in home or in foster care at time of Report Run will not be
included in the counts, therefore their parents will also be excluded.
Q1-2017 ACTUAL 78.8%
Target 100%
Red <80%
Yellow 80-<95%
Green >95%
Why this measure is
important
This is an important measure as research shows that regular contact between caseworkers and
children help to ensure child safety, permanency and well-being. Regular contact with parents
also affects child safety, permanency and well-being by keeping parents engaged in the
planning and outcomes for their children.
Action
What does it mean if the measure is high?
What does it mean if the measure is low?
What action does this prompt? This is an early warning sign of what?
DHS Priority 1 1 1 1 –––– Child SafetyChild SafetyChild SafetyChild Safety
Measure Name 1.41.41.41.4 Safety in Foster CareSafety in Foster CareSafety in Foster CareSafety in Foster Care (CW)(CW)(CW)(CW)
Measure Calculation Of all children in foster care during a 12Of all children in foster care during a 12Of all children in foster care during a 12Of all children in foster care during a 12----month period, rate of victimization per 100,000 days of month period, rate of victimization per 100,000 days of month period, rate of victimization per 100,000 days of month period, rate of victimization per 100,000 days of
foster carefoster carefoster carefoster care
Measure Owner Laurie Price
Data Provider Judy Helvig
Data Source ROM Report SA.01 (Fed) Maltreatment in Foster Care, Rate of Victimization per 100,000 Days
Frequency Quarterly
Measure Details
Reports maltreatment in foster care where: 1) foster care provider IS the perpetrator; and, 2)
foster care provider IS NOT the perpetrator. For those cases where the foster care provider IS
the perpetrator, it includes when 1) child is in an agency foster home; and, 2) child is in a
professional/contracted level of care.
Rolling 12Rolling 12Rolling 12Rolling 12----Month Target PeriodMonth Target PeriodMonth Target PeriodMonth Target Period – The target period is the “Rolling 12 Month Period” that ended
on the “Report Period End” date.
Count of Substantiated ReportsCount of Substantiated ReportsCount of Substantiated ReportsCount of Substantiated Reports – Count of substantiated reports during the “Rolling 12-Month
Period” where the report received date was during the time the child was in a foster care
episode lasting 8 or more days (time in trial home visit is included)
ExclusionsExclusionsExclusionsExclusions– minus substantiated reports where the child was the age 18 or more at the time of
the report; the incident date of the report occurred outside of the removal episode (even if the
report date is within the episode); or the report occurred within the first 7 days of removal.
Count of DaysCount of DaysCount of DaysCount of Days – Total of days in foster care (including days in trial home visit) minus days: the
child was age 18 or over; days in foster care episodes lasting less than 8 days
Unit of Analysis:Unit of Analysis:Unit of Analysis:Unit of Analysis: A child
Calculation / Count:Calculation / Count:Calculation / Count:Calculation / Count: Numerator: Of children counted in the denominator, total number of
substantiated or indicated reports of maltreatment (by any perpetrator) during any foster care
episode within the “Rolling 12-Month Period.” Divided By Denominator: Of children in foster
care during a 12-month period, the total number of days these children were in foster care
during the “Rolling 12-Month Period” Times 100,000
Example:Example:Example:Example:
For every 100,000 days children spent in Foster Care, approximately “X” children became
victims of Abuse while in Foster Care (includes Trial Reunification and any Perpetrator
Type). (X = Rate)
QBR 2016_Q3: From 7/1/2015 - 6/30/2016, for every 100,000 days children spent in Foster
Care, about 14 children became victims of Abuse.

4
Note: The Round 2 Federal measure counted number of children, not number of Days those
children were in Foster Care, so the result was a very small percent and fluctuated greatly with
just “one more” or “one less” child abused. The Round 3 Federal measure counts “days” the
children spent in foster care, and multiplies those days by 100,000 to create a rate that is more
comparable over time and to other states than the Round 2 measure.
Q1-2017 ACTUAL 18.5
Target 0
Red >12
Yellow 8.5-12
Green <8.5
Why this measure is
important
While this federal measure is difficult to understand the algorithm behind the calculation and
this is the third change in the last 4 years on how calculations are being made Oregon remains
below the national standard. Regardless, this measures Safety of Safety of Safety of Safety of Children in DHS careChildren in DHS careChildren in DHS careChildren in DHS care and the
data point we should strive for is 0. The federal standard is 8.5. There are several nuances that
drives this number higher in Oregon than other states as it pertains to the length of time the
courts assign legal custody of a child to DHS, the date in which the assessment is conducted by
CPS, and the actual perpetrator of the abuse which may not be the foster parent but someone
other than the foster parent at the time of the report/assessment.
Action
What does it mean if the measure is high?
What does it mean if the measure is low?
What action does this prompt? This is an early warning sign of what?
DHS Priority 1 1 1 1 –––– Child SafetyChild SafetyChild SafetyChild Safety
Measure Name 1.5a1.5a1.5a1.5a Children Safely Maintained with ParentsChildren Safely Maintained with ParentsChildren Safely Maintained with ParentsChildren Safely Maintained with Parents (CW)(CW)(CW)(CW)
Measure Calculation % in home% in home% in home% in home that exit to intact family closurethat exit to intact family closurethat exit to intact family closurethat exit to intact family closure
Measure Owner Laurie Price
Data Provider Judy Helvig
Data Source ORKids Query
Frequency Quarterly
Measure Details
Reports those that are 1) in-home cases (identified as “at risk”, but didn’t enter care); and, 2)
trial home visits (those who returned home after being in care)
Calculation / Count: Calculation / Count: Calculation / Count: Calculation / Count: Numerator - Children who are discharged to an intact family home. –
Denominator - Children who exit an in-home episode within the quarter. If a child has multiple
exits the most recent exit in the quarter is used.
Q1-2017 ACTUAL 89.1%
Target 100%
Red <80%
Yellow 80-95%
Green >95%
Why this measure is
important
This measure is important as our mission is to protect children from abuse and neglect and
maintain them safely at home whenever possible. It’s important to know if we manage child
safety effectively when children are able to remain home. This measure helps us see how
effectively we are assessing and planning around risk and safety. This measure is our goal, to
identify safety issues, plan with the family to mitigate those safety threats and close the case
with the child safe.
Action
What does it mean if the measure is high?
What does it mean if the measure is low?
What action does this prompt? This is an early warning sign of what?
DHS Priority 1 1 1 1 –––– Child SafetyChild SafetyChild SafetyChild Safety

5
Measure Name 1111.5b.5b.5b.5b Children Safely Maintained with ParentsChildren Safely Maintained with ParentsChildren Safely Maintained with ParentsChildren Safely Maintained with Parents (CW)(CW)(CW)(CW)
Measure Calculation % in % in % in % in home not experiencing abusehome not experiencing abusehome not experiencing abusehome not experiencing abuse
Measure Owner Laurie Price
Data Provider Judy Helvig
Data Source Numerator: ROM SA.06 Maltreatment Reports During In-Home
Denominator: ORKids Query
Frequency Quarterly
Measure Details
Calculation / Count: Calculation / Count: Calculation / Count: Calculation / Count:
Numerator - Number of children that were not a victim of abuse while served in home in the
quarter. Numerator equals Total Served in Home Denominator minus Victim Count from ROM
Report SA.06 Maltreatment Reports During In-Home
Denominator –Total served Children in home at least 1 day in the Quarter, from Query
ROM Report SA.06 Maltreatment Reports During In-Home
Operational Definition of ROM Report:Operational Definition of ROM Report:Operational Definition of ROM Report:Operational Definition of ROM Report: Count of CPS screened-in reports for children occurring
anytime during an in-home episode reported by finding (disposition).
Reports – All screened-in child reports will be counted in the month the report was received or
accepted (state defined) unless the “incident date” as recorded (in SACWIS) is prior to the
child’s start date of an in-home episode.
Finding – The finding (sometimes called disposition) of the CPS report will be reported as
either:
• substantiated/indicated (victim)
• not substantiated/indicated, or
• pending if the report does not have a completed investigation date
Unit of Analysis:Unit of Analysis:Unit of Analysis:Unit of Analysis: A child CPS report (if child has two separate reports in same month they will
appear twice)
Calculation / Count: Calculation / Count: Calculation / Count: Calculation / Count:
Counts: Count of child screened in reports by finding
Q1-2017 ACTUAL 95.9%
Target 100%
Red <80%
Yellow 80-95%
Green >95%
Why this measure is
important
This measure is important as our mission is to protect children from abuse and neglect and
maintain them safely at home whenever possible. It’s important to know if we manage child
safety effectively when children are able to remain home. This measure helps us see how
effectively we are assessing and planning around risk and safety. This measure helps us see
when we are achieving our goal and children are safe in their own home.
Action
What does it mean if the measure is high?
What does it mean if the measure is low?
What action does this prompt? This is an early warning sign of what?
DHS Priority 1 1 1 1 –––– Child SafetyChild SafetyChild SafetyChild Safety
Measure Name 1.1.1.1.5c5c5c5c Children Safely Maintained with ParentsChildren Safely Maintained with ParentsChildren Safely Maintained with ParentsChildren Safely Maintained with Parents (CW)(CW)(CW)(CW)
Measure Calculation % of children on trial home visits % of children on trial home visits % of children on trial home visits % of children on trial home visits that resulted in a discharge fthat resulted in a discharge fthat resulted in a discharge fthat resulted in a discharge from foster carerom foster carerom foster carerom foster care (successful trial (successful trial (successful trial (successful trial
home visits)home visits)home visits)home visits)
Measure Owner Laurie Price
Data Provider Judy Helvig
Data Source ORKids Query
Frequency Quarterly

6
Measure Details
Calculation / Count: Calculation / Count: Calculation / Count: Calculation / Count:
Numerator - Children who exited trial reunification who did not return to foster care from the
Trial Reunification placement.
Denominator - Children exiting a trial reunification within the quarter. If the child has multiple
exits from Trial Home visit the most recent exit is used.
Q1-2017 ACTUAL 83.2%
Target 100%
Red <80%
Yellow 80-95%
Green >95%
Why this measure is
important
This measure is important as our mission is to protect children from abuse and neglect and
maintain or reunify them safely home whenever possible. It’s important to know if we manage
child safety effectively when children are returned home. This measure helps us see how
effectively we are assessing and planning around risk and safety, considering conditions for
return and expected outcomes.
Action
What does it mean if the measure is high?
What does it mean if the measure is low?
What action does this prompt? This is an early warning sign of what?
DHS Priority 1 1 1 1 –––– Child SafetyChild SafetyChild SafetyChild Safety
Measure Name 1.1.1.1.5d5d5d5d Children Safely Maintained with ParentsChildren Safely Maintained with ParentsChildren Safely Maintained with ParentsChildren Safely Maintained with Parents (CW)(CW)(CW)(CW)
Measure Calculation % of trial home visits not experiencing abuse% of trial home visits not experiencing abuse% of trial home visits not experiencing abuse% of trial home visits not experiencing abuse/neglect/neglect/neglect/neglect
Measure Owner Laurie Price
Data Provider Judy Helvig
Data Source ORKids Query
Frequency Quarterly
Measure Details
Calculation / Count: Calculation / Count: Calculation / Count: Calculation / Count:
Numerator - Children served in trial reunification who were not a victim of abuse while in trial
reunification.
Denominator - Total Served children who were in Trial reunification for at least 1 day in the
quarter.
Q1-2017 ACTUAL 98.5%
Target 100%
Red <80%
Yellow 80-95%
Green >95%
Why this measure is
important
This measure is important as our mission is to protect children from abuse and neglect and
maintain them safely at home whenever possible. It’s important to know if we manage child
safety effectively when children are returned home. This measure helps us see how effectively
we are assessing and planning around risk and safety, considering conditions for return and
expected outcomes.
Action
What does it mean if the measure is high?
What does it mean if the measure is low?
What action does this prompt? This is an early warning sign of what?

7
DHS Priority 1 1 1 1 –––– Child SafetyChild SafetyChild SafetyChild Safety
Measure Name 1.61.61.61.6 Inconclusive Disposition of InvestigationsInconclusive Disposition of InvestigationsInconclusive Disposition of InvestigationsInconclusive Disposition of Investigations ---- childrenchildrenchildrenchildren (DD)(DD)(DD)(DD)
Measure Calculation % of completed allegations with an “inconclusive” outcome/finding% of completed allegations with an “inconclusive” outcome/finding% of completed allegations with an “inconclusive” outcome/finding% of completed allegations with an “inconclusive” outcome/finding (children)(children)(children)(children)
Measure Owner Lilia Teninty
Data Provider Jason Stein
Data Source OAAPI Database
Frequency Quarterly
Measure Details
Numerator = # of completed allegations with an inconclusive outcome/finding
Denominator = Total allegations assigned for investigation
There could be more than one inconclusive finding within a single report. This measure would
report all of them.
Q1-2017 17.3%
Target 10%
Red >19%
Yellow 15-19%
Green <15%
Why this measure is
important
Accurate data regarding abuse of adults with Intellectual and Developmental Disabilities is
critical in order to tailor programs and policies to adequately serve the target population. One
of the first steps in addressing the scope of abuse is understanding the size and nature of the
problem. This measure allows programs to have more accurate discussion on how to improve
accuracy of abuse investigation outcomes.
Inconclusive outcomes/findings are the result where there isn’t a preponderance of evidence.
Action Deeper dive into the results, such as the reasons for the inconclusive outcome/finding, county
DHS Priority 1 1 1 1 –––– Child SafetyChild SafetyChild SafetyChild Safety
Measure Name 1.1.1.1.7777 TimelinessTimelinessTimelinessTimeliness of Calls Assignedof Calls Assignedof Calls Assignedof Calls Assigned (CW)(CW)(CW)(CW)
Measure Calculation % of % of % of % of calls assigned for field contact that meet policy timelinescalls assigned for field contact that meet policy timelinescalls assigned for field contact that meet policy timelinescalls assigned for field contact that meet policy timelines (24 hours or 5 days)(24 hours or 5 days)(24 hours or 5 days)(24 hours or 5 days)
Measure Owner Laurie Price
Data Provider Judy Helvig
Data Source ROM Report CPS03 Time to Initial Contact
Frequency Quarterly
Measure Details
Operational Definition of Report Operational Definition of Report Operational Definition of Report Operational Definition of Report -Percent of reports referred for Investigation that had an initial
child contact or attempted contact within the required response time (24 hours or within 5
days) of receiving the report.
Counts are based on a family case (not individual child)
Cases are counted in the ROM Report Period when the CPS report was received.
Required response time – Each report is assigned one of two types of response times (“within
24 hours” or “within 5 days) depending on the urgency of the report as stated in agency policy”
Unit of Analysis:Unit of Analysis:Unit of Analysis:Unit of Analysis: A CPS report (which may involve multiple children).
Calculation / Count: Calculation / Count: Calculation / Count: Calculation / Count:
Numerator- (Of the denominator) Number of cases where the child contact or attempted
contact was made within the required response time of report received date Divided by
Denominator- Number of CPS reports accepted (screened in).
Q1-2017 ACTUAL 68.7%
Target 100%
Red <70%
Yellow 70-90%
Green >90%
Why this measure is
important
This measure is important as timely initial contact is an important measure related to child
safety. When we make timely initial contact, children who are being abused or neglected or at

8
risk of being abused and neglected have timely safety planning to halt the present or
impending danger.
Action
What does it mean if the measure is high?
What does it mean if the measure is low?
What action does this prompt? This is an early warning sign of what?
DHS Priority 1 1 1 1 –––– Child SafetyChild SafetyChild SafetyChild Safety
Measure Name 1.1.1.1.8888 TimeliTimeliTimeliTimelinessnessnessness of Investigation Completionof Investigation Completionof Investigation Completionof Investigation Completion (CW)(CW)(CW)(CW)
Measure Calculation % of % of % of % of investigation reports completed within policy timelines (30/45 days)investigation reports completed within policy timelines (30/45 days)investigation reports completed within policy timelines (30/45 days)investigation reports completed within policy timelines (30/45 days)
Measure Owner Laurie Price
Data Provider Judy Helvig
Data Source ROM Report CPS.02 Traditional Response and Alternative Response completed within required
time-of those due
Frequency Quarterly
Measure Details
Operational Definition of Report Operational Definition of Report Operational Definition of Report Operational Definition of Report -Percent of accepted reports for CPS investigations that
reached the investigation due date according to agency policy that were completed within the
required time period of 30-45 days for completing the investigation (extensions included).
ReportReportReportReport – This measure is by “report” not individual child. Since there can be multiple
allegations and conclusions (findings) for multiple children in a report, all children in the report
must have a conclusion (finding) for the report to be reported as concluded.
Completed ReportCompleted ReportCompleted ReportCompleted Report – a report is only completed when every child named in the report has an
investigation completed date.
Calculation / Count: Calculation / Count: Calculation / Count: Calculation / Count:
Numerator- (Of the denominator) Number of investigations completed within required time
period of receiving report, Divided By Denominator- Number of CPS reports that reached the
investigation due date according to agency policy.
Q1-2017 ACTUAL 24.7%
Target 100%
Red <70%
Yellow 70-90%
Green >90%
Why this measure is
important
This measure is important as timely investigation completion is an important measure related
to child safety. It’s a way for supervisors to provide oversight, guidance and correction when
caseworkers are incorrect in their safety determinations. It’s also an important customer
service measure, as families deserve to know in a timely way what the outcome of their CPS
assessment is. Additionally, when CPS assessments are not completed within timelines, it is
difficult to know whether appropriate contacts, interventions and actions have been
implemented to insure that children are safe.
Action
What does it mean if the measure is high?
What does it mean if the measure is low?
What action does this prompt? This is an early warning sign of what?
DHS Priority 1 1 1 1 –––– Child SafetyChild SafetyChild SafetyChild Safety
Measure Name 1.1.1.1.9999 Timeliness of Investigation CompletionTimeliness of Investigation CompletionTimeliness of Investigation CompletionTimeliness of Investigation Completion ---- childrenchildrenchildrenchildren (DD)(DD)(DD)(DD)
Measure Calculation % of investigation reports completed within policy timelines% of investigation reports completed within policy timelines% of investigation reports completed within policy timelines% of investigation reports completed within policy timelines (45 days, or approved extension (45 days, or approved extension (45 days, or approved extension (45 days, or approved extension
date) (children)date) (children)date) (children)date) (children)
Measure Owner Lilia Teninty
Data Provider Jason Stein
Data Source OAAPI Database
Frequency Quarterly
9
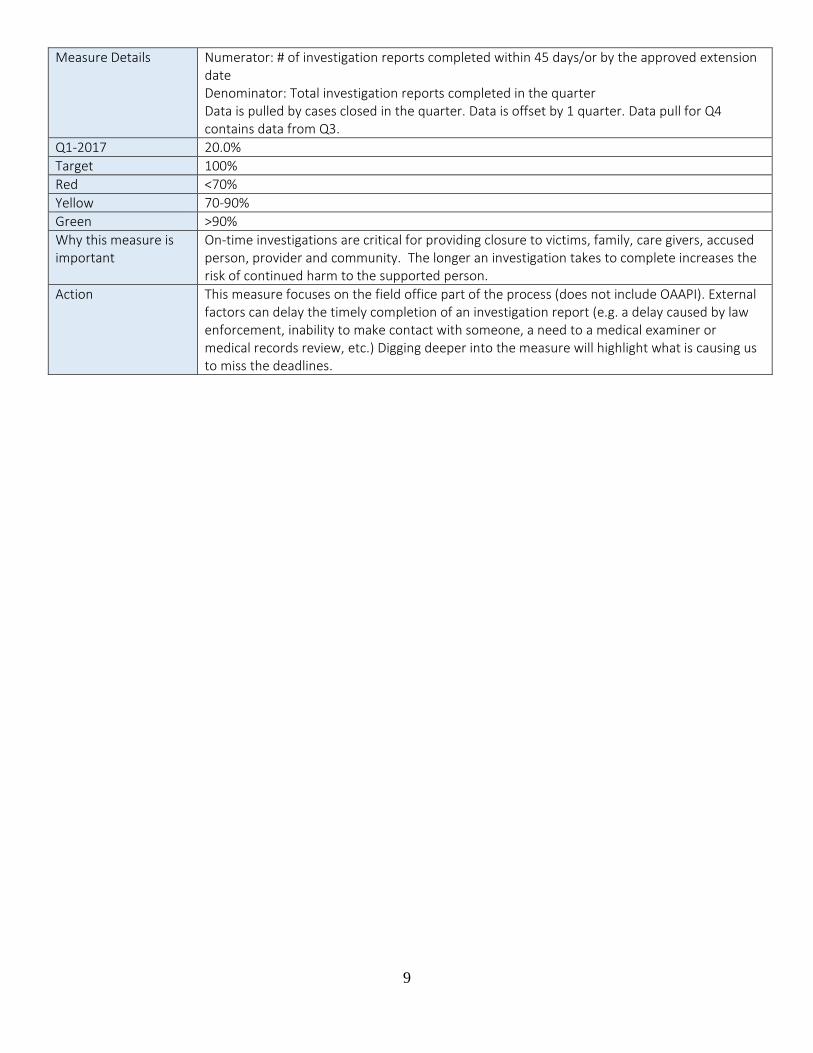
Measure Details
Numerator: # of investigation reports completed within 45 days/or by the approved extension
date
Denominator: Total investigation reports completed in the quarter
Data is pulled by cases closed in the quarter. Data is offset by 1 quarter. Data pull for Q4
contains data from Q3.
Q1-2017 20.0%
Target 100%
Red <70%
Yellow 70-90%
Green >90%
Why this measure is
important
On-time investigations are critical for providing closure to victims, family, care givers, accused
person, provider and community. The longer an investigation takes to complete increases the
risk of continued harm to the supported person.
Action
This measure focuses on the field office part of the process (does not include OAAPI). External
factors can delay the timely completion of an investigation report (e.g. a delay caused by law
enforcement, inability to make contact with someone, a need to a medical examiner or
medical records review, etc.) Digging deeper into the measure will highlight what is causing us
to miss the deadlines.

10
Priority 2 – Every Oregon adult lives safely – free from abuse, neglect and financial
exploitation
DHS Scorecard MeasureDHS Scorecard MeasureDHS Scorecard MeasureDHS Scorecard Measure Program Program Program Program
AreaAreaAreaArea
Measure OwnerMeasure OwnerMeasure OwnerMeasure Owner
2.1-2.2 Abuse Rate APD Ashley Carson-Cottingham
DD Lilia Teninty
2.3 Inconclusive Disposition of Investigations DD Lilia Teninty
2.4 Timeliness of Response APD Ashley Carson-Cottingham
2.5-2.6 Timeliness of Investigation Completion APD Ashley Carson-Cottingham
DD Lilia Teninty
2.7 Monitoring DD Lilia Teninty
2.8 Domestic Violence Payment Access SSP Kim Fredlund
DHS Priority 2 2 2 2 –––– Adult SafetyAdult SafetyAdult SafetyAdult Safety
Measure Name 2222.1.1.1.1aaaa Abuse rateAbuse rateAbuse rateAbuse rate (APD)(APD)(APD)(APD)
Measure Calculation % % % % averaged among all facility types of averaged among all facility types of averaged among all facility types of averaged among all facility types of substantiated abuse allegations per occupied bedssubstantiated abuse allegations per occupied bedssubstantiated abuse allegations per occupied bedssubstantiated abuse allegations per occupied beds
Measure Owner Ashley Carson-Cottingham
Data Provider Ann McQueen
Data Source QMDB
Frequency Rolling 12 month average
Measure Details Numerator = # of abuse cases. Denominator = # of occupied beds in facility. Measured in a
rolling Calendar Year (# of beds = licensed total x average occupancy rate for each facility
type).
Q1-2017 ACTUAL 3.0%
Target 0%
Red >2.75%
Yellow 1 – 2.75%
Green <1%
Why this measure is
important
To identify trends by facility type and target interventions accordingly.
Action
For this particular measure, we drill down to the types of abuse and the facilities to determine
what sorts of interventions need to be done. Being “high” doesn’t necessarily mean anything
in general, it could mean that more people are aware of how to report abuse, which can be a
positive. While we want the abuse to not happen at all, we would hope that our interventions
work and bring the overall number down. We measure this at the program (Tier 2) level.
This measure shows trends of types of abuse in facility settings. It prompts us to consider
continuing or changing interventions.
DHS Priority 2 2 2 2 –––– Adult SafetyAdult SafetyAdult SafetyAdult Safety
Measure Name 2.2.2.2.1b1b1b1b Abuse rate (APD)Abuse rate (APD)Abuse rate (APD)Abuse rate (APD)
Measure Calculation % of substantiated abuse allegations in community of the screened% of substantiated abuse allegations in community of the screened% of substantiated abuse allegations in community of the screened% of substantiated abuse allegations in community of the screened----in referrals we receivein referrals we receivein referrals we receivein referrals we receive
Measure Owner Ashley Carson-Cottingham
Data Provider Ann McQueen/Jason Stein
Data Source Data Warehouse
Frequency Quarterly
Measure Details Numerator = number of substantiated allegations. Denominator = total number of allegations.
Rolling 12 month average
Q1-2017 ACTUAL 28.5%

11
Target 0%
Red >20%
Yellow 10-20%
Green <10%
Why this measure is
important
Identify emerging trends by category of abuse then allocating resources to effectively meet
identified needs.
Action
For this particular measure, we are looking at types of abuse by location to determine where
opportunities of actionable improvement lie. While we want abuse not to happen at all, we
would hope that our efforts may show a reduction in overall substantiations of abuse. We
measure this at the program (Tier 2) level. This measure prompts us to consider the
continuing or changing interventions or education we can do.
DHS Priority 2 2 2 2 –––– Adult SafetyAdult SafetyAdult SafetyAdult Safety
Measure Name 2222.2.2.2.2 Abuse rate (DD)Abuse rate (DD)Abuse rate (DD)Abuse rate (DD)
Measure Calculation % % % % of substantiated abuse/neglect of adults of substantiated abuse/neglect of adults of substantiated abuse/neglect of adults of substantiated abuse/neglect of adults in licensed in licensed in licensed in licensed programsprogramsprogramsprograms
Measure Owner Lilia Teninty
Data Provider Jason Stein
Data Source OAAPI Database
Frequency Quarterly
Measure Details
Numerator: The number of unduplicated victims that had at least 1 substantiated allegation. If
the victim had more than 1 substantiated allegation, the client would only be counted once.
Denominator: Total number of people enrolled in the following licensed programs: group
homes, Stabilization and Crisis Unit (SACU), in-home supported living, vocational and
employment, and adult foster homes.
Q1-2017 .9%
Target 0%
Red >1.5%
Yellow .75-1.5%
Green <.75%
Why this measure is
important
To identify trends and target interventions accordingly.
Action
There are a number of ways to dig deeper into the data to understand what’s happening and
what action to take. Tier 2 and Tier 3 measures are needed.
DHS Priority 2 2 2 2 –––– Adult SafetyAdult SafetyAdult SafetyAdult Safety
Measure Name 2222.3.3.3.3 Inconclusive Disposition of Investigations (DD)Inconclusive Disposition of Investigations (DD)Inconclusive Disposition of Investigations (DD)Inconclusive Disposition of Investigations (DD)
Measure Calculation % of completed allegations with an “inconclusive” outcome/finding% of completed allegations with an “inconclusive” outcome/finding% of completed allegations with an “inconclusive” outcome/finding% of completed allegations with an “inconclusive” outcome/finding (adults)(adults)(adults)(adults)
Measure Owner Lilia Teninty
Data Provider Jason Stein
Data Source OAAPI Database
Frequency Quarterly
Measure Details
Numerator = # of completed allegations with an inconclusive outcome/finding
Denominator = Total allegations assigned for investigation
There could be more than one inconclusive finding within a single report. This measure would
report all of them.
Q1-2017 22.8%
Target 10%
Red >19%
Yellow 15-19%

12
Green <15%
Why this measure is
important
Accurate data regarding abuse of adults with Intellectual and Developmental Disabilities is
critical in order to tailor programs and policies to adequately serve the target population. One
of the first steps in addressing the scope of abuse is understanding the size and nature of the
problem. This measure allows programs to have more accurate discussion on how to improve
accuracy of abuse investigation outcomes.
Inconclusive outcomes/findings are the result where there isn’t a preponderance of evidence.
Action
Deeper dive into the results, such as the reasons for the inconclusive outcome/finding, setting,
county, in-home vs out-of-home…
DHS Priority 2 2 2 2 –––– Adult SafetyAdult SafetyAdult SafetyAdult Safety
Measure Name 2222.4.4.4.4aaaa Timeliness of ResponseTimeliness of ResponseTimeliness of ResponseTimeliness of Response (APD)(APD)(APD)(APD)
Measure Calculation % of calls assigned in a timely manner % of calls assigned in a timely manner % of calls assigned in a timely manner % of calls assigned in a timely manner –––– FacilityFacilityFacilityFacility (non(non(non(non----nursing facility)nursing facility)nursing facility)nursing facility)
Measure Owner Ashley Carson-Cottingham
Data Provider Ann McQueen
Data Source Data warehouse
Frequency Quarterly
Measure Details
A Facility APS case response time is considered timely if it was assigned by the end of the next
business day from when the complaint was received. Numerator: number of calls assigned by end of the next business day
Denominator: total number of calls received
Trend: Increased by 1.09% from 2016 Q3. Has remained stable between 93.8% and 96.60%,
with an overall positive trend throughout CY 2016.
Q1-2017 ACTUAL 95.4%
Target 100%
Red <70%
Yellow 70-90%
Green >90%
Why this measure is
important
This measure indicates how we are doing on our response timeliness to abuse allegations in
Facility settings (not including nursing facilities).
Action
Higher numbers indicate we are doing a good job of getting out to asses consumers in a
facility setting and investigate abuse allegations in a timely manner. Lower numbers indicate
we are not doing a good job of getting out to asses consumers in a facility setting and
investigate abuse allegations in a timely manner. This measure illustrates an Increase in
allegations and capacity challenges.
DHS Priority 2 2 2 2 –––– Adult SafetyAdult SafetyAdult SafetyAdult Safety
Measure Name 2222.4.4.4.4bbbb Timeliness of RespTimeliness of RespTimeliness of RespTimeliness of Responseonseonseonse (APD)(APD)(APD)(APD)
Measure Calculation % of calls assigned in a timely manner % of calls assigned in a timely manner % of calls assigned in a timely manner % of calls assigned in a timely manner –––– CommunityCommunityCommunityCommunity
Measure Owner Ashley Carson-Cottingham
Data Provider Jason Stein
Data Source Data Warehouse
Frequency Quarterly
Measure Details
A Community APS case response time is considered timely if it was assigned within 5 business
days of when the complaint was received.
Numerator: number of complaints assigned within 5 business days
Denominator: total number of complaints received

13
Trend: Decreased by 0.01% from 2016 Q3. Has remained stable between 96.98% and 98.00%
throughout CY 2016.
Q1-2017 ACTUAL 98.5%
Target 100%
Red <70%
Yellow 70-90%
Green >90%
Why this measure is
important
This measure indicates how we are doing on our response timeliness to abuse allegations in
Community settings.
Action
Higher numbers indicate we are doing a good job of getting out to asses consumers in
community settings and investigate abuse allegations in a timely manner. Lower numbers
indicate we are not doing a good job of getting out to asses consumers in community settings
and investigate abuse allegations in a timely manner. This measure illustrates an Increase in
allegations and capacity challenges.
DHS Priority 2 2 2 2 –––– Adult SafetyAdult SafetyAdult SafetyAdult Safety
Measure Name 2222....4444cccc Timeliness of ResponseTimeliness of ResponseTimeliness of ResponseTimeliness of Response (APD)(APD)(APD)(APD)
Measure Calculation % of calls assigned in a timely manner % of calls assigned in a timely manner % of calls assigned in a timely manner % of calls assigned in a timely manner –––– NNNNursing ursing ursing ursing FFFFacility acility acility acility SSSSurvey urvey urvey urvey UUUUnit (NFSU)nit (NFSU)nit (NFSU)nit (NFSU)
Measure Owner Ashley Carson-Cottingham
Data Provider Connie Rush
Data Source ASPEN (eventually, will be manually counting for 2017)
Frequency
Measure Details
Data on hold until Q1 2017 and is being recalculated to meet State guidelines vs. Federal
(state is stricter)
Q1-2017 ACTUAL NA
Target 100%
Red <70%
Yellow 70-90%
Green >90%
Why this measure is
important
This measure indicates how we are doing on our response timeliness to abuse allegations in
Nursing Facilities.
Action
What does it mean if the measure is high?
What does it mean if the measure is low?
What action does this prompt? This is an early warning sign of what?
DHS Priority 2 2 2 2 –––– Adult SafetyAdult SafetyAdult SafetyAdult Safety
Measure Name 2222.5.5.5.5 Timeliness of Investigation Completion Timeliness of Investigation Completion Timeliness of Investigation Completion Timeliness of Investigation Completion –––– Community & Community & Community & Community & FacilityFacilityFacilityFacility (APD)(APD)(APD)(APD)
Measure Calculation % of investigation reports completed % of investigation reports completed % of investigation reports completed % of investigation reports completed within policy timelineswithin policy timelineswithin policy timelineswithin policy timelines
Measure Owner Ashley Carson-Cottingham
Data Provider Ann McQueen/Jason Stein
Data Source QMDB
Frequency Quarterly
Measure Details Open cases divided by closed reports completed within 60 days
Q1-2017 ACTUAL 68.9%
Target 100%
Red <70%
Yellow 70-90%
Green >90%

14
Why this measure is
important
The measure only tells us how quickly our investigation reports are being finished by APS. The
process has changed in the last year to be more proactive and we don’t rely on completed
reports before we take action to protect consumers now. For the APD program, this measure
has moved to a Tier 3 because while we do want to ensure compliance on completing reports
timely, in regards to “safety” report completion is not as important as our response time in
assessing a consumer when an allegation of abuse is reported.
Action
Higher numbers mean we are doing well on completing our investigation reports timely.
Lower numbers mean we are not doing well on completing our investigation reports timely.
This measure illustrates capacity challenges and an increase in reports/allegations.
DHS Priority 2 2 2 2 –––– Adult SafetyAdult SafetyAdult SafetyAdult Safety
Measure Name 2222....6666 Timeliness of Investigation Completion (DD)Timeliness of Investigation Completion (DD)Timeliness of Investigation Completion (DD)Timeliness of Investigation Completion (DD)
Measure Calculation % of % of % of % of investigation reports completed within policy timelinesinvestigation reports completed within policy timelinesinvestigation reports completed within policy timelinesinvestigation reports completed within policy timelines (45 days, or approved extension (45 days, or approved extension (45 days, or approved extension (45 days, or approved extension
date) (adults)date) (adults)date) (adults)date) (adults)
Measure Owner Lilia Teninty
Data Provider Jason Stein
Data Source OAAPI Database
Frequency Quarterly
Measure Details
Numerator: # of investigation reports completed within 45 days/or by the approved extension
date
Denominator: Total investigation reports completed in the quarter
Data is pulled by cases closed in the quarter. Data is offset by 1 quarter. Data pull for Q4
contains data from Q3.
Q1-2017 48.9%
Target 100%
Red <70%
Yellow 70-90%
Green >90%
Why this measure is
important
On-time investigations are critical for providing closure to victims, family, care givers, accused
person, provider and community. The longer an investigation takes to complete increases the
risk of continued harm to the supported person.
Action
This measure focuses on the field office part of the process (does not include OAAPI). External
factors can delay the timely completion of an investigation report (e.g. a delay caused by law
enforcement, inability to make contact with someone, a need to a medical examiner or
medical records review, etc.) Digging deeper into the measure will highlight what is causing us
to miss the deadlines.
DHS Priority 2 2 2 2 –––– Adult SafetyAdult SafetyAdult SafetyAdult Safety
Measure Name 2222.7.7.7.7 MonitoringMonitoringMonitoringMonitoring (DD)(DD)(DD)(DD)
Measure Calculation % of DD licensing on% of DD licensing on% of DD licensing on% of DD licensing on----site visits completed within program specific timelinessite visits completed within program specific timelinessite visits completed within program specific timelinessite visits completed within program specific timelines
Measure Owner Lilia Teninty
Data Provider Barb Southard
Data Source ASPEN
Frequency Quarterly
Measure Details
Licensing review visits for 24 hour residential homes are conducted every 2 years prior to the
expiration date on the license. This measure reports the percentage of those visits due in the
quarter that were completed.
Q1-2017 ACTUAL 98%
Target 100%
Red <90%

15
Yellow 90-95%
Green >95%
Why this measure is
important
It assures that appropriate services are being provided to the individuals and also allows the
program to continue to bill for the services they provide.
Action
What does it mean if the measure is high?
What does it mean if the measure is low?
What action does this prompt? This is an early warning sign of what?
DHS Priority 2 2 2 2 –––– Adult SafetyAdult SafetyAdult SafetyAdult Safety
Measure Name 2222....8888 Domestic Violence Payment AccessDomestic Violence Payment AccessDomestic Violence Payment AccessDomestic Violence Payment Access (SSP)(SSP)(SSP)(SSP)
Measure Calculation Of those determinedOf those determinedOf those determinedOf those determined eligible for Domestic Violence emergency grant, the % with paymentseligible for Domestic Violence emergency grant, the % with paymentseligible for Domestic Violence emergency grant, the % with paymentseligible for Domestic Violence emergency grant, the % with payments
Measure Owner Kim Fredlund
Data Provider Erika Conjugacion, Xochitl Esparza
Data Source DHS Caseload data, Client Maintenance System (CMS)
Frequency Quarterly
Measure Details
This measure uses the total number of cases receiving a payment (numerator) divided by the
total Temporary Assistance for Domestic Violence Survivors caseload (denominator).
Q1-2017 ACTUAL 25.6%
Target 75%
Red <30%
Yellow >=30% to <50%
Green >= 50%
Why this measure is
important
This measure tracks the percentage of domestic violence survivors determined eligible for the
program who are receiving a payment to address an emergent need related to domestic
violence. Eligibility requirements follow TANF income requirements. The program is for
women with children, or who are pregnant.
The Temporary Assistance for Domestic Violence Survivors (TADVS) program is intended to
address the safety needs of domestic violence survivors. This program connects to the mission
of DHS by ensuring adults and children are safe.
The program will be tracking this measure over the next year and make adjustment to the
targets as necessary.
Action
A greater investment needs to be made to this program. The maximum amount a family can
receive is $1200 which was set in 1991 and has not changed since. However, there are other
ways to supplement that amount, such as the JOBS program.
The reason this measure is low, is that often times the $1200 is insufficient to get a family into
a safe/secure situation (e.g. first and last month’s rent is higher than the grant amount, and
the family isn’t able to supplement).
16
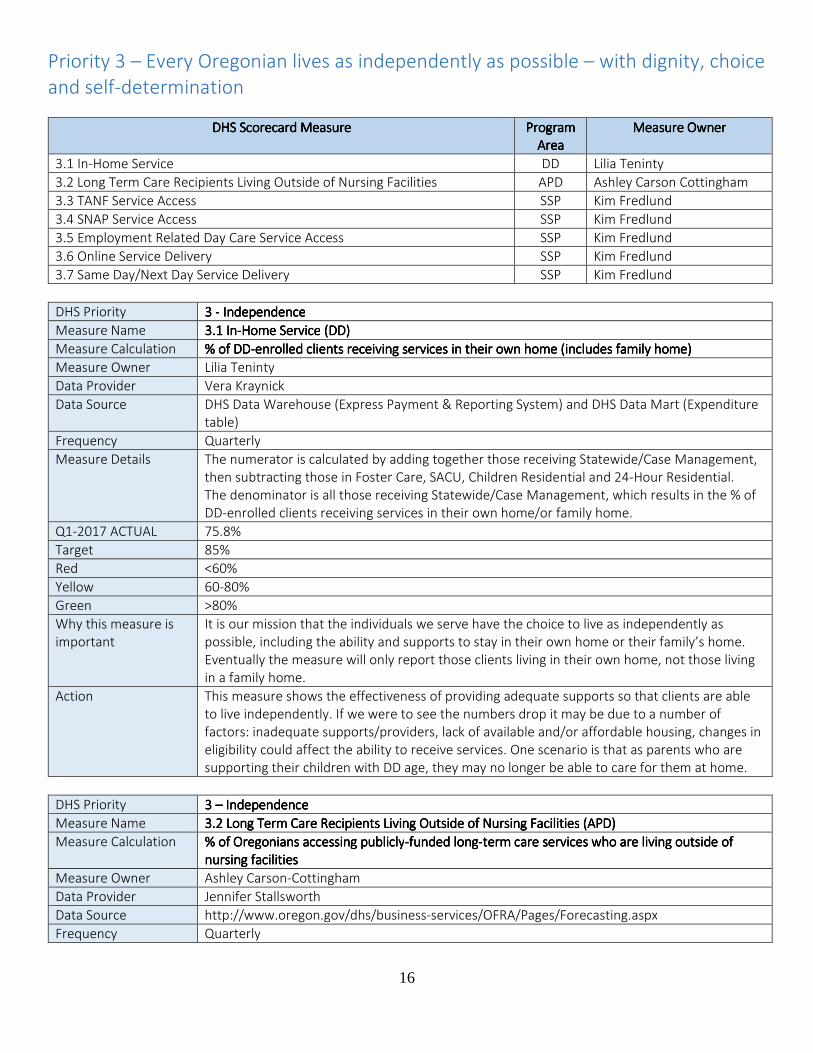
Priority 3 – Every Oregonian lives as independently as possible – with dignity, choice
and self-determination
DHS ScorecaDHS ScorecaDHS ScorecaDHS Scorecard Measurerd Measurerd Measurerd Measure Program Program Program Program
AreaAreaAreaArea
Measure OwnerMeasure OwnerMeasure OwnerMeasure Owner
3.1 In-Home Service DD Lilia Teninty
3.2 Long Term Care Recipients Living Outside of Nursing Facilities APD Ashley Carson Cottingham
3.3 TANF Service Access SSP Kim Fredlund
3.4 SNAP Service Access SSP Kim Fredlund
3.5 Employment Related Day Care Service Access SSP Kim Fredlund
3.6 Online Service Delivery SSP Kim Fredlund
3.7 Same Day/Next Day Service Delivery SSP Kim Fredlund
DHS Priority 3 3 3 3 ---- IndependenceIndependenceIndependenceIndependence
Measure Name 3.13.13.13.1 InInInIn----Home ServiceHome ServiceHome ServiceHome Service (DD)(DD)(DD)(DD)
Measure Calculation % of DD% of DD% of DD% of DD----enrolled clients receiving servienrolled clients receiving servienrolled clients receiving servienrolled clients receiving services in their own home (includesces in their own home (includesces in their own home (includesces in their own home (includes family home)family home)family home)family home)
Measure Owner Lilia Teninty
Data Provider Vera Kraynick
Data Source DHS Data Warehouse (Express Payment & Reporting System) and DHS Data Mart (Expenditure
table)
Frequency Quarterly
Measure Details
The numerator is calculated by adding together those receiving Statewide/Case Management,
then subtracting those in Foster Care, SACU, Children Residential and 24-Hour Residential.
The denominator is all those receiving Statewide/Case Management, which results in the % of
DD-enrolled clients receiving services in their own home/or family home.
Q1-2017 ACTUAL 75.8%
Target 85%
Red <60%
Yellow 60-80%
Green >80%
Why this measure is
important
It is our mission that the individuals we serve have the choice to live as independently as
possible, including the ability and supports to stay in their own home or their family’s home.
Eventually the measure will only report those clients living in their own home, not those living
in a family home.
Action
This measure shows the effectiveness of providing adequate supports so that clients are able
to live independently. If we were to see the numbers drop it may be due to a number of
factors: inadequate supports/providers, lack of available and/or affordable housing, changes in
eligibility could affect the ability to receive services. One scenario is that as parents who are
supporting their children with DD age, they may no longer be able to care for them at home.
DHS Priority 3 3 3 3 –––– IndependenceIndependenceIndependenceIndependence
Measure Name 3.23.23.23.2 Long Term Care Recipients Living Outside of Nursing FacilitiesLong Term Care Recipients Living Outside of Nursing FacilitiesLong Term Care Recipients Living Outside of Nursing FacilitiesLong Term Care Recipients Living Outside of Nursing Facilities (APD)(APD)(APD)(APD)
Measure Calculation % of Oregonians accessing publicly% of Oregonians accessing publicly% of Oregonians accessing publicly% of Oregonians accessing publicly----funded longfunded longfunded longfunded long----term care services who are living outside of term care services who are living outside of term care services who are living outside of term care services who are living outside of
nursing facilitiesnursing facilitiesnursing facilitiesnursing facilities
Measure Owner Ashley Carson-Cottingham
Data Provider Jennifer Stallsworth
Data Source http://www.oregon.gov/dhs/business-services/OFRA/Pages/Forecasting.aspx
Frequency Quarterly

17
Measure Details
Of APD actuals, pick the month at the end of the quarter being reporting on (i.e. for Q4 =
December)
Take the total in-home + total Community Based Care (CBC) = Total Home & Community Based
Services (HCBS)
Divide HCBS by total Long Term Care (LTC) = measure result
This measure is also a Key Performance Measure (KPM) reported to legislature.
Q1-2017 ACTUAL 87.3%
Target 90%
Red <85%
Yellow 85-87.5%
Green >87.5%
Why this measure is
important
This measure is an indicator that tells the agency how many consumers are receiving services
that are outside of higher cost care of nursing facilities. This measure supports DHS’s mission
and goal of serving individuals as independently as possible. Additionally, this measure shows
the Department’s compliance with federal Americans with Disabilities Act and the Olmstead
decision.
Action
A higher number means that consumers are receiving Long Term Care services in less
expensive settings. A lower number means that consumers are receiving Long Term Care
services in more expensive nursing facility settings.
This measure ensures that we don’t take our eyes “off the ball”, otherwise we would need to
reiterate goals and planning with local diversion and transition workers.
DHS Priority 3 3 3 3 –––– IndependenceIndependenceIndependenceIndependence
Measure Name 3.33.33.33.3 TANFTANFTANFTANF Service AccessService AccessService AccessService Access (SSP)(SSP)(SSP)(SSP)
Measure Calculation Of the children under 18 in families below 50% Of the children under 18 in families below 50% Of the children under 18 in families below 50% Of the children under 18 in families below 50% Federal Poverty Level (FPL)Federal Poverty Level (FPL)Federal Poverty Level (FPL)Federal Poverty Level (FPL), the % accessing , the % accessing , the % accessing , the % accessing
Temporary Assistance to Needy Families (Temporary Assistance to Needy Families (Temporary Assistance to Needy Families (Temporary Assistance to Needy Families (TANFTANFTANFTANF))))
Measure Owner Kim Fredlund
Data Provider Kevin Hamler-Dupras, Dawn Myers, Xochitl Esparza
Data Source DHS caseload data, U.S. Census Bureau, American Community Survey 1-Year Estimates, Table
B17024
Frequency Quarterly
Measure Details
This measure tracks the percentage of children in deep poverty (below 50% of FPL) who access
the TANF program. The average number of children accessing TANF for a calendar quarter
(numerator) is divided by the number of children in deep poverty (denominator) based on the
most recent census data available. 50% FPL is used because that is what the census reports.
The eligibility threshold for a family of 3 is <37% federal poverty level.
Note: The denominator is based on one-year census estimates. Since census data are updated
in the fall each year for the previous year, the first and second quarters are based on estimates
for two years prior, while the third and fourth quarters are based on estimates for the previous
year.
Q1-2017 ACTUAL 61.8%
Target 80%
Red <65%
Yellow ≥65% to <70%
Green ≥70%
Why this measure is
important
This measure tells us what percent of children in deep poverty are served by the TANF
program. The TANF program is a program “of last resort” serving children in families living in
extreme poverty. The DHS mission includes helping Oregonians become independent. It is a
priority of DHS to help people secure their most basic needs so that they can live as
independently as possible.
18
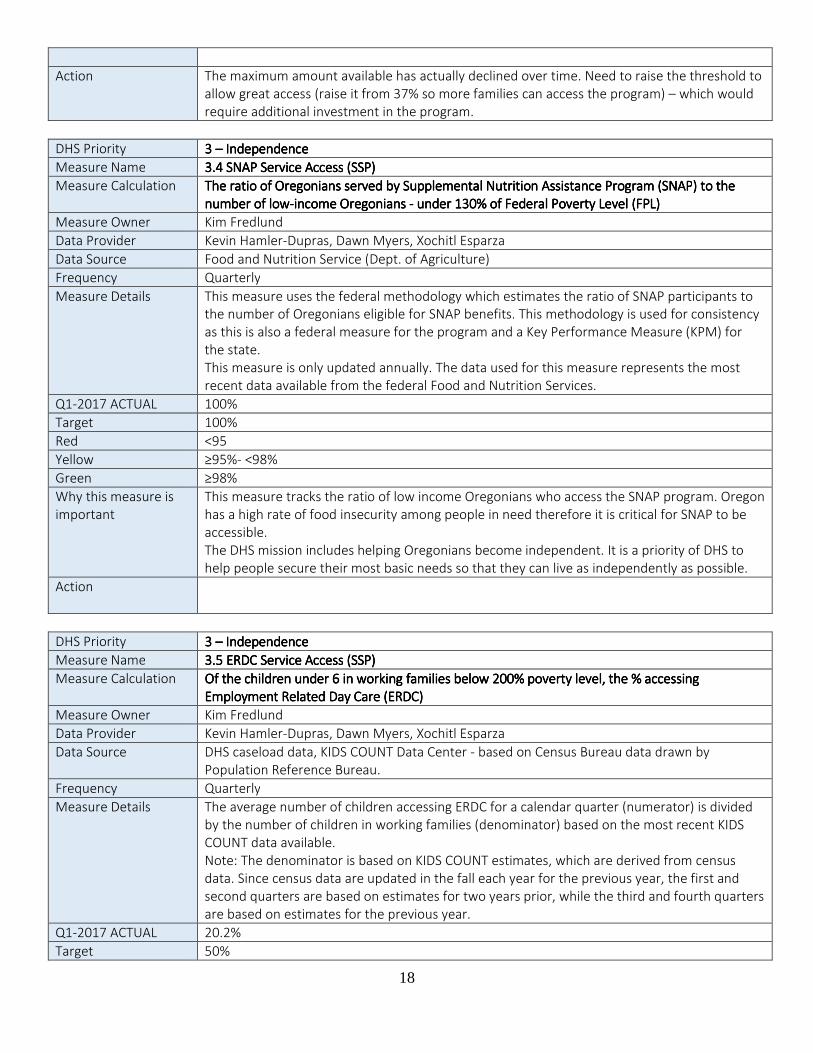
Action
The maximum amount available has actually declined over time. Need to raise the threshold to
allow great access (raise it from 37% so more families can access the program) – which would
require additional investment in the program.
DHS Priority 3 3 3 3 –––– IndependenceIndependenceIndependenceIndependence
Measure Name 3.43.43.43.4 SNAPSNAPSNAPSNAP Service AccessService AccessService AccessService Access (SSP)(SSP)(SSP)(SSP)
Measure Calculation The ratio of Oregonians served by The ratio of Oregonians served by The ratio of Oregonians served by The ratio of Oregonians served by Supplemental Nutrition Assistance Program (Supplemental Nutrition Assistance Program (Supplemental Nutrition Assistance Program (Supplemental Nutrition Assistance Program (SNAPSNAPSNAPSNAP)))) to the to the to the to the
number of lownumber of lownumber of lownumber of low----income Oregonians income Oregonians income Oregonians income Oregonians ---- under 130% of Funder 130% of Funder 130% of Funder 130% of Federal ederal ederal ederal PPPPoverty overty overty overty LLLLevel evel evel evel ((((FPLFPLFPLFPL))))
Measure Owner Kim Fredlund
Data Provider Kevin Hamler-Dupras, Dawn Myers, Xochitl Esparza
Data Source Food and Nutrition Service (Dept. of Agriculture)
Frequency Quarterly
Measure Details
This measure uses the federal methodology which estimates the ratio of SNAP participants to
the number of Oregonians eligible for SNAP benefits. This methodology is used for consistency
as this is also a federal measure for the program and a Key Performance Measure (KPM) for
the state.
This measure is only updated annually. The data used for this measure represents the most
recent data available from the federal Food and Nutrition Services.
Q1-2017 ACTUAL 100%
Target 100%
Red <95
Yellow ≥95%- <98%
Green ≥98%
Why this measure is
important
This measure tracks the ratio of low income Oregonians who access the SNAP program. Oregon
has a high rate of food insecurity among people in need therefore it is critical for SNAP to be
accessible.
The DHS mission includes helping Oregonians become independent. It is a priority of DHS to
help people secure their most basic needs so that they can live as independently as possible.
Action
DHS Priority 3 3 3 3 –––– IndependenceIndependenceIndependenceIndependence
Measure Name 3.53.53.53.5 ERDCERDCERDCERDC Service AccessService AccessService AccessService Access (SSP)(SSP)(SSP)(SSP)
Measure Calculation Of the children under 6 in working families below 200% poverty level, the % accessing Of the children under 6 in working families below 200% poverty level, the % accessing Of the children under 6 in working families below 200% poverty level, the % accessing Of the children under 6 in working families below 200% poverty level, the % accessing
Employment Related Day Care (Employment Related Day Care (Employment Related Day Care (Employment Related Day Care (ERDCERDCERDCERDC))))
Measure Owner Kim Fredlund
Data Provider Kevin Hamler-Dupras, Dawn Myers, Xochitl Esparza
Data Source DHS caseload data, KIDS COUNT Data Center - based on Census Bureau data drawn by
Population Reference Bureau.
Frequency Quarterly
Measure Details
The average number of children accessing ERDC for a calendar quarter (numerator) is divided
by the number of children in working families (denominator) based on the most recent KIDS
COUNT data available.
Note: The denominator is based on KIDS COUNT estimates, which are derived from census
data. Since census data are updated in the fall each year for the previous year, the first and
second quarters are based on estimates for two years prior, while the third and fourth quarters
are based on estimates for the previous year.
Q1-2017 ACTUAL 20.2%
Target 50%

19
Red <30%
Yellow ≥30%- <35%
Green ≥35%
Why this measure is
important
The DHS mission includes helping Oregonians connect to employment and support their
independence. Lack of high quality and affordable child care can impact the ability of parents
to remain employed. It can also impact the early development of children.
Action
There is a biennial cap of how many children can enter the program, and a high demand for
the program. There has been confusion about when the program is open or closed based on
capacity. Better/more outreach will help alleviate this confusion. In 2015 an investment was
made in the quality of child care (additional training, etc), which caused a decrease in the
number of providers and thus decreased capacity to meet the need/demand.
May be an opportunity to partner with CW to provide available child care slots.
DHS Priority 3 3 3 3 ---- IndependenceIndependenceIndependenceIndependence
Measure Name 3333.6.6.6.6 Online Service DeliveryOnline Service DeliveryOnline Service DeliveryOnline Service Delivery (SSP)(SSP)(SSP)(SSP)
Measure Calculation % of applications % of applications % of applications % of applications processed online (processed online (processed online (processed online (Client Application Processing Interface Client Application Processing Interface Client Application Processing Interface Client Application Processing Interface ---- CAP/CAPI) for CAP/CAPI) for CAP/CAPI) for CAP/CAPI) for
Supplemental Nutrition Assistance Program (Supplemental Nutrition Assistance Program (Supplemental Nutrition Assistance Program (Supplemental Nutrition Assistance Program (SNAPSNAPSNAPSNAP)))) submissionsubmissionsubmissionsubmission
Measure Owner Kim Fredlund
Data Provider Terra Lee, Xochitl Esparza
Data Source DHS EDMS System
Frequency Quarterly
Measure Details Numerator = # of SNAP applications processed online
Denominator = Total # of SNAP applications
Eventually there will be specific targets for each district.
Discussion at Q1-2017 SSP QBR to lower target to 70%
Q1-2017 ACTUAL 41.5%
Target 100%
Red <50%
Yellow 50-60%
Green >60%
Why this measure is
important
This measure tracks the percentage of SNAP applications processed online. Oregon has a high
rate of food insecurity. Providing the use of the SNAP online application is a critical option in
easing access to the SNAP program so that families can put food on their table. A priority of
DHS is to provide efficient and effective services and this measure aims to contribute to that
priority.
Action
A higher % means there is good outreach and awareness and that people have access to
computers (whether their own, in an office, library, etc)
Lower % means lack of access, awareness, etc. Causes higher traffic in offices and potential
delays.
Need to continue building awareness. While there are issues with the current system (not very
user-friendly, etc), it’s important for clients to get accustomed to an online system for when
Integrated Eligibility is implemented.
DHS Priority 3 3 3 3 ---- IndependenceIndependenceIndependenceIndependence
Measure Name 3.73.73.73.7 Same Day/Next Day SerSame Day/Next Day SerSame Day/Next Day SerSame Day/Next Day Service Deliveryvice Deliveryvice Deliveryvice Delivery (SSP)(SSP)(SSP)(SSP)
Measure Calculation % of % of % of % of Supplemental Nutrition Assistance Program (Supplemental Nutrition Assistance Program (Supplemental Nutrition Assistance Program (Supplemental Nutrition Assistance Program (SNAPSNAPSNAPSNAP)))) benefits issued same day or next daybenefits issued same day or next daybenefits issued same day or next daybenefits issued same day or next day
(new applications)(new applications)(new applications)(new applications)
Measure Owner Kim Fredlund
Data Provider Darrell Osborn, Xochitl Esparza
Data Source DHS Office of Business Intelligence (OBI) Data Warehouse and DHS caseload data

20
Frequency Quarterly
Measure Details
All certification (CRT) transactions occurring for Self Sufficiency cases during the prior two full
months (from the current month) are read from the AFS200U data in the DHS OBI data
warehouse along with associated case data for those transactions. Application days are derived
by calculating the total number of calendar days between the original application date and the
first benefit issuance occurring on or after the original application date. Average percentage of
applications periods between 0 and 1 day are calculated for each month and data for each of
the three months of the quarter being reported are averaged.
Q1-2017 ACTUAL 49.3%
Target 60%
Red >51%
Yellow 51-56%
Green >56%
Why this measure is
important
This measure tracks the percentage of SNAP benefits issued the same day or the next working
day after they apply for SNAP (new applications only). Oregon has a high rate of food
insecurity. Serving participants the same day or the next working day after they apply for SNAP
is critical in easing access to the SNAP program so that families can put food on their table. A
priority of DHS is to provide efficient and effective services and this measure aims to contribute
to that priority.
Action
There are many factors that influence this measure. Once the application is date-stamped, that
starts the clock for same day/next day. There are reports that breakout how soon someone
receives benefits beyond just same day/next day (find out what detail is available).

21
Priority 4 – Every Oregonian can work to the best of their abilities to contribute to
their family and their community
DHS Scorecard MeasureDHS Scorecard MeasureDHS Scorecard MeasureDHS Scorecard Measure Program Program Program Program
AreaAreaAreaArea
Measure OwnerMeasure OwnerMeasure OwnerMeasure Owner
4.1-4.3 Successful Employment DD Lilia Teninty
SSP Kim Fredlund
VR Trina Lee
4.4-4.5 Earning Sufficient Wages SSP Kim Fredlund
VR Trina Lee
4.6-4.7 Direct Service VR Trina Lee
DHS Priority 4 4 4 4 –––– EmploymentEmploymentEmploymentEmployment
Measure Name 4.1a4.1a4.1a4.1a Successful EmploymentSuccessful EmploymentSuccessful EmploymentSuccessful Employment (DD)(DD)(DD)(DD)
Measure Calculation Increase number of adults with developmental disabilities receiving ODDS employment services Increase number of adults with developmental disabilities receiving ODDS employment services Increase number of adults with developmental disabilities receiving ODDS employment services Increase number of adults with developmental disabilities receiving ODDS employment services
and reported as receiving sheltered workshop services who obtain and reported as receiving sheltered workshop services who obtain and reported as receiving sheltered workshop services who obtain and reported as receiving sheltered workshop services who obtain Competitive Integrated Competitive Integrated Competitive Integrated Competitive Integrated
EmploymentEmploymentEmploymentEmployment
Measure Owner Lilia Teninty
Data Provider Andre Harboe
Data Source Employment Outcomes System (EOS) or Brokerage surveys
Frequency Annual
Measure Details
Individuals calculated as receiving "sheltered workshop services" is defined as any ODDS client
that has been identified as working in a sheltered workshop since March 2012 in EOS or
Brokerage surveys. A sheltered workshop is a type of segregated work setting. Those
individuals who are reported as obtaining "Competitive integrated supported employment" is
defined as having been successfully closed by Vocational Rehabilitation (VR), completed job
development by Office of Developmental Disability Services (ODDS) with retention payment, or
billed for individual supported employment for at least three months. "working-age individual"
is calculated in VR as being 21 or older at date of successful closure and for ODDS being 21 or
older at beginning of the State Fiscal Year (SFY).
Q1-2017 ACTUAL 143 for Q3-2016. Next data reported Q3 2017
Target 130
Red Below target
Yellow NA
Green At or above target
Why this measure is
important
The goal of ODDS Employment Services is for individuals with Intellectual/Developmental
Disabilities (I/DD) to get, maintain and advance in individual community jobs at or above
minimum wage. Individuals working in competitive integrated employment are more
financially independent. Employment establishes community connections that allow people to
become contributing and valued members of their communities. As with all other citizens, for
individuals with I/DD, employment has many positive impacts. These impacts include
increasing self-worth, building relationships, and access to community resources. Employment
improves economic well-being as well as physical and mental health.
Action
What does it mean if the measure is high?
What does it mean if the measure is low?
What action does this prompt? This is an early warning sign of what?
DHS Priority 4 4 4 4 –––– EmploymentEmploymentEmploymentEmployment
Measure Name 4.1b 4.1b 4.1b 4.1b Successful EmploymentSuccessful EmploymentSuccessful EmploymentSuccessful Employment (DD)(DD)(DD)(DD)

22
Measure Calculation Decrease number of adults with developmental disabilities receiving ODDS employment services Decrease number of adults with developmental disabilities receiving ODDS employment services Decrease number of adults with developmental disabilities receiving ODDS employment services Decrease number of adults with developmental disabilities receiving ODDS employment services
who are reported as receiving sheltered who are reported as receiving sheltered who are reported as receiving sheltered who are reported as receiving sheltered workshop servicesworkshop servicesworkshop servicesworkshop services
Measure Owner Lilia Teninty
Data Provider Andre Harboe
Data Source Employment Outcomes System (EOS)
Frequency Semi-annual
Measure Details
All individuals in the EOS census for each State Fiscal Year (SFY) who have paid employment
under the service category of “path to employment” and are identified as being a sheltered
workshop setting by ODDS.
Q1-2017 ACTUAL 1,267 for Q4-2016. Next data reported Q2-2017.
Target 1,860
Red At or above target
Yellow NA
Green Below target
Why this measure is
important
Executive Order 15-01, Oregon’s Employment First Policy and the Lane v. Brown federal
settlement call for a decrease in sheltered workshop services, which are a type of segregated
work setting. ODDS policy has eliminated new entries to sheltered workshops and must show
progress in assisting people to leave segregated work settings such as sheltered workshops.
In addition, ODDS is committed to its mission that Oregonians with I/DD are safe, healthy and
independent, and part of that mission includes supporting people to work in their communities
rather than in segregated settings.
Action
What does it mean if the measure is high?
What does it mean if the measure is low?
What action does this prompt? This is an early warning sign of what?
DHS Priority 4 4 4 4 –––– EmploymentEmploymentEmploymentEmployment
Measure Name 4.2a4.2a4.2a4.2a Successful EmploymentSuccessful EmploymentSuccessful EmploymentSuccessful Employment (SSP)(SSP)(SSP)(SSP)
Measure Calculation % of SSP exits who are employed the quarter of exit% of SSP exits who are employed the quarter of exit% of SSP exits who are employed the quarter of exit% of SSP exits who are employed the quarter of exit
Measure Owner Kim Fredlund
Data Provider Kevin Hamler Dupras
Data Source Integrated Client Services (ICS)
Frequency Quarterly
Measure Details
Numerator is the number of people who exit the SSP program and are employed during that
quarter.
Denominator is the total number of people who exit the SSP program in that quarter.
Due to the length of time needed for employers to submit data and have it processed by the
Oregon Employment Department (OED), the data are lagged 2 quarters (for example, the Q1-
2017 number would represent the Q3-2016 exit cohort).
Q1-2017 ACTUAL 46.6%
Target 47%
Red <43%
Yellow 43 – 44.9%
Green >45%
Why this measure is
important
One of the goals of the Self-Sufficiency program is to provide a connection to careers that
guide Oregonians out of poverty. A key priority for DHS is to help Oregonians connect to
employment. Employment is an important means to help reduce poverty. This measure shows
the degree to which SSP leavers are employed around the time of exit.
Action
Given the long time lag between exit and measurement, this is more of a long-term outcome
measure than an operational measure for guiding the field. However, every action is important
in getting someone employment and it takes time. As we continue aligning policies with

23
operational priorities we anticipate seeing positive outcomes in the next year or two. Family
Coaches work to ensure that there’s a strong network to support people in challenging times.
We rely on strong partnerships through collective impact (e.g. colleges, housing, health and
wellbeing, home visits, etc).
DHS Priority 4 4 4 4 –––– EmploymentEmploymentEmploymentEmployment
Measure Name 4.2b4.2b4.2b4.2b Successful EmploymentSuccessful EmploymentSuccessful EmploymentSuccessful Employment (SSP)(SSP)(SSP)(SSP)
Measure Calculation % of SSP exits who are employed in the 2% of SSP exits who are employed in the 2% of SSP exits who are employed in the 2% of SSP exits who are employed in the 2ndndndnd quarter after exitquarter after exitquarter after exitquarter after exit
Measure Owner Kim Fredlund
Data Provider Kevin Hamler-Dupras
Data Source Integrated Client Services (ICS)
Frequency Quarterly
Measure Details
Numerator is the number of SSP exits earning wages in the 2nd quarter after exit.\
Denominator is the total number of people who exited the SSP program in the given quarter.
Due to the length of time needed for employers to submit data and have it processed by the
Oregon Employment Department (OED), the data are lagged 4 quarters (for example, the Q1-
2017 number would actually represent the Q1-2016 exit cohort)
Q1-2017 ACTUAL 82.9%
Target 84%
Red <79%
Yellow 79 -80.9%
Green >81%
Why this measure is
important
One of the goals of the Self-Sufficiency program is to provide a connection to careers that
guide Oregonians out of poverty. A key priority for DHS is to help Oregonians connect to
employment. Employment is an important means to help reduce poverty. This measure shows
how successful SSP leavers are in retaining employment near-term.
Action
Given the long time lag between exit and measurement, this is more of a long-term outcome
measure than an operational measure for guiding the field. However, every action is important
in getting someone employment and it takes time. As we continue aligning policies with
operational priorities we anticipate seeing positive outcomes in the next year or two. Family
Coaches work to ensure that there’s a strong network to support people in challenging times.
We rely on strong partnerships through collective impact (e.g. colleges, housing, health and
wellbeing, home visits, etc).
DHS Priority 4 4 4 4 –––– EmplEmplEmplEmploymentoymentoymentoyment
Measure Name 4.2c4.2c4.2c4.2c Successful EmploymentSuccessful EmploymentSuccessful EmploymentSuccessful Employment (SSP)(SSP)(SSP)(SSP)
Measure Calculation % of SSP exits who are employed in the 4th quarter after exit% of SSP exits who are employed in the 4th quarter after exit% of SSP exits who are employed in the 4th quarter after exit% of SSP exits who are employed in the 4th quarter after exit
Measure Owner Kim Fredlund
Data Provider Kevin Hamler-Dupras
Data Source Integrated Client Services (ICS)
Frequency Quarterly
Measure Details
Numerator is the number of SSP exits earning wages in the 4th quarter after exit
Denominator is the total number of people who exited the SSP program in the given quarter.
Due to the length of time needed for employers to submit data and have it processed by the
Oregon Employment Department (OED), the data are lagged six quarters (for example, the Q1-
2017 number would actually represent the Q3-2015 exit cohort).
Q1-2017 ACTUAL 77.5%
Target 77%
Red <75%
Yellow 75 -75.9%

24
Green >76%
Why this measure is
important
One of the goals of Self-Sufficiency programs is to provide a connection to careers that guide
Oregonians out of poverty. A key priority for DHS is to help Oregonians connect to
employment. Employment is an important means to help reduce poverty. This measure shows
how successful SSP leavers are in retaining employment longer-term.
Action
Given the long time lag between exit and measurement, this is more of a long-term outcome
measure than an operational measure for guiding the field. However, every action is important
in getting someone employment and it takes time. As we continue aligning policies with
operational priorities we anticipate seeing positive outcomes in the next year or two. Family
Coaches work to ensure that there’s a strong network to support people in challenging times.
We rely on strong partnerships through collective impact (e.g. colleges, housing, health and
wellbeing, home visits, etc).
DHS Priority 4 4 4 4 –––– EmploymentEmploymentEmploymentEmployment
Measure Name 4.3a4.3a4.3a4.3a Successful Employment (VR)Successful Employment (VR)Successful Employment (VR)Successful Employment (VR)
Measure Calculation % of clients closing as rehabilitated% of clients closing as rehabilitated% of clients closing as rehabilitated% of clients closing as rehabilitated
Measure Owner Trina Lee
Data Provider Ron Barcikowski
Data Source Vocational Rehabilitation Data
Frequency Monthly
Measure Details
The numerator is the number of clients closed as employed in competitive integrated
employment.
The denominator is the number of clients who closed after receiving services in plan
This measure is also a Key Performance Measure (KPM) reported to legislature.
Q1-2017 ACTUAL 61.7%
Target 63%
Red <58%
Yellow 58-62%
Green >62%
Why this measure is
important
When clients are employed in competitive wage jobs that are integrated in the community,
they are more independent, relying less on SS/SSI and Self Sufficiency services.
Action prompted
Early warning sign of…
When this measure is low there are a number of variables to be explored, such as the
economy, labor market, capacity, counselors, job placement vendors, severity of the disability
of the clients applying to the program, as well as regional and branch performance.
DHS Priority 4 4 4 4 –––– EmploymentEmploymentEmploymentEmployment
Measure Name 4.3b4.3b4.3b4.3b Successful Employment (VR)Successful Employment (VR)Successful Employment (VR)Successful Employment (VR)
Measure Calculation % of clients who closed from plan employed during the 2% of clients who closed from plan employed during the 2% of clients who closed from plan employed during the 2% of clients who closed from plan employed during the 2ndndndnd quarter following closurequarter following closurequarter following closurequarter following closure
Measure Owner Trina Lee
Data Provider Ron Barcikowski
Data Source Vocational Rehabilitation and Unemployment Insurance Data from the Employment
Department
Frequency Annually
Measure Details
The numerator is the number of clients employed during the 2nd quarter following closure from
the program (whether or not they were employed)
The denominator is the total number of clients who closed from plan (for any reason)
Targets will be adjusted once we receive the federal standards from the Rehabilitation Services
Administration (RSA).
Q1-2017 ACTUAL 56.0%

25
Target 52%
Red >46%
Yellow 46-51%
Green >51%
Why this measure is
important
VR services focus on helping the client be successful. While a client may leave the program
without being employed, if they achieve employment later, that’s considered a success.
This is one of the Workforce Innovation & Opportunity Act (WIOA) performance standards we
are held to.
Action prompted
Early warning sign of…
When this measure is low there are a number of variables that could be explored, such as the
effectiveness of long-term services, whether the client received appropriate supports to get
their needs met, and that a comprehensive plan was done effectively. The “percentage closing
as a rehabilitation” can serve as a proxy for this measure.
DHS Priority 4 4 4 4 –––– EmploymentEmploymentEmploymentEmployment
Measure Name 4.3c4.3c4.3c4.3c Successful Employment (VR)Successful Employment (VR)Successful Employment (VR)Successful Employment (VR)
Measure Calculation % of clients closed from plan employed during 4% of clients closed from plan employed during 4% of clients closed from plan employed during 4% of clients closed from plan employed during 4thththth quarter following closurequarter following closurequarter following closurequarter following closure
Measure Owner Trina Lee
Data Provider Ron Barcikowski
Data Source Vocational Rehabilitation and Unemployment Insurance Data from the Employment
Department
Frequency Annually
Measure Details
The numerator is the number of clients employed during the 4th quarter following closure
from the program
The denominator is the number of clients who closed from plan for any reason
Targets will be adjusted once we receive the federal standards from the Rehabilitation Services
Administration (RSA).
Q1-2017 ACTUAL 53.0%
Target 53%
Red <46%
Yellow 46-51%
Green >51%
Why this measure is
important
VR services focus on helping the client be successful. While a client may leave the program
without being employed, if they achieve employment later, that’s considered a success.
This is one of the Workforce Innovation & Opportunity Act (WIOA) performance standards we
are held to.
Action prompted
Early warning sign of…
When this measure is low there are a number of variables that could be explored, such as the
effectiveness of long-term services, whether the client received appropriate supports to get
their needs met, and that a comprehensive plan was done effectively. The “percentage closing
as a rehabilitation” can serve as a proxy for this measure.
DHS Priority 4 4 4 4 –––– EmploymentEmploymentEmploymentEmployment
Measure Name 4.44.44.44.4 Earning Sufficient WagesEarning Sufficient WagesEarning Sufficient WagesEarning Sufficient Wages (SSP)(SSP)(SSP)(SSP)
Measure Calculation Median quarterly wage 2Median quarterly wage 2Median quarterly wage 2Median quarterly wage 2ndndndnd quarter after SSPquarter after SSPquarter after SSPquarter after SSP exitexitexitexit
Measure Owner Kim Fredlund
Data Provider Kevin Hamler-Dupras
Data Source Integrated Client Services (ICS)
Frequency Quarterly
Measure Details
Median quarterly wage 2nd quarter after exit for those leaving SSP.

26
Due to the length of time needed for employers to submit data and have it processed by the
Oregon Employment Department (OED), the data are lagged 4 quarters (for example, the Q1-
2017 number would actually represent the Q1-2016 exit cohort).
Q1-2017 ACTUAL $11,246
Target $12,500
Red < $10,600
Yellow $10,600 - $11,599
Green > $11,600
Why this measure is
important
One of the goals of Self-Sufficiency programs is to provide a connection to careers that guide
Oregonians out of poverty. A key priority for DHS is to help Oregonians connect to
employment. Employment is an important means to help reduce poverty. This measure
provides information on the quality of employment in terms of wage level.
Action
Given the long time lag between exit and measurement, this is more of a long-term outcome
measure than an operational measure for guiding the field. However, every action is important
in getting someone employment and it takes time. As we continue aligning policies with
operational priorities we anticipate seeing positive outcomes in the next year or two. Family
coaches are a resource to connect families to supports and resources to help them be
successful. We rely on strong partnerships through collective impact (e.g. colleges, housing,
health and wellbeing, home visits, etc). Family Coaches work to ensure that there’s a strong
network to support people in challenging times.
DHS Priority 4 4 4 4 –––– EmploymentEmploymentEmploymentEmployment
Measure Name 4.54.54.54.5 Earning Sufficient Wages (VR)Earning Sufficient Wages (VR)Earning Sufficient Wages (VR)Earning Sufficient Wages (VR)
Measure Calculation Median quarterly wage at 2Median quarterly wage at 2Median quarterly wage at 2Median quarterly wage at 2ndndndnd quarter following closure from the programquarter following closure from the programquarter following closure from the programquarter following closure from the program
Measure Owner Trina Lee
Data Provider Ron Barcikowski
Data Source Vocational Rehabilitation and Unemployment Insurance Data from the Employment
Department
Frequency Annually
Measure Details
This measure reports median quarterly earnings for clients employed during the 2nd quarter
following closure from the program
Q1-2017 ACTUAL $3,383
Target $3,300
Red <$3,000
Yellow $3,000-3,299
Green >$3,300
Why this measure is
important
This measure focuses on ensuring clients are making more of a living wage and are able to be
more self-sufficient. These wages typically supplement other benefits such as SSI and/or SSDI.
This is one of the Workforce Innovation & Opportunity Act (WIOA) performance standards we
are held to.
Action prompted
Early warning sign of…
If the number is higher, it means that a higher percentage of clients will have successfully
completed secondary/postsecondary education/training programs which should increase their
employability and eventually boost their earnings above what they would have received
without the degree.
If this number is lower, we could look at things such as the labor market, the comprehensive
planning process and opportunities to invest in training.
Important action on these measures is the median number of weekly work hours as the
minimum wage is going up.
DHS Priority 4 4 4 4 –––– EmploymentEmploymentEmploymentEmployment

27
Measure Name 4.64.64.64.6 Direct ServiceDirect ServiceDirect ServiceDirect Service ---- EligibilityEligibilityEligibilityEligibility (VR)(VR)(VR)(VR)
Measure Calculation % of clients being determined eligible% of clients being determined eligible% of clients being determined eligible% of clients being determined eligible, or entered into eligibility delay,, or entered into eligibility delay,, or entered into eligibility delay,, or entered into eligibility delay, within 60 days of within 60 days of within 60 days of within 60 days of
applicationapplicationapplicationapplication
Measure Owner Trina Lee
Data Provider Ron Barcikowski
Data Source Vocational Rehabilitation
Frequency Monthly
Measure Details
The numerator is the number of clients either determined eligible or entered into an eligibility
delay within 60 days of application
The denominator is the number of clients whose 60 days from application elapsed during the
reporting period
Eligibility delay is when there isn’t enough documentation to determine eligibility.
Q1-2017 ACTUAL 98.0%
Target 100%
Red <95%
Yellow 95-98%
Green >98%
Why this measure is
important
This measure represents how well the program is determining clients eligible within a timely
period from application. It is required by our federal funding source. This measure also
supports the agency’s priority around providing efficient and effective services.
Action prompted
Early warning sign of…
A low percentage could be a result of having a preponderance of new staff, poor caseload
management, surge in applications and the resulting staff capacity issues. Process
improvement tools could be utilized. This may be an early indicator of the need for invoking
the Order of Selection in which those with the greatest need are served.
DHS Priority 4 4 4 4 –––– EmploymentEmploymentEmploymentEmployment
Measure Name 4.74.74.74.7 Direct ServiceDirect ServiceDirect ServiceDirect Service –––– Entering PlanEntering PlanEntering PlanEntering Plan (VR)(VR)(VR)(VR)
Measure Calculation % of clie% of clie% of clie% of clients entering plan or plan delay within 90 days of being determined eligiblents entering plan or plan delay within 90 days of being determined eligiblents entering plan or plan delay within 90 days of being determined eligiblents entering plan or plan delay within 90 days of being determined eligible
Measure Owner Trina Lee
Data Provider Ron Barcikowski
Data Source Vocational Rehabilitation
Frequency Monthly
Measure Details
The numerator is the number of clients entering a plan or plan delay for services within 90 days
of being determined eligible
The denominator is the number of clients whose 90 days from being determined eligible
elapsed during the reporting period
Plan delay is when there isn’t enough information to determine a suitable job, or lack of
agreement on a suitable job goal.
Q1-2017 ACTUAL 84.0%
Target 100%
Red <95%
Yellow 95-98%
Green >98%
Why this measure is
important
This measure represents how well the program is enrolling clients into plans within a timely
period from eligibility. It is required by our federal funding source (RSA). This measure also
supports the agency’s priority around providing efficient and effective services.
Action prompted
Early warning sign of…
A low percentage could be a result of having a preponderance of new staff, poor caseload
management, surge in applications and the resulting staff capacity issues. Process

28
improvement tools could be utilized. This may be an early indicator of the need for invoking
the Order of Selection in which those with the greatest need are served.
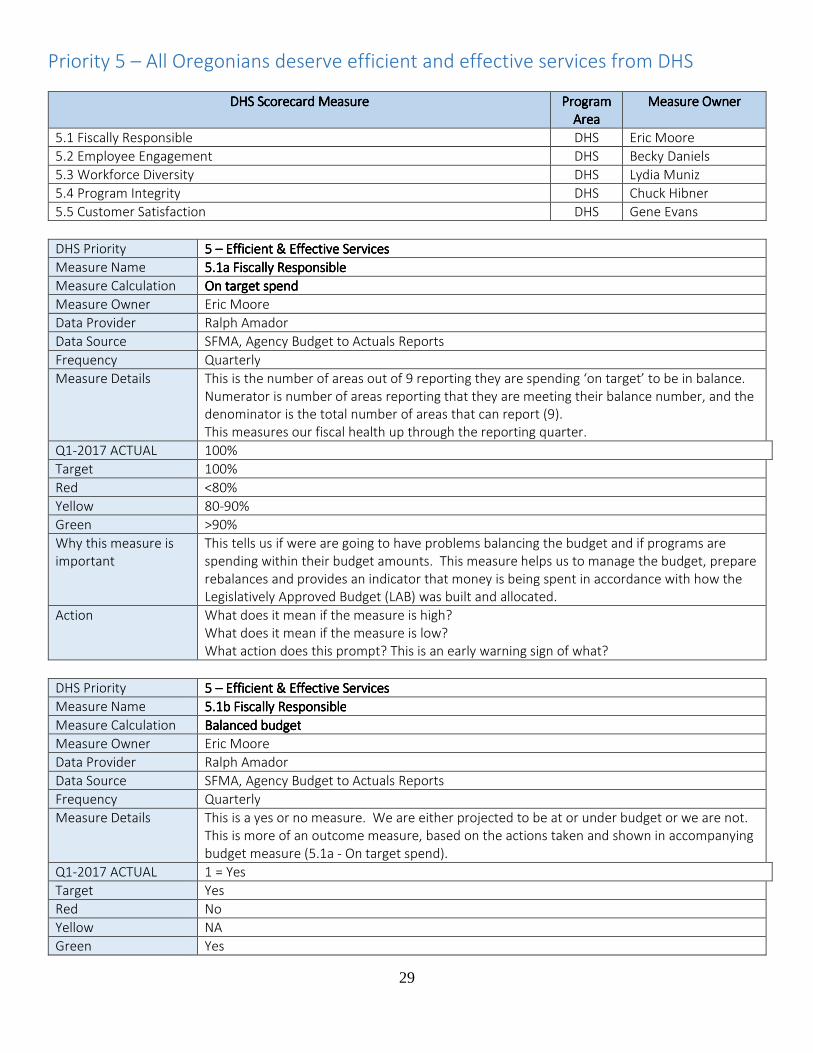
29
Priority 5 – All Oregonians deserve efficient and effective services from DHS
DHS Scorecard MeasureDHS Scorecard MeasureDHS Scorecard MeasureDHS Scorecard Measure Program Program Program Program
AreaAreaAreaArea
Measure OwnerMeasure OwnerMeasure OwnerMeasure Owner
5.1 Fiscally Responsible DHS Eric Moore
5.2 Employee Engagement DHS Becky Daniels
5.3 Workforce Diversity DHS Lydia Muniz
5.4 Program Integrity DHS Chuck Hibner
5.5 Customer Satisfaction DHS Gene Evans
DHS Priority 5 5 5 5 –––– Efficient & Effective ServicesEfficient & Effective ServicesEfficient & Effective ServicesEfficient & Effective Services
Measure Name 5.1a 5.1a 5.1a 5.1a Fiscally ResponsibleFiscally ResponsibleFiscally ResponsibleFiscally Responsible
Measure Calculation On target spendOn target spendOn target spendOn target spend
Measure Owner Eric Moore
Data Provider Ralph Amador
Data Source SFMA, Agency Budget to Actuals Reports
Frequency Quarterly
Measure Details
This is the number of areas out of 9 reporting they are spending ‘on target’ to be in balance.
Numerator is number of areas reporting that they are meeting their balance number, and the
denominator is the total number of areas that can report (9).
This measures our fiscal health up through the reporting quarter.
Q1-2017 ACTUAL 100%
Target 100%
Red <80%
Yellow 80-90%
Green >90%
Why this measure is
important
This tells us if were are going to have problems balancing the budget and if programs are
spending within their budget amounts. This measure helps us to manage the budget, prepare
rebalances and provides an indicator that money is being spent in accordance with how the
Legislatively Approved Budget (LAB) was built and allocated.
Action
What does it mean if the measure is high?
What does it mean if the measure is low?
What action does this prompt? This is an early warning sign of what?
DHS Priority 5 5 5 5 –––– Efficient & Effective ServicesEfficient & Effective ServicesEfficient & Effective ServicesEfficient & Effective Services
Measure Name 5.1b5.1b5.1b5.1b Fiscally ResponsibleFiscally ResponsibleFiscally ResponsibleFiscally Responsible
Measure Calculation Balanced budgetBalanced budgetBalanced budgetBalanced budget
Measure Owner Eric Moore
Data Provider Ralph Amador
Data Source SFMA, Agency Budget to Actuals Reports
Frequency Quarterly
Measure Details
This is a yes or no measure. We are either projected to be at or under budget or we are not.
This is more of an outcome measure, based on the actions taken and shown in accompanying
budget measure (5.1a - On target spend).
Q1-2017 ACTUAL 1 = Yes
Target Yes
Red No
Yellow NA
Green Yes
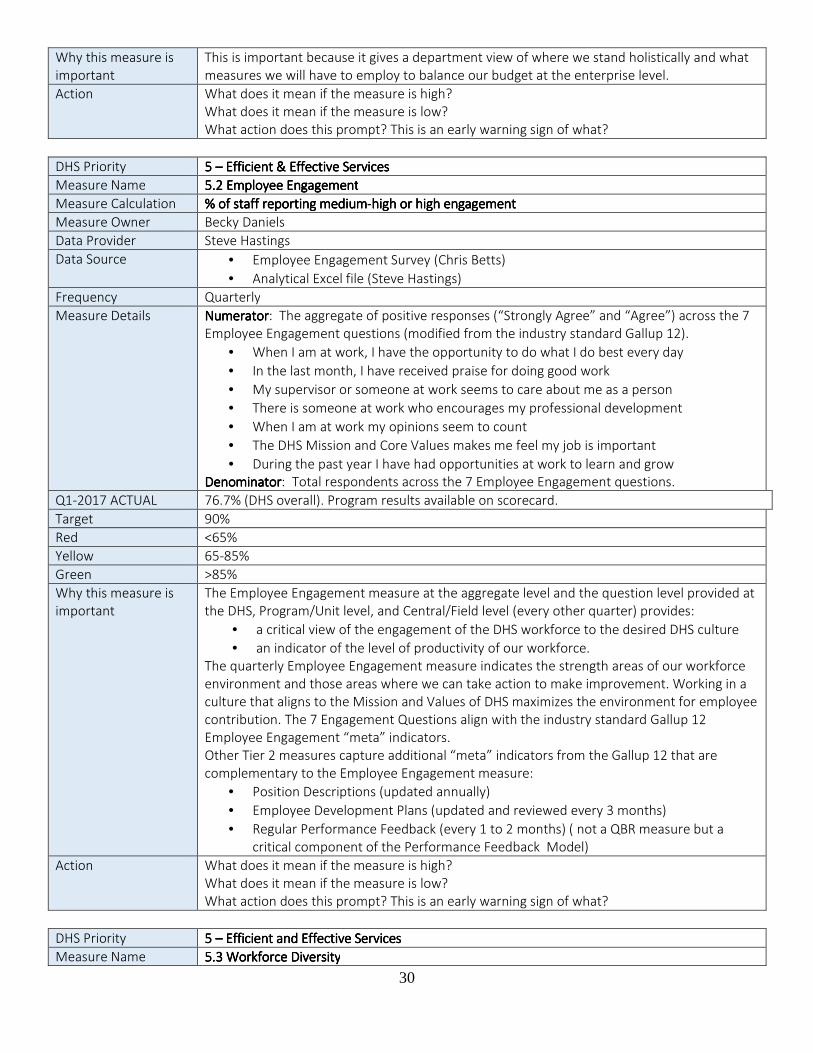
30
Why this measure is
important
This is important because it gives a department view of where we stand holistically and what
measures we will have to employ to balance our budget at the enterprise level.
Action
What does it mean if the measure is high?
What does it mean if the measure is low?
What action does this prompt? This is an early warning sign of what?
DHS Priority 5 5 5 5 –––– Efficient & Effective ServicesEfficient & Effective ServicesEfficient & Effective ServicesEfficient & Effective Services
Measure Name 5.25.25.25.2 Employee EngagementEmployee EngagementEmployee EngagementEmployee Engagement
Measure Calculation % of staff reporting medium% of staff reporting medium% of staff reporting medium% of staff reporting medium----high or high engagementhigh or high engagementhigh or high engagementhigh or high engagement
Measure Owner Becky Daniels
Data Provider Steve Hastings
Data Source • Employee Engagement Survey (Chris Betts)
• Analytical Excel file (Steve Hastings)
Frequency Quarterly
Measure Details
NumeratorNumeratorNumeratorNumerator: The aggregate of positive responses (“Strongly Agree” and “Agree”) across the 7
Employee Engagement questions (modified from the industry standard Gallup 12).
• When I am at work, I have the opportunity to do what I do best every day
• In the last month, I have received praise for doing good work
• My supervisor or someone at work seems to care about me as a person
• There is someone at work who encourages my professional development
• When I am at work my opinions seem to count
• The DHS Mission and Core Values makes me feel my job is important
• During the past year I have had opportunities at work to learn and grow
DenominatorDenominatorDenominatorDenominator: Total respondents across the 7 Employee Engagement questions.
Q1-2017 ACTUAL 76.7% (DHS overall). Program results available on scorecard.
Target 90%
Red <65%
Yellow 65-85%
Green >85%
Why this measure is
important
The Employee Engagement measure at the aggregate level and the question level provided at
the DHS, Program/Unit level, and Central/Field level (every other quarter) provides:
• a critical view of the engagement of the DHS workforce to the desired DHS culture
• an indicator of the level of productivity of our workforce.
The quarterly Employee Engagement measure indicates the strength areas of our workforce
environment and those areas where we can take action to make improvement. Working in a
culture that aligns to the Mission and Values of DHS maximizes the environment for employee
contribution. The 7 Engagement Questions align with the industry standard Gallup 12
Employee Engagement “meta” indicators.
Other Tier 2 measures capture additional “meta” indicators from the Gallup 12 that are
complementary to the Employee Engagement measure:
• Position Descriptions (updated annually)
• Employee Development Plans (updated and reviewed every 3 months)
• Regular Performance Feedback (every 1 to 2 months) ( not a QBR measure but a
critical component of the Performance Feedback Model)
Action
What does it mean if the measure is high?
What does it mean if the measure is low?
What action does this prompt? This is an early warning sign of what?
DHS Priority 5 5 5 5 –––– Efficient and Effective ServicesEfficient and Effective ServicesEfficient and Effective ServicesEfficient and Effective Services
Measure Name 5555.3 Workforce Diversity.3 Workforce Diversity.3 Workforce Diversity.3 Workforce Diversity

31
Measure Calculation % of demographic categories meeting target goals% of demographic categories meeting target goals% of demographic categories meeting target goals% of demographic categories meeting target goals
Measure Owner Lydia Muniz
Data Provider Jason Mak, Shawn Messick
Data Source HR data
Frequency Quarterly
Measure Details
Q1-2017 ACTUAL DHS Overall = 56.3%
Program = 48.2%
Subclass = 39.6%
New Hires = 75.0%
Promotions = 37.5%
Separation type = 81.3%
Target 100%
Red <80%
Yellow 80-95%
Green >95%
Why this measure is
important
Action
What does it mean if the measure is high?
What does it mean if the measure is low?
What action does this prompt? This is an early warning sign of what?
DHS Priority 5 5 5 5 –––– Efficient and Effective ServicesEfficient and Effective ServicesEfficient and Effective ServicesEfficient and Effective Services
Measure Name 5555.4.4.4.4 Program IntegrityProgram IntegrityProgram IntegrityProgram Integrity
Measure Calculation % of corrective action plans due in the quarter and implemented on time% of corrective action plans due in the quarter and implemented on time% of corrective action plans due in the quarter and implemented on time% of corrective action plans due in the quarter and implemented on time
Measure Owner Charles Hibner
Data Provider Dave Lyda
Data Source DHS Internal Audit Unit database
Frequency Quarterly
Measure Details
Each quarter the Internal Audit Office follows up with program areas on audit finding
recommendations scheduled to be fully implemented. This measure takes the number of
recommendations scheduled to be implemented divided by the number of recommendations
actually implemented. This measure is further smoothed by taking an average of the last 4
quarters as the value reported for the current quarter.
Q1-2017 ACTUAL 17.4%
Target 100%
Red <85%
Yellow 85-95%
Green >95%
Why this measure is
important
As a risk management tool, audit findings and their recommendations provide solutions to
known issues. Implementation of those recommendations in a timely way generally equates
to improved process and improved risk management, as well as demonstrates responsiveness
to Federal and State auditors.
Action
What does it mean if the measure is high?
What does it mean if the measure is low?
What action does this prompt? This is an early warning sign of what?
DHS Priority 5 5 5 5 –––– Efficient & Efficient & Efficient & Efficient & Effective ServicesEffective ServicesEffective ServicesEffective Services
Measure Name 5555.5.5.5.5 External External External External Customer SatisfactionCustomer SatisfactionCustomer SatisfactionCustomer Satisfaction

32
Measure Calculation % of responding customers who rank quality of DHS service as “good” or “excellent”% of responding customers who rank quality of DHS service as “good” or “excellent”% of responding customers who rank quality of DHS service as “good” or “excellent”% of responding customers who rank quality of DHS service as “good” or “excellent”
Measure Owner Gene Evans
Data Provider Chris Betts, Angela Long
Data Source Online survey: http://www.surveygizmo.com/s3/2083555/DHS-Customer-Satisfaction-Survey
Frequency Survey is deployed annually. Results are reported semi-annually.
Measure Details
Each year, we send email invitations in English & Spanish to 50,000 Client Application
Processing Interface (CAPI) applicants. For 2016, we had 3,196 responses.
The CAPI applicants are a good proxy for all DHS services because of the crossover between
Supplemental Nutrition Assistance Program (SNAP) and other programs. It is zero cost and has
zero impact of field office staff, allowing them to focus on providing services to clients.
Recent research shows that over 90% of Oregonians have access to web-enabled services
(including e-mail). The survey is optimized for mobile formats so it runs well on PC’s, laptops,
smart phones and tablets (Android or Apple). Customers can also request a paper copy of the
survey to fill out and mail back as an alternate format accommodation.
Q1-2017 ACTUAL 81.0% for Q4-2016. New data to be reported for Q2-2017.
Target 100%
Red <75%
Yellow 75-90%
Green >90%
Why this measure is
important
This measure is our best look into the satisfaction with services in DHS field offices across the
state. Customer Satisfaction is one of our KPM’s we report to the legislature. Our responses
have been consistent since we began using this measure in 2015 – so we can track results
year-to-year.
Action
What does it mean if the measure is high?
What does it mean if the measure is low?
What action does this prompt? This is an early warning sign of what?